economic profile of the computer animation and visual ... · economic profile of the computer...
TRANSCRIPT

Economic Profile of the Computer Animation and Visual Effects Industry in Ontario, 2008-2010 Final Report
March 2012
Prepared for
CASO By
Nordicity

Economic Profile of the Computer Animation and Visual Effects Industry in Ontario, 2008-2010 2 of 59
Funding for this study was provided by the Ontario Media Development Corporation (OMDC). The author of this report is Nordicity (Group Limited). Any opinions, finding, conclusions or
recommendations expressed in this material are those of the author and do not necessarily reflect the views of the Ontario Media Development Corporation or the Government of Ontario. The
Government of Ontario and its agencies are in no way bound by any material present in this document.

Economic Profile of the Computer Animation and Visual Effects Industry in Ontario, 2008-2010 3 of 59
Table of Contents
Executive Summary 5
1. Introduction 8
1.1 Profile Mandate 8
1.2 Methodology 8
1.3 Outline of Report 10
2. Industry Descriptions 10
2.1 Computer Animation 11
2.2 Visual Effects 11
3. Industry Profile Data 14
3.1 Corporate Profile 14
3.1.1 Corporate Status 14
3.1.2 Years in Operation 15
3.2 Production 16
3.2.1 Shots and Minutes Produced 16
3.2.2 Ownership of Content 17
3.2.3 Outsourcing 18
3.3 Financial Profile 18
3.3.1 Operating Revenue 18
3.3.2 Operating Expenditures 21
3.3.3 Operating Profits 22
3.3.4 Capitalization 23
3.3.5 Use of Public Incentives 24
3.4 Employment and Jobs 25
3.4.1 Employment by Job Type 26
3.4.2 Employment by Employment Status 26
3.4.3 Availabiltiy of Talent 27
3.5 Future Outlook 29

Economic Profile of the Computer Animation and Visual Effects Industry in Ontario, 2008-2010 4 of 59
3.5.1 Outlook of Companies 29
3.5.2 Percieved Barriers to Growth 29
4. Customer Satisfaction 30
4.1 Recent Projects 31
4.2 Customer Satisfaction 31
4.3 Losses to Other Jurisdictions 32
5. Economic Impact Analysis 33
5.1 Direct Economic Impact 33
5.2 Industry Employment in FTEs 33
5.3 Spin-off and Total Economic Impact 34
6. Key Findings and Observed Trends 34
6.1 Industry Growth 34
6.2 Products and Territories 35
6.3 Capital and Funding 35
6.4 Jobs and Employment 35
6.5 Future Growth and Barriers 36
6.6 Customer Satisfaction 36
6.7 Economic Impact 36
A Survey Questionnaires 37
A.1 Economic Profile 37
A.2 Customer Satisfaction Survey 53

Economic Profile of the Computer Animation and Visual Effects Industry in Ontario, 2008-2010 5 of 59
Executive Summary Introduction
Report Mandate
Nordicity was commissioned by the Computer Animation Studios of Ontario (CASO) to provide key economic data on the computer animation and visual effects industries in Ontario.
In addition to the economic profile data, Nordicity conducted a high-level economic impact analysis of the computer animation and visual effects industries in Ontario – and their impact on Ontario’s GDP.
In parallel to the collection of economic indicators, Nordicity issued a survey to the customers of Ontario-based computer animation and visual effects companies to gauge the satisfaction of these customers. The results of that survey process are reflected in this document.
Report Methodology
Nordicity conducted two parallel surveys to gather the needed data for this report: an Economic Profile Survey and a Customer Satisfaction Survey.
The Economic Profile Survey was distributed directly to 28 computer animation and visual effects studios. Useable responses were received (in whole or in part) from 14 studios (or 50% of the number of companies).
The Customer Satisfaction Survey was distributed by studios directly to their clients/customers. As such, the total universe of distributed questionnaires for the Customer Satisfaction Survey is not known.
A standard economic impact analysis was also conducted.
Findings
Industry Growth
Despite a small dip in production levels in 2009 in the computer animation (CA) 2010 saw a rebound. That said, the 2010 growth was somewhat limited (up 10% from 2009 levels). Meanwhile, in the VE industry production levels grew significantly (in terms of number of shots completed) between 2008 and 2010.
Revenue levels in both the CA and VE industries grew significantly in 2010 (from 2009 levels) after being relatively flat between 2008 and 2009. Over the three year period in question, both industries’ revenue levels saw around a 17% annualized compound growth rate.
As one might expect, expenditure levels roughly follow the trend of production and revenue – with a dip in 2009 and a significant rebound in 2010. Over the three year period,

Economic Profile of the Computer Animation and Visual Effects Industry in Ontario, 2008-2010 6 of 59
CA expenses seemed to grow (at 13% compound annual growth) slightly faster than VE expenses (which grew at a rate of 10% compounded annually).
In 2010, the majority of these expenses (roughly 2/3) were wages, compensation and employee benefits.
Combining the above, it was observed that profit margins in the CA industry have come to exceed that of the VE industry. In 2008, the CA industry had an average margin of 11%, which grew to 18% in 2010. At the same time, the VE studios’ 13% margin in 2008 shrunk slightly to 12% in 2010.
Products and Territories
In terms of product lines the VE industry relies heavily on three types of projects: live action feature film service work, live action TV service work, and live action TV original content. Conversely, CA studios in Ontario derive revenue from a wide variety of product types.
Indeed, 100% of reported revenue (in 2010) in the VE industry was from service-based work, while just over 1/3 of revenue in the CA industry was generated by original content.
When examining the territories where CA and VE studios generated their revenue in 2010, it was observed that most (79%) of the CA work reported came from Ontario, with New York accounting for another significant portion (19%). For VE studios, Ontario was also the largest source of revenue (50%), while Los Angeles was also a very important source of revenue (41%).
Capital and Funding
In terms of initial capitalization, CA relied heavily on self-financing (54%) to start their firms. While VE firms also used self-funding (making up 33% of initial capital), they were far more successful in attracting private equity, which accounted for 42% of VE studios’ initial capitalization.
The two industries are somewhat more similar in terms of sources of on-going capital, with retained earnings accounting for 46% and 40% of CA and VE capital, respectively. Again, while both types of studio will rely on self-funding, CA studios (at 32%) are more dependent on this type of financing than VE studios (at 22%). On the other hand, VE studios seem to be somewhat more successful in attracting bank credit (which accounts for another 22% of VE studios’ on-going capital).
Jobs and Employment
Looking at employment levels in total, one sees that CA studios saw a small dip in employment in 2009, but rebounded strongly in 2010. VE studios, on the other hand, experienced more significant growth between 2008 and 2009. By 2010, CA studios had grown at a compound annual rate of 9% (from 2008 levels) while the VE industry grew by 10% over the same period.
When employment is examined by type of position, it is clear that the distribution of artistic, technical, and administrative staff has remained fairly constant since 2008 – with artistic staff accounting for 81% of all employees in 2008 and 81% in 2010.

Economic Profile of the Computer Animation and Visual Effects Industry in Ontario, 2008-2010 7 of 59
Digging deeper into employment, it is interesting to note the change in employment status from 2008 to 2010. Over the three year period (2008-2010), the level of full time employment remained roughly flat (at between 417 and 467 for CA studios; and 381 and 425 for VE studios). However, the percentage of the industry that is made up of contract and/or freelance employment has grown among CA firms. In 2008 contract/freelance workers accounted for 50% of all CA employees, while in 2010 that portion had grown to 55%.
Future Growth and Barriers Bucking the conventional wisdom to some extent, studios polled suggested that the most
likely sources of future growth for their companies lay with live action and animation TV, while live action feature film and mobile applications were thought to be the least likely prospects for growth.
In terms of achieving this growth, the most commonly identified barriers to growth were international competition and the inability to access foreign markets. Lack of affordable capital was also identified as a significant issue.
Customer Satisfaction
Of those customers that responded to the survey, the vast majority (92%) commented on TV productions and most were from Ontario.
Overall, customers were very satisfied with the work of Ontario-based studios. That said, the customers were least satisfied by the cost of labour in Ontario (which scored 70%) and the quality of technical work (74%).
Of those customers surveyed, 45% opted to select a firm outside of Ontario. Of these firms, the most common reason given for this decision was, unsurprisingly, the cost of labour in Ontario.
Economic Impact
The direct economic impact of the CA and VE industries in 2010 was $83 million.
The total impact including spin-off impacts of the two industries in 2010 totaled more than $190 million.
In terms of FTEs, the combined CA and VE industries generated employment for 2,721 people in Ontario in 2010. This figure includes direct and spin-off (i.e. indirect and induced) employment.

Economic Profile of the Computer Animation and Visual Effects Industry in Ontario, 2008-2010 8 of 59
1. Introduction This section of the report outlines the project mandate, details the methodology used and provides an outline of the subsequent sections.
1.1 Profile Mandate
In June 2010, Computer Animation Studios of Ontario (CASO) produced A Strategy for the Ontario Digital Animation and Visual Effects Industry. Among the sources of data used in that report was the 2008 report produced by Nordicity for CASO Economic Profile of the Ontario Computer Animation and Visual Effects Industry.
Given that conclusions were being drawn in 2010 on data that described the computer animation and visual effects industries in 2007, it was deemed that an update was required. To this end, Nordicity was commissioned by CASO to provide key data on the computer animation and visual effects industries in Ontario.
These data include corporate profiles, revenues and expenditure figures, employment and other key economic indicators.
Additionally, one recommendation made in the 2010 strategy report concerned promoting the industries “on the basis of quality” to domestic and international clients. The Customer Satisfaction survey conducted as part of the current study represents an initial effort to ascertain the industries’ existing image in the eyes of their clients.
Where possible, this report makes comparisons to the report produced by Nordicity for CASO in 2008. As the survey questionnaires administered for the two studies were slightly different (due to changes in project scope and refinements in methodology), not all questions can be compared to 2007 data. Where such comparisons are possible, they are included in the text. However, due to the methodological refinements employed in this study, comparisons to 2007 data should be used with caution.
In addition to the economic profile data, Nordicity conducted a high-level economic impact analysis of the computer animation and visual effects industries in Ontario – and their impact on Ontario’s GDP.
In parallel to the collection of economic indicators, Nordicity issued a survey to the customers of Ontario-based computer animation and visual effects companies to gauge the satisfaction of these customers. The results of that survey process are reflected in this document.
While Nordicity was tasked with creating, administering, and analyzing the result of the two surveys, CASO took on the task of stimulating responses among the computer animation and visual effects studios operating in Ontario.
1.2 Methodology
As stated above, Nordicity conducted two parallel surveys to gather the needed data for this report: an Economic Profile Survey and a Customer Satisfaction Survey.

Economic Profile of the Computer Animation and Visual Effects Industry in Ontario, 2008-2010 9 of 59
The Economic Profile Survey was distributed directly to 28 computer animation and visual effects studios. Useable responses were received (in whole or in part) from 14 studios (or 50% of the companies who received the survey).
The Customer Satisfaction Survey was distributed by studios directly to their clients/customers. As such, the total universe of distributed questionnaires for the Customer Satisfaction Survey is not known.
Given that this report aims to account for the entirety of the computer animation and visual effects industries in Ontario, and only a portion of those industries were captured through primary data collection, Nordicity used a relatively simple technique to “gross-up” some data (i.e. production levels, operating revenue, operating expenses and employment).
To “gross-up” the data, Nordicity first determined the proportion of the estimated total value of projects produced in Ontario in 2010. To estimate the total project value, Nordicity noted from the survey data that 62% of all projects produced by computer animation and visual effects studios in Ontario in 2010 made use of the Ontario Computer Animation and Special Effects (OCASE) Tax Credit. The total project value of these projects amounted to $125,063,434 in 2010.1 Anecdotal evidence suggested that projects accessing the OCASE tax credit accounted for the majority of project values – as it is less likely that smaller projects would access the tax credit. Therefore, it is assumed that while 38% of projects may not have accessed the OCASE tax credit, these projects account for less than 38% of 2010 total project value. Accordingly, Nordicity inflated the total project values reported by OMDC by 25% to reflect the total project values of those projects that did not access the OCASE tax credit. As such, the estimated total project value for computer animation and visual effects projects in 2010 was $162,582,464.
Using this estimate, Nordicity determined the portion of 2010 total project value captured by the Economic Profile survey. Given that the survey results accounted for an estimated $56,255,000 of project value, the survey results were estimated to reflect 36.0% of the economic activity undertaken by the computer animation and visual effects industries in 2010. Accordingly, a multiplier of 2.78 (1/0.36) was applied to those survey questions where an industry-wide count was needed. Those survey questions based on percentages or opinions did not require grossing up. Grossed-up figures are presented in this report as “estimated.”2
No grossing-up was required for the Customer Satisfaction Survey and the results are presented accordingly.
Based on the results of the Economic Profile, Nordicity conducted a standard economic impact assessment based on cost categories and multipliers devised by Statistics Canada. In so doing, Nordicity was able to calculate the direct and spin-off (i.e. indirect and induced) economic impacts created by the computer animation and visual effects industries in
1 See the OMDC website at: http://www.omdc.on.ca/Page5938.aspx 2 This “gross-up” methodology used in this study differs from that used in the 2008 Profile of the Ontario Computer Animation and Visual Effects Industry, as total project revenue was not captured by the 2008 survey. As such, the 2008 report undertook additional methodological steps to estimate the project-related revenues generated by survey respondents. Such steps were not necessary for the current study.

Economic Profile of the Computer Animation and Visual Effects Industry in Ontario, 2008-2010 10 of 59
Ontario. Employment figures (in Full Time Equivalents [FTEs]) were also generated as part of the economic impact analysis to allow for comparison to other industries.
One element of the economic impact analysis is the calculation of FTEs. To do so, Nordicity simply divided the estimated direct GDP contribution made by the computer animation and visual effects industries by the average salary of those industries. Unfortunately, the industries do not neatly fit into any given National Occupation Code, as described by the Government of Canada’s Working in Canada website.
That said, the industries relate best to NOC 25223 “Graphic Arts Technicians” (which account for computer animators) and NOC 2174-A - “Computer Programmers and Interactive Media Developers.” These professions earn $18.85/hour and $31.33/hour respectively. Accordingly, Nordicity has created an average hourly salary of $25.09/hour. Based on a 7.5 hour day and a five day work week, this estimate generates an average salary level of $48,925.50.
1.3 Outline of Report
Other than this introduction, this report consists of four sections (five in total):
o Industry Descriptions: A very brief overview of the computer animation and visual effects industries;
o Industry Profile Data: A summary of the data gathered by the Economic Profile Survey;
o Economic Impact Analysis: A summary of the calculated economic impact and FTE figures;
o Customer Satisfaction Data: A summary of the data gathered by the Customer Satisfaction Survey; and,
o Key Findings and Observed Trends: A review of the most striking finds of both surveys (and economic impact analysis), including any trends observed by Nordicity.
2. Industry Descriptions The computer animation (CA) and digital visual effects (VE) industries in Ontario comprises companies that produce content and/or provide other services for film, television and digital media markets, in Canada and internationally.
For companies operating in this industry, the primary customer base includes film (and television) producers, distributors, content producers, video game developers, mobile application/content developers and television broadcasters.
Companies operating in the computer animation and VE industry also serve the commercial market by producing TV commercials, training materials, corporate communications, or music videos for brand owners, either directly or indirectly through an agency.
Some production companies operating in the computer animation and VE industry provide post-production services in-house, whereas other producers contract work out to specialty post-production service houses. Some producers do both.

Economic Profile of the Computer Animation and Visual Effects Industry in Ontario, 2008-2010 11 of 59
2.1 Computer Animation Computer animation is the evolution of classical cel animation into digital technology. Of
the numerous forms of commercial animation -- stop motion, Claymation (using Plasticine), cut-out and others – production of cel animation, in the style of traditional Disney and Looney Tunes cartoons has, for the most part, been supplanted by computer technology. This style of animation is often referred to as 2D animation reflecting the fact that visual elements (characters and environments) have no apparent volume – they are flat, two-dimensional objects.
With the significant improvements in computer hardware and software during the past two decades, creating three-dimensional (3D) animation has become a commercially feasible process.
The fundamental difference between 3D and 2D animation is the apparent depth and volume of the character models, environments and props. The first large scale, well-known project to use 3D technologies was the animated feature film Toy Story. Since its release in 1995, further developments in digital technologies have enabled the production of innumerable television and DVD projects which can now be produced with significantly lower budgets than those required for feature films.
Of the programs commonly produced today, animated features are commonly produced as 3D animation in order to appeal to theatrical audiences. Programs for television are produced in both 2D and 3D animation.
At its core, computer animation is an efficient production platform that is suited to simulating many other media. In some studios, computer animation is replacing many traditional types of animation, such as simulated stop-motion. The scope and definition of computer animation can be construed quite broadly ranging from traditional frame-based animation based on works created on a computer to complex 3D animation techniques.
Typical services provided by CA studios include some or all of the following:
o Design and consultation services
o Storyboarding
o Animatic reel creation
o Digital element (e.g. characters, props, environments) creation
o Animation sequence integration
o Editing
o Final output
2.2 Visual Effects
Filmmakers use digital visual effects (VE) to modify, enhance and augment live-action cinematography. Digital VE, or simply VE, are a subset of visual special effects available to directors that enable realization of the visual aspects of film and television projects. Some of these effects can be “in-camera,” involving the various technologies embedded in the

Economic Profile of the Computer Animation and Visual Effects Industry in Ontario, 2008-2010 12 of 59
camera itself. Visual effects can also entail using manipulation of physical elements, lighting, makeup, prosthetics, creating virtual crowd scenes, and a host of other effects that have become commonplace in modern film and television production.
Digital technologies permit filmmakers to surpass the constraints of physical reality. Typically VE include integration of digital elements into live-action cinematography, combining elements from multiple sources into composite images or creating photorealistic shots totally by computer.
VE artists can create objects and effects that do not exist in reality – monsters, horror characters, a castle in the forest, a pig that talks, an exploding head – but that need to be realistic and believable. These elements thus must have photorealistic characteristics.
Digital set extensions permit modification of film locations that extend beyond both physical reality and budget allowances. For example, using visual effects techniques to populate a crowd scene can lessen the cost of hiring extras to work on a particular shoot. In addition, VE can alter environmental elements such as making day night and vice-versa, creating storms, tornados, blizzards, fire storms, explosions, adding icy breath to a winter scene shot in July, showing the detail of a bullet in flight and replacing the hazardous work of stuntmen and women and animals with a process that has zero physical risk.
The range of VE is wide and filmmakers’ capacity to conceive of new ways to expand audiences’ visual experience with creative use of VE technologies is constantly evolving.
Typical services provided by CA studios include some or all of the following:
o Design and consultation
o On-set supervision
o Pre-visualization
o Digital element creation
o Integration with live-action sequences
o Matte painting, crowd replication, set extensions
o Environmental element integration (e.g., fire, water, smoke, etc.)
o Rig removal
o Final output
2.3 Computer Animation and Visual Effects Workforce
Given an understanding of the types of products and services that CA and VE studios offer, it is critical to understand the types of skilled labour that are required for the industries to function.
The CA and VE industries combine the work of individual artists (e.g., digital animators, storyboard artists, writers, etc.) with the skills of technical professionals (such as software developers or system administrators). At times, individual employees may possess both artistic and technical skills.
Economic Profile of the Computer Animation and Visual Effects Industry in Ontario, 2008-2010 13 of 59
These skilled employees are typically integrated into a production pipeline or other workflow process by creative and/or technical directors, producers, and production managers.
CA and VE studios typically supplement artistic and technical staff with business/administrative staff including sales managers, production accountants, and other administrative support positions.
2.4 Industry Structure
In order to understand the economics of the CA and VE industries in Ontario, it is important to know how the businesses that comprise these industries operate. The following illustrations depict the typical business models for each industry.
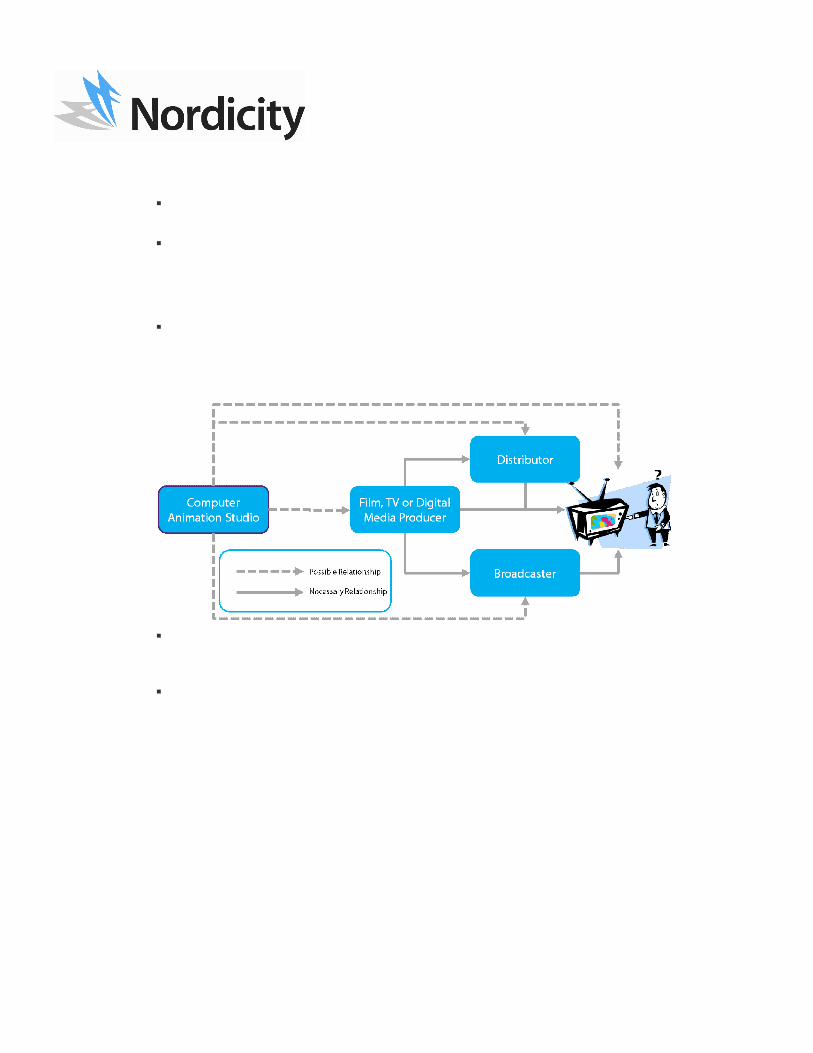
Figure 1 - Computer animation industry structure
As Figure 1 shows, there are several business models available to computer animation studios. They may opt to create content directly for audiences (and distribute the content themselves, e.g. through a website).
Alternatively, the CA studio could opt to work with a distributor or broadcaster to distribute original content to audiences. Finally, a CA studio could supply content to a film, TV or digital media producer as a part of a larger production – typically as part of a fee-for-service arrangement.
Economic Profile of the Computer Animation and Visual Effects Industry in Ontario, 2008-2010 14 of 59
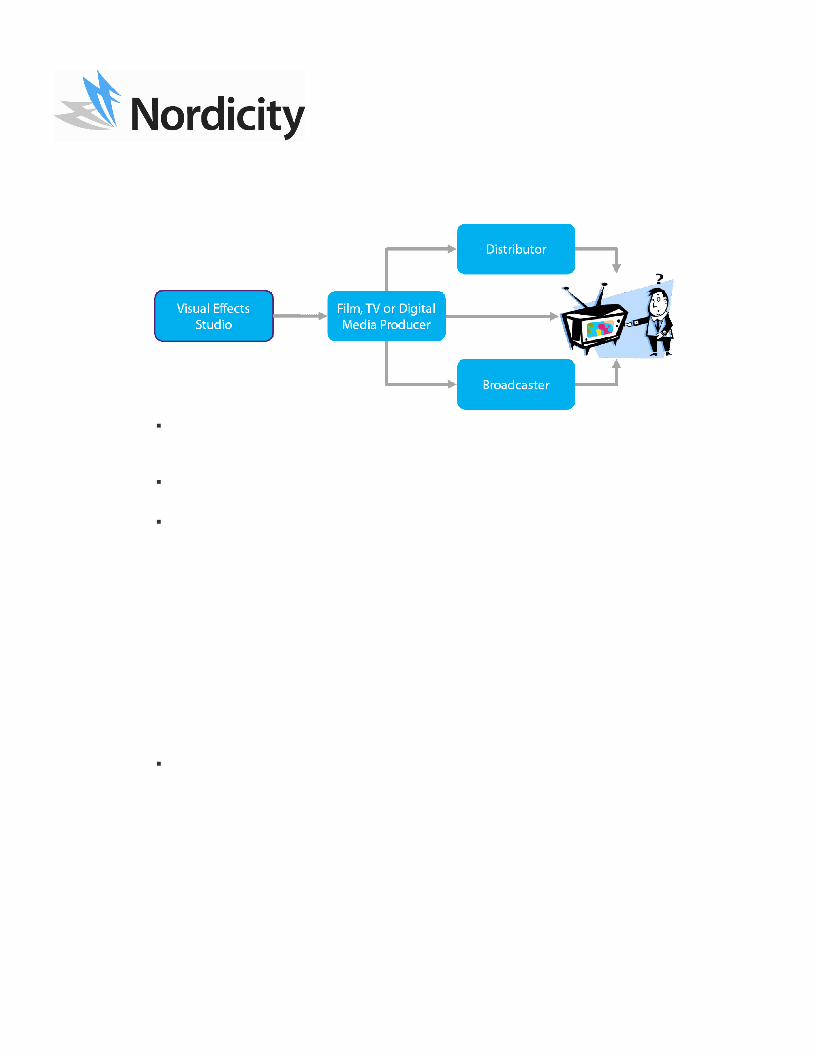
Figure 2 - Visual effects industry structure
As Figure 2 depicts, the visual effects industry has a somewhat more linear structure than the computer animation industry. VE studios typically provide services to film, TV and/or digital media producers in a fee-for-service relationship as part of a larger production.
Notably, it is quite common for more than one visual effects studio to provide “shots” (i.e. visual sequences requiring digital manipulation) to a single production.
While most studios specialize in one type of production (i.e., computer animation or visual effects), it is, of course, possible that a studio may exist in both the CA and VE industries.
3. Industry Profile Data This section of the report provides data derived from the web-based survey of computer animation and visual effects companies operating in Ontario. The section is divided into sub-sections that mirror the structure of the survey questionnaire.
3.1 Corporate Profile
The corporate profile describes the nature of the firms operating in the computer animation (CA) and visual effects (VE) industry in Ontario.
3.1.1 Corporate Status
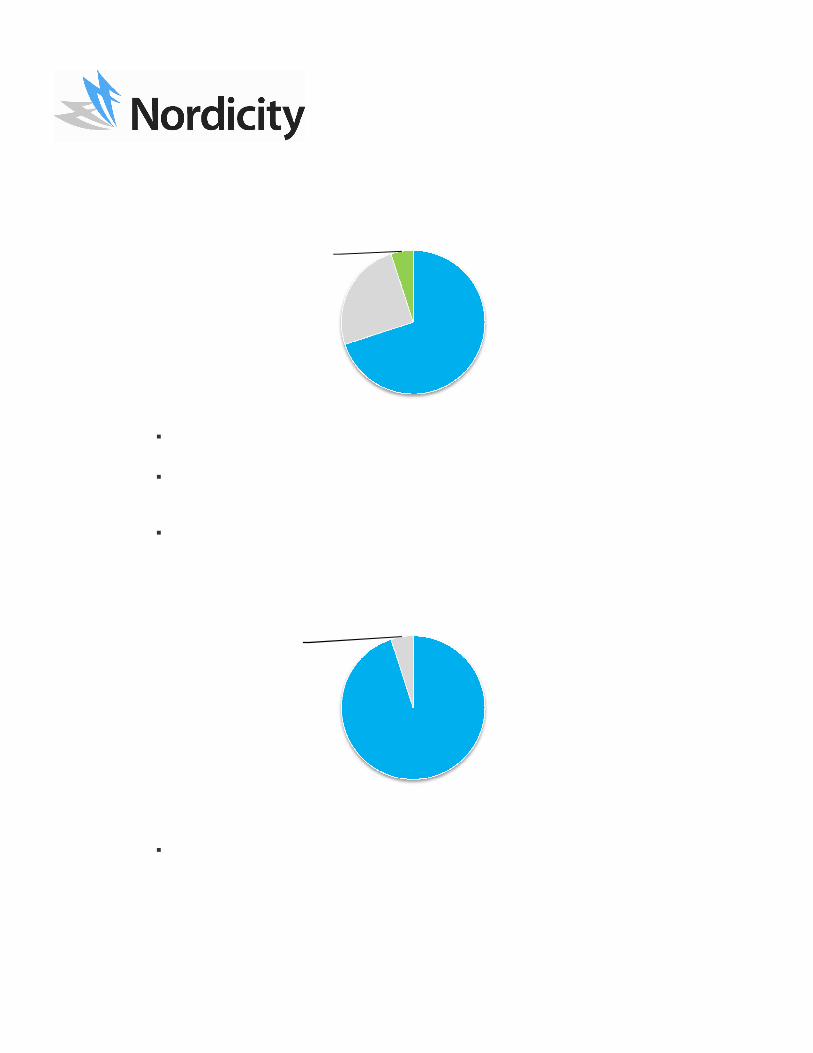
As shown by Figure 3 (below), in 2010, most (70%) of the firms operating in Ontario’s computer animation and visual effects industry were private corporations.
Economic Profile of the Computer Animation and Visual Effects Industry in Ontario, 2008-2010 15 of 59
Figure 3 - Type of company (2010)
Furthermore, only a small minority (5%) of companies operating in the CA or VE industry are public corporations.
This distribution differs only slightly from the types of companies present in 2007, where 78% of companies were Private Corporations, 19% were Sole Proprietorships and 5% were Public Corporations.
As of 2010, the vast majority of survey companies (95%) were Canadian-controlled, as depicted in Figure 4. This figure is similar to the 97% of companies that were Canadian-owned in 2007.
Figure 4 - Corporate control (2010)
3.1.2 Years in Operation
As of 2010, the average age of a computer animation company in Ontario was 9 years, slightly less than the average of 13 years for visual effects companies. Figure 5, below displays the age of companies.
Private Corporation
70%
Sole Proprietorship
25%
Public Corporation
5%
Canadian-controlled
95%
Foreign-controlled
5%
Economic Profile of the Computer Animation and Visual Effects Industry in Ontario, 2008-2010 16 of 59
Figure 5 - Average age of companies (2010)
3.2 Production
When examining an industry such as the CA or VE industry, one key measurement of success is the volume of production created in a given year.
3.2.1 Shots and Minutes Produced
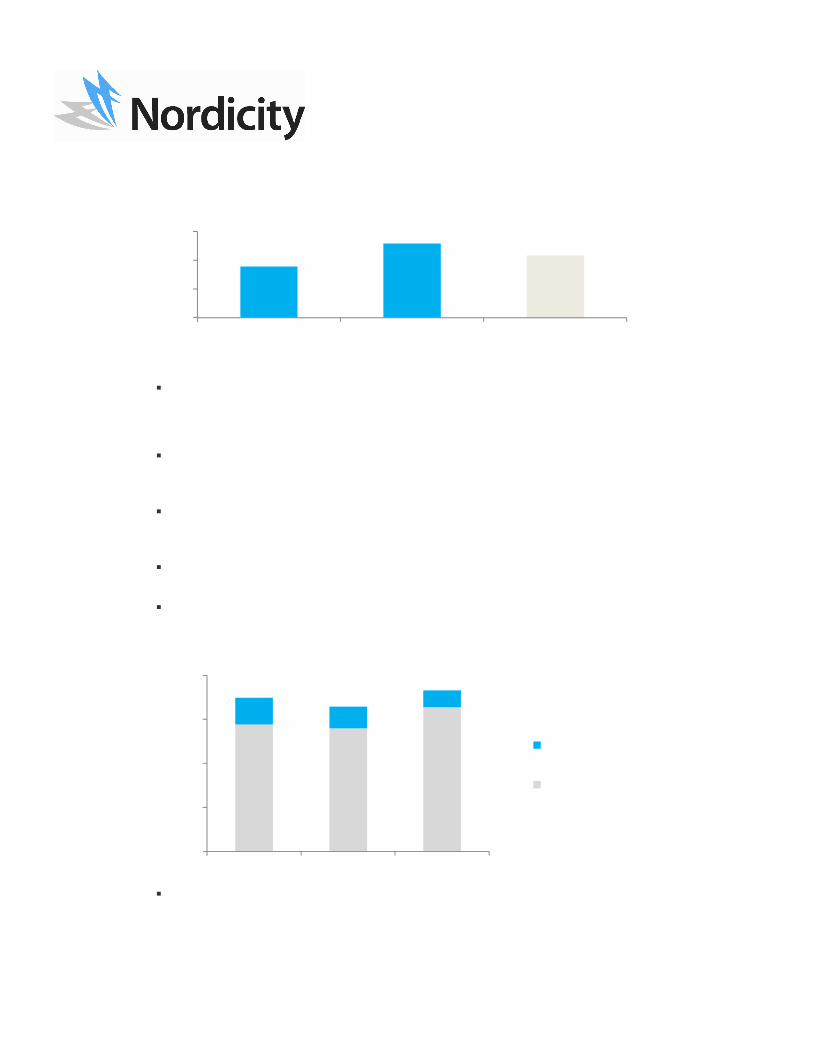
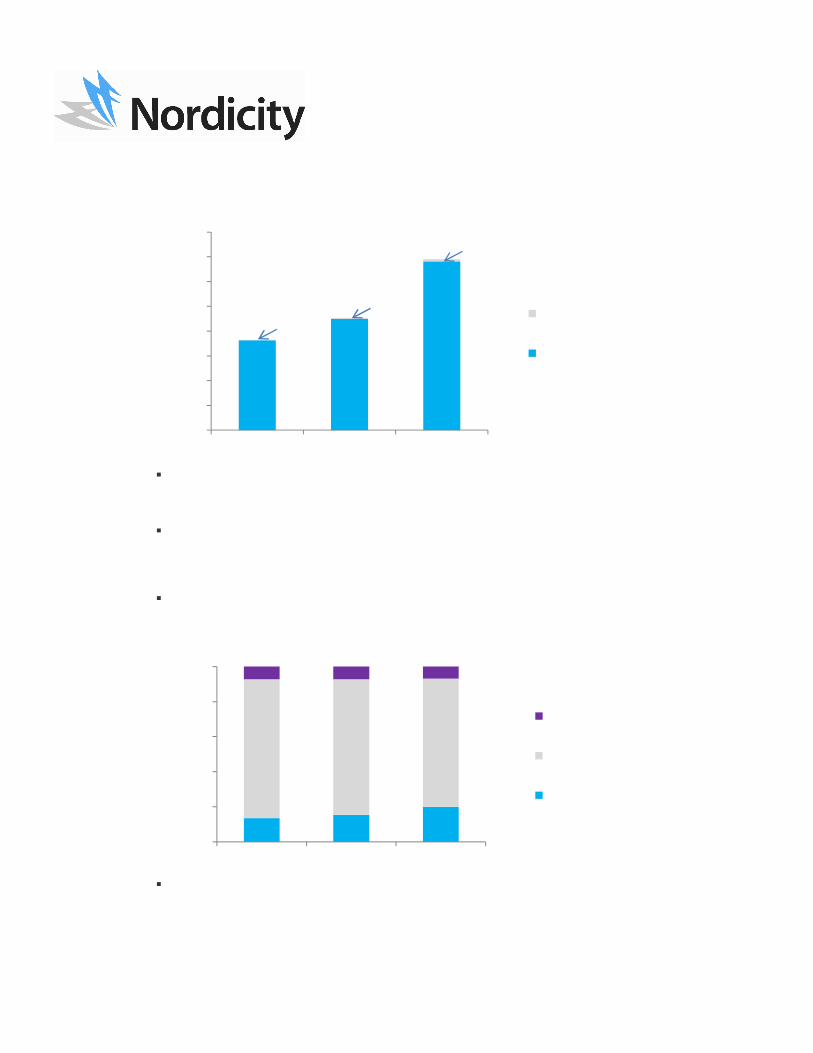
Figure 6 (below) shows that for computer animation, the number of minutes produced dropped in 2009 (from roughly 17,500 minutes to approximately 16,500 minutes), but rebounded in 2010 (to roughly 18,300 minutes).
The majority of these minutes were produced by dedicated computer animation firms. However, the portion of computer animation shots produced by visual effects studios has decreased at a compound annual rate of 14% since 2008.
Overall, the number of minutes produced has grown by a compound annual rate of 1.5% since 2008.
Furthermore, the number of minutes produced in 2008 was 21.3% higher than the 14,408 minutes of computer animation minutes produced in 2007.
Figure 6 - Estimated computer animation minutes produced (2008-2010)
Since 2008, the number of visual effect shorts produced has grown substantially, as Figure 7 indicates. Over that period the number of shots produced has grown by a compound annual rate of 23.8%.
9
1311
0
5
10
15
Computer Animation Visual Effects All Companies
14,423 13,96416,362
3,051 2,501
1,917
0
5000
10000
15000
20000
2008 2009 2010
Visual Effects Studios
Computer Animation Studios
17,474 16,465 18,279
Economic Profile of the Computer Animation and Visual Effects Industry in Ontario, 2008-2010 17 of 59
Figure 7 - Estimated visual effect shots produced (2008-2010)
While visual effects studios continue to account for the vast majority of this activity, the number of shots produced by computer animation studios has grown by 142% over this period.
Due to a change in methodology from the 2008 report, the number of shots produced in 2008 through 2010 cannot be directly compared to 2007 levels.
3.2.2 Ownership of Content As Figure 8 shows, in 2010, roughly three quarters of all content produced by the CA and VE
industry was service work.
Figure 8 - Content ownership by project (2008-2010)
Over time, it appears that Ontario studios are producing slightly more content than they own (13.6% in 2008 vs. 20.9% in 2010).
18,17422,496
34,05633
161
472
0
5000
10000
15000
20000
25000
30000
35000
40000
2008 2009 2010
Computer Animation Studios
Visual Effects Studios
13.6% 15.4% 20.9%
79.2% 77.4% 76.1%
7.2% 7.2% 7.2%
0%
20%
40%
60%
80%
100%
2008 2009 2010
Other
Service-work
Content owned by company
18,207 22,657
34,528

Economic Profile of the Computer Animation and Visual Effects Industry in Ontario, 2008-2010 18 of 59
This growth is a continuation of a trend from 2007, when 83% of projects produced by CA and VE firms were service-based.
3.2.3 Outsourcing
As of 2011, a majority of surveyed firms currently outsource at least a portion of their work.
Figure 9 - Outsourcing of work (2011)
Of those 7 firms that outsource some of their work, the most common reason was “Insufficient capacity in home studio,” (4 responses) while the second most popular reason was the “Low cost of labour” (3 responses) in the jurisdiction to which the work is outsourced.
Of these 7 outsourcing firms, 5 outsourced work to other firms in Ontario, while the remaining two outsourced to South America and Eastern Europe.
The rate of outsourcing in 2011 has increased from 2007 levels, when only 39% of firms reported that they outsourced to other firms.
3.3 Financial Profile
This section of the report outlines the financial reality of the CA and VE industry in Ontario. In so doing, it expands upon the revenues, expenditures and profits of CA and VE companies. It also highlights the initial and on-going capitalization of these companies.
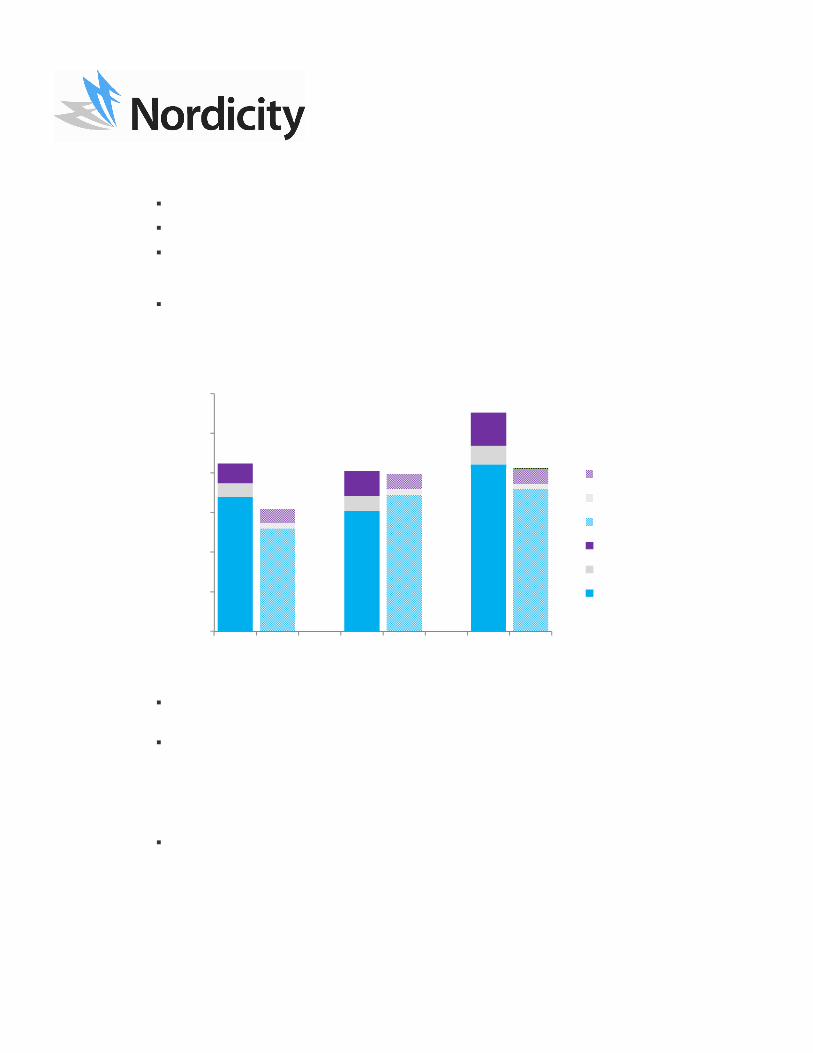
3.3.1 Operating Revenue
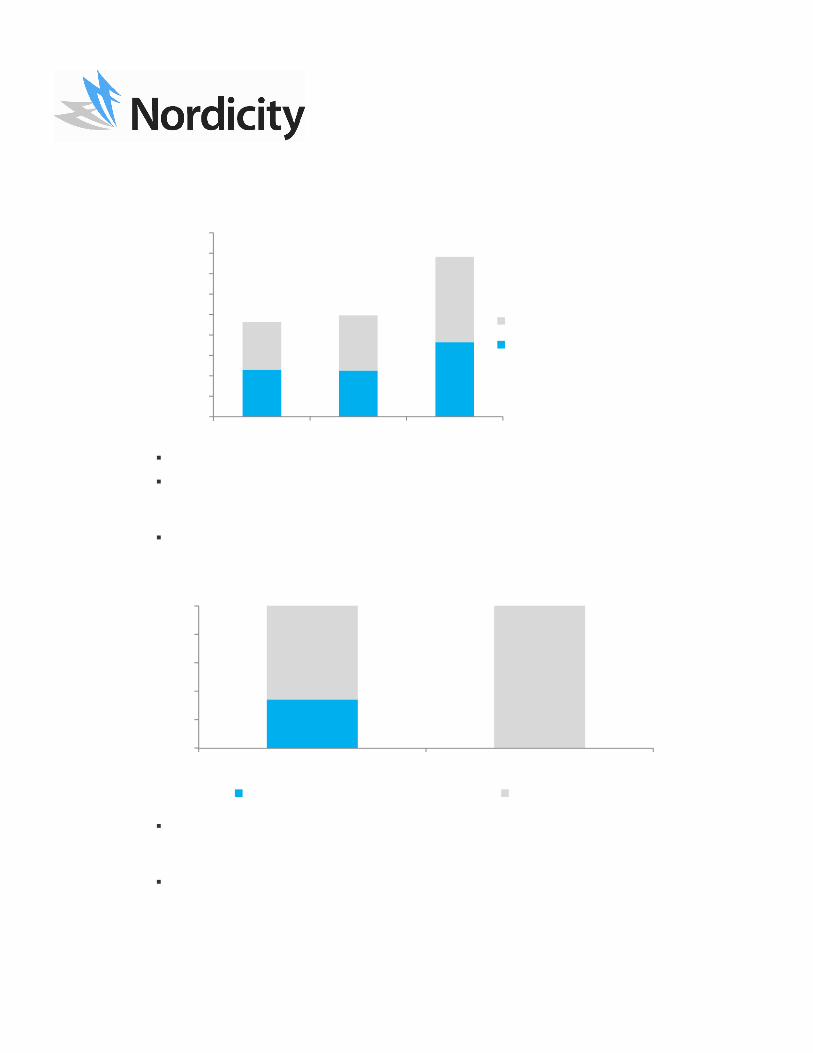
As the following Figure 10 illustrates, revenue growth was flat between 2008 and 2009, but picked up substantially between 2009 and 2010. For the three year period, revenue grew by a compound annual rate of 17.1%.
Outsource58%
Do not Outsource
42%
Economic Profile of the Computer Animation and Visual Effects Industry in Ontario, 2008-2010 19 of 59
Figure 10 - Estimated operating revenue (2008-2010, in $000s)
This growth appears to have been quite similar in CA studios (16.6%) and VE studios (17.5%).
As the estimated revenue generated by the CA and VE industries in 2007 was roughly $128,100,000, the 2008 revenue represented a 24% decrease. By 2010, however, revenue had rebounded to 122% of 2007 levels.
As the following Figure 11 illustrates the clear majority of this revenue was generated through service-based work.
Figure 11 - Revenue by type of work (2010)
All revenue generated by visual effects studios was service-based work, while nearly two-thirds (65.7%) of revenues generated by computer animation studios was derived from service-based work.
In terms of the product lines that generate revenue, the following Figure 12 illustrates that CA studios generate revenues from a far greater number of sources than VE studios.
46,061 45,17272,975
51,341 54,120
83,354
0
20,000
40,000
60,000
80,000
100,000
120,000
140,000
160,000
180,000
2008 2009 2010
Visual Effects Studios
Computer Animation Studios
34.3
65.7
100.0
0%
20%
40%
60%
80%
100%
Computer Animation Visual Effects
Original content owned by company Service-based work
97,402 99,292
156,329
Economic Profile of the Computer Animation and Visual Effects Industry in Ontario, 2008-2010 20 of 59
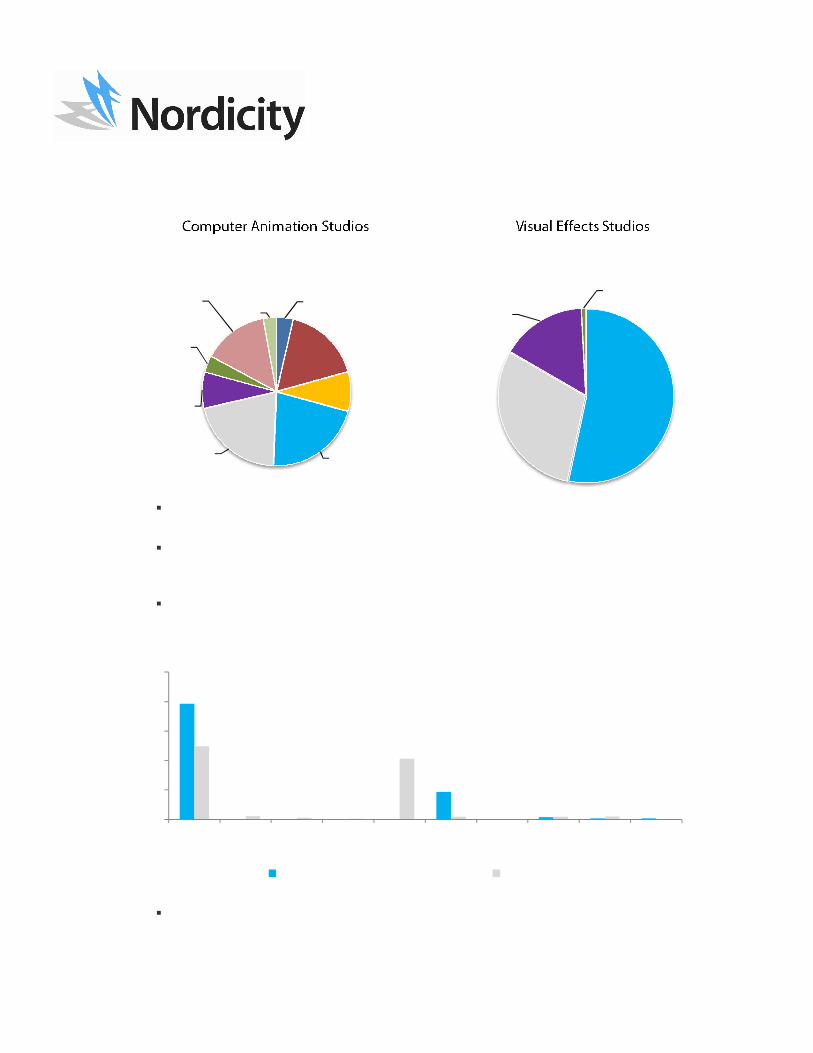
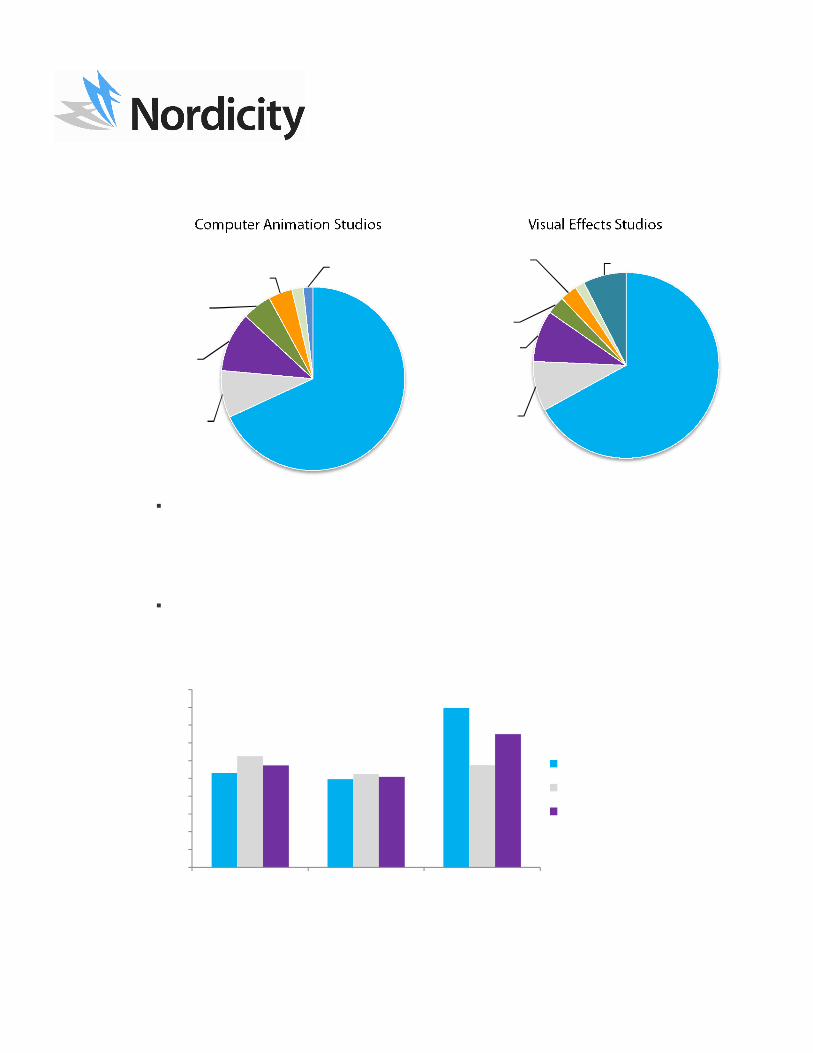
Figure 12 - % revenue by product line (2010)
Clearly, service work on live action feature films (53.3%) and service work for live action TV (30%) make up the largest part of visual effects studios’ revenues.
At the same time, service work for live action TV (27.9%), service work for animated TV (21.4%) and original work for animated TV (20.7%) make up the bulk of revenues for computer animation studios.
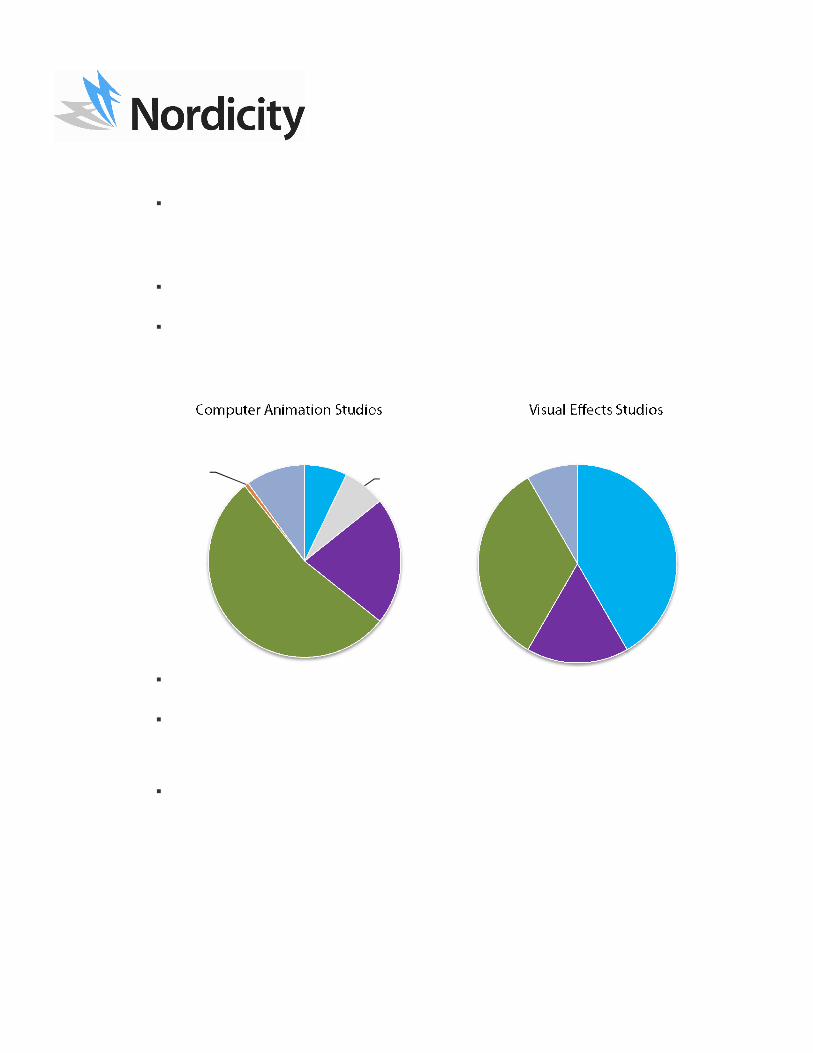
As Figure 13 indicates below, the bulk (78.6%) of revenues in the CA industry and nearly half (49.7%) of the revenues from VE studios are generated from within Ontario.
Figure 13 - % revenue by territory (2010)
That said, a very significant amount of visual effects work comes from Los Angeles (41.2%), while New York contributes 18.6% of revenues to computer animation companies.
78.6
18.6
1.4 0.7 0.7
49.7
2.2 1.2 0.3
41.2
1.7 0.2 1.7 2.00
20
40
60
80
100
Ontario Quebec B.C. Canada: Other
L.A. New York USA: Other
UK Western Europe
Eastern Europe
Computer Animation Visual Effects
Live Action Feature Film: Service-work
3.6%Live Action TV: Service-
work17.1%
Live Action TV: Original
content8.6%
Animated TV: Service-work
21.4%
Animated TV: Original content20.7%
Advertising (incl.
commercials): Service-work
7.9%
Mobile apps: Service-work
3.6%
Animated Feature Film: Service-work
14.3%
Animated Feature Film:
Original content
2.9%
Live Action Feature Film: Service-work
53.3%
Live Action TV: Service-
work30.0%
Live Action TV: Original
content15.8%
Other: Original content
0.8%
Economic Profile of the Computer Animation and Visual Effects Industry in Ontario, 2008-2010 21 of 59
While these findings are roughly consistent with the 2007 findings, CA studios are more focused on the Ontario market in 2010 (78.6% rather than 53.7% in 2007), though the revenue generated from New York has not changed (18.6% in both 2007 and 2010). Less revenue, it seems, is being generated (by CA studios) from Europe and other parts of the United States.
For VE firms, the major sources of revenue have not significantly changed from 2007, with Ontario and Los Angeles remaining the principal sources of revenue. Ontario accounted for 43.6% of revenue in 2007 (slightly less than the 49.7% in 2010), while Los Angeles-based projects generated 36.2% of VE revenue in 2007, somewhat less than the 41.2% of revenue generated from L.A. in 2010.
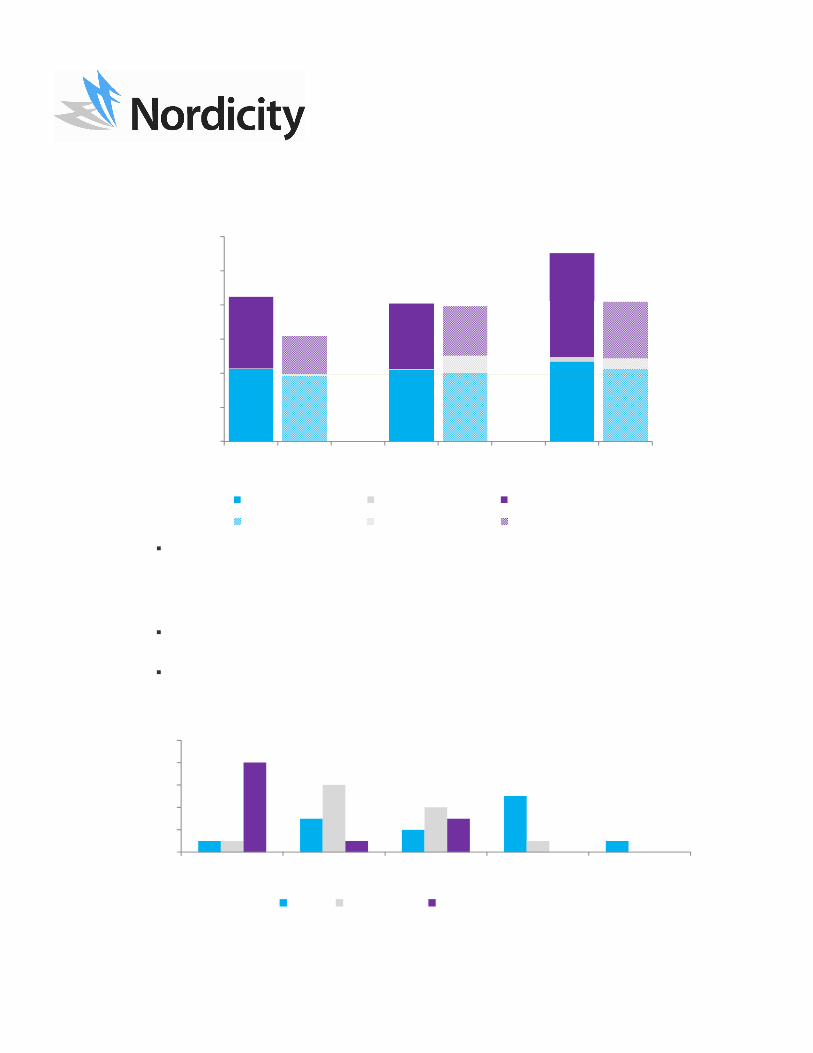
3.3.2 Operating Expenditures
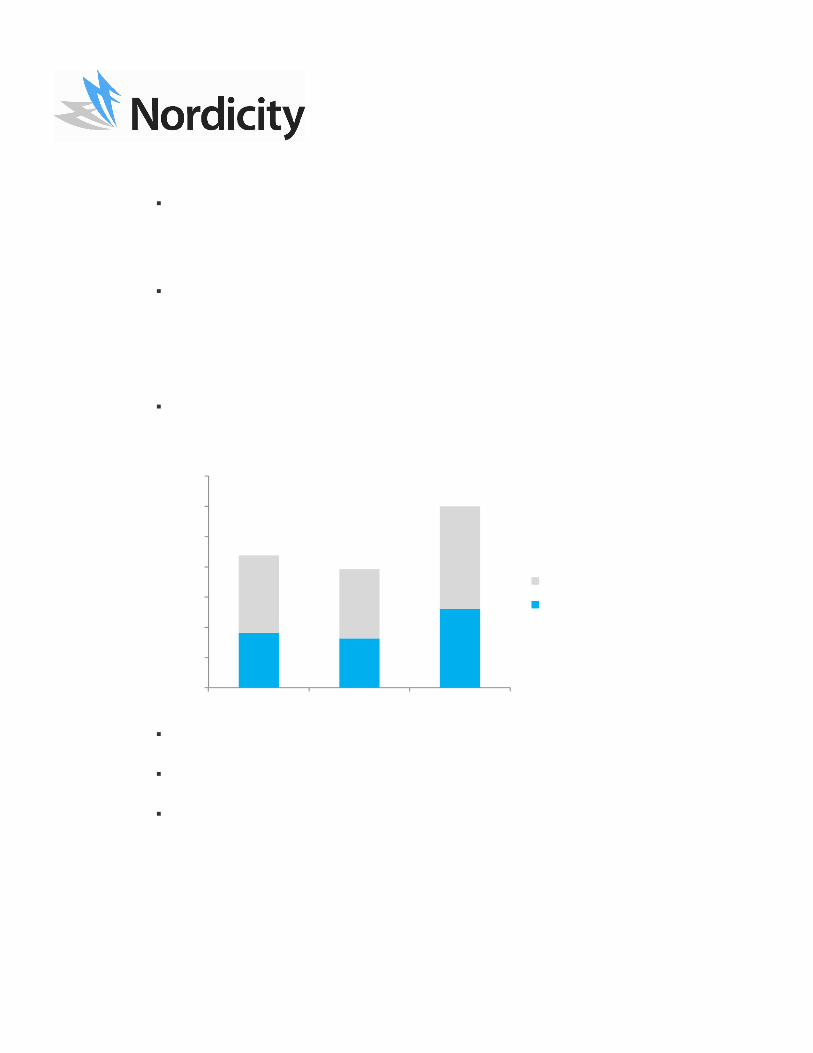
As the following Figure 14 indicates, the industry saw a decline in expenditures in 2009 (from 2008), but has seen a significant growth in expenditures in 2010.
Figure 14 - Estimate of expenditures in $000s (2008-2010)
Over this three-year period, expenses grew for CA studios at a rate of 12.8%, which is slightly faster than the 9.9% growth rate of VE studios’ expenses.
The $87.7 million of expenditures spent by CA and VE studios in 2008 represents a 3.8% decrease from 2007 levels ($91.1 million).
For both CA and VE companies, two thirds of all expenditures (in 2010) were labour-based (i.e. wages, compensation, and employee benefits). Further detail on expenditure categories is presented in Figure 15.
36,349 32,68052,147
51,34145,783
68,084
$0
$20,000
$40,000
$60,000
$80,000
$100,000
$120,000
$140,000
2008 2009 2010
Visual Effects
Computer Animation
87,689 78,463
120,231
Economic Profile of the Computer Animation and Visual Effects Industry in Ontario, 2008-2010 22 of 59
Figure 15 - % expenditures by expense category (2010)
While expenditures on wages, compensation and employee benefits have not changed
significantly from 2007 (when they accounted for 64% of all expenditures), the portion of expenditures spent on software, licenses and equipment has decreased from 18% in 2007 to less than 10% in 2010 (for both the CA and VE industries).
3.3.3 Operating Profits
As Figure 16 (below) indicates, though there may have been a dip in production between 2008 and 2009, overall profit margins only fell by 1.3% (from 11.5% in 2008 to 10.2 % in 2009).
Figure 16 - Profit margins (2008-2010)
10.6%9.9%
17.9%
12.5%10.5% 11.5%11.5%
10.2%
15.0%
0%2%4%6%8%
10%12%14%16%18%20%
2008 2009 2010
Computer Animation
Visual Effects
All Companies
Wages, compensation, employee
benefits68%
Software licenses,
equipment8%
Premises11%
Legal, banking,
accounting, other
professional5%
Advertising, marketing
4%
Transport. travel,
shipping2%
Other2%
Wages, compensation, employee
benefits67%
Software licenses,
equipment9%
Premises9%
Legal, banking,
accounting, other
professional3%
Advertising, marketing
3%
Transport. travel,
shipping2%
Other8%
Economic Profile of the Computer Animation and Visual Effects Industry in Ontario, 2008-2010 23 of 59
Perhaps the most striking change from 2008 to 2010 is the increased profitability of VE studios. Whereas in 2008 and 2009 VE studios lagged behind their CA counterparts, in 2010 VE studios were 6.3 percentage points more profitable then CA studios.
3.3.4 Capitalization
To examine studios’ capitalization, we examine both the initial capitalization of a firm, and its on-going sources of capital.
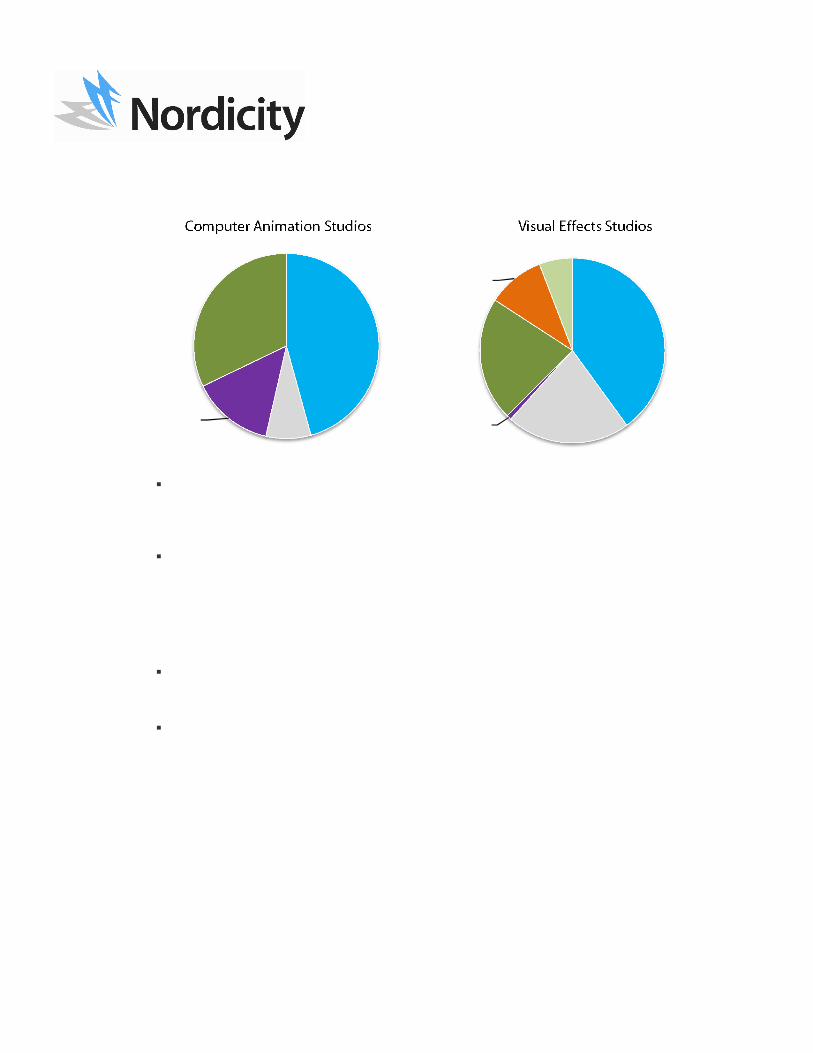
To that end, Figure 17 shows that CA studios in Ontario tend to have received most (53.6%) of their initial capitalization from self-funding. On the other hand, VE studios seem to have attracted significant interest (41.7%) from private investors.
Figure 17 - % sources of initial capitalization
On an on-going basis, studios must continue to raise funds to finance their operations. Figure 18 depicts the sources of these funds.
In 2007, roughly 28% of initial capitalization for CA firms was derived from private equity, which is a significantly higher portion than the 7% reported by CA firms operating in 2011. Correspondingly, CA firms operating in 2007 reported that only 39% of initial capitalization was self-financed, as opposed to 54% in 2011.
For VE studios, firms operating in 2007 reported that 44% of initial capitalization was self-financed, as compared to 33% in 2011. Conversely, whereas VE firms operating in 2011 reported that 42% of their initial capitalization was supplied by private equity, VE studios operating in 2007 reported that private equity accounted for only 18% of initial capitalization.
Private Equity (e.g. Angel
Investor, VC)7%
Public Equity (e.g. CMF
experimental stream)
7%
Other Business Earnings
21%
Self-funding54%
Equipment Financing
1%Other10%
Private Equity (e.g. Angel
Investor, VC)42%
Other Business Earnings
17%
Self-funding33%
Other8%
Economic Profile of the Computer Animation and Visual Effects Industry in Ontario, 2008-2010 24 of 59
Retained Earnings/Prof
it40%
Bank Credit21%
Business Development
Bank Loan1%
Self-funding22%
New Equity Injections
(public and private)
10%
Other6%
Figure 18 - % sources of on-going capitalization
As the figure above illustrates, retained earnings (i.e. profits) make up the largest share of on-going capitalization for both CA and VE studios. However, CA firms continue to self-fund to a greater extent than VE studios. Conversely, VE studios are more likely to obtain bank credit and/or new equity injections.
In 2007, both CA and VE firms reported that roughly 56% of on-going capitalization came from retained earnings, with roughly 15% of on-going capitalization being supplied from both bank credit and new injections of private capital. In 2011, retained earnings account for less on-going capital, while a greater reliance on self-funding has emerged (32% of on-going capitalization for CA studios and 22% for VE studios).
3.3.5 Use of Public Incentives
As with many creative and cultural industries in Canada, CA and VE studios operating in Ontario have access to a range of public support options. The following Figure 19 depicts the percentage of projects that access various support options.
The public support options presented to respondents were the Ontario Computer Animation and Special Effects (OCASE) Tax Credit, Scientific Research and Experimental Development (SR&ED) Tax Credits, the Ontario Production Services Tax Credit (OPSTC), the Ontario Film and Television Tax Credit (OFTTC), and the Canadian Film or Video Production Services Tax Credit (CFVPSTC).
Retained Earnings/Prof
it46%
Bank Credit
8%
Business Development
Bank Loan14%
Self-funding32%
Economic Profile of the Computer Animation and Visual Effects Industry in Ontario, 2008-2010 25 of 59
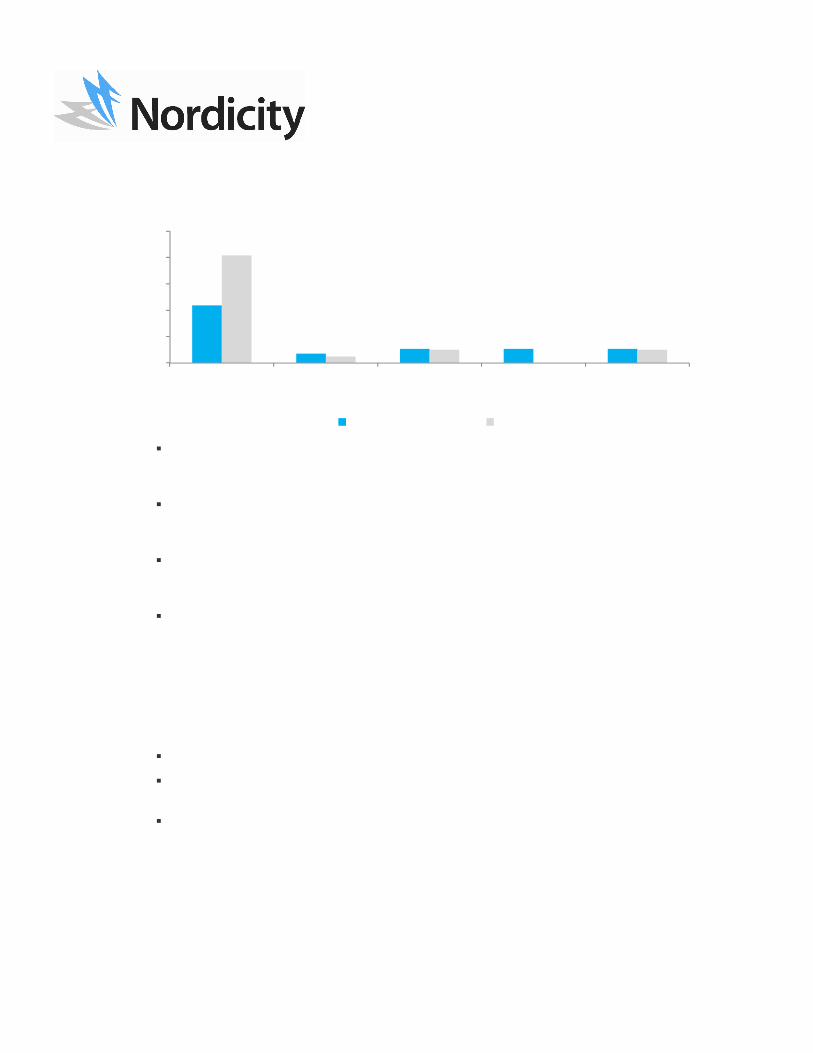
Figure 19 - Access to public support programs as a % of projects (2010)
As the above chart shows, the most popular public support vehicle is the OCASE Tax Credit (administered by the OMDC) with 43.6% of computer animation projects and 81.7% of visual effects projects produced in 2010 having accessed the Credit.
Of the 9 studios that indicated that they produced projects that did not access the OCASE tax credit, six out of the nine reported that they did not apply because the project in question was ineligible to receive tax credit support.
Since 2007, the rate of use of the OCASE tax credit for CA projects has decreased from 88% of projects to less than 44% of projects in 2010 (a 50% drop). Similarly, the use of SR&ED tax credits (19% in 2007), the OPSTC (25% in 2007) and OFTTC (13% in 2007) have all decreased.
A decrease was also observed for VE studios, where the instance of OCASE access fell from 92% in 2007 to 82% in 2010. Over the same period SR&ED and OPSTC access fell from 25% (for each tax credit) to 10% and 5% respectively.
3.4 Employment and Jobs
This section of the report details employment in the computer animation and visual effects industry in Ontario, as evidenced by the survey results. In so doing, we discuss the following types of employees:
Artistic: such as designers, layout artists, modelers, riggers, animators, etc.
Technical: such as systems operators, programmers, network and communication specialists, etc.
Administrative: such as CTO, CFO, production management, sales, marketing, PR, finance, etc.
This section also refers to contract and freelance employees. For this study we understand contract employees to be individuals hired on a short-term basis, either full or part-time, whereas freelancers are self-employed workers (including personal corporations).
Finally, this section refers to different levels of seniority among CA and VE workers. We have defined these levels of seniority as follows:
43.6
7.1 10.7 10.7 10.7
81.7
5.0 10.0 10.0
0
20
40
60
80
100
OCASE Tax Credit Access
SR&ED Access OPSTC Access OFTTC Canadian Film or Video Production
Services Tax CreditComputer Animation Visual Effects
Economic Profile of the Computer Animation and Visual Effects Industry in Ontario, 2008-2010 26 of 59
Senior: five or more years of directly relevant experience
Intermediate: 2 to 4 years of directly relevant experience
Junior: fewer than 2 years of directly relevant experience
3.4.1 Employment by Job Type
As the following Figure 20 indicates, employment in the CA industry dipped in 2009, but rebounded in 2010. On the other hand, employment among VE studios grew more between 2008 and 2009 (by 28%) than between 2009 and 2010 (by only 3%).
Figure 20 – Total employment by job type (2008-2010)
In both industries, the vast majority of employees are artistic employees, though computer animation companies seem to maintain slightly more technical and administrative staff.
In total, 1466 people were employed by the combined CA and VE industries in 2008, which grew by 9.2% to 1601 in 2009, and again by 20.2% to 1924 persons by 2010. From the 1285 people employed in the two industries in 2007, 2010 levels represent a 49.7% increase over four years.
3.4.2 Employment by Employment Status
While CA studios did see a significant growth in employment in 2010 (from 2009 levels), the vast majority of that growth was derived from contract and freelance labour, as shown by Figure 21.
678 606
842
7078
95100
125
167
520687 717
28
31 28
70
75 75
0
200
400
600
800
1,000
1,200
1 2 3 4 5 6 7 8
Admin VE
Technical VE
Artistic VE
Admin CA
Technical CA
Artistic CA
2008 20102009
848
618
809 792 820
1104
Economic Profile of the Computer Animation and Visual Effects Industry in Ontario, 2008-2010 27 of 59
Figure 21 – Total employment by status (2008-2010)
Indeed, full time employment in both the CA and VE industries has been relatively stable since 2008. CA firms’ full time staffs have grown at a compound annual rate of 3.2% since 2008, while VE studios full time staffs have grown by 3.8% over the same period.
3.4.3 Availability of Talent
Another important element of the employment picture in Ontario’s CA and VE industries is the availability of that talent.
As the following Figure 22 indicates, senior staff members seem to be somewhat less available for artistic positions, while junior staff members are readily available.
Figure 22 - Artistic talent availability (by # of responses, 2011)
425 417 467
3 828
420 384
609
381 403 425
14100 61
222
289 334
0
200
400
600
800
1,000
1,200
1 2 3 4 5 6 7 8
Full Time CA Part-time CA Contract/Freelance CA
Full Time VE Part-time VE Contract/Freelance VE
2008 20102009
848
618
809 792 820
1104
1
32
5
11
6
4
1
8
1
3
0
2
4
6
8
10
Very Available Somewhat Available
Available Sometimes Available
Not at all Available
Senior Intermediate Junior
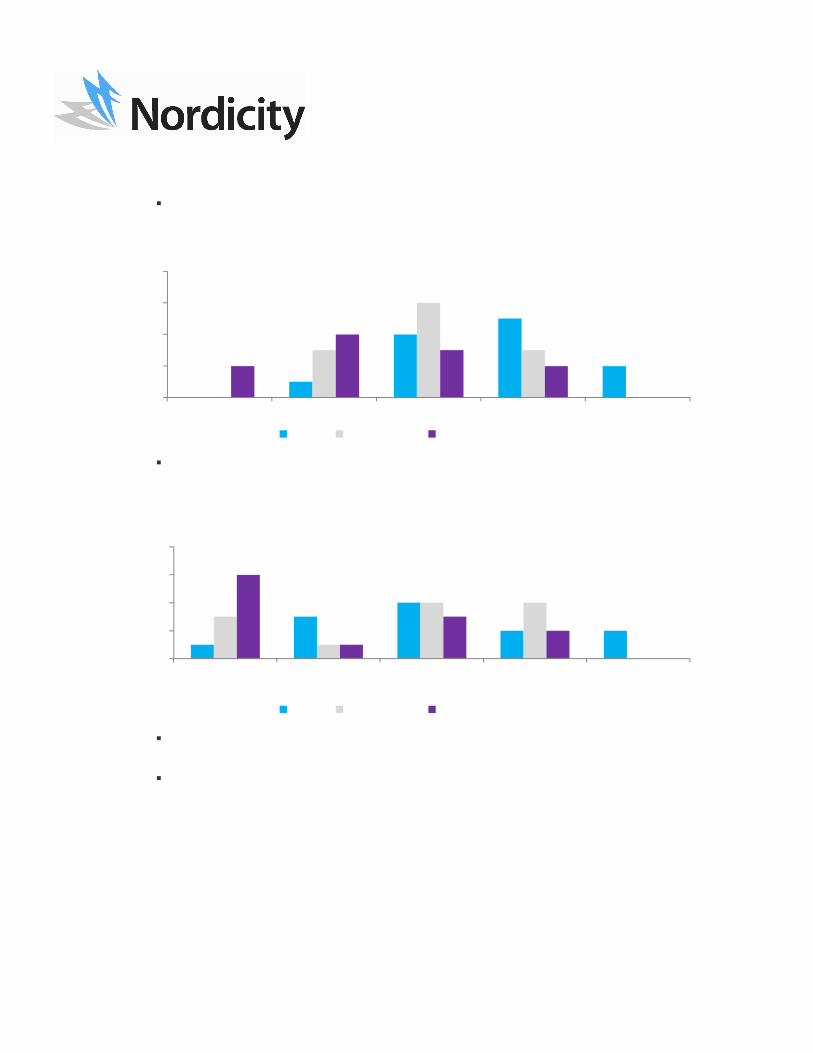
Economic Profile of the Computer Animation and Visual Effects Industry in Ontario, 2008-2010 28 of 59
As depicted by Figure 23, senior technical staff members are also somewhat less available to studios, while intermediate and junior staff members are only slightly more available.
Figure 23 - Technical talent availability (by # of responses, 2011)
Figure 24 shows that administrative staff is available at the junior and intermediate level, while there is no clear position among respondents as to the availability of senior administrative talent.
Figure 24 - Administrative talent availability (by # of responses, 2011)
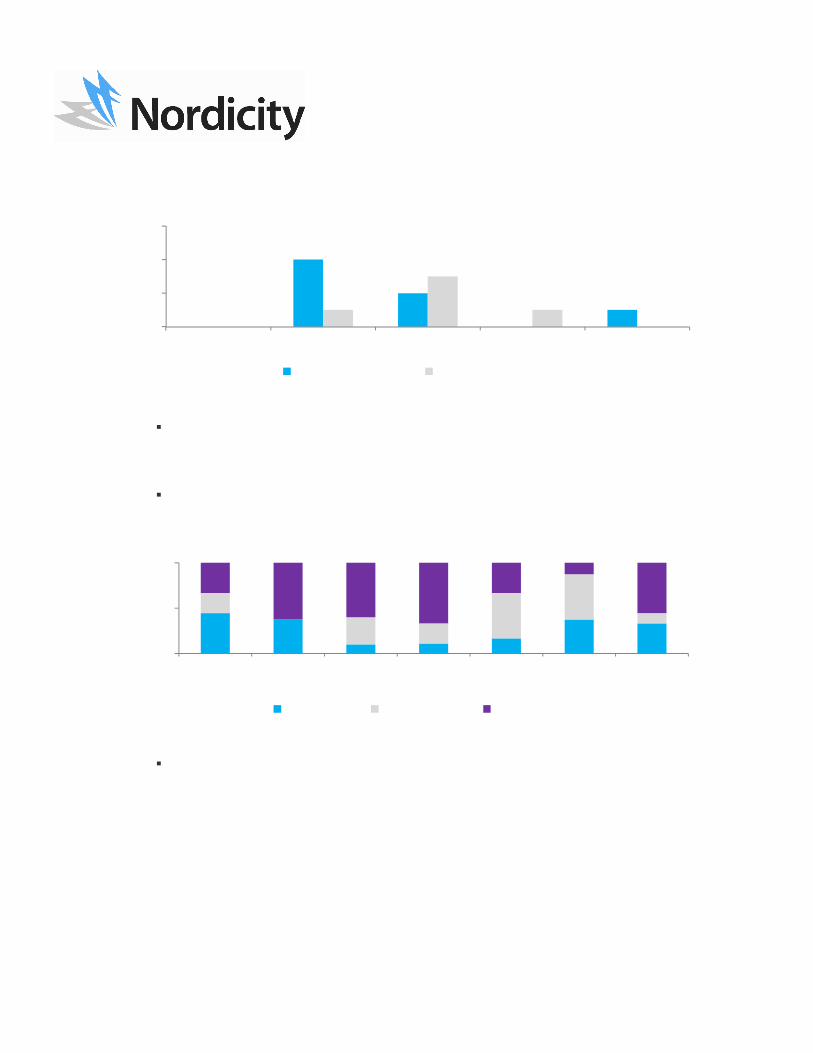
As new talent is clearly most available at the junior level for all types of positions, it is important to gauge studios’ views as to the preparedness of these new workers.
To that end, Figure 25 shows that CA studios seem to be somewhat more satisfied with their new junior hires than their VE counterparts.
1
45
23
6
32
43
2
0
2
4
6
8
Very Available Somewhat Available Available Sometimes Available Not at all Available
Senior Intermediate Junior
1
34
2 23
1
4 4
6
1
32
0
2
4
6
8
Very Available Somewhat Available Available Sometimes Available
Not at all Available
Senior Intermediate Junior
Economic Profile of the Computer Animation and Visual Effects Industry in Ontario, 2008-2010 29 of 59
Figure 25 - Level of satisfaction with new graduates (by # of responses, 2011)
3.5 Future Outlook
In the final section of the questionnaire, firms were asked to report on their outlook for the future of the CA and VE industries in Ontario.
3.5.1 Outlook of Companies
As the following Figure 26 indicates, the studios polled viewed animated TV and live action TV as the most promising areas for future growth.
Figure 26 - Future outlook by industry segment
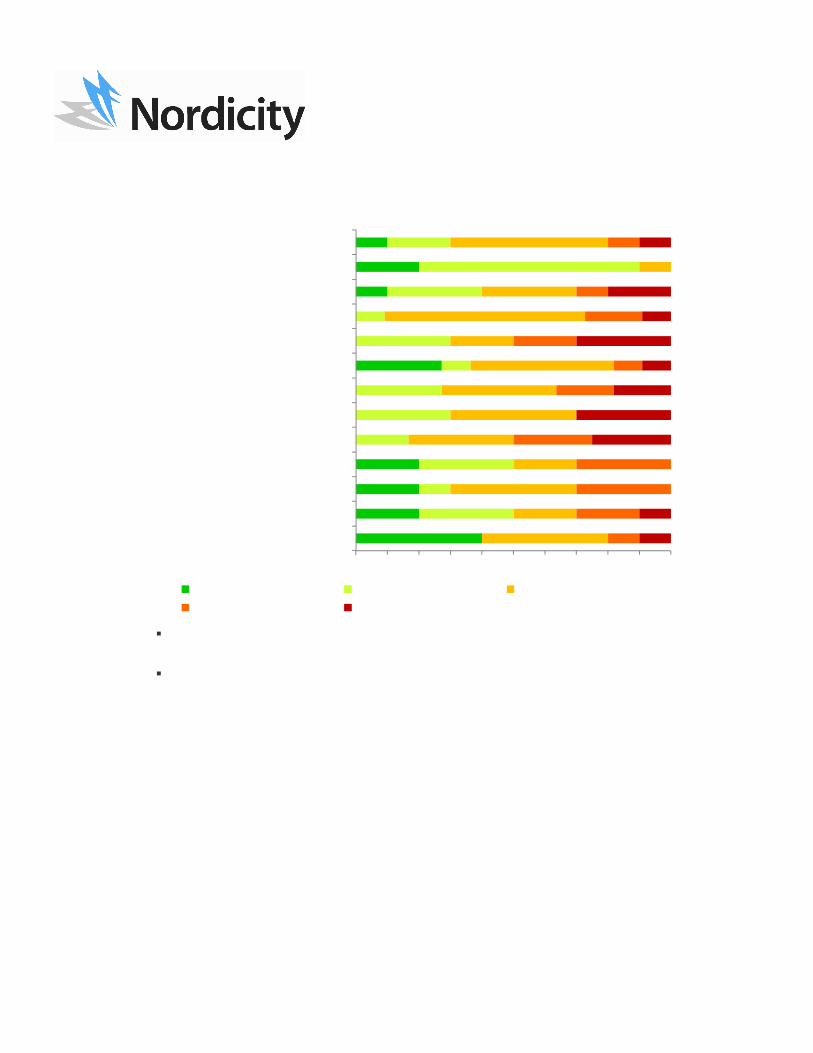
3.5.2 Perceived Barriers to Growth
Studios were also asked about issues that may hinder their growth; the following Figure 27 outlines studios’ perception of these barriers.
4
211
3
1
0
2
4
6
Extremely Satisfied Very Satisfied Somewhat Satisfied Not Very Satisfied Not At All Satisfied
Computer Animation Visual Effects
44%38%
10% 11% 17%38% 33%
22%
30% 22%
50%
50%
11%
33% 63% 60% 67% 33%13%
56%
0%
50%
100%
Live action feature film
Animated feature film
Live action TV Animated TV Video/Computer Games
Mobile Application
Development
Other Digital Media
No Change Slight Growth Significant Growth
Economic Profile of the Computer Animation and Visual Effects Industry in Ontario, 2008-2010 30 of 59
Figure 27 - Perceived barriers to growth (by # of respondents, 2011)
According to the polled CA and VE studios, the biggest issues were the inability of firms to collaborate and international competition.
International competition was the most common barrier to growth reported in 2007, followed by the strength of the Canadian dollar, the high cost of operating tin Ontario, the decline in demand for service work and local studios’ ability to collaborate. As such, some concerns (collaboration and international completion) seem to be consistent challenges for the CA and VE industries in Ontario.
4. Customer Satisfaction Survey This section of the report provides data on the satisfaction of the clients of computer animation and visual effects studios in Ontario. The survey was developed specifically to collect information on the strengths and weaknesses of Ontario firms in delivering, meeting and/or exceeding their customers’ expectations. Twenty-three clients of Ontario-based firms responded to the customer satisfaction survey.
4
2
2
2
3
1
2
1
3
1
3
2
3
3
1
3
1
3
7
2
4
2
4
2
4
4
4
5
2
7
3
1
5
1
2
3
3
3
2
1
2
2
1
1
1
1
3
3
2
1
3
1
2
1
0% 10% 20% 30% 40% 50% 60% 70% 80% 90% 100%
Tax credits (other jurisdictions)
Decline in demand for service work
Shortage of skilled labour
Shortage of effective training programs
International competition
Lack of affordable capital
Inability to access foreign markets
Insufficient management and expertise
Local studios inability to collaborate
Increase in client/producer demands
High cost of operating in Ontario
Threat of industry disruptions (e.g. strikes)
Increasing strength of Canadian dollar
Not at all limiting Not very limiting Somewhat limitingVery limiting Extremely limiting
Economic Profile of the Computer Animation and Visual Effects Industry in Ontario, 2008-2010 31 of 59
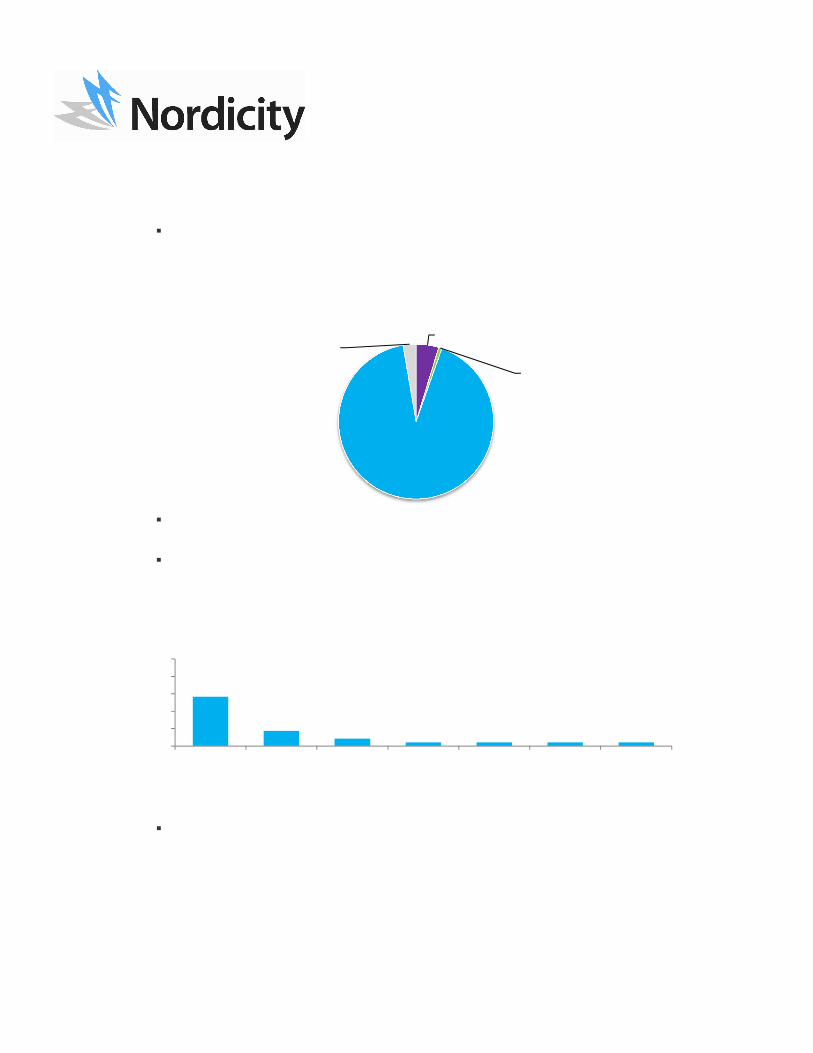
4.1 Recent Projects As Figure 28 below indicates, of the 23 firms that responded to the Customer Satisfaction
survey and worked with an Ontario-based studio, the vast majority (91.9%) of the projects belonged to the TV Production segment.
Figure 28 – Number of Ontario-based studio projects in past 12 months by market segment
Well below TV production is Feature Film Production (4.7%), TV Distribution and Post-Production (2.7%) and Other Digital Media Productions (0.7%).
As depicted in Figure 29 below, the majority (56.5%) of respondents are based in Ontario, followed by LA, New York and BC with one respondent based in each of Miami, UK and South America. In other words, 60.9% of client respondents were based in Canada and 39.1% are international in nature.
Figure 29– Location of client satisfaction survey respondents
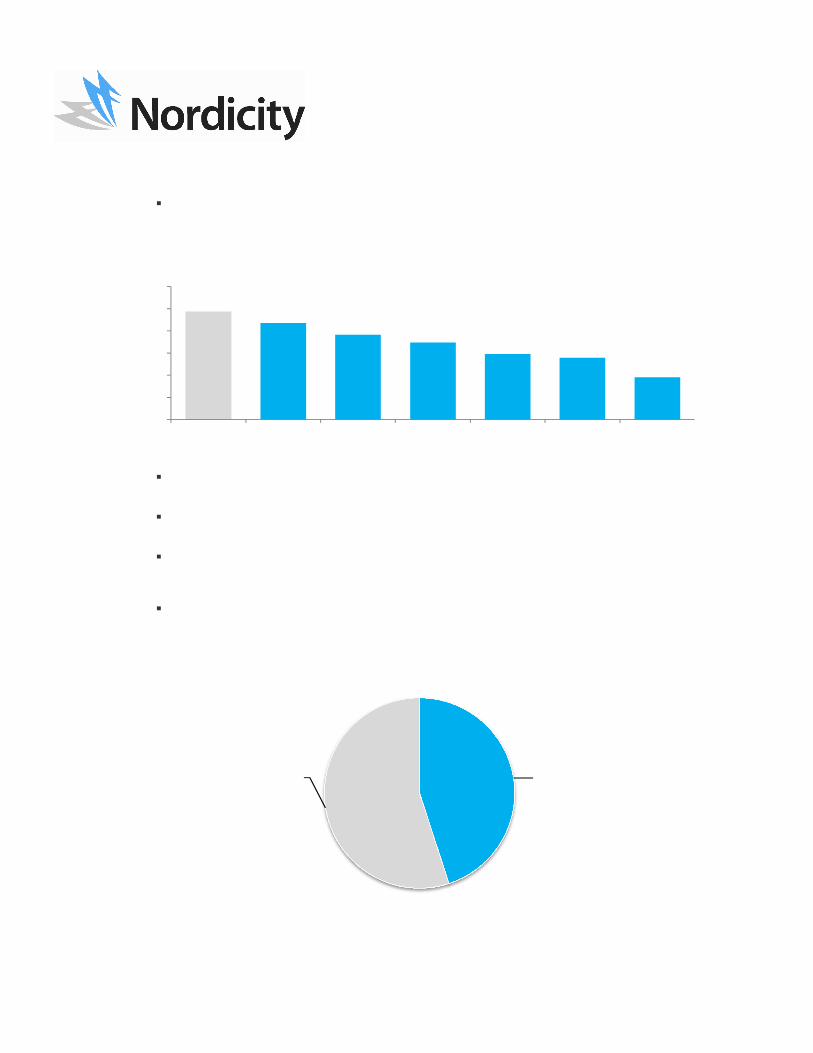
4.2 Customer Satisfaction Rankings
Clients were asked to rate Ontario-based CA and VE studios on various criteria according to a five point satisfaction scale ranging from “Not at all Satisfied” to “Very Satisfied.” Each point on the scale was assigned a score between 1 and 5. The scores were tallied for each criterion and subsequently divided by the total possible points that could be awarded in a given criterion, leading to the percentage scores (as shown below in Figure 30).
Feature film production
5%
Other digital media
production and/or
development0%
TV production92%
TV Production, Development,
Distribution, and Post.3%
13
14 2 1 1 1
0%20%40%60%80%
100%
Ontario LA New York BC Miami UK South America
Economic Profile of the Computer Animation and Visual Effects Industry in Ontario, 2008-2010 32 of 59
When asked to rank satisfaction with various aspects of the work completed by Ontario-based studios, firms ranked ‘Professionalism and attitude’ (81.7%), ‘Business skills and knowledge’ (79.1%), and the ‘Quality of creative work’ (77.4%) as the top three criteria.
Figure 30 – Satisfaction with Ontario-based studios
The three lowest-rated criteria, as rated by client-respondents, were ‘Cost of labour’ (69.6%), ‘Quality of technical work’ (73.9%), and ‘Timeliness of deliverables’ (74.8%).
‘Overall satisfaction’ – which was asked as a standalone criterion and not derived from the average of all of the criteria -- was the criterion rated the highest by client firms.
No client rated any criteria as ‘Not at all satisfied’ or ‘Not very satisfied.’
4.3 Losses to Other Jurisdictions
Of the firms that responded to the client satisfaction survey, 11 firms (55%) did not award any work outside of Ontario in the past 12 months, while 9 firms (45%) did.
Figure 31-% of firms that have awarded a contract outside of Ontario in the past 12 months
84.3%81.7%
79.1%77.4%
74.8% 73.9%
69.6%
60%
65%
70%
75%
80%
85%
90%
Overall Professionalism and attitude
Business skills and knowledge
Quality of creative work
Timeliness of deliverables
Quality of technical work
Cost of labour
Awarded work to fims outside Ontario, 45.0%
Did not award work to firms
outside of Ontario, 55.0%

Economic Profile of the Computer Animation and Visual Effects Industry in Ontario, 2008-2010 33 of 59
“Cost of Labour” was cited most frequently as the reason firms looked outside of Ontario for Computer Animation and visual effects work.
Other reasons cited by survey respondents included:
o “Greater talent base in Vancouver for the specific purposes of the project;”
o “Los Angeles Tax incentive and good price point. Ease of execution with local company,” and;
o “More attractive package from Montreal Studio - they brought equity investment as well as PSTC to offer better price/value to the project.”
5. Economic Impact Analysis 5.1 Direct Economic Impact
The total direct economic impact of activity in the visual effects and computer animation industries is approximately $82.9 million. Direct economic impact is based on a combination of a portion of an industry’s direct output3 and the wages it pays to employees.
5.2 Industry Employment in FTEs
The Computer Animation and Visual Effects industry in Ontario leads to the employment of approximately 2,721 full-time equivalent jobs (or FTEs) in the province.
The FTE figure is attained by taking the total hours worked divided by average annual hours worked in full-time jobs. The FTE figure is useful because it allows for comparisons across industries and time periods.
Figure 32 – FTE employment, direct and spin-off
3 “Output consists of those goods or services that are produced within an establishment that become available for use outside that establishment, plus any goods and services produced for own final use.” Organisation for Economic Co-operation and Development (OECD) Glossary. http://stats.oecd.org/glossary
1,311; 48%1410; 52%
Direct Spin-off
Total: 2,721

Economic Profile of the Computer Animation and Visual Effects Industry in Ontario, 2008-2010 34 of 59
As shown in Figure 32 (above), the total figure of 2,721 is composed of 1,311 directly employed FTE’s and approximately 1,410 spin-off FTEs.
5.3 Spin-off and Total Economic Impact
Where the direct economic impact relates to GDP, wages and output as described previously, we refer to indirect and induced economic impacts as spin-off. Spin-off economic impact results from the computer animation and visual effects industry’s purchase of goods and services from other industries (indirect), and the economic activity generated by the re-spending of income and profits within the Canadian economy (induced).
In 2010, the computer animation and visual effects industries indirectly generated $34.5 million towards provincial GDP. At the same time, the induced impact of the industries was $72.6 million in 2010.
Combined with the direct impact, the spin-off yields a total economic impact of $190 million, as indicated by Figure 33 below.
Figure 33 - Contributions to GDP by the CA and VE industries (in $000s, 2010)
6. Key Findings and Observed Trends Based on the survey findings and economic analysis presented in the preceding section, Nordicity is able to establish some key findings – and to observe a number of interesting trends.
6.1 Industry Growth
Despite a small dip in production levels in 2009 in the computer animation (CA) 2010 saw a rebound. That said, the 2010 growth was somewhat limited (up 10% from 2009 levels). Meanwhile, in the VE industry production levels grew significantly (in terms of number of shots completed) between 2008 and 2010.
82,917; 44%
107,107; 56%
Direct Spin-off
Total: $190,024,000

Economic Profile of the Computer Animation and Visual Effects Industry in Ontario, 2008-2010 35 of 59
Revenue levels in both the CA and VE industries grew significantly in 2010 (from 2009 levels) after being relatively flat between 2008 and 2009. Over the three year period in question, both industries’ revenue levels saw around a 17% annualized compound growth rate.
As one might expect, expenditure levels roughly follow the trend of production and revenue – with a dip in 2009 and a significant rebound in 2010. Over the three year period, CA expenses seemed to grow (at 13% compound annual growth) slightly faster than VE expenses (which grew at a rate of 10% compounded annually).
In 2010, the majority of these expenses (roughly 2/3) were wages, compensation and employee benefits.
Combining the above, it was observed that profit margins in the CA industry have come to exceed that of the VE industry. In 2008, the CA industry had an average margin of 11%, which grew to 18% in 2010. At the same time, the VE studios’ 13% margin in 2008 shrunk slightly to 12% in 2010.
6.2 Products and Territories
In terms of product lines the VE industry relies heavily on three types of projects: live action feature film service work, live action TV service work, and live action TV original content. Conversely, CA studios in Ontario derive revenue from a wide variety of product types.
Indeed, 100% of reported revenue (in 2010) in the VE industry was from service-based work, while just over 1/3 of revenue in the CA industry was generated by original content.
When examining the territories where CA and VE studios generated their revenue in 2010, it was observed that most (79%) of the CA work reported came from Ontario, with New York accounting for another significant portion (19%). For VE studios, Ontario was also the largest source of revenue (50%), while Los Angeles was also a very important source of revenue (41%).
6.3 Capital and Funding
In terms of initial capitalization, CA relied heavily on self-financing (54%) to start their firms. While VE firms also used self-funding (making up 33% of initial capital), they were far more successful in attracting private equity, which accounted for 42% of VE studios’ initial capitalization.
The two industries are somewhat more similar in terms of sources of on-going capital, with retained earnings accounting for 46% and 40% of CA and VE capital, respectively. Again, while both types of studio will rely on self-funding, CA studios (at 32%) are more dependent on this type of financing than VE studios (at 22%). On the other hand, VE studios seem to be somewhat more successful in attracting bank credit (which accounts for another 22% of VE studios’ on-going capital).
6.4 Jobs and Employment
Looking at employment levels in total, one sees that CA studios saw a small dip in employment in 2009, but rebounded strongly in 2010. VE studios, on the other hand, experienced more significant growth between 2008 and 2009. By 2010, CA studios had

Economic Profile of the Computer Animation and Visual Effects Industry in Ontario, 2008-2010 36 of 59
grown at a compound annual rate of 9% (from 2008 levels) while the VE industry grew by 10% over the same period.
When employment is examined by type of position, it is clear that the distribution of artistic, technical, and administrative staff has remained fairly constant since 2008 – with artistic staff accounting for 81% of all employees in 2008 and 81% in 2010.
Digging deeper into employment, it is interesting to note the change in employment status from 2008 to 2010. Over the three year period (2008-2010), the level of full time employment remained roughly flat (at between 417 and 467 for CA studios; and 381 and 425 for VE studios). However, the percentage of the industry that is made up of contract and/or freelance employment has grown among CA firms. In 2008 contract/freelance workers accounted for 50% of all CA employees, while in 2010 that portion had grown to 55%.
6.5 Future Growth and Barriers
Bucking the conventional wisdom to some extent, studios polled suggested that the most likely sources of future growth for their companies lay with live action and animation TV, while live action feature film and mobile applications were thought to be the least likely prospects for growth.
In terms of achieving this growth, the most commonly identified barriers to growth were international competition and the inability to access foreign markets. Lack of affordable capital was also identified as a significant issue.
6.6 Customer Satisfaction
Of those customers that responded to the survey, the vast majority (92%) commented on TV productions and most were from Ontario.
Overall, customers were very satisfied with the work of Ontario-based studios. That said, the customers were least satisfied by the cost of labour in Ontario (which scored 70%) and the quality of technical work (74%).
Of those customers surveyed, 45% opted to select a firm outside of Ontario. Of these firms, the most common reason given for this decision was, unsurprisingly, the cost of labour in Ontario.
6.7 Economic Impact
The direct economic impact of the CA and VE industries in 2010 was $83 million.
The total impact including spin-off impacts of the two industries in 2010 totaled more than $190 million.
In terms of FTEs, the combined CA and VE industries generated employment for 2,721 people in Ontario in 2010. This figure includes direct and spin-off (i.e. indirect and induced) employment.

Economic Profile of the Computer Animation and Visual Effects Industry in Ontario, 2008-2010 37 of 59
Appendix A: Survey Questionnaires
A.1 Economic Profile
Introduction
Nordicity, on behalf of CASO, has prepared this online survey to collect information on the issues and challenges facing businesses in Ontario’s computer animation and visual effects industry. Your input is vital to developing:
inputs for the analysis of relevant economic data and industry benchmarks;
public and private incentives;
valid insight into market changes;
critical success factors for the growth of computer animation and visual effects companies.
In order to complete this questionnaire, you will require access to project and financial information for the fiscal years ending in 2008, 2009 and 2010. All of your responses to the survey will be kept strictly confidential. The information collected will be used in aggregate in order to improve programs and policies that serve the industry. Only the survey company will see individual company information. The CASO board, its members and/or our funding sponsors will have no access to any individual company results, but will only see the information in aggregate. Please note: You may opt to print a copy of this questionnaire and fax it directly to Nordicity at 416-657-2521. To do so, simply click on the "Download to PDF" link at the top of any page of the survey other than this one. This PDF will display all answers to you have entered so far, and you may manually add any other responses that you may have skipped There are five sections to the survey, a total of 21 questions:
Corporate Profile – 5 questions (e.g. Are you a public vs. private company?)
Financial Profile - 7 questions (e.g. A breakdown of operating revenues)
Access to Financing - 2 questions (e.g. Do you use tax credits?)

Economic Profile of the Computer Animation and Visual Effects Industry in Ontario, 2008-2010 38 of 59
Employment and Jobs- 3 questions (e.g. How many people do you employ?)
Market Growth Prospects – 2 questions (e.g. How do you see the industry evolveing?)
Games Development – 2 questions (e.g.Do you develop games?)
Please take the time to complete the survey. This is likely best done by person(s) in senior management most familiar with key financial, human resources and other strategic issues facing your company. Your participation in this survey is of the utmost importance and is greatly appreciated. The questionnaire is easy to fill out and should take less than 30 minutes to complete. If you have any questions about this survey, you may contact: Kristian Roberts, Nordicity, 416 657 2521, [email protected]. Many thanks.
A. Corporate Profile
A1. Is your company public or private?
A2. Is your company Canadian or foreign-controlled?
A3. For how many years has your company been in operation?
A4. What is your company’s volume of output?
Computer animation - Please convert the number of films/TV episodes into the number of minutes.

Economic Profile of the Computer Animation and Visual Effects Industry in Ontario, 2008-2010 39 of 59
Visual effects - Please state the number of shots completed. Games and/or applications – Please state the number of projects completed Other - Please state the number of projects.
Fiscal Year Ending in: 2010
Fiscal Year Ending in: 2009
Fiscal Year Ending in: 2008
Computer Animation – total minutes:
Visual effects - total shots:
Games or Applications – number of projects:
A5. What percentage of your company’s projects (as described in the previous question) is service-oriented vs. original content owned by your company?
Please note that percentages for each year should equal 100%.
Fiscal Year Ending in: 2010
Fiscal Year Ending in: 2009
Fiscal Year Ending in:2008
Service work
Content owned by your company
Other

Economic Profile of the Computer Animation and Visual Effects Industry in Ontario, 2008-2010 40 of 59
B. Financial Profile & Sales Data
B1. Please indicate your company’s principal line of business (as of the fiscal year ending in 2010).
Your principal line of business is where your company generates the largest share of its revenues in a typical year. Please note that if your company is engaged in pre-production work, please select the line of business that best describes the eventual finished product.
B2. Over the past three fiscal years, what has been your company’s operating revenues, expenses and margin?
Operating Revenue Operating Expenses Operating Margin
2010
2009
2008
B3. In the fiscal year ending (FYE) in 2010, what was the approximate breakdown of your company’s operating expenses?
Please note that percentages must sum to 100%
Variable Response
B3. In the fiscal year ending (FYE) in 2010, what was the approximate breakdown of your company’s operating expenses? | Wages, compensation and employee benefits:
B3. In the fiscal year ending (FYE) in 2010, what was the approximate breakdown of your company’s operating expenses? | Software licenses and equipment:
Economic Profile of the Computer Animation and Visual Effects Industry in Ontario, 2008-2010 41 of 59
B3. In the fiscal year ending (FYE) in 2010, what was the approximate breakdown of your company’s operating expenses? | Premises (incl. utilities, telecoms, rent):
B3. In the fiscal year ending (FYE) in 2010, what was the approximate breakdown of your company’s operating expenses? | Legal, banking, accounting and other professional services:
B3. In the fiscal year ending (FYE) in 2010, what was the approximate breakdown of your company’s operating expenses? | Advertising/Marketing:
B3. In the fiscal year ending (FYE) in 2010, what was the approximate breakdown of your company’s operating expenses? | Transport. Travel, shipping:
B3. In the fiscal year ending (FYE) in 2010, what was the approximate breakdown of your company’s operating expenses? | Other:
B4. Based on all projects completed in FYE 2010, what percentage of your annual revenues was generated by the following types of project:
Please note that percentages must sum to 100%
Variable Response
B4. Based on all projects completed in FYE 2010, what percentage of your annual revenues was generated by the following types of project: | Original content owned by your company
B4. Based on all projects completed in FYE 2010, what percentage of your annual revenues was generated by the following types of project: | Service-based work
B4. Based on all projects completed in FYE 2010, what percentage of your annual revenues was generated by the following types of project: | Licensing
B4. Based on all projects completed in FYE 2010, what percentage of your annual revenues was generated by the

Economic Profile of the Computer Animation and Visual Effects Industry in Ontario, 2008-2010 42 of 59
following types of project: | Other non-content revenues (e.g. merchandising)
B5. What percentage of your company’s revenues was generated by each of the following market segments in FYE 2010?
Original content (%) Service-work (%)
Live Action Feature Film
Animated Feature Film
Live Action TV
Animated TV
Game content
Non-games digital Media
Mobile apps
Advertising (incl. commercials)
Other
B6. In the fiscal year ending in 2010, what percentages of your company’s revenues came from projects commissioned from each of the following regions?
Please note that percentages must sum to 100%
Variable Response
B6. In the fiscal year ending in 2010, what percentages of your company’s revenues came from projects commissioned from each of the following regions? | Canada: Ontario
B6. In the fiscal year ending in 2010, what percentages of your company’s revenues came from projects commissioned from each of the following regions? |

Economic Profile of the Computer Animation and Visual Effects Industry in Ontario, 2008-2010 43 of 59
Canada: Quebec
B6. In the fiscal year ending in 2010, what percentages of your company’s revenues came from projects commissioned from each of the following regions? | Canada: B.C.
B6. In the fiscal year ending in 2010, what percentages of your company’s revenues came from projects commissioned from each of the following regions? | Canada: Other (please specify):
B6. In the fiscal year ending in 2010, what percentages of your company’s revenues came from projects commissioned from each of the following regions? | USA: L.A.
B6. In the fiscal year ending in 2010, what percentages of your company’s revenues came from projects commissioned from each of the following regions? | USA: New York
B6. In the fiscal year ending in 2010, what percentages of your company’s revenues came from projects commissioned from each of the following regions? | USA: Other (please specify):
B6. In the fiscal year ending in 2010, what percentages of your company’s revenues came from projects commissioned from each of the following regions? | Europe: UK
B6. In the fiscal year ending in 2010, what percentages of your company’s revenues came from projects commissioned from each of the following regions? | Europe: Western Europe
B6. In the fiscal year ending in 2010, what percentages of your company’s revenues came from projects commissioned from each of the following regions? | Europe: Eastern Europe
B6. In the fiscal year ending in 2010, what percentages of your company’s revenues came from projects commissioned from each of the following regions? |

Economic Profile of the Computer Animation and Visual Effects Industry in Ontario, 2008-2010 44 of 59
Asia: India
B6. In the fiscal year ending in 2010, what percentages of your company’s revenues came from projects commissioned from each of the following regions? | Asia: China
B6. In the fiscal year ending in 2010, what percentages of your company’s revenues came from projects commissioned from each of the following regions? | Asia: Korea
B6. In the fiscal year ending in 2010, what percentages of your company’s revenues came from projects commissioned from each of the following regions? | Asia: Other
B6. In the fiscal year ending in 2010, what percentages of your company’s revenues came from projects commissioned from each of the following regions? | South America
B6. In the fiscal year ending in 2010, what percentages of your company’s revenues came from projects commissioned from each of the following regions? | Other:0

Economic Profile of the Computer Animation and Visual Effects Industry in Ontario, 2008-2010 45 of 59
B7a. In the fiscal year ending in 2010, did your company outsource any element of your business to other companies (e.g. other than to individual freelancers)?
B7b. Why did your company outsource any element of your business to other companies (e.g. other than to individual freelancers)?
B7c. To which jurisdictions did your company outsource? (please check all that apply).
C. Access to Financing
C1. What is the source of your company’s original and ongoing capitalization? (Percentages must sum to 100%)
A) Original capitalization. Capitalization is to be understood as monies invested at the outset of a company prior to that company generating revenues.
Variable Response
C1. What is the source of your company’s original and ongoing capitalization? (Percentages must sum to 100%) | Private Equity (e.g. Angel Investor, VC)
C1. What is the source of your company’s original and ongoing capitalization? (Percentages must sum to 100%) | Public Equity (e.g. CTF, CMF experimental stream)
C1. What is the source of your company’s original and ongoing capitalization? (Percentages must sum to 100%) | Other Business Earnings
C1. What is the source of your company’s original and ongoing capitalization? (Percentages must sum to 100%) | Self-funding
Economic Profile of the Computer Animation and Visual Effects Industry in Ontario, 2008-2010 46 of 59
C1. What is the source of your company’s original and ongoing capitalization? (Percentages must sum to 100%) | University/Incubator Funds
C1. What is the source of your company’s original and ongoing capitalization? (Percentages must sum to 100%) | Equipment Financing
C1. What is the source of your company’s original and ongoing capitalization? (Percentages must sum to 100%) | Other
B) Ongoing sources of capital (as of the FYE 2010).
Variable Response
| Retained Earnings/Profit
| Bank Credit
| Business Development Bank Loan
| Self-funding
| New Equity Injections (public and private)
| Other
C2. Please indicate the percentage of the projects produced by your company in the FYE 2010 that accessed the following tax credits?
Variable Response
C2. Please indicate the percentage of the projects produced by your company in the FYE 2010 that accessed the following tax credits? | Ontario Computer Animation & Special Effects Tax Credit (OCASE)
C2. Please indicate the percentage of the projects produced by your company in the FYE 2010 that accessed the following tax credits? | Scientific Research & Experimental Development (SR&ED)
C2. Please indicate the percentage of the projects produced by your company in the FYE 2010 that accessed the following tax credits? | Ontario Production Services Tax Credit (OPSTC)
C2. Please indicate the percentage of the projects produced by your company in the

Economic Profile of the Computer Animation and Visual Effects Industry in Ontario, 2008-2010 47 of 59
FYE 2010 that accessed the following tax credits? | Ontario Film and Television Tax Credit (OFTTC) C2. Please indicate the percentage of the projects produced by your company in the FYE 2010 that accessed the following tax credits? | Canadian Film or Video Production Services Tax Credit
C2. Please indicate the percentage of the projects produced by your company in the FYE 2010 that accessed the following tax credits? | Canadian Film or Video Production Tax Credit
C2. Please indicate the percentage of the projects produced by your company in the FYE 2010 that accessed the following tax credits? | Ontario Interactive Digital Media Tax Credit (OIDMTC)
C3. In FYE 2010, did your company produce any projects that did not access an Ontario tax credit (i.e. OCASE, OPSTC, OIDMTC or OFTTC)
C3b. For those projects that did not access an Ontario tax credit (and were produced in the fiscal year ending in 2010), why did your company opt not to use the tax credit?
D. Employment and Training
D1. How many employees did your company employ (on average) over the past three fiscal years?
Artistic = Designers, layout artists, modelers, riggers, animators, etc. Technical = Systems operators, programmers, network and communication specialists, etc Administrative = CTO, CFO, production management, sales, marketing, PR, finance, etc

Economic Profile of the Computer Animation and Visual Effects Industry in Ontario, 2008-2010 48 of 59
Contract/Temporary labour = Individuals hired on a short-term basis, either full or part-time. Freelancers = Self-employed workers including personal corporations
2010 2009 2008
Artistic: Full-time staff
Artistic: Part-time staff
Artistic: Contract/Temporary/Freelance
Technical: Full-time staff
Technical: Part-time staff
Technical: Contract/Temporary/Freelance
Administrative: Full-time staff
Administrative: Part-time staff
Administrative:
Contract/Temporary/Freelance
D2. How would you rate the current availability of well-trained, experienced new hires for your company in the following categories?
Artistic = designers, layout artists, modelers, riggers, animators, etc. Technical = systems operators, programmers, network and communication specialists, etc Administrative = production management, sales, marketing, PR, finance, etc. Senior = five or more years of directly relevant experience Intermediate = 2 to 4 years of directly relevant experience Junior = fewer than 2 years of directly relevant experience
Variable Response
D2. How would you rate the current availability of well-trained, experienced new hires for your company in the following categories? | Artistic: Senior

Economic Profile of the Computer Animation and Visual Effects Industry in Ontario, 2008-2010 49 of 59
D2. How would you rate the current availability of well-trained, experienced new hires for your company in the following categories? | Artistic: Intermediate
D2. How would you rate the current availability of well-trained, experienced new hires for your company in the following categories? | Artistic: Junior
D2. How would you rate the current availability of well-trained, experienced new hires for your company in the following categories? | Technical: Senior
D2. How would you rate the current availability of well-trained, experienced new hires for your company in the following categories? | Technical: Intermediate
D2. How would you rate the current availability of well-trained, experienced new hires for your company in the following categories? | Technical: Junior
D2. How would you rate the current availability of well-trained, experienced new hires for your company in the following categories? | Administrative: Senior
D2. How would you rate the current availability of well-trained, experienced new hires for your company in the following categories? | Administrative: Intermediate
D2. How would you rate the current availability of well-trained, experienced new hires for your company in the following categories? | Administrative: Junior
D2. How would you rate the current availability of well-trained, experienced new hires for your company in the following categories? | Other (please specify):

Economic Profile of the Computer Animation and Visual Effects Industry in Ontario, 2008-2010 50 of 59
D3a. How satisfied is your company with new graduates’ ability to meet your human resource needs?
E. Market Growth Prospects
E1. In which of the following areas do you anticipate growth or decline for your business over the next 1-3 years?
Variable Response
E1. In which of the following areas do you anticipate growth or decline for your business over the next 1-3 years? | Live action feature film
E1. In which of the following areas do you anticipate growth or decline for your business over the next 1-3 years? | Animated feature film
E1. In which of the following areas do you anticipate growth or decline for your business over the next 1-3 years? | Live action TV
E1. In which of the following areas do you anticipate growth or decline for your business over the next 1-3 years? | Animated TV
E1. In which of the following areas do you anticipate growth or decline for your business over the next 1-3 years? | Video/Computer Games
E1. In which of the following areas do you anticipate growth or decline for your business over the next 1-3 years? | Mobile Application Development
E1. In which of the following areas do you anticipate growth or decline for your business over the next 1-3 years? | Other digital media (e.g. content, web content, scientific animation, etc.)
E1. In which of the following areas do you anticipate growth or decline for your business over the next 1-3 years? | Other

Economic Profile of the Computer Animation and Visual Effects Industry in Ontario, 2008-2010 51 of 59
content (please specify)
E2. What are the factors that are limiting growth for your company?
Variable Response
E2. What are the factors that are limiting growth for your company? | Better tax credits on other jurisdictions
E2. What are the factors that are limiting growth for your company? | Decline in demand for service work
E2. What are the factors that are limiting growth for your company? | Shortage of skilled labour
E2. What are the factors that are limiting growth for your company? | Shortage of effective training programs
E2. What are the factors that are limiting growth for your company? | Strong international competition
E2. What are the factors that are limiting growth for your company? | Lack of affordable capital for expansion or day-to-day operations
E2. What are the factors that are limiting growth for your company? | Inability to access foreign markets
E2. What are the factors that are limiting growth for your company? | Insufficient management & marketing/sales expertise
E2. What are the factors that are limiting growth for your company? | Local studios’ inability to collaborate in an effort to leverage economies of scale
E2. What are the factors that are limiting growth for your company? | Increase in client/producer demands
E2. What are the factors that are limiting growth for your company? | High cost of operating in Ontario
E2. What are the factors that are limiting growth for your company? | Threat of industry disruptions (e.g. strikes)
E2. What are the factors that are limiting growth for your company? | Increasing strength of Canadian dollar
E2. What are the factors that are limiting growth for your

Economic Profile of the Computer Animation and Visual Effects Industry in Ontario, 2008-2010 52 of 59
company? | Other (please specify)
Thank you for your cooperation.
Please click on the Submit button to complete the questionnaire. Your input is critically important to CASO's understanding of the computer animation and visual effects industry in Ontario - and thus effectively advocate on your behalf. That said, we remind you that all information submitted will be held in strict confidence by Nordicity and will only be presented in aggregate to CASO, its Board, or any other party. At no time will company-specific information be made available. To submit your survey, please ensure that you press the "Submit" button (the farthest button to the right). Thank you again for your participation.

Economic Profile of the Computer Animation and Visual Effects Industry in Ontario, 2008-2010 53 of 59
A.2 Customer Satisfaction Survey
Introduction
Thank you for agreeing to collaborate in this survey of client satisfaction of the computer animation and visual effects industry in Ontario. The Computer Animation Studios of Ontario (CASO) has engaged Nordicity to prepare this online survey to collect information on the strengths and weaknesses in delivering, meeting and/or exceeding customer expectations. Your input is vital to the on-going development of the computer animation and visual effect industry in Ontario. Please note that all of your responses to the survey will be kept strictly confidential. The information collected will be used in aggregate. Only Nordicity will see individual company information. The CASO board, its members and/or our funding sponsors will have no access to any individual company results, but will only see the information when presented in aggregate. There are 2 sections to the questionnaire, a total of 9 questions:
Buyer Profile – 3 questions
Experience with Ontario Studios- 6 questions
Please take the time to complete the questionnaire, which is easy to fill out and should take 15 minutes (or less) to complete. This may best be done by person(s) in senior management most familiar with key decision making and other strategic issues around service procurement. Your participation in this survey is of the utmost importance and is greatly appreciated.

Economic Profile of the Computer Animation and Visual Effects Industry in Ontario, 2008-2010 54 of 59
If you have any questions about this survey, you may contact: Julie Whelan, Nordicity, 647 878 0989, [email protected]. Many thanks.
A. Buyer Profile
A1. Please provide the following information.
As a reminder, information particular to your company will not be shared with CASO, its Board or any other party. Only aggregate information will be presented.
Variable Response
A1. Please provide the following information. | Company
(No response)
A1. Please provide the following information. | Contact Name
(No response)
A1. Please provide the following information. | Title (No response)
A1. Please provide the following information. | Email Address
(No response)

Economic Profile of the Computer Animation and Visual Effects Industry in Ontario, 2008-2010 55 of 59
A2. In what region and location is your company based (i.e. is headquartered)?
A3. What is the principal line of business in which your company does business (i.e. where your company generates a majority of its revenue)?
B. Experience with Ontario Studios
B1. Over the past 12 months, on how many projects did you work with an Ontario-based computer animation and/or visual effect studio?
B2. Of the projects on which you worked with an Ontario-based studio, what percentage of these projects were in the following market segments?
Please note that percentages must total to 100%.
Variable Response
B2. Of the projects on which you worked with an Ontario-based studio, what percentage of these projects were in the following market segments? | Live Action Feature Film
B2. Of the projects on which you worked with an Ontario-based studio, what percentage of these projects were in the following market segments? | Animated Feature Film
B2. Of the projects on which you worked with an Ontario-based studio, what percentage of these projects were in the following market segments? | Live Action TV
B2. Of the projects on which you worked with an Ontario-based studio, what percentage of these projects were in the

Economic Profile of the Computer Animation and Visual Effects Industry in Ontario, 2008-2010 56 of 59
following market segments? | Animated TV
B2. Of the projects on which you worked with an Ontario-based studio, what percentage of these projects were in the following market segments? | Game Content
B2. Of the projects on which you worked with an Ontario-based studio, what percentage of these projects were in the following market segments? | Other Digital Media
B2. Of the projects on which you worked with an Ontario-based studio, what percentage of these projects were in the following market segments? | Advertising (incl.commercials)
B2. Of the projects on which you worked with an Ontario-based studio, what percentage of these projects were in the following market segments? | Other
B3. Overall, what is your company’s overall level of satisfaction with the Ontario-based studio(s) with which you have worked (over the past 12 months): (select one)
B4. Based on the following criteria, please rate your experience working with Ontario-based studios.
Variable Response
B4. Based on the following criteria, please rate your experience working with Ontario-based studios. | Cost of labour
B4. Based on the following criteria, please rate your experience working with Ontario-based studios. | Quality of creative work
B4. Based on the following criteria, please rate your experience working with Ontario-based studios. | Quality of technical work
B4. Based on the following criteria, please rate your experience working with Ontario-based studios. |

Economic Profile of the Computer Animation and Visual Effects Industry in Ontario, 2008-2010 57 of 59
Timeliness of deliverables
B4. Based on the following criteria, please rate your experience working with Ontario-based studios. | Professionalism and attitude
B4. Based on the following criteria, please rate your experience working with Ontario-based studios. | Business skills and knowledge

Economic Profile of the Computer Animation and Visual Effects Industry in Ontario, 2008-2010 58 of 59
B5. Over the past 12 months, did your company select a studio outside of Ontario to work on a project for which one or more Ontario-based studios were considered?
B5b. Why did your company opt not to work with an Ontario-based studio?
B5c. In which jurisdiction did the animation and/or visual effects work in question take place?
B6. Are there any issues (positive or negative) that you would like to bring to the attention of Ontario-based computer animation and/or visual effects studios?
In some instances we may want to follow-up with you to briefly discuss some of the issues raised in this survey.
Do we have permission to get in touch if this need arises?
Thank you for your cooperation.
Please click on the Submit button to complete the questionnaire. Your input is critically important to CASO's understanding of the computer animation and visual effects industry in Ontario. We remind you, however, that all information submitted will be held in strict confidence by Nordicity and will only be presented in aggregate to CASO, its Board, or any other party. At no time will company-specific information be made available.

Economic Profile of the Computer Animation and Visual Effects Industry in Ontario, 2008-2010 59 of 59
For more information on the study or CASO please visit www.casont.com