economic prospects and policy challenges for the gcc ... cooperation council annual meeting of...
TRANSCRIPT

* The views expressed herein are those of the authors and should not be reported as or attributed to the International Monetary Fund, its Executive Board, or the governments of any of its member countries.
Gulf Cooperation Council
Annual Meeting of Ministers of Finance and Central Bank Governors
October 5, 2013
Riyadh, Saudi Arabia
Economic Prospects and Policy Challenges for the GCC Countries
Prepared by Staff of the International Monetary Fund
I N T E R N A T I O N A L M O N E T A R Y F U N D

2
Contents Page
Executive Summary ...................................................................................................................3
I. The Global Context ................................................................................................................4
II. Developments in the Middle East and North Africa (MENA) Region .................................9
III. Developments and Outlook in the GCC Countries ............................................................10
IV. Risks and Spillovers in an Uncertain Global Environment ...............................................15 A. Key Global Risks .......................................................................................................15 B. Implications for the GCC ...........................................................................................17
V. Policy Responses and Challenges .......................................................................................19 A. Macroeconomic Policy Settings .................................................................................19 B. Longer-Term Policy Challenges ................................................................................20
Tables 1. GCC Financial Soundness Indicators ..................................................................................15 2. GCC Countries Publication of IMF Reports ........................................................................25 3. GCC Countries Selected Economic Indicators, 2007–13 ....................................................26 Figures 1. Recent Developments in Advanced Economies ....................................................................4 2. GDP Growth Rates in Emerging Markets, 2010H1–2013H2 ................................................5 3. Recent Financial Market Developments, 2011–latest ...........................................................5 4. Oil Market Indicators .............................................................................................................6 5. GCC Recent Economic Developments ................................................................................11 6. GCC Fiscal Indicators ..........................................................................................................12 7. GCC Credit Growth and Inflation........................................................................................14 8. Bond Flows, 2005–latest ......................................................................................................14 9. Oil Price Risk Scenarios ......................................................................................................16 10. GCC Links with Foreign Banks .........................................................................................18 11. GCC Governance and Education .......................................................................................21 References ................................................................................................................................27

3
EXECUTIVE SUMMARY
The global and regional economic environment remains challenging. Global growth remains tepid, and although some pick-up is expected, risks are tilted to the downside. Recent volatility in financial markets is having a significant impact on some large emerging markets, highlighting the challenges that will be faced in unwinding the Federal Reserve’s quantitative easing policy. Geopolitical uncertainties in the Middle East are also high.
Global oil markets are being affected by competing factors. The increase in non-conventional oil production in the United States and weak global oil demand are putting downward pressure on prices, while supply disruptions in some countries and uncertainties arising from the unrest in the Middle East are applying upward pressure. Prices are close to where they started the year, while futures markets are pricing in a gradual decline going forward. GCC producers, particularly Saudi Arabia, are playing a key role in helping ensure the global oil market remains well supplied in the face of supply disruptions elsewhere.
The growth outlook for the GCC is positive, but will be affected by global and regional developments. While growth has slowed from the exceptionally strong rates in 2010–11, it remains robust, and with confidence high and large infrastructure projects coming on stream, it should remain well-supported going forward. The path of oil prices remains the main uncertainty for the region, although countries would also be affected by increased volatility in global financial markets or broader unrest in the Middle East region.
Macroeconomic policies have scope to respond to economic developments as they unfold. Given the substantial buffers that have been built up, fiscal policy is well positioned to manage demand as needed, while monetary and macro-prudential policies can also be proactively used. Over the medium term, fiscal consolidation will be needed to strengthen buffers and increase savings for future generations.
A key challenge for the region is to generate jobs in the private sector for the rapidly growing young population. Policies are already being implemented to achieve this objective, but more is needed to limit incentives for public-sector employment, raise educational quality, and make nationals more competitive in the private labor market. Other reform priorities include: strengthening fiscal frameworks to underpin more efficient spending and medium-term fiscal consolidation; reducing the growth of domestic energy consumption; developing domestic capital markets to support corporate and infrastructure financing; further developing macro-prudential tools to continue to manage financial sector risks; and improving the availability and timeliness of economic statistics.
___________________ Prepared by Zsofia Arvai, Tim Callen, Fuad Hasanov, Renas Sidahmed, and Martin Sommer.

4
I. THE GLOBAL CONTEXT
Global activity has disappointed again this year, mostly owing to a sharp fiscal withdrawal in the United States, a delayed recovery in the euro area, and a loss of momentum in emerging markets. In recent months, the prospect of the United States Federal Reserve beginning to taper its bond purchases has also had a significant impact on global financial markets and emerging market economies with external financing requirements, while geopolitical tensions in the Middle East have risen. The outlook remains for a modest pick-up in global growth over the next year, but risks remain slanted to the downside.
1. Global growth has remained weak, although the dynamics appear to be slowly changing. The advanced countries are slowly recovering, while the emerging market and developing countries are coming off their cyclical peaks. All in all, global growth in 2013 is expected to be around 3 percent, before accelerating in 2014. This acceleration is expected to be largely driven by stronger growth in the United States and the euro area as the pace of fiscal consolidation slows, with a more modest pick-up expected in emerging market economies. 2. In the advanced countries, there are recent signs that economic activity is gaining some traction (Figure 1). In the United States, while the rapid reduction of the fiscal deficit has dampened growth, underlying activity has been resilient thanks to higher house and equity prices and easy financial conditions (recent tightening notwithstanding). As the pace of fiscal consolidation eases, growth is expected to strengthen next year. Growth has been surprisingly vigorous in Japan as the new policy actions boosted equity values and consumer confidence, and the depreciated yen helped export growth, although the economy is expected to lose steam in 2014 as fiscal policy tightens. In the euro area, the recession in the periphery has been deeper than expected, but growth is expected to pick up modestly as fiscal consolidation slows and the external environment improves.
Figure 1. Recent Developments in Advanced Economies
Sources: Country authorities; and IMF staff calculations. 1 Measured as a change in the cyclically-adjusted primary fiscal balance.
-10
-5
0
5
10
15
-5
0
5
10
2010Q1 2010Q3 2011Q1 2011Q3 2012Q1 2012Q3 2013Q1
United States
Euro Area
Japan (RHS)
Advanced Economies: GDP Growth Rates, 2010Q1–2013Q2(Q-o-q percent change)
-1.0
-0.5
0.0
0.5
1.0
1.5
2.0
2.5
3.0
-1.0
-0.5
0.0
0.5
1.0
1.5
2.0
2.5
3.0
2011 2012 2013 2014
United States Euro Area Japan
Fiscal Withdrawal in Major Advanced Economies, 2011–141
(Percent of GDP )

5
3. Growth has disappointed in many emerging market economies, reflecting sluggish exports and cooling domestic demand following previous rapid growth. Emerging and developing country growth rates are some 2½ percentage points down from 2010 levels, with Brazil, China, and India accounting for about two-thirds of this decline. Diminished confidence about medium-term growth prospects, infrastructure bottlenecks (e.g., in India), and previous overinvestment (China) are weighing on activity (Figure 2). 4. More broadly, after a period of calm, financial market volatility has increased globally since May. In most advanced economies, long-term interest rates increased as investors re-assessed the timing of exit from monetary policy stimulus in the United States (Figure 3). Emerging markets have generally been hit hardest, as the increases in long-term rates and asset price volatility combined with weaker domestic activity led to capital outflows, equity price declines, rising local yields, and currency depreciation. Countries that need to finance current account deficits, including Brazil, India, Indonesia, South Africa, and Turkey, have been particularly hard hit, with currencies coming under significant downward pressure. Policymakers have responded with a combination of foreign exchange intervention, monetary tightening, and other measures to discourage capital outflows and imports. Sovereign spreads in the euro area periphery have remained elevated, in part reflecting policy uncertainty. 5. Risks to global growth remain tilted to the downside. The recent bout of financial market volatility, which could prove more persistent than currently envisaged, illustrates the important challenges related to the exit from highly accommodative monetary policies in advanced countries. The risks of a longer-term stagnation in the euro area and a more
0
3
6
9
12
15
0
3
6
9
12
15
2010H1 2010H2 2011H1 2011H2 2012H1 2012H2 2013H1 2013H2
China India Developing Asia Latin America
Figure 2. GDP Growth Rates in Emerging Markets , 2010H1–2013H2(Half-over-half annualized percent change)
Sources: Country authorities; and IMF staff calculations.
Figure 3. Recent Financial Market Developments, 2011–latest
Sources: Country authorities; Bloomberg; Financial Times; Datastream; Capital Data; Haver; and IMF staff calculations.1Interest rates are ten-year government bond yields unless otherwise noted.
0
1
2
3
4
5
6
7
8
9
10
0
1
2
3
4
5
6
7
8
9
10
Jan-11 Jun-11 Nov-11 Apr-12 Sep-12 Feb-13 Jul-13
Germany Italy
Spain United States
EM Sovereign Bond Index
Government Bond Yields1
(Percent)
80
90
100
110
120
130
140
80
90
100
110
120
130
140
1/1/11 5/1/11 9/1/11 1/1/12 5/1/12 9/1/12 1/1/13 5/1/13
Brazil China India
Russia Turkey
National Currency per US$(Index, January 2010=100; period average)

6
persistent slowdown in emerging markets have increased, while failure to raise the U.S. debt ceiling would lead to global financial disruptions. Geopolitical risks have also risen in recent months, given ongoing developments in the Middle East.
6. Inflation is expected to remain subdued, given the still-large economic slack in advanced economies and projected decline in commodity prices. In advanced economies, inflation is generally running below targets. In emerging and developing economies, inflation is expected to fall slightly next year, as downward price pressures from lower growth and commodity prices are only partly offset by capacity constraints and pass-through from the recent exchange rate depreciations. 7. Crude oil prices have moved higher in recent months. The oil market has tightened as output in Libya and Iraq has declined and OECD inventories have fallen below usual levels, while geopolitical uncertainties have increased. The Brent benchmark, however, has remained in the established $100–120 a barrel range, with Saudi Arabia playing a key role in ensuring the global oil market remains well supplied in the face of the supply disruptions elsewhere. Futures markets point to a gradual decline in oil prices to about $90 a barrel for Brent over the next three years (Figure 4), but the oil price outlook is highly uncertain—the 95 percent confidence band for oil prices is between $70–145 a barrel one year ahead, and price spikes cannot be ruled out if the geopolitical risks escalate. Rapid development of the United States unconventional energy resources presents new challenges for the Middle Eastern oil producers (see Special Feature).
8. Natural gas prices continue to vary substantially by geographical market. After rebounding last year, the United States gas prices (lowest among major economies) have been moving sideways amid continued production growth, stronger demand for power generation, and temporary weather-related factors. Liquefied natural gas (LNG) prices in Japan fell off their peak with demand moderating after the post-Fukushima surge, but remain among the highest in the world. European natural gas prices fell somewhat on weaker demand and increasing penetration of spot-priced gas supplies, but also remain elevated.
Figure 4. Oil Market Indicators
Sources: Bloomberg; and IMF staff calculations.1Data as of September 17, 2013.2Derived from prices of Brent oil futures options on September 12, 2013.
0
20
40
60
80
100
120
140
160
0
20
40
60
80
100
120
140
160
Jan-05 Mar-06 May-07 Jul-08 Sep-09 Nov-10 Jan-12 Mar-13
WTI
Brent
OPEC Basket
Oil Prices, January 2005–September 20131
(US$/barrel)
30
50
70
90
110
130
150
170
30
50
70
90
110
130
150
170
Jan-12 Sep-12 May-13 Jan-14 Sep-14 May-15 Jan-16
Options-based Oil Price Prospects2
(US$/barrel)
7
Special Feature: Unconventional Oil and Gas in North America: What are the Implications?
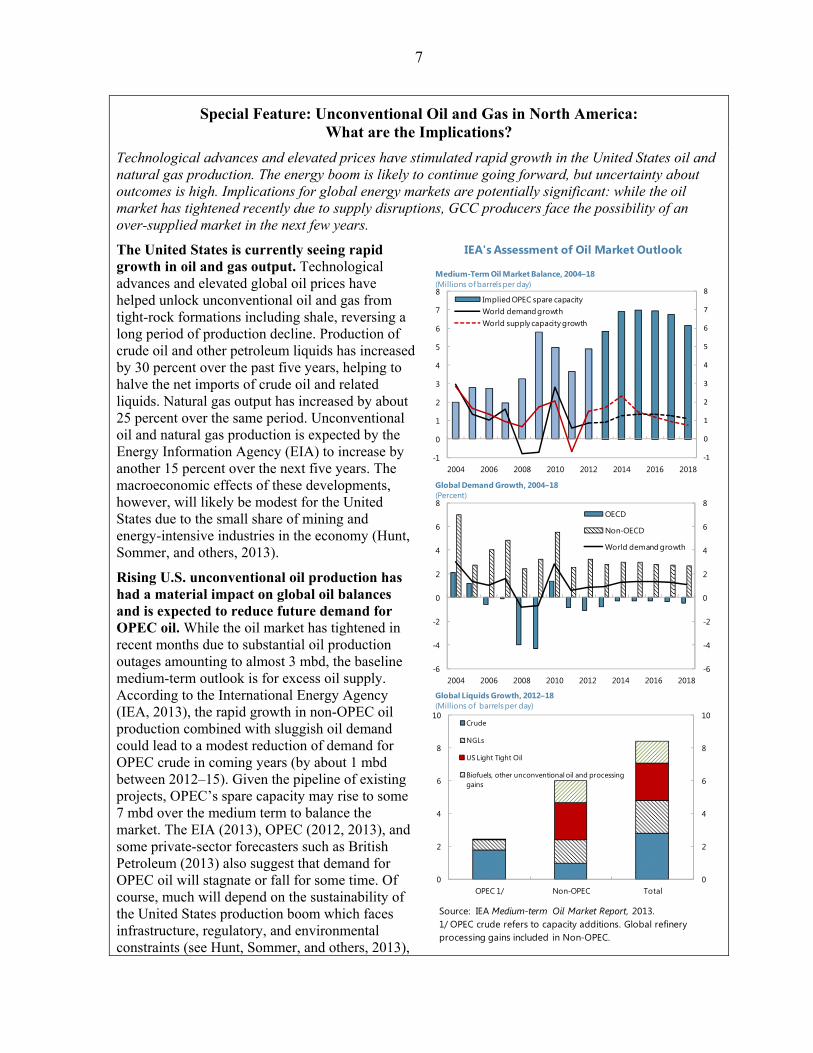
Technological advances and elevated prices have stimulated rapid growth in the United States oil and natural gas production. The energy boom is likely to continue going forward, but uncertainty about outcomes is high. Implications for global energy markets are potentially significant: while the oil market has tightened recently due to supply disruptions, GCC producers face the possibility of an over-supplied market in the next few years.
The United States is currently seeing rapid growth in oil and gas output. Technological advances and elevated global oil prices have helped unlock unconventional oil and gas from tight-rock formations including shale, reversing a long period of production decline. Production of crude oil and other petroleum liquids has increased by 30 percent over the past five years, helping to halve the net imports of crude oil and related liquids. Natural gas output has increased by about 25 percent over the same period. Unconventional oil and natural gas production is expected by the Energy Information Agency (EIA) to increase by another 15 percent over the next five years. The macroeconomic effects of these developments, however, will likely be modest for the United States due to the small share of mining and energy-intensive industries in the economy (Hunt, Sommer, and others, 2013).
Rising U.S. unconventional oil production has had a material impact on global oil balances and is expected to reduce future demand for OPEC oil. While the oil market has tightened in recent months due to substantial oil production outages amounting to almost 3 mbd, the baseline medium-term outlook is for excess oil supply. According to the International Energy Agency (IEA, 2013), the rapid growth in non-OPEC oil production combined with sluggish oil demand could lead to a modest reduction of demand for OPEC crude in coming years (by about 1 mbd between 2012–15). Given the pipeline of existing projects, OPEC’s spare capacity may rise to some 7 mbd over the medium term to balance the market. The EIA (2013), OPEC (2012, 2013), and some private-sector forecasters such as British Petroleum (2013) also suggest that demand for OPEC oil will stagnate or fall for some time. Of course, much will depend on the sustainability of the United States production boom which faces infrastructure, regulatory, and environmental constraints (see Hunt, Sommer, and others, 2013),
IEA's Assessment of Oil Market Outlook
Source: IEA Medium-term Oil Market Report, 2013.1/ OPEC crude refers to capacity additions. Global refinery processing gains included in Non-OPEC.
‐1
0
1
2
3
4
5
6
7
8
-1
0
1
2
3
4
5
6
7
8
2004 2006 2008 2010 2012 2014 2016 2018
Implied OPEC spare capacityWorld demand growthWorld supply capacity growth
Medium-Term Oil Market Balance, 2004–18(Millions of barrels per day)
-6
-4
-2
0
2
4
6
8
-6
-4
-2
0
2
4
6
8
2004 2006 2008 2010 2012 2014 2016 2018
OECD
Non-OECD
World demand growth
Global Demand Growth, 2004–18(Percent)
0
2
4
6
8
10
0
2
4
6
8
10
OPEC 1/ Non-OPEC Total
Crude
NGLs
US Light Tight Oil
Biofuels, other unconventional oil and processing gains
Global Liquids Growth, 2012–18 (Millions of barrels per day)

8
the speed of global economic recovery, and the magnitude of supply disruptions. In sharp contrast, the near-term implications of the United States shale boom for the Middle East gas producers appear limited because of the geographic segmentation of the natural gas market (IMF, 2012).
These oil market conditions are expected to put downward pressure on prices over the medium term. The price downside, however, would be limited by the high breakeven cost of the unconventional oil producers—in the ballpark of $60–70 a barrel for the United States shale oil fields (IEA, 2010 and 2013), but more for some other non-OPEC producers—and by higher reservation prices of OPEC producers, whose fiscal breakeven prices have risen in recent years. Barring major shocks, higher OPEC spare capacity should protect the oil market from supply disruptions, and thus reduce the potential for a sudden increase in oil prices. That said, supply disruptions in several oil-exporting countries could mean that expectations of market oversupply are not met, and this would put upward pressures on prices. This potential concern is reflected in the upward tilt of the oil price fan chart (paragraph 7, main text).
The ripple effects of the United States unconventional boom have been distributed unevenly, with producers of light sweet crudes subject to the strongest competitive pressures. Because the U.S. legally prohibits crude oil exports, the global oil market adjustment has largely occurred through lower U.S. crude imports and higher product exports. Indeed, the U.S. has become a net oil products exporter. The U.S. tight oil is of a light and sweet variety and its production growth has especially hurt countries exporting light grades, such as Algeria and Nigeria; their exports to the United States have fallen by some 60–80 percent over the past five years. The producers of heavier sour grades have done much better given the technical specifications of U.S. refineries; for example, Saudi Arabia’s exports to the U.S. have remained broadly stable since 2010 (Saudi Aramco also owns stakes in several United States refineries). The unconventional oil boom is also causing an unanticipated shift in the mix of crude oil grades—exacerbating pressures on the global refining industry—although the Middle Eastern refiners are better positioned to manage this trend than some of their peers.
Most forecasters expect the demand for OPEC oil to pick up again in the long-run, but the shale gas boom could help slow oil demand growth. Both EIA and IEA expect the U.S. tight oil production to plateau early next decade, at which point demand growth for OPEC oil would accelerate. In contrast to the United States, the other countries pursuing unconventional energy (e.g., China, Mexico, Argentina, and to a small extent, Europe) may focus on natural gas rather than oil due to different geology, water availability, and infrastructure. The bulk of natural gas output will probably remain consumed in geographically-segmented markets. That said, the process of developing shale gas could help accelerate fuel switching away from oil, eventually boosting the use of gas in the transport industry, which is the largest consumer of oil.
In sum, GCC producers face the risk of an oversupplied oil market over the next several years. Available data suggest that oil investments and capacity expansion are set to slow substantially. But the falling call on OPEC could still create the need for production cuts and could cause, in their absence, price declines which would hurt all oil exporters. This baseline scenario is subject to considerable uncertainty—continued supply disruptions elsewhere in the Middle East and North Africa could yet increase demand for GCC oil, even if the unconventional energy boom reduces the overall “call on OPEC.”
In contrast, the challenges posed by growing production of U.S. unconventional natural gas for Middle East gas exporters are largely not immediate. The barriers inhibiting regional gas price convergence will limit the direct spillovers from the U.S. shale gas boom over the next several years, although producers exporting gas indexed to spot oil prices could face challenges. Competition from other LNG exporters such as Australia is likely to grow over the longer-term (IMF, 2012 and 2013).
9
II. DEVELOPMENTS IN THE MIDDLE EAST AND NORTH AFRICA (MENA) REGION
Growth in the Middle East and North Africa (MENA) region has continued to slow in 2013, reflecting a marked slowdown in the region’s oil-exporting countries and a lackluster recovery in the oil importers. Uncertainties arising from prolonged political transitions, growing unrest, and a weak external environment are weighing on confidence in a number of countries. Growth is projected to pick up modestly in 2014 if domestic stability and global conditions improve, although uncertainties and risks remain high.
9. In the MENA region, growth is expected to slow quite sharply in 2013, before seeing a modest pick-up in 2014. This slowdown is mainly being driven by slower output growth in oil exporting countries, which is more than offsetting a tepid recovery in oil importing countries. Real GDP growth is projected at around 2½ percent in 2013, some 2 percentage points lower than in 2012, and 3¾ percent in 2014.
10. Growth in the MENA oil exporters decelerated substantially in the first half of 2013, driven by falling oil production. In a number of non-GCC countries, such as Iran, Iraq, and Libya, geopolitical tensions, economic sanctions, and deteriorating security interrupted oil supply. All in all, the region’s hydrocarbon output is expected to fall in 2013. However, the non-oil economy, which is important for further economic diversification, is holding up well in most countries, supported by high levels of government spending. Growth is expected to strengthen in 2014 as oil production recovers.
11. Economic conditions continue to be difficult in MENA’s oil-importing countries. There have been some nascent signs of improvement in tourism, exports, and FDI since the troughs experienced in 2011, in part owing to increased demand from the GCC countries. However, for many, these positive developments are overshadowed by weak confidence and slow domestic activity resulting from prolonged political and policy uncertainty, social unrest, and security problems. Regional spillovers from the protracted conflict in Syria, and potential spillovers from the ongoing complex political transition in Egypt, further complicate economic management. Moreover, for many countries, external and fiscal buffers are running low. Growth in 2013 and 2014 is expected to be broadly unchanged from 2012. Policy challenges center on achieving macroeconomic stabilization and reducing fiscal and external vulnerabilities, while reshaping economic structures and institutions to boost confidence and long-term growth and job creation. Where needed, external official financing can help smooth adjustment in the course of macroeconomic stabilization and structural transformation.
12. For the region, risks remain tilted to the downside, although the extent and nature of these risks varies considerably among countries.
For oil exporters, extended disruptions in domestic production or a fall in oil prices, either due to a slowdown in global growth or a faster-than-expected increase in non-OPEC

10
supply, would leave many with fiscal deficits. Many countries have not been accumulating wealth fast enough to provide sufficient reserves for future generations, or buffers to guard against declines in oil revenues. On the upside, higher oil prices due to a stronger-than-expected global recovery or supply disruptions elsewhere would be positive for the outlook.
For oil importing countries, risks stem mainly from domestic and regional factors. Setbacks in political transitions and continued social and security tensions could delay reforms and a return of confidence. Weaker growth in the euro area would present risks for tourism, exports, investment, and remittances. Limited external financial exposures reduce the risk of a sudden stop in capital inflows for most countries. On the upside, faster progress in political transitions and reform implementation across the region, and a resolution of regional conflicts, could boost investor confidence and growth.
III. DEVELOPMENTS AND OUTLOOK IN THE GCC COUNTRIES
The economic outlook in the GCC remains favorable, although growth is likely to be slower over the next few years than it has been in the recent past. A weaker pace of non-oil growth is expected as government spending growth eases, while oil output may also grow more slowly. There are both upside and downside risks to the outlook.
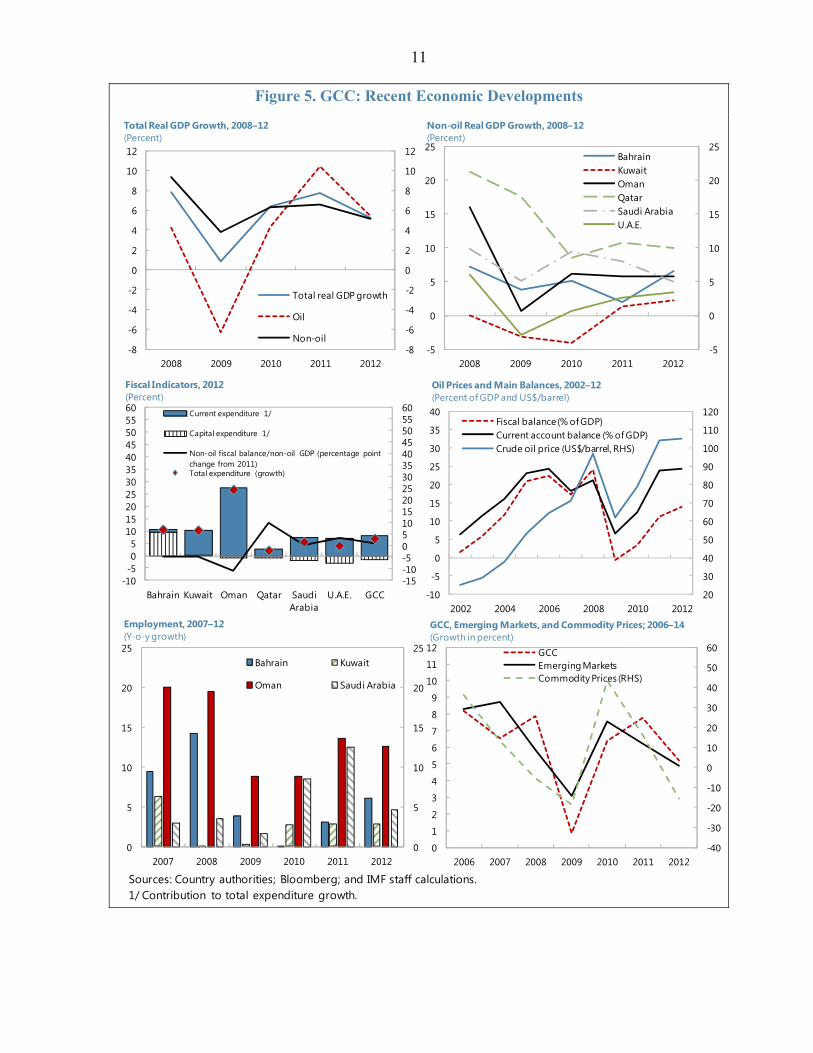
13. The GCC economies are continuing to grow robustly, albeit at a slower pace than in recent years (Figure 5). Real GDP grew by 5.2 percent in 2012, down from 7.7 percent in 2011. Growth in the oil sector eased as the global oil market became increasing well supplied in the second half of 2012, while the expansion in the non-oil sector slowed due to developments in Saudi Arabia where government spending growth moderated after the large increase in 2011. In the region, growth converged in 2012 as countries that had grown relatively slowly in 2011 (Bahrain and the United Arab Emirates) saw stronger growth, and those that enjoyed very strong growth in 2011 (Saudi Arabia, Qatar) slowed. Strong growth in the non-oil economy has resulted in a large increase in employment, although this has been concentrated among expatriates in a number of countries.
14. Regional growth is set to slow further this year, before strengthening in 2014. Real GDP is projected to expand by 3.7 percent, with growth expected to be weaker in 2013 than in 2012 in five of the six countries. Noticeable slowdowns are projected in Kuwait and Saudi Arabia. These two countries scaled back oil production earlier this year, and while it has increased again in recent months, it is likely to be broadly flat for the year as a whole. Quarterly GDP data for Saudi Arabia confirm that growth slowed in the first half of 2013, largely due to the oil sector. Nevertheless, growth in the non-oil sector remains robust across the region as large infrastructure projects continue to be implemented and private sector confidence remains high. The Purchasing Managers Index for Saudi Arabia and the United Arab Emirates show that output and confidence in the non-oil private sector are strong. In 2014, oil production is projected to increase, and with steady non-oil growth, overall GDP growth is projected at just over 4 percent.
11
Figure 5. GCC: Recent Economic Developments
Sources: Country authorities; Bloomberg; and IMF staff calculations.1/ Contribution to total expenditure growth.
-5
0
5
10
15
20
25
-5
0
5
10
15
20
25
2008 2009 2010 2011 2012
Non-oil Real GDP Growth, 2008–12(Percent)
BahrainKuwaitOmanQatarSaudi ArabiaU.A.E.
20
30
40
50
60
70
80
90
100
110
120
-10
-5
0
5
10
15
20
25
30
35
40
2002 2004 2006 2008 2010 2012
Fiscal balance (% of GDP)Current account balance (% of GDP)Crude oil price (US$/barrel, RHS)
Oil Prices and Main Balances, 2002–12(Percent of GDP and US$/barrel)
-8
-6
-4
-2
0
2
4
6
8
10
12
-8
-6
-4
-2
0
2
4
6
8
10
12
2008 2009 2010 2011 2012
Total Real GDP Growth, 2008–12(Percent)
Total real GDP growth
Oil
Non-oil
-15-10-5051015202530354045505560
-10-505
1015202530354045505560
Bahrain Kuwait Oman Qatar Saudi Arabia
U.A.E. GCC
Current expenditure 1/
Capital expenditure 1/
Non-oil fiscal balance/non-oil GDP (percentage point change from 2011)Total expenditure (growth)
Fiscal Indicators, 2012(Percent)
-40
-30
-20
-10
0
10
20
30
40
50
60
0
1
2
3
4
5
6
7
8
9
10
11
12
2006 2007 2008 2009 2010 2011 2012
GCCEmerging MarketsCommodity Prices (RHS)
GCC, Emerging Markets, and Commodity Prices; 2006–14(Growth in percent)
0
5
10
15
20
25
0
5
10
15
20
25
2007 2008 2009 2010 2011 2012
Employment, 2007–12(Y-o-y growth)
Bahrain Kuwait
Oman Saudi Arabia

12
15. The fiscal consolidation that started in 2012 is expected to continue in 2013, albeit with policy differences across countries (Figure 6). Following the large fiscal expansion in 2011, the growth of fiscal spending appropriately slowed in GCC economies in 2012 as robust growth in the non-oil sector continued. Nevertheless, there were differences across countries. The non-oil general government fiscal deficit as a percent of non-oil GDP—the most useful measure of how fiscal policy is affecting the non-oil domestic economy (see Special Feature on Fiscal Policy)—narrowed in Qatar, Saudi Arabia, and the United Arab Emirates in 2012 as government spending growth eased, while it widened in Bahrain, Kuwait, and Oman. In 2013, fiscal consolidation is expected to continue in Qatar, Saudi Arabia, and UAE and begin in Oman, while Bahrain and Kuwait are pursuing an expansionary fiscal policy. All the GCC countries continue to run relatively large overall fiscal surpluses as oil revenues remain high, except Bahrain which is in deficit.
Figure 6. GCC: Fiscal Indicators
Sources: Country authorities; and IMF staff estimates.
-100
-90
-80
-70
-60
-50
-40
-30
-20
-10
0
-100
-90
-80
-70
-60
-50
-40
-30
-20
-10
0Bahrain Kuwait Oman Qatar Saudi
ArabiaU.A.E.
2010 2011 2012 2013
Non-oil Fiscal Balance, 2010–13(Percent of non-oil GDP)
BHR
KWT
OMNQAT
SAUUAE
0
10
20
30
40
50
60
70
80
90
100
110
0 10 20 30 40 50 60 70 80 90 100 110
PIH
-con
sist
ent n
on-o
il prim
ary d
efic
it
Actual non-oil primary deficit
Non-oil Primary Fiscal Deficit, 2012(Percent of non-oil GDP)
Bahrain
Kuwait
Oman
Qatar
Saudi Arabia
U.A.E.
0
10
20
30
40
50
60
70
80
90
100
0
10
20
30
40
50
60
70
80
90
100
40 50 60 70 80 90 100
Hyd
roca
rbon
Rev
enue
s/To
tal E
xpor
ts
Hydrocarbon Revenues/Total Government Revenues
Reliance on Hydrocarbon Revenues, 2012(Percent)
Bahrain
Kuwait
Oman
Qatar
Saudi Arabia
U.A.E.
0
20
40
60
80
100
120
140
0
20
40
60
80
100
120
140
0 20 40 60 80 100 120
Fisc
al B
alan
ce
External Balance
2012
2013
Break-even Oil Prices, 2012–13(U.S. dollars per barrel)
Average Brent price in 2013: $108
13
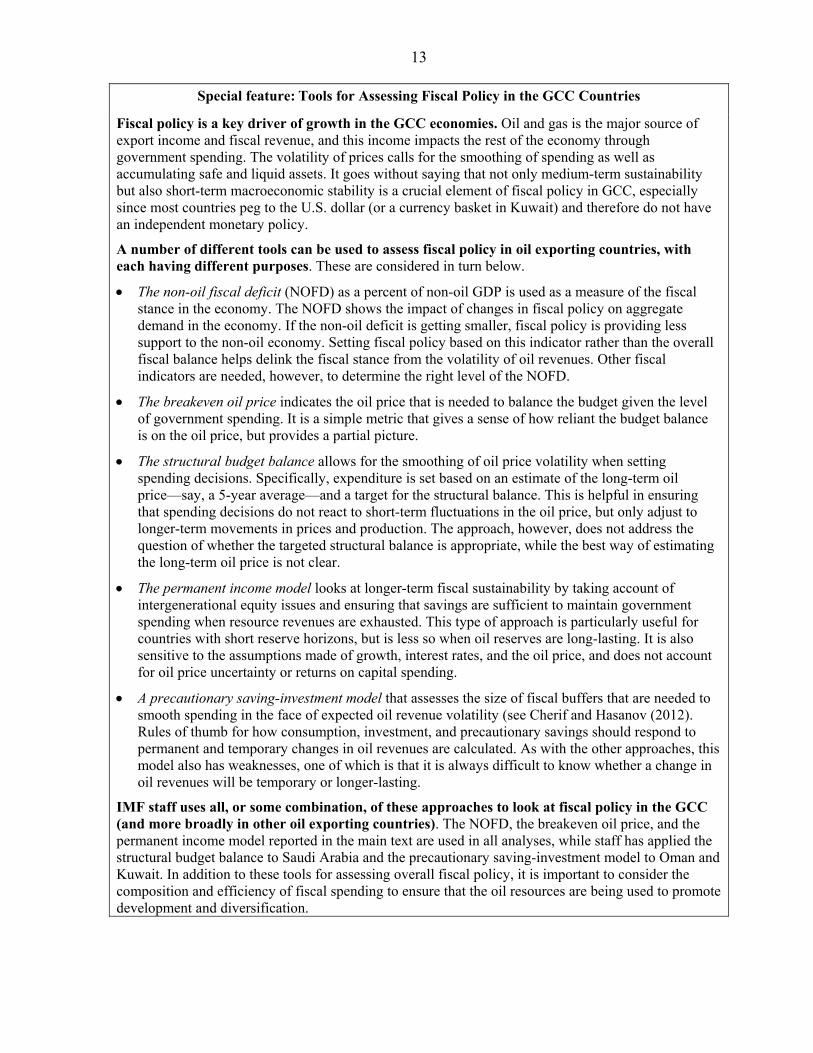
Special feature: Tools for Assessing Fiscal Policy in the GCC Countries
Fiscal policy is a key driver of growth in the GCC economies. Oil and gas is the major source of export income and fiscal revenue, and this income impacts the rest of the economy through government spending. The volatility of prices calls for the smoothing of spending as well as accumulating safe and liquid assets. It goes without saying that not only medium-term sustainability but also short-term macroeconomic stability is a crucial element of fiscal policy in GCC, especially since most countries peg to the U.S. dollar (or a currency basket in Kuwait) and therefore do not have an independent monetary policy.
A number of different tools can be used to assess fiscal policy in oil exporting countries, with each having different purposes. These are considered in turn below.
The non-oil fiscal deficit (NOFD) as a percent of non-oil GDP is used as a measure of the fiscal stance in the economy. The NOFD shows the impact of changes in fiscal policy on aggregate demand in the economy. If the non-oil deficit is getting smaller, fiscal policy is providing less support to the non-oil economy. Setting fiscal policy based on this indicator rather than the overall fiscal balance helps delink the fiscal stance from the volatility of oil revenues. Other fiscal indicators are needed, however, to determine the right level of the NOFD.
The breakeven oil price indicates the oil price that is needed to balance the budget given the level of government spending. It is a simple metric that gives a sense of how reliant the budget balance is on the oil price, but provides a partial picture.
The structural budget balance allows for the smoothing of oil price volatility when setting spending decisions. Specifically, expenditure is set based on an estimate of the long-term oil price—say, a 5-year average—and a target for the structural balance. This is helpful in ensuring that spending decisions do not react to short-term fluctuations in the oil price, but only adjust to longer-term movements in prices and production. The approach, however, does not address the question of whether the targeted structural balance is appropriate, while the best way of estimating the long-term oil price is not clear.
The permanent income model looks at longer-term fiscal sustainability by taking account of intergenerational equity issues and ensuring that savings are sufficient to maintain government spending when resource revenues are exhausted. This type of approach is particularly useful for countries with short reserve horizons, but is less so when oil reserves are long-lasting. It is also sensitive to the assumptions made of growth, interest rates, and the oil price, and does not account for oil price uncertainty or returns on capital spending.
A precautionary saving-investment model that assesses the size of fiscal buffers that are needed to smooth spending in the face of expected oil revenue volatility (see Cherif and Hasanov (2012). Rules of thumb for how consumption, investment, and precautionary savings should respond to permanent and temporary changes in oil revenues are calculated. As with the other approaches, this model also has weaknesses, one of which is that it is always difficult to know whether a change in oil revenues will be temporary or longer-lasting.
IMF staff uses all, or some combination, of these approaches to look at fiscal policy in the GCC (and more broadly in other oil exporting countries). The NOFD, the breakeven oil price, and the permanent income model reported in the main text are used in all analyses, while staff has applied the structural budget balance to Saudi Arabia and the precautionary saving-investment model to Oman and Kuwait. In addition to these tools for assessing overall fiscal policy, it is important to consider the composition and efficiency of fiscal spending to ensure that the oil resources are being used to promote development and diversification.

14
16. Inflation is contained, and policy interest rates remain low in line with the U.S. federal funds rate and consistent with the pegged exchange rate regimes. While inflation in Bahrain, Qatar, and Saudi Arabia has picked-up in 2013 to 3-3½ percent due to a combination of rising food prices and higher housing costs, it appears now to have peaked (Figure 7). In Oman, inflation is declining, while in the United Arab Emirates it remains low. For the region as a whole, inflation is expected at 3.2 percent this year (on an annual average basis), up from 2.4 percent in 2012. Residential real estate prices are rising strongly in Dubai and Qatar as demand for housing, particularly from expatriates, is increasing.
Figure 7. GCC: Credit Growth and Inflation
17. Despite low policy interest rates, private sector credit growth across the region is mixed. Credit growth is robust at around 15–16 percent in Saudi Arabia, but is relatively weak in other countries. In the United Arab Emirates, while there has been some pick-up in credit growth in recent months, the debt overhang from the Dubai crisis is still limiting lending opportunities and the banking sector remains cautious in light of high NPLs. In Kuwait, relatively weak non-oil growth and the slow implementation of public capital projects are limiting lending. External bond inflows have decelerated from the 2010 peak in Bahrain, Qatar, and the United Arab Emirates (Figure 8), and the region has not seen the short-term capital inflows that other emerging markets received (and are now seeing exit).
Sources: Country authorities; and IMF staff calculations.
-5
5
15
25
35
45
55
65
-5
5
15
25
35
45
55
65
Jan-08 Nov-08 Sep-09 Jul-10 May-11 Mar-12 Jan-13
Bahrain
Kuwait
Oman
Qatar
Saudi Arabia
U.A.E.
Private Sector Credit Growth, 2008-Latest(Percent)
-15
-10
-5
0
5
10
15
20
-15
-10
-5
0
5
10
15
20
Jan-08 Oct-08 Jul-09 Apr-10 Jan-11 Oct-11 Jul-12 Apr-13
BahrainKuwaitOmanQatarSaudi ArabiaU.A.E.
CPI Inflation, 2008–Latest(Percent)
-0.1
0.0
0.1
0.2
0.3
0.4
0.5
0.6
0.7
0.8
0.9
1.0
-0.1
0.0
0.1
0.2
0.3
0.4
0.5
0.6
0.7
0.8
0.9
1.0
2005 2006 2007 2008 2009 2010 2011 2012
Bahrain Kuwait
Oman Qatar
Saudi Arabia U.A.E.
Figure 8. Bond Flows, 2005–latest(Percent of non-oil GDP)
Sources: EPFR Global; and IMF staff calculations.

15
18. Financial sectors in the GCC countries are sound, although non-performing loans rose in Bahrain and the United Arab Emirates in 2012. The banking systems in the GCC generally remain well capitalized and nonperforming loans (NPLs) well provisioned (Table 1). There are pockets of weakness, however, including in the United Arab Emirates where NPLs are still high and a potential additional restructuring of government related entity (GRE) debt could raise the level, and in Bahrain where a number of Islamic banks have concentrated exposures to local and regional real estate markets. Further, in Kuwait, some investment companies continue to make losses, and the investment company sector remains vulnerable to swings in global and regional financial and real estate markets. Implementation of Basel III is progressing. Saudi Arabia was among the first countries in the world to implement Basel II capital standards, while other countries are planning a phased implementation until 2019.
IV. RISKS AND SPILLOVERS IN AN UNCERTAIN GLOBAL ENVIRONMENT
Risks to the global outlook remain on the downside. The main channel through which the region would be affected if these risks materialize is the oil market, although some countries (notably the United Arab Emirates) would also be affected by their links to global financial markets. Nevertheless, with the substantial fiscal and financial buffers that have been built up, the GCC countries are in a strong position to withstand any turbulence. Risks from domestic sources could also emerge, for instance, if ongoing reform programs are not successful at generating jobs.
A. Key Global Risks
19. The implications of four global risks are considered below: (i) a prolonged slowdown in large emerging market countries; (ii) a re-intensification of pressures in the euro area; (iii) an unwinding of unconventional monetary stimulus that leads to a sharp increase in global interest rates; and (iv) an increase in global oil prices as a result of further geopolitical uncertainties or disruptions in oil production in countries outside the GCC.
A prolonged slowdown in emerging market economies. The recent slowdown in emerging markets is part cyclical and part structural. The baseline IMF projections assume that growth in emerging markets recovers modestly in 2014, staying well below the rate seen in 2010–11 over the medium term, however it is possible, that the slowdown is more structural in nature, and therefore will be longer-lasting than assumed. Weaker growth in emerging markets would have a significant impact on global growth and oil prices. IMF
2009 2012 2009 2012 2009 2012
Bahrain 19.6 19.3 3.9 5.8 60.3 53.1Kuwait 16.7 18.0 11.5 5.2 38.3 95.1Oman 15.6 16.0 3.4 2.2 59.8 69.6Qatar 16.1 18.9 1.7 1.7 84.5 97.5Saudi Arabia 16.5 18.7 3.3 1.9 89.8 145.1UAE 19.9 20.6 4.3 8.7 64.4 64.9
Source: Country authorities.
Table 1. GCC Financial Soundness Indicators
Capital Adequacy Ratio Non-performing Loans (share of gross loans)
Provisioning Rate (percent of non-
performing loans)

16
simulations suggest that if investment in the BRICS were to fall 10 percent below baseline next year and be accompanied by capital outflows as confidence in the growth outlook for these countries declines, this would reduce global growth by around 1¾ percentage points and result in a 20 percent drop in oil prices.
A re-intensification of pressures in the euro area. The absence of further policy actions to address fragmentation, support demand, and tackle needed structural reforms could see renewed pressures in the euro area. Although recent data has suggested that the outlook in the euro area is improving and spreads have narrowed, actions are still needed in many areas to repair balance sheets, improve competitiveness, and restore sustained growth. If these reforms are not forthcoming and confidence again erodes, the euro area could see a renewal of financial pressures. IMF simulations suggest that such a scenario would reduce global growth by about 1 percentage point, and would be accompanied by a drop in oil prices of about 7 percent.
A sharp increase in global interest rates. Uncertainty about the timing of the tapering of bond purchases by the Federal Reserve has led to increased uncertainty in financial markets. If growth in the United States turns out to be stronger than projected in the coming years and the timing of the withdrawal of monetary stimulus takes place earlier than currently anticipated, there will be offsetting effects on the global economy. As rates rise in the United States, capital flows into the United States will increase and interest rates across the world will rise, slowing activity. At the same time, stronger United States growth will result in higher imports, benefiting countries with large exports to the United States. On balance, the impact on global growth is likely to be small and the impact on oil prices negligible. The outcome will be less benign, however, if interest rates and financial market volatility spike higher before stronger U.S. growth is evident (basically if the experience of the past few months is extended and becomes more intensified). The impact on global growth would be more substantial as the positive benefit from stronger U.S. growth would be absent, but global interest rates would still be higher. Simulations of this scenario in the IMF’s 2013 Spillovers Report suggest that global growth could be 1 percent lower than in the baseline, with oil prices falling by a little more than 10 percent.
Higher oil prices resulting from increased geopolitical tensions. Ongoing difficulties in a number of oil exporting countries or broader regional geopolitical developments could result in disruptions to oil supply and higher oil prices. There would also be a call on spare oil production capacity in the GCC. Although the size of the potential oil price increase in such a scenario is difficult to gauge, it would probably range from negligible to substantial if production in a large non-GCC exporter was significantly affected for an extended period. If oil prices were to move substantially higher, and this were to be accompanied by a decline in confidence in advanced and emerging market economies, this could have a significant negative effect on global growth.

17
B. Implications for the GCC
20. The main channel through which the GCC countries would be affected by any of these risks is the oil market. IMF staff simulations suggest that the fall in oil prices in the three downside scenarios could range from around 7 percent (re-intensification of pressures in the euro area) to 20 percent (prolonged emerging market slowdown). These effects could be magnified if oil production in the United States. Increases more rapidly than expected. All countries except for Bahrain have accumulated large official external assets and would be able to comfortably weather temporary declines in oil income. Total public external assets in the GCC are estimated at about $1.8 trillion or more than 115 percent of GDP in 2012, while government debt is generally low, with Bahrain and Qatar having the highest gross debt-to-GDP ratios at 34 and 36 percent respectively (the latter has issued debt for market development purposes rather than fiscal need). However, a more prolonged drop in oil revenues would begin to erode the fiscal buffers that have been established in recent years.
21. Simulations indicate that fiscal and external balances are sensitive to oil prices, but show that the buffers that have been built-up provide a substantial cushion in the event of a significant decline in prices. If oil prices were to fall $25 below the baseline from 2014, fiscal balances in all countries except Kuwait would be in deficit in 2018 (assuming no policy reaction). Current account balances would also fall, although only in Oman and Qatar would they move into deficit, and the accumulation of public external assets would slow. If oil prices increased by the same amount, all countries would remain in fiscal surplus in 2018, and the accumulation of foreign assets would be substantial (Figure 9).
Figure 9. Oil Price Risk Scenarios
Sources: Country authorities; and IMF calculations.Note: The fiscal numbers reflect the fiscal year balances, and are labeled according to the year in which the fiscal year starts.
0
20
40
60
80
100
120
140
0
20
40
60
80
100
120
140
2009 2010 2011 2012 2013 2014 2015 2016 2017 2018
Baseline
Downside scenario
Upside scenario
Oil Price Assumptions (USD per barrel)
-20
-10
0
10
20
30
40
50
-20
-10
0
10
20
30
40
50
Saudi Arabia UAE Qatar Kuwait Oman Bahrain
Current account (2012)
Downside scenario (2018)
Baseline scenario (2018)
Upside scenario (2018)
Current Account Balance(Percent of GDP)
-20
-10
0
10
20
30
40
-20
-10
0
10
20
30
40
Saudi Arabia UAE Qatar Kuwait Oman Bahrain
Fiscal balance (2012)
Downside scenario (2018)
Baseline scenario (2018)
Upside scenario (2018)
Fiscal Balance (Percent of GDP)

18
22. Gauging the impact on economic growth is more difficult, but it will greatly depend on the policy response of the government. In a weaker global environment, oil production in the region would be expected to fall as global energy demand drops, reducing oil GDP. Although the slowdown in the global economy would likely reduce private-sector confidence and curtail FDI inflows, which would negatively affect the non-oil sector, the substantial fiscal buffers in place would enable government spending to be maintained, or even temporarily increased, which would help limit the impact on non-oil growth. Given the pegged exchange rate regimes, the eventual increase in interest rates in the United States will result in higher domestic interest rates; however, the pass-through of policy rates to lending rates is generally weak in the GCC countries, and the impact of rising interest rates is likely to be limited, at least initially.
23. Countries with a higher reliance on external financing and closer links to global financial markets will be affected through financial channels. Linkages with global banks vary across the GCC, with Qatar and the United Arab Emirates being significant recipients of foreign bank lending (of about 25–30 percent of GDP), and Bahrain, given its position as an international financial center, having a high exposure to foreign banks. Kuwait and Saudi Arabia are considerably less dependent on foreign bank financing. Nevertheless, the Investment Corporations in Kuwait hold foreign assets constituting almost half of total claims, and have foreign liabilities comprising almost a quarter of total obligations. Outflows of capital would increase financial sector vulnerabilities in these countries, put pressure on bank credit, and could spillover to the real economy, particularly real estate markets (Figure 10). Nevertheless, as discussed in paragraph 17, the financial sectors in the region generally remain well capitalized and liquid which would help them weather these risks.
Figure 10. GCC Links with Foreign Banks
Sources: BIS locational bank data; and IMF staf f calculations.
GCC
Saudi Arabia
UAE
Qatar
Kuwait
Oman
Bahrain*
0
5
10
15
20
25
30
0 5 10 15 20 25 30
Non
-ban
k se
ctor
Bank sector
Foreign Bank Claims on GCC Countries, 2013:Q1 (Percent of 2012 GDP)
* Foreign bank claims on Bahrain's bank sector amount to 162 percent of GDP.
GCC
Saudi Arabia
UAEQatar
Kuwait
Oman
Bahrain*
0
5
10
15
20
25
30
0 5 10 15 20 25 30 35 40
Non
-ban
k se
ctor
Bank sector
Foreign Bank Liabilities to GCC Countries, 2013: Q1(Percent of 2012 GDP)
* Foreign bank liabilities to Bahrain's bank sector amount to 107 percent of GDP.

19
24. Economic developments and policies in the GCC will themselves have implications for other countries in the region and elsewhere. The main outward spillover from the GCC to the global economy is through the oil market, where the spare production capacity held by Saudi Arabia is a key source of stability for the global oil market. Saudi Arabian production has been raised during past episodes of large oil supply disruptions (the Gulf wars, the Venezuelan general strike, and the abrupt decline in Libyan production in 2011) and it has once again increased in recent months as production from several other OPEC countries has fallen.1 Remittance outflows from the large number of expatriate workers in the region are an important source of foreign income for a number of countries. Lastly, the GCC countries have been a particularly generous provider of financial support to a number of countries in transition in the Middle East.
V. POLICY RESPONSES AND CHALLENGES
The GCC countries remain well positioned to respond to the challenges that may stem from the continued uncertain global environment, given the substantial buffers that have been built up in recent years. Nevertheless, further actions are still needed to reduce potential vulnerabilities, diversify the economies, and create well-paying, productive jobs for the growing working-age populations.
A. Macroeconomic Policy Settings
25. Macroeconomic policy settings appear appropriate for the short term in most countries, although fiscal consolidation is generally needed over the medium term. Following the expansionary fiscal policy stance in 2011, the non-oil fiscal deficit is appropriately narrowing in 2013 in Oman, Qatar, Saudi Arabia, and the United Arab Emirates. In Bahrain and Kuwait, the non-oil fiscal deficit is expected to increase further this year, which is a particular concern in Bahrain given government debt is already quite high. Early action is needed to put the non-oil fiscal deficit on a firm downward path. Over time, fiscal consolidation will be needed in most countries to ensure that fiscal buffers remain at adequate levels and to raise savings for future generations. With the exception of Qatar, all countries are running non-oil fiscal deficits that are larger than is consistent with an equitable intergenerational allocation of oil revenues. Consolidation should focus on containing the growth of current spending, particularly public sector wages, prioritizing capital spending, and enhancing non-oil revenues. Nevertheless, as government spending has increased in recent years, the breakeven oil price—the price at which the government budget is balanced—has risen. Further, except in Qatar and Kuwait, the non-oil primary fiscal deficit is above the level needed to ensure that government spending will be sustainable when oil reserves are exhausted.
1 The role of Saudi Arabia in the global oil market is discussed “Assessing Saudi Arabia’s Systemic Role in the Oil Market and Global Economy,” IMF County Report No. 13/230.

20
26. Monetary policy settings remain accommodative. While this is appropriate at present, it will be important that policymakers remain vigilant for signs of rising inflationary pressures in goods and asset markets, particularly in those countries where inflation is more elevated and has been on an upward trend this year. While the pegged exchange rate means that fiscal tightening would have to be the first line of defense against rising price pressures, monetary and macro-prudential tools could be used as well by adjusting reserve requirements or loan-to-deposit ratios. If pressures in real estate markets were to emerge, early and targeted macro-prudential interventions would help, although their effectiveness would be constrained in countries where most financing comes from outside the financial sector.
27. If the downside risks discussed above were to emerge, there would be scope for fiscal policy to respond. The first course of action would be to maintain existing expenditure plans in the face of the drop in oil revenues—i.e., the overall fiscal surplus should be allowed to decline. If domestic growth is more severely affected by the global shock, most countries have the fiscal space to slow the pace of fiscal consolidation currently underway, or even temporarily reverse it. In such circumstances, however, it would be important to ensure that any new fiscal measures introduced are consistent with other short-and medium-term policy objectives. For example, boosting public-sector employment and wages would work counter to the objectives of the ongoing labor market reforms to increase the incentives for nationals to work in the private sector. Monetary and macro-prudential policies could also be proactively used to ensure that liquidity is available to the financial sector and that credit to the private sector is not unduly affected.
28. In a situation where oil prices increase above current levels, it will be important that policies do not become procyclical and take the opportunity to further build fiscal buffers. If oil revenues are stronger than expected, fiscal consolidation plans already in train should be maintained, and the additional revenues largely saved. This will not only reduce the risks of overheating pressures emerging, but will allow countries to boost saving for intergenerational purposes. Macro-prudential policy settings would also need to be adjusted if inflation or sector credit risks emerged. In countries such as UAE and Qatar, where real estate prices are already increasing quite strongly, macro-prudential measures targeted at the real estate sector (both construction and purchase) could be considered. In other countries, particularly Saudi Arabia, the focus of policy should be more on delivering the new supply of affordable housing that is needed for the local population.
B. Longer-Term Policy Challenges
Employing a rapidly growing working-age population
29. Creating jobs for the growing working-age population remains a key policy challenge for most GCC countries. As discussed in the accompanying background paper, labor market structure in the GCC, with the majority of nationals employed in the public sector and the private sector reliant on an elastic supply of low-skilled expatriate workers, has enabled the region to develop rapidly, keep inflation relatively low, and distribute the oil

21
wealth to the population. However, the costs of this model—low productivity and a low responsiveness of the employment of nationals to economic growth—are increasingly becoming an issue as economic diversification becomes more of a policy priority and the scope for increased public-sector employment diminishes. Reforms to increase the employment of nationals in the private-sector are under way in all countries, but a greater focus on controlling public sector employment, raising educational quality, and making nationals more competitive in the private labor market is needed.
30. Measures to sustain strong growth in the private non-oil sector are needed to create jobs. The GCC countries generally rank relatively well in overall competitiveness and Doing Business indicators, although there is some room for Oman and Kuwait to strengthen their positions (Figure 11). Efforts that are under way in the region to strengthen the SME sector are welcome; continued financial deepening, including the development of domestic bond markets, will be important to support financing.
Figure 11. GCC Governance and Education
Sources: World Bank: World Governance Indicators; Fraser Institute: Economic Freedom in the World; UNDP: Human Development Index, TIMSS, 2007 and 2012; World Economic Forum; and IMF staff calculations.
0
50
100
150
200
250
300
350
400
450
500
0
50
100
150
200
250
300
350
400
450
500
Bahrain Kuwait Oman Qatar Saudi Arabia
U.A.E
Quality of Education - TIMSS Math Score
2007 2011
31
13
35
20
37
19
42
33
43 43
30
36
1
6
11
16
21
26
31
36
41
46
1
6
11
16
21
26
31
36
41
46
QatarSaudi ArabiaU.A.E.OmanBahrainKuwait
2007 2012
GCC: Global Competitiveness Rank, (2007 and 2012)
BHR
Advanced
QAT
GCC
OMN
KWT
0
20
40
60
80
100
120
140
160
180
200020406080100120140
Ease
of D
oing
Bus
ines
s(R
anki
ng a
mon
g 18
3 co
untr
ies)
Global Competitiveness Index(Ranking among 134 countries)
Doing Business vs. Global Competitiveness Index, 2012Doing Business vs. Global Competitiveness Index, 2012
SAU
UAE
Korea
Russia
United Kingdom United States
Bahrain
Oman
Kuwait
Saudi Arabia
Qatar
Singapore
Hong Kong
Indonesia
Japan
Turkey
300
350
400
450
500
550
600
650
300
350
400
450
500
550
600
650
4 6 8 10 12 14Years of schooling
Aver
age
mat
h an
d sc
ienc
e sc
ore
(TIM
SS)
Length and Quality of Education, 2011(Years of schooling and TIMSS scores)

22
Strengthening fiscal frameworks
31. Stronger fiscal frameworks would help improve the efficiency of public spending and underpin the needed medium-term fiscal consolidation The introduction of a medium-term budget framework would help integrate National Development Plans into the annual budget planning process, look at the impact of current year commitments in a multi-year setting, and identify fiscal risks on both the revenue and expenditure sides. As part of the budget process, estimated revenues should be set on the basis of a realistic forecast of the oil price. The use of a structural fiscal balance concept may help in this regard. The expenditure envelope, would be set on the basis of an estimate of the long-term oil price and a target for the structural budget balance. The move to multi-year budgeting would be supported by the establishment of macro-fiscal units and the publication of fiscal data in GFSM 2001 format.
32. Significant investments are being made in large infrastructure projects through-out the region, and it is important to have strong frameworks in place to ensure that these support development needs. Investment rates in the region are high, and as shown in the accompanying background paper, the accumulation of capital has been an important driver of growth in the region over the past two decades. However, productivity growth has generally been negative, suggesting there is scope for improved efficiency in the use of capital and labor, in both the public and private sectors.
Curtailing domestic energy consumption
33. Growing populations mean that, in the absence of policy reforms, domestic energy consumption is likely to continue to rise. The GCC countries have some of the highest levels of energy consumption per capita in the world and some of the lowest prices. In addition to efforts to improve energy efficiency in the region through building and appliance standards, a gradual upward adjustment in domestic energy prices over time would help curb the rapid growth of domestic consumption, redirect existing incentives in the growth model away from energy intensive industries, and strengthen the fiscal position. Recent estimates suggest that GCC countries could significantly reduce energy consumption over the long term if prices were adjusted upward (see Charap, Ribeiro de Silva, and Rodriguez, 2013).
34. While low energy prices are one of the ways that oil wealth is distributed to the population, the benefits are heavily skewed toward the better off: an increase in energy prices however, would have an adverse impact on poor and vulnerable groups, so compensatory measures would need to be put in place. Energy intensive industries would need time to adjust their production and cost structures to remain competitive. International experience with energy price reform suggests that such a policy adjustment will need to be well-planned, phased-in gradually over time, and clearly explained and communicated to the population and businesses (see IMF, 2013).

23
Developing domestic debt markets to support growth 35. Domestic debt markets are still at an early stage of development in the GCC. Regional policymakers, however, are placing a strong emphasis on developing these markets based on a broader vision of an increasing role for the private sector in driving economic growth and diversification. Developing deep and liquid domestic debt markets can bring important benefits, including diversifying financing risks, supporting further development of funded pension schemes, and enhancing corporate governance, because debt issuance will demand more financial disclosure and transparency. As GCC countries advance their diversification agendas, the availability of long-term financing will become even more important, particularly for mega-infrastructure projects. The joint Qatar-IMF capital markets conference held in Doha in October 2012 focused on the key issues in debt market development in the region.
36. The development of a government securities market is usually the first step in deepening domestic debt markets. Although GCC governments generally do not need to issue debt, liquid government debt markets have benefits even in fiscal surplus countries, and countries such as Norway, Australia, Hong Kong SAR, and Singapore have made conscious efforts to develop them. A well-functioning government securities market can (i) establish the benchmark yield curve for private-sector issuers; (ii) help create new financial products and market infrastructure that improve financial efficiency; (iii) make monetary policy operations and the monetary transmission mechanism more effective; and (iv) support banks’ liquidity management and help them meet the Basel III liquidity coverage requirements. At the practical level, domestic debt market development requires attention to a broad range of issues. These include: public debt management, a diverse investor base, corporate governance, market transparency and integrity, as well as the technicalities of developing products and market platforms.
Strengthening macro-prudential policy frameworks
37. While macro-prudential policies have a long history in the GCC countries, they have been implemented by central banks without a formal framework or adequate legal backing. Drawing on the emerging international experience, it would be desirable to develop a more formal and transparent macro-prudential institutional and policy framework, particularly with respect to the mandate for financial stability, coordination framework, definition of objectives, elaboration of analytical methods, and the policy toolkit. The development of a formal macro-prudential framework may require more time, as the understanding of these issues is still evolving. Nevertheless, a number of countries, including Qatar in the GCC, are introducing institutional arrangements for macro-prudential policy.
38. GCC countries should conduct regular systemic assessments and publish financial stability reports. Currently, Bahrain (since 2007), Qatar (since 2010), Oman (since 2013) and the United Arab Emirates (since 2012) publish financial stability reports.

24
These reports help improve the transparency of risk recognition in the financial system, and facilitate broad communication with the public. Macro stress testing should also become an integral part of systemic surveillance. In addition, the macro-prudential framework should be supported by an effective early warning system (EWS) to identify and monitor systemic risks.
39. There is scope for refining the existing macro-prudential toolkit, to build appropriate buffers and to limit excessive leveraging and credit booms in good times. For building and maintaining buffers, GCC countries have been relying strongly on high capitalization of banks. This could be complemented by an enhanced role for Pillar II, a further move towards risk-based supervision, and linking the supervisory review process to the cycle. For macro-prudential purposes, designing time-varying loan-to-deposit ratios could be given consideration to alleviate procyclicality, while time-varying loan-to-value ratios and sector exposure limits could help contain excessive exposure to the real estate sector and reduce credit concentration. GCC regulators are appropriately focusing on instruments to reduce liquidity risks, and have been developing regulations to comply with Basel III requirements. To help with liquidity management, the development of the domestic debt market is important.
Improving economic statistics and increasing transparency
40. Enhancing the quality and availability of economic statistics remains a key priority. Good and timely data are essential if policymakers are to be able to respond to economic developments as they unfold. Good progress has been made in strengthening data provision in the GCC in recent years, but important gaps still remain, in the areas of national accounts, balance of payments, labor markets, and the real estate sector, among others. Regional initiatives, including GCCStat and ArabStat, will help harmonize statistical measures and could help anchor statistical improvement plans.
GCCStat: A Regional Statistical Center
In a welcome initiative that should help improve economic and social statistics across the region, the Heads of State of the GCC member countries approved the establishment of a new statistical center—GCCStat—at their 2012 annual summit. GCCStat will be responsible for the collection, analysis, and dissemination of economic, social, and other data, working with national statistic agencies and compilers. GCCStat will coordinate all statistical work programs at the level of member states and will look to apply international standards and best practices, and to unify methodologies and improve data quality. It will be the official source of data for the GCC. GCCStat is located in Oman, and will be overseen by a Board of Directors comprised of the heads of the statistical centers of the six GCC countries.

25
41. Further steps could be taken to enhance economic transparency, including the publication of IMF reports. Although there have been very positive steps in recent years, not all GCC countries publish IMF country reports (Table 2).
Table 2. GCC Countries Publication of IMF Reports
2010 2010 2010 2010
Bahrain ✓ None2 None2 None2
Kuwait ✓ ✓ ✓ ✓
Oman ✓ ✓ No No
Qatar ✓ ✓ ✓ ✓
Saudi Arabia No ✓ No No
UAE ✓ ✓ ✓ ✓
2 No Board discussion took place.
✓
No
✓
✓
✓
✓
✓
✓
✓
No
✓
✓
✓
Latest1/ Latest1/ Latest1/ Latest1/
1 Latest refers to the 2013 Article IV for Bahrain, Oman, Saudi Arabia, and the United Arab Emirates and to the 2012 Article IV for Kuwait and Qatar
End of Mission Statement Post-Board PIN/Press Release Staff Report Selected Issues Paper
No ✓ No No
✓
✓
No
✓
✓
✓
✓
26
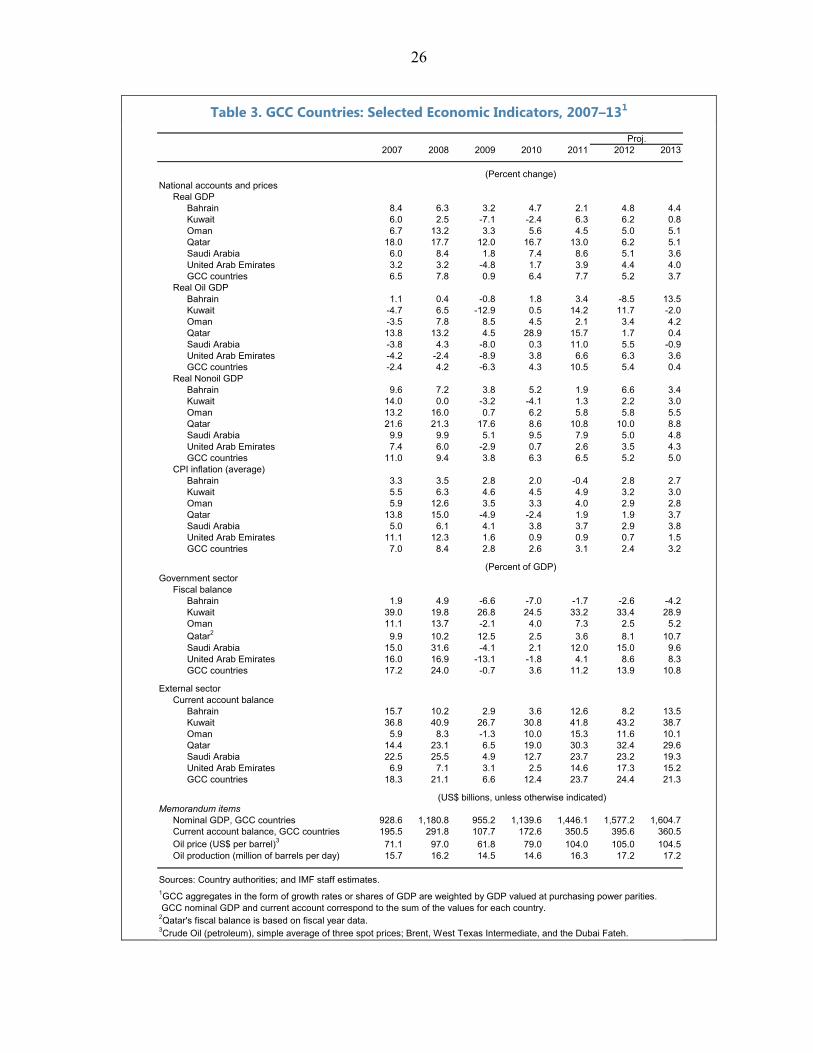
Table 3. GCC Countries: Selected Economic Indicators, 2007–131
Proj.2007 2008 2009 2010 2011 2012 2013
(Percent change)National accounts and prices
Real GDPBahrain 8.4 6.3 3.2 4.7 2.1 4.8 4.4Kuwait 6.0 2.5 -7.1 -2.4 6.3 6.2 0.8Oman 6.7 13.2 3.3 5.6 4.5 5.0 5.1Qatar 18.0 17.7 12.0 16.7 13.0 6.2 5.1Saudi Arabia 6.0 8.4 1.8 7.4 8.6 5.1 3.6United Arab Emirates 3.2 3.2 -4.8 1.7 3.9 4.4 4.0GCC countries 6.5 7.8 0.9 6.4 7.7 5.2 3.7
Real Oil GDPBahrain 1.1 0.4 -0.8 1.8 3.4 -8.5 13.5Kuwait -4.7 6.5 -12.9 0.5 14.2 11.7 -2.0Oman -3.5 7.8 8.5 4.5 2.1 3.4 4.2Qatar 13.8 13.2 4.5 28.9 15.7 1.7 0.4Saudi Arabia -3.8 4.3 -8.0 0.3 11.0 5.5 -0.9United Arab Emirates -4.2 -2.4 -8.9 3.8 6.6 6.3 3.6GCC countries -2.4 4.2 -6.3 4.3 10.5 5.4 0.4
Real Nonoil GDPBahrain 9.6 7.2 3.8 5.2 1.9 6.6 3.4Kuwait 14.0 0.0 -3.2 -4.1 1.3 2.2 3.0Oman 13.2 16.0 0.7 6.2 5.8 5.8 5.5Qatar 21.6 21.3 17.6 8.6 10.8 10.0 8.8Saudi Arabia 9.9 9.9 5.1 9.5 7.9 5.0 4.8United Arab Emirates 7.4 6.0 -2.9 0.7 2.6 3.5 4.3GCC countries 11.0 9.4 3.8 6.3 6.5 5.2 5.0
CPI inflation (average)Bahrain 3.3 3.5 2.8 2.0 -0.4 2.8 2.7Kuwait 5.5 6.3 4.6 4.5 4.9 3.2 3.0Oman 5.9 12.6 3.5 3.3 4.0 2.9 2.8Qatar 13.8 15.0 -4.9 -2.4 1.9 1.9 3.7Saudi Arabia 5.0 6.1 4.1 3.8 3.7 2.9 3.8United Arab Emirates 11.1 12.3 1.6 0.9 0.9 0.7 1.5GCC countries 7.0 8.4 2.8 2.6 3.1 2.4 3.2
(Percent of GDP)Government sector
Fiscal balanceBahrain 1.9 4.9 -6.6 -7.0 -1.7 -2.6 -4.2Kuwait 39.0 19.8 26.8 24.5 33.2 33.4 28.9Oman 11.1 13.7 -2.1 4.0 7.3 2.5 5.2Qatar2 9.9 10.2 12.5 2.5 3.6 8.1 10.7Saudi Arabia 15.0 31.6 -4.1 2.1 12.0 15.0 9.6United Arab Emirates 16.0 16.9 -13.1 -1.8 4.1 8.6 8.3GCC countries 17.2 24.0 -0.7 3.6 11.2 13.9 10.8
External sectorCurrent account balance
Bahrain 15.7 10.2 2.9 3.6 12.6 8.2 13.5Kuwait 36.8 40.9 26.7 30.8 41.8 43.2 38.7Oman 5.9 8.3 -1.3 10.0 15.3 11.6 10.1Qatar 14.4 23.1 6.5 19.0 30.3 32.4 29.6Saudi Arabia 22.5 25.5 4.9 12.7 23.7 23.2 19.3United Arab Emirates 6.9 7.1 3.1 2.5 14.6 17.3 15.2GCC countries 18.3 21.1 6.6 12.4 23.7 24.4 21.3
(US$ billions, unless otherwise indicated)Memorandum items
Nominal GDP, GCC countries 928.6 1,180.8 955.2 1,139.6 1,446.1 1,577.2 1,604.7Current account balance, GCC countries 195.5 291.8 107.7 172.6 350.5 395.6 360.5Oil price (US$ per barrel)3 71.1 97.0 61.8 79.0 104.0 105.0 104.5Oil production (million of barrels per day) 15.7 16.2 14.5 14.6 16.3 17.2 17.2
Sources: Country authorities; and IMF staff estimates.1GCC aggregates in the form of growth rates or shares of GDP are weighted by GDP valued at purchasing power parities. GCC nominal GDP and current account correspond to the sum of the values for each country.2Qatar's fiscal balance is based on fiscal year data. 3Crude Oil (petroleum), simple average of three spot prices; Brent, West Texas Intermediate, and the Dubai Fateh.

27
References
British Petroleum, 2013, BP Energy Outlook, January.
Charap, J., A. Ribeiro da Silva, and P. Rodriguez, 2013, “Energy Subsidies and Energy Consumption – A cross country Analysis,” IMF Working Paper 13/112.
Cherif, R. and F. Hasanov, 2012, “Oil Exporters’ Dilemma: How Much to Save and How Much to Invest,” IMF Working Paper 12/04.
Energy Information Agency (EIA), 2013, Annual Energy Outlook, April.
Hunt, B., M. Sommer, and others, 2013, “Macroeconomic Implications of the U.S. Unconventional Energy Boom,” in United States: Selected Issues, IMF Country Report No. 13/237, July (Washington: International Monetary Fund).
International Energy Agency, 2010, World Energy Outlook.
International Energy Agency, 2013, Medium-Term Oil Market Report.
International Monetary Fund, 2012, “The Natural Gas Market: Where Is It Heading,” Annex 1.1 in Middle East and Central Asia: Regional Economic Outlook, November (Washington).
International Monetary Fund, 2013, “Qatar: Staff Report for the 2012 Article IV Consultation, January (Washington).
International Monetary Fund, 2013, “Assessing Saudi Arabia’s Systemic Role in the Oil Market and Global Economy,” IMF County Report No. 13/230.
OPEC, 2012, World Oil Outlook.
OPEC, 2013, Monthly Oil Market Report, July.