“economic science for rural development” · mendel university in brno, 2012 ... bogdan klepacki...
TRANSCRIPT
1
Economic Science for Rural Development Nr. 28., 2012
ISSN 1691-3078
“ECONOMIC SCIENCE FOR RURAL DEVELOPMENT”
Proceedings of theInternational Scientiic Conference
RURAL BUSINESS AND FINANCE1. Rural Business Economics and Administration
2. Finance And Taxes
№ 28Jelgava
2012

Economic Science for Rural Development Nr. 28., 2012
ISSN 1691-3078
2
1-10
L. Rantamäki-Lahtinen Turning Rural Potential into Success
TIME SCHEDULE OF THE CONFERENCE
Preparation: October 2011 – April 2012Process: 26-27 April 2012
Agricultural University in Cracow, 2012 Alberta College, 2012Aleksandras Stulginskis University, 2012Corvinus University of Budapest, 2012 Council of Latvian Chamber of Commerce and Industry, 2012Daugavpils University, 2012 Estonian University of Life Sciences, 2012Fulda University of Applied Sciences, 2012Institute of Economics and Social Sciences, Estonian University of Life Sciences, 2012Institute of Economics by Latvian Academy of Sciences, 2012 Institute of Economics, Hungarian Academy of Sciences, 2012 Kaunas University of Technology, 2012 Latvia University of Agriculture, 2012Latvian Academy of Agricultural and Forestry Sciences, 2012Latvian Academy of Sciences, 2012Latvian State Institute of Agrarian Economics, 2012 Lithuanian Institute of Agrarian Economics, 2012 Mendel University in Brno, 2012 Mykolas Romeris University, 2012 Poznan University of Economics, 2012 Professional Association of Project Managers, 2012 Research Institute of Agriculture Machinery, Latvia University of Agriculture, 2012 Research Institute of Biotechnology and Veterinary Medicine “Sigra”, 2012Research Institute of Economics and Business, 2012 State Revenue Service of Latvia, 2012Rezekne Higher Education Institution, 2012 Riga International School of Economics and Business Administration, 2012Riga Technical University, 2012 Rural Support Service, 2012 School of Business Administration Turiba, 2012 School of Business and Finance, 2012 Seinäjoki University of Applied Sciences, 2012 Tallinn University Institute of Political Science and Governance, 2012 Tartu University, 2012 University College of Economics and Culture, 2012 University of Latvia, 2012University of Szczecin, 2012 Ural State Mining University, 2012 Valga County Government, 2012 Ventspils University College, 2012 Vidzeme University of Applied Sciences, 2012Wageningen University, 2012Warsaw University of Life Sciences, 2012West Pomeranian University of Technology in Szczecin, 2012
ISSN 1691-3078ISBN 978-9934-8304-1-9
Abstracted / Indexed: ISI Web of Knowledge, AGRIS, EBSCO http://thomsonreuters.com/products_services/science/science_products/a-z/conf_proceedings_citation_index/http://www.llu.lv/ef/konferences.htmwww.fao.org/agris/http://search.ebscohost.com/login.aspx?authtype=ip,uid&proile=ehost&defaultdb=lbh

3
Economic Science for Rural Development Nr. 28., 2012
ISSN 1691-3078
1-10
L. Rantamäki-Lahtinen Turning Rural Potential into Success
Programme Committee of International Scientiic Conference
Professor Baiba Rivza President of the Academy of Agricultural and Forestry Sciences of Latvia; academician of Latvian Academy of Sciences; foreign member of Academy of Agricultural Sciences of Russia; foreign member of Lithuanian Academy of Sciences; foreign member of the Academy Geargophily (Italy), foreign member of the Royal Swedish Academy of Agriculture and Forestry, Latvia
Professor Bartosz Mickiewicz West Pomeranian University of Technology in Szczecin, Poland
Professor Vilija Alekneviciene Faculty of Economics and Management, Aleksandras Stulginskis University, Lithuania
Professor Irina Pilvere Dean of the Faculty of Economics of Latvia University of Agriculture, Latvia
Professor Ingrida Jakusonoka Head of the Department of Accounting and Finance of the Faculty of Economics of Latvia University of Agriculture, Latvia
Associate professor Gunita Mazure
Department of Accounting and Finance of the Faculty of Economics of Latvia University of Agriculture, Latvia
ProfessorBarbara Freytag-Leyer
Department of Home Economics, Fulda University of Applied Sciences, Germany
Professor Jacques Viaene Faculty of Bioscience Engineering, Department of Agricultural Economics, University of Ghent, Belgium
Professor Bo Öhlmer Department of Economics of the Swedish University of Agricultural Sciences, Uppsala, Sweden
Professor Wim J.M. Heijman Wageningen University, the Netherlands
Professor Maria Parlinska Warsaw University of Life Sciences, Poland
Professor Csaba Forgacs Corvinus University of Budapest, Hungary
Professor Aina Dobele Department of Entrepreneurship and Management of the Faculty of Economics of Latvia University of Agriculture, Latvia
Professor Liga Mihejeva Department of Entrepreneurship and Management of the Faculty of Economics of Latvia University of Agriculture, Latvia
Associate professorBruna Maria Zolin
Department of Economic Sciences, University of Venice, Italy
Associate professorJonas Jasaitis
Siauliai University, Lithuania
Associate professorAndra Zvirbule-Berzina
Head of the Department of Entrepreneurship and Management of the Faculty of Economics of Latvia University of Agriculture, Latvia
Associate professorInguna Leibus
Department of Accounting and Finance of the Faculty of Economics of Latvia University of Agriculture, Latvia
Associate professorModrite Pelse
Head of Department of Economics of the Faculty of Economics of Latvia University of Agriculture, Latvia
The chief facilitator and project leader – associate professor Andra Zvirbule-Berzina

Economic Science for Rural Development Nr. 28., 2012
ISSN 1691-3078
4
L. Rantamäki-Lahtinen Turning Rural Potential into Success
1-10
Editorial Board
The Editorial Board of the edition of the International Scientiic Conference Proceedings:
Professor Baiba Rivza LatviaProfessor Irina Pilvere Latvia Professor Bartosz Mickiewicz Poland
Professor Maria Parlinska Poland
Professor Vilija Alekneviciene LithuaniaProfessor Barbara Freytag-Leyer GermanyProfessor Jacques Viaene BelgiumProfessor Bo Öhlmer SwedenProfessor Wim J.M. Heijman the Netherlands
Professor Csaba Forgacs HungaryProfessor Aina Dobele LatviaAssociate professor Bruna Maria Zolin Italy
Associate professor Andra Zvirbule-Berzina LatviaAssociate professor Gunita Mazure Latvia
Editor – in-chief Associate professor Andra Zvirbule-Berzina
Responsible compilers of the proceedings: Associate professor Gunita Mazure
Lecturer Zanete Gruzina
Assistants to the responsible compilers: Dzesija Zeiferte
Agnese Radzele-Sulce
Language editor: Gunita Mazure
Layout designer: Agnese Radzele-Sulce

5
Economic Science for Rural Development Nr. 28., 2012
ISSN 1691-3078
L. Rantamäki-Lahtinen Turning Rural Potential into Success
1-10
Reviewers
Every article included into the Proceedings was subjected to a scientiic, including international review.
All reviewers were anonymous for the authors of the articles.The following 89 reviewers from scientiic and academic institutions of 7 countries (Estonia,
Finland, Hungary, Latvia, Lithuania, Poland, and the Czech Republic) have written 206 reviews.
Dzintra Atstaja Dr.oec., assoc. prof. (School of Business and Finance, Latvia)
Anita Auzina Dr.oec., assoc. prof. (Latvia University of Agriculture, Latvia)
Stanislaw Bagienski Dr.hab., prof. nadz. (Warsaw University of Life Sciences, Poland)
Konstanins Benkovskis Dr.oec., lecturer (Stockholm School of Economics in Riga, Latvia)
Dainis Berjoza Dr.ing., assoc. prof. (Latvia University of Agriculture, Latvia)
Veronika Bikse Dr.oec., prof. (University of Latvia, Latvia)
Ligita Bite Dr.oec., assist. prof. (Latvia University of Agriculture, Latvia)
Vera Boronenko Dr.oec. (Daugavpils University, Latvia)
Ieva Brence Dr., assoc. prof. (Latvian Academy of Sciences, Latvia)
Inta Bruna Dr.oec., prof. (University of Latvia, Latvia)
Veronika Bugina Dr.oec., prof. (Latvia University of Agriculture, Latvia)
Andrzej Czyzewski Dr.hab., prof. (Poznan University of Economics, Poland)
Alina Danilowska Dr.hab., prof. (Warsaw University of Agriculture, Poland)
Rimantas Dapkus Dr., assoc. prof.( Kaunas University of Technology, Lithuania)
Vija Dislere Dr.paed., assoc. prof., (Latvia University of Agriculture, Latvia)
Aina Dobele Dr.oec., prof. (Latvia University of Agriculture, Latvia)
Aija Eglite Dr.oec., assoc. prof. (Latvia University of Agriculture, Latvia)
Justyna Franc-Dabrowska Dr.hab., adjunct prof. (Warsaw University of Life Sciences, Poland)
Ineta Geipele Dr.oec., prof. (Riga Technical University, Latvia)
Barbara Golebiewska PhD hab. (Warsaw University of Life Sciences, Poland)
Jaroslaw Golebiewski Dr.hab. (Warsaw University of Life Sciences, Poland)
Gunta Grinberga-Zalite Dr.oec., assist. prof. (Latvia University of Agriculture, Latvia)
Inguna Gulbe Dr.oec.(Latvian State Insitute of Agrarian Economics, Latvia)Māra Gulbe Dr.math., assoc. prof. (University of Latvia, Latvia)
Uldis Ivans Mg.oec., assoc. prof. (Latvia University of Agriculture, Latvia)
Ingrida Jakusonoka Dr.oec., prof. (Latvia University of Agriculture, Latvia)
Elita Jermolajeva Dr.oec., assoc. prof. (Daugavpils University, Latvia)
Helma Jirgena Dr.oec., assoc. prof. (Insitute of Economics by Latvian Academy of Sciences, Latvia)Inara Jurgena Dr.oec., assoc. prof. (Latvia University of Agriculture, Latvia)
Janis Kakins Dr.oec., assoc. prof. (Latvia University of Agriculture, Latvia)
Leif Kalev PhD, assoc. prof. (Tallin University, Estonia)
Laszlo Karpai Dr., PhD (Budapest Business School, Hungary)
Bogdan Klepacki Dr.hab., prof. (Warsaw University of Life Sciences, Poland)
Evija Kopeika Dr.oec., assist. prof. (Latvia University of Agriculture, Latvia)
Vulfs Kozlinskis Dr.habil.oec., prof. (Riga Internaional School of Economics and Business Administraion, Latvia)
Zaiga Krisjane Dr.geogr., prof. (University of Latvia, Latvia)
Gediminas Kuliesis Dr. (Lithuanian Insitute of Agrarian Economics, Lithuania)Marika Laizane-Jurkane Dr.sc.pol. (University of Latvia, Latvia)
Olga Lavrinenko Dr.oec. (Daugavpils University, Latvia)
Inguna Leibus Dr.oec., assoc. prof. (Latvia University of Agriculture, Latvia)
Sviesa Leitoniene Dr., assoc. prof.( Aleksandras Stulginskis University, Lithuania)
Linda Leja M.Sc. (the Ministry of Environmental Protecion and Regional Development, Latvia)

Economic Science for Rural Development Nr. 28., 2012
ISSN 1691-3078
6
3-13
L. Rantamäki-Lahtinen Turning Rural Potential into Success
1-10
Agita Livina Dr.oec., assoc. prof.( Vidzeme University of Applied Sciences, Latvia)
Valdemaras Makutenas Dr., assist. prof.( Aleksandras Stulginskis University, Lithuania)
Gunita Mazure Dr.oec., assoc. prof. (Latvia University of Agriculture, Latvia)
Bartosz Mickiewicz PhD., prof. (West Pomeranian University of Technology in Szczecin, Poland)
Liga Mihejeva Dr.oec., prof. (Latvia University of Agriculture, Latvia)
Tatjana Muravska Dr.oec., prof. (University of Latvia, Latvia)
Aina Muska Dr.oec., assoc. prof. (Latvia University of Agriculture, Latvia)
Grigorijs Olevskis Dr.hab.oec., prof. (University of Latvia, Latvia)
Liga Paura Dr.sc.agr., assoc. prof. (Latvia University of Agriculture, Latvia)
Modrite Pelse Dr.oec., assoc. prof. (Latvia University of Agriculture, Latvia)
Irina Pilvere Dr.oec., prof. (Latvia University of Agriculture, Latvia)
Dina Popluga Dr.oec., assist. prof. (Latvia University of Agriculture, Latvia)
Arturs Praulins Dr.oec. (Latvian State Insitute of Agrarian Economics, Latvia)Agnese Radzele-Sulce Dr.oec., assist. prof. (Latvia University of Agriculture, Latvia)
Viktorija Rankevica Dr.oec., assoc. prof. (School of Business and Finance, Latvia)
Priit Sander PhD (Tartu University)
Linda Silina Dr.oec., assist. prof. (Latvia University of Agriculture, Latvia)
Inga Sina Dr.oec. (University College of Economics and Culture, Latvia)
Timo Sipiläinen PhD, assist. prof. (University of Helsinki, Finland)
Tomasz Siudek Dr., assist. prof. (Warsaw University of Life Sciences, Poland)
Peteris Skinkis Dr.geogr., assoc. prof. (University of Latvia, Latvia)
Teodor Skotarczak Dr.hab., prof. (West Pomeranian University of Technology in Szczecin, Poland)
Marin Soucek Ing. Ph.D. (Mendel University in Brno, Czech Republic)
Evelina Spakovica Dr.oec., assist. prof. (Latvia University of Agriculture, Latvia)
Ilze Sproge Dr.sc.administr., assist. prof. (ISMA Graduate School, Latvia)
Neringa Stonciuviene Dr., prof.( Aleksandras Stulginskis University, Lithuania)
Evita Straumite Dr.sc.ing. (Latvia University of Agriculture, Latvia)
Aivars Strautnieks Dr.oec., assoc. prof. (emeritus) (Latvia University of Agriculture, Latvia)
Voldemars Strikis Dr.agr., prof. (Latvia University of Agriculture, Latvia)
Romena Sulca Dr.oec., assist. prof. (Latvia University of Agriculture, Latvia)
Tatjana Tambovceva Dr.oec., assoc. prof. (Riga Technical University, Latvia)
Elga Tilta Dr.oec. (Insitute of Economics by Latvian Academy of Sciences, Latvia)Ilze Upite Dr.oec., assist. prof. (Latvia University of Agriculture, Latvia)
Vasilijs Usinovs Dr.sc.ing. (Research Insitute of Agriculture Machinery, Latvia University of Agriculture, Latvia)
Rando Värnik PhD., prof. (Estonian University of Life Sciences. Estonia)
Dainis Viesturs Dr.vc.ing. (Research Insitute of Agriculture Machinery, Latvia University of Agriculture, Latvia)
Dace Viksne Dr.oec., assist. prof. (Latvia University of Agriculture, Latvia)
Anastasija Vilcina Dr.oec., prof. (Latvia University of Agriculture, Latvia)
Raina Vira Dr.paed., assoc. prof.(Riga Internaional School of Economics and Business Administraion, Latvia)
Irija Vitola Dr.oec., prof. (Latvia University of Agriculture, Latvia)
Inesa Voroncuka Dr.oec., prof. (University of Latvia, Latvia)
Jekaterina Voznuka Dr.oec., assist. prof. (Balic Internaional Academy, Latvia)Bogdan Wawrzyniak Dr.hab., prof. (University of Technology and Life Sciences in Bydgoszcz, Poland)
Ludwik Wicki Dr.hab. (Warsaw University of Agriculture, Poland)
Lajos Zoltan Bakucs Dr. (Hungarian Academy of Sciences, Hungary)
Anda Zvaigzne Dr.oec., assist. prof. (Latvia University of Agriculture, Latvia)
Andra Zvirbule-Berzina Dr.oec., assoc. prof. (Latvia University of Agriculture, Latvia)

7
Economic Science for Rural Development Nr. 28., 2012
ISSN 1691-3078
3-131-10
L. Rantamäki-Lahtinen Turning Rural Potential into Success
Foreword
Every year the Faculty of Economics, Latvia University of Agriculture holds the international scientiic conference “Economic Science for Rural Development” and publishes internationally reviewed papers of scientiic researches, which are presented at the conference. This year the conference is organised for the 13th year running and all the papers are published in English. Selected papers from the Proceedings are included into ISI Web of Knowledge database and the Faculty of Economics has applied also to Scopus database for including the Proceedings into this database.Researchers from various European countries representing not only the science of economics in the diversity of its sub-branches have contributed to the conference this year; they have expanded their studies engaging colleagues from social and other sciences, thus conirming inter-disciplinary and multi-dimensional development of the contemporary science. The conference is dedicated to topical themes of rural development; hence, the research results are published in three successive volumes (No. 27, 28, and 29). The irst volume of scientiic conference proceedings was published in 2000. Professors, doctors of science, associate professors, assistant professors, PhD students, and other researchers from the following higher education, research institutions, and professional organisations participate at the International Scientiic Conference held on April 26-27, 2012 and present their results of scientiic research: Agricultural University in CracowAlberta CollegeAleksandras Stulginskis UniversityCorvinus University of BudapestCouncil of Latvian Chamber of Commerce and IndustryDaugavpils UniversityEstonian University of Life SciencesFulda University of Applied SciencesInstitute of Economics and Social Sciences, Estonian University of Life SciencesInstitute of Economics by Latvian Academy of SciencesInstitute of Economics, Hungarian Academy of SciencesKaunas University of Technology Latvia University of AgricultureLatvian Academy of Agricultural and Forestry SciencesLatvian Academy of SciencesLatvian State Institute of Agrarian Economics Lithuanian Institute of Agrarian EconomicsMendel University in Brno Mykolas Romeris University Poznan University of EconomicsProfessional Association of Project Managers Research Institute of Agriculture Machinery, Latvia University of Agriculture Research Institute of Biotechnology and Veterinary Medicine “Sigra”Research Institute of Economics and Business State Revenue Service of LatviaRezekne Higher Education Institution Riga International School of Economics and Business AdministrationRiga Technical University Rural Support Service School of Business Administration Turiba School of Business and Finance Seinäjoki University of Applied Sciences Tallinn University Institute of Political Science and Governance Tartu University University College of Economics and Culture

Economic Science for Rural Development Nr. 28., 2012
ISSN 1691-3078
8
1-10
University of LatviaUniversity of Szczecin Ural State Mining University Valga County GovernmentVentspils University CollegeVidzeme University of Applied SciencesWageningen UniversityWarsaw University of Life SciencesWest Pomeranian University of Technology in Szczecin
The following topical themes have been chosen for the conference: — Production and co-operation in primary and secondary agriculture — Integrated and sustainable development — Finance and tax — Rural business economics and administration — Resources and sustainable consumption
The comprehensive reviewing of submitted scientiic articles has been performed on international and inter-university level to ensure that only high-level scientiic and methodological research results, meeting the requirements of international standards, are presented at the conference. Every submitted manuscript has been reviewed by one reviewer from the author’s native country or university, while the other reviewer came from another country or university. The third reviewer was chosen in the case of conlicting reviews. All reviewers were anonymous for the authors of the articles. Every author received the reviewers’ objections or recommendations. After receiving the improved (inal) version of the manuscript and the author’s comments, the Editorial Board of the conference evaluated each article.All the papers of the international scientiic conference “Economic Science for Rural Development” are arranged into the three following thematic volumes:
No. 27 Integrated and Sustainable Development
No. 28 Rural Business and Finance Rural Business Economics and AdministrationFinance and Tax
No. 29 Resources and Cooperation Resources and Sustainable ConsumptionProduction and Cooperation in Primary and Secondary Agriculture
The publishing of the Proceedings before the conference will promote exchange of opinions, discussions, and collaboration of economic scientists on the international level. The research results included into the Proceedings are available worldwide to any stakeholder.
The abstracts of the conference proceedings provided in English are submitted to the international databases:
Web of Knowledge, which is a uniied platform, that integrates all data and search terms. It provides access to the world’s leading citation databases, including powerful cited reference searching, the Analyse Tool, over 100 years of comprehensive backile and citation data. Web of Knowledge also delivers access to conference proceedings, patents, websites, and chemical structures, compounds and reactions. While other databases simply aggregate data, Web of Science information is carefully evaluated and selected. This time-tested approach helps conserve an institution’s resources and researchers’ time by delivering access to the most relevant resources. Web of Science offers a true cited reference index, which is still the best tool for discovery and the only method of retrieving accurate citation counts.

9
Economic Science for Rural Development Nr. 28., 2012
ISSN 1691-3078
AGRIS - International Information System for the Agricultural Sciences and Technology set up by the Food and Agriculture Organisation of the United Nations (FAO UN), and especially to the databases containing full research texts set up by the academic higher education institutions.
EBSCO Academic Search Complete is the world’s most valuable and comprehensive scholarly, multi-disciplinary full-text database with more than 8,500 full-text periodicals, including more than 7,300 peer-reviewed journals.
CABI PUBLISHING CAB ABSTRACTS database. CAB Abstracts gives researchers instant access to over 6.3 million records from 1973 onwards, with over 300,000 abstracts added each year. Its coverage of the applied life sciences includes agriculture, environment, veterinary sciences, applied economics, food science, and nutrition. CAB Abstracts is a comprehensive bibliographic database that covers worldwide literature from all areas of agriculture and related applied and life sciences. Published by CAB International, a division of CAB International, CABA is the world’s most comprehensive database in its ield containing 5 million entries of which 95% are supported by abstracts. Starting from 2009, part of entries is available as full-text periodicals.
The Conference Committee and editorial Board are open to comments and recommendations for the development of future conference proceedings and organisation of international scientiic conferences.
We would like to thank all the authors, reviewers, members of the Programme Committee and the Editorial Board as well as supporting staff for their contribution organising the conference.
On behalf of the conference organisersAndra Zvirbule-BerzinaAssociate professor of Faculty of EconomicsLatvia University of Agriculture

Economic Science for Rural Development Nr. 28., 2012
ISSN 1691-3078
10
3-13
Content
1. Rural Business Economics and Administration
Dzintra Atstaja,Dzineta Dimante,
Agita Livina
Public Activities in Developing Green Economy: Case Studies in Latvia
14
Tomas Balezentis,Irena Krisciukaitiene,
Alvydas Balezentis
Farming Eficiency Across the EU Member States and Farming Types: Frontier Benchmarking
20
Signe Balina,Sarmite Mickevica
Analysis of Competitiveness of Latvia’s ICT Service Sector 25
Zane Bulderberga,Irina Pilvere
Theoretical and Practical Aspects of Rural - Urban Typology 31
Mariusz Chadrzynski Milk Market in Poland - Selected Aspects of Functioning 38
Elge Gaule,Jolita Sinkiene
Role of Place Attractiveness for Local Economic Development
44
Žanete Gruziņa,Andra Zvirbule-
Berzina
Support Diversiication for Micro, Small and Medium SizeEnterprises in Zemgale Region
49
Jitka Kalabova,Jana Turčínková
Preferences of Consumers when Shopping for Regional Products
56
Sanita Klava Development and Structure of Latvian Agricultural FarmsAfter Joining The EU
61
Tatjana Kulikova Category Management as an Important Management Tool for Performance Enhancement of Rural Trade Enterprises
67
Arnis Lenerts,Irina Pilvere
Role of Land Resources in the Development of the Market of Renewable Energy Sources of Agricultural Origin in Latvia
73
Oliver Lukason Reasons of Firm Failures: Example of Estonian Agriculture,Forestry and Fishing Industries in 2002-2009
80
Heikki Makinen,Matti Ylatalo,
Matti Ryhanen
Farmer Characteristics, Farm Management andFinancial Performance on Finnish Dairy Farms
85
Zane Mistre,Anda Zvaigzne
Assessment of Development Scenarios forThe Regional Internal Communication and Information System of The Latvian Blood Donors Service
91
Liene Muhina EU Structural Funds for Tourism Development in Latvia 98
Aina Muska,Ligita Bite
Factors Affecting the Development of Catering Enterprises in Latvia
104
Zinta Zalite,Anita Auzina
Socio-Economic Value of State-Owned Forests and PotentialEconomic Solutions for Increasing it
112
Viktorija Zaluksne, Baiba Rivza
Place’s Image in Latvia and Peculiarities of Its Perception in the Context of Place Marketing
119
Aldona Zawojska Reputation of Public Administration: Agriculture-Related Agencies in Poland Seen Through Farmers’ Eyes
126

11
Economic Science for Rural Development Nr. 28., 2012
ISSN 1691-3078
3-13
A. Kārkliņš, I. Līpenīte Daži kūtsmēslu normatīvu izstrādes metodiskie aspekti
Rosita Zvirgzdina, Modrīte Pelse
Development Possibilities of Farms in Latvia 133
2. Finance and Taxes
Sandris Ancans Aspects of Inlation and Interest Rates in Latvia 140
Vilija Alekneviciene, Lina Martirosianiene
Agriculture Funding Measures in Lithuania: Demand andOpportunities
145
Vilija Alekneviciene, Neringa Stonciuviene,
Danute Zinkeviciene
Value Drivers of Multifunctional and Sustainable AgriculturalOrganisation: Cash Flow Discounting Approach
152
Iluta Berzina Elaboration and Approbation of Methodology for Estimating the Region-Wide Economic Signiicance of Tourism in National Parks of the Regions of Latvia
158
Irina Berzkalne,Elvira Zelgalve
Standard vs. Behavioural Finance:The Case of Capital Structure in Latvia
164
Katarzyna Boratyńska Predicting Bankruptcy of Selected Companies fromThe Polish Meat Sector
170
Alina Danilowska Cooperative Banks and a Problem of Adverse Selectionin Agricultural Credit Market
176
Wim Heijman,Johan van Ophem,
Urszula Bronisz
Regional Competitiveness, Social and Intellectual Capital 181
Aļona Irmeja,Inguna Leibus
State Aid for Self-Employed Persons in Latvia and Other European Union Member States
187
Anna Jesemchika Problematic Aspects of Financial Reporting in Latvia 194
Jelena Lacenko,Anna Jesemčika
Improvement of Internal Control System of Agricultural Enterprises
199
Gunita Mazure Mortgage Lending Market Development Tendencies Within the Context of Global Financial Crisis
205
Baiba Mistre,Aina Dobele,Ilva Rudusa
Elements of the System of Financing Social Transfers andAssessment of Factors Affecting Them in Latvia
211
Anatolijs Prohorovs,Ingrida Jakusonoka
Financing of Innovation System Development andAttraction of Private Capital
219
Michal Soliwoda Factors Inluencing Productivity of Tangible Fixed Assets in Dairy Cooperatives in Poland
225
Sandra Stucere, Gunita Mazure
Application of Immovable Property Tax inThe EU Baltic Sea Region Countries
231
Irija Vitola,Daiga Joma
Immovable Property Tax in Latvia: Problematic Aspects andPossibilities for Improvement
238

Economic Science for Rural Development Nr. 28., 2012
ISSN 1691-3078
12

13
Economic Science for Rural Development Nr. 28., 2012
ISSN 1691-3078
“ECONOMIC SCIENCE FOR RURAL DEVELOPMENT”
Proceedings of theInternational Scientiic Conference
RURAL BUSINESS AND FINANCE1. Rural Business Economics and Administration
Economic Science for Rural Development Nr. 28., 2012
ISSN 1691-3078
14
Atstaja et al. Public Activities in Developing Green Economy: Case Studies in Latvia
___________________________1 E-mail address: [email protected].
Public Activities in Developing Green Economy: Case Studies in Latvia
Dzintra Atstaja1, Dr.oec., associate professorBA School of Business and Finance
Dzineta Dimante, Dr.oec., assistant professorUniversity of Latvia
Agita Livina, Dr.oec., associate professor Vidzeme University of Applied Sciences
Abstract. The authors have analysed the implementation of public activities in several local municipalities in Latvia. The aim of the research is to identify the main driving forces and prerequisites for the development of green economy in local communities. Tasks of the research are to identify the main features of green economy, to study legislation regarding public involvement, to analyse the possibilities of public involvement in developing green economy, to study the current situation in selected local communities, and to suggest ways of tackling problems concerned and share best practices. The study is based upon in-depth interviews; data have been triangulated by the analysis of statistical data and observations. The results of the research demonstrate that public, when engaged in cooperation with local governments, can have a major impact upon development of green economy in local communities. Local governments that are responsive and supportive towards the activities have undergone by the local community experience higher level of public involvement in adapting to green economy principles. Often the initiative comes from small enthusiast groups or even individuals; thus, they may grow considerably, when supported by the local government. In some municipalities, the lack of a balance between business and environmental activist interests impedes the economic development. The discussion with entrepreneurs on cleaner technologies might help reduce environmental impact but still provide jobs for local people. Development of these skills and sharing of the best practices could be undertaken by the Latvian Association of Local and Regional Governments. Key words: public activities, green economy, local community, partnership, cooperation.JEL code: R11, Q01
Introduction Development of green economy is seen as today’s
response to the worldwide crises that are experienced during the past few years. Many people treat this as not only a inancial crisis but also as energy, environmental, food, and ethical value crisis. Radical changes in the production and consumption patterns faced by the present generation are necessary, and they also change the functioning of the economic system. Meanwhile, these fundamental changes are quite slow; the authors believe that a lot can be done on the local level to foster
cooperation between the local governments and the community.
The authors have analysed a number of case studies that pertain to diverse green economy development related issues by using in-depth interviews with different stakeholders. Apart from having purely academic objectives, the research is also aimed at promoting best practices among other local governments and the public in Latvia. Hence, the authors mainly focused on case studies relecting good practice and positive
examples.Content analysis was used to ind available political,
economic, infrastructure, and information instruments that facilitate the development of green economy in Latvia. Analysis of statistical data and observations were used to draw conclusions on public beneits from involvement in the development of green economy.
The Baltic Sea is a very precious resource for all countries of the region. Thus, simultaneously it is a particularly vulnerable ecosystem, which suffers from different economic activities in the sea and in the Baltic Sea basin countries. Therefore, for the analysis purposes the authors have selected Latvian municipalities located on the bank of rivers belonging to the Baltic Sea basin. The case studies involve the following municipalities: Sigulda and Valmiera located on the bank of the river Gauja as well as the territory of North Vidzeme Biosphere Reserve, which is located on the bank of river Gauja water basin; Jurmala - on the river bank of Lielupe, and Ikskile - on the river bank of Daugava.
Results and discussion 1. The concept of green economy
Green economy has become a frequently used term in the economic theory, politics, mass media, and speeches of well-known people. There are many versions of the contextual meaning behind the term that is closely linked to such concepts as: Green New Deal, green jobs, green stimulus, clean technologies, triple bottom line, new economy, low-carbon sustainable economy etc.
The United Nations Environmental Programme (UNEP) has deined green economy as “one that results
in improved human well-being and social equity, while
signiicantly reducing environmental risks and ecological scarcities. In its simplest expression, a green economy

15
Economic Science for Rural Development Nr. 28., 2012
ISSN 1691-3078
can be thought of as one which is low carbon, resource
eficient and socially inclusive” (UNEP, 2011).According to the UNEP, the key measures in
greening economy are: investment in natural capital, decarbonising of the economy, and creation of green jobs. The main areas for implementation of these changes are renewable energy, manufacturing, waste management, building, transport, tourism, and urban development (UNEP, 2011). Having combined the diverse views on green economy, the authors deined it as an economy with minimised impact of the economic activity upon the nature, by simultaneously providing a major share of active population with jobs, thereby, increasing public wellbeing. This might seem as a comeback to old-time technologies having lower environmental impact and making all people work hard. The authors hold that it is possible also with new and modern technologies designed for effective use of resources, waste and emission reduction, and making the human work easier. The severe social problems have been caused by high unemployment rates, especially in the rural areas, demand creation and maintenance of work places. In times when all resources are scarce, except for manpower, it should be used more eficiently. The development of a social security system and equitable distribution of beneits is not suficient for solving the problem with unemployment. To gain satisfaction, people need to develop their capabilities and feel useful for their family, community, and public. Latvia, likewise also other European countries, is experiencing the problem of human degradation, since people they are losing the sense of meaningful life, despite various social beneits and care facilities. This is a serious obstacle for sustainable development.
Green economy is also closely linked to the concept of sustainable development. Sustainable development requires that industrially developed countries seek steady state economy, which is characterised by more-durable goods with low rates of throughput, qualitative improvement, and non-growing population (H.Daly, 1991). Developing countries with their comparatively small impact upon environment deserve the possibility to solve the problems of poverty by economic development and actual growth. Transition economies are somewhere in-between. There is still the need for economic growth to solve problems of unemployment, poverty and social deprivation, whereas, the lower consumption levels might be an advantage under circumstances when change of consumption patterns is inevitable.
Latvia as a transition economy faces the dilemma of economic growth and reduction of environmental impact. On the one hand, Latvia can be considered quite a green country what is supported by statistical igures and compound sustainability indexes used worldwide. For example, forest covered territory in Latvia is around 50 per cent; greenhouse gas emission (GHG) in 2009 amounted only to 40 per cent of the 1990 levels (the lowest indicator in the EU) (European Union, 1995-2011); and Latvia is the only country from those listed in Annex I to the United Nations Framework Convention on Climate Change, with negative GHG emission (including emissions/removals from land use, land-use change and forestry) (UNFCCC, 2011). On the other hand, huge efforts are devoted to achieve rapid economic growth, develop manufacturing and increase exports that may
considerably increase the environmental impact, if it is not undergone in a smart way.
According to the authors, a preferable solution would be to maintain the average consumption at the current level as an informed choice for the sake of cleaner environment than striving hard to achieve higher level of income, by attempting to reduce the environmental impact only afterwards. Therefore, public efforts to facilitate environmentally friendly way of living and develop green economy are worth studying and sharing best practices worldwide.
2. Spatial planning in the Context of the EU policies
Spatial planning is one of the most powerful tools for local governments to promote public involvement in decision-making processes by also promoting green economy. The existing legislation in the EU and Latvia supports both these processes.
Important principles of spatial planning, considering the speciics of the Baltic Sea region, have been developed by the Vision and Strategies around the Baltic Sea 2010 (VASAB), an organisation, which was established in 1992. In 2009, the VASAB presented its Long Term Perspective for the Territorial Development of the Baltic Sea Region. The document underlines the ongoing heavy dependence of the Baltic Sea Region on oil resources and imported energy. These conditions strengthen the necessity for transnational spatial and development planning for the Baltic Sea Region in the context of green economy (VASAB 2010, 2009).
In the he European Union strategy “Europe 2020” sustainable growth is identiied as one out of three key goals for a resource eficient, greener, and more competitive economy (Europe 2020, 2011). The authors consider that all European spatial and regional planning
documents contain the principle of sustainability. The sustainability principle is crucial for developing green
economy in the entire European Union, including urban and rural areas. Spatial planning is a crucial legal tool for local governments to regulate the development of territories, including construction for production and service purposes.
3. Statutory commitment of public participation
The rights and duties of public involvement as provided for in the principle of openness, stating that the spatial plan is developed by public involvement, ensuring openness of information and decision making, is laid down in Section 4 of the Spatial Development Planning Law of the Republic of Latvia, effective as of 1 December 2011. The law provides that the responsible authority has the duty to provide information and ensure decision-making transparency, clarify public opinion and organise public participation in the territory
development planning, providing the widest possible and understandable information (Spatial Development Planning Law, 2011). The law aims to ensure that spatial development is planned in a manner to increase environmental quality of living and achieve sustainability by effective and eficient use of sites and other resources as well as ensuring a purposeful and balanced economic
Atstaja et al. Public Activities in Developing Green Economy: Case Studies in Latvia

Economic Science for Rural Development Nr. 28., 2012
ISSN 1691-3078
16
development. Although, spatial planning is a continuous process involving not only development and approval of a spatial plan but also information analysis on the changes required in the future, public participation is of episodic nature. Furthermore, usually public involvement is observed only if some spatial plan affects their personal interests. Having analysed the spatial planning materials that have been submitted to the Ministry of Environmental Protection and Regional Development, it is possible to conclude that only few submissions concern the interests of the entire society. Unfortunately, general public and NGO’s treat short-term, spontaneous episodes of involvement, like protests, as the most effective form of participation, although this does not speak for long-term constructive forms of collaboration requiring planning (Indriksone, 2007).
It is important to state that local governments may involve in the spatial planning process not only local
inhabitants of the relevant municipality but also people not living there, e.g. experts and NGOs. However, local governments should always keep in mind the aim of their activities – territorial local governments have been created and function to pursue identiied interests of local people living there. Therefore, territorial local governments should not subject to the pressure of some particular individuals or an organisation, thereby putting excessive burden upon the owners of land in the relevant municipality.
The scope of the Development Planning System Law (2008) is to promote sustainable and stable development of the state and to facilitate the improvement of quality of life for people living there. In order to analyse the performance of municipalities, a summary on the principles established in the applicable laws and regulations is presented in Table 1. The summary illustrates the possibilities of public participation and support towards green economy. The development plan should be based upon the key principles deined by these laws. Other principles, which supplement or specify the development principles of some particular economic sector should be deined in the laws regulating the relevant sector.
Public participation is essential for every decision
making process, whereas, for Latvia, especially topical is
involvement in the development of territorial development planning documents, development of nature protection plans, performance of environmental impact assessment (EIA) and strategic environmental impact assessment, and public discussion of construction plans (Gavena I., et al., 2011).
Public participation in Latvia is effectuated through formal (e.g. associations, foundations, trade-unions, employer organisations, religious organisations) and informal (unregistered initiative groups, interest groups) public organisations and private individuals (public
representatives). Analysis of the conducted interviews revealed that a precondition for involvement of local public in the development of green economy was the existence of an active community core, which is well-informed on the existing environmental problems and ready for change.
There are some common features of already approved spatial plans
— approved plans are a kind of compromise between the economic development, environmental protection and the majority of local people
choosing the best possible plan, keeping in
mind the reserved public attitude towards the economic development perspectives. Meetings, discussions and workshops are an integral part of the consultative work of spatial development planners who also assist in
collecting the necessary information, for delivering the message, deining problem
solutions by means of “collective wisdom”, and increasing trust and effective time management;
— many public recommendations are received for changing the territorial zoning from industrial to environmentally friendly. Slow settlement of ownership issues;
— there are no instruments available for municipalities to deal with slums that are in private ownership or measures to force completion of objects according to the approved plan;
— the plan developed as a result of public discussion is
an instrument for the implementation of a strategy approved by the local government;
Table 1
Development Planning Key Principles
Development Planning System Law (2008) Spatial Development Planning Law (2011)
1. The principle of sustainable development. 2. The principle of interest co-ordination. 3. The principle of participation.4. The principle of collaboration. 5. The principle of inancial possibilities. 6. The principle of openness. 7. The principle of supervision and assessment. 8. The principle of subsidiarity. 9. The principle of interconnection between development
planning and drafting of laws and regulations. 10. The principle of balanced development. 11. The principle of topicality. 12. The principle of document coordination.
1. The principle of sustainability. 2. The principle of succession. 3. The principle of equal possibilities. 4. The principle of continuity. 5. The principle of openness. 6. The principle of integrated approach. 7. The principle of diversity. 8. The principle of mutual coordination.
Source: Development Planning System Law (2008), Spatial Development Planning Law (2011)
Atstaja et al. Public Activities in Developing Green Economy: Case Studies in Latvia

17
Economic Science for Rural Development Nr. 28., 2012
ISSN 1691-3078
— the principle of caution is observed – no new solutions are likely to be implemented, in case the public identiies existence of some risk or unclear solutions, instead of lexible and contemporary solutions for the use of some territory, including those that might lead to green economy – as perceived by the planners.
4. Types and samples of partnershipsThe authors are giving an overview on the types
of partnerships and techniques, which could be used by public, NGOs and municipalities to promote and strengthen green economy activities. This overview is prepared based on the best practices and observations of
the authors. The authors have divided partnership types and techniques in three major groups: formal tools such as legislation, spatial planning, and landscape planning; informal tools such as discussion, public actions, public relation activities - as awareness of green economy; and sustainable strategic thinking.
Municipalities with higher level of public involvement apply all three partnership types and techniques. For example, Sigulda municipality considers that the most important tool for partnership and promotion of green economy is spatial plan including landscape planning, aiming at preservation of environmental values and speciic culture and history based elements. Municipality and community partnership examples to be named are implementation of the international project “Nature. Urban. Future”; municipal regulation to allow waste sorting only in the conined areas; responsiveness of the municipality towards public complaints and information posting. For example, if the local population have iled a complaint to the municipal authorities that some industrial company is creating excessive amounts of black smoke or that snow above heating mains is melting in the winter, there are follow-up actions by the municipality to verify and prove this information and to
ind solutions. Ikskile municipality is supporting the public incentive
to transform Ikskile into the irst Transition Town in the Baltic States. Transition Town is a movement started in Totnes, the United Kingdom (UK) in 2005 and that has gained much popularity in the UK, the USA, Canada, and Australia. The main objectives of the movement are promotion of independence from fossil fuels and reduction of GHG emissions by putting into practice the famous principle – think globally, act locally. The priorities deined by the municipality are culture environment and youth development. Municipality has two people’s centres, several sport teams, and art groups. There are several commissions established involving not only oficials but also public, which deal with green economy issues, e.g. Greenery Conservation Commission, Interest and Adult Informal Education Programmes Licensing Commission, Energy audits and Renovation Application Evaluation
Commission. Jurmala as a resort and attractive place for living
has to tackle public opinion conlicts. The municipality has double responsibility – development of the city and preservation of Jurmala as a resort of national importance. Active public involvement in Jurmala is observed regarding issues affecting private interests of
local population, for example, entrepreneurs supported the idea of a new resort and entertainment opportunities
because they saw changes in the zoning as a possibility for creating new job places. The local inhabitants, on their turn, were against such an idea, claiming that an entertainment zone would cause much noise and make peaceful living impossible. Many discussions concerned also nature territories: a group of people was collecting signatures to protect nature mounts, whereas, another group in Varnukrogs struggled hard to legalise their cottages, thereby, being allowed to perform construction in the nature territories.
A positive example for greener economy is the green light given by Jurmala municipality for a plan of SIA ‘‘Zalas tehnologijas’’ to recycle household waste in metantanks and produce biogas by reconstructing the former Sloka paper mill for this purpose. The plan foresaw production of biogas by recycling Jurmala water treatment plant sludge, imported green-mass, low quality grain, and Jurmala green-mass waste, for example, freshly mowed grass, fallen leaves and sea-sludge.
The municipality of Carnikava has also a number of cooperation examples with local community. The municipality has carried out a research on public consideration of the development strategy for 2010 – 2027. Another example to be named is the decision to introduce a tourism duty, passed in May 2011. The decision brought along an outburst of negative attitude from NGOs, tourism companies, the Ministry of Economics, and public. The example demonstrates the decision is accepted without discussion of tourism entrepreneurs and locals. After emergency meeting of Carnikava Council in July 2011, changes were accepted in the rules of tourism tax in November 2011. The authors’ conclusion is that it is necessary to encourage entrepreneurs, NGOs and society for advised activities.
Vidzeme University of Applied Sciences in Valmiera is implementing an international project “Creative Rooms”. The aim of the project is to create space for creative activities via lifelong learning activities. These activities are called “Green school classes” for individuals who would like to learn new skills, gain experience, and knowledge on green activities. The average number of participants is 30. The classes are open and take place in the Integrated Library of Valmiera. Valmiera Town Council has a long-term perspective to use biogas for public transport in Valmiera in the future. Biogas is produced by the waste management company “North Vidzeme Waste Management Organisation” in the polygon “Daibe” (Atstaja et al. 2011).
Since 2005, the North Vidzeme Biosphere Reserve Administration is implementing a monitoring programme the main scope of which is to involve local people including school children in the monitoring of nature environment. With the support of the United Nation Development Programme project, the administration has created a Public monitoring support group involved in awareness raising activities, presenting materials and organising workshops on nature for participants in public monitoring. The results demonstrated high interest from local people to get involved in these activities. Local libraries were involved in public monitoring programme as local support points (Druva-Druvaskalne et al, 2009).
The examples of strategic thinking in the abovementioned municipalities are consideration of well-being of people, comprehensive education of youth,
Atstaja et al. Public Activities in Developing Green Economy: Case Studies in Latvia

Economic Science for Rural Development Nr. 28., 2012
ISSN 1691-3078
18
and preservation of cultural and natural environment as regards all measures taken and long-term projects.
5. Results and beneits for public and municipalities
Analysing the case studies of Latvian municipalities, it was concluded that public participation prescribed by the law very often takes place only episodically, mainly to protect one’s own and not public interests. “Not in my backyard!” syndrome persists in many municipalities. Nevertheless, there are also good examples of public local involvement in planning processes and development of green economy initiatives – cleaner technology businesses, educational projects, eco-villages, collective cleanups etc.
The main beneit from involvement of a municipality in green economy is an increased welfare and better living conditions for its people. There is capacity for water treatment and social infrastructure in many municipalities to increase the number of users by cutting the average maintenance costs accordingly. Green management approach of municipalities could serve as a tool for gaining new people. For example, Sigulda municipality is experiencing positive natural population growth in the past three years and the birth rate in 2011 had gone up
by 25%.In Table 2, the authors have compared the research
results based upon the best practice in partnership of
green economy activities of several municipalities and the average indicators of Latvia. Table 2 demonstrates some sustainability indicators of the authors’ study (Livina et al., 2009). All studied local governments have approved spatial plans and the natural increase indicator per
1000 inhabitants was above the average in Latvia (-4.8 in 2010 and -3.7 in 2009) during the global economic crisis, except for Jurmala in 2009. The comparison of economically active statistical units in the market sector per 1000 inhabitants in 2009 and 2010 demonstrate an upward trend that speaks on increasing business and public activity. Although, the indicators of Jurmala and Carnikava as regards economically active statistical units in the market sector per 1000 inhabitants in 2010 is under the average that can be explained by the seasonal nature of the activity proile of these municipalities.
Conclusions, proposals, recommendations 1. Green economy is a way to solve the development
and environmental impact dilemma. While changes in the functioning of an economic system are very slow, local governments can promote green economy on the local level, thereby, contributing towards overcoming the crises the world is experiencing.
2. Green economy can be facilitated by support received from the public involvement. Changes in consumption patterns, local economy structure, and public attitude towards preservation of nature are matters of education, awareness, and ethics. Therefore, the priorities for reaching sustainability lie in comprehensive development of youth and interest education.
3. The Spatial Development Planning Law of the Republic of Latvia deines responsibility of a local municipality to involve public in spatial development planning process and the law determines to balance interests of sustainable territorial development between inhabitants and entrepreneurs. This is a formal partnership tool, which could be illed with informal tools as discussions, meetings, observation of place etc.
4. Local governments, which are responsive and support public participation not only formally but in practice, can beneit in multiple ways - increased number of population (considering the downward trend in the entire country) accounting for budget
income; increased economic activity with lower environmental impact; and improved health and living conditions of the local population.
5. The authors’ recommendation is to make use of all three types of partnership in practice and to involve
in municipal activities all possible stakeholders supporting green economy - local people, NGOs, entrepreneurs, libraries, education institutions etc.
Bibliography 1. Atstaja, D., Dimante, D., Brivers, I. et.al. (2011).
Vide un ekonomika (Environment and Economy). Monograph. Riga: University of Latvia Press, pp. 215-217.
Table 2
Characteristics of sustainability of certain indicators of case study territorial units
Territorial unit
Approved spatial plan
Natural increase per 1000 inhabitants
Market sector economically active statistical units per 1000 inhabitants
2009 2010 2009 2010
Jurmala In 1995; amended in 2010 -4.1 -4.2 44 46
Carnikava In 2005; amended in 2011 -0.2 -0.3 46 50
Sigulda Re-approved in 2009 1.8 0 58 61
Valmiera In 2007; amended in 2011 -0.6 -2.9 61 65
Ikskile In 2006 for Ikskile town; in 2009 for Tinuzi parish
5.4 2.4 52 61
Latvia - -3.7 -4.8 57 60
Source: MEPRD (2011), the Central Statistical Bureau of Latvia (2011)
Atstaja et al. Public Activities in Developing Green Economy: Case Studies in Latvia
19
Economic Science for Rural Development Nr. 28., 2012
ISSN 1691-3078
2. Cabinet Regulations No. 970 (2009). Public Participation Procedures for the Development Planning Process. Retrieved: http://www.likumi.lv/doc.php?id=197033. Access: 21 November 2011.
3. Cabinet Regulations No. 816 (2011). National Development Plan 2014-2020 Procedures of Development, Implementation, Monitoring and Public Consultation. Retrieved: http://www.likumi.lv/doc.php?id=238460&from=off. Access: 21 November 2011.
4. Central Statistical Bureau of Latvia (2011). Retrieved: http://www.csb.gov.lv/en/dati/statistics-database-30501.html. Access: 14 December, 2011.
5. Daly, H. (1991). Steady-State Economics. 2nd ed. Washington, DC: Island Press p. 302.
6. Development Planning System Law (2008). Retrieved: http://www.likumi.lv/doc.php?id=175748. Access: 21 November 2011.
7. Druva-Druvaskalne, I., Livina, A. (2009). Research “Indicators’ Assessment and Analysis of Sustainable Development Proile in North Vidzeme Biosphere Reserve”. Vidzeme University of Applied Sciences. p. 16.
8. European Regional/Spatial Planning Charter. Torremolinos Charter. (1983). Strasbourg: Council of Europe. Retrieved: http://www.coe.int/t/dg4/cultureheritage/heritage/cemat/versioncharte/Charte_bil.pdf. Access: 22 November 2011.
9. European Union (1995-2011). Eurostat Database. Retrieved: http://epp.eurostat.ec.europa.eu/tgm/table.do?tab=table&init=1&language=en&pcode=tsien010&plugin=1 Access: 15 December 2011.
10. Gavena, I., Jekale, I., Valdmane, I., Nikodemus, O. (2011). Pasvaldibas, iedzivotaju un uznemeju interesu saskanosana – sabiedriska apspriesana ka instruments (The Public Consultations as the Tool of Coordination of Interests
Municipalities, Residents and Business Interests), Methodological Material. Riga, VARAM, p. 70. Retrieved: http://www.varam.gov.lv/lat/publ/met/?doc=14074. Access: 12 December 2011.
11. Indriksone, A. (2008). Nevalstiskas organizacijas –
pasvaldibu partneri attistibas planosana (Non-
governmental Organisations – Partners in Local Development Planning). Retrieved: http://www.politika.lv/index.php?id=5704. Access: 21 November 2011.
12. Livina, A., Druva-Druvaskalne, I. (2009). The Sustainable Development Proile Structure in the Biosphere Reserve. In: Sustainable Planning Instruments and Biodiversity Conservation
(ed. Livina, A.). University of Latvia Press. p. 52.13. Ministry of Environmental Protection and Regional
Development (2011). Information of Spatial Plans of Local Governments. Retrieved: http://varam.gov.lv/lat/darbibas_veidi/tap/pasv/?doc=13378. Access: 14 December, 2011
14. Spatial Planning Law (2011). Retrieved: http://www.likumi.lv/doc.php?id=238807. Access: 21 November 2011.
15. UNFCCC (2011). Report on National Greenhouse Gas Inventory Data from Parties Included in Annex I to the Convention for the Period 1990–2009. Retrieved: http://unfccc.int/resource/docs/2011/sbi/eng/09.pdf. Access 26 December, 2011.
16. UNEP (2011). Towards a Green Economy: Pathways to Sustainable Development and Poverty Eradication. Green Economy Report. Retrieved: www.unep.org/greeneconomy. Access: 15 December 2011.
17. VASAB secretariat (2010). Long-Term Perspective for the Territorial Development of the Baltic Sea Region. Retrieved: http://www.vasab.org/conference/upload/dokumenti/vasab_ltp_inal.pdf. Access: 18 December 2011.
Atstaja et al. Public Activities in Developing Green Economy: Case Studies in Latvia

Economic Science for Rural Development Nr. 28., 2012
ISSN 1691-3078
20
T. Balezentis et al. Farming Eficiency Across the EU Member States and
Farming Types: Frontier Benchmarking
Farming Eficiency Across the EU Member States and Farming Types: Frontier Benchmarking
Tomas Balezentis1; Irena Krisciukaitiene, Dr.Lithuanian Institute of Agrarian Economics
Alvydas Balezentis, prof. Dr. Mykolas Romeris University
Abstract. Most of the Central and East European countries are still peculiar with relatively low eficiency and productivity of agriculture. This paper analyses farming eficiency in the selected European Union Member States during 2009. The aim of this study was to apply the benchmarking method and thus reveal the competitive advantages of the Lithuanian agricultural sector by comparing eficiency of different farming types. The data envelopment analysis was employed for the analysis. The results of analysis showed that for Lithuania, the most prospective farming types in terms of international competitiveness were those related to animal farming, namely, dairying (milk) and mixed farming.Key words: eficiency, productivity, farming types, European Union, data envelopment analysis.JEL code: C14, C61, Q13.
Introduction The effective decision-making aimed at sustainable
change requires appropriate benchmarking practices. More speciically, the sustainable change can be fostered through benchmarking-based comparative analysis, which enables to identify the best practices and thus, improve the situation. As Jack and Boone (2009) reported with reference to Bogan and English (1994), benchmarking could (i) create motivation for change; (ii) provide a vision for what an organisation can look like after change; (iii) provide data, evidence, and success stories for inspiring change; (iv) identify best practices for how to manage change; and (v) create a baseline or yardstick by which to evaluate the impact of earlier changes. Moreover, a steady growth in productivity and eficiency leads to non-inlationary economic growth, which, in turn, results in reduced unemployment rate and increased earnings.
The issue is of the particular importance in the area of the agricultural policy. As for the European Union (EU) Member States, it is important to streamline the structural and income support policies so that they lead to increase in eficiency as well as competitiveness of the agricultural sector (OECD, FAO, 2011). Therefore, the appropriate benchmarking system would improve the quality of decisions taken by farmers, farmer advisors, and policy makers.
Moreover, the Central and East European countries are speciic with relatively high importance of agriculture in the total economy. The latter inding makes agricultural policy especially important here. Usually, the benchmarking processes are based on Key Performance Indicators. Indeed, the multi–criteria assessment should be employed for the analysis, for these indicators are usually conlicting ones and should be considered simultaneously. There is, however, a lack of international comparison of farming eficiency across different farming types. Hence, this study focuses on farming eficiency of the different farming types across the EU Member States.
Data envelopment analysis (DEA) is suitable for the latter purpose. A number of studies have attempted to investigate the issues of eficiency and competitiveness (Krisciukaitiene et al., 2010). Indeed, DEA is a method widely applied for eficiency assessment in agriculture (Van Zyl et al., 1996; Odeck, 2009; Vinciuniene, Rauluskeviciene, 2009; Bojnec and Latruffe, 2008; Van Passel et al., 2009). Gorton and Davidova (2004) provided an overview of papers on farm productivity and eficiency. Rimkuviene et al. (2010), and Balezentis and Balezentis (2011) have performed an international comparison of the EU Member States’ achievements in rural development. Nevertheless, there is a lack of such comparison across different farming types.
The aim of this study is to apply the benchmarking method and thus reveal the competitive advantages of the Lithuanian agricultural sector by comparing eficiency of different farming types. More speciically, this paper focuses at the three Baltic States given they are speciic with similar geo-political environment as well as production structure. However, farming eficiency in these states is estimated in relative terms with respect to the EU-27 states. The object of the research – technical
eficiency of different farming types in the EU. The following tasks are set: 1) to describe the DEA method; 2) to deine variables identifying farming eficiency; and 3) to apply the DEA model when analysing eficiency of different farming types. The research is based on the Farm Accountancy Data Network (FADN) data covering the period of 2009 (European Commission, 2011). The DEA model was implemented by employing R language, namely, package Benchmarking (Bogetoft, Otto, 2011).
Results and discussion1. Preliminaries of DEA
DEA is a non-parametric method of measuring the eficiency of a decision–making unit (DMU) such as a irm or a public–sector agency. The very term of eficiency was initially deined by Debreu and then by Koopmans. ___________________________
1 E-mail address: [email protected]

21
Economic Science for Rural Development Nr. 28., 2012
ISSN 1691-3078
Debreu discussed the question of resource utilisation at the aggregate level, whereas Koopmans offered the following deinition of an eficient DMU: A DMU is fully eficient if and only if it is not possible to improve any input or output without worsening some other input
or output. Due to similarity to the deinition of Pareto eficiency, the former is called Pareto–Koopmans Eficiency. Finally, Farrell summarised research of Debreu and Koopmans, thus, offering frontier analysis of eficiency and describing two types of economic
eficiency, namely, technical eficiency and allocative
eficiency (indeed, a different terminology was used at that time). The concept of technical eficiency is deined as the capacity and willingness to produce the maximum possible output from a given bundle of inputs and technology, whereas the allocative eficiency relects the ability of a DMU to use the inputs in optimal proportions, considering respective marginal costs. However, Farrell did not succeed in handling Pareto–Koopmans Eficiency with a proper mathematical framework.
The modern version of DEA originated in studies of A. Charnes, W. W. Cooper and E. Rhodes. Hence, these DEA models are called CCR models. Initially, the fractional form of DEA was offered. However, this model was transformed into input– and output–oriented multiplier models, which could be solved by means of the linear programming (LP). In addition, the dual CCR model (i. e. envelopment program) can be described for each of the primal programs.
Unlike many traditional analysis tools, DEA does not require to gather information about prices of materials or produced goods, thus making it suitable for evaluating
both private– and public–sector eficiency. Suppose that there are 1,2,..., ,...,j t N= DMUs, each producing
1, 2,...,r m= outputs from 1,2,...,i n= inputs. Hence, DMU t exhibits input–oriented technical eficiency
tθ , whereas output–oriented technical eficiency is a reciprocal number 1/t tθ φ= . The output–oriented technical eficiency tϕ may be obtained by solving the following multiplier DEA program:
(1)
In Equation (1), coeficients jλ are weights of peer DMUs. Noteworthy, this model presumes the existing constant returns to scale (CRS), which is rather arbitrary condition. CRS indicates that the manufacturer is able to scale the inputs and outputs linearly without increasing or decreasing eficiency.
Whereas, the CRS constraint was considered over–restrictive, the BCC (Banker, Charnes, and Cooper) model was introduced. The CRS presumption was overridden
by introducing a convexity constraint 1
1N
j
j
λ=
=∑ , which
enabled to tackle the variable returns to scale (VRS). The BBC model, hence, can be written as follows:
(2)
The best achievable input can therefore be calculated
by multiplying actual input by technical eficiency of certain DMU. On the contrary, the best achievable output is obtained by dividing the actual output by the same technical eficiency 1/t tθ φ= , where tφ is obtained
from Equation (2). The difference between the actual output and the potential one is called slack. In addition, it is possible to ascertain whether a DMU operates under increasing returns to scale (IRS), CRS, or decreasing returns to scale (DRS). CCR measures gross technical eficiency (TE) and, hence, resembles both TE and scale eficiency (SE), whereas BCC represents pure TE. As a result, pure SE can be obtained by dividing CCR TE by BCC TE. Noteworthy, technical eficiency describes the eficiency in converting inputs to outputs, while scale eficiency recognises that economy of scale cannot be attained at all scales of production.
2. Comparison of farming eficiency in Lithuania and selected countries
As it was mentioned before, our analysis was based on the FADN data. More speciically, the TF8 farming type classiication was employed for the analysis. The latter classiication deines the following eight farming types: Fieldcrops; Horticulture; Wine; Other permanent crops; Milk; Other grazing livestock; Granivores; and Mixed. In addition, the aggregate category (Total) is deined for each Member State. Considering wine is not produced in the Baltic States, the authors did not take into account the latter farming type. Thus, the total number of observations accounted for 170
(8 farming types x 27 Member States minus 46 missing observations).
The farming eficiency was estimated in terms of input and output indicators. The following input indicators
T. Balezentis et al. Farming Eficiency Across the EU Member States and Farming Types: Frontier Benchmarking

Economic Science for Rural Development Nr. 28., 2012
ISSN 1691-3078
22
covered the land, labour, and capital factors employed in agricultural production: utilised agricultural area
(UAA) in hectares (ha), total labour in Annual Working Units (AWU), total assets in EUR, and intermediate consumption in EUR. The output indicators identify crop, livestock, and other output (in EUR). The applied output decomposition enabled to distinguish between different production structures speciic to certain farming types. The DEA minimises input and maximises output indicators when calculating eficiency scores.
The R package Benchmarking (Bogetoft, Otto, 2011) was employed for DEA computations described in the antecedent section. More speciically, the output-oriented DEA model was applied, for agricultural producers can increase outputs by means of modernisation, whereas inputs are less likely to be altered.
The main indings are presented in Figure 1, which depicts VRS technical eficiency across the three Baltic States and Poland. In this case, Poland was chosen as the most proximate state peculiar with similar geo-political environment. The last group of columns in
Figure 1 describes the overall technical eficiency of farming in the enumerated states. More speciically, Latvia was ranked the irst (TE=0.7), whereas Estonia (TE=0.67), Lithuania (TE=0.62), and Poland (TE=0.6) remained behind. As for Lithuania, the most eficient farming types were horticulture (TE=0.81), other permanent crops (fruit and permanent crops combined; TE=0.79), milk (TE=0.74), and mixed farming (TE=0.7), in that order. Meanwhile, other permanent crop farming and granivore farming appeared to be fully eficient in Estonia, whereas the same types plus dairying were fully
Source: authors’ estimations based on the FADN data (European Commission, 2011)
Fig. 1. Technical eficiency of various farming types across the selected states, 2009
Source: authors’ estimations based on the FADN data (European Commission, 2011)
Fig. 2. Technical eficiency and competitive advantage of various farming types in Lithuania, 2009
T. Balezentis et al. Farming Eficiency Across the EU Member States and Farming Types: Frontier Benchmarking

23
Economic Science for Rural Development Nr. 28., 2012
ISSN 1691-3078
eficient in Latvia. However, the FADN did not provide data for granivore farming in Lithuania and horticulture in Latvia.
These differences in TE, however, are impacted by the nature of different farming types. Hence, further analysis is needed for each particular farming type. For instance, the mean eficiency of granivore farming was 0.86, that of horticulture – 0.85, that of other permanent crops – 0.81, that of dairying – 0.71 etc. (as of 2009). The competitive advantages in this case can be revealed by comparing, for instance, Lithuanian TE and the
EU-27 TE for speciic farming type. The latter ratio and technical eficiency for each farming type are depicted in
Figure 2. As one can note, the highest competitive advantage was observed for mixed farming and
dairying. These farming types were more eficient than the average EU farm specialised in respective
area (ratios 1.12 and 1.04, respectively). The previously mentioned farming types—horticulture and other permanent crops (fruit and permanent crops combined—were also approaching the mean EU eficiency for certain farming type (ratios 0.95 and 0.97, respectively).
For Lithuania, the most prospective farming types in terms of international competitiveness are those related to cattle production, namely, dairying (milk) and mixed farming. Indeed, Lithuania is speciic with high availability of feed. Furthermore, the dairying sector underwent some kind of modernisation even before Lithuania acceded to the EU. Hence, milk products are being exported to both the EU and third countries, thus, constituting a stable source of income. The enumerated advantages, however, are likely to shrink in the future, mainly because of growing wages and other expenditures. In addition, the current absolute level of intermediate consumption might lead to high values of eficiency measures, albeit it is not suficient to provide momentum for Lithuanian farmers’ graduation in the commodity chain. Noteworthy, the increased activity of animal farming would in turn lead to increase in demand for feed. To conclude, the new Rural Development Programme as well as the agricultural policy in general should be focused on support of the
farming types, which contribute to increase in export.
Conclusions 1. The farming eficiency was estimated in terms of
input and output indicators. The output-oriented data envelopment analysis model was applied for the analysis. Comparison of the selected EU Member States showed that the Latvian agricultural sector was ranked the irst (TE=0.7), whereas Estonia (TE=0.67), Lithuania (TE=0.62), and Poland (TE=0.6) remained behind (as of 2009).
2. For Lithuania, the most prospective farming types in terms of international competitiveness are those related to animal farming, namely, dairying (milk) and mixed farming. Indeed, this situation is due to low production costs. Accordingly, the new Rural Development Programme as well as the agricultural policy in general should be focused on support of
the farming types, which contribute to increase in export. The public support could be delivered through income and structural support measures as well as
institutional alleviations (establishment of farmers’ markets).
3. The current level of intermediate consumption is relatively high in Lithuania if compared with other EU Member States. However, it still might not be suficient in absolute terms to modernise the agricultural production and, thus, successfully compete in the common market. In this context, the pressure on a more reasonable CAP payments’ distribution among the EU Member States becomes especially important.
4. The FADN practice can be improved by establishing the uniform estimation of input costs. For instance, labour costs and capital depreciation costs remain the most problematic issues. Thereafter, the allocative eficiency of farming could be estimated.
Bibliography 1. Alvarez, A., Arias, C. (2004). Technical Eficiency
and Farm Size: A Conditional Analysis. Agricultural
Economics. Volume 30, pp. 241–250.2. Balezentis, T., Balezentis, A. (2011). A Multi–Criteria
Assessment of the Relative Farming Eficiency in the European Union Member States. Zemes ukio
mokslai (Agricultural Sciences), Volume 18, Issue 3, pp. 125–135.
3. Bogan, C. E., English, M. J. (1994). Benchmarking
for Best Practices: Winning through Innovative
Adaptation. New York, McGraw-Hill. P. 312. 4. Bogetoft, P., Otto, L. (2011). Benchmarking with
DEA, SFA, and R. International Series in Operations Research and Management Science, Vol. 157. Springer. p. 351.
5. Bojnec, S., Latruffe, L. (2008). Measures of Farm Business Eficiency. Industrial Management &
Data Systems, Volume 108, Issue 2, pp. 258–270.
6. European Commission (2011). FADN Public Database. Retrieved: http://ec.europa.eu/agriculture/rica/database/database_en.cfm. Access: 6 January 2012.
7. Jack, L., Boone, J. (2009). Sustainable Change and Benchmarking in the Food Supply Chain. In: Jack, L. (Ed.). Benchmarking in Food and Farming. Gower. p. 132.
8. Krisciukaitiene, I., Tamosaitiene, A., Andrikiene, S. (2010). Lietuvos ukininku ukiu gamybinio potencialo kompleksinis vertinimas (Complex Assessment of Lithuanian Family Farms’ Productive Potential). Management Theory and Studies for Rural Business and Infrastructure Development, Issue 22(3), pp. 87–95.
9. Odeck, J. (2009). Statistical Precision of DEA and Malmquist Indices: A Bootstrap Application to Norwegian Grain Producers. Omega, Volume 37, Issue 5, pp. 1007–1017.
10. OECD, Food and Agriculture Organisation of the United Nations. (2011). OECD-FAO Agricultural
Outlook 2011-2020. OECD Publishing.11. Rimkuviene, D., Laurinaviciene, N., Laurinavicius, J.
(2010). ES saliu zemes ukio efektyvumo ivertinimas (Evaluation of Agricultural Eficiency in the EU Countries). Vagos: LZUU mokslo darbai [VAGOS:
T. Balezentis et al. Farming Eficiency Across the EU Member States and Farming Types: Frontier Benchmarking

Economic Science for Rural Development Nr. 28., 2012
ISSN 1691-3078
24
Scientiic Papers of LUA], Volume 87, Issue 40, pp. 81–89.
12. Van Passel, S., Van Huylenbroeck, G., Lauwers, L., Mathijs, E. (2009). Sustainable Value Assessments of Farms Using Frontier Eficiency Benchmarks. Journal of Environmental Management, Volume 90, pp. 3057–3069.
13. Van Zyl, J., Miller, B. R., Parker, A. (1996). Agrarian
Structure in Poland: The Myth of Large-Farm
Superiority. Policy Research Working Paper 1596. The World Bank. p. 47.
14. Vinciuniene, V., Rauluskeviciene, J. (2009). Lietuvos respondentinių ukininku ukiu techninio ir masto efektyvumo neparametrinis vertinimas (Technical and Scale Eficiency of Family Farms in Lithuania: A Non-Parametric Approach). Vagos: LZUU mokslo darbai [VAGOS: Scientiic Papers of LUA], Volume 85, Issue 38, pp. 39–46.
T. Balezentis et al. Farming Eficiency Across the EU Member States and Farming Types: Frontier Benchmarking

25
Economic Science for Rural Development Nr. 28., 2012
ISSN 1691-3078
S. Balina, S. Mickevica Analysis of Competitiveness of Latvia’s ICT Service Sector
___________________________1 E-mail address: [email protected].
Analysis of Competitiveness of Latvia’s ICT Service Sector
Signe Balina1, Dr.oec.; Sarmite Mickevica, Mg.sc. Faculty of Economics and Management, University of Latvia
Abstract. The recent economic and inancial crisis has again raised issues on organisation and industry competitiveness. The information and communication technologies (ICT) industry of Latvia is often mentioned as one of the industries with the highest potential in Latvia and seen as one of the future foundations of the country economy. However, there have been very few researches done on the industry competitive position in the country as well as research on future development forecasts in an extended manner from the perspectives of strategic forces and resource based view. The aim of this paper is to analyse Latvian ICT industry competitiveness using Porter ive forces model and resource based view models. The research will provide recommendations for strategy developments for individual organisations and the industry. The research includes literature review, exploratory interviews with experts of Latvian ICT industry, quantitative analysis, logical analysis, and generalisation. This paper contributes to organisations, which are taking strategic decisions on entering the ICT industry of Latvia and it will help shape strategies for the current ICT industry players in Latvia. The paper could be used by governmental institutions developing economic strategies of Latvia. Key words: ICT industry, industry analysis, competitiveness.JEL code: L86.
Introduction Information and communication technologies
are increasingly moving to the core of national competitiveness strategies globally, because of their power as a critical enabler of growth, development, and modernisation. Latvia is not an exception in this global race, and thus, ICT is deined as one of building blocks of information society and knowledge economy in Latvia.
Globally, ICT is the priority of many countries and best index to compare countries in information society and ICT developments area. It is “Networked readiness index” developed by the World Economic Forum and ISEAD business school. The index compares 138 countries, which are evaluated on 31 environment, 20 readiness and 20 usage components of ICT. In 2010 – 2011, the total rank of Latvia is 52 with the score of 3.9. The Baltic neighbours of Latvia are ranked higher: Estonia - 26 with the score of 4.8 and Lithuania - 42 with the score of 4.2 (Dutta, Mia, 2011).
The National Development Plan of Latvia 2007-2013 deines ICT as one of the prerequisites for successful national priorities: an educated and creative individual, technological excellence, and lexibility of companies, and the development of science and research.
Competitiveness of local ICT industry is an important area for reaching long-term priorities of information society development, since the ICT industry is delivering strategic resource for the entire society to reach
sustainable development and improve living standards. Basically, ICT industry is delivering key commodity of knowledge economy on the national level. National development of information society is as effective as the ICT industry is capable to innovate and deliver required products and services. So, competitiveness of local ICT industry should be considered when prioritising resources for particular industry support on the
national level.
Theoretical foundation of competitiveness analysis
National prosperity does not grow from labour, natural resources, and interest rates as insist traditional economists. A nation’s competitiveness depends on industry capacity to innovate and upgrade (Porter, 2008). Competitiveness should be sustainable and based on competitive advantage. According to Barney (1991), competitive advantage is when a company is implementing value creating strategy not simultaneously being implemented by any current or potential competitors; while sustained competitive advantage is when value creating strategy is not simultaneously being implemented by any current or potential competitors and when these other companies are unable to duplicate the beneits of this strategy.
Traditional industry analysis can be made using Porter’s ive competitive forces model that captures essential division of value between the current and potential industry players. This model may be used to determine the ultimate proit potential in the ICT industry measured in terms of long-run return on invested capital as well as industry structure provides snapshot of the rules of the game of industry (Porter, 1998). Porter model assumes that companies within an industry or within a strategic group are identical in terms of the strategically relevant resources they control and strategies they
pursue (Porter, 1981). Resource heterogeneity, which develops in an industry or group, will be very short lived because the resources that companies use to implement their strategies are highly mobile, for example, they can be bought or sold on factor markets (Barney, 1991).
Five forces model (Porter, 1998; Magretta, 2012) provides the evaluation of new entrants to industry, suppliers, buyers, substitutes, and rivalry among the existing industry players. Number of new entrants in industry depends on entry barriers, which typically are
Economic Science for Rural Development Nr. 28., 2012
ISSN 1691-3078
26
economies of scale, switching costs, capital requirements, brand identity, and products differences; access to distribution channels; cost advantages; technology intensity; and government policy. Another important factor to consider analysis potential of new entrants is the probability of retaliation of existing competitors. The more intense is the competition, the higher is the probability of retaliation from existing competitors. The following factors are sources of increased rivalry: slow industry growth, diverse competitors, numerous or equally balanced competitors, high exit barriers, lack of product differentiation or switching costs, and high ixed and storage costs.
Buyers are the third area to consider for analysis as buyers may force down prices, bargain for better quality and service, or play competitors off against each other. Buyer power constitutes buyer bargaining leverage and buyer price sensitivity. Buyer leverage is increased by low buyer concentration, especially in a fragmented industry, buyer volume, low switching costs of buyer, and ability of buyer to integrate backward or produce in-house as well as buyer has full information and availability of substitute products. Buyer price sensitivity is increased if product forms a high share of buyers total costs, buyer has low proit margins, product is standard, product is unimportant to quality of buyers’ product, and industry product does not save the buyer money. Thus, it is strategically important to ind buyer who possesses the least power, because that may improve the strategic position of an enterprise.
Supplier bargaining power may increase due to the following factors: suppliers are more concentrated than companies in the industry they sell to, lack of substitute products, industry is not an important customer of the supplier, suppliers product is an important input to buyers business, suppliers products are differentiated and/or they have built up switching costs, or suppliers group possess a credible threat of forward integration. Hence, substitute products should be considered when analysing industry. Pressure from substitute products will depend on relative price performance of substitutes, switching costs, and buyer propensity to substitute.
Industry context should be analysed by a simple industry fragmentation test (Porter, 1998): the industry is fragmented if top 4 companies have less than 40% of the market share. Fragmented industries have weak bargaining position with suppliers and buyers. The ways for enterprises to overcome fragmentation are specialisation, unique features or service, and focusing on bottom line by having low overhead, tight cost control, and attention to detail.
In research done by Rumelt (1991), one of key conclusions is that company’s speciic variables are more important than industry attractiveness. Thus, it is important to consider resource based view that combines external environment and enterprise resources when analysing competitiveness (Montgomery, Collis, 1995). Resource-based view of competitive advantage examines the link between company’s internal characteristics and performance. This model assumes that companies within an industry may be heterogeneous with respect to the strategic resources they control. Second, this model assumes that
these resources may not be perfectly mobile across companies, and thus, heterogeneity can be long lasting
(Barney, 1991).The resource-based view of the company pushes
value chain logic further, by examining the attributes that resources isolated by value chain analyses shall be
possessed in order to be sources of sustained competitive advantage. Thus, resources of a previous industry setting may be weakness, or simply irrelevant in a new industry setting (Barney, 1991).
Company’s resource shall have four attributes in order to hold potential of sustained competitive advantage (Barney, 1991; Foss, 1997):
— it shall be valuable, in the sense that it exploits opportunities and/or neutralises threats in a
company’s environment; — it shall be rare among a company’s current and
potential competition; — it shall be imperfectly imitable. Imperfectly imitable
resources can follow one or the combination of three reasons: (a) the ability of a company to obtain a resource is dependent upon unique historical conditions; (b) the link between the resources possessed by a company and a company’s sustained competitive advantage is casually ambiguous; and (c) the resources generating company’s advantage are socially complex;
— there cannot be strategically equivalent substitutes for this resource that are valuable but neither rare
nor imperfectly imitable.
Position of the ICT industry service sector in the economy of Latvia
In 2010, Latvia ICT industry contributed 3.6% of the total gross value added to the economy of Latvia. ICT industry comprises ICT manufacturing, ICT wholesale, and ICT services, thus, employing 17 900 persons in 2 899 enterprises with the turnover of LVL 1 452 million (Table 1). Further, the article analyses ICT service sector in details.
ICT services feature 6.34% of all service enterprises, 6.87% employed persons and 15.4% of value added in the service sector of Latvia. ICT services employ 82% of the industry employees and represent 84% of the enterprises. ICT services include software publishing, telecommunications, computer programming and consulting, data processing, hosting, web portals, and repair of computers and communication equipment.
Telecommunications is the biggest ICT service sector generating 68% of all ICT service revenues and 76% of all proits before taxes. During 2008-2010, there were established 394 new enterprises in the ICT service sector and 500 new employees entered this sector. Most of new enterprises or 64% were established in computer programming, consulting and related activities; followed by data processing, hosting and web services – 35% of new enterprises (Central Statistical Bureau of Latvia, 2011).
ICT industry in Latvia is back to the 2% growth in 2010 after the decline of turnover by 15% in 2009. Computer programming and consulting turnovers declined by 23% in 2009 and were back on the positive track by an annual growth of 6% in 2010. Data processing, hosting and web
S. Balina, S. Mickevica Analysis of Competitiveness of Latvia’s ICT Service Sector

27
Economic Science for Rural Development Nr. 28., 2012
ISSN 1691-3078
S. Balina, S. Mickevica Analysis of Competitiveness of Latvia’s ICT Service Sector
related business were most stable and even in 2009 their turnovers were growing by 2% and continue with the same trend by 27% growth in 2010. Only telecommunication sector of ICT service industry was still declining by 3% in 2010 (Central Statistical Bureau of Latvia, 2011).
ICT service sector has more variance in terms of value added and proitability depending on service activity of enterprise (Figure 1). Telecommunications is the most attractive service segment in the entire economy of Latvia generating LVL 540 thou. value added on average and LVL 168 thou. proit per enterprise on average. Computer programming and consulting ranks the 8th with the average value added per enterprise amounting to LVL 71.5 thou. and it is the 3rd by the
average proit of LVL 11.6 thou. per enterprise (Central Statistical Bureau of Latvia, 2012). Thus, ICT services are a very attractive sector in the economy of Latvia regarding proitability.
Personnel costs constitute the major cost position from the costs perspective. in 2010, personnel costs amounted to 39% of all value added in ICT service sector; although in telecommunications, the proportion of personnel costs in the value added was the lowest - 26%, while it was the highest in computer programming and consulting - 68%, and data processing and hosting – 54% (Central Statistical Bureau of Latvia, 2011). So, the ICT services, especially, computer programming, consulting, and data processing and hosting are dependent on personnel costs
and the quality of service employees.Comparing the average costs of an employee with
other activities of Latvia shows that the ICT services – telecommunications ranks the 1st with LVL 10 222 average costs per employee and computer programming ranks the 2nd with LVL 9 848 average costs per employee; thus, ICT services are experiencing higher costs of human resources (Central Statistical Bureau of Latvia, 2012). Reasons behind this are the lack of qualiied specialists on the market and high costs of developing such specialists in the companies. Telecommunications can be a different case, because they are the least dependent on people
resource, thus, they may be overspending for personnel compared with the average situation in Latvia.
Research and development infrastructure in the country is an important source for developing ICT innovations. The national level Research Centre on Information, Communications and Signal-processing Technologies and ICT Competence Centre are established in ICT sector (Balina, 2011). Yet, this development may not be suficient for Latvia to reach the level of Baltic neighbours and it could be more complicated to outperform them on global markets, since Estonia is currently one of the leaders among ICT innovators and Lithuania has already made signiicant investments into national technology park and incubator “Sunrise Valley”.
Competitive position and strategic resource availability analysis of the ICT service sector
The ICT service industry of Latvia is open to new entrants in most of the activities. In general, ICT services are the sector with low entry barriers, because an enterprise can be established by one industry specialist
with suficient know-how and some access to customers. This is very explicitly observed in statistics where 84% of all ICT enterprises are operating in service segment.
Mobile telecommunications is the only state regulated sector of ICT services with a limited number of players. Telecommunication sector, especially mobile and ixed line network providers, requires high upfront capital investments, thus, creating high entry barriers in this particular activity. Hence, the top enterprises of this sector are the largest enterprises in the country – Lattelecom and LMT (Table 2). In 2010, Top 5 enterprises were generating 65% of all turnovers, employing 40% of all employees, and providing 28% of all proits in telecommunications activity. Thus, telecommunication sector can be considered as consolidated; although, small enterprises operating in open niches of telecommunications markets are holding over 70% of the industry proits.
Table 1
Key indicators of the Latvian ICT sector enterprises in 2010
Number of enterprises
Number of persons employed
Turnover (mln. LVL)
ICT manufacturing 57 800 61
ICT wholesale 418 2 500 621
ICT services 2 424 14 600 770
Software publishing 34 100 3
Telecommunications 413 5 500 522
Computer programming, con sulting and related activities
1 285 6 400 173
Data processing, hosting and related activities, web portals
478 1 900 57
Repair of computers, peripheral equipment and communication equipment
214 700 15
ICT industry total 2 899 17 900 1 452 Source: Central Statistical Bureau of Latvia

Economic Science for Rural Development Nr. 28., 2012
ISSN 1691-3078
28
S. Balina, S. Mickevica Analysis of Competitiveness of Latvia’s ICT Service Sector
Buyers of telecommunications include local households, businesses, and the government. Buyer power is high in this market as services provided are similar. Service providers can differentiate themselves with investments in marketing and customer service by building their brands.
Internet based voice communications are the main substitute and competitor for this sector, thus, the key strategy for companies in this sector is to provide Internet service that has already been done by all key
players. At the same time, smaller enterprises are more lexible and they react to the changing market environment faster, because they are not holding long-term investments into telecommunication infrastructure,
thus, improving their proitability and return on capital investments.
Computer programming and consulting is the largest segment of ICT service sector in Latvia, and the entry barriers are the lowest here. On the contrary, rents are still higher in this sector as in other comparable services with high dependency on specialist know-how, for example, management consulting, advertising and marketing, and legal and accounting services. Certiication of specialists on speciic knowledge and experience of these specialists in different industries and project scales is
the entry barrier in this sector. Entry barriers are mainly proprietary knowledge of an individual or company, and switching costs of buyer from one computer software
Source: authors’ calculations based on the data of the Central Statistical Bureau of Latvia
Fig. 1. Comparison of average value added and proits of Latvia service activities, 2010
Table 2
Top ICT telecommunication sector players in Latvia, 2010
Turnover, 2010 (mln. LVL)
Proit, 2010 (th. LVL) Proitability, % Number of
employees
Lattelecom, SIA 130.29 19.24 14.77 1191
Latvijas Mobilais Telefons, SIA 125.63 30.46 24.25 435
Tele2, SIA 93.75 21.33 22.75 286
BALTCOM TV, SIA 11.72 1.2 10.23 184
BITE Latvija, SIA 27.31 -8.55 -31.32 134
Total 388.7 63.68 16.38 2230
Source: Diena-Bonier, 2012
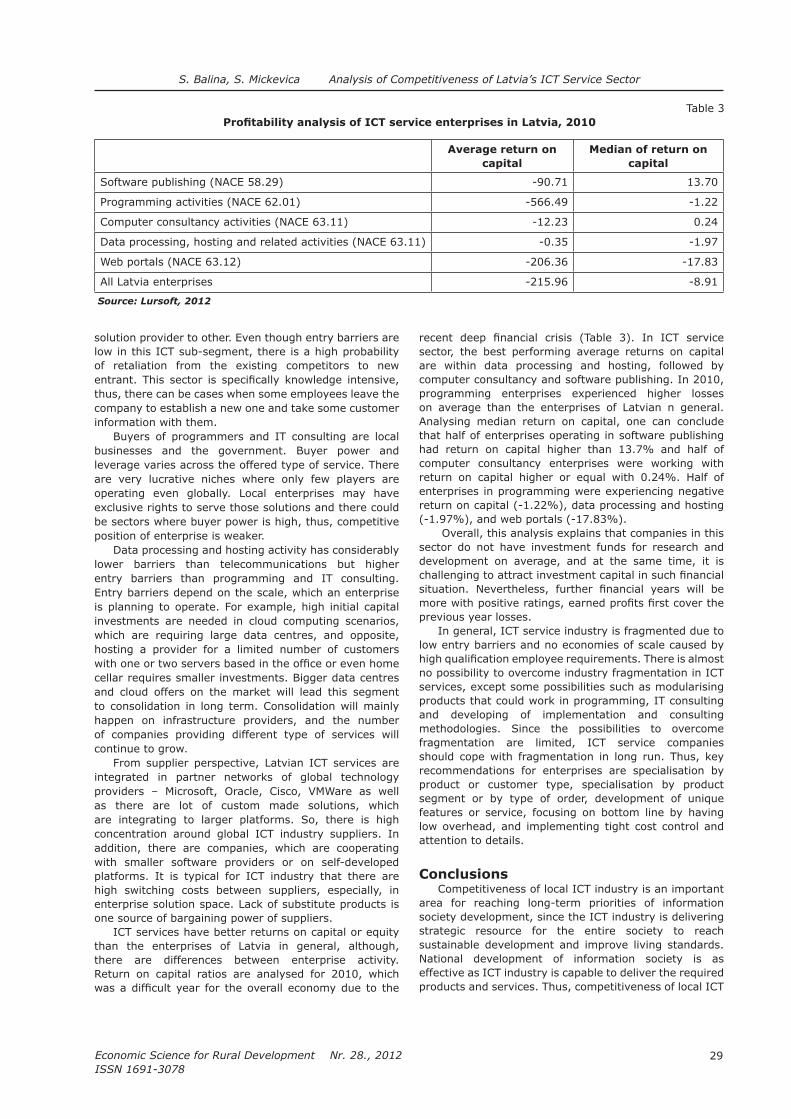
29
Economic Science for Rural Development Nr. 28., 2012
ISSN 1691-3078
S. Balina, S. Mickevica Analysis of Competitiveness of Latvia’s ICT Service Sector
solution provider to other. Even though entry barriers are low in this ICT sub-segment, there is a high probability of retaliation from the existing competitors to new entrant. This sector is speciically knowledge intensive, thus, there can be cases when some employees leave the company to establish a new one and take some customer information with them.
Buyers of programmers and IT consulting are local businesses and the government. Buyer power and leverage varies across the offered type of service. There are very lucrative niches where only few players are operating even globally. Local enterprises may have exclusive rights to serve those solutions and there could be sectors where buyer power is high, thus, competitive position of enterprise is weaker.
Data processing and hosting activity has considerably
lower barriers than telecommunications but higher entry barriers than programming and IT consulting. Entry barriers depend on the scale, which an enterprise is planning to operate. For example, high initial capital investments are needed in cloud computing scenarios, which are requiring large data centres, and opposite, hosting a provider for a limited number of customers with one or two servers based in the ofice or even home cellar requires smaller investments. Bigger data centres and cloud offers on the market will lead this segment to consolidation in long term. Consolidation will mainly happen on infrastructure providers, and the number of companies providing different type of services will continue to grow.
From supplier perspective, Latvian ICT services are integrated in partner networks of global technology providers – Microsoft, Oracle, Cisco, VMWare as well as there are lot of custom made solutions, which are integrating to larger platforms. So, there is high concentration around global ICT industry suppliers. In addition, there are companies, which are cooperating with smaller software providers or on self-developed
platforms. It is typical for ICT industry that there are high switching costs between suppliers, especially, in enterprise solution space. Lack of substitute products is one source of bargaining power of suppliers.
ICT services have better returns on capital or equity than the enterprises of Latvia in general, although, there are differences between enterprise activity. Return on capital ratios are analysed for 2010, which was a dificult year for the overall economy due to the
recent deep inancial crisis (Table 3). In ICT service sector, the best performing average returns on capital are within data processing and hosting, followed by computer consultancy and software publishing. In 2010, programming enterprises experienced higher losses on average than the enterprises of Latvian n general. Analysing median return on capital, one can conclude that half of enterprises operating in software publishing had return on capital higher than 13.7% and half of computer consultancy enterprises were working with return on capital higher or equal with 0.24%. Half of enterprises in programming were experiencing negative return on capital (-1.22%), data processing and hosting (-1.97%), and web portals (-17.83%).
Overall, this analysis explains that companies in this sector do not have investment funds for research and development on average, and at the same time, it is challenging to attract investment capital in such inancial situation. Nevertheless, further inancial years will be more with positive ratings, earned proits irst cover the previous year losses.
In general, ICT service industry is fragmented due to low entry barriers and no economies of scale caused by high qualiication employee requirements. There is almost no possibility to overcome industry fragmentation in ICT services, except some possibilities such as modularising products that could work in programming, IT consulting and developing of implementation and consulting methodologies. Since the possibilities to overcome fragmentation are limited, ICT service companies should cope with fragmentation in long run. Thus, key recommendations for enterprises are specialisation by product or customer type, specialisation by product segment or by type of order, development of unique features or service, focusing on bottom line by having low overhead, and implementing tight cost control and attention to details.
ConclusionsCompetitiveness of local ICT industry is an important
area for reaching long-term priorities of information society development, since the ICT industry is delivering strategic resource for the entire society to reach
sustainable development and improve living standards. National development of information society is as effective as ICT industry is capable to deliver the required products and services. Thus, competitiveness of local ICT
Table 3
Proitability analysis of ICT service enterprises in Latvia, 2010
Average return on capital
Median of return on capital
Software publishing (NACE 58.29) -90.71 13.70
Programming activities (NACE 62.01) -566.49 -1.22
Computer consultancy activities (NACE 63.11) -12.23 0.24
Data processing, hosting and related activities (NACE 63.11) -0.35 -1.97
Web portals (NACE 63.12) -206.36 -17.83
All Latvia enterprises -215.96 -8.91
Source: Lursoft, 2012

Economic Science for Rural Development Nr. 28., 2012
ISSN 1691-3078
30
S. Balina, S. Mickevica Analysis of Competitiveness of Latvia’s ICT Service Sector
industry should be considered when prioritising resources for particular industry support on the national level.
ICT industry is already contributing signiicantly to the economy of Latvia and its contribution is expected to grow. Value added and proitability is higher than in the majority of other economic sectors of Latvia.
In telecommunications sector, the biggest threat is a substitute product, such as Internet based voice communications and lower entry barriers in the future that may lead this currently consolidated sector to fragmentation. To keep long-term competitiveness, key player of this sector should be focusing on keeping industry more consolidated and
avoiding fragmentation.In the rest of ICT services activities – software
publishing, programming, computer consultancy, data processing and hosting, and Internet portals – speciic knowledge and skills is a key to entering this business. As the overall ICT service industry is fragmented, companies in this sector should cope with fragmentation in long run, and the key recommendations for enterprises are specialisation by product or customer type, specialisation by product segment or by type of order, development of unique features or service, focusing on bottom line by having low overhead, and implementing of tight cost control and attention to detail.
Bibliography 1. Balina, S. (2011). Development of Science and
Technology in Latvia, 2011. Riga: Ministry of Education and Science, Republic of Latvia, p. 143.
2. Barney, J. (1991). Firm Resources and Sustained Competitive Advantage. Journal of Management, Volume 17, No. 1, pp. 99-120.
3. Central Statistical Bureau of Latvia (2011). On the
Information Society of Latvia, 2011. Collection of
Statistical Data. Riga: Central Statistical Bureau of Latvia, p. 100.
4. Central Statistical Bureau of Latvia (2012). Databases of Central Statistical Bureau of Latvia: Economics and Finance. Retrieved: http://data.csb.gov.lv/DATABASE/ekin/databasetree.asp?lang=16. Access: 15 March 2012.
5. Diena-Bonnier in Cooperation with Lursoft (2012). Largest Enterprises of Latvia 2012. Top 500. Riga, p. 176.
6. Dutta, S., Mia, I. (2011). The Global Information
Technology Report 2010–2011. Transformations
2.0. Geneva: World Economic Forum, p. 435.7. Foss, N. J. (1997). Resources, Firms, and Strategies:
A Reader in the Resource-Based Perspective. Oxford: Oxford University Press, p. 378.
8. Lursoft (2012). Financial Analysis of Companies in Lursoft Home Page. Retrieved: http://www.lursoft.lv/Financial-analysis.html. Access: 15 March 2012.
9. Magretta, J. (2012). Understanding Michael Porter: The Essential Guide to Competition and Strategy. Boston: Harvard Business Press, p. 248.
10. Montgomery, C. A., Collis, D. J. (1995). Competing on Resources. Harvard Business Review, Volume 73: 4, pp. 118-128.
11. Porter, M. (1981). The Contributions of Industrial Organisation to Strategic Management. Academy of
Management Review. No 6, pp. 609-620.12. Porter, M.E. (1998). Competitive Strategy:
Techniques for Analysing Industries and
Competitors: with a New Introduction. New York: the free press, p. 397.
13. Porter, M.E. (2008). On Competition. Boston: Harvard Business Press, Upd. Exp. Edition, p. 576.
14. Rumelt, P.R. (1991). How much does Industry Matter? Strategic Management Journal, Volume 12, pp. 167-185.

31
Economic Science for Rural Development Nr. 28., 2012
ISSN 1691-3078
Theoretical and Practical Aspects of Rural - Urban Typology
Zane Bulderberga, PhD; Irina Pilvere, Dr.oec.Faculty of Economics, Latvia University of Agriculture
Abstract. One of the main goals set both by the European Union and the Latvian government is territorial cohesion and balanced spatial development. The common understanding of urban and rural areas is essential to implement this goal. The aim of this research is to compare and evaluate experience and approaches in classiication of rural and urban areas. The methods of analysis, synthesis and logical construction, statistical data calculations as well as scientiic discussion were applied in the research. According to the research results, there are numbered approaches in the world - based on demographic indicators, main economic activity, or social beliefs. There is no uniied understanding on rural and urban in Latvia as well. If using the Central Statistical Bureau information - 32% of population lived in rural area, based on the OECD approach - 39.3%, while the State Regional Development Agency data show that 35.4% of total population in 2010 lived in rural areas. Such situation can become a problem when implementing national and international development programmes and there is a great need to develop a single classiication of spatial division.Key words: rural – urban dichotomy, spatial development.JEL code: R00
Introduction The main trend in today’s territorial development is the
concentration of people and resources in cities, leading to unequal development of territories. The year 2008 was a dividing line when half of the world’s population lived in cities. In Europe, urbanisation is more explicit – already in the 1950s, more than half of its population lived in cities (United Nation, 2009). As a result, the economic structure of territories changes, human lifestyles and the perception of life have become more diversiied, leading to unequal development of territories. One of the main goals set both by the European Union (EU) and the Latvian government is to balance the development of cities and rural areas by promoting their mutual functional linkages and partnerships (Latvijas ilgtspejigas attistibas…, 2010). An important issue in implementation of these goals is a common understanding of spatial division – which criteria classify area as urban, and which – as rural. The development of clear criteria is vitally essential for effective analysis of the spatial processes and successful
development of the entire country. The rural – urban typology related issues have
been analysed in studies by different authors in Latvia: A. Melluma (1994), J. Iesalnieks (1995), A. Krauklis (2000), Z. Krisjane, M. Berzins (2008), and L. Kule (2010).
The aim of the research is to compare and evaluate experience and approaches in classiication of rural and urban areas in the world and in Latvia. the following tasks are set to achieve the goal:
1) to evaluate the theoretical aspects of the concepts
‘rural’ and ‘urban’ in three dimensions - demographic, economic, and social;
2) to analyse the small-town identiication possibilities as rural or urban area.
Research methodology – the methods of analysis, synthesis and logical construction, statistical data calculations as well as scientiic discussion were applied for fulilment of the above assignments.
The regulatory enactments of the Republic of Latvia, scientiic publications and special literature as well as statistical data from national and international institutions were used to achieve the goal and fulil the tasks.
Results and discussionTraditionally, ‘rural’ and ‘urban’ have been seen as
opposites. Most development theory and practice is implicitly based on the dichotomy between rural and urban areas, populations, and activities. This is relected in the division of policies - urban planners usually
concentrating on urban nodes and giving scant attention
to agricultural or rural-led development, while rural development planners tend to ignore urban centres and deine rural areas as consisting only of villages and their agricultural land (Tacoli, 1998).
In the past, there was a clear visual line between rural and urban areas – fortiications or walls. At present, such physical boundaries do not exist, thus, it is often very dificult to determine at which point the city ends and where the rural area begins. The distinction between ‘rural’ and ‘urban’ is probably inescapable for descriptive purposes; however, it often implies a dichotomy, which encompasses both spatial and sectoral dimensions. The key issue dividing various individual authors (Hurbanek, 2008; Pezzini, 2001; Woods, 1998) and their approaches is the manner in which they deine rural or urban areas. While Hurbanek (2008) tries to ind key characteristics of various rural settlements, when deining rural areas, other authors (Pezzini, 2001) discuss the delimitation of rural areas on the basis of an urban – rural dichotomy, without clearly deining individual categories.
Presently, there are several criteria according to which a particular territory can be deined as urban or rural – by population number, density, economic activity, distance from cities etc. H. Schmal (1981) compiled all the criteria that can be used as a benchmark for determining the status of territories in three dimensions – demographic,
economic, and people behaviour.
Z. Bulderberga, I. Pilvere Theoretical and Practical Aspects of Rural - Urban Typology

Economic Science for Rural Development Nr. 28., 2012
ISSN 1691-3078
32
1. The demographic approachThe demographic approach stresses demographic
indicators as the main ones, determining whether a place belongs to an urban or a rural area. In Europe, the majority of countries characterise urban and rural areas according to the number of population. Because of national differences in the characteristics that distinguish
urban from rural areas, the distinction between the urban and the rural population is not yet amenable to a single deinition that would be applicable to all countries or, for the most part, even to the countries within a region (United Nations Statistics Division, 2011). The Nordic countries (Norway, Sweden, Iceland) consider settlements with 200 inhabitants as urban, in the Central Europe, the customary limit is 2,000 (Czech Republic, France, the Netherlands) or 5,000 inhabitants (Austria, Slovakia, Germany). Countries of the Southern Europe (Greece, Italy, and Portugal) and also Poland, and Switzerland use a limit of 10,000 inhabitants for the delimitation of urban settlement (Demographic Yearbook, 2005).
In Latvia, the Law on Administrative Territories and Populated Areas (2008) determines - the area is classiied as an urban if the population exceeds 2000, the rest of the territory – as rural. This approach can be used
conditionally, as in the classiication other aspects are taken into account, for instance, a developed infrastructure, road network, secured business opportunities, and cultural services. Over the recent years, the number of towns has not changed in Latvia – in total 76 populated places were granted as towns. As a result, there are towns with a relatively small population, such as Durbe
(621 inhab.), Subate (736 inhab.), or Ainazi (993 inhab.), while the largest population, apart from republic cities, is in Ogre - almost 26 000. Presently, the number of population is less than 2000 permanent residents in 21 towns (27% from all towns) as it is set by the
Cabinet of Ministers (Central Statistical Bureau, 2011). According to the legislative acts, these populated places have to change their status but it is not done because
of various reasons – historical traditions, protests of population etc. Although, discussions on changing the status of small towns have been started many times on the national level, no decision has been made so far. This approach is used by the Central Statistical Bureau as the
main principle to summarising and analysing the statistical indicators on the national level. In Latvia, the population share living in urban areas has considerably changed
over time (Figure 1). Generally, 37% of population lived in urban areas in 1935, since then the share of population has been increasing continuously until reaches the top in
1990 – 69% of population lived in urban areas. Yet, this approach faces various problems, for
instance, the number of declared and actual population can vary considerably, people live in one place and work in another place, people have several places of residence and work. Therefore, it is dificult to determine the number of population in a particular territory.
As a criterion, other demographic indicators can be used, for instance, population density that is undoubtedly higher in urban territories. This approach is used by the Organisation of Economic Cooperation and Development (OECD) - within each of its 30 member countries, local areas were clustered according to the rural and urban typology, where rural areas were identiied as communities with population densities below 150 inhabitants per square kilometre. The regions are also grouped in three clusters depending on the share of regional population
living in rural areas: predominantly rural (over 50%), intermediate (15 to 50%), and predominantly urbanised (below 15%) (OECD Regional typology, 2010).
According to this typology (Figure 2), only 24.1% of the EU population lives in predominant rural areas. In Latvia, totally 39.9% of total population lives in predominant rural areas, yet, the territory covers bigger part of Latvia (62%). These trends - exacerbated by structural reductions in agricultural employment and ageing of the population – result in urban over-concentration causing
further social and environmental problems. Following the OECD methodology, Riga statistical region is classiied as predominantly urban, Kurzeme and Latgale
region – as intermediate region, and Zemgale, Vidzeme and Pieriga – as predominantly rural regions based on share of rural population (A Revised Urban…, 2010).
Some countries, such as Japan, would require different population threshold to identify areas, for instance, a threshold of 500 inhabitants per km² due to the higher population density compared with other countries. As well as Belgium, where two different optimal
Source: authors’ construction based on the Central Statistical Bureau data, 2011
Fig. 1. Share of population in rural and urban areas in Latvia, 1935 - 2010
Z. Bulderberga, I. Pilvere Theoretical and Practical Aspects of Rural - Urban Typology

33
Economic Science for Rural Development Nr. 28., 2012
ISSN 1691-3078
population density limits are identiied for its two regions: at 600 inhabitants per km² for Flanders and at 300 inhabitants per km² for Wallonia (Pizzoli, Xianoning, 2000).
Although Latvia is not an OECD member state and, thus, its formal deinition is not mandatory for Latvia, taking into account the experience of other new EU Member States (Poland, the Czech Republic, Slovakia), Latvia can use this classiication as the main principle in spatial division. If using the OECD deinition, the majority of Latvian small cities and other territorial units meet the criteria of rural areas. In administrative division aspect of the 110 Latvian municipalities, only two (Stopinu and Salaspils) would be deined as urban areas with a density of 187 and 184 inhabitants per km2 as well as all the republic cities (Central Statistical Bureau data, 2011).
When delimiting urban or rural areas according to population density, the comparison of various European countries in terms of municipality size is problematic. On the one hand, there are states with very large municipalities (measured by the number of inhabitants), such as Great Britain and Scandinavian countries, while on the other hand, there are countries with relatively small municipalities that are very numerous in certain
regions. Such countries include the Czech Republic, France, and Latvia among others (Regions at the Glance, 2005).
2. Economic approachThis approach views any territorial division by
engagement of population in various economic sectors, industries, and occupations emphasising that certain industries are appropriate for different territories (Pizzoli, Xianoning, 2000).
Goals of land use, building density, morphology, and distance between buildings are some of the features that help understand the differences between rural and urban areas. Traditionally, it is considered that urban areas are characterised by intense built-up, while the large distances between buildings are more characteristic to rural areas. European Spatial planning documents deine rural areas as a certain type of landscape and land use where agriculture is the key activity. Density of settlement may not, however, be a suficient criterion in many countries, particularly where there are large localities that are still characterised by a truly rural
way of life. Such countries will ind it necessary to use additional criteria in developing classiications that are
Source: authors’ construction based on the Eurostat data, 2010
Fig. 2. Share of population in the EU-27 and Latvia, 2010
Table 1
Traditional stereotypical differences between urban and rural populations
Urban Dimension Rural
Secondary and tertiary sector dominant EconomyPrimary industry sector and supporting
dominant activities
Manufacturing, construction, administration and service Employment
Agriculture, forestry and other primary industry occupations
Higher than national averages Education Lower than national averages
High Services accessibility Low
Liberal and radical elements are strongly represented
Political views Conservative, resistance to change
Source: authors’ construction based on Scott, Gilbert, Gelan, 2007
Z. Bulderberga, I. Pilvere Theoretical and Practical Aspects of Rural - Urban Typology

Economic Science for Rural Development Nr. 28., 2012
ISSN 1691-3078
34
more distinctive than a simple urban rural differentiation. Some of the additional criteria that may be useful are the percentage of the economically active population employed in agriculture, the general availability of electricity and/or piped water in living quarters, and the ease of access to medical care, schools and recreation facilities (Population Density and Urbanisation, 2011). For instance, in Panama and Nicaragua areas are considered as urban if there are streets, electric light, and water supply systems, meanwhile in the Russian Federation, Armenia, Azerbaijan, and Georgia, a number of inhabitants and predominance of agricultural or non-agricultural workers and their families are taken into account.
In Latvia, this approach is relected in the long-term planning document “Sustainable Development Strategy of Latvia until 2030” (2010) - to maintain a traditional lifestyle with the historic settlement structures, landscapes, and traditions. This can be achieved by ensuring that the rural areas parallel production of
agricultural and forestry produce, provides recreational opportunities for urban residents, high-quality living space for urban workers as well as territory for non-agricultural businesses. The document stresses the need to develop both the agriculture and forestry industry as
well as diversify economic activity without any priorities.In rural areas, the availability of basic services (trade,
social, health, education, infrastructure etc.) impacts possibilities of the economic activity and quality of life. Services are a precondition for a new, lexible economic development, innovation in local communities. Various researchers from European and the North American countries have found a reduction in service availability
especially in rural areas (Latvija. Parskats par..., 2005). In Latvia, the project of Guidelines in Regional Policy 2012 – 2018 (2011) deines the basket of services available for inhabitants depending on the classiication of populated areas - village, county development centre, regional development centre (21), the National Development Centre (5), and the International Development Centre (4). On the lowest level, public and private institutions have to provide basic services in
culture, health, social care, education and science, postal services, and business; on each next level, the list of available services are expanding.
However, the economic development causes a situation in which business activities are not explicitly differentiated depending on their relation to rural
or urban areas – quite often central ofices of large companies are not located in city centres anymore, more often urban residents live a “green” lifestyle, start growing fruit and vegetables, thus becoming engaged in agriculture. Whereas, in agricultural areas, alternative businesses of various types are done – tourism, health and entertainment services, commerce at shopping malls etc. Researchers Mogk, Kwiatkowski, Weindorf (2010) in the United States stress the opportunities for urban
agriculture in Detroit, pointing to the need to promote urban agriculture in the era of limited resource - the total population size and overall demand increase result in food deicit due to exploitation of all existing agriculture land outside urban areas. As a result of these processes, it is problematic to determine, which economic activities are solely characteristic of rural territories and which ones – of cities.
3. Social aspectsThe traditional distinction between urban and rural
areas has been based on the assumption that urban areas provide a different way of life and usually a higher standard of living than are found in rural areas. In the 1960s, scientists had an opinion that rural territories featured
greater social stability and safety, whereas urban life was much more unpredictable. Many of the rural community members are acquainted with one another, they have a higher sense of community, and rural residents often identify themselves with the territory in which they live (Cloke, 1994). The rural idyll “presents happy, healthy, and problem-free images of rural life safely nestling with both a close social community and a contiguous natural environment” (Cloke, Milbourne, 1992). The urban-led rural idyll emerged from the idea of the countryside as a place to escape from the realities of urban life and has been most evident in the desire for public access. This has latterly developed to encompass residential choice, employment and quality of life issues. Here, too, the idea of a landscape untouched by urbanism has strong resonance (Scott et al., 2007).
The education level of the population in the area is one
of the measurements to identify the human resources and skills. In rural areas, they are expected to be low so that mainly manual activities are developed. Indicators refer to the spatial dimension of social life, highlighting that in rural areas, distances are higher, and opportunities are lower with respect to urban areas. In this case, it is not always easy to ind out a suitable and available variable, which is why several alternative solutions are applied by the authors suggesting this approach. Distances from some key services, services available per square kilometre or per capita, and the length of roads for square kilometres are some of the proxy variables. Some studies suggest the use of socioeconomic structural characteristics such as infrastructures or human capital (Pizzoli, Xianoning, 2000). Although, the differences between urban and rural ways of life and standards of living remain signiicant in developing countries, in many industrialised countries this distinction has become blurred (Population Density and Urbanisation, 2011).
In Latvia, there is a strong tradition to describe and identify people by their place of residence (urban, rural population etc.) and assume that people living in the same area have similar traditions, values, and even similar characteristics. Often the rural inhabitants and the farmers are used as synonyms, despite the fact that less and less people are engaged in the agricultural industry
(Latvija. Parskats par…, 2005).
4. Rural areas and small townsControversial is the question about small-town
identiication as rural or urban area. In some developed countries rural areas and towns are separate, determining the rural as territorial residual category – outside of
urban areas. However, differences between the rural areas and small towns are not clearly deined in other cases. Rural areas often include small towns, villages, and other populated places with fewer than 1,000, 2,000 or 10,000 people based on principle that the small rural towns provide supply of services for surrounding rural areas. Even more - research results in Finland show that small towns are dependent on the surrounding rural area development (Hinderlink, Titus, 2002). Labour market
Z. Bulderberga, I. Pilvere Theoretical and Practical Aspects of Rural - Urban Typology

35
Economic Science for Rural Development Nr. 28., 2012
ISSN 1691-3078
researcher Rasnaca with colleagues (2008) indicates similar trends in Latvia and concludes that there is no evidence that small towns in Latvia are more successful than in Finland. This approach emphasises that small cities are integrated rather than “closed” system. City functional sizes generally do not overlap with its administrative borders. Urban functions are inluenced by the demographic (age, profession) structure, seasonal population (number of inhabitants), and while the functions make it possible to change the structure of the population (Kruzmetra, Rasnaca, 2007). Thus, it would be necessary include small towns deining the rural areas.
The State Regional Development Agency through survey “Development of Regions in Latvia, 2010” (2011) uses two types of municipalities - urban municipalities and rural municipalities. Rural municipalities (50 municipalities) are those the territory of which is not approved a city by the Cabinet of Ministers, while urban municipality (60 municipalities) has one or more towns or cities. Rural municipalities occupy 35% of the total territory and 15% of the population. However, this distinction is incomplete, since municipalities in Riga suburban area are called the rural because of lack of town or city in its territory.
When analysing the overall trends (Table 2), it can be concluded that all indicators have improved, yet, there are still signiicant differences between urban and rural areas. Several conclusions can be made based on this approach. Population change on average does not show signiicant difference in the time dimension, except the year 2004. In 2010, the population in rural areas did not change showing that the attractiveness of rural areas has been increased, and people are not longer attached to live in cities with growing pollution and crime. From 2004 to 2008, the highest indicators of demographic burden were observed in rural areas. The year 2010 is a year of change - demographic burden is higher in urban than in rural areas comparing with previous years. The level of welfare increased in Latvian rural areas in slower rates than in urban areas on average, based on the individual income tax revenues in municipal budgets per capita. In 2004, individual tax revenue volume in urban and rural areas differs by more than 90%, over time these differences are reduced, for instance, in 2010, the difference is only 2%. The values of indicators that characterise, to some extent, the attractiveness of life environment in 2010 are better in rural municipalities,
yet, better values of economic and demographic indicators are observed for the urban municipalities, indicating the impact of the large urban areas.
There are countries, which use the complex method, including a number of indicators. For instance, Spain includes the population age structure, economic dependency, the farm’s main occupation as well as density of population and building in its rurality index calculations.
However, there are also opposite views, which state that it is not possible to make any division between rural and urban areas. The main argument for this view is the belief that urban and rural areas may not be separated or isolated - no matter how successfully the classiication would be created, it represent only one part of an overall multi-faceted picture.
Conclusions, recommendations1. One of most common principles in spatial division
of urban and rural areas is the use of demographic indicators - in Europe the majority of countries characterise urban and rural areas according to
the number of population starting from 200 to
10 000 inhabitants (in Latvia – 2000); meanwhile the OECD and Eurostat consider population density as the main criteria for statistical purposes.
2. The traditional approach is based on belief that rural
and urban areas can be classiied in terms of most common economic activities, land use, availability of services, and education; meanwhile, other studies argue that old assumptions have to be reviewed taking into consideration globalisation effect, networking, communication and impact of electronic trade, and service availability.
3. The spatial development studies argue that the small towns are part of surrounding rural areas and cannot be separated as individual unit, these areas are strongly connected and interdependent.
4. There are several approaches used in Latvia for deinition of urban and rural areas - based on the status of settlements, population density, and administrative division. Every approach is used by different institution and for different purpose –
as a result, there is no uniied understanding and it can becomes a problem when implementing national and international development programmes.
Table 2
Socio-economic indicators in urban and rural areas in Latvia on average, 2004 - 2010
Indicator Area 2004 2006 2008 2010
Change in the number of population over the previous 5-year period (%)
Urban -4.7 -2.8 -2.5 -2.6
Rural -1.8 -3.0 -2.9 0.0
Demographic burdenUrban 570.5 550.9 518.0 517.2
Rural 641.5 588.6 538.7 506.4
Individual income tax revenues in municipal budgets per capita (EUR)
Urban 133.7 163.9 353.0 332.9
Rural 67,5 100,2 202,4 325.8
Unemployment rateUrban 5,5 5,6 3,2 13
Rural 8,0 7,0 4,4 12.4 Source: authors’ construction based on Development of Regions…, 2004, 2006, 2008, 2010
Z. Bulderberga, I. Pilvere Theoretical and Practical Aspects of Rural - Urban Typology
Economic Science for Rural Development Nr. 28., 2012
ISSN 1691-3078
36
5. In Latvia, according to the Central Statistical Bureau provided statistical reports, rural areas are territories that are located outside the town borders set by the Cabinet of Ministers – in 2010, 32% of total population lived in rural areas. Based on the OECD approach, 39.3% of population lived in predominantly rural areas, 13.5% - in intermediate and 47.2% of total population lived in predominantly urban areas in 2010. The State Regional Development Agency divides all administrative units into two groups – urban municipalities (one or more towns are located in its territory) and rural municipalities where 35.4% of total population lives.
6. It is essentially to elaborate a uniied deinition and classiication indicators for urban and rural areas in order to implement the EU and national policies regarding spatial development and territorial cohesion, taking into consideration today’s situation in spatial development and population tendencies, international experience, and
practice.
Bibliography 1. A Revised Urban-Rural Typology (2010). Eurostat
Regional Yearbook 2010, Eurostat. Retrieved: http://epp.eurostat.ec.europa.eu/cache/ITY_OFFPUB/KS-HA-10-00115/EN/KS-HA-10-001-15 EN.PDF. Access: 6 January 2012.
2. Cloke, P., Milbourne, P. (1992). Deprivation and Lifestyles in Rural Wales –II. Rurality and the Cultural Dimension, Journal of Rural Studies, Volume 8(4). pp. 360-374.
3. Cloke, P. (1994) “Rural” (ed. Johnston, R., et al.). The Dictionary of Human Geography, 3rd edition. Oxford, Blackwell Publishers. pp. 536-537.
4. Demographic Yearbook (2005). The United Nations Statistics Division. Retrieved: http://unstats.un.org/unsd/demographic/products/dyb/dyb2005/notestab06.pdf. Access: 6 January 2012.
5. Development of Regions in Latvia, 2004 (2005). State Regional Development Agency. Retrieved: http://www.vraa.gov.lv/lv/petnieciba/petijumi/. Access: 8 January 2012.
6. Development of Regions in Latvia, 2006 (2007). State Regional Development Agency. Retrieved: http://www.vraa.gov.lv/lv/petnieciba/petijumi/. Access: 8 January 2012.
7. Development of Regions in Latvia, 2008 (2009). State Regional Development Agency. Retrieved: http://www.vraa.gov.lv/lv/petnieciba/petijumi/. Access: 8 January 2012.
8. Development of Regions in Latvia, 2010 (2011). State Regional Development Agency. Retrieved: http://www.vraa.gov.lv/lv/petnieciba/petijumi/. Access: 8 January 2012.
9. Hinderlink, J., Titus, M. (2002). Small Towns and Regional Development: Major Findings and Policy Implications from Comparative Research. Urban Studies, Volume 39, No.3, pp. 379- 391.
10. Hurbanek, P. (2008). Recent Developments in Deinitions of Rurality /Urbanity Focus on Spatial Aspect and Land Cover Composition and Coniguration. Europe XXI, Volume 17, pp. 9-27.
11. Kruzmetra, Z., Rasnaca, L. (2007). Small Towns as Employment and Service centres in Latvia, Geograiskie raksti, Volume 13, Riga. pp. 134-145.
12. Latvijas ilgtspejigas attistibas strategija līdz 2030. gadam (Latvian Sustainable Development Strategy
till the year 2030) (2010). Retrieved: http://www.latvija2030.lv/ upload/latvija2030_saeima.pdf. Access: 10 January 2012.
13. Law on Administrative Territories and Populated
Areas (2008) Retrieved: http://www.likumi.lv/doc.php?id=185993. Access: 10 January 2012.
14. Mogk, J. E., Kwiatkowski, S., Weindorf, M.J. (2010). Urban Agriculture as an Alternative Land Use for Vacant Properties in the City of Detroit: Beneits, Problems And Proposals for a Regulatory Framework
for Successful Land Use Integration. Wayne State
University Law School Promoting. Retrieved: http://law.wayne.edu/pdf/ urban_agriculture_policy_paper_mogk.pdf. Access: 5 January 2012.
15. OECD Regional Typology (2010). OECD Directorate for Public Governance and Territorial Development, Retrieved: www.oecd.org/dataoecd/35/62/ 42392595.pdf. Access: 5 January 2012.
16. Pezzini, M. (2001). Rural Policy Lessons from OECD Countries. International Regional Science Review, Volume 24(1). pp. 134–145.
17. Pizzoli, E., Xianoning, G. (2000). How to Best
Classify Rural and Urban? Fourth International
Conference on Agriculture Statistics (ICAS-4), China. Retrieved: http://www.stats.gov.cn/english/ICAS/papers/ P020071114325747190208.pdf. Access: 16 December 2011.
18. Population Density and Urbanisation (2011). United Nations Statistics Division, Retrieved: http://unstats.un.org/unsd/demographic/sconcerns/densurb/densurbmethods.htm#B. Access: 12 December 2011.
19. Rasnaca, L., Bite, D., Saulaja, I. (2008). Employers in Rural Towns, In: Collection of Papers of
International Conference “Countryside – our world”, pp. 223-232.
20. Regions at the glance (2005). OECD, Paris. Retrieved: http://www.oecd-ilibrary.org/urban-rural-and-regional-development/oecd-regions-at-a-glance-2005_reg_glance-2005-en. Access: 5 January 2012.
21. Regionalas politikas pamatnostadnu 2012.-2018.
gadam projekts. (The project of Regional Policy
Guidelines 2012-2018) Retrieved: www.tavavara.lv. Access: 10 January 2012.
22. Rural Area, Glossary of Key Expressions Used in Spatial Development Policies in Europe, 14 CEMAT (2007). Retrieved: http://commin.org/en/bsr-glossaries/european-glossary/spatial-structures/
rural-area.html. Access: 5 January 2012.23. Schmal, H. (ed.) (1981). Patterns of European
UrbaniSation since 1500. London: Croom Helm. p. 309.
24. Scott, A., Gilbert, A., Gelan, A. (2007). The Urban-Rural Divide: Myth or Reality? The Macaulay Land Use Research Institute. Retrieved: http://www.macaulay.ac.uk/economics/research/SERPpb2.pdf. Access: 5 January 2012.
Z. Bulderberga, I. Pilvere Theoretical and Practical Aspects of Rural - Urban Typology

37
Economic Science for Rural Development Nr. 28., 2012
ISSN 1691-3078
25. Statistical Data of Population (2011). Central Statistical Bureau. Retrieved: http://data.csb.gov.lv/Dialog/Saveshow.asp. Access: 10 January 2012.
26. Tacoli, C. (1998). Rural – urban Linkages and Sustainable Rural Livelihoods. Carney, D. (ed) Sustainable Rural Livelihoods, What
Contribution can we Make? London: DFID. p. 213.
27. Urban/rural Population (2009). World
Urbanisation Prospects. The 2009 Revision. United
Nations. Retrieved: http://esa.un.org/unpd/ wup/index.htm. Access: 5 January 2012.
28. Urban-rural Typology (2010). European Commission, Retrieved: http://epp.eurostat.ec.europa.eu/statistics_explained/index.php/Urbanrural_typology. Access: 6 January 2012.
29. Woods, M. (1998). Advocating Rurality? The Repositioning of Rural Local Government, Journal of
Rural Studies, Volume 14(1). pp. 13-26.30. Zobena, A. (red.) (2005). Latvija. Parskats par
tautas attistibu. 2004/2005: Ricibspeja regionos.
(Latvia. Human Development Report. 2004/2005,
Legal Capacity in Regions) Riga: ANO Attisiības programma, LU Socialo un politisko petijumu instituts, p. 148.
Z. Bulderberga, I. Pilvere Theoretical and Practical Aspects of Rural - Urban Typology
The research has been supported within the ESF project “Support for the Implementation of Doctoral Studies at Latvia
University of Agriculture”, agreement No 2011/0055/1DP/1.1.2.1.2/11/IPIA/VIAA/008

Economic Science for Rural Development Nr. 28., 2012
ISSN 1691-3078
38
M. Chadrzynski Milk Market in Poland - Selected Aspects of Functioning
Milk Market in Poland - Selected Aspects of Functioning
Mariusz Chadrzynski, PhD., engineerDepartment of Agricultural Economics and Policy, Faculty of Economic Sciences, Warsaw University of Life Sciences
Abstract. The paper discusses key elements of functioning of the milk market in Poland after the accession to the European Union. In Poland, it was stated that there was the surplus of supply over the demand in the analysed period in the milk market. It was affected by the fact that Poland had been a net milk and dairy products exporter. In foreign trade, there was a trend towards eliminating the differences between export and import milk and dairy products. Poland’s milk market, the same as in the European Union, is regulated by milk quota system. This system had a favourable impact on the intensiication of processes of the specialisation of both the concentration of the production and milk processing, and at the same time reduced production and food - processing potential options. In the analysed period, there was an advantageous milk balance – this is proved by the indicator of the self – suficiency, which is on the level of 110%. Dynamics of prices changes in the milk market in Poland were on the similar level as the level of total food.Key words: milk market, dairy sector, milk production, milk processing.JEL code: D40
IntroductionPoland is regarded as one of the major milk producers
in the European Union and the milk processing industry is one of the key sectors of Polish agriculture. The value of milk produced in Poland is estimated at ca. PLN 3.5 billion annually (Information Bulletin of the Ministry of Agriculture and Rural Development No. 1-2/2010). In connection with the situation which may occur after the expiry of the milk quota system in 2015, it seems necessary to commence activities aimed to support the entities operating in the dairy sector. This sector encompasses both milk producers and processing plants. The supply of raw material for dairy industry in Poland is based on individual suppliers producing
over 12 million tons of milk annually (Jablonska –
Urbaniak T., 2010). The structure of milk production is signiicantly dispersed. This has an impact on the increase of the expenditure for improvement of milk quality. Since the introduction of the milk quota system in Poland, the number of suppliers has been decreasing, thus, proving concentration and specialisation of milk production. The dairy sector structure is based primarily on dairy cooperatives. Dairy plants focus their activity on the domestic market (nearly 90% of sales volume). In 2010, milk was purchased by 288 entities of which
200 processed the purchased raw material. Reduction of the number of milk collection points is also visible (Jablonska – Urbaniak T., 2010).
The main aim of the paper was presentation of the selected aspects of functioning of diary sector in Poland
after the accession to the European Union. The speciics tasks are:
1) presentation of the general situation on the Polish
milk market;2) characteristics of milk processing;3) presentation of the milk balance and the changes in
prices in the milk market;4) analysis of the foreign trade of Poland with the dairy
products and tendency on the global milk market.
The paper attempts to determine the selected aspects of functioning of the dairy sector in Poland
on the basis of materials and source data of Central Statistical Ofice - Glowny Urzad Statystyczny (GUS), Agricultural Market Agency - Agencja Rynku Rolnego
(ARR), Ministry of Agriculture and Rural Development - Ministerstwo Rolnictwa i Rozwoju Wsi (MRiRW), Institute of Agricultural and Food Economics - National Research Institute - Instytut Ekonomiki Rolnictwa i Gospodarki Zywnościowej – Panstwowy Instytut Badawczy
(IERiGZ – PIB), Polish Chamber of Milk - Polska Izba
Mleka (PIM), Analytical Centre of the Customs Administration - Centrum Analityczne Administracji Celnej (CAAC), Food and Agriculture Organisation, and available secondary sources. The research tools included a critical analysis of the status of research
with respect to a particular topic and descriptive
analysis. An inductive method was adopted for the inference. The paper provides a theoretical, empirical, and general overview.
Domestic milk marketThe Polish milk market as in the entire European
Union (EU) is characterised with the surplus of supply over demand. In the period of 2006 – 2010, milk production exceeded domestic consumption by 15%
(27 EU Member States – 10%) (Szajner P., 2010). The dairy industry in Poland is characterised with a low production marketability measured as a relation between the sale and production (80%). Taking into account the share of the purchased milk in the total milk produced, it is ca. 65% (in the EU Member States 90 – 95%). This results in a situation where Polish dairy industry does not fully utilise its processing capacities. According to the estimates, their use in the dairy industry is 75 – 80% (Szajner P., 2010). An additional element regulating the milk market in Poland after the accession to the EU is the milk quota system. This system is intended to contribute to the stabilisation and development of the milk sector by

39
Economic Science for Rural Development Nr. 28., 2012
ISSN 1691-3078
keeping the balance on the EU milk and dairy products market and ensure the sales of the raw material at the prices advantageous for the suppliers. It is also an element of intervention into the market, which the EU attempts to depart from. This system is to function until 2015. As a result of the pre-accession negotiations, Poland obtained the production quotas of 9380 thousand tons including 8500 thousand tons of supplies for the dairy industry, 464 thousand tons of direct sales, and 416 thousand tons of restructuring reserve – to be used in the economic year 2006/2007 (Szajner P., 2010).
The reform of the Common Agricultural Policy (CAP) envisages a gradual increase of the milk quotas on the milk market and their abolition from 1 April 2015. According to the decisions of the European Commission (EC), the national milk quotas have increased since 2009/2010 and will continue to increase until 2014/2015 at the annual rate of 1%. In the economic year 2014/2015, the Polish milk quotas are to be at the level of 10056 thousand tons (Szajner P., 2010), which would not materially improve the eficiency of production. Such a slow increase of production limits will contribute to the slowdown of the dairy sector restructuring process at the raw material base and industry level. The raw material producers are limited by the quotas, which, if exceeded, are subjected to penalty charges. It also limits the production potential. The dairy sector may not take full advantage
of them.
Raw material baseThe changes across the milk sector have different
scale intensity in both time and structure and they are as follows.
Taking into account the aspects related to raw material, one has to do with the concentration and productivity growth processes. Since Poland’s accession to the EU structures until 2010, the milk cow headage has decreased by nearly 8% in parallel with over 14% productivity improvement. This may be a consequence
of the increased specialisation in the milk cow breeding fostered by the functioning of the milk quotas system, which, due to its restrictive nature, results in the reduced proitability of small farms. The decrease of the cow population accompanied by their increased productivity occurred in parallel with nearly 40% drop in the number of milk producing farms and over 52% reduction of milk suppliers. Taking into account the size of the farms, small farms (up to 9 cows) withdraw from the business, the number of farms keeping from 100 to 199 milk cows grows with the largest farms keeping over 200 cows also in retreat (Olkowska O., 2010, 2011). These data show the growing specialisation and concentration of milk production. A faster growth of productivity in comparison with the reduced headage translated into 5% increase in milk production between 2004 and 2010. Increased milk supply to dairy plants by almost 13% and reduction of the number of milk suppliers by over 52% can be also observed. This proves the concentration of the raw material production and relative decrease of milk use in feeds and for consumption purposes.
Milk processingDairy sector in Poland was restructured with respect
to ownership, technology, and concentration of the scale of milk production and processing.
With respect to milk processing, the ownership restructuring led to a separation of a group of strong
private companies. Because of capital and entity consolidation in the cooperative sector, there are several economically viable dairy cooperatives operating on the domestic milk market. The structural transformations have led to the reduction of number of cooperatives and growth of the scale of the processing business. The average level of raw milk processing per company increased from 25.5 thousand tons up to 43 thousand tons in the period of 2003 – 2009. An increasing consolidation of the entities producing, buying, and processing the raw milk is observed (Szajner P., 2010).
Table 1
Characteristics of milk production in Poland in selected years in the period of 2004 - 2010
No. Items 2004 2005 2008 2009 2010
1. Milk cow headage (in thousand) 2770 2769 2702 2629 2551
2. Index (2004 = 100%) 100 99.96 97.55 94.91 92.09
3. Milk production (in million kg) 11824 11913 12426 12447 12430
4. Index (2004 = 100%) 100 100.75 105.09 105.27 105.13
5. Cow productivity (in kg per cow annually) 4262 4302 4595 4731 4870
6. Index (2004 = 100%) 100 100.94 107.81 111.00 114.27
7. Milk cow farms with cows (in thousand) 736 712 551 495 465
8. Index (2004 = 100%) 100 96.74 74.86 67.26 63.18
9. Number of milk suppliers (in thousand) 389 294 222 200 186
10. Index (2004 = 100%) 100 75.58 57.07 51.41 47.81
11. Milk supplies to dairy plants (in thousand kg) 7997 8831 8941 9138 9014
12. Index (2004 = 100%) 100 110.43 111.80 114.27 112.72 Source: author’s calculations based on Milk market – Condition and Prospects (various years, IERiGZ - PIB; Central
Statistical Ofice Yearbooks (various years), Agricultural Development Agency data, Polish Chamber of Milk
M. Chadrzynski Milk Market in Poland - Selected Aspects of Functioning
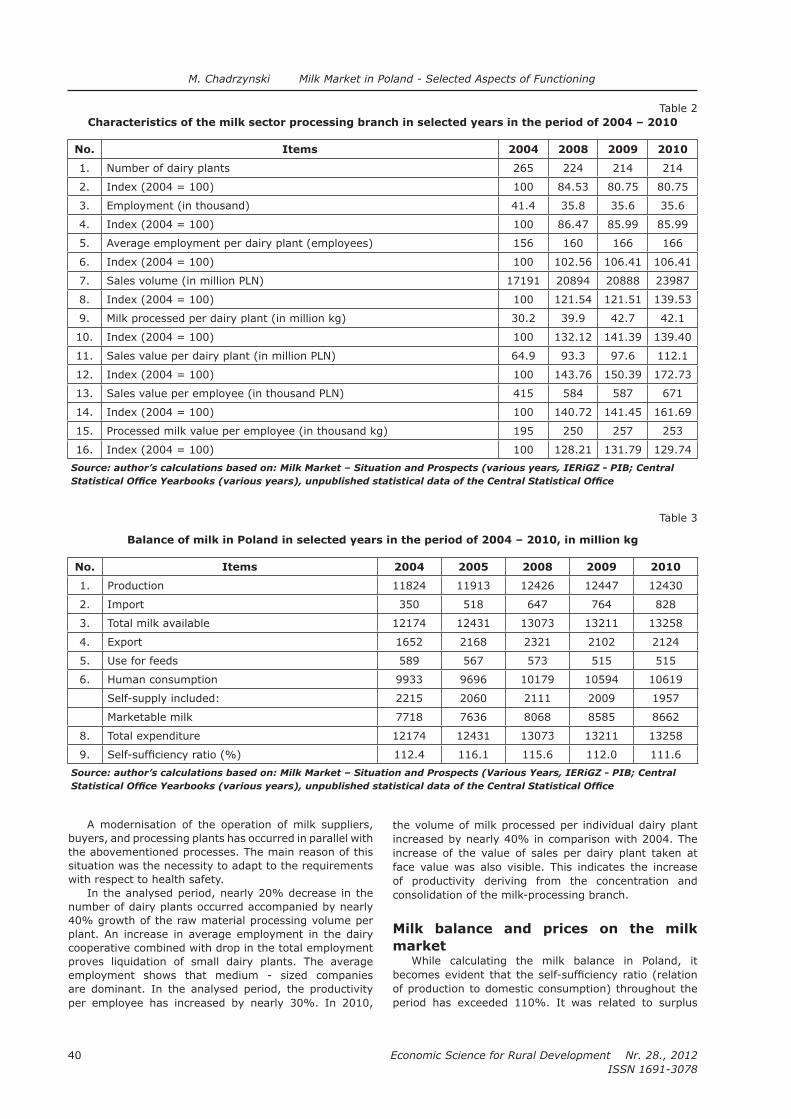
Economic Science for Rural Development Nr. 28., 2012
ISSN 1691-3078
40
A modernisation of the operation of milk suppliers, buyers, and processing plants has occurred in parallel with the abovementioned processes. The main reason of this situation was the necessity to adapt to the requirements with respect to health safety.
In the analysed period, nearly 20% decrease in the number of dairy plants occurred accompanied by nearly 40% growth of the raw material processing volume per plant. An increase in average employment in the dairy cooperative combined with drop in the total employment proves liquidation of small dairy plants. The average employment shows that medium - sized companies are dominant. In the analysed period, the productivity per employee has increased by nearly 30%. In 2010,
the volume of milk processed per individual dairy plant increased by nearly 40% in comparison with 2004. The increase of the value of sales per dairy plant taken at
face value was also visible. This indicates the increase of productivity deriving from the concentration and consolidation of the milk-processing branch.
Milk balance and prices on the milk market
While calculating the milk balance in Poland, it becomes evident that the self-suficiency ratio (relation of production to domestic consumption) throughout the period has exceeded 110%. It was related to surplus
Table 2
Characteristics of the milk sector processing branch in selected years in the period of 2004 – 2010
No. Items 2004 2008 2009 2010
1. Number of dairy plants 265 224 214 214
2. Index (2004 = 100) 100 84.53 80.75 80.75
3. Employment (in thousand) 41.4 35.8 35.6 35.6
4. Index (2004 = 100) 100 86.47 85.99 85.99
5. Average employment per dairy plant (employees) 156 160 166 166
6. Index (2004 = 100) 100 102.56 106.41 106.41
7. Sales volume (in million PLN) 17191 20894 20888 23987
8. Index (2004 = 100) 100 121.54 121.51 139.53
9. Milk processed per dairy plant (in million kg) 30.2 39.9 42.7 42.1
10. Index (2004 = 100) 100 132.12 141.39 139.40
11. Sales value per dairy plant (in million PLN) 64.9 93.3 97.6 112.1
12. Index (2004 = 100) 100 143.76 150.39 172.73
13. Sales value per employee (in thousand PLN) 415 584 587 671
14. Index (2004 = 100) 100 140.72 141.45 161.69
15. Processed milk value per employee (in thousand kg) 195 250 257 253
16. Index (2004 = 100) 100 128.21 131.79 129.74 Source: author’s calculations based on: Milk Market – Situation and Prospects (various years, IERiGZ - PIB; Central
Statistical Ofice Yearbooks (various years), unpublished statistical data of the Central Statistical Ofice
Table 3
Balance of milk in Poland in selected years in the period of 2004 – 2010, in million kg
No. Items 2004 2005 2008 2009 2010
1. Production 11824 11913 12426 12447 12430
2. Import 350 518 647 764 828
3. Total milk available 12174 12431 13073 13211 13258
4. Export 1652 2168 2321 2102 2124
5. Use for feeds 589 567 573 515 515
6. Human consumption 9933 9696 10179 10594 10619
Self-supply included: 2215 2060 2111 2009 1957
Marketable milk 7718 7636 8068 8585 8662
8. Total expenditure 12174 12431 13073 13211 13258
9. Self-suficiency ratio (%) 112.4 116.1 115.6 112.0 111.6 Source: author’s calculations based on: Milk Market – Situation and Prospects (Various Years, IERiGZ - PIB; Central Statistical Ofice Yearbooks (various years), unpublished statistical data of the Central Statistical Ofice
M. Chadrzynski Milk Market in Poland - Selected Aspects of Functioning

41
Economic Science for Rural Development Nr. 28., 2012
ISSN 1691-3078
of supply over the demand occurring on the Polish market. The value of the index has been decreasing each year since 2008. It was linked with the narrowing difference between export and import in terms of quantity. In addition, the volume of milk used in feed production and self-supplies has slightly decreased
and was accompanied with the simultaneous growth of the milk production. It can be said that the balance on the Polish milk market was positive in the analysed
period.The growing trend in per capita milk consumption is
evident in Poland. In 2005, it was 259 kg and in 2010, it reached 276 kg. However, it is still lower in comparison with other European countries, especially in comparison with the Northern parts of the continent (Germany, Denmark, Ireland, and Scandinavian countries, where it ranges from 300 to 470 kg per capita).
The growth of milk prices on the milk market can be observed in the analysed period. An advantageous factor for milk producers was the fact that purchase prices showed the highest dynamics (42.4%) among all milk market levels despite the slope in the period of 2007-2009. Price luctuations of raw milk purchase were much deeper in comparison with the wholesale and retail prices. It has to do with a long milk cattle production period, which delays in time the consequences of producers’ decisions.
Changes in the retail prices of butter and dairy products in the years 2004-2010 relected the food and consumer goods and services price luctuations in general. Only wholesale prices proved considerable deviations. Prices of butter and dairy products grew faster than inlation. This may have contributed to high food price growth dynamics in general and relatively low milk consumption in Poland.
The advantage of the Polish dairy producers over
their competitors from the EU countries is evident - on 15 international markets. It manifests in the raw milk prices, which in Poland are ca. 15% lower in comparison with the EU average.
World’s milk market and foreign trade in dairy products
The situation on the domestic milk market is to a large extent moulded by the results of foreign trade. In view of surplus of supply on the domestic market, Poland is a net exporter of milk and dairy products. In the analysed period, export dominated over the import in terms of both the quantity and value. The reduction of these differences can now be observed. In 2004, the volume of export exceeded import over 8 times (in terms of value nearly 5.5) but already in 2010, the volume of export was much bigger than import exceeding it
Table 4
Changes of prices of the raw material and dairy products against the background of milk products and consumer goods in Poland in selected years in the period of 2000 – 2010, %
No. Items 2000 - 2003 2004 - 2006 2007 - 2009 2004 - 2010
1. Raw milk purchase prices 117.5 129.7 97.5 142.4
2. Wholesale prices 108.4 109.4 103.4 115.4
3. Dairy products retail prices 114 107.4 112.1 124.1
4. Butter milk prices 109.3 118.8 109.3 135.7
5. Consumer goods and services 119.3 106.8 110.5 121.8
6. Total food 113.5 109.2 115.8 131.4 Source: author’s calculations based on: Milk Market – Situation and Prospects (Various Years, IERiGZ - PIB; Central Statistical Ofice Yearbooks (various years), unpublished statistical data of the Central Statistical Ofice
Table 5
Volume of import and export of dairy products in Poland in selected years in the period of 2004 – 2010, in thousand tons
No. Items2004 2009 2010
Import Export Import Export Import Export
1. Milk powder 5.9 129 27 120.7 37.1 103
2. Liquid milk and cream 5.9 52.9 49.8 281.8 57.8 239.6
3. Butter and milk fat 4.1 27.6 9.3 18.3 12.8 25.5
4. Cheese and quark cheese 8.7 81.3 38 142.9 39.8 140
5. Yogurts and dairy drinks 1.9 43.7 21.3 107.5 27.7 123.3
6. Ice cream 2 8.2 8.6 25.3 8.4 27.6
7. Casein 11.5 6.2 11 3.9 7.4 4
8. Whey 8.3 47.8 24.9 130.7 27.3 135.4 Source: author’s calculations based on: Milk Market – Situation and Prospects (Various Years, IERiGZ - PIB; Central Statistical Ofice Yearbooks (various years), unpublished statistical data of the Central Statistical Ofice
M. Chadrzynski Milk Market in Poland - Selected Aspects of Functioning
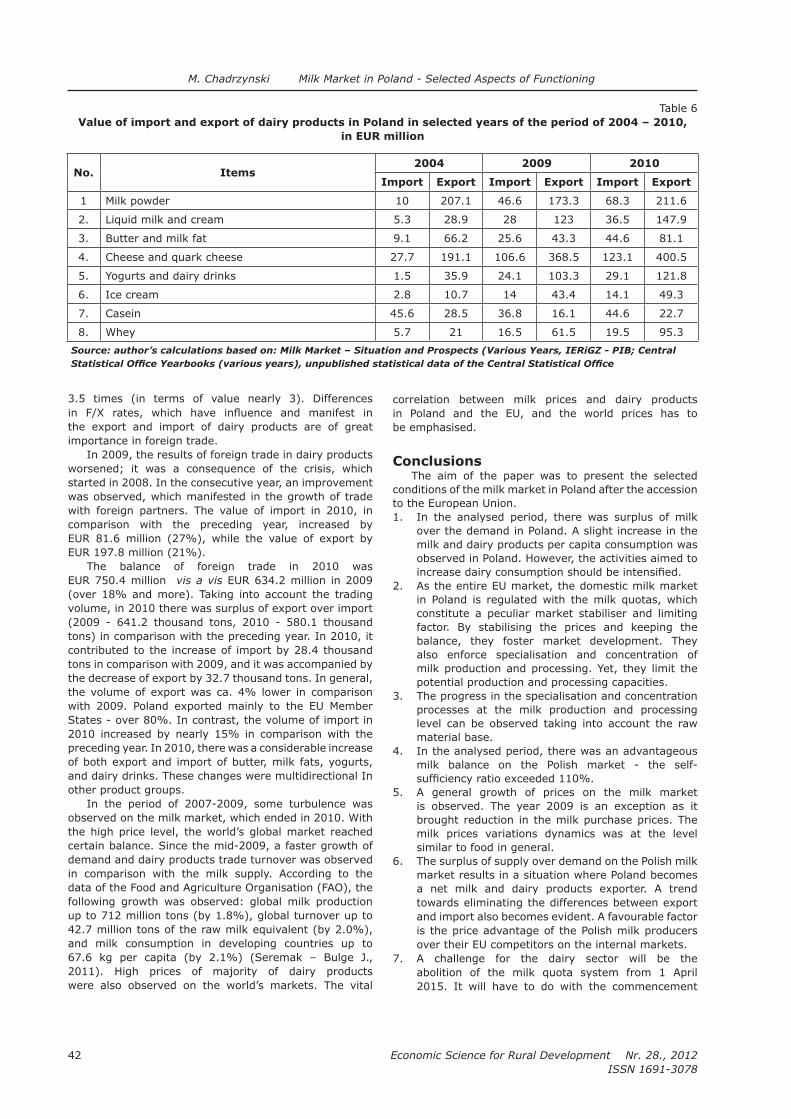
Economic Science for Rural Development Nr. 28., 2012
ISSN 1691-3078
42
3.5 times (in terms of value nearly 3). Differences in F/X rates, which have inluence and manifest in
the export and import of dairy products are of great importance in foreign trade.
In 2009, the results of foreign trade in dairy products worsened; it was a consequence of the crisis, which started in 2008. In the consecutive year, an improvement was observed, which manifested in the growth of trade with foreign partners. The value of import in 2010, in comparison with the preceding year, increased by
EUR 81.6 million (27%), while the value of export by
EUR 197.8 million (21%).The balance of foreign trade in 2010 was
EUR 750.4 million vis a vis EUR 634.2 million in 2009 (over 18% and more). Taking into account the trading volume, in 2010 there was surplus of export over import (2009 - 641.2 thousand tons, 2010 - 580.1 thousand tons) in comparison with the preceding year. In 2010, it contributed to the increase of import by 28.4 thousand tons in comparison with 2009, and it was accompanied by the decrease of export by 32.7 thousand tons. In general, the volume of export was ca. 4% lower in comparison with 2009. Poland exported mainly to the EU Member States - over 80%. In contrast, the volume of import in 2010 increased by nearly 15% in comparison with the preceding year. In 2010, there was a considerable increase of both export and import of butter, milk fats, yogurts, and dairy drinks. These changes were multidirectional In other product groups.
In the period of 2007-2009, some turbulence was observed on the milk market, which ended in 2010. With the high price level, the world’s global market reached certain balance. Since the mid-2009, a faster growth of demand and dairy products trade turnover was observed in comparison with the milk supply. According to the data of the Food and Agriculture Organisation (FAO), the following growth was observed: global milk production up to 712 million tons (by 1.8%), global turnover up to 42.7 million tons of the raw milk equivalent (by 2.0%), and milk consumption in developing countries up to
67.6 kg per capita (by 2.1%) (Seremak – Bulge J., 2011). High prices of majority of dairy products were also observed on the world’s markets. The vital
correlation between milk prices and dairy products in Poland and the EU, and the world prices has to
be emphasised.
ConclusionsThe aim of the paper was to present the selected
conditions of the milk market in Poland after the accession to the European Union.1. In the analysed period, there was surplus of milk
over the demand in Poland. A slight increase in the milk and dairy products per capita consumption was observed in Poland. However, the activities aimed to increase dairy consumption should be intensiied.
2. As the entire EU market, the domestic milk market in Poland is regulated with the milk quotas, which constitute a peculiar market stabiliser and limiting factor. By stabilising the prices and keeping the balance, they foster market development. They also enforce specialisation and concentration of
milk production and processing. Yet, they limit the potential production and processing capacities.
3. The progress in the specialisation and concentration
processes at the milk production and processing level can be observed taking into account the raw material base.
4. In the analysed period, there was an advantageous milk balance on the Polish market - the self-suficiency ratio exceeded 110%.
5. A general growth of prices on the milk market is observed. The year 2009 is an exception as it brought reduction in the milk purchase prices. The milk prices variations dynamics was at the level similar to food in general.
6. The surplus of supply over demand on the Polish milk market results in a situation where Poland becomes a net milk and dairy products exporter. A trend towards eliminating the differences between export and import also becomes evident. A favourable factor is the price advantage of the Polish milk producers over their EU competitors on the internal markets.
7. A challenge for the dairy sector will be the abolition of the milk quota system from 1 April 2015. It will have to do with the commencement
Table 6
Value of import and export of dairy products in Poland in selected years of the period of 2004 – 2010, in EUR million
No. Items2004 2009 2010
Import Export Import Export Import Export
1 Milk powder 10 207.1 46.6 173.3 68.3 211.6
2. Liquid milk and cream 5.3 28.9 28 123 36.5 147.9
3. Butter and milk fat 9.1 66.2 25.6 43.3 44.6 81.1
4. Cheese and quark cheese 27.7 191.1 106.6 368.5 123.1 400.5
5. Yogurts and dairy drinks 1.5 35.9 24.1 103.3 29.1 121.8
6. Ice cream 2.8 10.7 14 43.4 14.1 49.3
7. Casein 45.6 28.5 36.8 16.1 44.6 22.7
8. Whey 5.7 21 16.5 61.5 19.5 95.3 Source: author’s calculations based on: Milk Market – Situation and Prospects (Various Years, IERiGZ - PIB; Central Statistical Ofice Yearbooks (various years), unpublished statistical data of the Central Statistical Ofice
M. Chadrzynski Milk Market in Poland - Selected Aspects of Functioning

43
Economic Science for Rural Development Nr. 28., 2012
ISSN 1691-3078
of activities aimed at harmonisation of market functioning under modiied conditions. It is necessary for milk and dairy products producers to
undertake them.
Bibliography1. Food Outlook, Global market analysis, FAO,
June 2010.2. Information Bulletin of the Ministry of Agriculture
and Rural Development No. 1-2/2010.3. Jablonska – Urbaniak, T. (ed.) (2010). Agriculture
and Food Economy in Poland. Ministry of Agriculture and Rural Development, Warsaw.
4. Materials published by Analysis and Programming Ofice of the Agricultural Market Agency. Milk Market No. 08/2011, No. 37/2011.
5. Milk Market – Status and Prospects (various years, IERiGZ - PIB). Warsaw.
6. Olkowska, O. (2010). Report: Situation on the Milk Market, Polska Federacja Hodowcow Bydla i
Producentow Mleka (Polish Federation of Cattle Breeders and Dairy Farmers). Warsaw.
7. Olkowska, O. (2011). Situation on the Milk Market in Poland in 2010 , Polska Federacja Hodowcow Bydla i Producentow Mleka (Polish Federation of Cattle Breeders and Dairy Farmers), Warsaw.
8. Salacki, K. (2010). Situation of the Milk Sector in Poland in 2009, Part 1-2, Przeglad Mleczarski (Dairy Review), No. 5, pp. 26-28.
9. Salacki, K. (2010). Situation of the Milk Sector in Poland in 2009, Part 1-1, Przeglad mleczarski (Dairy Review), No. 4, p. 1 - 1, Przeglad mleczarski (Dairy Review), No. 4, pp. 36-40.
10. Seremak – Bulge, J. (2011). Milk Market in Early 2011, Press Breakfast – Polish Chamber of Milk, Warsaw.
11. Statistical Yearbooks (various years), Central Statistical Ofice, Warsaw.
12. Szajner, P. (2010). Milk Sector in Poland - Issues and Prospects, Rynek mleka (Milk Market), July – August 2010, Vol. 64, pp. 28-32.
M. Chadrzynski Milk Market in Poland - Selected Aspects of Functioning
Economic Science for Rural Development Nr. 28., 2012
ISSN 1691-3078
44
E. Gaule, J. Sinkiene Role of Place Attractiveness for Local Economic Development
Role of Place Attractiveness for Local Economic Development
Elge Gaule, PhD, lecturerDepartment of Public Administration, Kaunas University of Technology
Jolita Sinkiene, PhD, assoc. professor Department of Regional Development, Kaunas University of Technology
Abstract. This article discusses the importance of place attractiveness for local economic development in the context of international competition of territories. Discussion is based on the review of international academic literature, paying major attention to the public management perspective. The authors draw attention to the concept and process of local economic development, which integrates a number of other important place development methods, facilitating retention of exiting and attraction of new important resources for a sustainable development of a place (region, city, town, other). The main aim of the article is to discuss the inter-relations between the place attractiveness and its LED through the analysis of concepts, content, and processes of local economic development and place attractiveness.Key words: place development, place attractiveness, local economic development.JEL code: R
Introduction The power to attract activity and people is one of
the most important pre-conditions for a place success. Therefore, the enhancement of place attractiveness is a continuous public policy effort and object of research. As literature analysis showed, the ields of local economic development (LED) and place attractiveness are suficiently discussed as separate topics, yet, there is a lack of scientiic and empirical analysis on their interdependency.
In the era of global competition, large and small communities (cities, towns, villages) are facing new challenges to maintain and strengthen their competitiveness in order to create a lexible, adaptable, and diverse local economic structure, which would allow the community to be in a better competitive position, and thus, to create a higher quality of life for its members. To achieve this aim, places are constantly competing for many different factors (skilled, creative entrepreneurs and workers, businesses, events, public funding etc.), which stimulate their economies. Therefore, one of the most important conditions, which determines inter-community competition outcome, is the ability of the community to compete for these factors. In this context, the attractiveness of a place is regarded as one of the
most important pre-conditions for its community’s future economic success.
The main aim of the article is to discuss the inter-relations between place attractiveness and its LED through the analysis of concepts, content, and processes of local economic development and place attractiveness. The tasks of the research are: 1) to disclose the essence
of the concepts of local economic development and place attractiveness; 2) to present the process of LED emphasising its strategic nature; and 3) to explain the main factors that inluence attractiveness of a place to speciic target groups. The authors of the article state that improvement of its attractiveness helps promote and support the image of a place so that it can become competitive and attractive for potential
resource generating elements (investment capital, skilled people etc.), which are crucial for the local economic development.
Research results and discussionDecentralisation of government competencies,
responsibilities and resources, and transfer of decision-making powers from national level to lower government levels give local communities more decision making powers as well as responsibility for the quality of life of community members. Different researchers (Dunning, 1998; Brenner, 2004; Savitch and Kantor, 2002) denote that nation-states transfer increasingly more powers and responsibilities to local level authorities in order to take
advantages of globalisation on the level, where their expression is most intense.
Free movement of people, capital and goods strengthened international competition among products, services, persons, and even territories - states, regions, cities, villages, communities. If some decades ago, the main competitors-territories were nation-states, nowadays, even a small and remote community has a number of competitors. They compete to retain existing or attract new economic (inancial), social and/or technological resources; they strive to enhance their attractiveness to society groups, which can guarantee its stability or long-term growth. As nowadays skilled people relate the attractive place with the “quality of place” (more prosperous, healthier, safer, open, cleaner, fun, sustainable, …), the communities should seek to offer conditions, which are important for successful businesses and smart people. This encourages development of a new local policy and implementation of complex measures to attain a clear objective - to increase the attractiveness
of the place.In this context, communities face new challenges,
which require application of more effective or new methods of socio-economic development of their territories. Different experts suggest different solutions
45
Economic Science for Rural Development Nr. 28., 2012
ISSN 1691-3078
to this issue: strategic management, local economic development, place marketing, strategic networking, creative inancing - to name just a few. The authors of the article will pay major attention to the local economic development (further - LED) as a tool to generate community’s internal and external resources.
The relationship between place attractiveness and LED is coming forward as a very important scientiic area, concerning the place’s (regional and local) development. Most of the theoretical and empirical approaches tend to analyse each of the terms separately, without deeper academic or empirical investigation of the impact of place attractiveness on development taking in a place (city, town, village, other).
Essence of local economic development The growing attention to locality and community
decision-making in democratic states facilitates LED. Local governments are committed to create sustainable human settlements that provide decent quality of life and meet the social, economic, and material needs of communities in a holistic way. LED should be seen as a tool for development of place economies when exploited local opportunities address local needs and contribute
to the national development goals of economic growth and poverty alleviation. LED leads to increase of the local economy’s capacity to create wealth for local residents in two ways: either in the growth of local jobs, when unemployed labour and land is used, or when the local resources (labour and land) are used more productively.
LED is a process when local government and/or community-based groups manage their existing resources and enter into new partnership arrangements with the private sector, or with each other, to create new jobs and stimulate economic activity in a deined economic zone (Blakely, 1994). White and Gasser (2001) determined four LED features as it: (a) requires participation and social dialogue; (b) is based on territory; (c) entails the mobilisation of local resources and competitive advantages; and (d) is locally owned and managed. LED is an outcome of co-operation between public organisations, communities and private enterprises in a total production, distribution, and consumption processes.
Promoting robust and inclusive local economies requires concerted, coordinated action in all ields of governance. Local governments choose different strategies to affect local economy as well as to develop different policy-making and administrative processes using diverse instruments. Eisinger (1988) has distinguished supply-side and demand-side policies of LED. Supply-side policies refer to incentives to attract economic activity into the area, e.g. tax incentives, debt inancing schemes, infrastructure investment, regulatory policy, tax increments, land and site development, and inancing arrangements. Demand-side policies are strategies to promote new enterprises creation and small-business expansion, government assistance to local businesses in new product development and market expansion, supporting research and development, strategic investment (e.g., business incubators, venture capital inancing, and job training programmes). Public sector agencies spend money purchasing goods and services from local businesses; seeking to encourage
E. Gaule, J. Sinkiene Role of Place Attractiveness for Local Economic Development
participation of local business enterprises in its local
procurement activities. In the times of unstable economy, places orient
themselves to attraction of external resources, as the groups, which call for assistance, remain more constant in communities (i.e. local problems), while the capital and economically active residents are more mobile (i.e. problems solving). LED concerns actions that take place in place internal environment, through the motivation of the existing local enterprises, in order to contribute to local development, to become more competitive and to expand their inancial and production activities, and external environment through the attraction of new investments and residents, while there are quite close interdependency of these two.
Local economic development processLED is a process that brings together resources from
within and outside the community to promote economic growth in a systematic and organised manner on the local level. LED is connected to, and thus, dependent on, other processes such as effective planning, communication, actions coordination, controlling and evaluation, and the authorities’ motivation to perform development activities. LED process is based on careful and detailed planning and, primarily, on good practice in urban planning and development (Cunningham and Meyer-Stamer, 2005). LED process is an integral part of the extensive process of strategic management. Effective strategic management ensures that priority issues are addressed and limited resources are well targeted. Five main stages in LED process may be identiied:
— the local economic development process begins by place diagnosis and institutional mapping, i.e. identifying the stakeholders (individuals, public institutions, enterprises, community organisations, and other groups) interested in the local economy. The knowledge, skills, and resources that each of these stakeholders bring to the LED process provide a critical foundation for success;
— LED initiative needs to be based on a profound investigation of the local economy. Local conditions analysis and assessment helps acquire knowledge on the local economy and its resources. Each place and community has a unique set of local attributes that can advance or hinder LED. The aim of the local economy assessment is to identify the strengths and weaknesses of place socio-economic and political environment including its human resource capacity, and local government’s ‘friendliness’ to all types of business activities;
— by designing economic development strategy,
a shared economic vision and goals, objectives, programmes, projects, and action plans are set. It is very important to determine the role and the contribution of the existing enterprises as well as the establishment of new ones in a place (city or region). LED implementation needs good coordination, thus, LED institutionalisation embodies establishment of the local economic development unit in municipality and/or committee in a council of local government or a local economic development agency, a business association, and a stakeholder forum. This process

Economic Science for Rural Development Nr. 28., 2012
ISSN 1691-3078
46
ensures that all major stakeholder groups are given the opportunity to deine the goals to be achieved, and the means of achievement, they will be bounded and timeframed for participation in the implementation of the strategy;
— local economic development strategy implementation
is driven by the action plans. The local stakeholders, according to their competence, resources, and capacities, implement the bottom-up development strategy following the action plans;
— good monitoring and evaluation techniques help quantify outcomes, justify expenditures, determine enhancements and adjustments, and develop good practices. Permanent monitoring is accomplished through the formal institutions set in step one. The evaluation of programmes and projects outcomes ensures that the strategy continues to lead to the achievement of the LED vision, goals, and objectives. This information is also used in the review of the complete local economic development strategy.
The ive-step LED process should be tailored to complement and correspond with other integrated local development processes. The process of designing and implementing LED policy may vary according to the types of policies adopted and institutions established in the
municipality.
Concept of place attractiveness Criteria characterising the location decisions of
business and people in the 20th and the 21st centuries
illustrate the change of interests for the qualities of a location (place). In the past century, the location was chosen based primarily on the needs of businesses (“traditional” approach). In the 21st century, in the knowledge-based economy, where the relative advantages on the market depend largely on the creative, complex skills, the needs of creative and competent workforce play
a crucial role.Although, the need to be attractive is regarded by
most entities as a “self-evident fact”, there are other perspectives as well. Some researchers say that places do not strive to increase their attractiveness; on the opposite – they seek to restrict their attractiveness, especially if it is very distinct comparing with other places of similar size and functions. For example, “the principle of attraction” proposed by Forrester (1969) states that every class of society, all geographic locations strive to be equally attractive.
Speciically to say, all locations strive to be equally unattractive. Why all areas want to be attractive - because people move from unattractive areas to more attractive ones. Movement of people is like a levelling process. When people move to attractive places, prices there rise, vacancy rates fall, supply of workplaces decrease, the natural environment is loaded, availability of high-quality housing, and public services is reducing. In other words, the growing location’s population facilitates the decline of all qualities of the location, which previously made it an attractive one.
However, most of us will agree that the improvement of attractiveness, not the opposite, is on the agendas of most public authorities. Perhaps the strength of the
need (motivation) to increase particular community’s attractiveness can change with time, but it will always remain an important task for its leadership.
Factors of attraction The authors propose to search for an answer to the
question “to whom a community should direct its efforts to be attractive?” A general answer, referring to Braun (2008), can be “to all people and organisations that are important for the functioning of the community”. Of course, community uniqueness and attractiveness from the point of view of different economic subjects is different, depending on their speciic needs and activity characteristics. It is obvious that a certain community cannot be “perfect” - equally appealing to all groups in the society: local or external business, residents, visitors, young, elderly etc. Consequently, for communities, seeking to manage their attractiveness, primarily, all it is necessary to understand and decide which group of society (target group of the community) is most relevant in order to ensure its socio-economic growth and competitiveness.
To choose the target group of a city, a town, or a village is a particularly important challenge, since this choice would affect the community’s development activities (choice and communication of attractive location characteristics) in the coming few years. Strengthening the community’s attractiveness is a continuous and long-term process, the cornerstone of policy and efforts, not a one-time action.
Before development of programmes, to enhance the attractiveness of a place, it is very important to understand that place attractiveness for different society
groups (target groups) is not the same; the attractiveness of a community consists of many different characteristics. Kotler et al. (1993) identify the following major target groups of a community: visitors, residents/employees, business/industry, and export markets.
Berg et al. (1990), Ashworth and Voogd (1990) distinguish residents, businesses, and visitors.
Jensen (2005) suggests ive main objects, which every community should consider in its efforts to achieve higher competitive position: mobile investors, mega internal products, citizens creating value added, public funds, exceptional events, and important infrastructure spheres.
If preparing the community attractiveness plan for the irst time, it is suggested to focus on three general target groups: residents, business, and
visitors - as their activities, objectives and interests have the most prominent differences. Below is a more detailed explanation of factors, which determine a community’s attractiveness for each of these target groups.
— Community’s factors important to business
As analysis of academic and empirical literature shows, most communities strive to attract business, which could create new employment opportunities for the local population and to generate income of the community’s budget.
Kirvaitiene (2007) states that it is very important to understand companies’ interests for a place, as their (successful or not) fulilment are directly relected in
E. Gaule, J. Sinkiene Role of Place Attractiveness for Local Economic Development

47
Economic Science for Rural Development Nr. 28., 2012
ISSN 1691-3078
economic and social indicators of the community, such as impact for a general GNP, investments coming to the place, number and quality of created work places, residents migration etc.
If several decades ago communities put most efforts to draw attention of industries, today they want to attract attention of businesses belonging to “clean industries”. According to van den Berg, van der Meer and Otgaar (1999), an attractive place for business community should have good accessibility, acceptable land prices, local taxes and legal requirements, and suficient quantity and quality of labour force supply. Other factors such as living environment and quality of public services are important as well. Braun (2008) states that entrepreneurs and investors look for the following most important community’s characteristics: location, built environment, labour force, existing and new customers, suppliers, inance, and partners.
In his discussion about place’s brand, Jensen (2005) emphasises the importance of creation of place’s conditions, which are necessary to attract capital. Places, “friendly” to business, i.e. maintaining high level of technological infrastructure, have to maintain other important elements, such us quality of life.
— City factors important to residents
In general, the attractiveness of the community to residents means all community characteristics, which meet needs of all their family members. According to Braun (2008), these are jobs, education institutions, leisure facilities, other institutions and services, and family and friends. According to van den Berg, van der Meer and Otgaar (1999), attractive to residents is a place with a good, accessible, clean, safe environment; good access to employment, high quality education and health care services; and high quality city culture, attention to public safety, religion, arts.
Anholt (2007) states that people, thinking about communities, often pay attention to rather practical things, such as climate, pollution, transport and trafic jams, standards of living, leisure and sports facilities, legal environments, and, of course, cultural city’s life. Ejigu (2004), speaking about reasons to visit a location, gives the following classiication of visiting purposes: business, conference, short-stay, long-term stay (to see its main places of interest), passing through or coming to a place on a daily basis, to visit family and friends.
— Community factors important to visitors
An attractive community draws also visitors and tourists. It is important to notice that, in recent decade, the spatial behaviour of visitors has changed: people
travel more often but trips are shorter in time. This group of society, contrary to the previously discussed two other community target groups, does not aim to settle in the city for a long time.
According to van den Berg, van der Meer and Otgaar (1999), a community’s attractiveness as a visitors’ destination relies on the existence of different tourist products, such as attractions, museums, events, the climate, the landscape as well as hotels, restaurants, and shops.
Braun (2009), discussing place marketing issues, emphasises that visitors look for a temporary accommodation (hotel, apartment, camping, family’s house etc.) plus the accessibility to relevant attractions
or other facilities or locations. This author also points out to the fact that the visitor considers additional factors
like the costs and type of accommodation, architecture and design, comfort, availability of restaurants, the direct neighbourhood, parking facilities, public transportation, and other amenities.
Before starting the development and implementation of community attractiveness improvement strategies, it is important to understand that these efforts shall be based primarily on the existing community’s advantages, its values, identity, especially its socio-cultural heritage. This will help create a distinctive local character, which draws attention of visitors, residents, and businesses, distinguishes it from many other locations, and encourages settling in the community. It is also important to achieve that the objectives to enhance the attractiveness of a
community would be the result of debates and consensus of leaders of all community interest groups (political and administrative level, private, and NGOs sector). These objectives should be relected in the wording of vision of the community’s local economic development strategy. Community’s attractiveness enhancement efforts will be successful only if it is systematic, targeted, whole-community effort to use the existing local qualities and characteristics to create and promote conditions for living, doing business, and visiting, which are required by modern society groups with the highest socio-economic potential.
Conclusions — Globalisation and the knowledge economy bring
complex challenges for local governments seeking to achieve a better competitive position of their community. The most important challenges are to maintain the existing or desired competitive position by creating a lexible, adaptable, and diverse local economic structure, allowing the community to improve its situation in regional and global competition. To achieve this, communities are competing to retain existing (internal) or attract new (external) major development factors, particularly high-skilled, creative workers, successful businesses that are the driving force of the knowledge-based economy, and visitors.
— Improvement of place attractiveness is an important element within the strategies of LED. Place attractiveness plays a key role for the success of
places in gaining competitive advantage, optimally allocating economic resources, and designing long-term economic development strategy and policies.
— LED may be deined as a set of special activities, undertaken by local government to promote economic development of the community. LED can be understood as a self-supporting process: it helps
retain and use internal community resources more effectively and attract external ones. Therefore, LED strategy is an important tool, which helps manage current and/or potential resources necessary for the
development of economic processes. Coordinated attraction of resources should be based on detailed
segmentation of resource markets in order to ensure more successful processes of local economic development. Only comprehensive analysis of the
E. Gaule, J. Sinkiene Role of Place Attractiveness for Local Economic Development

Economic Science for Rural Development Nr. 28., 2012
ISSN 1691-3078
48
economic environment provides the answer what resources are most relevant for a particular place.
Bibliography 1. Anholt S. (2007). Competitive Identity: the New
Brand Management for Nations, Cities and Regions. New York: Palgrave Macmillan.
2. Ashworth, G. J., Voogd H. (1990). Selling the City. Belhaven Press.
3. Berg L. van den, Meer J. van der, Otgaar A.H.J. (1999). The Attractive City. European Institute for Comparative Urban Research (EURICUR). Erasmus University, Rotterdam.
4. Blakely, E. J. (1994). Planning Local Economic Development (2nd ed.). Thousand Oaks, CA: Sage.
5. Braun, E. (2008). City Marketing: Towards an Integrated Approach. Erasmus School of Economics, Erasmus University Rotterdam.
6. Brenner, N. (2004). New State Spaces: Urban Governance and the Rescaling of Statehood. Oxford University Press, USA.
7. Cunningham S., Meyer-Stamer J. (2005). Planning or Doing Local Economic Development? Problems with the Orthodox Approach to LED, Africa Insight, Vol. 35 No. 4, pp. 4-14.
8. Dunning, J.D. (1992). The Competitive Advantage of Nations and TNC Activities. Transnational Corporations. No. 1, pp. 135-168.
9. Eisinger, P.K. (1988). The Rise of the Entrepreneurial State: State and Local Economic Development Policy in the United States. Madison, WI: University of Wisconsin Press.
10. Ejigu A., Sjoholm J., Nordgren E., Lindstrom P. (2004). Twinning Identities – Losing Uniqueness? Planning for Regional Development Across Borders, Project Work, Royal Institute of Technology.
11. Forrester, J. W. (1975). Collected Papers of Jay Forrester. Pegasus Communications. Portland.
12. Gorzelak, G. (2001). Economic and Strategic Plan for a City or Region. EUROREG: Warsaw University.
13. Jensen, O. B. (2005). Branding Contemporary City - Urban Branding as Regional Growth Agenda? Plenary Paper for Regional Studies Association Conference. Aalborg: Aalborg University.
14. Kirvaitiene, S. (2007). City Image-Making: Possibilities and Objectives of the Developments of the Centre Environment. Summary of Doctoral Dissertation Humanities, Arts, Sculpture and Architecture. Vilnius: Vilniaus Gedimino Technikos Universitetas.
15. Kotler, P. (1993). Marketing Places: Attracting Investment, Industry, and Tourism to Cities, States, and Nations. Free Press.
16. Savitch, H. V., Kantor, P. (2002). Cities in the International Marketplace: the Political Economy of Urban Development in North America and Western Europe. Princeton, NJ: Princeton University Press.
17. White, S., Gasser, M. (2001). Local Economic Development: a Tool for Supporting Locally Owned and Managed Development Processes that Foster the Global Promotion of Decent Work. A Working Paper Prepared and Presented for Discussion by
the Local Economic Development Practice Group on
25 September 2001 Geneva: ILO, Job Creation
and Enterprise Development Department.
E. Gaule, J. Sinkiene Role of Place Attractiveness for Local Economic Development

49
Economic Science for Rural Development Nr. 28., 2012
ISSN 1691-3078
Z. Gruzina, A. Zvirbule-Berzina Support Diversiication for Micro, Small and Medium Size Enterprises in Zemgale Region
___________________________1 E-mail address: [email protected]
Support Diversiication for Micro, Small and Medium Size Enterprises in Zemgale Region
Zanete Gruzina1, Mg.oec., lecturer; Andra Zvirbule-Berzina, Dr.oec., assoc. professorLatvia University of Agriculture, Faculty of Economics
Abstract. The paper presents the concept of support diversiication for development of micro, small and medium size enterprises (MSMEs) in Zemgale region, Latvia. Financial, advisory, and educational support is crucial for the establishment and development of micro, small and medium size enterprises worldwide. The World Bank, the European Commission, and governments have all showed an increased interest in inancing and supporting MSMEs. The research is focused on discussion and classiication of support available for the establishment, and growth and development of micro, small and medium size enterprises in Latvia. Cluster analysis groups 22 local municipalities of Zemgale region into 4 clusters, and the authors suggest to diverse support according to speciic needs of region and enterprises in each cluster. In the clusters that link territories with low number of micro enterprises per 1000 capita, it is necessary to stimulate the establishment of new micro enterprises through programmes like Promotional Programmes Ofice ALTUM Start Programme, Micro Lending Programmes as well as education and training. In contrast, in clusters with high number of micro enterprises per 1000 capita but low number of small and medium size enterprises, it is important to stimulate the growth of micro enterprises into small, medium and large enterprises through Competitiveness and SME Growth Loan programmes. Key words: inancial support, support diversiication.JEL code: E02
Introduction The irm size plays an important role in
enterpreneurship. Micro, small and medium size enterprises (MSMEs) face dificulties and problems, when trying to survive and develop. According to Schiffer and Weder, there are 3 main problems that small and medium size enerprises are facing: tax policy, access to inance, and inlation. Large enterprises are more concerned about policy instability, tax policy, and inlation (Schiffer M., Weder B., 2001). Access to inance is one of the problems that the European Comission is concerned about. The European Central Bank conducted survey between 22 August and 7 October 2011, covering a sample of 8316 irms in the euro area. According to the survey results, external inancing needs of MSMEs have slightly increased between April and September 2011. The survey results show that access to bank loans has deteriorated at the same time. On balance, irms’ opinion about the availability of bank loans has decreased
by 5 percentage points reaching 14%. Moreover, the survey results point to slightly lower rates of success when applying for a loan. Meanwhile, the percentage of respondents reporting “access to inance” as their main problem was unchanged and stood at 16% (Report on the Results…, 2011). Because inancial support is limited, it is important to diverse it according to the needs of speciic region and enterprise. In this paper, the authors take into account not just inancial support offered for MSMEs but also consultations, knowledge sharing, and advisory services for MSMEs.
The aim of the research is to analyse possibilities of
support diversiication for micro, small and medium size enterprises in Zemgale region. Three research tasks
are set up to reach the aim:
1) to describe the role of micro, small and medium size enterprises;
2) to classify and describe support that is available for
the establishment, and growth and development of micro, small and medium size enterprises in Latvia;
3) to analyse opportunities of support diversiication for micro, small and medium size enterprises thought cluster analysis of Zemgale region.
The research methods are monographic descriptive, analysis, synthesis, statistical methods, and cluster analysis. The paper presents the classiication of support that is available for MSMEs into two main groups: 1) support for the establishment of MSME
and 2) support for the growth and development of MSME. Cluster analysis is used to group
22 local municipalities of Zemgale region into four homogeneous groups, so that the authors can suggest different strategy for each group of local
municipalities. Cluster analysis is based on 4 socio-economic indicators from the year 2009: number of micro size enterprises per 1000 capita, number of small size enterprises per 1000 capita, number of medium-size enterprises per 1000 capita, and specially supported territory status. If a territory has the status of specially supported territory, it shows that there are long-lasting negative social and economic processes in this territory.
1. Role and importance of micro, small and medium size enterprises
Micro, small and medium size enterprises play an increasing role in economy, but there is not common understanding of the term micro, small and medium size of enterprise. The number of employees and inancial data
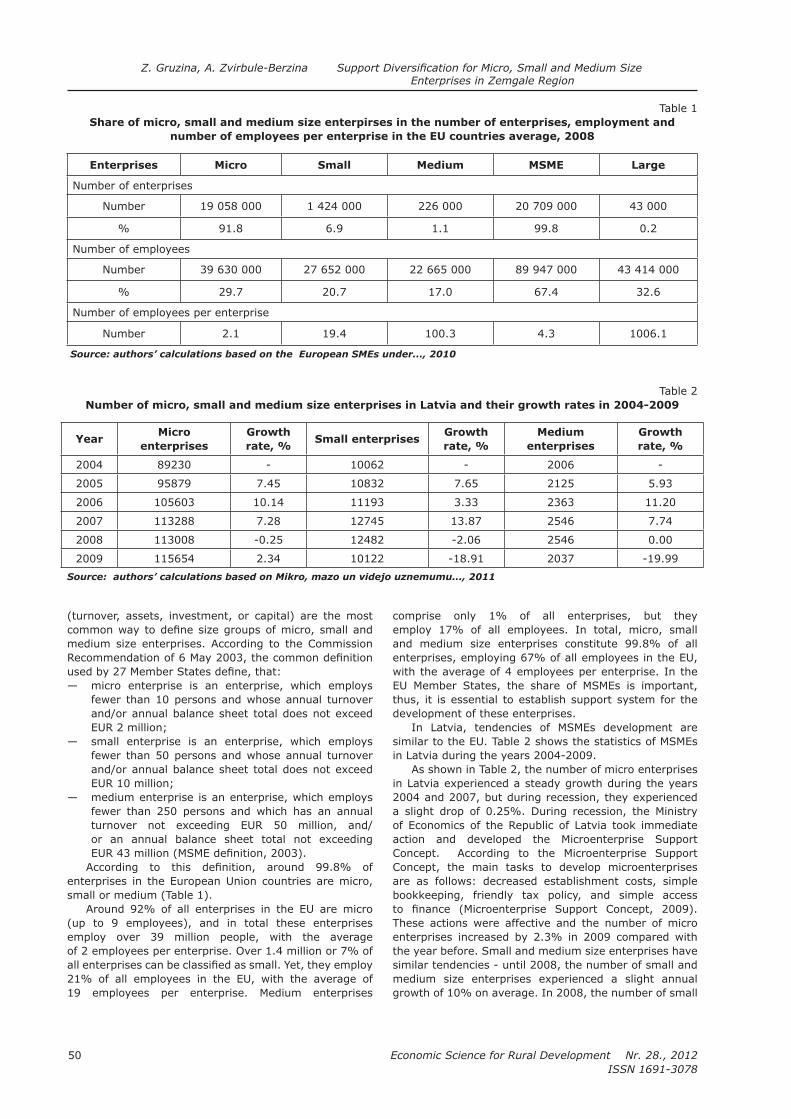
Economic Science for Rural Development Nr. 28., 2012
ISSN 1691-3078
50
(turnover, assets, investment, or capital) are the most common way to deine size groups of micro, small and medium size enterprises. According to the Commission Recommendation of 6 May 2003, the common deinition used by 27 Member States deine, that:
— micro enterprise is an enterprise, which employs fewer than 10 persons and whose annual turnover and/or annual balance sheet total does not exceed EUR 2 million;
— small enterprise is an enterprise, which employs fewer than 50 persons and whose annual turnover and/or annual balance sheet total does not exceed EUR 10 million;
— medium enterprise is an enterprise, which employs fewer than 250 persons and which has an annual turnover not exceeding EUR 50 million, and/or an annual balance sheet total not exceeding
EUR 43 million (MSME deinition, 2003).According to this deinition, around 99.8% of
enterprises in the European Union countries are micro, small or medium (Table 1).
Around 92% of all enterprises in the EU are micro (up to 9 employees), and in total these enterprises employ over 39 million people, with the average
of 2 employees per enterprise. Over 1.4 million or 7% of all enterprises can be classiied as small. Yet, they employ 21% of all employees in the EU, with the average of 19 employees per enterprise. Medium enterprises
Z. Gruzina, A. Zvirbule-Berzina Support Diversiication for Micro, Small and Medium Size Enterprises in Zemgale Region
comprise only 1% of all enterprises, but they
employ 17% of all employees. In total, micro, small and medium size enterprises constitute 99.8% of all enterprises, employing 67% of all employees in the EU, with the average of 4 employees per enterprise. In the EU Member States, the share of MSMEs is important, thus, it is essential to establish support system for the development of these enterprises.
In Latvia, tendencies of MSMEs development are similar to the EU. Table 2 shows the statistics of MSMEs in Latvia during the years 2004-2009.
As shown in Table 2, the number of micro enterprises in Latvia experienced a steady growth during the years 2004 and 2007, but during recession, they experienced a slight drop of 0.25%. During recession, the Ministry of Economics of the Republic of Latvia took immediate action and developed the Microenterprise Support
Concept. According to the Microenterprise Support Concept, the main tasks to develop microenterprises are as follows: decreased establishment costs, simple bookkeeping, friendly tax policy, and simple access to inance (Microenterprise Support Concept, 2009). These actions were affective and the number of micro enterprises increased by 2.3% in 2009 compared with the year before. Small and medium size enterprises have similar tendencies - until 2008, the number of small and medium size enterprises experienced a slight annual growth of 10% on average. In 2008, the number of small
Table 1
Share of micro, small and medium size enterpirses in the number of enterprises, employment and number of employees per enterprise in the EU countries average, 2008
Enterprises Micro Small Medium MSME Large
Number of enterprises
Number 19 058 000 1 424 000 226 000 20 709 000 43 000
% 91.8 6.9 1.1 99.8 0.2
Number of employees
Number 39 630 000 27 652 000 22 665 000 89 947 000 43 414 000
% 29.7 20.7 17.0 67.4 32.6
Number of employees per enterprise
Number 2.1 19.4 100.3 4.3 1006.1
Source: authors’ calculations based on the European SMEs under..., 2010
Table 2
Number of micro, small and medium size enterprises in Latvia and their growth rates in 2004-2009
YearMicro
enterprisesGrowth rate, % Small enterprises
Growth rate, %
Medium enterprises
Growth rate, %
2004 89230 - 10062 - 2006 -
2005 95879 7.45 10832 7.65 2125 5.93
2006 105603 10.14 11193 3.33 2363 11.20
2007 113288 7.28 12745 13.87 2546 7.74
2008 113008 -0.25 12482 -2.06 2546 0.00
2009 115654 2.34 10122 -18.91 2037 -19.99Source: authors’ calculations based on Mikro, mazo un videjo uznemumu..., 2011

51
Economic Science for Rural Development Nr. 28., 2012
ISSN 1691-3078
Z. Gruzina, A. Zvirbule-Berzina Support Diversiication for Micro, Small and Medium Size Enterprises in Zemgale Region
enterprises dropped by 2%, while the number of medium enterprises stayed stable. Both, the number of small and the number of medium size enterprises experienced impressive decrease during 2009- respectively by 19% and 20% due to recession. Because of economic problems, many small and medium size enterprises bankrupt or were forced to decrease their size. In total, the number of MSMEs decreased by 0.2% in 2009 compared with 2008 due to decline in the number of small and medium size enterprises and the increase of the number of micro enterprises.
2. Support for the development of MSMEs in Latvia
In Latvia, the available inancial support for micro, small and medium enterprises can be classiied into two groups: 1) inancial support that is available to establish MSME and to ensure the irst years of its work; and 2) inancial support that is available for the
existing MSMEs that are aiming at growth and development. Figure 1 shows support that is available for establishing MSMEs.
To establish a micro, small or medium size enterprise, three types of support are available: inancial support, consultations and administrative help, and knowledge sharing and education. There are three main sources of inancial support for MSMEs.
— Measures for business or self-employed start-ups - administrated by the State Employment Agency and offering training and support up to
LVL 2000 for the development of business plans to registered unemployed persons (Pasakumi komercdarbibas…, 2011).
— Start programme (ESF) - support to business start-ups is administrated by the Promotional
Programmes Ofice ALTUM. The programme provides the business start-ups and newly established companies with an all-embracing support, i.e. consultations, training, and inancing in the shape of loans and grants for starting the business. Consultations, loans up to LVL 54 thousand and grants up to LVL 2 thousand are available (Start programme…, 2011).
— Micro-lending programme is administrated by ALTUM and the overall objective of the programme is to improve access of micro enterprises (up to 10 employees) and self-employed persons (individuals – economic operators) to micro loans for setup and development of business activities. Loans are intended for the implementation of business plans – both for investments and working capital - and the loan volume is up to
LVL 10 thousand, with ixed interested rate from 5% to 8% per annum and loan maturity up to
5 years (Micro Lending…, 2011).There is one main source of consultations and
advisory help and two sources of sharing knowledge and education.
— Business incubators are aimed to promote new, viable and competitive businesses, providing them with the necessary environment for business and advisory services. Business incubation is a unique and lexible business development process - a combination of infrastructure and personnel, designed to help develop new and small businesses by supporting the early stage of development with daily consultations based on business development issues (Biznesa inkubatori, 2011). There are ive business incubators established in each region of Latvia.
Source: authors’ construction
Fig. 1. Support available for the establishment of micro, small and medium size enterprises

Economic Science for Rural Development Nr. 28., 2012
ISSN 1691-3078
52
— Mentoring and Business Angels - movement of mentoring and business angels is becoming popular in Latvia. Both mentors and business angels are experienced business people who are willing to share their knowledge and experience with new and inexperienced start-ups.
— Courses and seminars - Investment and Development Agency of Latvia (LIAA) is offering several training sessions and courses for business
start-ups and providing information about available support.
It is important that inancial support is available not only during the establishment of MSME but also for its growth and development. In Figure 2, the authors summarise support available for the growth and development of micro, small and medium size enterprises.
Three main sources of inancial support are available for the growth and development of micro, small and medium size enterprise.
— Competitiveness Programme grants loans to the
businesses registered in Latvia with economically feasible business plans that cannot access the inancing of the credit institutions due to increased risks they
present. The total loan amount per one entrepreneur may not exceed LVL 7.5 million. Mostly, the loans are intended for implementation of the projects of the processing businesses and entrepreneurs attracting
the inancing of the EU Structural Funds’ grant programmes (Competitiveness Programme, 2011).
— SME Growth Loan Programme inances small and medium enterprises and cooperative unions providing agricultural services that have economically feasible action plans but cannot access the inancing due to high risk they present. The programme is inanced by the European Investment Bank. Two types of loans are available - for investments and for working capital (including credit lines). The working capital
and investment loans taken together may not exceed LVL 300 000 for one entrepreneur (SME Growth…, 2011).
— Investment Loan in SEB and Swedbank in
cooperation with the European Investment Fund. Investment loan is aimed to grant loans to small and medium size enterprises in Latvia. It is possible to inance investments in movable and immovable ixed assets and working capital to promote core expansion and development using loan of the European Investment Fund (Eiropas investiciju…, 2011).
For growth and development of MSME, it is still possible to use help and advice of business angels and
mentors as well as it is possible to use services of business incubators if the business is established not earlier than
2 years before entering incubator.
3. Support diversiication for the development of micro, small and medium size enterprises in Zemgale region
Zemgale region consists of 20 local municipalities and 2 cities, and each of 22 territories shows different development indicators. Therefore, the authors suggest to diverse inancial support available for MSMEs to ensure development of all local municipalities. To difference the support system, it is important to group 22 territories into few clusters. This allows to group homogeneous territories into groups and afterwards to work with each group separately. The authors use cluster analysis with 4 factors: number of micro enterprises per 1000 capita in 2009; number of small enterprises per 1000 capita in 2009; number of medium size enterprises
per 1000 capita in 2009; and specially supported
territory status. Specially supported territory status is used to describe territories with long lasting negative social and economic processes.
Source: authors’ construction
Fig. 2. Support available for the growth and development of micro, small and medium size enterprise
Z. Gruzina, A. Zvirbule-Berzina Support Diversiication for Micro, Small and Medium Size Enterprises in Zemgale Region

53
Economic Science for Rural Development Nr. 28., 2012
ISSN 1691-3078
Local municipalities and cities are grouped in
4 clusters (Figure 3). Cluster 1 consists of Rundale, Skriveri, Koknese, Iecava, Vecumnieki, Jelgava, Plavinas, and Tervete local municipalities. Cluster 2 consists of Auce, Jaunjelgava, Krustpils, Viesite, and Nereta local municipalities. Cluster 3 consists of Aizkraukle, Ozolnieki,
Bauska, and Dobele local municipalities, and Jelgava and Jekabpils cities. Cluster 4 consists of Akniste, Jekabpils, and Salas local municipalities. As shown in dendogram, the closest connection between data is in Cluster 1 as linkages between local municipalities are close. Opposite is Cluster 4, where linkages between Akniste, Jekabpils,
Table 3
Description of clusters according to the cluster analysis
CriteriaClusters
1 2 3 4
Average number of micro enterprises per 1000 capita 35.4 50.1 39.5 94.2
Average number of small enterprises per 1000 capita 1.6 1.7 3.7 1.5
Average number of medium enterprises per 1000 capita 0.2 0.3 0.8 0.6
Specially supported territories -
Auce, Nereta, Viesite, Krustpils,
Jaunjelgava-
Sala, Jekabpils, Akniste
Source: authors’ construction
Source: authors’ construction
Fig. 3. Dendogram using average linkage for local municipalities in Zemgale region
Z. Gruzina, A. Zvirbule-Berzina Support Diversiication for Micro, Small and Medium Size Enterprises in Zemgale Region

Economic Science for Rural Development Nr. 28., 2012
ISSN 1691-3078
54
and Sala local municipalities are not as close. According to the information in dendogram, the authors describe each cluster in Table 3.
Cluster 1 links territories with the average of 35 micro enterprises, 2 small, and 0.2 medium enterprises per 1000 capita. Cluster 2 links territories with the average of 50 micro enterprises per 1000 capita, 2 small, and 0.3 medium enterprises per 1000 capita; besides there are 5 specially supported territories in this cluster. Cluster 3 merges territories with the average of 50 micro enterprises per 1000 capita, 4 small, and 0.8 medium enterprises. Cluster 4 contains three local municipalities with very high number of micro enterprises per 1000 capita - 94, which is almost 3 times more than in Cluster 1 and Cluster 3; however, there are 2 small and 0.6 medium
size enterprises per 100 capita, so all 3 local municipalities are specially supported territories.
Conclusions, proposals, recommendations
Access to inancial support is one of the main problems for micro, small and medium size enterprises. Therefore, the authors of the article suggest that according to the
analysis of Zemgale region it is possible to diverse the available support:
1. Cluster 1 links territories with the lowest number of micro enterprises per 1000 capita, average number of small enterprises, and lowest number of medium size enterprises. In these territories, it is important to stimulate the establishment of new micro and small enterprises, and also to stimulate the growth of existing micro and small enterprises into medium and large size enterprises. It is necessary to stimulate the establishment of new micro enterprises through programmes like ALTUM Start Programme, Micro Lending Programmes as well as education and training.
2. Cluster 2 is characteristic with a high number of micro enterprises per 1000 capita but lower number of small and medium size enterprises. Because of high share of micro enterprises, there are
5 local municipalities, which are specially supported territories with negative social and economic environment. It is important to stimulate the growth of micro enterprises into small, medium and large enterprises through Competitiveness and SME Growth Loan Programmes.
3. Cluster 3 merges territories with the second lowest number of micro enterprises and the highest number of small and medium size enterprises per 1000 capita. High share of small and medium size enterprises, which employs between 11 and 249 employees ensures that territories do not have negative social or economic situation. In this cluster, it is important to stimulate the establishment of micro enterprises through programmes like ALTUM Start Programme, Micro Lending Programmes as well as education and training, yet, at the same time it is important to keep small and medium size enterprises developed, since they ensure high
employment.
4. Cluster 4 contains three local municipalities with a very high number of micro enterprises per 1000 capita but at the same time, there is a very low number of small and medium size enterprises. The high share of micro enterprises leads to the fact that all 3 municipalities are specially supported territories with negative social and economic indicators. The main task in this cluster is to stimulate the growth of the existing micro enterprises into medium and large enterprises. It is necessary to stimulate growth and development of existing micro enterprises, rather than establishment of new micro enterprises.
Bibliography 1. Biznesa inkubatori (Business Incubators). LIAA
(2011). Retrieved: http://www.liaa.gov.lv/?object_id=2843. Access: 16 January 2012.
2. Competitiveness Programme. ALTUM. Retrieved:
http://www.altum.lv/public/29728.html. Access: 16 January 2012.
3. Eiropas Investiciju fonda krediti maziem un videjiem uznemumiem (European Investment Fund Loans to Small and Medium Size Enterprises). SEB (2011).
Retrieved: http://www.seb.lv/lv/corporate/services/credits/eif/. Access: 16 January 2012.
4. European SMEs Under Pressure. European
Commission (2010). Retrieved: http://ec.europa.eu/enterprise/policies/sme/facts-igures-analysis/pe r f o rmance - r ev i ew/pd f /dgen t r_annua l _report2010_100511.pdf. Access: 16 January 2012.
5. Micro Lending Programme. ALTUM (2011). Retrieved:
http://www.altum.lv/public/29777.html. Access: 16 January 2012.
6. Microenterprise Support Concept (2009). Ministry of Economics. Retrieved: www.em.gov.lv/images/modules/items/map_1.doc. Access: 16 January 2012.
7. Mikro, mazo un videjo uznemumu skaits 2004 - 2009 (Number of Micro, Small and Medium Size Enterprises 2004 - 2009). Centrala statistikas parvalde (2011). Retrieved: http://data.csb.gov.lv/DATABASE/rupnbuvn/Ikgad%C4%93jie%20statistikas%20d a t i / S t a t i s t i k a s % 2 0 v i e n % C 4 % A B b u % 2 0r e % C 4 % A 3 i s t r s / S t a t i s t i k a s % 2 0vien%C4%ABbu%20re%C4%A3istrs.asp. Access:
16 January 2012.8. MSME deinition. European Commission (2003).
Retrieved: http://ec.europa.eu/enterprise/policies/sme/facts-figures-analysis/sme-definition/index_en.htm. Access: 16 January 2012.
9. Pasakumi komercdarbibas vai pasnodarbinatibas uzsaksanai (Measures for Business or Self-employed Start-ups). State Employment Agency
(2011). Retrieved: http://www.nva.lv/index.php?cid=3&mid=311&new_lang=lv#komerc. Access: 16 January 2012.
10. Report on the Results of the Survey on the Access
to Finance of Small and Medium-sized Enterprises in the Euro Area – April to September 2011. European
Central Bank (2011). Retrieved: http://www.ecb.int/press/pr/date/2011/html/pr111201.en.html. Access: 16 January 2012.
Z. Gruzina, A. Zvirbule-Berzina Support Diversiication for Micro, Small and Medium Size Enterprises in Zemgale Region

55
Economic Science for Rural Development Nr. 28., 2012
ISSN 1691-3078
Z. Gruzina, A. Zvirbule-Berzina Support Diversiication for Micro, Small and Medium Size Enterprises in Zemgale Region
11. Schiffer M., Weder B. (2001). Firm Size and the Business Environment: Worldwide Survey Results. International Finance Cooperation. Retrieved: http://www-wds.worldbank.org/external/default/WDSContentServer/WDSP/IB/2001/12/01/000094946_01111704003345/Rendered/PDF/multi0page.pdf. Access: 16 January 2012.
12. SME Growth Loan Programme. ALTUM (2011). Retrieved: http://www.altum.lv/public/29773.html. Access: 16 January 2012.
13. Start Programme (ESF) Support to Business Start-ups. ALTUM (2011). Retrieved: http://www.altum.lv/public/29734.html. Access: 16 January
2012.

Economic Science for Rural Development Nr. 28., 2012
ISSN 1691-3078
56
J. Kalabova, J. Turcinkova Preferences of Consumers when Shopping for Regional Products
Preferences of Consumers when Shopping for Regional Products
Jitka Kalabova, Ing.; Jana Turcinkova, Ing., PhD.Faculty of Business and Economics, Mendel University in Brno
Abstract. This paper presents partial results of research on consumer preferences when shopping for food. It is focused on the area of regional products and consumer preferences in relation to the country origin of food products. The results are based on questionnaire survey that was conducted within the period from October 2010 to January 2011 on a sample of 3767 respondents from the Czech Republic, via both online questionnaires and its printed version. The questionnaire system ReLa, developed by the Department of Marketing and Trade at the Faculty of Business and Economics, Mendel University in Brno, was used for the data collection. Data were processed with statistical software STATISTICA (Ver. 9). Preferences for food of Czech origin were analysed in relation to identiication criteria. The
research results show that the origin of food plays an important role in consumer purchase decision-making. Results of analysis of contingency proved no association between the variables – levels of preferences and gender or size of the towns of respondents’ residence but a moderately strong degree of association between the selected values and respondents’ occupation, age and education. Key words: consumer behaviour, the Czech Republic, region, regional products.JEL code: M31, M19
Introduction The Consumer buying behaviour refers to the buying
behaviour of inal consumers, individuals and households that buy goods and services for private consumption (Kotler and Armstrong, 2008). Inluences that affect the behaviour of consumers during the buying process are very important. Consumers shall go through several stages of decision-making process. Most authors (e.g. Solomon, 2004; Belch and Belch, 2009) name the following ones: problem recognition, information search, evaluation of alternatives, product choices / purchase decision, and outcomes / post-purchase
evaluation.Marketers are also interested in how their customers
can be inluenced by marketing stimuli and what are the consequences (Figure 1).
Every company should monitor a customer satisfaction because it not only keeps bringing current customers back but it also attracts new customers who are increasing a turnover of the company (Kotler, 2007).
Local production and production of regional manufacturers (producers) should respond to the growing importance of location in the global food-complex. The growing interest of producers and consumers to deal with alternative alimentary system should be of paramount importance in the approach to perception regions. Consumers increasingly focus on the issue of health, food safety, the impact of globalised markets, animal welfare etc.
The Ministry of Agriculture of the Czech Republic has issued a methodology for the labelling of “Regional food”, according to which the regional food is a product that is made for consumption by the inal consumer. Such product is manufactured in the region and originates mainly from domestic raw materials (Ministry of Agriculture of the Czech Republic).
Jones, Comfort, and Hillier (2004) deal with the issue of local food and name a number of reasons for promoting regional food producers. One can start with the beneits
of the environment, economic, and social ields, besides that it also contributes to sustainable development. The authors point to the growth of employment opportunities in connection with the development of regional food production and the huge economic beneit for the region just in case of the sale of regional products. The authors also refer to the distribution options of food on the
consumer market. The farmers have more possibilities how to sell their products, such as the possibility for consumer to collect their own fruit and vegetables on a farm. It is also possible to operate the farms and shops to sell baskets with a seasonal selection of fresh vegetables and fruit. This method of sales then promotes regional identity, local economy and it has a deeper impact on good relations between producers and consumers. Such relationships result in competitive advantage (Thilmany, Bond and Bond, 2008).
Pratt (2007) also believes that local food production
and marketing brings beneits to farmers, food producers, and consumers. In order to increase farmers’ incomes, he proposes to remove the middle part of the supply chain, business intermediaries, and sell products directly to ultimate consumers. Beneicial is also the producers’ direct contact with consumers, this relationship between the seller and the buyer becomes more personal and trustworthy. Thilmany, Bond and Bond (2008) reach similar conclusions. For the consumer buying food, the place of origin of the food is important, and if the image of the place results in higher quality perception then it can affect his/her decision-making. The personal experiences of consumers with purchases of local food and their subsequent trust in producers and their products are also very important. For the consumer, it is also very important that their purchase contributes to the local economy.
In his article, McEntee (2010) summarises the reasons why people buy local food products. The advantage of buying seasonal food is its freshness and high nutritional
value. It is better to buy food directly on the site of its

57
Economic Science for Rural Development Nr. 28., 2012
ISSN 1691-3078
Source: Kotler, Armstrong, Principles of Marketing, 2008
Fig. 1. Consumer buying behaviour model
production, because transportation of food products to remote places burdens the environment. Thanks to local shopping, consumers meet food producers. Buying local food helps preserve open space and farmland. The productive farms maintain a higher quality of life. Purchasing local foods supports the local economy and the development of family farms, because more money stays in the region.
Research results and discussionThis paper presents the results of primary research,
which is focused on preferences of Czech consumers when buying food, especially regional food products. The aim of the article is to assess the consumer behaviour in the Czech Republic in connection with their perception of food origin. In this paper, the interest concentrates on inding how the consumers perceive Czech food products, whether they are preferred to foreign ones, and whether consumers prefer foods typical of the region where they live including the statistical testing of dependencies
between the parameters.
Data collection was conducted by researchers of the Department of Marketing and Trade at FBE MENDELU in the period from October to January 2011 on the sample of 3946 respondents from all regions of the Czech Republic. Totally, 3767 questionnaires were processed after elimination of incomplete
questionnaires. Online data collection was conducted via Research
Laboratory (ReLa) Questionnaire System and printed questionnaire version, too. Both sources were merged into one database. Statistical evaluation of the obtained data was conducted with the use of STATISTICA (V. 9).
The sample characteristics: — the sample is almost evenly divided into the following
three categories according to the size of the place
of the residence: up to 3,000 inhabitants, 3,000 - 89,999 inhabitants, and municipalities with 90,000 or more inhabitants;
— the largest group of respondents was a group that consists of people with secondary education, with leaving exam (50.6%);
Source: questionnaire survey, October 2010 to January 2011, n = 3767
Fig. 2. Mean values for factors, which are important when consumers are choosing a particular product in a store
J. Kalabova, J. Turcinkova Preferences of Consumers when Shopping for Regional Products

Economic Science for Rural Development Nr. 28., 2012
ISSN 1691-3078
58
— there were various social groups of respondents according to their occupation; the two largest groups are a group of students (38.0%) and a group of employees (38.0%);
— the most represented age category is 18–24 years of age (34.5%), second largest group consists of age category 35–54 years (22.4%), and the third one covers respondents in the age category between 25 and 34 years (17.0%);
— men are represented in the sample by
1518 respondents (40.3%) and women are represented in the sample by 2249 respondents (59.7%).
Looking at the position of the Czech origin as an evaluation criteria in contrast with other most frequently evaluated ones in food purchase decision-making, one can see that it does not belong to the top three, nor even top ive, it reached the 8th rank out of 13 evaluation
criteria provided, with the mean value of 6.38 on the scale
from 1 to 10. Only the recommendations and health aspects are of less importance for the total sample (Figure 2).
Respondents were also given a list of statements and they had to select a value on scale from 1 to
10 based on their level of agreement with the statement (10 meaning I totally agree). Table 1 shows the results for the statements focusing on
respondents consent with the statement relecting their shopping behaviour in relation to the origin of the food
products.The frequencies of individual values on the scale for
the total sample are presented in following two igures (Figures 3 and 4).
The Czech respondents assigned the food origin a medium importance (the typical selected value was 5). The following Figure 5 and Figure 6 illustrate differences in the levels of preferences between male and female respondents.
It is evident that the selected opinions by men and women are different but not dramatically. The independence on gender was proved also by the analysis of contingency (p-value = 0.22733). In general, one can see that the majority of both men and women consider the Czech origin as moderately or strongly important. The analysis of contingency, however, provided results, which are proving moderately strong degree of association between the selected values and respondents’ occupation, age, and education
(p-value = 0.00000).The approach to local origin (a particular region of
the Czech Republic) is a little bit different, despite the fact one cannot really see big differences between preferences of men and women when dealing with the issue. Again, results of analysis of contingency proved
Table 1
Results for the Czech Republic
Statement Mean Median Mode
I prefer Czech food to foreign 6.47 7 5
When I have a choice, I prefer local foods (food typical for the region where I live) 5.82 6 5
Source: questionnaire survey, October 2010 to January 2011, n = 3767
Source: questionnaire survey, October 2010 to January 2011, n = 3767
Fig. 3. I prefer Czech food products to foreign ones, %
J. Kalabova, J. Turcinkova Preferences of Consumers when Shopping for Regional Products

59
Economic Science for Rural Development Nr. 28., 2012
ISSN 1691-3078
no association between the variables – selected values and gender and size of the towns of their residence but a moderately strong degree of association between the selected values and respondents’ occupation, age, and education (p-value = 0.00000).
Respondents, in general, are not so deinite on the scale of their preference. The preferences reach its peak in value 5; nevertheless, the shares in other values both up and down the scale are more equal. Women seem to
show somewhat greater degree of patriotism, in this case a “local patriotism” (Figure 6).
The presented results focused on consumer preferences when buying regional food, other issues connected with consumer preferences are being further processed and will be published in following papers. During autumn 2011, the Department of Marketing and Trade also conducted a qualitative research with interesting indings.
Source: questionnaire survey, October 2010 to January 2011, n = 3767
Fig. 4. When I have a choice, I prefer local foods (food typical for the regi on where I live), %
Source: questionnaire survey, October 2010 to January 2011, n = 3767
Fig. 5. I prefer Czech food products to foreign ones, %
J. Kalabova, J. Turcinkova Preferences of Consumers when Shopping for Regional Products

Economic Science for Rural Development Nr. 28., 2012
ISSN 1691-3078
60
Conclusions, proposals, recommendations
The basic prerequisite for the promotion of regional food products is the fact that consumers are interested in the origins of food and that the origin of food plays an
important role in consumer purchase decision-making. From the perspective of marketing communication we can see a great potential in focusing on building an
awareness of Czech origin and regional origin of food products.
Either therefore, it should be considered as useful to highlight this information on the product packaging itself or by the way, the product is displayed at the point of sales. One option is a development of a brand, which can be seen in the case of regional food products as one of
the most important tools of marketing communication. Growing interest of the Czech consumers in quality and the food product origin is an opportunity for an increase
in competitiveness of regional producers on the Czech markets. Women tend to be even more patriotic than men are. Therefore, the emphasis on the local origin of the food product may be turned into product’s competitive advantage.
Bibliography 1. Belch, G.E., Belch, M.A. (2009). Advertising and
Promotion: an Integrated Marketing Communications Perspective. Boston. McGraw-Hill Irwin. p. 838.
2. Jones, P., Comfort, D., Hillier, D. (2004). A Case Study of Local Food and its Routes to Market in the UK. British Food Journal, Volume 106, Issue 4, pp. 328-335.
3. Kotler, P., Armstrong, G. (2008). Principles of
Marketing. New Jersey: Prentice Hall, 12th ed. p. 736.
4. Kotler, P., Wong, V., Sanders, J., Armstrong, G. (2007). Moderni marketing (Modern Marketing). Grada, Praha. 1th ed. p. 1041.
5. Pratt, J. (2007). Food Values: the Local and the Authentic. Critique of anthropology. Research in
Economic Anthropology, Volume 28, pp. 53-70.6. Regionalni potravina (2010). Portal Ministerstva
zemedelstvi CR (Ministry of Agriculture of the Czech Republic). Retrieved: http://eagri.cz/public/web/regionalni-potraviny/o-projektu/metodiky-a-loga. Access: 10 December 2011.
7. Solomon, M.R. (2004) Consumer Behaviour. Buying,
Having and Being. Pearson Prentice Hall. p. 621.8. Thilmany, D., Bond, C.A., Bond, J.K. (2008).
Going Local: Exploring Consumer Behaviour and Motivations for Direct Food Purchases. American
Journal of Agricultural Economics, Oxford Journals, Volume 90, Issue 5, pp. 1303-1309.
9. Winter, M. (2003) Embeddedness, the New Food Economy and Defensive Localism. Journal of Rural
Studies, Volume 19, Issue 1, pp. 23-32.
Source: questionnaire survey, October 2010 to January 2011, n = 3767
Fig. 6. When I have a choice, I prefer local foods (food typical for the region where I live), %
J. Kalabova, J. Turcinkova Preferences of Consumers when Shopping for Regional Products

61
Economic Science for Rural Development Nr. 28., 2012
ISSN 1691-3078
S. Klava Development and Structure of Latvian Agricultural Farms After Joining The EU
Development and Structure of Latvian Agricultural Farms After Joining The EU
Sanita Klava1, Mg. oec., PhD studentSenior oficer, Ziemelkurzeme Regional Agriculture Department of Rural Support Service
Abstract. The paper analyses the proportion of rented farmland in the total land balance as well as the use of farmland for the period of 2003-2010. According to this analysis, cereal crops in Latvia on average occupy more than 36% of the entire utilised agricultural area (UAA) farmed for crops and range within 14.9-54.4% depending on the region and the farm size group. The role of growing cereals in the agricultural industry is explained in the analysis and as a result, it is concluded that growing cereals is mostly popular among large farms because these farms have specialised in farming one group of crops. It was ascertained in the paper that the single area payments (SAPs) accounted for a signiicant share in the proit of enterprises. It was proved that without the SAPs, the indicators of inancial performance of enterprises would signiicantly worsen, especially proit that would decrease by 30-40% on average. Among several size groups of farms and in some regions, agricultural enterprises would suffer losses and be put out of business without these support payments. General research methods: creation, structuring and dynamics of time series analysis methods as well as general analysis, synthesis and grouping techniques.Key words: EU support, single area payment, inancial results, agriculture.JEL code: A12, H24, Q15.
___________________________1 E-mail address: [email protected].
IntroductionAgriculture is historically one of the most ancient and
important industries not only in Latvia but also in the whole world. Its formation and evolution is consistently associated with the development pace of mankind and with the progress in science and technology. The industry takes a signiicant position in the world’s economy; it has an essential role in the national economy of Latvia as well. The essential role and position of agricultural industry among all the industries have been researched and described by many authors.
In 1934, K.Ulmanis said in his speech: “Agriculture is the basis of culture of mankind, and we can completely rightfully speak about the human history of a country only since the moment this nation abandons its nomadic lifestyle, settles for permanent life in a speciic place and, therefore, creates a basis for its material life, i.e. agriculture” (Latvian Agricultural…, 1940).
The role of Latvia’s agricultural industry is emphasised by several researchers, for instance, V.Kaza (1976) says, “One of the prerequisites of existence of wildlife is land. Land is a source for producing agricultural commodities and food products and a necessary prerequisite for the functioning and development of other industries…”. K.Valdmanis (1983) also admits “Agriculture is an important industry for our nation. Its purpose is to provide the population with food products but the light and food industries – with raw materials…”.
The European Commission has published a report on the agricultural industry’s perspectives for the period of 2008-2015, which includes clear signals about the stability and even growth of the industry. Despite the signiicant short-term setback in the wake of the economic recession, the medium-term prospects for the EU agricultural
income remain positive with the aggregate income in real terms and per labour unit exceeding the very favourable 2007 year by 7.5% in 2015. While agricultural income in the EU-15 would show a very moderate development, it is foreseen to display a more pronounced picture in the EU-12 supported by the continuous increase in the CAP payments (European Commission, 2009b).
Another European Commission publication provides a summary on the Common Agricultural Policy instruments and their effect on agriculture: “The farming sector’s income development implies that without some kind of income support, many European farmers would not be able to stay in business” (European Commission, 2009a).
Z. Kazakevicius (2009), when working on the paper entitled “The Inluence of State Economic Support to Farmers Income Level”, made a conclusion that the subsidies accounted for more than a half of gross proit in Lithuania.
In Latvia, the effect of SAPs on farms and their proit has not been researched; therefore, it is important to ascertain it.
Research object – FADN data on the economic performance of farms.
Research hypothesis – single area payments have a positive impact on the income structure and development of farms.
To verify the hypothesis, the research aim was deined: to analyse and assess the income structure of farms and the situation in farms since the introduction of SAPs and to ascertain their effect.
To achieve the above aim and to examine the hypothesis, several research tasks were set:1) to research and analyse the proportion of rented
farmland in the total land balance and its changes

Economic Science for Rural Development Nr. 28., 2012
ISSN 1691-3078
62
since the introduction of SAPs as well as to analyse the distribution of farmland in the regions of Latvia;
2) to analyse the changes in areas sown with the main groups of crops;
3) to assess the effects of disbursed area payments on the total income of payment recipients.
Information published on the Farm Accountancy Data Network (FADN) of the Latvian State Institute of Agrarian Economics was used in the research. The FADN functions in all the Member States, its establishment and basic principles are regulated by the EU legislative enactments passed especially for this purpose.
Data samples are determined in accordance with the Regulation No. 1348 Procedure of the Establishment,
Maintenance, and Functioning of Farm Accountancy Data Network accepted by the Cabinet of Ministers of the Republic of Latvia on 24 November 2009, which stipulates that a data sample has to include not less than 1000 farms.
The FADN data are grouped using such an indicator
as European size unit, which characterises a farm’s possibilities to create value added that enables the
farm to raise its competitiveness depending on the chosen specialisation. By using a special formula, the FADN computes European size units and groups farms according to them. Computing European size units and determining specialisations are based on total standard gross margins.
The following research methods have been used in the paper - creation, structuring and dynamics of time series analysis methods as well as general analysis, synthesis and grouping techniques. Conclusions were drawn using the logical and constructive methods.
Research results and discussion 1. Analysis of the area of land used by farms
The study of the area of farm land was conducted by processing the FADN data up to an extent so that it is possible to conduct comparative analysis.
In Latvia, the FADN data are computed and grouped in accordance with the Regulation No.271 On the
Statistical Regions and their Administrative Units of the
Republic of Latvia accepted by the Cabinet of Ministers of the Republic of Latvia on 28 April 2004 and the statistical territorial classiication of the European Union
(NUTS 3) for six statistical regions. From 1 July 2009, Latvia’s territory consists of the following administrative units:
Riga (includes the city of Riga), Pieriga (Jurmala, the municipalities of Limbazi, Ogre, Riga, and Tukums), Vidzeme (municipalities of Aluksne, Cesis, Gulbene, Madona, Valka, and Valmiera), Kurzeme (Liepaja, Ventspils, and the municipalities of Kuldiga, Liepaja, Saldus, Talsi, and Ventspils), Zemgale (Jelgava, the municipalities of Aizkraukle, Bauska, Dobele, Jelgava, and Jekabpils), Latgale (Daugavpils, Rezekne, and the municipalities of Balvi, Daugavpils, Kraslava, Ludza, Preili, and Rezekne) (Grozijums Ministru kabineta..., 2010).
Figure 1 demonstratively shows the average sizes of farms in the regions during 2004-2010.
Several conclusions can be drawn from the
calculation results presented in Figure 1. — Figure 1 shows that the smallest average sizes of
farms are located in Latgale region – the average size of surveyed farms was 56 hectares in 2007. If this value is assessed in the context of information from Table 1, one can explicitly see that mostly small farms operate in Latgale region that actually could be called subsistence farms, which is speciic to this region.
— In contrast to the previously observed region of
Latgale, Zemgale region has large farms in terms of land area. For instance, the average Zemgale farm was 101 ha in size in 2007, whereas in 2010, the average size was 109 ha. It has to be noted that this fact does not mean that particular farms have increased in size, since not always the FADN collects annual data from the same farms and the data could be random.
— Inspected farms in Zemgale, Kurzeme, and Latgale regions have increased by 20% by the year of 2010 compared with 2004. Pieriga region has an average size of farms of 72 ha in 2010 the same as in 2004.
74
82
76
90
109
50 70 90 110
Pieriga
Vidzeme
Latgale
Kurzeme
Zemgale
Regio
n 2010
2007
2004
Source: author’s calculations based on the FADN data, 2004-2010
Fig. 1. Average sizes of farms in the regions during 2004-2010, ha
S. Klava Development and Structure of Latvian Agricultural Farms After Joining The EU

63
Economic Science for Rural Development Nr. 28., 2012
ISSN 1691-3078
— In Zemgale region, the greatest percentage increase is observed for the farm group of more than
250 ESU, reaching 33%, which can be explained by strengthening the position of large farms on the agricultural market.
— In Vidzeme region, the greatest percentage decrease compared with the base year is observed for the economic size group ranging within 100-<250 ESU. It is possible to explain it by the fact that in 2007 and 2008, a new farm group of ESU was introduced in the FADN data, which is >=250. It means that this group includes data gathered from farms whose size is more than 1000 ha.
Table 1 includes a calculation result on the proportion
of rented land in the total land balance over the period
of 2003-2010.Several important conclusions can be made according
to the calculation results in Table 1. It is worth mentioning the main one – the proportion of rented land decreases. One of the reasons why it happens is that land owners purchase the previously rented land. Since 2004, the EU area payments have been introduced in Latvia, and
farmers have had a possibility to apply for and use this support according to their own judgement. It is possible that a part of farms used this support for increasing the amount of owned land by purchasing additional land.
The relatively largest areas of rented land belong to
the farm group of 40-<100 ESU and to the bigger ones. The area of rented land exceeds the area of owned land. In the country, the area of rented land among the farms range from 35.6 to 39.9% on average.
2. Farm distribution by group of cropsResearcher A.Boruks has dedicated his scientiic
contribution to explaining and describing the history of Latvian crop farming, explicitly pointing to its role: “The role of crop farming in the history of our nation is very great, as it was the main type of occupation for many centuries… Farming emerged in Latvia along with the arrival of the Baltic tribes around the 18th century BC.” (Boruks A., 2003).
J.Klovans, R.Krogere et al. (1983) describe the beginning of crop farming and its evolution and deine it as follows: “Crop farming is one of the most ancient,
S. Klava Development and Structure of Latvian Agricultural Farms After Joining The EU
Table 1
Proportion of rented land in the total land balance over the period of 2003-2010, %
YearEconomic size of farms, ESU On average
per farm< 4 4 -< 8 8 -< 16 16 -< 40 40 -< 100 100 -< 250 >= 250
2003 17.1 23.7 39.1 49.1 66.3 68.2 68.1 35.6
2004 17.6 23.8 37.5 47.0 61.4 65.7 66.7 37.2
2005 15.0 23.2 37.0 45.0 59.8 62.8 60.3 36.0
2006 19.7 20.0 32.7 45.7 57.2 59.1 57.1 35.7
2007 11.5 21.8 32.6 44.9 55.8 63.5 59.9 36.5
2008 12.3 30.7 28.6 43.5 56.3 61.7 61.7 36.5
2009 15.4 32.9 30.7 45.4 57.9 61.2 54.5 37.2
2010 15.2 33.0 34.9 48.0 57.8 61.4 55.1 39.9Source: author’s calculations based on the FADN data, 2003-2010
Table 2
Percentage distribution of various crop groups by area compared with the whole area of land belonging to farms in the period of 2004-2010
Crop groupAverage in the period per farm
Economic size of farms, ESU
< 4 4 -< 8 8 -< 16 16 -< 40 40 -< 100 100 -< 250 >= 250
Cereals 36.0 14.9 22.3 34.2 43.3 53.2 54.4 51.4
Rape 5.8 0.2 1.5 2.3 5.2 10.8 13.9 16.0
Coarse fodder crops 18.2 26.2 20.0 18.6 16.6 10.5 13.0 15.7
Fallows 6.2 5.2 6.7 7.0 7.3 7.6 5.4 3.1
Meadows and pastures 25.9 41.5 40.0 30.8 20.8 11.9 8.3 7.1
Other crops 4.8 6.2 5.3 4.7 4.7 4.5 3.9 4.5
Unused AA 3.0 5.8 4.2 2.5 2.1 1.6 1.1 2.1Source: author’s calculations based on the FADN data, 2004-2010

Economic Science for Rural Development Nr. 28., 2012
ISSN 1691-3078
64
important, and extensive industries concerning public production. Its formation and evolution is closely associated with the pace of evolution of the whole mankind, the capacity of public production, and the progress in science and technology”.
To assess the changes in areas of crop groups, it is important to group the data in a way they are comprehensible and clearly perceptible. Crops that occupy on average more than 5% of the whole land area of farms were selected after analysing the data available on the FADN. The crops that occupy the relatively largest areas are grouped in Table 2.
After analysing the results included in Table 2, one can make several judgements and conclusions.
— The main group of crops that is grown in Latvia is cereals of various kinds, and the areas sown with cereals in the regions range from 14.9% up to 54% over the period from 2004 to 2010.
— Analysing the farm groups of ESU, an interesting observation becomes obvious – the greater the value of ESU for a farm group, the relatively more cereals are grown, which is actually logical because the large farms have specialised in growing particular groups of crops. The small farms behave in a different way and grow various crops.
— The groups of crops whose areas are less than 5% on average belong to ‘other crops’, for instance, pulses, potatoes, vegetables and lowers, perennial plants as well as other groups of crops.
— The table also includes data on agricultural land not
used for agricultural activities. Percentage of the used areas has the smallest share and the higher is the ESU group, the smaller is this share.
— On average, during the period of 2004-2010, 36% of the whole area of farmland was sown with various cereals, 25.9% was meadows and pastures, 18.2%
was coarse fodder crops, and about 6% of the area was farmed for rape or fallowed.
Unused agricultural land in the period takes up to 3% of the total area. The structure of the unused agricultural land has also changed from 2004 to 2010. Changes can be seen in Figure 2.
Although unused agricultural land area of the farm is ranging from 2.3% to 3.7% on average between years, it is seen that they differ in different ESU farms, which could also be seen in the table above. From calculations used to create Figure 2, the following tendency can be seen - agricultural land is increasingly used in agricultural
production. Farmers choose these areas for agricultural treatment and to apply larger areas for support payments.
3. Effects of single area payments on the proit of farms
The situation in rural areas of Latvia has signiicantly changed, since Latvia’s accession to the European Union, which took place in 2004. Farmers have a possibility to receive support payments of various types for doing business in rural areas including single area payments per hectare of utilised agricultural area that is maintained in a good agricultural and environmental condition.
The development of Latvia’s agricultural industry after joining the European Union was researched by I.Pilvere (2008). She analysed the amount of the EU support and its role in the national economy. The amount of the disbursed support over the reference period has increased 6.4 times and this rise with certainty exceeds the increase rates of other agricultural indicators, demonstrating that part of the support is evidently channelled to cover the growing costs (Pilvere I., 2008). L.Straujuma and K.Spogis (2006) have conducted a research related to the inancial situation in rural areas and made a conclusion that the
0,5
1,5
2,5
3,5
4,5
5,5
6,5
7,5
8,5
2004 2005 2006 2007 2008 2009 2010
%
< 4 4 -< 8 8 -< 16 16 -< 40
40 -< 100 100 -< 250 >= 250
Source: author’s construction based on the FADN data, 2004-2010
Fig. 2. Percentage distribution of unused agricultural areas in the period of 2004-2010
S. Klava Development and Structure of Latvian Agricultural Farms After Joining The EU
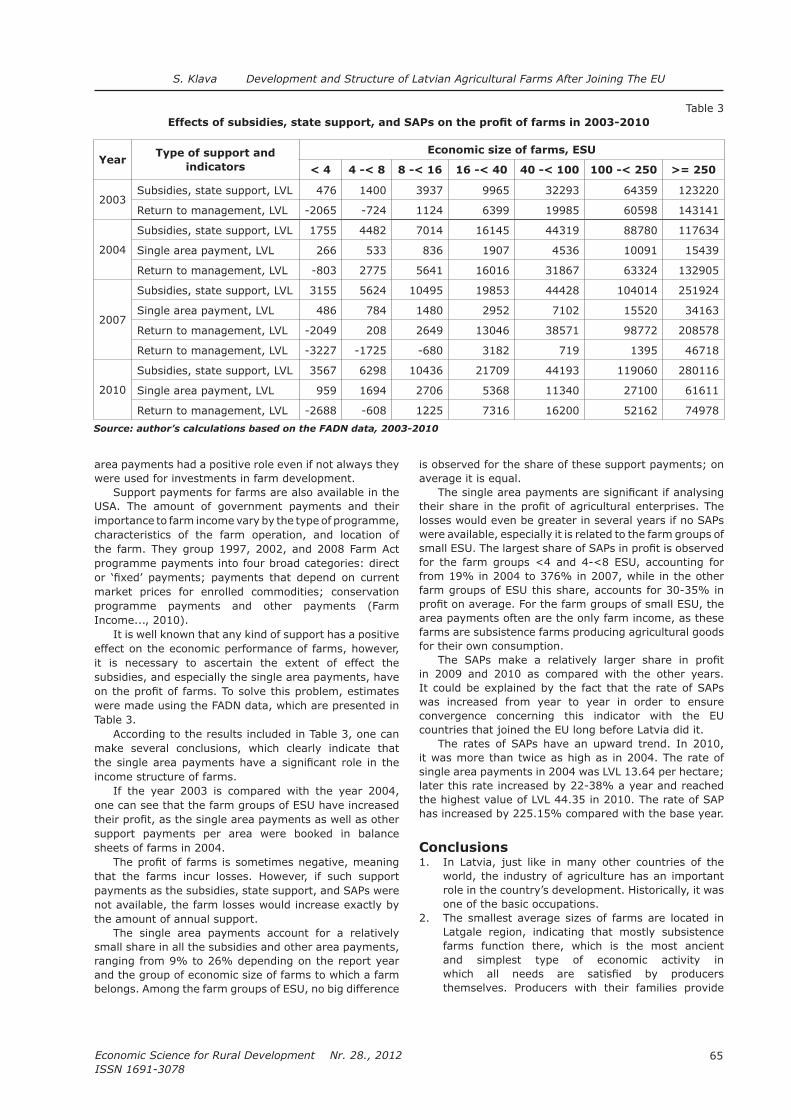
65
Economic Science for Rural Development Nr. 28., 2012
ISSN 1691-3078
area payments had a positive role even if not always they were used for investments in farm development.
Support payments for farms are also available in the USA. The amount of government payments and their importance to farm income vary by the type of programme, characteristics of the farm operation, and location of the farm. They group 1997, 2002, and 2008 Farm Act programme payments into four broad categories: direct or ‘ixed’ payments; payments that depend on current market prices for enrolled commodities; conservation programme payments and other payments (Farm Income..., 2010).
It is well known that any kind of support has a positive effect on the economic performance of farms, however, it is necessary to ascertain the extent of effect the subsidies, and especially the single area payments, have on the proit of farms. To solve this problem, estimates were made using the FADN data, which are presented in Table 3.
According to the results included in Table 3, one can make several conclusions, which clearly indicate that the single area payments have a signiicant role in the income structure of farms.
If the year 2003 is compared with the year 2004, one can see that the farm groups of ESU have increased their proit, as the single area payments as well as other support payments per area were booked in balance sheets of farms in 2004.
The proit of farms is sometimes negative, meaning that the farms incur losses. However, if such support payments as the subsidies, state support, and SAPs were not available, the farm losses would increase exactly by the amount of annual support.
The single area payments account for a relatively small share in all the subsidies and other area payments, ranging from 9% to 26% depending on the report year and the group of economic size of farms to which a farm belongs. Among the farm groups of ESU, no big difference
is observed for the share of these support payments; on average it is equal.
The single area payments are signiicant if analysing their share in the proit of agricultural enterprises. The losses would even be greater in several years if no SAPs were available, especially it is related to the farm groups of small ESU. The largest share of SAPs in proit is observed for the farm groups <4 and 4-<8 ESU, accounting for from 19% in 2004 to 376% in 2007, while in the other farm groups of ESU this share, accounts for 30-35% in proit on average. For the farm groups of small ESU, the area payments often are the only farm income, as these farms are subsistence farms producing agricultural goods for their own consumption.
The SAPs make a relatively larger share in proit in 2009 and 2010 as compared with the other years. It could be explained by the fact that the rate of SAPs was increased from year to year in order to ensure convergence concerning this indicator with the EU countries that joined the EU long before Latvia did it.
The rates of SAPs have an upward trend. In 2010, it was more than twice as high as in 2004. The rate of single area payments in 2004 was LVL 13.64 per hectare; later this rate increased by 22-38% a year and reached the highest value of LVL 44.35 in 2010. The rate of SAP has increased by 225.15% compared with the base year.
Conclusions1. In Latvia, just like in many other countries of the
world, the industry of agriculture has an important role in the country’s development. Historically, it was one of the basic occupations.
2. The smallest average sizes of farms are located in Latgale region, indicating that mostly subsistence farms function there, which is the most ancient and simplest type of economic activity in which all needs are satisied by producers themselves. Producers with their families provide
Table 3
Effects of subsidies, state support, and SAPs on the proit of farms in 2003-2010
YearType of support and
indicators
Economic size of farms, ESU
< 4 4 -< 8 8 -< 16 16 -< 40 40 -< 100 100 -< 250 >= 250
2003Subsidies, state support, LVL 476 1400 3937 9965 32293 64359 123220
Return to management, LVL -2065 -724 1124 6399 19985 60598 143141
2004
Subsidies, state support, LVL 1755 4482 7014 16145 44319 88780 117634
Single area payment, LVL 266 533 836 1907 4536 10091 15439
Return to management, LVL -803 2775 5641 16016 31867 63324 132905
2007
Subsidies, state support, LVL 3155 5624 10495 19853 44428 104014 251924
Single area payment, LVL 486 784 1480 2952 7102 15520 34163
Return to management, LVL -2049 208 2649 13046 38571 98772 208578
Return to management, LVL -3227 -1725 -680 3182 719 1395 46718
2010
Subsidies, state support, LVL 3567 6298 10436 21709 44193 119060 280116
Single area payment, LVL 959 1694 2706 5368 11340 27100 61611
Return to management, LVL -2688 -608 1225 7316 16200 52162 74978Source: author’s calculations based on the FADN data, 2003-2010
S. Klava Development and Structure of Latvian Agricultural Farms After Joining The EU

Economic Science for Rural Development Nr. 28., 2012
ISSN 1691-3078
66
themselves with everything that is necessary
for life.3. Zemgale region has the largest farms in terms of land
area. It is Latvia’s central and most agriculturally productive region owing to its rich soils. Large farms are located in the region, which extend their business by renting agricultural land from other farms.
4. A high proportion of cereals is observed in the area
structure of crops; on average, it accounts for 36% of the total area of farmland in Latvia. In the farm groups of 40-<100 ESU and more, cereals account for more than 53% of the total area.
5. The subsidies, state support, and SAPs have a signiicant role in the balance sheets of farms. It is proved that if no annual support payments were available, many farms would go out of business, as they cannot incur losses for a long time.
6. The single area payments account for 9-26% of the total amount of subsidies and state support, which change depending on the report year and the group of economic size of farms to which a far belongs.
7. The research results showed that the farms would perform without proit or even incur losses if such a type of support as single area payments were not available.
Bibliography1. Boruks, A. (2003). Farmer, Land and Crop Farming in
Latvia. LLU, Jelgava, 717 p. ISBN 9984-596-68-0.2. Cabinet of Ministers (2009). Procedure of the
Establishment, Maintenance, and Functioning of Farm Accountancy Data Network. Regulation
No. 1348. Latvijas Vestnesis No. 187 (4173), November 27.
3. Cabinet of Ministers (2004). On the Statistical Regions and their Administrative Units of the Republic of Latvia. Regulation No. 271. Latvijas Vestnesis No. 69 (3017), May 1.
4. European Commission (2009a). Prospects for Agricultural Markets and Income 2008-2015. Economic Analysis and Market Forecasts. Retrieved: http://ec.europa.eu/agriculture/publi/caprep/prospects2008/index_en.htm. Access: 30 May 2010.
5. European Commission (2009b). The CAP in Perspective: from Market Intervention to Policy Innovation. Agricultural Policy Perspectives, Brief No. 1. Retrieved: http://ec.europa.eu/agriculture/publi/app-briefs/01_en.pdf. Access: 22 May 2010.
6. Grozijums Ministru kabineta 2004.gada 28.aprila rikojuma Nr.271 “Par Latvijas Republikas statistiskajiem regioniem un tajos ietilpstosajam administrativajam vienibam” (2010): MK 2010. gada 28. decembra rikojumi Nr. 759 Retrieved: http://www.likumi.lv/doc.php?id=223639. Access: 30 December 2011.
7. Kazakevicius, Z. (2009). Inluence of State Economic Support to Farmers Income Level. Retrieved: http://www.lzuu.lt/vadyb/en/28129, ISSN 1822-6760. Access: 24 September 2009.
8. Kaza, V. (1976). Agricultural Use of Land. Riga: Liesma. p. 196. (p. 5).
9. Klovans, J., Krogere, R., Pogodins, S., Rubenis J. (1983). Crop Farming. Riga: Zvaigzne. p. 292. (p. 3).
10. Latvian State Institute of Agrarian Economics. (2005). Operating Results of Latvian Farms 2004. FADN. pp. 80-188.
11. Latvian State Institute of Agrarian Economics (2006). Operating Results of Latvian Farms 2005. FADN. pp. 82-111.
12. Latvian State Institute of Agrarian Economics. Operating Results of Latvian Farms 2006, 2007, 2008, 2009, 2010. Retrieved: https://sudat.lvaei.lv/Login.aspx?ReturnUrl=%2fDefault.aspx. Access: 10 December 2010.
13. Latvian Agricultural Board (1940). Latvia’s Land, Farmers and their Work. Republished by Latvian National Federation in Canada in Ottawa in 1980, p. 600.
14. Pilvere, I. (2008). The Proile of Agriculture and its Largest Enterprises in Latvia. Proceedings of the International Scientiic Conference “Economic Science for Rural Development” Finance and Credit Diversiication, Volume 11, pp. 12-19.
15. Straujuma, L., Spogis, K. (2006). Problems Concerning Balancing of Interests of Agricultural Production and Rural Population Density in the
Financial Aid Context. Proceedings of the International Scientiic Conference “Economic Science for Rural Development” Agriculture, Regional Developments, Volume 10, pp. 12-20.
16. United States Department of Agriculture (2010). Farm Income and Costs Receiving Government Payments. Economic Research Service. Retrieved: http://www.ers.usda.gov/Briefing/FarmIncome/govtpaybyfarmtype.htm. Access: 30 May 2010.
17. Valdmanis, K. (1983). Basics of Agronomy. Riga: Zvaigzne. p. 144. (p. 3).
S. Klava Development and Structure of Latvian Agricultural Farms After Joining The EU

67
Economic Science for Rural Development Nr. 28., 2012
ISSN 1691-3078
T. Kulikova Category Management as an Important Management Tool for Performance Enhancement of Rural Trade Enterprises
___________________________1 E-mail address: [email protected].
Category Management as an Important Management Tool for Performance Enhancement of Rural Trade Enterprises
Tatjana Kulikova1, Mg.oec.University of Latvia
Abstract. The aim of this paper is to present the results of research held by the author with target to ind new ways of implementation of management tools in order to ensure the performance enhancement for trade enterprises. The paper relects the results of the author’s research, aiming to take a speciic attention on the importance of use of Category
management approach managing a small rural trade enterprise. The aim of the research was to make scientiically approved practical and easy in use methodology for coordination of interaction for management of wholesale and retail trade enterprises in the process of Category management. Category management approach is a management tool that helps beneit from coordination of interaction between retailers and wholesalers. Today’s executives of biggest retail chains are already familiar with the beneits of Category management approach. Still the author’s research has proven that exactly the small rural trade enterprises are those which need help and instructions in performance enhancement by the use of category management approach. Key words: category management, TQM, trade enterprise performance enhancement.JEL code: R11
Introduction The following paper relects the results of the author’s
research, aiming to take a speciic attention on the importance of use of Category management approach
when managing a small rural trade enterprise. The aim of the research was to make scientiically approved practical and easy in use methodology for coordination of interaction for management of wholesale and retail trade enterprises in the process of Category management.
Category management is a process that involves
managing product categories as business units and customising them to satisfy customer needs. A category is a distinct, manageable group of products/services that consumers perceive to be interrelated and/or substitutable in meeting consumer’s needs. The goal of category management is to reach the maximum customer satisfaction and increase the eficiency of buyer-supplier collaboration. The principles of category management were started to use in the beginning of 1990s, while the marketing Guru in the United States of America tried to create an organised formal process of marketing that today is called Category management theory (Kulikova, 2009).
The methodology of research includes – analysis of management theory literature content; and modelling, processing, and analysing of statistical data. In order to identify the basic problems of research object –wholesale and retail trade organisations - qualitative research techniques like interviews with the executives of trade enterprises by division them into two different groups – executives of wholesale organisations (in some cases also manufactures) and retail organisations
were used in the research. In addition, interviews with the staff of a non-proit organisation ECR Baltic and the president of Latvian Chamber of Traders were used in order to get more comprehensive information on the processes of interaction between trade organisations.
The main literature review was started in the late autumn 2008. The collection of empirical data was started in 2009. The survey took place between autumn 2010 and spring 2011 and followed by
data analyses.The industry analyses showed that the number
of wholesale companies in Latvia decreases, while the turnover of those who stay on the market increases. According to the trend, in the near future only several strongest and biggest wholesalers would stay, they will control the market, thus, dictating the rules for smallest retailers that may lead to destruction of small retail business. The survey results analysis approved that the implementation of Category management was more required for management of rural trade enterprises than for already well developed management processes of the biggest retail chains that already conquered the trade industry in the biggest towns.
Research results and discussion1. Theoretical base of the research
Various theoretical perspectives that present the information on the classic management tools available for the managers and the tools that lead to improvement of coordination of interaction processes of trade enterprises
were used for the purposes of the research. The improvement of the coordination within the interaction process in its turn helps the enterprise enhance the
performance of the organisation. The management tools applicable in trade organisation like retail and wholesale trade companies are of the most interest within the held research.
The content analysis of different theories on classic
management tools as Fayol’s approach discussed by scientists (Morgan G., 2006), SWOT analysis debated by researches (Slocum, 1994; Weinhrich, 1982), Porter theory presented in works of experts (Porter M.,

Economic Science for Rural Development Nr. 28., 2012
ISSN 1691-3078
68
1998; Wang W., 2009) and McKinsey seven S model (Rasiel, Friga, 2002) were observed in the study. The discussion continues with the description of recent trends in management science and principles of modern management tools used by executives of organisations in order to enhance the performance of organisation. Within the discussion, the author glanced at the essence of such management tools as Balanced Score Card (Kaplan, Norton, 1992), Knowledge management (Hazlett, 2005; Wang W., 2009), Growth strategic approach (Rigby, 2009), Activity Based management (Ghikajanu, 2008; Trotta, 2003), and Downsizing (Vollman, 1993). Yet, more detailed attention was given for Category management
tool that ought to be one of the most popular tools within the executives of trade enterprises and different perceptions of this tool seen by researches (Vitek, 1998; ACNielsen, 1992; Hamister, 2007).
The author also pays a special attention to the
Total Quality Management (TQM). While some of the researches recognise the TQM as one of management tools, the author considers that TQM discussed by researches (Besterield et al., 2011; Deming, 1986; Juran, 1995; Kondo, 1993) should be perceived as more than simply a management tool. The author concludes that the use of TQM concept should be used as a primary philosophy for the creation of management policy of the enterprise.
2. Industry peculiarities for rural trade enterprises in Latvia
Thorough trade industry analysis was held within the perceived research. The overview of world retail market presents the processes of globalisation in retail industry
and peculiarities of grocery retail further narrowing the analysis to Grocery retail in the Eastern Europe and
current situation in the Baltic Grocery retail industry. The analysis of retail industry highlights the peculiarities of
Latvian Retail grocery. Commonly, there is a shift between the changes of
grocery and non-grocery retailers. Both grocery and non-grocery sales have dropped dramatically after the fall out. While grocery turnover declined by 22% in the year 2010 in comparison with 2008, the decline in non-grocery retail sector at the same period was almost 50% and
dropped under the level of the year 2005. The dynamics of retail turnover during the past years in Latvia is shown in Figure 1.
Sales of non-grocery retailers suffered much more as the majority of goods they sell are not staples, so purchases of these goods during the time of crisis were either cancelled or delayed. Sales of clothing and footwear retailers dropped by 29% in 2009 and 18% in 2010; the majority of these players admit there was no other way to attract consumers’ attention and stimulate sales than to offer considerable discounts up to 75% off. Many traders closed some of their stores, as sales turnover did not always justify expensive rent in shopping centres (Euromonitor International, 2011, January).
It is observed that the share of shops with big sales area has increased. The number of shops with sales area of 400-999 m2 and more than 1000 m2 has grown by 267% and 371% respectively and reached almost 959 shops with the area more than 400 m2 in comparison with only 238 in the year 1999. When one speaks about the sales area of the grocery shops, one should remember that rural trade companies own the shops with sales area rarely more than 100 m2. For example, besides more than 450 shops of trade cooperation AIBE included in cooperative, there are only two with the sales area more than 400 m2, 93 - with the area more than
100 m2, and more than 350 shops are with the area less than 100 m2; of which 165 are with the area 50 m2 and
less. Similarly, the structure is typical also for other trade cooperatives like LaTS and Balstor with shops Vesko that are mostly located in rural areas. Analysing the geographical situation of the shops, totally 72% of shops of the cooperative AIBE are situated outside the biggest towns of Latvia like Riga, Bauska, Liepaja, and Ventspils. Some of them are situated in places with the number of inhabitants even less like Aglona, Nereta, Skriveri, and other places.
In the year 2010, more than 80% of retail grocery turnover was generated by retail chains. Almost 50% of turnover belongs to two companies. Maxima Latvija SIA runs several hypermarkets, supermarkets, and numerous convenience stores and it belongs to Lithuanian company UAB Maxima Groupe. Table 1 presents the shares of
T. Kulikova Category Management as an Important Management Tool for Performance Enhancement of Rural Trade Enterprises
Source: author’s construction based on the statistical data analysis
Fig. 1. Retail turnover in Latvia, share of grocery versus non-grocery turnover

69
Economic Science for Rural Development Nr. 28., 2012
ISSN 1691-3078
major centralised retail chains with shops concentrated in the biggest towns of Latvia.
Nevertheless most of the shops of main retail chains are situated in the biggest towns; rural shops still suffer from the competition of biggest retail chains because consumers more and more choose to make purchases in a bigger supermarket of the closest larger and not in the neighbourhood small rural shop. There is no purposeful government support for traditional grocery retailing, so players apply different strategies to attract consumers themselves. Modern grocery retailers are much more prevalent in Latvia. In 2010, traditional grocery retailers, which include independent small grocers, food/drink/tobacco specialists and other grocery retailers, accounted for just 6% of total sales of grocery retailers (Euromonitor International, 2011, January).
In order to resist increasing competition from hypermarkets, supermarkets, and discounters, small grocery retailers unite in trade co-operatives. Trade co-operatives provide several advantages to the partners:
united recognised branding, united logistic system, marketing and advertising activities, a website with all addresses listed, and inancial support in case of temporary pressure for money. Table 2 presents the data on turnover share of trade cooperatives on retail grocery
market. Mego in addition to its 57 own supermarkets has
organised a cooperative and joined more than 370 small shops under the brand Vesko. The co-operative of Latvian retailers AIBE joined independent retailers in union starting from the year 1999. In 2007, some of the shops segregated and organised an independent co-operative
under the brand LaTS operated by Latvijas Tirgotaju Savieniba SIA. Iepirkumu grupa SIA also organised
T. Kulikova Category Management as an Important Management Tool for Performance Enhancement of Rural Trade Enterprises
a co-operative besides its 16 companies and joined
141 shops under the brand TOP! with the market share of 4.5% in 2010. In 2010, Elvi Grupa SIA faced insolvency and, to run its network of Elvi supermarkets, another company was created - Partikas Tirdzniecibas Apvieniba SIA. This new company operates now on a franchise basis convenience stores under the Elvi brand
name with 4.7% of the market share. Totally, there are ive main groups, which have joined on the co-operation principle and unite small retailers. Together they share 23.4% of turnover between 500 different legal companies with almost 1500 shops.
Wholesale companies operating in trade industry is the main supply chain of products for Grocery retail market. In an interview, a senior employee in a major retail chain estimated that more than 70% of the suppliers of major Latvian retail chains are categorised as Latvian SMEs generating less than 50% of the retailer’s total turnover, and less than 10% are categorised as international and/or global brands that provide more than 50% of turnover (Fel, 2008). More than 85% of goods in grocery retail, retailers buy from local suppliers and producers of wholesalers of goods.
However, as it was already presented, the number of wholesalers decreases and one observes a concentration on the wholesale grocery market. While the biggest retail chains start to import the goods themselves and produce the private brands, they are also deinitely strong to require the necessary purchasing prices from wholesalers. Small rural retailers do not have such power and usually should buy the goods at higher prices; at the same time, they still should compete with biggest retailers for sales pricing policy. Such situation minimises the proit and does not allow having additional expenses
Table 1
Share of turnover, grocery retail by brand, centralised chains
Brand Company name 2010 Cum. share 2010
Maxima UAB Maxima Groupe 24.3% 24%
Rimi, Supernetto Royal Ahold NV 23.9% 48%
IKI, Cento Coopernic 4.5% 53%
Mego Mego SIA 2.3% 55%
Stockmann Stockmann Oyj Abp 1.7% 57%
Sky Skai Baltija SIA 1.3% 58%
Beta Zemnieciba SIA 0.9% 59% Source: author’s calculations based on GMID database, Lursoft
Table 2
Share of turnover, grocery retail by brand, united co-operatives
Brand Company name 2010 Cum. share 2010
LaTS Latvijas Tirgotaju Savieniba SIA 6.6% 6.6%
Aibe Aibe Baltic UAB 5.3% 11.9%
Elvi Elvi Grupa SIA 4.7% 16.6%
Tops! Iepirkumu Grupa SIA 4.5% 21.1%
Balstor Baltstor SIA 2.3% 23.4% Source: author’s calculations based on GMID database, Lursoft

Economic Science for Rural Development Nr. 28., 2012
ISSN 1691-3078
70
T. Kulikova Category Management as an Important Management Tool for Performance Enhancement of Rural Trade Enterprises
that usually result in the fact that the owner of rural shop is at the same time the sales staff, head of the shop, merchandiser, and bookkeeper in one person.
3. Interpretation of the research results In order to investigate more precisely the real attitude
of management and the readiness to implement in day-to-day business relations basic concepts of Category
management approach, the author organised a survey to study the readiness of trade companies to implement the author’s proposed methodology as a basic tool to increase the competitiveness of an enterprise.
The wholesale enterprise managers and managers of retail companies were invited to participate in a survey. Thus, survey invitations were sent by e-mail and additionally 157 telephone calls to the managers of the companies from the list of biggest wholesalers and retailers were made. Finally, 179 replies were received and ready for the analysis.
The survey intended to explore, identify, and analyse the organisational management of Latvian trade companies – retailers and wholesalers - to clarify the differences between them and to test the validity of hypotheses.1. The number of wholesale companies decreases; at
the same time, the turnover increases. According to the trend, only several strongest and biggest wholesalers will stay and control the market in the near future, thus, dictating the rules for smallest retailers leading to the destruction of small retail business.
2. Wholesalers are more ready to work with retailers with higher market share and they do not wish to make investments in cooperation with small retailers.
3. Contemporary executives lack knowledge on the available management tools.
4. Category management is an important management tool for the performance of trade organisation.
5. The success for the implementation of Category
management principles depends on the compliance of quality management principles.
6. The opportunity of trade organisation to strengthen
and develop the desired position on the market and enhance the performance of organisation in addition to the usage of Category management depends on
the level of quality management development in the organisation.
First, the trends in trade industry were approved by already presented previous industry analyses. Second, by analysing the survey results, the author concludes that almost half of the wholesalers approved work with Rimi and Maxima retail chains that together generate almost half of the retail turnover. Less than one ifth of wholesalers have cooperation with Stockman and Sky. This fact relects the wholesalers’ attitude and readiness to work with smaller retail chains. Irrespective that IKI, Elvi, AIBE, and LaTS have almost similar market shares, the author concludes that wholesalers are more ready to work with IKI and Elvi that have a centralised order system and product assortment agreed for all shops in the contract and they do not take into consideration small shops like AIBE and LaTS.
Summarising the opinions of general managers and heads of departments of trade organisations both from
wholesaler and retailer representatives gathered from personal interviews and combining with the survey results, the author concludes that wholesalers are more ready to work with centralised retail chains and deliver the goods to shops located in biggest towns. The higher the market share of retailer, the more the wholesaler is ready to work with this retailer. The work with small retailers located in rural areas is not attractive for the wholesalers and it brings more expenses than proit because of much higher logistics expenses and the necessity to operate with a big number of sales agents in order to reach these shops. In this situation, wholesalers propose better purchasing conditions for the biggest retail chains and
worse for small and single retailers. As a result, small retailers receive the products with higher prices and they are not able to propose good prices for consumers and loose the competitiveness.
Third, the survey was held for the managers of retail and wholesale organisations that helped deine the awareness of managers on the management tools that promote to increase the competitiveness of organisation. The awareness of 23 different management tools were tested within the research. The answers of suppliers (wholesalers) and retailers were compared. The results highlighted that the Category management technique is a helpful management tool to increase the competitiveness of wholesale enterprise. According to the survey results, 36% of retailers and 57% of wholesalers are satisied with the use of Category management. The percentage of those who regularly or sometimes use the Category
management principles was higher in increasing the number of employees than those who did not use the tool.
Rather small satisfaction between retailers is explained by the fact that only the biggest retailers answered that they were satisied with the tools. Most of the retailers simply did not have any practice of Category
management implementation. Only 8% were not satisied with the tool, while 46% simply did not know whether they use the Category management approach.
It is suggested by the author for small trade enterprises to follow the collaboration process between the wholesaler and retailer following the Category
management technique and implementing it as a retailer/supplier process of managing categories as strategic business units, producing enhanced business results by focusing on delivering consumer value as it is proposed by former researches. It is recommended for retailers to pay a special attention to Category management process
as managing strategic business units, thus aiming to increase the proit of a whole category.
The statistical method T-test for independent samples was used to test if the usage of TQM and Category
management tools in organisations is dependent on
the number of employees and turnover of organisation. The perceived statistical test allows assuming that the highest break point for the existence of difference of relative frequency for the usage of TQM in organisations (organisations with higher number of employees use the tool relatively more frequently) is 100 employees. At the same time, testing frequency of Category management
tool usage in organisations, it was found that it is only 20 employees. Similarly, the dependence on turnover was tested and brought to conclusions that the highest
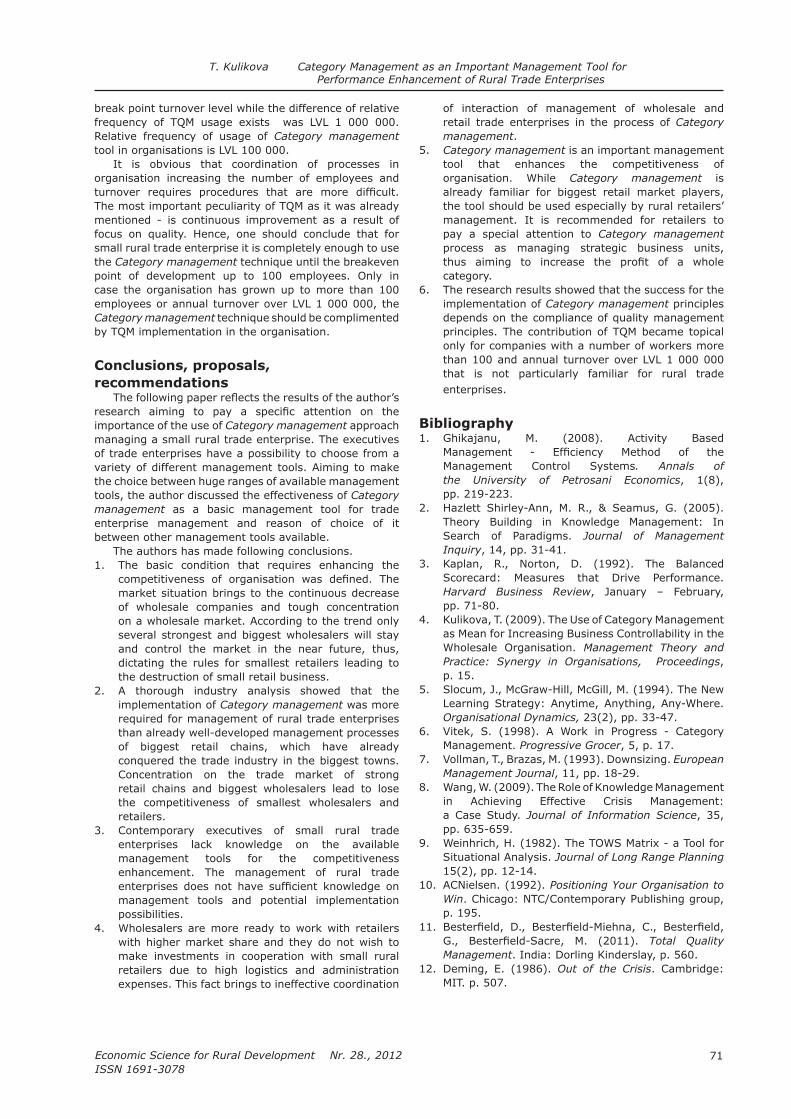
71
Economic Science for Rural Development Nr. 28., 2012
ISSN 1691-3078
break point turnover level while the difference of relative frequency of TQM usage exists was LVL 1 000 000. Relative frequency of usage of Category management
tool in organisations is LVL 100 000.It is obvious that coordination of processes in
organisation increasing the number of employees and turnover requires procedures that are more dificult. The most important peculiarity of TQM as it was already mentioned - is continuous improvement as a result of focus on quality. Hence, one should conclude that for small rural trade enterprise it is completely enough to use the Category management technique until the breakeven point of development up to 100 employees. Only in case the organisation has grown up to more than 100 employees or annual turnover over LVL 1 000 000, the Category management technique should be complimented by TQM implementation in the organisation.
Conclusions, proposals, recommendations
The following paper relects the results of the author’s research aiming to pay a speciic attention on the importance of the use of Category management approach
managing a small rural trade enterprise. The executives of trade enterprises have a possibility to choose from a variety of different management tools. Aiming to make the choice between huge ranges of available management tools, the author discussed the effectiveness of Category
management as a basic management tool for trade enterprise management and reason of choice of it between other management tools available.
The authors has made following conclusions.1. The basic condition that requires enhancing the
competitiveness of organisation was deined. The market situation brings to the continuous decrease of wholesale companies and tough concentration on a wholesale market. According to the trend only several strongest and biggest wholesalers will stay and control the market in the near future, thus, dictating the rules for smallest retailers leading to the destruction of small retail business.
2. A thorough industry analysis showed that the implementation of Category management was more required for management of rural trade enterprises than already well-developed management processes of biggest retail chains, which have already conquered the trade industry in the biggest towns. Concentration on the trade market of strong retail chains and biggest wholesalers lead to lose the competitiveness of smallest wholesalers and retailers.
3. Contemporary executives of small rural trade enterprises lack knowledge on the available management tools for the competitiveness enhancement. The management of rural trade enterprises does not have suficient knowledge on management tools and potential implementation possibilities.
4. Wholesalers are more ready to work with retailers with higher market share and they do not wish to make investments in cooperation with small rural retailers due to high logistics and administration expenses. This fact brings to ineffective coordination
of interaction of management of wholesale and retail trade enterprises in the process of Category
management.5. Category management is an important management
tool that enhances the competitiveness of organisation. While Category management is
already familiar for biggest retail market players, the tool should be used especially by rural retailers’ management. It is recommended for retailers to pay a special attention to Category management
process as managing strategic business units, thus aiming to increase the proit of a whole
category.6. The research results showed that the success for the
implementation of Category management principles
depends on the compliance of quality management principles. The contribution of TQM became topical only for companies with a number of workers more than 100 and annual turnover over LVL 1 000 000 that is not particularly familiar for rural trade enterprises.
Bibliography 1. Ghikajanu, M. (2008). Activity Based
Management - Eficiency Method of the
Management Control Systems. Annals of
the University of Petrosani Economics, 1(8), pp. 219-223.
2. Hazlett Shirley-Ann, M. R., & Seamus, G. (2005). Theory Building in Knowledge Management: In Search of Paradigms. Journal of Management Inquiry, 14, pp. 31-41.
3. Kaplan, R., Norton, D. (1992). The Balanced Scorecard: Measures that Drive Performance. Harvard Business Review, January – February, pp. 71-80.
4. Kulikova, T. (2009). The Use of Category Management as Mean for Increasing Business Controllability in the Wholesale Organisation. Management Theory and Practice: Synergy in Organisations, Proceedings, p. 15.
5. Slocum, J., McGraw-Hill, McGill, M. (1994). The New Learning Strategy: Anytime, Anything, Any-Where. Organisational Dynamics, 23(2), pp. 33-47.
6. Vitek, S. (1998). A Work in Progress - Category Management. Progressive Grocer, 5, p. 17.
7. Vollman, T., Brazas, M. (1993). Downsizing. European
Management Journal, 11, pp. 18-29.8. Wang, W. (2009). The Role of Knowledge Management
in Achieving Effective Crisis Management: a Case Study. Journal of Information Science, 35, pp. 635-659.
9. Weinhrich, H. (1982). The TOWS Matrix - a Tool for Situational Analysis. Journal of Long Range Planning
15(2), pp. 12-14.10. ACNielsen. (1992). Positioning Your Organisation to
Win. Chicago: NTC/Contemporary Publishing group, p. 195.
11. Besterield, D., Besterield-Miehna, C., Besterield, G., Besterield-Sacre, M. (2011). Total Quality
Management. India: Dorling Kinderslay, p. 560.12. Deming, E. (1986). Out of the Crisis. Cambridge:
MIT. p. 507.
T. Kulikova Category Management as an Important Management Tool for Performance Enhancement of Rural Trade Enterprises

Economic Science for Rural Development Nr. 28., 2012
ISSN 1691-3078
72
13. Juran, J. (1995). A History of Managing for Quality: The Evolution, Trends, and Future Directions of
Managing for Quality. Milwaukee, WI: ASQC Quality Press. p. 688
14. Morgan, G. (2006). Images of Organization. Thousand Oaks, p. 504.
15. Porter, M. (1998). Clusters and Competition:
New Agendas for Companies, Governments and
Institutions. Cambridge MA: Harvard Business School Press. p. 54.
16. Rasiel, E., Friga, P. (2002). The Mckinsey Mind: Understanding and Implementing the Problem Solving Tools and Management Techniques of the World’s Top Strategic Consulting Firm. New York, p. 218.
17. Trotta, R. J. (2003). Translating Strategy into
Shareholder Value. New York, p. 270.18. Euromonitor International (2011, January). Country
Market Insight, Retailing - Latvia. LU database. Retrieved: http://datubazes.lanet.lv:2136/Portal/Pages/Magazine/WelcomePage.aspx. Access: 16 April 2011
19. Fel, E. (2008). The Impact of Eficient Consumer Response (ECR) on Suppliers to Retail in Latvia. Promotion Paper, University of Latvia, Riga. LU database. Retrieved: http://www.lu.lv/biblioteka/resursi/nosleguma-darbu-db/. Access: 10 February 2011
20. GMYD database. Global Market Information Database. London. LU database. Retrieved: http://datubazes.lanet.lv:2136/Portal/Pages/Magazine/WelcomePage.aspx. Access: 16 April 2011.
21. Hamister, J. W. (2007). Impact of Category Management Practices. Buffalo: The State University of New York at Buffalo. ProQuest Dissertations & Theses database. Retrieved: http://datubazes.lanet.lv:3476/dissertations/index?accountid=27169. Access: 21 January 2011
22. Rigby, D. K. (2009). Management Tools 2009, An Executive Guide. Boston: Bain&Company. ProQuest Dissertations & Theses Database. Retrieved: http://datubazes.lanet.lv:3476/dissertations/index?accountid=27169. Access: 18 October 2011.
T. Kulikova Category Management as an Important Management Tool for Performance Enhancement of Rural Trade Enterprises
This paper has been supported by the European Social Fund within the project “Support for Doctoral Studies at the
University of Latvia”.

73
Economic Science for Rural Development Nr. 28., 2012
ISSN 1691-3078
A. Lenerts, I. Pilvere Role of Land Resources in the Development of the Market of Renewable Energy Sources of Agricultural Origin in Latvia
___________________________1 E-mail address: [email protected]
Role of Land Resources in the Development of the Market of Renewable Energy Sources of Agricultural Origin in Latvia
Arnis Lenerts1, Mag.oec., PhD student; Irina Pilvere, Dr.oec., professorFaculty of Economics, Latvia University of Agriculture
Abstract. To comply with the requirements of the EU Directive 2009/28/EC for using renewable energy sources (RES) in Latvia, the agricultural industry has to become a signiicant supplier of resources to energy producers and consumers. An increase in the area sown with maize is forecasted by exploiting the unused agricultural land to expand biogas production. The agricultural area has decreased by 2% in Latvia over the recent decade, and 16% of its total agricultural area are not exploited anymore. Thus, agricultural land resources are available to produce intensively RES for biogas production in the future and to achieve the target set for renewables by 2020, so that the total capacity of biogas facilities reaches 61 MW. In 2011, totally 24 new biogas facilities with a total capacity of 29.38 MW started operating. Nevertheless, the Ministry of Economics of the Republic of Latvia has granted 59 licences to purchase electricity produced from biogas in compliance with the renewable power purchase obligation. It means that raw materials are needed for newly established biogas facilities. Key words: RES (renewable energy sources), land resources, biogas, biomass, market.JEL code: C88, D29, O38, Q28, Q42, R11
IntroductionAccording to Latvia’s economic development
forecasts, the agricultural industry will gradually grow. The Ministry of Economics of the Republic of Latvia (2011) forecasts that positive growth rates are expected for almost all industries of the national economy, whereas export-oriented industries including agriculture, will grow faster than the national economy on average. The economic growth scenarios developed by the Ministry of Economics for a medium term (until 2016) indicate that Latvia’s Gross Domestic Product might increase by 2.7-4.8% a year (depending on the scenario), while primary industries including agriculture are expected to grow at an average rate within a range of 3.5-4.1% a year.
In forecasting the economic growth, it is assumed that the agricultural sector would produce traditional agricultural products. Yet, the foundation of biogas facilities started in Latvian rural areas in 2009. It means that in the territories where biogas facilities were constructed or will be constructed, energy crops for biogas production would be grown on agricultural land, thus, competing with the production of traditional agricultural commodities for food. According to I.Pilvere, V.Tetere, I.Upite (2011), by developing biogas production, “stable income from selling electrical energy, beneicial effect in agriculture and diversiication of income sources are gained from the results of implemented projects” as well they mentioned that “there is a possibility to use agricultural production waste”. B.Kniuksta, J.Caplikas (2011) conclude that “agriculture based bioenergy development has direct and indirect effects in economic, social, and environmental ields”. Yet, K.Naglis-Liepa, J.Leikucs, M.Pelse (2010) emphasise that “the EU energy policy is directed towards promotion of renewable energy proportion in total energy balance and Latvia’s ambitious aim is to achieve 40% of renewable energy in the total primary energy balance in the year 2010”. Therefore, the research on
how to balance the possible development of various industries in rural areas has to be conducted. Basically, it is necessary to analyse the use of agricultural land
resources to determine the availability of these resources for growing non-food crops. Presently, agricultural land is a signiicant resource in Latvia, which is used not only “for agricultural production but it is also a work object and a work tool, and it is substantial to ensure eficient land use” (Pilvere, 2008). B.Vaznonis (2010) emphasise that “beyond supplying food and ibre, agricultural activity can also be instrumental in forming the landscape, providing natural resources and preserving biodiversity”. Similar ideas belong to scientists such as B.L. Turner, E.F.Lambin, A. Reenberg (2007), S.Wirsenius, C.Azar, G.Berndes (2010), and A. Nikolaou, M. Remrova, I.Jeliazkov (2003). Qualitative indicators of using agricultural land point at insuficiently intensive agricultural production in Latvia. A small share of agricultural area available in Latvia is used for growing energy crops. Growing energy crops in the territories around biogas development centres will improve quantitative indicators of using land resources and is a prerequisite for a market of RES of agricultural origin to arise there. Yet, Latvia’s geographic situation and favourable climate are good prerequisites for the industries of agriculture and forestry to provide the
necessary RES.Therefore, the research aim is to analyse agricultural
land resources in Latvia to determine their availability for biogas production. The research object is agricultural
land resources in the territories of biogas development centres in Latvia, while the research subject, which will assist in identifying causes of the problem researched, is the market of RES in Latvia.
Research hypothesis: participants of the energy
market in Latvia are prepared to achieve a 40% share of the RES in gross domestic energy consumption by the year 2020.

Economic Science for Rural Development Nr. 28., 2012
ISSN 1691-3078
74
A. Lenerts, I. Pilvere Role of Land Resources in the Development of the Market of
Renewable Energy Sources of Agricultural Origin in Latvia
Research tasks:1) to characterise the agricultural land resources
and their potential availability to produce RES of
agricultural origin in Latvia;2) to determine the necessary quantity of biomass to
produce RES of agricultural origin according to the
strategic target set;3) to analyse the availability of agricultural land in the
regions of biogas production;4) to forecast the development of RES of agricultural
origin.The present research was performed in 2011, and
to achieve the research aim, information available by the Ministry of Economics of the Republic of Latvia and the Ministry of Environmental Protection and Regional Development of the Republic of Latvia (before 2010, the Ministry of Regional Development and Local Government), legal enactments related to production and sales of RES, strategic planning documents, Central Statistical Bureau data, a database of the Rural Support Service (hereinafter RSS), and research papers of other authors were used in the research. The following methods were employed in the research: analysis and synthesis, the monographic, abstract, logical, and graphical methods, a method of sociological studies (documentary analysis), and statistical methods (full statistical observation and information summarisation).
Research results and discussion1. Availability of agricultural land to produce renewable energy sources of agricultural origin
The industries of agriculture and forestry manage 83% of land resources available in the territory of Latvia. Agricultural land occupies approximately 37.6%, while forestland – 45.75% of the country’s rural areas. The economic growth has promoted changes in the area managed by the industries of agriculture and forestry in Latvia. Since 1930, the forest area has almost doubled in Latvia from 24% in 1930 to 45.7% in 2010. An especially signiicant increase in the forest area was observed during the Soviet period (Krastins, 2001). Its reasons were as follows: nationalisation of land, establishment of large collective and state farms, and due to inability to farm the entire agricultural area, part of it was transformed into fallow land and afforested. A factor promoting an increase in the forest area was the Soviet period’s purposeful patriotic leaders of the forest
industry who were able to use their inluence on political circles. The existing areas were effectively managed and new areas were afforested (Krastins, 2001). These processes continue nowadays as well. Latvia is presently one of the most wooded countries in Europe. An analysis of data showed that the forest area tended to increase. It is ensured by the fast growth of the forest industry and its signiicant role in supplying RES to energy producers and consumers on the Latvian and world
market.Changes in the agricultural area also characterise the
development of agricultural industries. The exploitation of the entire agricultural area indicates on the
development of the agricultural sector. Its development promotes the expansion of businesses and a more complete use of resources endowed by the nature. An unused agricultural area indicates that traditional
agriculture is not able to produce suficient income stimulating those engaged in agriculture to expand their business activities.
The previous trend in Latvia during the recent century, in general, indicated a decrease in the agricultural area and an increase in the unused agricultural area. However, the agricultural area (well-farmed area) has even slightly increased over the recent 10 years (2000-2010). The sown area rose in the period of 2003-2006 (by 26%), and afterwards a slight decrease was observed from 2006 to 2010. The areas of meadows and pastures were comparatively stable over the recent decade.
In the period of 2000-2010, 4% of agricultural land was transformed into land for construction.
Part of agricultural land is not presently used for
agricultural production. In 2010, it accounted for 16% and totalled to 368.9 thou. ha.
The Basic Guidelines of Land Policy for 2008-2014 elaborated by the Ministry of Environmental Protection and Regional Development of the Republic of Latvia include medium-term and long-term scenarios for land use in Latvia. The scenarios were worked out by taking into account trends in land policy and economic development in Latvia as well as those in land use in Europe. According to an assessment of the development trends, demand for agricultural land will increase over the near ten years, which would be caused by the increasing demand for food products. Therefore, the unused agricultural area has to decline. Thus, certain areas of
agricultural land are temporarily unused. Energy crops will be grown on a part of the agricultural area, a part of less fertile agricultural area will remain unused and
Table 1
Land uses in Latvia in 1935-2010, thou. ha
No. Indicators of land use 1935 1980 1990 2000 20102010
against2000, %
2010against1935,%
1. Total area 6579 6459 6459 6459 6459 100 98
2. Total agricultural area 3679 2581 2567 2485 2430 98 66
3. Forests 1742 2729 2803 2852 2955 104 170
4. Other land (occupied by
waters, roads, buildings) 1158 1149 1089 1122 1074 96 93 Source: authors’ calculations based on the RSS data, 2011 and SLS, 2011

75
Economic Science for Rural Development Nr. 28., 2012
ISSN 1691-3078
overgrown to maintain natural landscapes (Zemkopibas ministrija..., 2010). Therefore, a signiicant decrease in the agricultural area is not expected (RAPLM..., 2008).
According to a study of the Latvian State Institute of Agrarian Economics, the total arable area could change within a range +/- 4% compared with 2006 in the period until 2020. After comparing the forecast for the year 2020 and the real data for 2010 (CSB), an increase of 7% in the total arable area is expected (Eiropas Savienibas lauksaimniecibas un lauku attistibas..., 2008).
Based on the analysis of agricultural land resources, one can assure that these resources are not fully and
well exploited in Latvia. Both intensive and extensive development possibilities for producing RES of agricultural origin and satisfying this market’s demand may be explicitly observed.
2. Necessary quantity of biomass of agricultural origin to produce renewable energy sources according to the target set
Until 2020, according to various information sources, an 11-13% increase in the gross domestic energy consumption compared with 2008 is forecasted for Latvia, and it might reach an amount within a range of 55 780 GWh (Latvijas Republikas Riciba atjaunojamas..., 2010) – 56 944 GWh (Ekonomikas ministrija..., 2009). Increases in electricity consumption and fuel consumption by vehicles are mostly expected (Latvijas Republikas Riciba atjaunojamas..., 2010). According to a report (Latvijas Republikas regularais..., 2011), 5.06 GWh of electricity produced from RES was sold to the public company in 2010. In the same year, the following quantities were produced: 2139.7 thou. t of hay of perennial grasses, green forage, and silage; 209.0 thou. t of maize for silage and green forage; 7.7 thou t of grains; and 1.27 thou. t of rape – biomass of agricultural origin that could be used for biogas
production.In accordance with the document Basic Guidelines
for the Development of the Power Industry 2007-2016 (2006), which is in force, it was planned to construct biogas cogeneration plants with an electrical capacity of 61 MW in Latvia in 2010, while in 2020 their total capacity would have to reach 61 MW. A quantity of biomass needed for these biogas facilities was calculated according to the methodological instructions (Kalnins A. 2009), in which several models with a consumption of 300 (capacity
1 MW), 550 (capacity 2 MW), and 800 (capacity 3 MW) tons of biomass per day were available and it was based on a study Possibilities of Biogas Production from Various
Kinds of Biomass on a Farm (Skudra A., Adamovics A., 2011) that was conducted on Latvian farms in 2011. Based on an assumption that on average an electrical capacity of biogas plant is up to 1 MW and electricity
is produced for 330 days a year, the necessary quantity of biomass amounted to 550 thou. t a year. To provide a continuous operation of bioreactors with a capacity of 61 MW, approximately 1.5% of the available potential of biomass obtained from by-products in agricultural production has to be exploited. A total quantity of by-products in agricultural production, according to the calculations (Atjaunojamo energijas resursu..., 2006), consists of: 20 mln. m3 of crop farming residues and green forage; 3.2 mln. m3 of cattle manure; 20 mln. m3
of pig manure; and 21.6 mln. m3 of poultry manure a year.
By developing a cooperation model, based on demand and supply, for the market of RES of agricultural origin in Latvia, it is possible to achieve a higher share of RES in the gross domestic energy consumption. The target set by Latvia may be achieved from the viewpoint of availability of resources. The achievement of the target does not contradict with the uses of agricultural land: food production or growing energy crops.
3. Availability of agricultural land in the territory of biogas thermoelectric power plants
The present development of agricultural industries is assessed based on qualitative indicators of land resources. In Zemgale, agricultural land is mostly used for growing grains and energy crops, while in Vidzeme, it is used for meadows and pastures, which are a feed basis for dairy farming. Owing to active production, funds are accumulated in these regions. These funds provide the implementation of new business projects based on available agricultural resources.
The growth potential of Latvia’s agricultural industry is related to:
— increasing the agricultural sector’s competitiveness by modernising obsolete equipment and buildings (special attention has to be paid to longer-term investments), promoting the engagement of young age farmers in agricultural business, developing
Table 2
Unused agricultural land in Latvia in 2010
No. Land statusArea Cadastral units
ha % number %
1. Surveyed land 2 352159 100 326 309 100.00
2. Cultivated land 1 983260 84.3 259 696 79.6
3. Unused land: 368 900 15.7 66 613 20.4
4. Uncultivated land 316 341 13.5 56 571 17.4
5. Overgrown land 49 710 2.1 9 300 2.8
6. Landfor construction 2 849 0.1 742 0.2 Source: authors’ calculations based on the RSS data, 2011
A. Lenerts, I. Pilvere Role of Land Resources in the Development of the Market of Renewable Energy Sources of Agricultural Origin in Latvia
Economic Science for Rural Development Nr. 28., 2012
ISSN 1691-3078
76
professional skills of those employed in agriculture, promoting cooperation among agricultural producers, and by fostering the introduction of modern technologies for processing agricultural commodities and for logistics and sales chains;
— developing market-oriented production units contributing to an increase in value added in
the agricultural sector along with an increase in the overall eficiency in the agricultural industry;
— engagement of unused agricultural land in agricultural business.
The number of biogas facilities sharply increased in 2011, and 24 biogas thermoelectric power plants (hereinafter TEPP) with a total capacity of 29.38 MW were operating at the end of the year. The Ministry of Economics of the Republic of Latvia has granted licences to purchase electricity, in compliance with the renewable power purchase obligation, to 59 biogas TEPPs. The construction of biogas TEPP develops in agriculturally the most active regions of Latvia. In terms of territorial distribution, the biogas TEPP are located in the municipalities of Jelgava, Dobele, Ilukste, Burtnieki, Madona, Auce, Nica, Limbazi, Vilani, Vainode, and Iecava. In terms of regional distribution, 9 such facilities are in Zemgale (7.9 MW), 5 - in Vidzeme (6.87 MW), 4 - in Kurzeme (4.65 MW), 3 - in Latgale (2.2 MW), and 3 - in Riga (7.76 MW) planning region.
Agricultural land available in municipalities is exploited to provide the operation of biogas TEPPs. To determine the area of agricultural land used for biogas TEPP, the authors performed calculations based on RSS information on sown areas of crops in the territories located next to biogas TEPPs in 2011.
Maize is mostly grown for biogas production. Yields of maize green mass are high, and it provides good parameters for biogas production. Experiments are conducted on the training and research farm “Vecauce” of Latvia University of Agriculture to determine the most suitable varieties of hybrid maize for Latvian conditions. The research results (Bartusevics, Gaile,
2009) showed that yields of maize green mass ranged
within 43-61 t ha-1.In 2010, totally 405 thou. t of maize green mass
were produced for biogas TEPPs in the territories of municipalities located near these facilities. In the future, increasing the sown area of maize will be needed to provide the necessary quantity of maize green mass to biogas TEPP. It is useful to engage unused agricultural land in the sown area.
After analysing data on exploiting agricultural land, signiicant differences are observed among municipalities even within one planning region. In Jelgava municipality, which belongs to Zemgale planning region, 4% of agricultural land was not farmed, while in Iecava municipality, it reached 32%, amounting to a total of 7.4 thou. ha of unused agricultural land. Constructing biogas TEPP will improve the qualitative indicators of using agricultural land. In these regions, farmers have a possibility to diversify the structure of crops grown, thus, becoming resource suppliers to biogas facilities.
The purchase obligation at a certain price is based on
a long-term contract to diversify agricultural production risks related to price luctuations, especially for grain crops. The cooperation model established in such a way is a stable prerequisite for the market of RES of agricultural origin based on supply and demand. In the beginning of 2011, additionally approximately 800 thou. t of maize green mass may be produced by farming unutilised agricultural area in the analysed municipalities.
4. Use of land resources for more eficient production of energy sources of agricultural origin
Latvia will integrate into the common EU energy market in the near future. To be able to compete with other EU Member States on the energy market and, at the same time, to solve energy security problems of the national level, the country’s action plan is simple: the share and output of domestic energy resources have to exceed their consumption. An eficient use of land resources is a signiicant factor in implementing this
Source: authors’ calculations based on the RSS data,2011
Fig. 1. Sown areas in agricultural territories near biogas TEPPs in 2011
A. Lenerts, I. Pilvere Role of Land Resources in the Development of the Market of Renewable Energy Sources of Agricultural Origin in Latvia

77
Economic Science for Rural Development Nr. 28., 2012
ISSN 1691-3078
action plan. Large energy consumption by households and in the public and service sectors, and comparatively small energy consumption in the sectors of agriculture and manufacturing are speciic to the structure of energy consumers in Latvia.
Long-term development planning and the elaboration of a strategy ensure RES of agricultural origin are
produced according to the territorial location of energy
consumers.Constructing biogas TEPP in municipalities provides
an opportunity to design a regional energy supply
development plan and integrate it in the territorial plan of a municipality or town. It is possible to forecast the development of the country’s entire
energy sector based on the principle of integration. A supply network of RES of agricultural origin has to be established in the same way as a network of natural gas. It is possible to plan and forecast the quantities of resources produced based on the available resources
ofagricultural land.A research was conducted and scenarios were worked
out (ES lauksaimniecibas un lauku..., 2008) for using agricultural land resources. Possibilities for promoting the development of the market of RES by using government support and market regulation were presented in a research paper of Denina and Zvanitajs (2010). Other authors point to a need to establish a regional energy
supply system by integrating RES of agricultural origin in
Table 3
Low quality use of agricultural land in the municipalities of biogas development centres in Latvia in 2010
No. MunicipalityAgricultural
area, ha
Farmed agricultural land
Unutilised agricultural area
ha % ha % uncultivatedha
overgrownha
buildingsha
1. Jelgava 76979 73879 96 3100 4 2837 254 10
2. Vilani 15096 14469 96 627 4 527 95 5
3. Dobele 51018 48053 94 2966 6 2593 370 3
4. Ilukste 29577 27443 93 2134 7 2099 21 14
5. Burtnieki 28408 25307 89 3101 11 2519 561 21
6. Madona 81426 71755 88 9671 12 9127 496 47
7. Auce 26221 23042 88 3179 12 2680 443 56
8. Nica 11316 9610 85 1707 15 1588 115 3
9. Limbazi 39790 31355 79 8435 21 7954 459 22
10. Vainode 11094 8625 78 2469 22 1603 846 19
11. Iecava 13629 9330 68 4299 32 3591 693 15
12. Total 292479 342868 86 41688 14 36591 4258 211
Source: authors’ calculations based on the RSS data, 2011
Source: authors’ construction
Fig. 2. Development stages of RES market of agricultural origin
A. Lenerts, I. Pilvere Role of Land Resources in the Development of the Market of Renewable Energy Sources of Agricultural Origin in Latvia

Economic Science for Rural Development Nr. 28., 2012
ISSN 1691-3078
78
it. In general, the market of RES of agricultural origin in Latvia is at an early stage of development.
The present research will be extended by a long-term development forecast based on system dynamics and its analysis. Possibilities to optimise the process of production will be determined by modelling a necessary composition of substrates and supply channels for biogas TEPP. It is important to integrate the production of RES of agricultural origin with territorial development planning, as exploiting RES is related to constructing various infrastructure objects. Interactions of environmental, social, and economic processes will be modelled for biogas development centres in further research, which would ensure sustainable
territorial development.
Conclusions, proposals, recommendations1. Structural changes in Latvia’s national economy
promoted a change in the area of land exploited in the industries of agriculture and forestry. The share of forest area has almost doubled in Latvia since 1930 – from 24 to 45.7% in 2010.
2. The total of utilised agricultural area 369 thou. ha or 16% were not exploited in 2010.
3. In 2011, totally 24 biogas thermoelectric power plants with a total capacity of 31.35 MW operated in Latvia, establishing territorial biogas development centres.
4. The areas sown with maize are still small in the municipalities of biogas development, occupying 3% of the total agricultural area in 2011.
5. Various kinds of biomass of agricultural origin are needed for qualitative and economically feasible biogas development. Growing various energy crops for biogas TEPP in their nearest territories will shape the regional market of RES of agricultural origin based on demand and supply.
Bibliography1. Atjaunojamo energijas resursu izmantosana Latvijas
regionos un vides ekonomisko un socialo ieguvumu novertejums nacionalaja un regionalaja limeni (Use of Renewable Energy Sources in Latvian Regions
and the Evaluation of Environmental, Economic and
Social Gains on the National and Regional Level). (2006). Fizikalas energetikas instituts. Retrieved: http://www.innovation.lv/eee/default_files/FEI_lvaf_2006.pdf. Access: 20 December 2011.
2. Bartusevics, J., Gaile, Z. (2009). Pirmie rezultati par biogazes ieguvi no svaigas un skabetas kukuruzas
(First Results of Producing Biogas from Fresh and
Ensilaged Maize). Retrieved: http://llufb.llu.lv/conference/LLU-Vecauce/Vecauce2009-16-18.pdf. Access: 1 December 2011.
3. Blumberga, D., Blumberga, A., Dzene, I. (2010). Modelling of an Energy Sector Development in Latvia. Retrieved: https://ortus.rtu.lv/science/en/publications/8933/fulltext. Access: 15 December 2011.
4. Denina, A., Zvanitajs, J. (2010). Signiicance of State in Promotion of Renewable Electricity Development. Retrieved: https://ortus.rtu.lv/science/en/
publications/9583/fulltext. Access: 15 December 2011.
5. Eiropas Savienibas lauksaimniecibas un lauku attistibas politikas sagaidamas parmainas – perspektivais novertejums Latvijai un Baltijas valstim (Expected Changes in European Union Agricultural and Rural Development Policies: a Prospective
Assessment for Latvia and the Baltic States).
(2008). Retrieved: http://www.lvaei.lv/upload/Galazinojums_Baltijas_proj_1dec2008_LVAEI.pdf. Access: 12 December 2011.
6. Kalnins, A. (2009). Biogazes razosanas saimnieciskie un vides ieguvumi (Economic and Environmental
Gains from Biogas Production). 72.-92. lpp. Retrieved: http://www.erab.lv/Biogazes%20rokasgramata.pdf. Access: 25 September 2011.
7. Krastins, O.(2001). Latvijas saimniecibas vesturiska pieredze (Historical Experience of the Economy of
Latvia). Riga: Latvijas valsts agraras ekonomikas instituts. 71.-76. lpp.
8. Kniuksta, B., Caplikas, J. (2011). Competition for Land Resources resulting from Bioenergy Development: Theoretical Approach. In: Economics and Rural Development: Research Papers, Vol. 7, No. 1. Lithuania: Akademija, pp. 27-38.
9. Kopeja lauksaimniecibas politika lidz 2020. gadam: sasniegt partikas, dabas resursu un teritorialos nakotnes izaicinajumus (The Common Agricultural
Policy towards 2020: Meeting the Food, Natural Resource and Territorial Challenges of the Future). (2010). Retrieved: http://www.zm.gov.lv/doc_upl/ZMPoz_Nr1_KLP(2).pdf. Access: 26 November 2011.
10. Latvijas Republikas prognozu dokuments par atjaunojamo energoresursu ipatsvara bruto energijas galapaterina lidz 2020.gadam sasniegsanu atbilstosi Direktivas 2009/28/EK 4.panta 3.punktam (Forecast
Paper of the Republic of Latvia on Reaching the Share
of Renewable Energy Sources in Gross Energy Final
Production until 2020 in Accordance with Paragraph
3 of Article 4 of Directive 2009/28/EC). (2009). Retrieved: http://www.em.gov.lv/images/modules/items/ae_5.pdf. Access: 15 December 2011.
11. Latvijas Republikas Riciba atjaunojamas energijas joma Eiropas Parlamenta un Padomes 2009. gada 23. aprila direktivas 2009/28/EK par atjaunojamo energoresursu izmantosanas veicinasanu un ar ko groza un sekojosi atcel Direktivas 2001/77/EK un
2003/30/EK ieviesanai lidz 2020. gadam (Activity of
the Republic of Latvia regarding Renewable Energy
Sources to Fulil European Parliament and Council Directive 2009/28/EC of 23 April 2009 on Promoting
Renewable Energy Sources until 2020, which Amends
and Subsequently Cancels the Implementation of
Directives 2001/77/EC and 2003/30/EC). (2010). Retrieved: http://ec.europa.eu/energy/renewables/transparency_platform/doc/national_renewable_energy_action_plan_latvia_lv.pdf. Access: 10 October 2011.
12. Latvijas Republikas regularais zinojums par Indikativa merka sasniegsanas gaitu atbilstosi Eiropas Parlamenta un Padomes 2001. gada 27. septembra Direktivas Nr. 2001/77/EK par tadas elektroenergijas pielietojuma veicinasanu iekseja elektribas tirgu, kas razota, izmantojot neizsikstosos energijas avotus,
A. Lenerts, I. Pilvere Role of Land Resources in the Development of the Market of Renewable Energy Sources of Agricultural Origin in Latvia

79
Economic Science for Rural Development Nr. 28., 2012
ISSN 1691-3078
3. panta 3. punktam (Regular Report of the Republic
of Latvia on Achieving the Indicative Target in
Accordance with Paragraph 3 of Article 3 of Directive
2001/77/EC of the European Parliament and of the
Council of 27 September 2001 on the promotion of
electricity from renewable energy sources in the
internal electricity market). (2011). Retrieved: www.em.gov.lv/images/modules/.../EMZino_230811_77_EK_943.d. Access: 13 November 2011.
13. Naglis-Liepa, K., Leikucs, J., Pelse, M. (2010). Energy Externitalies in Latvia: Case Study of Auce Town. In: Science Journal “Social Research”, No. 4 (21), Siauliai University, Lithuania, pp. 28-35.
14. Nikolaou, A., Remrova, M., Jeliazkov, I. (2003). Biomass Availability in Europe. In: Bioenergy’s Role on the EU Energy Market. p. 80 Retrieved: http://ec.europa.eu/energy/res/sectors/doc/bioenergy/cres_inal_report_annex.pdf. Access: 12 January 2012.
15. Pilvere, I. (2008). Characteristics of Land Resources in Latvia. In: Economics and Rural Development: Research Papers, Vol. 4, No. 1. Lithuania: Akademija, pp. 29-36.
16. Pilvere, I., Tetere, V., Upite, I. (2011). Production of Bioenergy under EARDF Support in Latvia. In: Management Theory and Studies for Rural Business and Infrastructure Development. Lithuania University of Agriculture. Research Papers 3 (27), Lithuanian University of Agriculture Kaunas, Lithuania and Latvia University of Agriculture, pp. 158-165.
17. Skudra, A., Adamovics, A. (2011). Biogazes razosanas iespejas no dazadiem biomasas veidiem
razojosa saimnieciba (Possibilities for Biogas
Production from Various Kinds of Biomass on a Farm). Retrieved: http://www.llkc.lv/upload_ile/401352/LaukaDemonstrejumi2011.pdf. Access: 2 January 2012.
18. Zemes politikas pamatnostadnes 2008. – 2014.gadam (Informativa dala) (Basic Guidelines for Land
Policy for 2008-2014). (2008). Retrieved: http://
www.zm.gov.lv/doc_upl/pamatnostadnes.pdf. Access: 19 November 2011.
19. Turner, B.L., Lambin, E.F., Reenberg, A. (2007). The Emergence of Land Change Science for Global Environmental Change and Sustainability. Retrieved: http://www.pnas.org/content/104/52/20666.abstract?ijkey=351228b08153c591f324a151f59a5742eda7d353&keytype2=tf_ipsecsha. Access: 2 January 2012.
20. Wirsenius, S., Azar, C., Berndes, G. (2010). How much Land is Needed for Global Food Production under Scenarios of Dietary Changes and Livestock Productivity Increases in 2030? In: Agricultural Systems. Volume: 103 Issue: 9, pp. 621-638.
21. Vaznonis, B. (2010). Regulation of the Provision of Public Goods from Agriculture: Economic value Based Model. In: Economics and Rural Development: Research Papers, Vol. 6, No. 1. Lithuania: Akademija, pp. 30-39.
22. Unused Agricultural Land in Latvia. (2011). Retrieved: www.lad.gov.lv/lv/citi-pakalpojumi/lauksaimnieciba-izmantojamas-zemes-apsekosana/. Access: 17 November 2011.
A. Lenerts, I. Pilvere Role of Land Resources in the Development of the Market of Renewable Energy Sources of Agricultural Origin in Latvia
Economic Science for Rural Development Nr. 28., 2012
ISSN 1691-3078
80
O. Lukason Reasons of Firm Failures: Example of Estonian Agriculture,
Forestry and Fishing Industries in 2002-2009
Reasons of Firm Failures: Example of Estonian Agriculture, Forestry and Fishing Industries in 2002-2009
Oliver Lukason1, MA Faculty of Economics and Business Administration, Tartu University
Abstract. In the previous decades, a lot of research has been conducted on different topics of irm failures but a relatively underdeveloped research domain is failure reasons, especially in the context of primary sector irms. The main objective of current paper is to ind out the failure reasons of bankrupt irms in Estonian agriculture, forestry, and ishery sector. In general, 17 different failure reasons are detected based on Estonian court judgments from 2002 to 2009. A decrease in demand, some unexpected event, and unproitable principal activities are among the most frequent failure reasons. The average number of reasons in bankruptcy case is two. Fitting with modern failure theories, the most common is the case where external and internal causes are simultaneously present. The hypothesis that the sources of failure reason (i.e. emerging from internal or external environment of irm) vary through irms from different bankruptcy years or through irms from different industries is not supported. Key words: irm failure, failure reasons, bankruptcy, primary sector.JEL code: G33, Q12
___________________________1 E-mail address: [email protected].
Introduction The topic of irm failure has attracted the interest
of researchers for a long time and several different domains have been studied ranging from pre- to post-failure events. Among one of the most exploited topics is forecasting irm failure using inancial data, whereas less attention has been devoted to causes of failure. The main reason for such tendency could be the fact that relevant
information is not available in aggregate form and data should be obtained through case studies. Still, studying failure causes of irms from different industries plays an important role, as among others the understanding of irms’ decline path helps creating better failure warning systems and increasing irm survival.
The research object of current paper is Estonian
agriculture, forestry and ishery sector (NACE
Section A), which plays an important role in rural economy. In Estonian economy as a whole, the sector has less importance, since in recent years its share of GDP and total sales of irms has luctuated
between 2% and 3% according to the Statistics Estonia (2011). The importance of mentioned sector in employment has been larger, accounting for more than 4% of the workforce in recent years according to the Statistics Estonia (2011). Besides given statistical igures, it shall be noted that the speciic sector has lengthy traditions in Estonia, and is well known for its achievements in the neighbouring countries. Previously given aspect makes the chosen sector as an interesting research object for studying irm failures.
The main objective of current paper is to ind out the failure reasons of bankrupt irms in Estonian agriculture, forestry, and ishery sector. Several research questions have to be answered to achieve the objective of paper. First, it is essential to outline the main indings from available failure literature for the current study. Second, it is necessary to collect data on the failure reasons of
Estonian agriculture, forestry, and ishery sector irms.
Third, it is necessary to apply proper framework to attribute different reasons to either internal or external category. Besides the main objective of paper, it will also study whether irm failure reasons have changed through the years 2002-2009 and whether failure reasons vary through irms by different size groups. The paper has been structured following the previously given research questions and a separate subsection has been devoted each of the questions.
Research results and discussion1. Review of literature on irm failure reasons
Decades of research have brought multifaceted results to literature considering reasons of failure. Different theoretical approaches have assigned varying importance to internal and external forces in determining irm failure (e.g. Daily C.M., 1994; Mellahi K. and Wilkinson A., 2004). Although, elderly theories have emphasised either internal or external reasons in determining irm decline, modern theories have established that both factors are equally important. More speciically, irm failure is seen as a combination of irm’s general environment factors, immediate environment factors, management or entrepreneur characteristics, corporate policy, and irm’s characteristics (De Prijcker S. and Ooghe H., 2008). Still, it is evident that dependent on speciic situation, different factors can have varying role and importance. An approach offered by Boyle R.D. and Desai H.B. (1991) establishes a matrix of four different types of failure factors. Namely, factors are divided between their source (external or internal) and management response needed (administrative or strategic). When distribution between internal and external reasons is quite logical (i.e. whether an event is under the management control or not), then in case of response given, classiication is more subjective. Additional aspect to address is the deinition of failure.

81
Economic Science for Rural Development Nr. 28., 2012
ISSN 1691-3078
Although many studies have used samples of bankrupt irms for empirical analysis, which is also followed in the current paper, various studies (e.g. Cochran A.B., 1981) outline multitude of different terms used to describe irm failure.
Despite the abundance of studies on various irm failure topics, the list of papers conducting empirical analysis of failure reasons is not long. Despite most of such research has been conducted based on the
bankrupt irms’ data as noted previously, the source of information is in many cases diverged, originating either from managers or trustees. Beaver G. (2003) noted that failure studies showed remarkable discrepancies between owner-manager perceptions of failure reasons and the interpretation of same causes by researchers. Main results from some of the well-known studies will be synthesised as follows.
Hall G. (1992) used seven groups of owners’ perceptions of failure: operational management, strategic, environmental, personal technological, marketing, and rises in different variables. The study concluded that in about half of the cases the bankruptcy reason was operational management, more speciically the dominant categories were undercapitalisation and poor management of debt (respectively 235 and 111 out of 857 cases). The UK Insolvency Service study from 2005 concluded that in over 75% of cases, the main primary causes of failure for companies in compulsory liquidation was loss of market, failure to deal with tax affairs, and other management failures. Arditi D. et al. (2000) found that over 80% of the failures in the US construction industries were caused by ive factors, namely insuficient proit (26.71%), industry weakness (22.73%), heavy operating expenses (17.80%), insuficient capital (8.29%), and burdensome institutional debt (5.93%). Baldwin J. et al. (1997) found on the example of large set of Canadian irms that about half of young irms went into bankrupt primarily due to factors beyond their control, namely, economic downturn and increases in competition, while the other half primarily due to the basic internal weaknesses. It was also noted in Baldwin J. et al. (1997) that even in the case of bankruptcies that originated from external events, internal weaknesses were important factors contributing to failure. Novak B. and Sajter D. (2007) questioned 24 trustees and 17 judges in Croatia, who perceived the following important bankruptcy reasons:
general environment (undeveloped market, loss of market after gaining independence, technological backwardness, lack of governmental development strategy, effects of privatisation, and war), immediate environment (non-payment as normal behaviour), management (low quality, individual interests overrun irm’s, deception, no personal liability for irm’s debts), corporate policy (low salaries and many employees, unresolved human relations, bad planning, harmful contracts, avoidance of due obligations and weak inancial discipline). Lussier R.N. and Pfeifer S. (2001) extensive study on the previous failure literature found the most commonly cited failure reasons based on the US data to be undercapitalisation, poor record keeping and inancial control, businesses managed by people without industry experience, businesses managed by people without management experience, not having a business plan, not using professional advisors, education of management, no ability to attract and retain quality employees, and product/service timing and economic timing at market entry. The results clearly set the role of management in failure process in foreground compared with market and general environment issues. In their study, Lussier R.N. and Pfeifer S. (2001) also tested the variables on the example of CEE countries, inding the failure factors to be the same as for the US irms.
Several important conclusions can be drawn based on the review of literature. Authors have used different failure deinitions and varying classiications of failure reasons in their studies, which most probably have resulted from the usage of views of different stakeholders and data obtained from different economic environments. Contrary to modern theories, the weight in empirical literature still seems to be set on internal reasons, or at least on management inability and deiciencies in facing external pressures. There were no outstanding studies available to the author on agriculture, forestry and ishing industries, so this is a certain gap in literature to be fulilled with the current study.
2. Data and methodology of studyThe sources of failure reasons in the current study
are the court judgments about bankruptcy declarations. According to the Estonian Bankruptcy Act (2011), court judgments beside other information shall include information on the insolvency reasons. Publicised court judgments can be downloaded in Estonia for two periods:
Table 1
Bankruptcy declaration years of cases in the current study
Bankruptcy declaration year Number of cases
2002 7
2003 10
2004 7
2005 4
2006 6
2007 5
2008 4
2009 7
Source: author’s calculations based on the KIS and KOLA data
O. Lukason Reasons of Firm Failures: Example of Estonian Agriculture, Forestry and Fishing Industries in 2002-2009

Economic Science for Rural Development Nr. 28., 2012
ISSN 1691-3078
82
the irst database KOLA (Database of court statistics
and decisions) covers decisions from 2001 to 2005 and the second database KIS (Data system of courts)
covers decisions from 2006 and onwards. When the KIS database has been actively used by courts, then KOLA often lacks information. For the current paper, all publicised county court judgments of irm bankruptcies for the period of 2002-2009 were downloaded from the previously mentioned databases and in total, there were 50 judgments on agriculture, forestry, and ishing
industry irms. The mentioned court judgments incorporate the perceived causes of irm failure
presented by trustee. This is also the reason why court judgments do not include any predeined classiication system and instead causes are set as the best understanding of trustee. Table 1 shows the frequencies of used cases per bankruptcy declaration year.
In current study, data collection is followed by its aggregation to 17 different groups of perceived causes
listed in Table 2 and detecting the frequencies, how often the given reason is represented through the
cases. This is followed by determining whether speciic
reason can be attributed to internal or external category based on the classiications of Boyle R.D. and Desai H.B. (1991). The analysis is followed with aggregate reasons and three groups will be formed: 1) cases where only internal reasons are given; 2) cases where only external reasons are given; and 3) cases where both reasons (i.e. internal and external) are given. Using previously outlined classiication, Cramer’s V Coeficient (for detailed description see, e.g. Healey J.F., 2011) will be used to test whether the source of bankruptcy reason is associated with the bankruptcy year and irm size. More speciically the aim is to study, whether the source of bankruptcy reason (i.e. only internal, only external, both external and internal) varies for different bankruptcy years and different irm size groups.
The size categories are deined according to the European Commission Regulation 96/280/EC, which recommends using the following groups outlined according to the number of workers: 1) 0 employees, 2) 1-9 employees, 3) 10-49 employees, 4) 50-249 employees, 5) 250-499 employees, and 5) more than 500 employees. The source of number
Table 2
Firm sizes of cases in the current study
Number of workers Number of cases
1-9 26
10-49 9
50-249 3
Not disclosed 12
Source: author’s calculations based on the KIS, KOLA and ECR data
Table 3
Frequencies of bankruptcy reasons for studied 50 cases
Category of reason Speciic reason Frequency
Internal
excessive risk taking 1
insuficient equity capital 6
unproitable principal activities 11
nonperforming accounts receivable 3
unskilled management 9
inability to ind inances 6
failed investment 9
failed business plan 5
low quality product 2
criminal activity 8
External
increase in competition 7
decrease in demand 17
increase in input prices 8
action of cooperation partners 9
change in some regulation 4
unexpected event (e.g. natural disaster, theft) 12
overall economic recession 2
Source: author’s calculations based on the KIS and KOLA data
O. Lukason Reasons of Firm Failures: Example of Estonian Agriculture, Forestry and Fishing Industries in 2002-2009

83
Economic Science for Rural Development Nr. 28., 2012
ISSN 1691-3078
of workers is the Estonian Commercial Register (i.e. ECR) database. Thus, the following frequencies of pre-bankruptcy number of workers are obtained as outlined in Table 2.
3. Empirical analysis and discussion of results
Empirical results outline several interesting tendencies. The average number of reasons through all cases was two. Cases with two reasons were also the most frequent ones (21 cases), which were followed by cases with three reasons (12 cases) and one reason
(10 cases). Cases where there was only one reason were mostly attributed to situation, where criminal activities (e.g. tax fraud, embezzlement of resources) had been suspected by trustee. The most frequent reason was the decrease in demand for the product irm was offering, which in turn mainly resulted in the inability to sell product or earn suficient proit from sales. As a common problem to agriculture, forestry and ishery sector, unexpected event was the second most frequent cause of bankruptcy, whereas natural disasters dominated as the speciic reason. The third most frequent cause was unproitable principal activities. Eight other reasons were represented for more than 10% of cases and they were (in the order of importance, also see Table 3): unfavourable activities by cooperation partners (mainly termination of contract by suppliers or buyers), failed investment (allocation of money to some asset that did not create expected returns), unskilled management (lack of knowledge and education to run business), increase in input prices (mostly different supplies or labour), criminal activity (e.g. tax fraud, embezzlement of resources), increase in competition (emergence of additional competitors on local or foreign market, thus, reducing price of products), inability to ind inances (mostly for replacing obsolete technology), and insuficient equity capital (too low capital input by shareholders compared with the amount of used loans and also absence of reserves). Out of 50 cases studied, the most common situation was the one where both, internal and external reasons were present in court judgment (21 cases). This supports the modern theories and some of the previous empirical studies outlined in literature review. Cases, where there were only internal or only external reasons given, had almost the same representation, 15 cases and 14 cases respectively. In future studies, the current research can be developed by analysing combinations of different reasons and outlining the failure process in more detail through speciic case studies.
The empirical analysis is followed by testing whether there is signiicant association between bankruptcy
reason source and bankruptcy year or irm size. Firstly, Cramer’s V is calculated using different bankruptcy years. The test has suficiently large value (V = 0.375) but due to high approximate signiicance value (0.443), the hypothesis that the source of bankruptcy reason
and bankruptcy year are associated shall currently
be rejected (i.e. bankruptcy year does not allow to determine the source of bankruptcy reason). The same
tendency is followed with different size groups (V = 0.204, approximate signiicance = 0.531), i.e. the hypothesis that bankruptcy reason’s source and irm size are associated shall be rejected (i.e. irm size
does not allow to determine the source of bankruptcy reason). From previously given, it can be theorised that bankruptcy time (that can for instance mean different market situation, climate conditions, economic cycle) or irm size (determined by the number of workers) does not inluence the source of bankruptcy reasons in agriculture, forestry, and ishery sector. In future research, the mentioned associations could be studied with more complex statistical techniques (which would probably demand additional data). Also, additional independent variables could be introduced and the typology of reasons
further developed.
Conclusions, proposals, recommendations
Failure literature is extensive but highly diversiied. Most of the research has been directed to forecasting
failure with inancial variables and less attention has been devoted to failure reasons, especially to speciic sectors like agriculture, forestry and ishery
industry.Both, theories and empirical research offer varying
insight into the reasons of failure. Some studies relect the importance of either internal or external causes but modern literature emphasises more the role of both factors.
The three main causes of irm bankruptcies in Estonian agriculture, forestry, and ishery industry have been the decrease in demand, some unexpected event, and unproitable principal activities. The most common situation is where both, internal and external reasons cause bankruptcy.
Results in the current paper allow theorising that bankruptcy time or irm size (determined by the number of workers) does not inluence the source of bankruptcy reasons in agriculture, forestry, and
ishery sector.
Bibliography 1. Arditi, D., Kale, S., Koksal, A. (2000) Business
Failures in the Construction Industry. Engineering,
Construction and Architectural Management, Volume 7, Issue 2, pp. 120-132.
2. Baldwin, J., Gray, T., Johnson, J., Proctor, J., Raiquzzaman, M., Sabourin, D. (1997). Failing Concerns: Business Bankruptcy in Canada. Ottawa: Statistics Canada, p. 70.
3. Beaver, G. (2003). Small Business: Success and Failure. Strategic Change, Volume 12, Issue 3, pp. 115-122.
4. Boyle, R.D., Desai, H.B. (1991) Turnaround Strategies for Small Firms. Journal of Small Business
Management, Volume 29, Issue 3, pp. 33-42.5. Causes of Failure in Bankruptcy and Compulsory
Liquidation (2007) London: The United Kingdom Insolvency Service, p. 37.
6. Cochran, A.B. (1981). Small Business Mortality Rates: A Review of the Literature. Journal of
Small Business Management, Volume 19, Issue 4, pp. 50-59.
7. Daily, C.M. (1994). Bankruptcy in Strategic Studies: Past and Promise. Journal of Management, Volume 20, Issue 2, pp. 263-295.
O. Lukason Reasons of Firm Failures: Example of Estonian Agriculture, Forestry and Fishing Industries in 2002-2009

Economic Science for Rural Development Nr. 28., 2012
ISSN 1691-3078
84
8. De Prijcker, S., Ooghe, H. (2008). Failure Processes and Causes of Company Bankruptcy: a Typology. Management Decision, Volume 46, Issue 2, pp. 223-242.
9. Estonian Bankruptcy Act.(2011). Retrieved: https://
www.riigiteataja.ee/akt/129062011014. Access: 5 January 2012.
10. European Commission Regulation 96/280/EC. (1996). Retrieved: http://eur-lex.europa.eu. Access: 5 January 2012.
11. Hall, G. (1994). Factors Distinguishing Survivors from Failures amongst Small Firms in the UK Construction Sector. Journal of Management Studies, Volume 31, Issue 5, pp. 737-760.
O. Lukason Reasons of Firm Failures: Example of Estonian Agriculture, Forestry and Fishing Industries in 2002-2009
12. Healey, J.F. (2011). Statistics: A Tool for Social Research. Wadsworth: Cengage Learning, p. 560.
13. Lussier, R.N., Pfeifer, S. (2001). A Crossnational Prediction Model for Business Success. Journal of
Small Business Management, Volume 39, Issue 3, pp. 228-239.
14. Mellahi, K., Wilkinson, A. (2004). Organisational Failure: A Critique of Recent Research and a Proposed Integrative Framework. International Journal of
Management Reviews, Volume 5, Issue 1, pp. 21-41.15. Novak, B., Sajter, D. (2007). Causes of Bankruptcy
in Europe and Croatia. MPRA Paper, No. 5833, p. 17. 16. Statistics Estonia. (2011) Retrieved: http://www.
stat.ee/. Access: 5 January 2012.
AcknowledgmentThe study has been prepared with inancial support received from the Estonian Ministry of Education Research funding SF0180037s08.

85
Economic Science for Rural Development Nr. 28., 2012
ISSN 1691-3078
H. Mäkinen et al. Farmer Characteristics, Farm Management and Financial Performance on Finnish Dairy Farms
Farmer Characteristics, Farm Management and Financial Performance on Finnish Dairy Farms
Heikki Mäkinen, M.Sc, Matti Ylätalo, Dr.Sc.Department of Economics and Management, University of Helsinki;
Matti Ryhänen, Dr.ScSeinäjoki University of Applied Sciences.
Abstract. The aim of this study was to measure the management capacity of Finnish dairy farmers and to see how it affects inancial performance of the farm in a short run. A survey data relating to management capacity were analysed together with inancial results from 117 farms by factor analysis and correlation analysis. The results indicate that the gross margin of the farm is positively associated with a farmer’s satisfaction with inancial results and an active touch to management and development of the farm, characterised by high appreciation of profession, strong instrumental values, a high trust on the future success of the farm, and an entrepreneurial management orientation. The results also indicate that to understand better the effect of management capacity on inancial performance, a longitudinal study would be preferable, because it is necessary to take into account the development of inancial success along time and its dependency on investments and growth.Key words: management, proitability, success, dairy farm. JEL code: Q12
IntroductionThe most important task of a farm manager is to
lead the use of farm resources in such a way, that the goals set for farming can be achieved as well as possible. Researchers in the ield of agricultural economics and farm management largely agree that the farmer himself is an essential element affecting the achievement of goals (e.g. Westermarck, 1951; Castle and Becker, 1962; Muggen, 1969; Bigras-Poulin et al. 1985; Tarabla and Dodd, 1990; Fairweather, 1994; Galanopoulos et al. 2006; Nuthall, 2009; Rantamäki-Lahtinen, 2009). Textbook deinitions of farm management (e.g. Bradford and Johnson, 1953; Harsh et al., 1981; Dalton, 1982; Castle et al., 1987; Turner and Taylor, 1998; James and Eberle, 2000; Olson, 2004; Kay et al., 2008) share certain features. They all refer to the importance of goals of the business together with the goals of the individuals involved in the family farming system. They typically attempt to separate different phases of the managerial work into parts of a process, which should be followed. The third common feature is the emphasis given to the managerial ability or management skills of the farm owner or operator. Managerial capacity of a farm manager, as determined by Rougoor et al. (1998), is compromised of the necessary personal characteristics and skills to deal with decision problems at a correct way and time. Management ability is often used in literature as a synonym to management capacity. However, while the latter contains both the personal characteristics and the decision making system, the former essentially deals with the personality and psychological traits of the manager: it is based on the genotype of a person – personality, intelligence and cognition – and is shaped by education and experience along time (Nuthall, 2001).
Although the importance of the manager on the performance of a farm is recognised, it has been a challenge to measure – even when omitting this factor in
econometric models may lead to distorted results (McBride and Johnson, 2006). According to Ford and Shonkwiler (1994), managerial ability in econometric studies has most typically been taken into account as a set of demographic variables or proxies of production methods. However, it is very dificult to characterise the level of farm management by basic farm operator characteristics or proxies like eficiency of inancing, solidity of the farm, and success in cattle breeding (McBride and Johnson, 2006; Solano et al., 2006; Hansson, 2008). Rougoor et al. (1998) reviewed 23 scientiic articles that deal with managerial capacity and farm performance. In these, the most typical depicters of managerial capacity have related to biography and drives or motivations of the farmer. As a conclusion, they stated that the knowledge in this area is still rather limited. The inluence of education is often studied, but other personal aspects are under-exposed.
Despite the numerous studies that deal with farmers’ personal characteristics like goals, attitudes, skills, and decision making as regards achieving the desired level of performance, it has been a challenge to form an integrated model where all these could be taken into account. Rougoor et al. (1998) introduced a general framework of management capacity in relation to environment, biological processes, and farm results (Figure 1). In this framework, a manager with his personal characteristics is the starting point. He makes his decisions on various aspects of farming trying to optimise the technical and biological processes on the farm. These processes are only partially controllable but they determine the technical and economic results of the farm. Stochastic elements, like weather, diseases, and market luctuations together with the changes in operating environment also affect the outcomes.
Personal characteristics of the manager can be classiied into drives and motivations, abilities and capabilities, and biography. Even if a farmer has high

Economic Science for Rural Development Nr. 28., 2012
ISSN 1691-3078
86
personal skills and is operating on favourable conditions, it is possible to go wrong with farming if the decision making process is poor. This process is commonly divided into three phases, planning, implementation, and control, which are applied in the ields of inance, production, marketing, and human resources (e.g. Kay
et al., 2008; Boehlje and Eidman, 1984). The core
idea of this framework has been applied, for example, by Wilson et al. (2001), Trip et al. (2002), Solano et al. (2006), and Hansson (2008).
The aim of this study was to measure the management
capacity of Finnish dairy farmers by using variables that
describe their personal characteristics and managerial
behaviour and to see how the management capacity
affects inancial performance of the farm on a short run.
Data and methodsThe framework presented in Figure 1 was utilised
to achieve the objectives of this study. The data were collected from Finnish bookkeeping farms. There are about one thousand farmers, who participate in a comprehensive bookkeeping system maintained by MTT Agrifood Research Finland. The Finnish bookkeeping farms also belong to the Farm Accountancy Data Network of the EU (FADN). The accounting system produces a detailed picture of the inancial situation of the participating farms. In 2010, a survey was performed among the bookkeeping farms. The survey contained a large set of questions that were formed to measure farmers’ values, attitudes, and managerial behaviour. Answers to the questions were given in a Likert scale, where the extreme ends were of the type “totally disagree – totally agree”, “not important – very important” or “not at all – very much”, depending on the nature of each question. A total of 302 farmers answered the survey. Due to the missing values in single questions, the effective sample size varied
between 280 -290.
The survey questions were originally formulated so that it would be possible to calculate summated scales of them for further analyses. The survey data were irst analysed by the explorative factor analysis using the principal axis extraction method and orthogonal Varimax rotation. Some of the original questions were removed from inal analyses due to very low communalities or high cross loadings on several factors. The interpretation of each factor was based on the contents of the highest loadings. Summated scales to represent the numeral values of factors were then calculated as the mean of the values of the original questions. Only questions with loadings higher than 0.35 on a factor were taken into account and values of questions with negative loadings were reversed. These summated scales were then used as measures of values, attitudes, traits, and behavioural features of each farmer. The factor analyses were carried out in the whole survey data set (n=280-290), but only dairy farms and farmers (n=117) were selected for further analyses.
The summated scales depicting farmers’ managerial capacity were combined with the selected key igures from inancial statements of farms. The averages from the years 2008 and 2009 were used to decrease random variation of the inancial indicators. The following key igures were analysed:
— total turnover (EUR) to measure the size of the
farm; — Farm Net Income (EUR) to measure the amount of
compensation that the farming family gets for its own capital and labour;
— Gross Margin to measure the compensation for ixed inputs incl. own capital and labour;
— Proitability Coeficient to measure the relative proitability of the farm. It is calculated by dividing Farm Net Income with the required compensation of own capital and labour.
Source: Rougoor et al., 1998
Fig. 1. Management capacities in relation to environment, biological processes and farm results
H. Mäkinen et al. Farmer Characteristics, Farm Management and Financial Performance on Finnish Dairy Farms

87
Economic Science for Rural Development Nr. 28., 2012
ISSN 1691-3078
Research results and discussionBefore going deeper to presentation and analysis
of the research results, the data set utilised in this study – the bookkeeping farms - is worthy of a remark. The farmers who voluntarily participate in bookkeeping with MTT and return the survey forms do not form a representative sample. Most probably, a notable portion of the variance unique to inancial performance, farmer characteristics, and their managerial behaviour was not detected in this study. The bookkeeping farms are often assessed to belong to the best performing farms in Finland. The research results presented next should thus be interpreted mainly as illustrative. The results provide evidence about the existence of certain dependencies between the measured items, but the exact magnitudes do not necessarily apply to dairy farming in a larger population.
Factors and summated scales describing the farmer
Values and goals of the farmer were measured with 18 questions, which were condensed into four factors. The solution covered 55% of the variance of the original questions. The rotated factors could be interpreted similar to value dimensions introduced by Gasson (1973), which are commonly thought to represent the goal set of farmers (e.g. Kay et al. 2008). The corresponding summated scales were named as social values, instrumental values,
intrinsic values, and expressive values. Farmers’ trust on future was measured with seven questions. Totally, 76% of their variance could be explained with two factors. The irst one depicts farmer’s trust on success possibilities of his own farm and the second one depicts success possibilities of farming in general. These were named as trust on own success and general trust on farming in the
future.
Attitudes of the farmers were measured applying a modiied version of an attitude scale developed by Willock et al. (1999). Five attitude dimensions were found: risk
aversion, appreciation of profession, critical attitude
towards bureaucracy, pro-environmental thinking, and
attitude towards the following political environment. The
solution explained 36% of the variance of the survey items. Farmers’ attitudes towards farm management can be expected to have an effect on their activity in managerial work compared with running, production related tasks (Sh. Al-Rimawi et al., 2006). This attitude also relates to the question whether the farmers see themselves more as entrepreneurs or producers, which also may affect their managerial behaviour (Vesala and Peura, 2002). These traits were analysed with twelve questions that produced three factors. Some of the questions, however, had low communalities or high cross loadings. Finally, seven questions were used and two easily interpretable factors extracted interest in
management and entrepreneurial management.
Locus of control is a personality trait that depicts an individual’s belief of his own possibilities compared with external forces to affect his situation and future state of things (e.g. Spector, 1982; Nuthall, 2010). In the former case, the locus of control is internal, and in the latter case, it is external. In psychological research, there has been used several different scales to measure
this trait. In this study, eleven questions were used and two dimensions found in the factor analysis. The irst one related to such a perception that the political environment largely determines the success of farming. The second dimension depicted a perception, where the farmer and his decisions mostly determine the course of development. The result of this factor analysis indicate that the locus of control is not necessarily a continuum from internal to external but at least in this kind of context, it may have more dimensions. The second factor, however, explained a relatively small proportion of the total variance of the original items and had a low alpha-reliability. Thus, one summated scale was formed to measure the external locus of control.
Success of a business is typically measured with objectively determined inancial indicators. However, the subjective perception of success that a farmer has may differ from that especially in a short run (Mäkinen et al., 2009). Perceived success was thus analysed with 17 questions that produced three factors. The respective summated scales were named as satisfaction
on profession, satisfaction on inancial results, and
satisfaction on agrarian way of living.
The decision making processThe management process - or the decision making
process - on a farm is commonly presented as a continuous cycle of planning, implementation, and control. The implementation phase is tightly connected to the operational working on the farm and is very dificult, if not impossible, to analyse with survey questions. For this reason, it was omitted in this study. Instead, the amount and quality of planning and control was analysed. In these phases of decision-making, the farmer collects information both from inside and outside the farm, processes it in a way he feels suitable, and creates guidelines for the implementation on different levels of operation. For information collection and processing, there are numerous tools available varying from simple hand-made calculations to sophisticated information systems. However, according to Öhlmer et al. (1998), analytical thinking is not as typical for farmers as a more intuitive, tacit decision-making. Hansson (2008) analysed this among Swedish farmers but did not ind any connections between analytical thinking and eficiency of the farm.
In this study, the amount of analytical thinking in decision making was measured with six questions, where the farmers were asked to rate how much they use different analysis tools. The values of these variables were added up to a summated scale named as use of
analysis tools. Regardless of the amount of analytical thinking, a farmer needs information from his farm and from the environment. Verissimo and Woodford (2005), for example, found that the most successful farmers typically collected and used plenty of information. Information usage in this study was measured with a list of 17 different sources of information. Similarly to analysis tools, the farmers were asked to express how much they use each source. The sum of these was used as measure of information activity.
Farmers’ activities in planning and control procedures were measured with 17 questions. Based on the factor analyses, these could be condensed into
H. Mäkinen et al. Farmer Characteristics, Farm Management and Financial Performance on Finnish Dairy Farms

Economic Science for Rural Development Nr. 28., 2012
ISSN 1691-3078
88
three summated scales: inancial planning, business planning, and controlling. The variables relating to
business planning mostly depicted activity in long term and strategic level planning, while inancial planning was more related to short or medium term point of view.
Connections between farmer characteristics, management process and success indicators
It is typical for summated scales that their distributions approach the normal distribution. By looking at histogram plots, this was observed with the scales
H. Mäkinen et al. Farmer Characteristics, Farm Management and Financial Performance on Finnish Dairy Farms
Table 1
Connections between farmer characteristics, management process and inancial success indicators from the years 2008-2009 on Finnish bookkeeping dairy farms
Proitability coeficient Gross margin Turnover Farm net income
Satisfaction in inancial results
Expressive values -0.068 -0.044 -0.081 -0.111 0.252 **
Instrumental values
-0.050 0.247 **
0.227 *
0.073 0.202 *
Intrinsic values -0.134 0.140 0.164 -0.031 0.050
Social values -0.054 0.191 *
0.221 *
0.061 0.127
Critical attitude towards bureaucracy
0.064 0.027 0.041 0.046 -0.239 **
Appreciation of
profession
0.020 0.258 **
0.239 **
0.146 0.409 ***
Pro-environmental thinking
0.009 -0.193 *
-0.189 *
-0.073 0.138
Attitude towards following political environment
-0.043 0.066 0.101 0.018 -0.003
Risk aversion -0.170 0.467 *** 0.481 ***
0.013 0.174
External locus of control
0.006 -0.085 0.027 0.024 -0.236*
Trust on own success
-0.029 0.399 ***
0.364 ***
0.130 0.484 ***
Trust on farming in future
-0.265 *
0.086 0.224 *
-0.162 -0.246 **
Entrepreneurial
management0.080 0.366
***
0.323 ***
0.182 *
0.211 *
Interest in
management0.004 0.039 0.139 0.082 -0.009
Information activity
-0.038 0.037 0.100 0.021 0.044
Use of analysis
tools
-0.062 0.384 ***
0.430 ***
0.121 0.004
Business planning -0.034 0.193 *
0.184 *
-0.017 0.195 *
Financial planning -0.073 0.057 0.131 -0.011 0.076
Controlling 0.153 0.186 *
0.182 *
0.212 *
0.100
Experience in farming (years)
0.069 -0.168 -0.165 0.045 -0.042
Pearson r, n=117, signiicance levels: *** = p<0.001, ** = p<0.01, * = p<0.05
Source: authors’ calculations based on the research data
89
Economic Science for Rural Development Nr. 28., 2012
ISSN 1691-3078
presented above as well as with the inancial igures of farms. Pairwise scatter plots were also examined to ind possible non-linear relationships, but such ones were not detected. Thus, it was justiied to use Pearson correlation coeficients to analyse linear relations between farmer characteristics, management process, and indicators of inancial success. These are presented in Table 1.
Conclusions1. Gross margin of a farm represents a short-term
indication of proitability. It measures the amount of money that is left to compensate the ixed costs of production (like depreciation of assets and farming family’s own labour) after the running costs of operation. Gross margin was positively associated with such characteristics of the farmer as appreciation of profession, instrumental and social values, trust on own success, entrepreneurial management, and risk aversion. Negative associations were found between gross margin and pro-environmental thinking, and experience in farming. Of the domains relating to the management process, controlling, business planning, and use of analysis tools were positively associated with gross margin. The correlation between gross margin and size of the farm measured with turnover was as high as 0.889. The perceived inancial success was negatively correlated with trust in future of farming and critical attitude towards bureaucracy, and positively associated with such features as appreciation of profession, experimental and instrumental values, trust on own success, risk aversion, entrepreneurial management, and business planning. Perceived success also correlated positively with inancial success of farming measured with different indicators.
2. The observed correlations between farmer characteristics, management process, and gross margin of farm argue in favour of causal relations between these features. The inding that turnover (size) of the farm correlates positively with gross margin but not with proitability coeficient, can be interpreted so that the proitability of the largest farms is low due to the high sunk costs of recent investments even though the gross margin after the direct costs is relatively high. Negative correlations between the experience (years) in farming, and turnover and gross margin of the farm (although signiicant only at p<0.1 level) support this interpretation: it is possible that relatively young
farmers have recently done notable investments to grow and develop the farm. Corresponding signals are also provided by the relatively high correlations
between risk aversion and farm size and gross margin. It looks likely, that when farmers have recently invested to the farm, they feel it necessary to avoid further risk taking to secure liquidity and solvency.
3. Gross margin of the farm is positively associated with a farmer’s satisfaction with inancial results and, widely explicated, with an active touch to management and development of the farm. This active touch is characterised by high appreciation of
profession, strong instrumental values, a high trust
on the future success of the farm, and especially, by an entrepreneurial management orientation with a vision about the future state of the farm. Active hold on inancial planning, controlling and use of analysis tools can also be seen as parts of this active
touch and a relatively large management capacity, which, as can be concluded, plays an important role in achieving good inancial results in the short run.
4. In the long run, proitability coeficient is the most important indicator of inancial success of a farm. However, few features relating to the management capacity were found to be associated with it. The cross-sectional nature of the study is a possible
explanation to this. When a long-term indicator is analysed, both the long-term development of the indicator and the long-term decisions affecting it should be taken into account in order to get a reliable
picture. Investments to develop and grow the farm typically irst lower the level of proitability, but if the farm is managed correctly in such a situation, it is possible to get to a positive track in the long
run. This kind of conclusions have been made earlier in a Finnish study (Ryhänen et al., 1998). Hansson (1998) also concluded that positive expectations for the future proitability of dairy farming had a negative association with eficiency probably due to large investments done lately, which are expected to generate increased income in the future. The interconnections relating to management capacity and farm success and development in the long run seem to be very dificult to characterise with a cross sectional survey analyses.
Bibliography1. Barnard, C.S. & Nix, J. S. (1973). Farm Planning and
Control. Cambridge University Press. London. p. 548. 2. Bigras-Poulin, M., Meek, A.H., Blackburn, D.J.
& Martin, S.W. (1985). Attitudes, Management Practices, and Herd Performance — a Study of Ontario Dairy Farm Managers. I. Descriptive Aspects. Preventive Veterinary Medicine 3:
pp. 227-240.3. Boehlje, M.D. & Eidman, V.R. (1984). Farm
Management. New York: Wiley. p. 806.4. Bradford, L. A. & Johnson, G. L. (1953). Farm
Management Analysis. New York: John Wiley &
Sons. p. 438.5. Castle, E. N. & Becker, N. H. (1962). Farm Business
Management: the Decision-making Process. New York: MacMillan. p. 423.
6. Dalton, G.E. (1982). Managing Agricultural Systems. Barking, England: Applied science Publishers Ltd. p. 161.
7. Fairweather, J.R. & Keating, N.C. (1994). Goals and Management Styles of New Zealand Farmers. Agricultural Systems 44: pp. 181-200.
8. Ford, Stephen A., Shonkwiler, J.S. (1994). The Effect of Managerial Ability on Farm Financial Success. Agricultural and Resource Economics Review 23 (2):
pp. 150-157.9. Galanopoulos, K., Aggelopoulos, S., Kamenidou, I.
& Mattas, K. (2006). Assessing the Effects of Managerial and Production Practices on the
H. Mäkinen et al. Farmer Characteristics, Farm Management and Financial Performance on Finnish Dairy Farms

Economic Science for Rural Development Nr. 28., 2012
ISSN 1691-3078
90
Eficiency of Commercial Pig Farming. Agricultural
Systems 88: pp. 125-141.10. Gasson, R. (1973). Goals and Values of Farmers.
Journal of Agricultural Economics 24: pp. 521-542.11. Hansson, H. (2008). How Can Farmer Managerial
Capacity Contribute to Improved Farm Performance? A Study of Dairy Farms in Sweden. - Food
Economics - Acta Agriculturae Scandinavica, Section C 5: pp. 44-61.
12. Harsh, S.B., Connor, L.J. & Schwab, G.D. (1981). Managing the Farm Business. Englewood Cliffs, NJ: Prentice-Hall. p. 384.
13. James, S.C. & Eberle, P.R. (2000). Economic & Business Principles in Farm Planning & Production. Ames: Iowa State University Press. p. 413.
14. Kay, R.D., Edwards, W. M. & Duffy, P. A. (2008). Farm Management. London: McGraw Hill Higher Education. p. 468.
15. McBride, W. D. & Johnson, J. D. (2006). Deining and Characterising Approaches to Farm Management. Journal of Agricultural and Applied
Economics 38 (1): pp. 155-167.16. Muggen, G. (1969). Human Factors and Farm
Management; A Review of the Literature. World
agriculture and rural Sociology Abstracts. 11(2):
pp. 1-11.17. Mäkinen, H., Rantamäki-Lahtinen, L., Ylätalo, M.
& Vehkamäki, S. (2009). Measuring the Success of Finnish Family Farms. Food Economics -
Acta Agriculturae Scandinavica, Section C 6: pp. 185-196.
18. Nuthall, P.L. (2001). Managerial Ability - A Review of Its Basis and Potential Improvement Using Psychological Con-cepts. Agricultural Economics 24:
pp. 247-262.19. Nuthall, P. L. (20099. Modelling the Origins of
Managerial Ability in Agricultural Production. Australian Journal of Agricultural and Resource
Economics 53: pp. 413-436.20. Nuthall, P.L. (2010). Farm Business Management:
the Human Factor. Wallingford, Oxfordshire, UK: CAB International. p. 216.
21. Olson, K.D. (2004). Farm Management: Principles and Strategies. Ames, IA: Iowa State Press. xiii, p. 429.
22. Rantamäki-Lahtinen, L. (2009). The Success of The Diversiied Farm - Resource-Based View. Agricultural
and Food Science 18, supplement 1: p. 134.23. Rougoor, C.W., Trip, G., Huirne, R.B.M. &
Renkema, J.A. (1998). How to Deine and Study Farmers’ Management Capacity: Theory and Use in Agricultural Economics. Agricultural Economics 18: pp. 261-272.
24. Ryhänen, M., Sipiläinen, T., Ylätalo, M. & Koskiahde, M. (1998). Vieremän kunnan maatilojen tuotantoresurssit ja niiden siirtymä vuosina 1985 – 1995. In: Ryhänen, M., Sipiläinen, T. & Ylätalo, M.
H. Mäkinen et al. Farmer Characteristics, Farm Management and Financial Performance on Finnish Dairy Farms
(ed.) 1998. Maatilojen tuotanto ja talous Vieremän kunnassa vuosina 1985 – 2000. Helsingin
yliopisto, Taloustieteen laitos. Julkaisuja 21:
pp. 27-71.25. Sh. Al-Rimawi, A., Karablieh, E.K., Al-Qadi, A. &
Al-Qudah, H. (2006). Farmers’ Attitudes and Skills of Farm Business Management in Jordan. The
Journal of Agricultural Education and Extension 12:
pp. 165-177.26. Solano, C., León, H., Pérez, E., Tole, L., Fawcett, R.H.
& Herrero, M. (2006). Using Farmer Decision-Making Proiles and Managerial Capacity as Predictors of Farm Management and Performance in Costa Rican Dairy Farms. Agricultural Systems 88: pp. 395-428.
27. Spector, P.E. (1982). Behaviour in Organisations as a Function of Employee’s Locus of Control. Psychological Bulletin 91: pp. 482-497.
28. Tarabla, H.D. & Dodd, K. (1990). Associations between Farmers’ Personal Characteristics, Management Practices and Farm Performance. British Veterinary
Journal 146: pp. 157-164.29. Trip, G., Thijssen, G.J., Renkema, J.A. & Huirne,
R.B.M. (2002). Measuring Managerial Eficiency: the Case of Commercial Greenhouse Growers. Agricultural Economics 27: pp. 175-181.
30. Turner, J. & Taylor, M. (1998). Applied Farm Management. Oxford: Blackwell Science. p. 394.
31. Veríssimo, A., & Woodford, K. B. (2005). Top Performing Farmers are Information Rich: Case Studies of Sheep and Cattle Farmers in the South Island of New Zealand. Paper presented at the
Fifteenth International Farm Management Association Congress, Campinas, Brazil. Retrieved: http://purl.umn.edu/24298. Access: 2 November 2011.
32. Vesala, M. V., Peura, J. (2002). Yrittäjäidentiteetti monialaisilla maatiloilla. Helsingin yliopiston
Maaseudun tutkimus- ja koulutuskeskus, Mikkeli. Julkaisuja 78. 95 s.
33. Westermarck, N. (1951). The Human Factor and Success in Farming. Acta Agriculturae
Scandinavica, 1 (1): pp. 123-152.34. Willock, J., Deary, I.J., McGregor, M.M.,
Sutherland, A., Edwards-Jones, G., Morgan, O., Dent, B., Grieve, R., Gibson, G. & Austin, E. (1999). Farmers’ Attitudes, Objectives, Behaviours, and Personality Traits: The Edinburgh Study of
Decision Making on Farms. Journal of Vocational
Behaviour 54: pp. 5-36.35. Wilson, P., Hadley, D. & Asby, C. (2001). The
Inluence of Management Characteristics on the Technical Eficiency of Wheat Farmers in Eastern England. Agricultural Economics 24: pp. 329-338.
36. Öhlmér, B., Olson, K. & Brehmer, B. (1998). Understanding Farmers’ Decision-making Processes and Improving Managerial Assistance. Agricultural
Economics 18: pp. 273-290.

91
Economic Science for Rural Development Nr. 28., 2012
ISSN 1691-3078
Z. Mistre, A. Zvaigzne Assessment of Development Scenarios for The Regional Internal Communication and Information System of The Latvian Blood Donors Service
Assessment of Development Scenarios for The Regional Internal Communication and Information System of
The Latvian Blood Donors Service
Zane Mistre1, Mg.oec., PhD student; Anda Zvaigzne2, Dr.oec., assistant professor Faculty of Economics, Latvia University of Agriculture
Abstract. The aim of the research paper is to assess scenarios for the regional internal communication and information system of the Latvian Blood Donors Service, taking into consideration its signiicant role in the operation and development of this system. To identify the most suitable scenario for the regional internal communication and information system of the Latvian Blood Donors Service, the authors performed a hierarchy analysis, engaging ive experts. The experts compared problem elements in pairs and assessed the degree of interaction among them in a hierarchy. In the result, the experts’ conclusions were expressed numerically, gradually identifying priorities and, inally, determining the global priority – cooperation among institutions engaged in the Latvian Blood Donors Service. Cooperation was advised in implementing the development scenario for the regional internal communication and information system of the Latvian Blood Donors Service. Key words: regional system of the Latvian Blood Donors Service, development, internal communication and information circulation.JEL code: I19
___________________________1 E-mail address: [email protected]
2 E-mail address: [email protected]
IntroductionThe need to assess the development scenarios for the
regional internal communication and information system of the Latvian Blood Donors Service (hereinafter LBDS) is determined by problems in internal communication and information circulation in the LBDS’s regional system, which hinders the low of operational and strategic information among the institutions engaged in the LBDS, which prepare blood components and supply them to medical institutions: the State Blood Donor Centre (hereinafter - SBDC), its afiliate in Rezekne, the Blood Establishments of 9 hospitals (hereinafter – BEs), and the Blood Ofices (hereinafter - HBBs) of 32 hospitals in all the regions of Latvia (Mistre, Zvaigzne, 2009; Mistre, Zvaigzne, 2010).
The goal of identifying the development scenario for internal communication and information circulation in the LBDS’s regional system is to work out further proposals which, in terms of legal acts regulating the operation of the LBDS’s regional system and in terms of communication, would serve as a basis to perform further activities in relation to professional communication among the institutions engaged in the LBDS’s regional system.
The development of internal communication and information circulation in the LBDS’s regional system is affected by various socio-economic criteria but so far, these criteria and their affect have not been studied. The latest studies on internal communication and information circulation in the LBDS’s regional system may be found in the research papers by Mistre and Zvaigzne (2009, 2010, 2011). The method of hierarchy analysis was widely used in tackling various problems of regional economy during the recent years: Rankevica (2006), Pelse (2007),
Litavniece (2008), and Vronska (2012).The research object is the regional system of
the LBDS, and the research subject is internal
communication and information circulation.The following hypothesis was set: cooperation among
the institutions engaged in the Latvian Blood Donors Service is the most optimum development scenario for improving the regional internal communication and information system of the LBDC.
The research aim is to assess the possible development scenarios for the regional internal communication and information system of the LBDC according to the criteria for assessing internal communication and information circulation.
The following research tasks were set and performed to achieve the aim:1) to assess the role of internal communication and
information circulation in the LBDS’s regional system by means of hierarchy analysis;
2) to identify the most appropriate scenario, based on expert opinions, for improving the internal communication and information circulation in the LBDS’s regional system.
Materials and methodsThe present research is based on theoretical studies of
communication and information circulation and a survey of specialists engaged in the LBDS’s regional system that was conducted in the spring of 2011.
In the present research, the monographic and descriptive methods were extensively employed as well as analysis and synthesis to study problem elements and synthesise interrelationships or deine causal relationships. The logical and constructive method was

Economic Science for Rural Development Nr. 28., 2012
ISSN 1691-3078
92
Z. Mistre, A. Zvaigzne Assessment of Development Scenarios for The Regional Internal Communication and
Information System of The Latvian Blood Donors Service
employed to distinguish the most essential qualities of the research object from individual facts, to draw general conclusions or to deine correlations. By means of analysis, the general and whole phenomenon was divided into components, which allows reviewing the interesting individual parts.
In the present research, the practical research process was based on a sociological study method – questionnaire surveying, which was performed within the LBDS’s regional system.
To assess the role of internal communication and information circulation in the LBDS’s regional system, the hierarchy analysis was employed, and 5 experts were invited to complete such an
analysis:
— Jorgen Georgsen, medical director at Funen Transfusion Service Department of Clinical Immunology, Denmark’s Odense University
Hospital; — Gita Nemceva, SBDC director, member of the
executive board of the Latvian Association of Transfusiologists;
— Irena Danilane, head of the Blood Donors Department of the SBDC (from 1974 to 2011);
— Brigita Aispure, head of the BE of Kuldiga Hospital, member of the executive board of the Latvian Association of Transfusiologists;
— Mg.oec. Zane Mistre, PhD student of the Faculty of Economics, Latvia University of Agriculture.
The experts were selected on condition that they were especially competent in information circulation issues in the LBDS’s regional system. Each expert was assigned a capital letter from A to E. The expert analysis
was based on an American mathematician T.Saaty’s Analytic Hierarchy Process, so that the experts’ work was organised and their ratings were processed in a scientiically correct way (Saaty, 1980).
The algorithm of hierarchy analysis was suited for assessing the present situation and the development priorities for internal communication and information circulation. The researched problem was divided into several components for designing an initial hierarchy. After hierarchy matrixes were illed in, a priority vector, which indicated its signiicance relative to the criterion of every higher level, was calculated for every element of hierarchy. In the inal result, all components of the general problem, which were subordinate to one goal, had to be mutually compared. It was achieved by using a special scale of relative signiicance, which allowed transformation of wordy information into numbers. A priority vector was gained by calculating a set of special vectors for every pair-rating matrix, and after, a result was normalised to 1 (Pelse, 2007).
Several ways of gaining coordinates of priority vector exist – one of them is calculation of a geometric mean in which elements of every row are multiplied and an n-power root is extracted, where n is a number of elements. A set of numbers gained is normalised by dividing every number by a sum of all numbers. To explicitly present the mentioned algorithm, a scheme for calculating a priority vector is shown in Figure 1, which is an example of 3x3 matrix.
To evaluate the consistency of local priorities, a consistency ratio CR is used, which allows evaluation of the credibility of hierarchy analysis results. According to T.Saaty’s theory, a consistency ratio has to be less
Legends:A – comparable groups of second level criteria; W – value for comparable elements; a – geometric mean value for comparable elements; x – priority vector for comparable elements.
Source: Saaty, 1980
Fig.1. Algorithm for a 3x3 matrix

93
Economic Science for Rural Development Nr. 28., 2012
ISSN 1691-3078
than 10% or 0.10. In some cases, it may reach 20% but not more. If a consistency ratio extends beyond these limits, experts have to examine carefully a problem and re-examine their ratings (Pelse, 2007).
Research results and discussionOn 1 January 2007, signiicant organisational changes
took place in the performance and structure of the LBDS’s regional system. Based on “The Concept for Optimising the Performance and Structure of the Blood Donor Service of the Republic of Latvia 2006-2010” developed by the SBDC, a new procedure of inancing BDC-s at medical institutions was introduced, and their number was reduced from 18 to 10. Along with the restructuring of the LBDS’s regional system, the improvement of blood component preparation technologies and the introduction of information technologies took place simultaneously in every department. These measures were implemented on the basis of the European Union documents with the purpose of promoting the development of the Latvian Blood Donor Service (Mistre, Zvaigzne, 2009).
Until 1 January 2007, the LBDS’s regional system consisted of the SBDC, its afiliate RBDC, and 18 BCDs in the whole Latvia. The SBDC had records on 95000 blood donors and information on 80000 residents having contraindications for blood donation. Exchange of operational information between the SBDC and other blood service institutions is carried out on the phone that
does not assure reception of precise information about donors who do not observe intervals between blood donations and residents who have contraindications for blood donation. Thus, collecting and testing blood that is later rejected as defective. Due to these reasons, funds have been used ineficiently and it was not possible to have the necessary operational information on stocks of blood components at blood collection institutions. It restricted the functioning of the LBDS and medical institutions when providing emergency medical help as well as in critical situations. The BCDs having a small stock of blood components not always could supply a necessary blood component. Cooperation with clinicians, which can be provided only by involving HBBs, could be regarded as a disadvantage for the LBDS. Complete information on transfusions, transfusion reactions as well as quantities of blood components actually used and disposed of has to be at the disposal of HBBs. There was a lack of feedback. It is and was necessary to receive, compile, and analyse this information, but so far this information is not included in statistical reports and was not entirely available for further analysis (Mistre, Zvaigzne, 2009).
The main goal for optimising the structure of the LBDS’s regional system was to change the principle of self-supply for centrally managed supply of blood at medical institutions having BCDs. Such a conceptual change is possible on condition that the total number of blood donors in the country per all residents is stable and
tends to increase. However, optimising the structure of the LBDS’s regional system might not become a reason for a decrease in this indicator (Mistre, Zvaigzne, 2009).
After the SBDC’s “The Concept for Optimising the Performance and Structure of the Blood Donor Service of the Republic of Latvia 2006-2010” was introduced on
1 January 2007, the following institutions are included in the LBDS’s regional system: the SBDC with its afiliate the RBDC, 10 hospital BCDs, and 35 HBBs in all regions of Latvia (Mistre, Zvaigzne, 2009).
With the introduction of the Concept, the above-mentioned threats remained as well as new ones emerged for the LBDS’s regional system. The change of the principle of self-supply for centrally managed supply of blood at BCDs could negatively impact any hospital’s interest in keeping a BCD as well as the problem of lacking inancial resources for quality improvement, which includes also education of medical personnel and residents, and introduction and maintenance of technologies, was not solved. Yet, the low of information and communications in the LBDS’s regional system have to function perfectly, thus, providing the right for all Latvian residents to receive quality medical services (Mistre, Zvaigzne, 2009).
Based on the theoretical studies on communication and information circulation, the previous studies on the institutions engaged in the LBDS’s regional system as well as the speciics of the LBDS, the authors classiied the characteristics and phenomena that were directly affected by insuficient communication and information circulation into 5 large groups:
1) effective and rational use of funding;2) increase of the regional system competitiveness;3) increase of quantitative indicators;4) increase of qualitative indicators;5) management of stocks of blood and its components.
The role of internal communication and information circulation in the LBDS’s regional system is signiicant as, although, the institutions engaged in the LBDS operate with the purpose of producing and distributing blood and its components. Yet, their performance is affected by various legal statuses of the institutions engaged
in the LBDS, which, in their turn, determine different procedures for their inancing. For instance, the SBDC is an institution directly subordinate to the Ministry of
Health of the Republic of Latvia and is inanced from the government budget, while the BEs are inanced from two sources: the budget of the SBDC and that of the medical institution (Mistre, Rudusa, Zvaigzne, 2011).
Since 2010, the SBDC has been differentiating funding for the BEs according to the quantity of blood produced. At the same time, ixed quantities of blood products are set in agreements concluded between the SBDC and the BEs. It means that the production of blood at the BEs is limited, otherwise, a medical institution, which controls a particular BE has to cover the costs of overproduction of blood. Given the fact that blood and its components are centrally distributed, such a model of inancing is not eficient, as it does not allow collection of blood in those regions where more blood donors are available (Mistre, Rudusa, Zvaigzne, 2011). In the result, funds are spent on attracting blood donors in those regions, where less blood donors are available. Besides, the costs of logistics for tests and transportation of blood components increase by setting ixed quantities of blood for regions.
Insuficient internal communication and information exchange hinders an increase in the competitiveness of the regional system. Although, a single scheme of distribution of blood and its components functions in the LBDS, yet, practically the scheme does not function, as
Z. Mistre, A. Zvaigzne Assessment of Development Scenarios for The Regional Internal Communication and Information System of The Latvian Blood Donors Service

Economic Science for Rural Development Nr. 28., 2012
ISSN 1691-3078
94
the quantities of blood to be produced by the BEs are set to meet only the demand of their regional medical institutions for blood components. Therefore, if, for instance, Riga region lacks blood of a certain blood group, while a stock of blood of this blood group is suficient in Kurzeme region, Riga region invites paid blood donors, conducts an additional campaign for blood donors, but it does not use the resources and capacity of Kurzeme region.
The third point results from the second one in which the authors conclude that any increase in the quantitative indicators of the LBDS is hindered due to insuficient internal communication and information exchange. Quantitative indicators of the BEs may not be compared with those of the SBDC, as, according to the authors, the output of the BEs is limited and set in
agreements. Increasing qualitative indicators directly depend
on communication and information exchange among the institutions engaged in the LBDS. For instance, if the LBDS purchases new bags for blood collection, but disproportions are identiied in various regional BEs during the sale of these bags, it is reported to the head of the Methodical Department of the SBDC that purchases medical materials for the LBDS’s needs. The quality of blood components depends on this information in a direct way. Besides, the greater quantity of blood and its components is written off, the greater are expenses of the LBDS.
The insuficient internal communication and information circulation also affects the overall management of stocks of blood and its components. Although, the single information system ProSang functions in the LBDS, in which the SBDC and the BEs have access to information on stocks of blood and its components at other institutions, such a system is not available to the Blood Ofices. As a result, if a medical institution having no BE, but having a Blood Ofice, is short of blood or a component of blood, it has to spend
some time on obtaining information on stocks of blood at the nearest BEs.
On Level 3 of hierarchy analysis, the authors offer four scenarios for improving internal communication and information circulation:1) establishment of a single blood service;2) establishment of a cooperation system;3) establishment of a system of independent institutions
producing blood and its components;4) retention of the present situation.
A hierarchy of assessment criteria was developed and presented in Figure 2. Its Level 1 is associated with the problem of how to provide the internal communication and information circulation in the LBDS; Level 2 includes groups of criteria, from the viewpoint of which this problem is tackled, while Level 3 contains the possible scenarios for improving the internal communication and information circulation in the LBDS’s regional system. Such scenarios were selected based on the survey of experts engaged in the LBDS’s regional system that was conducted in the spring of 2011.
The establishment of a single blood service means that the methodical head of the LBDS’s regional system in the SBDC becomes the real director of this service. Such a model completely changes the model of inancing the service, which includes a single system of salaries within the entire service and single accounting and management of inancial resources.
Introducing the cooperation model in the LBDS’s regional system means that the institutions engaged in the LBDS’s regional system retain their present legal status, but by means of targeted, planned, and well-managed internal communication and information circulation, cooperation is improved from the viewpoint of communication. Such a model means that the service is not reorganised, but additional funds are invested in it for developing communication.
Establishing a system of independent institutions producing blood and its components means that the
Source: authors’ construction based on the research results
Fig.2. Hierarchy of criteria for assessing the scenarios for internal communication and information circulation in the LBDS’s regional system
Z. Mistre, A. Zvaigzne Assessment of Development Scenarios for The Regional Internal Communication and Information System of The Latvian Blood Donors Service

95
Economic Science for Rural Development Nr. 28., 2012
ISSN 1691-3078
institutions engaged in the LBDS’s regional system would perform independently in accordance with the European Union regulations. In this case, the SBDC would lose the role of methodical leader, but all the institutions engaged in the service would function on equal and competitive conditions. This system also ensures medical institutions need to become self-suficient as well as businesses might be started for producing blood and its components, as it is observed in Lithuania. Based on the Lithuanian experience, the SBDC would become a private enterprise producing blood and its components, which afterwards are purchased by medical institutions at a certain price according to public procurement procedures. The main gain from this system is a rational use of blood and its components by medical institutions.
Retaining the present situation means that the present practices for the internal communication and information circulation in the LBDS’s regional system are continued and no investments are made to improve the situation.
The experts were familiarised with the scenarios for improving the internal communication and information circulation in the LBDS’s regional system. They illed in hierarchy analysis matrixes, taking into consideration
the scenarios and their personal experience. A rating of criteria groups was obtained in the result of analysis (Table 1).
The experts admitted the criteria group “management of stocks of blood and its components” as the most signiicant group of criteria for improving internal communication and information circulation; its average priority vector was 0.45. It is also logical, as the specialists targeted on eficient and rational use of blood and its components. Almost all the experts gave the highest rating to this criteria group, except expert E who believed that the most signiicant group of criteria that would affect improvements in internal communication and information circulation in the LBDS was the criteria group “increase of quantitative indicators”. The criteria group “effective and rational use of funding” as well as that of “increase of quantitative indicators” had quite similar priority vector coordinates - 0.19 and 0.18, respectively. According to the experts, the least interesting criteria group was “increase of the regional system competitiveness”. The priority vector was only 0.09 for this criteria group.
After analysing an opinion of each expert, the authors came to a conclusion that the experts’ opinions were
Table 1
Final matrix for the priority vectors of criteria groups
Groups of criteria Experts Average
priority vectorA B C D E
Effective and rational use of
funding
0.23 0.15 0.13 0.17 0.25 0.19
Increase of the regional system competitiveness
0.08 0.06 0.14 0.13 0.03 0.09
Increase of quantitative indicators
0.11 0.07 0.05 0.12 0.54 0.18
Increase of qualitative indicators 0.17 0.15 0.15 0.02 0.02 0.10
Management of stocks of blood and its components
0.41 0.57 0.53 0.56 0.16 0.45
Source: authors’ calculations based on the research results
Table 2
Calculation of the vector of global priorities
Scen
ari
os f
or
imp
rovin
g
the i
nte
rnal
co
mm
un
icati
on
an
d i
nfo
rmati
on
cir
cu
lati
on
Eff
ecti
ve a
nd
ra
tio
nal
use o
f fu
nd
ing
Incre
ase o
f th
e
reg
ion
al
syste
m
co
mp
eti
tiven
ess
Incre
ase o
f q
uan
tita
tive
ind
icato
rs
Incre
ase o
f q
uali
tati
ve
ind
icato
rs
Man
ag
em
en
t o
f sto
cks o
f b
loo
d a
nd
its
co
mp
on
en
ts
Glo
bal
pri
ori
ties
Establishment of a single blood service
0.34 0.23 0.25 0.31 0.19 0.28
Cooperation 0.27 0.43 0.48 0.38 0.47 0.37
Operation of independent
institutions producing
blood and its components0.29 0.27 0.20 0.23 0.29 0.26
Present situation 0.09 0.08 0.07 0.08 0.05 0.09Source: authors’ calculations based on the research results
Z. Mistre, A. Zvaigzne Assessment of Development Scenarios for The Regional Internal Communication and Information System of The Latvian Blood Donors Service
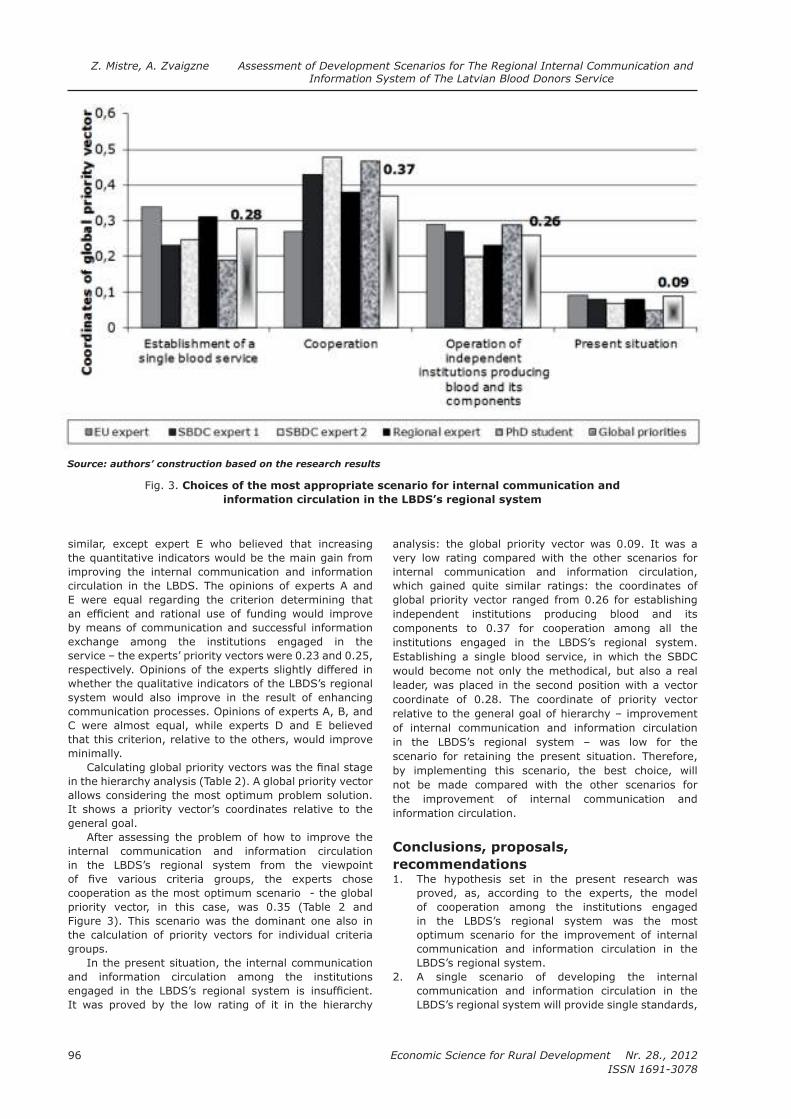
Economic Science for Rural Development Nr. 28., 2012
ISSN 1691-3078
96
similar, except expert E who believed that increasing the quantitative indicators would be the main gain from improving the internal communication and information circulation in the LBDS. The opinions of experts A and E were equal regarding the criterion determining that an eficient and rational use of funding would improve by means of communication and successful information exchange among the institutions engaged in the
service – the experts’ priority vectors were 0.23 and 0.25, respectively. Opinions of the experts slightly differed in whether the qualitative indicators of the LBDS’s regional system would also improve in the result of enhancing communication processes. Opinions of experts A, B, and C were almost equal, while experts D and E believed that this criterion, relative to the others, would improve minimally.
Calculating global priority vectors was the inal stage in the hierarchy analysis (Table 2). A global priority vector allows considering the most optimum problem solution. It shows a priority vector’s coordinates relative to the general goal.
After assessing the problem of how to improve the internal communication and information circulation in the LBDS’s regional system from the viewpoint of ive various criteria groups, the experts chose cooperation as the most optimum scenario - the global priority vector, in this case, was 0.35 (Table 2 and
Figure 3). This scenario was the dominant one also in the calculation of priority vectors for individual criteria
groups.In the present situation, the internal communication
and information circulation among the institutions engaged in the LBDS’s regional system is insuficient. It was proved by the low rating of it in the hierarchy
analysis: the global priority vector was 0.09. It was a very low rating compared with the other scenarios for internal communication and information circulation, which gained quite similar ratings: the coordinates of global priority vector ranged from 0.26 for establishing independent institutions producing blood and its
components to 0.37 for cooperation among all the institutions engaged in the LBDS’s regional system. Establishing a single blood service, in which the SBDC would become not only the methodical, but also a real leader, was placed in the second position with a vector coordinate of 0.28. The coordinate of priority vector relative to the general goal of hierarchy – improvement of internal communication and information circulation
in the LBDS’s regional system – was low for the scenario for retaining the present situation. Therefore, by implementing this scenario, the best choice, will not be made compared with the other scenarios for the improvement of internal communication and
information circulation.
Conclusions, proposals, recommendations1. The hypothesis set in the present research was
proved, as, according to the experts, the model of cooperation among the institutions engaged in the LBDS’s regional system was the most optimum scenario for the improvement of internal communication and information circulation in the LBDS’s regional system.
2. A single scenario of developing the internal
communication and information circulation in the LBDS’s regional system will provide single standards,
Source: authors’ construction based on the research results
Fig. 3. Choices of the most appropriate scenario for internal communication and information circulation in the LBDS’s regional system
Z. Mistre, A. Zvaigzne Assessment of Development Scenarios for The Regional Internal Communication and Information System of The Latvian Blood Donors Service

97
Economic Science for Rural Development Nr. 28., 2012
ISSN 1691-3078
forms, and types of internal communication and information circulation of high quality, which will promote more eficient and better-organised operation of the institutions engaged in the LBDS’s regional system.
3. Cooperation (priority vector coordinate was 0.37) among the institutions engaged in the LBDS’s regional system was chosen by the experts as the most optimum scenario for improving the internal communication and information circulation in the LBDS’s regional system. Establishing a single blood service, in which the SBDC would become not only the methodical, but also a real leader, was placed in the second position with a vector coordinate of 0.28.
Bibliography1. Litavniece, L. (2008). Crediting in the Development
of the Latgale Region, PhD Paper, Jelgava: Latvia University of Agriculture, pp. 36 - 41.
2. Mistre, Z., Rudusa, I., Zvaigzne, A. (2011). Procedure of Financing the National Blood Service of
Latvia. In: European Integration studies: Research
and Topicalities: Proceedings of the International
Scientiic Conference, No. 5, ISSN 1822-8402. Kaunas: Kaunas University of Technology, pp. 72-79.
3. Mistre, Z., Zvaigzne, A. (2009). Main Problems in the Regional System of the Latvian Blood Donor Service. In: Economic Science for Rural Development:
Proceedings of the International Scientiic Conference, No. 19. Jelgava: Latvia University of Agriculture, pp. 181–188.
4. Mistre, Z., Zvaigzne, A. (2010). Organisation of Internal Communication and its Risks among the Regional Institutions of the Latvian Blood Donor Service. In: Economics and Management: Current Issues and Perspectives: Scientiic journal, Siauliai: Siauliai University, pp. 289-297.
5. Pelse, M. (2007). Assessment of Possible Scenarios for Farmers’ Social Capital Development, In: Proceedings of Latvia University of Agriculture No. 19 (314). Jelgava: Latvia University of Agriculture, pp. 89-98.
6. Rankevica, V. (2006). Free Economic Zones in Latvia and their Regional Impact, PhD Paper, Jelgava: Latvia University of Agriculture, p. 177.
7. Vronska, N. (2012). Development of Prospective Teacher Information and Communication Technologies Integration Skills in Household and Home Economics Education, PhD Paper, Jelgava: Latvia University of Agriculture, p. 163.
8. Saaty, T.L. (1980). The Analytic Hierarchy
Process. New York: Mc Graw-Hill International, pp. 1.-19.
9. State Blood Donor Centre of the Ministry of Health of the Republic of Latvia. Concept for Optimising the Structure and Operational Principles of the National
Blood Service in 2006 – 2010 (2005). Latvia, Riga.
Z. Mistre, A. Zvaigzne Assessment of Development Scenarios for The Regional Internal Communication and Information System of The Latvian Blood Donors Service

Economic Science for Rural Development Nr. 28., 2012
ISSN 1691-3078
98
L. Muhina EU Structural Funds for Tourism Development in Latvia
___________________________1 E-mail address: [email protected]
EU Structural Funds for Tourism Development in Latvia
Liene Muhina1, mag.soc.
Abstract. Currently, Latvian tourism industry is facing different problems; however, tourism in Latvia is considered one of the opportunities for the state economic development (Latvian Tourism Development Agency, 2010). Having joined the European Union (hereinafter – the EU), Latvia as one of the less developed EU regions had the opportunity to have inancial aid provided by the EU for economic and social development. The EU Funds Projects for development of rural tourism during the period of 2004-2006 were implemented within the framework of the activity “Promotion of Rural Tourism and Craft”. The EU Funds support for 2007-2013 has to be a logic continuation for the already made investments. The support has also to be based on the obtained experience and reached results during the period of 2004 - 2006 (LR Finansu ministrija, 2007). The aim of this study is to identify the support receivers of the activity “Promotion of Rural Tourism and Craft” for the period of 2004 – 2006 who have used the EU funds for rural tourism business and who are doing the business at the moment. The methods applied in the study are quantitative research method, questionnaire, analysis, and monographic method. The results demonstrate supervision incompleteness of fund utilisation as not all support receivers who have been questioned are doing business in rural tourism.Key Words: tourism, EU Structural Funds, accommodation sites.JEL code: R10
IntroductionProjects for developing rural tourism and craft for
2004-2006 are being implemented within the framework of the activity “Promotion of Rural Tourism and Craft” of the Single Programming Document priority “Promotion of Development of Rural Areas and Fisheries”, which is co-inanced by the Guidance Section of the European Agriculture Guidance and Guarantee Fund (hereinafter –
EAGGF). This priority was comprised of EUR 138 643 255 with co-inancing of the EAGGF. It should be noted that the planning period for 2004-2006 is the irst time when Latvia receives the EU support with the assistance of the Structural Fund, thereby, there are some problems to be taken into account in the planning period for 2007 – 2013
(LR Finansu ministrija, 2007). One of the main problems is supervision of the Fund utilisation.
The Rural Support Service (hereinafter – the RSS) is
a state administration institution, and operates under the supervision of the Ministry of Agriculture. In accordance with the competence, the RSS is proceeding to supervise the projects implemented within the framework of inancial instruments of the EAGGF and the European Fisheries Fund for the programming period of 2004-2006 (Rural Support Service, 2010). The public information on the EU support and inance receivers is found on the RSS home page, which are the Structural Fund agreements paid by the EAGGF as of 30 December 2008. The support applicant, the project name, the support amount as well as the information on Structural Fund receivers, who have returned the received support, are mentioned there. Only 2 of 239 support receivers have returned the received support. The aim of this study is to identify the support receivers of the activity “Promotion of Rural
Tourism and Craft” for the period of 2004-2006 who have used the EU funds for rural tourism business and who are doing the business at the moment. The tasks of the study are to select ifty support receivers according to the
particular criteria, to conduct the questionnaire by using e-mail, and to summarise the results obtained during the questionnaire in order to ind out whether they still offer rural tourism services.
Research results Latvian tourism industry is currently facing such
problems as the offer of inadequate quality tourism products and services, typical seasonality and its caused turnover luctuations of tourism commercial activity, insuficiently used cooperation opportunities on all levels, rapid growth of the value added tax rate, and a lack of single vision for development. Irrespective of the mentioned, tourism in Latvia is considered to be as one of the opportunities for the state economic development and priorities of the service industry because it is an
important source of income from export that provides suficient contribution to the national domestic product (Latvian Tourism Development Agency, 2010).
1. Tourism in LatviaData gathered by the Central Statistical Bureau show
that in 2010, foreign travellers crossed the Latvian border for 5.04 million times. In its turn, more than 1.3 million people were serviced in hotels and other tourist sites in Latvia, of whom 33% were Latvian inhabitants, others - mainly from Russia, Germany, Lithuania, Finland, Norway, Estonia, and Sweden. In 2010, the increase of a number of people accommodated in hotels and similar sites was 11.6% in Latvia that was one of the best indicators.
However, Latvia compared with Lithuania and Estonia has the lowest indicators of a number of people accommodated and serviced in hotels. If Lithuania has a bit better result, then Estonia suficiently overtakes in respect of a number of foreign tourists accommodated and serviced, that indicates on the necessity to promote longer staying in Latvia and travelling for more days

99
Economic Science for Rural Development Nr. 28., 2012
ISSN 1691-3078
L. Muhina EU Structural Funds for Tourism Development in Latvia
of the local tourists around Latvia (Latvian Tourism Development Agency, 2010).
In its turn, in 2010, a number of people serviced by the rural tourism accommodation sites decreased in Latvia. A number of accommodation sites decreased by 32 that are comparatively two times less than in 2009 (Table 1). In 2010, there were 276 rural tourism accommodation sites left.
In 2010, a number of rural tourism accommodation sites near Riga, in Vidzeme and Zemgale decreased the most. It is quite stable in Latgale. However, in Kurzeme the small increase of a number of rural tourism accommodation sites has been observed (Figure 1).
Opportunities for the development of tourism product and services are encumbered with a lack of investments in tourism infrastructure. Investments in tourism public infrastructure are inancially great, with high percentage of risk and long term of return. Economic return of the investments made in tourism infrastructure is divided between direct infrastructure investors and other service providers, more percentage for the latter. The world practice shows that attraction of private investments is promoted when investing the state funds in the public tourism infrastructure (LR Finansu Ministrija, 2007).
2. Tourism project support receivers The research included support receiver projects for
2004-2006 within the framework of “Promotion of Rural Tourism and Craft” dealing out the rural tourism, which is co-inanced by the Guidance Section of EAGGF. Projects of support receivers were selected according to two key
words of their titles. The irst key word was related to the name of the accommodation site or similar establishment: recreation base/complex, holiday house, campsite, the house used for rural tourism/ house with bath/ house with outhouse, tourism site, gathering house, hotel, guest house/ building; the second key word was related to start of work of accommodation site: construction, building, or establishment. Fifty project titles conirmed with such key words.
In order to conduct the necessary research, home pages of particular support receivers were searched in the Internet resources as well as contact information – e-mails and phone numbers. It was possible to ind six support receivers (Table 2) only in the information catalogues but there were no home page addresses and contact information regarding the project (accommodation site). The relevant information about the EU Funds was found in the Internet resources regarding two support receivers but one support receiver had returned the received
funding. “Milina” Ltd – the receiver of the funding from the
Structural Funds has returned the received support
(Rural Support Service, 2008). ”Hincenbergs” Ltd – the RSS requested to return
money from “Hincenbergs” in 2006, because it had not inished the project. However, the “Hincenbergs” has not returned money until now.
“Augulienas Muiza” Ltd – representatives of the newspaper “Diena” had doubts about “Augulienes Muiza” existence and activities. The newspaper representatives contacted a superintendent of “Augulienes Muiza” for
Table 1
Indicators of rural tourism accommodation sites
Year Number of sites Number of visitors of which – non residents
2007 312 156069 12965
2008 376 131327 11245
2009 308 58095 7479
2010 276 47877 4582 Source: Central Statistical Bureau of Latvia, 2011
Source: Central Statistical Bureau of Latvia, 2011
Fig. 1. Number of rural tourism accommodation sites by regions

Economic Science for Rural Development Nr. 28., 2012
ISSN 1691-3078
100
premises for wedding booking. The superintendent answered that the repair works were being done and he would call back later. However, superintendent did not call back. When the representatives of “Diena” arrived at the “Augulienes Muiza” they saw that there was no guest house but a private house (Jemberga, 2009).
Contact information in the Internet resources was found regarding forty-four support receivers. The author contacted all of them by e-mail and tried to book rooms in their accommodations. Three answers were received from Mail Delivery Service that particular mail user did not exist (Table 3). The indicated home pages in different accommodation catalogues do not work anymore.
Regarding “Foil” Ltd, its home page is available only in Russian. There is no information on accommodation, either. However, it is mentioned that in 2007, the United Nations Organisation acknowledged the eco-biologic project as a model and ability to provide education services on the highest level. At the home page, there
are some articles about seminars, which have taken place in the guesthouse. Yet, in the explanatory dictionary, it is deined that tourism (tourist) accommodation is organised and non-organised sport and recreation tourist
accommodation site, catering and recreation company where usually events, especially related to tourism, are organised: hiking, competitions, acquisition of skills of specialised kinds of tourism (LR Ekonomikas Ministrija, 2008), not complying with “Foil” Ltd activity of the supported project.
As accommodation sites or similar establishments are hospitality companies, the speed of the provided responses is taken into account. Within the irst hour, the replies were received from nine project receivers (Table 4). Seven accommodation sites were able to offer accommodation on the indicated dates, except rural tourism recreation site “Pinkas”, which was closed for the winter but there was an opportunity to get accommodation in other accommodation sites of the same company, and
Table 2
Support receivers whose projects are not available in the Internet resources
No Support receiver Name of the project
1. “Hincenbergs” Ltd Construction of the hotel
2. Farm “Vizbuli” Construction of the tourism accommodation in the farm “Vizbuli”
3. “Milina” Ltd Construction of the recreation complex with the hotel “Milina”
4. Farm “Upmalas” Construction of the holiday house “Ezermala”
5. “Augulienas Muiza” Ltd Establishment of the hotel in the complex of Auguliena manor house
6. Farm “Krastkalni” Construction of the tourism house ”Mednieku Namins” Source: Lauku atbalsta dienests, 2008
Table 3
Support receivers whose e-mails do not work
No Support receiver Name of the project
1. “Xcelsus” Ltd Establishment and equipping of the guest house “Excelsus” at Ramava
2. “KKM” Ltd Construction of the hotel and recreation complex “Rojas Perle” and purchase of equipment
3. “Laimas Nams” Ltd Construction of the recreation complex “Laimas Nams” Source: Lauku atbalsta dienests, 2008
Table 4
Project receivers who replied within one hour
No Support receiver Name of the project
1. ”Usmas Kempings” Ltd Construction of the guest house with 30 places in Usma parish “Priezkalni”
2. “Courland Village” Ltd Establishment of the rural tourism recreation place “Pinka”
3. “Riekstnieki” Ltd Construction of the house and subsidiary building to be used for rural tourism purposes
4. “Alksnos Cetri Veji” Ltd Construction of the guest house for setting up business
5. “Anfeja” Ltd Construction of the guest house “Rudzupukes”
6. “Latlauva” Ltd Establishment of the campsite and playground
7. “Saro” Ltd Construction of the guest house ”Meidrops”
8. Farm “Gala Sparini” Construction of the dwelling house and bath to be used for rural tourism purposes
9. “Baltezers” Ltd Construction of the resort hotel “Baltezers” Source: Lauku atbalsta dienests, 2008
L. Muhina EU Structural Funds for Tourism Development in Latvia

101
Economic Science for Rural Development Nr. 28., 2012
ISSN 1691-3078
“Usmas Kempings” was overbooked and there would be some free rooms only on the next day.
On the irst day, ive replies were received from project receivers (Table 5). Three accommodation sites were able to offer accommodation, except the hotel in Kaltene that did not work in the winter but would restart its work from May. The guesthouse “Debesu Bloda” had celebration on the indicated dates and it could not offer
anything else. On the second day, seven replies were received from
project receivers (Table 6). Two accommodation sites were able to offer accommodation, except the recreation
complex “Turbas” that was overbooked on the indicated dates. However, it offered accommodation in other sites of the same company.
On the third day, seven replies were received from project receivers (Table 7). Six accommodation sites were able to offer accommodation, except “Fregate” Ltd, as the whole holiday house was overbooked.
On the fourth day, only one reply was received. On the eighth day the last reply was received
(Table 8) from the farm “Vitoli” that was not able to offer accommodation because they did not work in
the winter.
Table 5
Project receivers who replied within one day
No Support receiver Name of the project
1. “Ario & Partneri” Ltd Establishment of the recreation complex “Dzirnavas”
2. “Orthos” Ltd Establishment of the hotel in Kaltene for disabled people
3. “Limbazu Celotajs” Ltd Construction of the campsite
4. “Roksanala” Ltd Construction of the recreation complex “Kuldidznieki”
5. “Debesu Bloda” Ltd Construction and equipping of the guest house “Debesu Bloda” Source: Lauku atbalsta dienests, 2008
Table 6
Project receivers who replied within two days
No Support receiver Name of the project
1. “Kriki1” Ltd Establishment of the rural tourism and recreation complex “Kriki”
2. “Aitinlauvas” Ltd Construction of the guest house “Aitinlauvas”
3. “Zivsalas” Ltd Construction of the house to be used for rural tourism purposes
4. “Emila Pasaule” Ltd Construction of the guest house “Udri” and the house to be used for rural tourism purposes
5. “Cirmas Ezerkrasts” Ltd Construction of the recreation complex in Zvirgzdene parish “Ezernieki” of Ludza district
6. Farm “Turbas” Construction of the recreation complex “Turbas”
7. “Susurins” Ltd Construction and equipping of the gathering house “Krasta Lacites” Source: Lauku atbalsta dienests, 2008
Table 7
Project receivers who replied within three days
No Support receiver Name of the project
1. “Metra A” Ltd Establishment of the guest house “Metras Maja” within the individual company “Metra” owned by Valdis Drulle
2. “Piejuras Nams” Ltd Construction of the house to be used for rural tourism purposes and purchase of equipment
3. “Korande” Ltd Construction of the hotel and skating-rink within the recreation and tourism complex “Korande”
4. “Berzkalni” Ltd Establishment of the guest house “Berzkalni”
5. “Edene LS” Ltd Construction of the “Bicanu Ezers” guest house
6. “Fregate” Ltd Construction of the holiday house in Kaunata parish “Eisaki” of Rezekne district
7. “Lenkas” Ltd Construction of the guest house “Lenkupes” Source: Lauku atbalsta dienests, 2008
L. Muhina EU Structural Funds for Tourism Development in Latvia

Economic Science for Rural Development Nr. 28., 2012
ISSN 1691-3078
102
E-mails are depending on the Internet connection, and the author called to support receivers who did not reply to e-mails. Three of support receivers’ phones did not operate; four of them – could offer accommodation on particular date; ive of them – could not offer accommodation providing different reasons; one - replied that accommodation did not work in the winter; and one - replied that the accommodation was under reconstruction.
Two support receivers not contacted by phone were “Foil” Ltd and “Sabris V” Ltd. They did not reply to the e-mail and they were not reachable by phone.
Conclusions1. In 2010, was a suficient increase in a number of
people who used hotels and similar accommodation sites in Latvia. However, examining individual rural tourism accommodations, it was observed that the number of people serviced had decreased.
2. Reply to e-mails and phone calls was not received from eleven of support receivers of the period of 2004-2006 within the activity “Promotion of Rural Tourism and Craft” dealing out the rural tourism
that is 1/5 of the support receivers included in the
research. 3. The study presents that 1/5 of the support receivers
does not provide rural tourism services. Thereby, the incompleteness of supervision mechanism should be settled and improved in order to supervise the granting and utilisation of the funds of the
support receivers. It would improve the quality of rural tourism accommodation sites but not the
quantity – number of beds, in order to provide people with services with value
added.
Bibliography1. Central Statistical Bureau of Latvia (2011). Volume
on Statistical Data: Tourism in Latvia 2011). Riga, p. 63.
2. LR Ekonomikas ministrija (2008). Turisma
un viesmilibas terminu skaidrojosa vardnica
(Explanatory Dictionary on Tourism and Hospitality
Terms). Riga, p. 460.3. Latvian Tourism Development Agency (2011).
Latvian Tourism External Communication Strategy
Table 8Project receivers who replied after three days
Nr. Support receiver Name of the project
1. “Liepenes Rundales” Ltd Construction of the campsite “Jeni” and purchase of equipment
2. Farm “Vitoli” Construction of the rural guest house in Kaunata parish Source: Lauku atbalsta dienests, 2008
Table 9Support receivers who did not reply to e-mails but were contacted by phone
No Support receiver Name of the project
1. “Kadikis R” Ltd Establishment of the holiday house “Dzirnavnieki”
2. Farm “Saulstari – 1” Construction of the house with bath to be used for rural tourism purposes in More parish “Saulstari” of Riga district
3. “VN Deksni” Ltd Establishment of the guest house “Deksni”
4. “Krifonis” Ltd Construction of the recreation complex
5. “Ventlejas” Ltd Construction of the guest house and campsite “Ventaskrasti” and purchase of equipment
6. “Vecsimani” Ltd Construction of the holiday house “Vecsimani”
7. “Lauku Ainavas” Ltd Establishment of the recreation complex
8. “Milzkalnes Upesloki” Ltd Construction of the house “Upesloki” to be used for rural tourism purposes
9. “G.M.Koks” Ltd Establishment of the recreation complex “Pukarags” Source: Lauku atbalsta dienests, 2008
Table 10
Support receivers out of contact
Nr. Support receiver Name of the project
1. “Foil” Ltd Establishment of tourism and recreation centre “Lizari”
2. “Sabris V” Ltd Construction of the hotel in Vilani parish Source: Lauku atbalsta dienests, 2008
L. Muhina EU Structural Funds for Tourism Development in Latvia
103
Economic Science for Rural Development Nr. 28., 2012
ISSN 1691-3078
2011-2015. Retrieved: http://www.tava.gov.lv/en/strategical-documents. Access: 15 December 2011.
4. The Rural Support Service (2010). About us: General Information. Retrieved: http://www.lad.gov.lv/en/about-us/general-information. Access: 15 December 2011.
5. Jemberga, S. (2009). Turismam domata ES nauda tikusi ari miljonaru mitnem (Homes of Millionaires Financed with the EU Money). Retrieved: http://www.diena.lv/sabiedriba/politika/turismam-domata-es-nauda-tikusi-ari-miljonaru-mitnem-677511. Access: 15 December 2011.
6. Lauku Atbalsta dienests (2008). Apmaksatie strukturfondu ligumi - ELVGF - 30.12.2008 (Paid Structural Fund Agreements – EAGGF - as of 30 December 2008). Retrieved: http://www.lad.gov.lv/iles/maksajumi_elvgfb.pdf. Access: 15 December 2011.
7. LR Finansu Ministrija (2007). Valsts strategiskais ietvardokuments 2007.–2013.gada periodam (State Strategic Framework Document for 2007-2013). Retrieved: http://www.esfondi.lv/upload/04-kohezijas_politikas_nakotne/VSID_2009.pdf. Access: 15 December 2011.
L. Muhina EU Structural Funds for Tourism Development in Latvia

Economic Science for Rural Development Nr. 28., 2012
ISSN 1691-3078
104
A. Muska, L. Bite Factors Affecting the Development of Catering Enterprises in Latvia
___________________________1 E-mail address: [email protected]
Factors Affecting the Development of Catering Enterprises in Latvia
Aina Muska1, Dr.oec.; Ligita Bite, Dr.oec.Faculty of Economics, Latvia University of Agriculture
Abstract. In the European Union, including Latvia, catering services are the largest industry in the hospitality sector. The industry of catering services generates the largest part of value added and the majority of jobs in the hospitality sector. The research hypothesis is that the development of catering enterprises is unequal across the regions of Latvia, and various factors having different correlative interrelations affect it. The research aim is to investigate the factors affecting the development of catering enterprises in Latvia. According to the research result, low-turnover micro enterprises dominate in the industry of catering services in Latvia, and the number and proportion of enterprises of this size tend to increase. Medium and large catering enterprises in Latvia are concentrated in Riga region. The geographic distribution of catering enterprises in the regions of Latvia is uneven: the highest concentration of enterprises is in Riga region. In the period of 2005-2010, the number of enterprises has increased in the regions but these changes were insigniicant. In Latvia, the number of catering enterprises per 1000 inhabitants signiicantly lags behind that in other European countries. A correlation analysis showed that household expenses on restaurants, cafes, and hotels (r=0.97); the number of visitors in tourist accommodations (r=0.93); food expenses of foreign overnight travellers (r=0.91); the number of foreign visitors in tourist accommodations (r=0.74); and household expenses on food and non-alcoholic beverages (r=0.65) affected the turnover of catering enterprises in Latvia. However, the number of residents (r=0.78) and the average net monthly wage of employees (r=0.53) affected the number of catering enterprises in Latvia. An analysis of the factors affecting the development of catering enterprises showed that during the economic crisis, households in Latvia concentrated their economic resources for satisfying their primary needs by reducing their expense on eating outside their home. The overnight traveller expense on food declined in Latvia, thus, the demand for services of catering enterprises also fell. After comparing the number of visitors in tourist accommodations in the regions of Latvia and the number of catering enterprises in the regions of Latvia, a causal relationship was observed – the number of catering enterprises was greater in the regions having a greater number of visitors in tourist accommodations. Key words: catering enterprises, development, factors, hospitality industry.JEL code: M21
IntroductionThe Ministry of Economics of the republic of Latvia
deines tourism as one of the export-oriented service industries that has to be developed in the country, as this industry has a large multiplicative effect on the economy, and the industry’s growth stimulates the demand for services of catering, transportation, entertainment, and commerce (Ministry of Economics, 2009).
Latvian businessmen also regard tourism as a prospective industry of the national economy (SEB bank, 2010).
An important component of tourism is a hospitality industry made up of industries of accommodation and catering (Eurostat, 2009).
In the European Union, including Latvia, the industry of catering services is the largest industry in the
hospitality sector.According to statistical data, the largest proportion
(80% on average) has been composed of economically active market sector statistical units (hereinafter catering enterprises) in the hospitality industry in Latvia in the period of 2005-2010. They created 81% of jobs on average in the hospitality industry as well as made up 73% of the industry’s total turnover on average, and this proportion tended to rise (Central Statistical Bureau of Latvia, 2012c).
In 2006 in the European Union (EU-27), the industry of catering services created 2/3 of the hospitality
industry’s total value added and ¾ of this industry’s jobs (Eurostat, 2009).
Therefore, it is important to identify the factors determining the development of the industry of catering services.
Research hypothesis: the development of catering enterprises is unequal across the regions of Latvia, and various factors having different correlative interrelations
affect it.The research aim is to investigate the factors affecting
the development of catering enterprises in Latvia.The following tasks are set to achieve the research
aim:1) to investigate the changes in indicators of catering
enterprises in Latvia;2) to identify the factors affecting the performance of
catering enterprises and investigate their mechanism of effects;
3) to analyse the changes in the factors affecting the
performance of catering enterprises.The research object is enterprises engaged in the
industry of catering services. The research subject is
their affecting factors.The research period is extended from 2005 to
2010.The present research is based on data of the CSB
surveys. Documents developed by the Ministry of Economics of the Republic of Latvia as well as Eurostat

105
Economic Science for Rural Development Nr. 28., 2012
ISSN 1691-3078
data were used to achieve the aim, execute the tasks, and prove or reject the hypothesis.
The following research methods were employed: the monographic method, statistical methods for economic analysis, synthesis and analysis, and pair-wise correlation analysis.
Research novelty – the factors affecting the
development of catering enterprises were identiied and analysed by means of pair-wise correlation analysis.
Research results and discussion1. Characteristics of catering enterprises in Latvia
Catering enterprises provide food and beverage supply services by offering food and beverages both for
immediate consumption, and to tourists and domestic consumers. Traditional restaurants, self-service restaurants or restaurants offering take-away food as well as permanent or temporary catering places with or without seats provide catering enterprises (Central Statistical Bureau of Latvia, 2011).
One of the indicators characterising the development of catering enterprises is a number of these enterprises (Figure 1).
According to the data of Figure 1, the number of catering enterprises gradually decreased in Latvia in the period of 2005-2007 (the economic boom period). I.Millere (2009) explains the decrease in the number of catering enterprises by the fact that market entry barriers emerged in the country in 2005, which hindered the establishment of new catering enterprises in the industry. Another reason, which affected the decrease, was Latvia’s accession to the EU, which increased the number and scope of administrative procedures. The authors of the present paper agree to
this opinion.The number of catering enterprises decreased mostly
in Latvia’s capital city, whereas the change in its regions was insigniicant.
Totally, the number of catering enterprises in the country increased in the period of 2008-2010.
According to the CSB data, the number of enterprises employing 2-9 individuals gradually decreased until 2008, whereas a different trend was observed after 2008: the number of large and medium enterprises decreased, while that of micro enterprises increased (Central Statistical Bureau of Latvia, 2012c).
Figure 2 shows that micro enterprises dominated in the industry of catering enterprises, and their number and proportion increased during the economic recession.
The number and proportion of medium-size catering enterprises was low, and they were mainly concentrated in the capital city – Riga. In the period of analysis, 6.6 large catering enterprises operated in Latvia on average and their number was insigniicant. Therefore, the data of Figure 2 do not include them, as their proportion did not exceed 1%. All large enterprises were located in Riga. The authors explain the concentration of medium and large enterprises in the capital city by the large number of residents, and domestic and foreign tourists in this region.
The geographic distribution of catering enterprises is
uneven in the regions of Latvia (Table 1).The data of Table 1 show that the highest concentration
of enterprises engaged in the industry of catering services
was in Riga region where 1260 enterprises or 54.5% of all catering enterprises operated on average.
On average, 14.3% of catering enterprises operated in Pieriga region. In the other regions, the proportion of enterprises was low, and no changes in their percentage distribution occurred in the period of 2005-2010.
Regardless of the decrease in the total number of catering enterprises until 2007, the turnover of the industry’s enterprises increased from year to year (Table 2).
According to the data of Table 2, an increase in the turnover of catering enterprises was observed also in 2008 with the emergence of the irst indications of an economic crisis. An upward trend in turnover was also observed in the country until 2005. Millere (2009) believes that it indicated the development and expansion of these enterprises.
2100
2200
2300
2400
N
u
mb
e
r
2005 2006 2007 2008 2009 2010
Years
Source: authors’ construction based on the Central Statistical Bureau of Latvia, 2012a
Fig. 1. Changes in the number of catering enterprises in Latvia in 2005 - 2010
A. Muska, L. Bite Factors Affecting the Development of Catering Enterprises in Latvia

Economic Science for Rural Development Nr. 28., 2012
ISSN 1691-3078
106
Irrespective of the fact that the turnover of catering
enterprises increased, their annual increase rate gradually declined from 29% in 2006 to 3% in 2008. A signiicant decrease in their turnover was observed in 2009, while it slightly increased in 2010. Since the turnover increased
faster than the number of employees in this industry, the average labour productivity also rose in the period of
2005-2008. In 2009, the turnover decreased much faster than the number of employees in the industry, thus, the average labour productivity declined as well. In 2010,
73 71 70 7380
25 26 27 2418
0%
20%
40%
60%
80%
100%
2005 2006 2007 2008 2009
Prop
ortio
n, %
Years
Micro (0-9) Small (10-49) Medium (50-249) Source: authors’ calculations based on the Central Statistical Bureau of Latvia, 2012c
Fig. 2. Percentage distribution of the number of catering enterprises by size group in Latvia in 2005 – 2009
Table 1
Percentage distribution of the number of catering enterprises by region in Latvia in 2005 – 2010
Region 2005 2006 2007 2008 2009 2010
Riga 56 55 54 54 54 54
Pieriga 14 14 14 14 15 15
Vidzeme 6 7 7 7 7 7
Kurzeme 10 10 10 10 9 9
Zemgale 7 8 8 8 8 8
Latgale 7 7 7 7 7 7
Source: authors’ calculations based on the Central Statistical Bureau of Latvia, 2012a
Table 2
Total turnover, average turnover, and average labour productivity of catering enterprises in Latvia in 2005 – 2010
Indicators 2005 2006 2007 2008 2009 2010
Turnover, thou. LVL 196 646 254 218 301 735 311 432 216 547 217 630
Annual increase rate, % - 29 19 3 -30 1
Average turnover
(per enterprise), LVL 87 476 113 187 139 563 135 997 91 757 102 222
Annual increase rate, % - 29 23 -3 -33 11
Average labour productivity
(per employee), LVL 8 176 10 067 11 795 12 118 10 560 11 196
Annual increase rate, % - 23 17 3 -13 6
Source: Central Statistical Bureau of Latvia, 2012 c and authors’ calculations
A. Muska, L. Bite Factors Affecting the Development of Catering Enterprises in Latvia

107
Economic Science for Rural Development Nr. 28., 2012
ISSN 1691-3078
the labour productivity increased at the expense of a decrease in the number of employees.
Since micro enterprises dominate in the industry, an average turnover per enterprise is insigniicant. This indicator has a similar trend compared with the industry’s total turnover.
The indicator “number of enterprises per 1000 inhabitants” may be used to characterise the development of catering enterprises.
The data of Table 3 show that the number of catering enterprises per 1000 inhabitants both in the entire Latvia and in all its regions slowly increased. It indicated the development of enterprises in the industry. In Latvia, there was only 1 catering enterprise per 1000 inhabitants, while in the capital city this indicator was 1.8. In the other regions, the number of catering enterprise per 1000 inhabitants was below the average indicator in the country, and there were no signiicant differences among the regions, except the regions of Latgale and Riga. The large number of residents in Daugavpils city (the second largest city in Latvia after the capital city) reduced this indicator for Latgale region. The total number of catering enterprises in this region is the smallest one in the country.
If compared with European countries, this indicator in Latvia signiicantly lagged behind the respective indicator of other European countries. In the North-European countries, this indicator was 2 times greater, in the Middle-European countries – 3-4 times, while in the South-European countries – even 7 times greater (data of 2006) (authors’ calculations based on Eurostat, 2009; Central Statistical Bureau of Latvia, 2008a). These data showed that not only residents but also foreign tourists affected the demand for services of catering enterprises. The high capacity utilisation rate of catering enterprises in
such tourism regions as Spain (6.0), Portugal (8), Cyprus (8), and Greece (8.4) indicated it (authors’ calculations based on Eurostat, 2009; Statistical Yearbook of…, 2008).
2. Identiication of the factors affecting the development of catering enterprises
The authors performed a pair-wise correlation analysis to identify the factors affecting changes in the number and turnover of catering enterprises. The correlation analysis showed that a medium-strong linear correlation existed between the variable “turnover of catering enterprises”, and the factors “household expenses on food and non-alcoholic beverages” and “number of foreign visitors in tourist accommodations” (correlation
coeficients were 0.65 and 0.74, respectively). A strong positive linear correlation existed between the turnover of catering enterprises, and the factors “household expense on restaurants, cafes, and hotels”, “number of visitors in tourist accommodations”, and “food expense of overnight travellers” (the correlation coeficients were 0.97, 0.93, and 0.91, respectively). The turnover of catering enterprises increases with the increase in the household expense on restaurants, cafes, and hotels as well as the number of visitors in tourist accommodations and the food expense of overnight travellers in Latvia.
According to the pair-wise correlation analysis, there was no correlation between the turnover of catering enterprises and the number of residents. Therefore, changes in the number of residents in the country did not affect changes in the turnover of catering enterprises. A weak positive correlation existed between the
average monthly net wage of employees and the turnover of catering enterprises (r=0.4).
By means of the pair-wise correlation analysis, the authors found out (Table 4) that a strong negative linear
correlation existed between the variable “number of catering enterprises” and the factor “number of residents” in the regions of Latgale, Zemgale, and Vidzeme. It means that the number of catering enterprises increased with a decrease in the number of residents in these regions. In Pieriga region, there was a strong positive linear correlation between these variables, i.e. the number of catering enterprises increased with the increase in the number of residents in this region. It may be explained by the fact that Pieriga region was the only region in the country that had a positive change in the number of residents. In the regions of Riga and Kurzeme, a weak negative linear correlation existed between the number of catering enterprises and the number of residents, while a medium-strong negative linear correlation was observed in the entire country.
According to the pair-wise correlation analysis, there was a medium-strong negative linear correlation between the number of catering enterprises and the average monthly net wage of employees in all the regions. There was a weak negative linear correlation between the variable “number of catering enterprises” and the factor “number of visitors in tourist accommodations” in the regions of Latgale, Zemgale, and Vidzeme, i.e. the regions in which the number and proportion of tourists were the lowest in the country, whereas a weak positive linear correlation was identiied in Kurzeme region. There was a medium-strong linear correlation between these
Table 3
Number of catering enterprises per 1000 inhabitants in Latvia and its regions in 2005 - 2010
Region 2005 2006 2007 2008 2009 2010
Latvia 1.0 1.0 1.0 1.0 1.1 1.1
Riga 1.8 1.7 1.7 1.8 1.8 1.8
Pieriga 0.8 0.6 0.8 0.9 0.9 0.9
Vidzeme 0.6 0.6 0.6 0.7 0.7 0.8
Kurzeme 0.7 0.7 0.7 0.8 0.8 0.7
Zemgale 0.6 0.6 0.6 0.6 0.7 0.7
Latgale 0.4 0.4 0.5 0.4 0.5 0.5Source: authors’ calculations based on the Central Statistical Bureau of Latvia, 2012; 2012a
A. Muska, L. Bite Factors Affecting the Development of Catering Enterprises in Latvia

Economic Science for Rural Development Nr. 28., 2012
ISSN 1691-3078
108
variables in the regions of Riga and Pieriga. No correlation existed between the number of foreign visitors in tourist accommodations and the number of catering enterprises.
A weak linear correlation was observed between the total household expense on consumption, the household expense on food and the number of catering enterprises in all the regions of Latvia, except the regions of Kurzeme and Latgale. A medium-strong linear correlation existed between these variables in the regions of Kurzeme and Latgale.
Either a weak or a medium-strong linear correlation existed between the number of catering enterprises and the household expense on restaurants, cafes, and hotels in all the regions of Latvia, except Kurzeme where a weak positive linear correlation was observed.
So, the pair-wise correlation analysis performed by the authors showed that several socio-economic factors affected the development of catering enterprises. The authors will present their research indings on the changes in the main factors for the period of analysis in the paper, i.e. 1) household expenses on restaurants, cafes, and hotels; 2) household expenses on food and non-alcoholic beverages; 3) the number of visitors in tourist accommodations; 4) the number of foreign
visitors in tourist accommodations; and 5) food expenses of overnight travellers.
3. Analysis of the factors affecting the performance of catering enterprises
The private consumption of Latvian residents signiicantly increased in the period until 2008. The household expense on consumption per household member a month gradually rose from LVL 128 in 2005 to LVL 232 in 2008 or by 81% in the period of 2005-2008 (Household Budget Survey…, 2008).
An increase in wages positively affected the increase in the household expense on consumption. In Latvia, the average wage of employees engaged in the national economy rose even two times in the period of 2005-2008, while the average size of old age pensions increased by 56% (Central Statistical Bureau of Latvia, 2012d; Mistre, Muska, 2011). An increase in the household expense on consumption was promoted by loans widely offered by banks and other inancial institutions at acceptable interest rates (Household Budget Survey…, 2008).
In 2009, an increase trend in the household expense on consumption was not observed anymore. The household consumption expense per household member
Table 4
Values of correlation coeficients
Region
Factors
Number of residents
Average monthly
net wage of employees
Number of visitors in tourist accommodations
Household expense on food
and non-alcoholic beverages
Household expense on
restaurants, cafes, and hotels
Latvia -0.78 0.53 -0.44 0.28 -0.51
Riga -0.37 0.75 -0.54 -0.04 -0.69
Pieriga 0.94 0.75 -0.61 0.37 -0.45
Vidzeme -0.93 0.65 -0.49 0.42 -0.39
Kurzeme -0.28 0.61 0.13 0.55 0.41
Zemgale -0.91 0.55 -0.36 0.36 -0.25
Latgale -0.82 0.68 -0.26 0.61 -0.08Note: Quantitative variable – number of catering enterprises
Source: authors’ calculations
Table 5
Household expenses on food and non-alcoholic beverages as well as restaurants, cafes, and hotels and their proportion in the total expense on consumption in Latvia in 2005 – 2010
Year
Expense on food and non-alcoholic beverages Expense on restaurants, cafes and hotels
on average per household member a month, LVL
proportion, % on average per household member a month, LVL
proportion, %
2005 39.65 31.0 7.15 5.6
2006 43.69 28.1 9.17 5.9
2007 51.01 25.5 11.71 5.8
2008 59.33 25.6 12.83 5.5
2009 52.04 26.7 8.46 4.3
2010 50.47 28.3 6.87 3.9 Source: Household Budget in…, 2006; Household Budget Survey…, 2007; 2008; 2009; 2010; 2011 and
authors’ calculations
A. Muska, L. Bite Factors Affecting the Development of Catering Enterprises in Latvia

109
Economic Science for Rural Development Nr. 28., 2012
ISSN 1691-3078
a month in 2009 amounted to LVL 195, which was LVL 37 or 16% less than in 2008 (Household Budget Survey…, 2010).
The decrease in the household expense on consumption was related with a decrease in the employment rate caused by the economic crisis in 2009 and a decrease in wages. The number of job seekers almost doubled in 2009 and reached 200.7 thousand or 16.9% of economically active population. The average net monthly wage of employees engaged in the national economy fell by 2.3%. However, the average size of old age pensions of pensioners registered at social security institutions
rose by 16.1%. Financial liabilities of households might cause an additional effect on the household expense on consumption, as many households that took consumption loans and mortgage loans paid back signiicant sums on borrowed funds (these sums were not classiied as expenses on consumption) and, thus, they were forced to limit their expenses on consumption (Household Budget Survey…, 2010).
The economic crisis negatively affected domestic consumption in 2010 as well: the household expense on consumption shrank by 8.8% (Household Budget Survey…, 2011). In 2010, wages also continued falling, whereas the unemployment rate rose; in the result, many households were forced to subsist on social beneits of the central and local government. According to a survey of the study “DnB Nord Latvian Barometer” conducted in May of 2011, totally 31% of Latvian residents (aged from 18 to 74) had taken at least one loan, and they were paying it back (Household Budget Survey…, 2011).
The percentage distribution of household consumption expenses in Latvia changed in relation with changes in household income.
In the period of 2005-2007, the proportion of expense on food and non-alcoholic beverages in the total consumption expense declined from 31% in 2005 to 25.5% in 2007. Such a downward trend was relative, as the average monthly expense on food per household member continued increasing from LVL 39.65 in 2005 to LVL 51.01 in 2007. Although, the proportion of expense on food in 2008 remained constant compared with 2007, in real prices the expense on food increased by 16%; however, in constant prices this expense decreased by 1.9%, as prices on this group of expense increased by 18% in 2008 (Household Budget Survey…, 2009).
Millere (2009) believes that “a decrease in the proportion of expense on food indicates an increasing trend in consuming food outside home, i.e. the use services of catering enterprises”. The authors of the paper also agree to this view, and the CSB data proved it as well.
According to Table 5, in the period of 2005-2008, the average expense on restaurants, cafes, and hotels in household budgets (in real prices) increased from
LVL 7.15 in 2005 to LVL 12.83 in 2008. The proportion of expense on restaurants, cafes, and hotels in the total expense on consumption also gradually increased. In this period, an annual increase rate for the expense on restaurants, cafes, and hotels exceeded that for the expense on food and non-alcoholic beverages.
In 2009, the percentage distribution of household expenses changed, as households adapted to the decrease in economic resources. The main priority of households still was expenses on food in 2009. Households spent 27% of their income on food on average in 2009; the proportion of this expense slightly rose to 26% compared with 2008. At the same time, the expense on food decreased from LVL 59.33 to LVL 52.04 per household member a month (a decrease of 12%). Households signiicantly saved their income on restaurants, cafes, and hotels or 34% in 2009 (Household Budget Survey…, 2010).
In 2010, households spent on food 28% on average, and the proportion of this expense continued rising. At the same time, the real expense on food decreased to LVL 50.47 on average per household member a month (a decrease of 3%). In 2010, the expense on restaurants, cafes, and hotels declined by 19%.
Therefore, beginning with 2009, the demand for catering services in the country started decreasing, thus, the turnover of catering enterprises also
declined.After analysing the percentage distribution of
household expenses for the regions of Latvia, one can see that the largest expense on restaurants, cafes, and hotels was speciic to households living in the regions of Riga and Pieriga, whereas households living in the regions of Latgale and Vidzeme spent the least on it, i.e. in the regions where the number of catering enterprises was small (Household Budget in…, 2006; Household Budget Survey…, 2007; 2008; 2009; 2010; 2011).
In the period of 2005-2008, the number of visitors in tourist accommodations in Latvia gradually increased and reached almost 1.6 million in 2008, while in 2009 the number of visitors decreased by 28% and fell below the level of 2005 (Table 6).
In 2010, the number of tourists increased by 18%. According to Table 6, the majority or 63% of visitors in tourist accommodations on average were foreign tourists in the period of analysis. The proportion of foreign tourists in tourist accommodations in Riga exceeded even 70%, thus, the proportion of foreign tourists in the rest of Latvia was less than 30% (Muska, Bite, 2012). It also affected the uneven development of catering enterprises in Latvia.
Table 6
Number of visitors in tourist accommodations in Latvia in 2005- 2010
Indicator 2005 2006 2007 2008 2009 2010
Number of visitors, thou. 1155 1330 1487 1556 1114 1312
including foreign visitors, thou. 730 816 845 945 754 878
Proportion of foreign visitors in the total number of visitors, % 63 61 57 61 68 70
Source: Central Statistical Bureau of Latvia, 2012b and authors’ calculations
A. Muska, L. Bite Factors Affecting the Development of Catering Enterprises in Latvia

Economic Science for Rural Development Nr. 28., 2012
ISSN 1691-3078
110
Data on the number of visitors in tourist accommodations in the regions of Latvia are
summarised in Table 7.An analysis of the percentage distribution of tourists
by region showed that more than half of visitors in tourist accommodations concentrated in Riga region, while more than 10% of them – in the regions of Pieriga and Kurzeme. In the other regions, the proportion of tourists did not exceed 6% of their total number.
The percentage distribution of tourists was uneven not only by region but also by republican city and
municipality. The main destinations for recreation and business in Kurzeme region were Liepaja and Ventspils, in Latgale region – Daugavpils and Rezekne, in Vidzeme
region – Cesis municipality and Valmiera, and in Pieriga region – Jurmala. The largest number of catering enterprises outside Riga region was in these republican cities and in Cesis municipality. According to data of the CSB, the largest number of catering enterprises was observed in the mentioned territories of Latvia.
According to a cluster analysis performed by the authors before, the best situation in the sector of tourist accommodations was observed in the capital city of Latvia, i.e. Riga region. In terms of development level, this region is followed by the regions of Pieriga and Kurzeme. The development level of tourist accommodations located in the regions of Vidzeme, Latgale, and Zemgale lagged behind that in the other regions (Muska, Bite, 2011). The same relates with catering enterprises broken down by region in Latvia.
Along with an increase in the number of tourists in Latvia in the period of 2005-2008, the expense of foreign tourists also increased in the country (Table 8).
According to Table 8, the food expense of foreign tourists gradually increased in the period of 2005-2007. Since 2008, the food expense has gradually decreased
irrespective of the fact that the number of foreign tourists in Latvia rose in 2008 and 2010. Therefore, the demand for services of catering enterprises declined as well. An analysis of the annual increase rates showed that the
expense on food decreased faster than the total expense of tourists. The expense on food was the second largest item of expenses for foreign overnight travellers (after expenses on accommodation) (Tourism in Latvia…, 2006; 2007; 2008; 2009; 2010; 2011).
Conclusions1. Low-turnover micro enterprises dominate in the
industry of catering services in Latvia, and the number and proportion of enterprises of this size tend to increase. Medium and large catering enterprises in Latvia are concentrated in Riga region.
2. The geographic distribution of catering enterprises
in the regions of Latvia is uneven: the highest concentration of enterprises is in Riga region. In the period of 2005-2010, the number of enterprises has increased in the regions but these changes
were insigniicant. In Latvia, the number of catering enterprises per 1000 inhabitants signiicantly
(2-7 times) lags behind that in other European countries.
3. The turnover of catering enterprises in Latvia was affected by household expenses on restaurants, cafes, and hotels (r=0.97); the number of visitors in tourist accommodations (r=0.93); food expenses of foreign overnight travellers (r=0.91); the number of foreign visitors in tourist accommodations (r=0.74); and household expenses on food and non-alcoholic beverages (r=0.65).
4. The number of catering enterprises in Latvia was affected by the number of residents (r=0.78) and the average net monthly wage of employees (r=0.53).
Table 7
Proportion of visitors in tourist accommodations in the regions of Latvia in 2005 - 2010
Regions 2005 2006 2007 2008 2009 2010
Riga 57 55 55 56 62 59
Pieriga 17 18 17 16 15 15
Vidzeme 6 6 6 5 4 5
Kurzeme 11 12 13 15 12 13
Zemgale 3 4 3 2 2 3
Latgale 4 5 5 5 5 4
Source: Muska, Bite, 2012
Table 8Expenses of foreign tourists in Latvia in 2005 - 2010
Indicator 2005 2006 2007 2008 2009 2010
Expenses of overnight travellers, mln LVL 164.7 228.2 290.7 324.1 270.1 263.5
Annual increase rate, % - 39 27 11 -17 -2
Food expenses of overnight travellers, mln LVL 50.6 73.0 90.1 88.0 73.7 68.9
Annual increase rate, % - 44 23 -2 -16 -7
Proportion of food expense in the total expense, % 30 32 31 27 27 26
Source: Tourism in Latvia…, 2006; 2007; 2008; 2009; 2010; 2011
A. Muska, L. Bite Factors Affecting the Development of Catering Enterprises in Latvia

111
Economic Science for Rural Development Nr. 28., 2012
ISSN 1691-3078
5. During the economic crisis, households in Latvia concentrated their economic resources for satisfying their primary needs by reducing their expense on eating outside their home. The overnight traveller expense on food declined in Latvia, thus, the demand for services of catering enterprises also fell.
Bibliography1. Central Statistical Bureau of Latvia (2011). Statistical
Classiication of Economic Activities. Retrieved: http://www.csb.gov.lv/node/29900/list/4/0. Access: 2 January 2012.
2. Central Statistical Bureau of Latvia (2012) Population - Number and Change. Retrieved: http://
data.csb.gov.lv/DATABASEEN/Iedzsoc/Annual%20statistical%20data/04.%20Population/04.%20Population.asp. Access: 2 January 2012. (Tables ISG13, ISG14).
3. Central Statistical Bureau of Latvia (2012a) Statistical Business Register. Retrieved: http://data.csb.gov.lv/DATABASEEN/rupnbuvn/Annual%20statistical%20da t a /23 .%20S ta t i s t i c a l%20bus i ne s s%20register/23.%20Statistical%20business%20register.asp. Access: 2 January 2012. (Tables SRG042; SRG06, SRG061; SRG021).
4. Central Statistical Bureau of Latvia (2012b) Tourism. Retrieved: http://data.csb.gov.lv/DATABASEEN/transp/Annual%20statistical%20data/20.%20Tourism/20.%20Tourism.asp. Access: 2 January 2012. (Tables TUG01; TUG11; TUG091).
5. Central Statistical Bureau of Latvia (2012c) Trade and Services. Retrieved: http://data.csb.gov.lv/DATABASEEN/rupnbuvn/Annual%20statistical%20data/22.%20Domestic%20trade%20and%20paid%20services/22.%20Domestic%20trade%20and%20paid%20services.asp. Access: 2 January 2012. (Table TIG112).
6. Central Statistical Bureau of Latvia (2012d) Wages and Salaries. Retrieved: http://data.csb.gov. lv/DATABASEEN/Iedzsoc/Short%20term%20statistical%20data/Wages%20and%20salaries/Wages%20and%20salaries.asp. Access: 2 January 2012. (Table DS10)
7. Eurostat (2009). European Business: Facts and Figures 2009 - Chapter 20: Accommodation and food services. Retrieved: http://epp.eurostat.ec.europa.eu/cache/ITY_OFFPUB/KS-BW-09-001-20/EN/KS-BW-09-001-20-EN.PDF. Access: 2 January 2012.
8. Household Budget in 2005. (2006). Statistical Bulletin. Riga: Central Statistical Bureau of Latvia. p. 51, 55. ISBN 9984-06-299-6.
9. Household Budget Survey: Main Results in 2006. (2007). Riga: Central Statistical Bureau of Latvia. p. 15, 28, 29. (ISBN 978-9984-06-321-8).
10. Household Budget Survey: Main Results in 2007. (2008). Riga: Central Statistical Bureau of Latvia. p. 16, 17, 31. (ISBN 978-9984-06-350-8).
11. Household Budget Survey: Main Results in 2008. (2009). Riga: Central Statistical Bureau of Latvia. p. 15, 16, 32. (ISBN 978-9984-06-366-9).
12. Household Budget Survey: Main Results in 2009. (2010). Riga: Central Statistical Bureau of Latvia. p. 10, 16, 17, 33. (ISBN 978-9984-06-391-1).
13. Household Budget Survey: Main Results in 2010. (2011). Riga, Central Statistical Bureau of Latvia. p. 10, 11, 17, 31. (ISBN 978-9984-06-409-3).
14. Millere, I. (2009). The Activity Process in Catering Businesses in Latvia’s Regions. The
Doctoral Thesis for the Scientiic Degree Dr.oec. Jelgava, LLU.
15. Ministry of Economics (2009). Informative Report on Economic Recovery Policy Priorities in a Medium-term (reviewed by the Cabinet of Ministers on
10 November 2009). Retrieved: http://www.mk.gov.lv/lv/mk/tap/?pid=40146810&mode=mkk&date=2009-10-19. Access: 2 January 2012.
16. Mistre, B., Muska, A. (2011). Synergy of Recipients of Amount of Old-age Pensions and Economic Development in Latvia. In: Rural Development
2011: Proceedings of the 5th International Scientiic Conference, Volume 5, Book 1. Kaunas District, Akademija: Aleksandras Stulginskis University, pp. 150 – 157. ISSN 1822-3230.
17. Muska, A., Bite, L. (2011). Evaluation of the Developments of Tourist Accommodation in the Regions of Latvia. In: European Integration
Studies: Research and Topicalities, No. 5. Kaunas: Kaunas University of Technology, pp. 220 - 228. ISSN 1822 – 8402.
18. Muska, A., Bite, L. (2012). Interaction between the Number of Visitors at Tourist Accommodation Establishments and the Economic Development in Latvia. In: Economics and Rural Development:
Research papers Vol. 8, No. 1. Latvia: Latvia University of Agriculture, pp.20 – 31. ISSN 1822-3346.
19. SEB bank (2010). SEB Business Enviroenment Review for February 2010. Retrieved: http://www.seb.lv/lv/about/press-centre/biznesa-vides-apskati/. Access: 2 January 2012.
20. Statistical Yearbook of Latvia 2008. (2008). Riga: Central Statistical Bureau of Latvia. p. 542. (ISBN 978-9984-06-352-2).
21. Tourism in Latvia in 2005. (2006). A Collection of Statistical Data. Riga: Central Statistical Bureau of Latvia. p. 35.
22. Tourism in Latvia in 2006. (2007). A Collection of Statistical Data. Riga: Central Statistical Bureau of Latvia. p. 35.
23. Tourism in Latvia in 2007. (2008). A Collection of Statistical Data. Riga: Central Statistical Bureau of Latvia. p. 35.
24. Tourism in Latvia in 2008. (2009). A Collection of Statistical Data. Riga: Central Statistical Bureau of Latvia. p. 35.
25. Tourism in Latvia in 2009. (2010). A Collection of Statistical Data. Riga: Central Statistical Bureau of Latvia. p. 25.
26. Tourism in Latvia in 2011. (2011). A Collection of Statistical Data. Riga: Central Statistical Bureau of Latvia. p. 20, 25.
A. Muska, L. Bite Factors Affecting the Development of Catering Enterprises in Latvia

Economic Science for Rural Development Nr. 28., 2012
ISSN 1691-3078
112
Z. Zalite, A. Auzina Socio-Economic Value of State-Owned Forests and Potential Economic Solutions for Increasing it
___________________________1 E-mail address: [email protected] E-mail address: [email protected]
Socio-Economic Value of State-Owned Forests and Potential Economic Solutions for Increasing it
Zinta Zalite1, MBA; Anita Auzina2, Dr.oec., associate professor Faculty of Economics, Latvia University of Agriculture
Abstract. Forests play a very important role in the economy of Latvia, thus, it is topical today to research their socio-economic value and soil expectation value. Data from national forest inventory were used in this study; these data provide the most current and accurate information on the situation in Latvian forests.The methodology of P. Zalitis was used to calculate the socio-economic value of forests. P. Zalitis is a leading researcher at the Latvian State Forest Research Institute “Silava”. Soil expectation value was calculated using a simpliied method of M. Faustmann, a German researcher.The socio-economic value of Latvian state forests is LVL 4.4 billion, whereas soil expectation value is LVL 4.7 billion. The socio-economic value mostly depends on the standing volume and ecological value, while the dominant tree species signiicantly affect soil expectation value.Key words: forest value, soil expectation value, national forest inventory, factors inluencing forest value.JEL code: Q23
Introduction Forest is a priceless natural treasure that provides
economic, social, and ecological beneits. Latvia has no minerals, oil, or mountains but it has “green gold”, the forests. This study is relevant and topical, since the present and future living conditions depend on the socio-
economic value of forests.The structure and breakdown of forest property
ownership has been changing since the beginning of 20th century according to the political environment in the country. The most recent signiicant changes took place in 1999, when the joint stock company (JSC) “Latvian State Forests” delegated forest management functions. Nowadays, totally 50.3% of all Latvian forests are state-owned and the remaining 49.7% are under different ownership.
The role of forests in the economy keeps getting more and more signiicant. The wood industry has the highest exports and is the only sector with a balance of trade surplus. In 2011, the JSC “Latvian State Forests” made a payment of LVL 57.7 million to the State Treasury, which is the highest amount in national history (Latvijas valsts mezu…, 2011). Both, the Forest Law and the forest economic policy objectives state that a sustainable forest management and development shall comply with ecological, economic, and social terms but it has not been explained in detail how to achieve this. The present study describes processes that deserve more attention to increase the socio-economic value of forests.
The hypothesis of this study is as follows: state-owned forests have a high socio-economic value, which is affected by various factors.
The aim of this study is to investigate the socio-
economic value of state-owned forests and to make economically sound recommendations to increase it.
Enabling objectives are the following:1) to investigate the socio-economic value of forest in
state-owned forests;
2) to develop solutions for increasing the socio-
economic value of state-owned forests.Legislative acts of the Republic of Latvia, scientiic
publications, other relevant literature, and internet resources were used in the study.
Materials and methodsNational forest inventory (NFI) is a new way of
obtaining information on forests in Latvia. One can obtain two kinds of information from it: irst, statistical reports on state forest resources, and second, a large database for a more in-depth research on forest stand or tree level.
A network of sample plots was created, and statistical information about forest resources in the country was also obtained during the initial stage of NFI from 2004 to 2008. The next step of NFI is to re-measure the established ground plot network. The basis of NFI is a sample plot with a constant radius, an area of 500 m2, and a centre that is hidden in the surrounding environment and is ixed with geographical coordinates.
During the irst measurement stage of forest inventory in Latvia, the total number of ground plots was 18 710, each of them representing 345 hectares of the country’s territory. The NFI data have a very high scientiic value, as they provide in-depth information on Latvian forests (Parskats par meza..., 2009).
Forests are not only a source of timber but also a producer of oxygen and a constantly evolving ecosystem where trees, berries, and mushrooms grow, and birds and animals live. Forest owners need to evaluate all the functions of the forest and to understand their social, economic, and ecological signiicance (Klimmins P. J., 1997). The results of the analysis can be used in the development and improvement of regulatory enactments and in the drafting of new enactments (Bettinger et al., 2009).

113
Economic Science for Rural Development Nr. 28., 2012
ISSN 1691-3078
Peteris Zalitis, a leading researcher of the Latvian State Forest Research Institute “Silava”, has developed a methodology for calculating forest indemnity value. Forest indemnity value shows the social, economic, and ecological signiicance of forest from both the point of view of the owner and the
community.The two most important components of forest ecosystem regarding forest indemnity value are forestland and
growing stock: MV=ZV+KV, where MV – forest value, ZV – forestland value, and KV – forest stand value. The following equation is used to calculate forest value (1):
, (1)
where:
ZV – economic value of forestland;
Kekol
– ecological value of forestland;
Ksoc
– social value of forestland;
Vfakt
– current stock volume;
Vm – target stock volume;
R – ratio of the values of wood-produced oxygen and timber products
iv
– adjustment coeficient (Zalitis, 2001).
Forest is an ecosystem, which provides the community with social and ecological beneits, characterised by the value of forestland, and economic beneits characterised by the value of the growing stock. Forest stand value includes the value of the produced oxygen. However, the aim of this study is to analyse the socio-economic value of forests, thus, the net value of wood is not looked at separately. According to a forest scientist Zalitis, “we are all co-responsible for maintaining and maximising the socio-economic value [of forests]’’. The authors of the present paper believe that it is time to evaluate all the functions of the forest, not only the economic function, because the whole community beneits from sustainable forest management.
Soil expectation value was calculated using a simpliied method of the famous German researcher M. Faustmann, since the original Faustmann’s method
has limitations due to contradictions between the theoretical assumptions and actual forest management. Therefore, the authors used a simpliied method to calculate soil expectation value with the following
formula (2.):
, (2)
where:
MSV – soil expectation value;
S – value of the felling area at the time of felling;
T – felling age
W – planting costs;
r – discount rate (Gilless, 2003).
Faustmann’s simpliied methodology for determining soil expectation value takes into onsideration only the value of the forest stand while disregarding land value. The authors think that it is possible to compare the two values, because soil expectation value serves as an indicator that draws attention to the question whether state forests are being managed in an economically sound way, and there might be room for improvement and change from a future perspective.
Source: authors’ calculations and construction
Fig. 1. Ten highest socio-economic values of Latvian state forests by district in 2004 – 2008, LVL million
Z. Zalite, A. Auzina Socio-Economic Value of State-Owned Forests and Potential Economic Solutions for Increasing it

Economic Science for Rural Development Nr. 28., 2012
ISSN 1691-3078
114
Research results and discussionAccording to calculations done by the authors, the
socio-economic value of Latvian state-owned forests is LVL 4.4 billion including the value of forest land and stand value; soil expectation value for Latvian state-owned forests is estimated at LVL 4.7 billion.
To obtain information on the socio-economic value and soil expectation value of state-owned forests in each district, the authors used the formulae discussed above, which resulted in data about 107 districts.
The most valuable state-owned forest with a socio-economic value of LVL 294.21 million is situated in Ventspils district (Figure 1). Vidzeme region (North-eastern part of Latvia), which is fragmented into numerous districts, shows examples how districts with large forest areas have forests with a higher socio-economic value than other districts do. In such districts as Gulbene,
Madona, Aluksne, and Valka, forest values range from LVL 139.07 million to LVL 96.68 million. In Latgale region (South-eastern part of Latvia), only Daugavpils district is among the top ten highest values, with a forest value of LVL 119.41 million.
Forests with the lowest socio-economic value are located in the central part of Vidzeme region and in districts close to the capital Riga (Figure 2). In Adazi, Salaspils, and Aizkraukle districts, forest values range from LVL 0.82 million to LVL 0.93 million. In Ligatne district, forest value is LVL 1.46 million but in Aglona, Saulkrasti, Koceni, Cesis, Ikskile, and Preili districts, the values range from LVL 3.11 million to
LVL 3.95 million. These districts are relatively small, which supports the idea that the larger the district area with larger forest areas, the higher the socio-economic value.
Source: authors’ calculations and construction
Fig. 2. Ten lowest socio-economic values of Latvian state forests by district in 2004 – 2008, LVL million
Source: authors’ calculations and construction
Fig. 3. Ten highest soil expectation values in Latvian state forests by district in 2004 – 2008, LVL million
Source: authors’ calculations and construction
Fig. 4. Ten lowest soil expectation values in Latvian state forests by district in 2004 – 2008, LVL million
Z. Zalite, A. Auzina Socio-Economic Value of State-Owned Forests and Potential Economic Solutions for Increasing it

115
Economic Science for Rural Development Nr. 28., 2012
ISSN 1691-3078
Forests with the highest current socio-economic value will be the most proitable in the future
(Figure 3). However, not all districts will experience
higher soil expectation values in the future than the
current values are now. Districts with the highest potential soil expectation value are Ventspils, Daugavpils, Jekabpils, Talsi, Madona, Saldus, Aluksnes, Jelgava, Gulbene, and Vilaka districts. The proitability of the forests of these districts will range from LVL 99.18 million in Daugavpils district to LVL 239.03 million in Ventspils district, forest in the latter being the most valuable.
The lowest future proits from forests will be in those districts where the socio-economic value was not high, namely, Adazi, Salaspils, Ligatne, Aglona, Ikskile, Koceni, Preili, and Cesis districts (Figure 4), where values range between LVL 0.40 million to 3.14 million. The only two exceptions are Rauna and Cesvaine districts with values of LVL 2.72 million and LVL 2.73 million respectively, which were not rated among the districts with low socio-economic values. The least valuable forest is in Adazi district, which lies near the capital Riga.
Soil expectation value is higher than the current socio-economic value in 64 districts (Figure 5). The highest differences between the two values are in Saldus, Madona, and Aluksne districts. By analysing the data on these three districts, the authors concluded that it would be possible to increase the future value of forests.
Soil expectation value could be increased in the future by felling overgrown forest stands and regenerating the harvested areas with tree species appropriate for the forest type, because potential value in the future is affected not only by the age of the forest stand but also
by the dominant tree species. Moreover, the average age of the forest in those districts is relatively low, 50 years, and tree species that constitute the highest percentage
of trees are Norway spruce, birch, and aspen, which form forest stands with lower felling age, while Scotch pine is less common and has the highest felling age (according to the Forest Law, felling age for spruce, birch, and aspen is lower than for pine).
Socio-economic value is higher than soil expectation value in 43 districts (Figure 6). The biggest difference between the two values is in Kuldiga, Ventspils, and Engure districts; it is the lowest in Ligatne, Vilani, and Aloja districts.
Aloja, Vilani, and Ligante districts show that a long rotation period is not a prerequisite for obtaining more valuable timber. There are few overgrown forest stands, which are losing value. It can be one of the reasons why the difference between both forest values is small. The dominant tree species is another factor, however. In Vilani and Aloja districts, the dominant tree species are trees with a long rotation period. Forestland value is another factor. In Ligatne district, forestland
Source: authors’ calculations and construction
Fig. 5. Districts in Latvia where soil expectation value is higher than socio-economic value in 2004 – 2008, LVL million
Source: authors’ calculations and construction
Fig. 6. Districts where socio-economic value is higher than the expected forest value in 2004 – 2008, LVL million
Z. Zalite, A. Auzina Socio-Economic Value of State-Owned Forests and Potential Economic Solutions for Increasing it

Economic Science for Rural Development Nr. 28., 2012
ISSN 1691-3078
116
value is one of the highest, and there is potential for achieving the highest theoretical stock volume
of 400m3h-1.The popular belief that forests shall not be felled is
proven wrong, as forest stands lose their value when the stand becomes overgrown and young and middle-aged forest stands produce more oxygen than overgrown ones. Therefore, harvesting of those forest stands and regeneration of felled areas would increase the social, economic, and ecological value of the forest, and the community would beneit from this. People need to understand that forest felling is natural process if the
main aim is a valuable forest now and in the future. Thus, in Kuldiga, Ventspils, and Engure districts, the socio-economic value could be increased by harvesting the overgrown forest stands.
By comparing cases when one of the two values is higher than the other, the authors of the present paper conclude that if the dominant species in a forest is a tree with a long rotation period, e.g. Scotch pine with a 101-year rotation period, then the socio-economic value is higher than soil expectation value. However, if the dominant species is a tree with a shorter rotation period, e.g. Norway spruce with a 81-year rotation period, common silver birch with a 71-year rotation period, or aspen with a 41-year rotation period, and pines are less common, then soil expectation value is higher than socio-economic value.
The authors carried out statistical analysis using SPSS
to ind out the statistical signiicance of factors, which inluence soil expectation value and socio-economic value. Correlation analysis conirms the assumption that forest stand age and dominant species affect socio-economic value and soil expectation value, and that economically valuable trees should be planted as dominant species, while species of no signiicant value should be replaced to get the highest economic beneit from the forest. Valuable species are common silver birch, Scotch pine, common oak, European ash, small leaved lime-tree, Norway spruce, common alder, larch, and aspen. By species of no signiicant value, the authors mean species that cannot be sold for proit, for example, goat willow.
Overgrown aspen stands cover a total area of 71 760 ha.The oldest aspen stand is 110 years old, but the rotation period for aspen should normally be
41 years. These aspens should be felled, which should be unhindered because there are no restrictions on
economic activity in that area. The authors suggest growing hybrid aspen in Latvia instead of common aspen to harvest energy wood.
National forest inventory data show that the oldest state-owned forest is situated in Cesis district, where the average tree age is 103 years. The socio-economic value is LVL 3.62 million, soil expectation value is LVL 3.14 million, and the dominant species are spruce (75%) and pine (25%).
Source: authors’ calculations and construction
Fig. 7. Ten districts with the highest forest land values in 2004 – 2008, LVL million
Source: authors’ calculations and construction
Fig. 8. Ten districts with the highest forest stand values in 2004 – 2008, LVL million
Z. Zalite, A. Auzina Socio-Economic Value of State-Owned Forests and Potential Economic Solutions for Increasing it

117
Economic Science for Rural Development Nr. 28., 2012
ISSN 1691-3078
The youngest forest is located in Aizkraukle district; its average age is 22 years. The socio-economic value of the forest stand is LVL 0.93 million including the produced oxygen. According to calculations based on Faustmann’s formula, soil expectation value could reach LVL 6.76 million in the fertile forest type common in the district. Presently, species of no signiicant value are dominant here, namely, elm and goat willow. The authors recommend that these species should be replaced by valuable species such as spruce and birch, which would enable the forests to reach the calculated soil expectation value.
The study found the following correlation: if the average age of forest stand is between 40 and 60 years (the youngest age being 20 years and the oldest being
68 years), soil expectation value is higher than socio-economic value. If the average age of forest stand is between 50 and 90 years (with the youngest stands 45 years old and the oldest stands 103 years old), socio-economic value is usually higher than soil expectation value. Therefore, the authors came to the conclusion that the average rotation period for a forest
stand should be between 50 and 60 years, when forest value was the highest. The authors believe that age is one of the most substantial factors to determine socio-economic value and soil expectation value. However, further long-term research is needed, because other factors are also at play.
The authors also recommend that a computer program should be developed for calculating forest value and for determining when it will be most proitable to fell forest stands. Based on pre-determined criteria, the program would calculate the best time for harvesting a forest stand. This would allow for the forest stand to be felled when it is most valuable, rather than having to wait for the end of the rotation period when it loses value. Provisions on rotation periods stipulated in the Forest
Law need to be amended. Forest stand value and forestland value are
two important components in the socio-economic value equation, thus, they will be analysed
separately. Correlation analysis shows that there is a positive
but low correlation between socio-economic value and land value. The most valuable forest land, worth of LVL 10.56 million, is in Daugavpils district, Gulbene district - LVL 13.68 million, and Ventspils district - LVL 28.40 million (Figure 7). The analysis shows that three districts, Jelgava, Salacgriva, and Tukums, have one of the highest forestland values but not the highest
socio-economic values. This means that a high forestland value does not always co-occur with a high socio-economic value.
Correlation analysis also shows that the strongest correlation is between forestland value and the ecological value of forestland: it is the ecological value that affects
forestland value most strongly. According to the data analysis, the most valuable
forest stands are in Ventspils district - LVL 265.81 million, Gulbene district - LVL 171.44 million, and Aluksne
district - LVL 129.11 (Figure 8). Gulbene district has also the most valuable overgrown forest stand, worth of LVL 65.53 million. The overgrown stands should be felled and replaced with valuable tree species appropriate
for the forest type. Most signiicantly, forest stand value is inluenced by standing volume.
Conclusions1. Both, the Forest Law and forest economic policy
objectives stipulate that sustainable forest
management and development shall comply with certain ecological, economic, and social terms but a more precise explanation, how it should be done, has not been provided.
2. State-owned forest growing in Ventspils district can be considered the most valuable forest among the forests in all the other districts of Latvia, because it has the highest socio-economic value, soil expectation value, forestland value, and forest stand value.
3. Out of all the constituent indicators, current stock volume correlates most with forest stand value. There is a strong positive correlation between forest stand value and current stock volume
(r=0.911). 4. Out of all the constituent indicators, the ecological
value of the forest affects forestland most. There is a strong positive correlation between the value of forestland and the ecological value of a stretch of
forestland (r=0.885).5. Soil expectation value is most affected by the
dominant tree species, because it determines the felling age and the value of the felling area at the
time of harvest (r=0.767). 6. The average forest stand rotation period should
be between 50 and 60 years, when forest value is the highest. However, further long-term research is necessary to prove this assumption, because both the socio-economic value of forest and soil expectation value are affected by many other factors apart from the forest stand age.
Recommendations1. The JSC “Latvian State Forests” should harvest
overgrown forest stands and stands with tree species of no value such as goat willow, elm, and grey alder, and restore the felled areas with economically valuable tree species appropriate for the forest type.
2. The JSC “Latvian State Forests” should harvest 71 760 hectares of overgrown aspen stands. Latvia has a high potential for growing fast growing hybrid aspen stands to be used as fuel or high-energy
wood. “Latvian State Forests” should be able to do it but a strategy that deals with funding; the method of growing aspen, potential markets, consumers, and estimates when it would start making a proit needs to be developed irst.
3. The JSC “Latvian State Forests” should develop a program for modelling and estimating when the socio-economic value of a forest stand will be at its highest and when it will be most proitable, based on certain indicators to be fed into the program, while taking into consideration ecological and social functions of the forest.
4. In collaboration with researchers from the Latvian State Forest Research Institute “Silava”, the JSC
Z. Zalite, A. Auzina Socio-Economic Value of State-Owned Forests and Potential Economic Solutions for Increasing it
Economic Science for Rural Development Nr. 28., 2012
ISSN 1691-3078
118
Z. Zalite, A. Auzina Socio-Economic Value of State-Owned Forests and Potential Economic Solutions for Increasing it
“Latvian State Forests” should review the forest stand rotation periods provided for in the Forest
Law and develop recommendations to change the provisions, so that harvesting of a forest stand would be allowed when its value is at its highest, rather than having to wait for the end of the rotation period, and submit the recommendations to the government for consideration.
Bibliography 1. Bettinger, P., Boston, K., Siry, P., J., Grebner, L., D.
(2009). Forest Management and Planning. Academic Press, p. 29.
2. Gilless, Keith J. (2003). Decision Methods for Forest Resource Management. Academic Press, pp. 111-112.
3. Klimmins, P. J. (1997). Forest Ecology. A Foundation
for Sustainable Management. Printed in the United
States, 1997. p. 394.4. Latvijas valsts mezu 2010. gada parskats
(“Latvian State Forest” Annual Report) (2011)Retrieved: http://www.lvm.lv/lat/lvm/inansu_informacija/?doc=13785. Access: 19 August 2011.
5. Parskats par meza resursu stavokli Latvijas Republika uz meza resursu statistiskas inventarizacijas 1. cikla (2004. – 2008.) merijumu bazes (National Forest Inventory Report). (2009). Salaspils, p. 8.
6. Zalitis, P. (2001). Latvijas meza ka neaizvietojama biosferas elementa ekonomiska, ekologiska un sociala vertiba (Economic, Ecological and Social Value of Latvia’s Forests as an Irreplaceable Biosphere Constituent): Mezzinatne, Volume 11, Salaspils. pp. 125-151.

119
Economic Science for Rural Development Nr. 28., 2012
ISSN 1691-3078
V. Zaluksne, B. Rivza Place’s Image in Latvia and Peculiarities of Its Perception in the Context of Place Marketing
___________________________1 E-mail address: [email protected] E-mail address: [email protected].
Place’s Image in Latvia and Peculiarities of Its Perception in the Context of Place Marketing
Viktorija Zaluksne1, MBA; Baiba Rivza2, Dr hab.oec., professor, academician of Latvian Academy of Sciences
Abstract. The research of place marketing and a place’s image is presently at its very beginnings in Latvia. Even so, the cities already face serious inter-place competition challenges. Networks of schools and health care institutions are being optimised, and the population moves to other, more attractive cities. In such a situation, a place shall be able to compete with other cities. It is, thus, of crucial importance to know the image of place that the population thinks is attractive and the factors that determine the satisfaction levels of residents with their place of residence. The aim of the study is to elucidate the peculiarities of perception in relation to the place’s image and popularity of place marketing measures in various populated areas in Latvia. The study involved interviewing of 280 respondents in various populated areas. The article analyses academic place marketing and place branding literature and presents the results of the interviews. Descriptive statistics methods and the chi-square test were used to analyse the results. The study indings outline that the nature of the image of Latvian cities is mostly positive, although, quite often neutral, which shows that cities do not suficiently engage in the development of their image. The key elements of attraction seen by the inhabitants in their cities include architecture, and the urban environment and landscape in which the place is situated. The image of a Latvian place is most often characterised by landmarks and annual events that attract tourist lows, while it is to a very small extent related to outstanding companies and popular brands of goods that are manufactured in the particular place. In the majority of cases, cities use their slogans and, to a lesser extent, also their logos as measures by which to increase awareness. Yet, residents are quite often unsure whether any measures are taken at all. It should also be mentioned that monthly income plays an important role in the creation of the satisfaction of residents with their place of residence and that the satisfaction with one’s place of residence also increases with growing income.Key words: place image, place branding, place marketing.JEL code: R11
IntroductionThe authors of the present article intend to review
the application of place marketing in various populated areas of Latvia. Presently, more and more places, cities, villages, and even whole countries are forced to compete for residents, investment, and tourists who ensure the economic development of these locations. The most frequently viewed situation is the one of the population lowing away from the place and companies seeking wider industrial concentration areas that would ensure the internal market effect, and in such context, territories should be able to announce themselves effectively in this competitive space. The place marketing approach provides this opportunity.
The irst attempts to expand the limits of classical marketing in academic discussions had already been seen in the late 1960s and early 1970s (Kotler P., Levy S. J., 1969). However, the irst to introduce the concept of place marketing were the scientists O’Leary and Iredal who wrote that “there is an obvious need to create dispositions and change behaviour toward geographic locations” (O’Leary R., Iredal I., 1979). Marketing undertaken in the interests of a geographical
location is often referred to in literature as territorial
marketing or place marketing. In fact, the concept of place marketing is suficiently abstract, and thus, can be used for an entire region or country or for a particular place. The word ‘territorial’ stands for the geographical object in whose interests marketing measures have been taken.
A. Pankruhin (1999), a Russian marketing researcher, deines place marketing as a set of actions aimed at changing or maintaining the attitudes and behaviour of market subjects with respect to particular territories and the nature, culture, and materially-technical resources concentrated therein as well as to the utilisation and reproduction of such resources (Pankruhin, 1999). Place marketing means choosing the most suitable ways for the place to achieve and satisfy the requirements of the target segments that are necessary for its development. A place has achieved this aim when the businesses and residents are satisied with the economic development of that place and its social environment, and when the expectations of visitors and investors are met (Kotler, et al., 2002). Place marketing, local economic development, and place competitiveness are all concepts that are widely analysed in economic literature. However, the understanding of place marketing is sometimes restricted to a number of promotional activities, thereby unjustly reducing its importance for local economic development strategies. Bradley et al. (2002) stress that place marketing is a consistent strategic process that is closely related to the
development of the local economy and the improvement of the place’s competitiveness (Bradley, et al., 2002). Place marketing distinguishes four interrelated and complementary base strategies. These are the strategies of infrastructure marketing, human resources marketing, attraction marketing, and image marketing. The image marketing strategy provides for the focussing of attention

Economic Science for Rural Development Nr. 28., 2012
ISSN 1691-3078
120
on the development of propaganda and an informative environment for the developed place. The information campaign is orientated towards the advancement of already existent values in the market created earlier. The place’s attraction factors are analysed and the information is disseminated through various information channels depending on the target audience group.
Thanks to this, the key instruments of image marketing are the communicative events that demonstrate the openness of the place in terms of making contacts and allowing external market subjects to study it better and ascertain themselves what advantages lie therein.
In the context of place marketing, a place is perceived as goods, and the aim of place marketing measures is to make these goods attractive for their prospective consumers – residents, investors, visitors etc.
The branding expert Simon Anholt opposes the above approach. Instead, he offers a place branding approach. A brand is a visualised identity that is developed with the objective of branding, a name, logo, slogan, corporate style etc. In other words, goods, services, or corporations are visualised as a result of branding and thereby gain
awareness. However, Anholt himself considers this deinition incomplete and presents a wider view on the brand. In his opinion, a brand contains all of the aforementioned elements and additionally comprises the corporate strategy, consumer motivation and behaviour, internal and external communications, and ethics and intentions (Anholt, 2005).
Hence, if the object of branding is a country, a region, or any populated place, it cannot be simpliied down to a logo, a loud slogan, or other visualisation elements. Anholt stresses that a place or a region cannot be ‘sold’ as an article in a supermarket. Understanding a place as a project is erroneous in the opinion of Anholt. Only the brand with a logo, a slogan etc. as its elements may be sold. He offers examples from the branding policies of the big corporations, such as Procter & Gamble or Unilever. These companies do not offer a brand to stand for them themselves but rather manage an extensive brand portfolio. He suggests acting likewise in respect to place branding, that is, using the approach in which the most well-known company, service or product of the town or its famous personalities etc. are used as the place’s brand. Furthermore, the brand addressee should be able to answer the question, “what is there in this brand for me?” (Anholt, 2005). Therefore, if one speaks about a place as a brand, it should be irst established to whom this brand is addressed and how extensive target market it covers.
Another globally recognised branding specialist, Wally Olinss (2003), emphasises that a brand is based on four vectors that act as the driving force of the brand. Depending on the nature of the brand, the relative importance of one vector in relation to the other vectors may be different. Meanwhile, the brand is always the same, regardless of it being the brand for a place or a consumer product. The vectors proposed by W. Olinss are the product, the environment, communication, and behaviour (Olinss, 2003). He offers four brand vectors or driving forces (Environment, Product, Communication, and Behaviour). The environment is the strongest driving force of a territorial brand. For example, a place in this context is seen as an adventure, a place of residence or
work etc. The product as the driving force of a place’s development is something through which a consumer learns about the existence of the place and according to which he or she builds associations with that place. This inding corresponds to the brand portfolio approach mentioned by S. Anholt. The promotion of an image in the market is not possible without communication. It determines how the audience is informed about what it might expect from, in this case, a place. This image marketing part includes the development and utilisation of a slogan, vision, commercials, press releases, and other communications elements. Nevertheless, all of the above actions are ineffective if the consumer in the respective place inally does not meet the levels of behaviour expected of him/her. This behaviour is characterised by the way, in which the consumer is treated by everyone who represents, in this case, the place (Olinss, 2003). The authors of the present article interviewed 280 respondents based on the indings involving brand-driving forces by W. Olinss, with the aim of elucidating how residents perceive the image of their place of residence and to what extent the application of the place marketing methods is developed in Latvia.
Hypothesis: the place marketing approach is scarcely used in populated areas in Latvia, while the use of this approach might make the place more attractive and in general provide for its economic development.
Object: build up an image of populated areas (cities, villages, counties) in Latvia.
Aim: to determine the peculiarities for perception of the image of the place and the popularity of place marketing measures in various populated areas in Latvia.
Tasks: to analyse theoretical issues involved in place
marketing and place branding; to study a perception of the image of place in Latvia based on the inding of theoreticians.
Methodologically, the study is based on interviewing residents and descriptive statistics methods; the chi-square criterion and the statistical independence test are used to analyse the collected data.
Research results and discussionAn opinion poll was launched in 2011, comprising
280 respondents from various populated areas in Latvia, within an age range from 18 to 83 years, of whom
234 respondents were females and 46 respondents were males. As to their territorial distribution, respondents were grouped according to the territorial administrative division of their place of residence (Figure 1).
The information from the poll shows that images of populated areas in Latvia are generally valued as positive, neutral, and weak expressed. The value of a vivid image is mentioned to a lesser extent and the negative image is the least mentioned. The results are visualised
in Figure 2.The evaluation of a vivid positive image was gained
by the cities of Jekabpils, Jelgava, Liepaja, Rezekne, and Riga, Rogovka village, and the cities of Saldus, Strenci, Talsi, Valmiera, and Ventspils. The evaluation of a “vivid negative image” was comparatively rare and was earned by the cities of Aizpute, Dobele, Jekabpils, and Jelgava.
Respondents were asked the question “What, in your opinion, characterises the uniqueness of a
V. Zaluksne, B. Rivza Place’s Image in Latvia and Peculiarities of Its Perception in the Context of Place Marketing

121
Economic Science for Rural Development Nr. 28., 2012
ISSN 1691-3078
Source: authors’ construction based on the data array of the opinion poll “Place Image in Latvia”
Fig. 1. Classiication of respondents across the represented populated areas
Source: authors’ construction based on the data array of the opinion poll “Place Image in Latvia”
Fig. 2. Character of the image of populated areas
V. Zaluksne, B. Rivza Place’s Image in Latvia and Peculiarities of Its Perception in the Context of Place Marketing
place of residence?”. The aim of the question was to become immersed to a certain degree in the values of respondents and see what exactly in their opinion
creates the uniqueness of a place and is perceived as a value. A minority or 18% of respondents mentioned that there was nothing unique in their place. A total of 81% of those interviewed conirmed that their place was unique and supplemented their answers with examples. Grouping examples given by these respondents resulted in the distinguishing of ten factors
that create the uniqueness of a place according to respondents. Among those provided, the most frequently were answers characterising the place’s architecture, urban environment, nature, and landscape. Such components of the place image as the presence of famous persons, events and the quality of infrastructure were among the least mentioned, which makes one think that there is a lack of the aforementioned elements in the places of residence of these respondents. A relationship with unique historical events was also comparatively

Economic Science for Rural Development Nr. 28., 2012
ISSN 1691-3078
122
Source: authors’ construction based on the data array of the opinion poll “Place Image in Latvia”
Fig. 3. Factors determining the uniqueness of the place (grouped according to free answers by respondents)
V. Zaluksne, B. Rivza Place’s Image in Latvia and Peculiarities of Its Perception in the Context of Place Marketing
rarely mentioned, as was the existence of distinguished companies. The results are presented in Figure 3.
Contrary to the above question, further questions asked to respondents inquired about what exactly characterised their place, providing six particular answer versions. Therefore, it was found that cities are most often characterised by objects and events that are
directed at the activation of the potential of tourism sector including, among others, tourism objects and cultural heritage, beautiful landscapes, and famous annual events. Sectors that characterise local entrepreneurship and the representation of local products were less frequently mentioned, which indirectly characterises the
insuficient development of industry and
entrepreneurship in regions. The summary of results is presented in Figure 4.
It follows that it becomes problematic to develop a place image portfolio based on the product vector.
The article continues with reviewing issues that are related to the implementation of marketing measures for particular territories or that of the communication vector in various populated areas of Latvia. As it has already been mentioned, the place logo and place
slogan are elements of the place marketing strategy. Therefore, it is important to elucidate whether residents have noticed the use of these elements. Residents were asked questions regarding the way in which the place positions itself and what particular actions residents might have noticed. Therefore, the most frequent answer by respondents to the question “Does the place position itself in any way?” was “Perhaps, but I have not noticed it”. The same answers are most frequently provided for the question “Does the place have its own logo?”. It can be seen from the answers that respondents had not always noticed that a purposeful place marketing policy is being implemented, or that it is not being implemented in a suficiently active manner. It is also possible that respondents rarely meet cases in which the place’s logo is being used or are not interested in it, which points to certain communications problems between the place’s administration and its residents. The situation is different with the place’s slogan, because “yes” is the most frequent answer to the question “Does the place have its own slogan?”. This is likely to be related to the fact that it is not common for a slogan to be developed artiicially. Very often, it has its origin in the place’s ancestral background.

123
Economic Science for Rural Development Nr. 28., 2012
ISSN 1691-3078
Hence, residents are involved in the development of the place image. Answers to these questions are presented in Figure 5.
An assumption may be made on the grounds of the aforesaid that the degree of activity shown when a place positions itself and engages its residents in this
process may inluence the sense of belonging felt by
residents for their place of residence. By performing the chi-square test, the authors established with a probability of 95% that the presence of place positioning measures inluences the sense of belonging of its residents.
The way in which people become involved in the creation of the image of their place and the results
Source: authors’ construction based on the data array of the opinion poll “Place Image in Latvia”
Fig. 4. Elements characterising the place image
Source: authors’ construction based on the data array of the opinion poll “Place Image in Latvia”
Fig. 5. The application of various place marketing approaches in populated areas in Latvia
V. Zaluksne, B. Rivza Place’s Image in Latvia and Peculiarities of Its Perception in the Context of Place Marketing

Economic Science for Rural Development Nr. 28., 2012
ISSN 1691-3078
124
brought about by this process is largely determined by personal attitudes of such people to their place of
residence, which characterises the “behavioural” vector. Respondents were asked the question “What are your feelings when talking about your place?”. The most frequent answer to this question was “I do not think it is of any importance”, while 46% of respondents replied that they were proud of their place and 6% of respondents were sometimes reluctant to reveal which place they were from. It should, however, be mentioned that the absolute majority (83%) agreed that they were part of the image of their place. It may be presumed that the sense of belonging of the respondents to their place of
residence is inluenced by their income. Hence, a primary examination of the poll data was performed with the aim of determining the breakdown of the respondents’ answers regarding their sense of belonging to their place of residence depending on their monthly income. The results are presented graphically in the box plot in Figure 6.
It was found that the reply of “Yes, I have a sense of belonging” was preferred by people representing a wide range of income. Amongst them, a quarter had an income below LVL 150, while 75% of those “with a sense of belonging” had an income below LVL 300. The inclination of the median on the left indicates that half of respondents had an income below LVL 200. Respondents who do not have a sense of belonging are located within the income group that is similar to that of those who “belong” but their income does not exceed LVL 300. To obtain more speciic results, the chi-square test was used and it was established that the income of residents did have an effect on their sense of belonging to their place
of residence.
ConclusionsThe authors of the present article analysed the
application of the place marketing approach in various populated areas in Latvia. The analysis of the poll conducted as a part of the study supplied the following results. 1. A study of the respondents’ answers to the questions
of what characterises the place and what represents the uniqueness of the place reveals that cities are characterised by an extremely marked stress on the element of urban environment. It is valued the highest by respondents. However, answers related to objects that characterise the place rather rarely
mention the object ‘recreation grounds’, which leads to the thought that the existing urban environment potential has not been utilised to a suficient extent.
2. Although, the application of the product branding portfolio approach for place marketing may be very effective and might even facilitate international awareness. It might be problematic in Latvia because there are few cities or counties that produce recognisable goods. Even so, assistance for local industry may become an important contribution to place or county marketing.
3. Although, each Latvia’s place has its own coat of arms, something, which bears evidence of the historical heritage of those cities, enough speciic knowledge is often necessary to interpret it. Therefore, cities frequently create their logos and slogans, having absorbed these marketing elements from the commercial sector. In Latvia, this practice is applied in several local government authorities,
Source: authors’ construction based on the data array of the opinion poll “Place Image in Latvia”
Fig. 6. Breakdown of respondents across their sense of belonging to their place of residence depending on their monthly income
V. Zaluksne, B. Rivza Place’s Image in Latvia and Peculiarities of Its Perception in the Context of Place Marketing
125
Economic Science for Rural Development Nr. 28., 2012
ISSN 1691-3078
but the poll results show that this is not a general practice. Residents in most cases are not aware of the marketing policy of their place or county. The only exception is the public’s awareness of the place’s slogan that is more frequently used.
4. In general, regardless of people’s income having an effect on their attitudes and their sense
of belonging to their place of residence, their loyalty is manifested quite vividly through their positive answers to questions that were related to their sense of belonging to their place and their
conidence that every one of them is a part of the place’s image. Despite social and economic problems and low incomes, people are proud of their place.
Bibliography1. Anholt, S. (2005). Some Important Distinctions
in Place Branding. Place Branding, H Stewart
Publications, Volume 1, Issue 2, pp. 116-121.
2. Bradley, A., Hall, T., Harrison, M. (2002). Selling Cities - Promoting New Images for Meetings Tourism. Cities, Volume 19, Issue 1, pp. 61-70.
3. Kotler, P., Asplund, C., Rein, I., Haider, D. H. (1999). Marketing Places Europe: How to Attract Investments, Industries, Residents and Visitors to
European Cities, Communities, Regions and Nations.
London: Pearson Education Ltd, p. 376.4. Kotler, P., Levy, S. J. (1969). Broadening the Concept
of Marketing. Journal of Marketing, Volume 33, Issue 1, pp. 10-15.
5. O’Leary, R., Iredale, I. (1976). The Marketing Concept: Quo Vadis? European Journal of Marketing, Volume 10, Issue 3, pp. 146-157.
6. Olinss, V. (2003). Par zimolu. (On Brand). Riga:
Neptuns. p. 280. 7. Pankruhin A. (1999). Territorialnij Marketing
(Territory Marketing). Marketing v Rossii i za
rubezom. Issue 5, pp. 11-14.
V. Zaluksne, B. Rivza Place’s Image in Latvia and Peculiarities of Its Perception in the Context of Place Marketing

Economic Science for Rural Development Nr. 28., 2012
ISSN 1691-3078
126
A. Zawojska Reputation of Public Administration: Agriculture-Related Agencies in
Poland Seen Through Farmers’ Eyes
___________________________1 E-mail address: [email protected]
Reputation of Public Administration: Agriculture-Related Agencies in Poland Seen Through Farmers’ Eyes
Aldona Zawojska1, Dr.oec.Department of Economics and Economic Policy, Warsaw University of Life Sciences
Abstract. The paper presents the concept of organisation reputation and applies it to public sector organisations
focusing on administrative-type agricultural agencies. The research is qualitative and exploratory. To test the reputation in practice, a study measuring the reputation of two Polish agricultural agencies (Agricultural Market Agency and Agency for Restructuring and Modernisation of Agriculture) among farmers was carried out in 2006/2007 and 2010/2011. Only farmers with frequent interaction (contact) with the agencies in question were selected. Farmers being frequent customers are familiar with the agencies, have gained experience of and have observed them over time. The results of the study revealed that the agencies had neutral or a somewhat positive reputation and they had somewhat improved it since 2007. These indings suggest that agencies might improve reputation by being more responsive to the needs of their clients. The issues addressed in this paper are relevant for future research on reputation in the government administration context.Key words: government, public administration, payment agencies, reputation, agriculture. JEL code: H11, H83, Q1
The public sector is a major player in most European economies. The growing focus on reputation of public administration can be justiied by the observation that the vast majority of resources that are dedicated to the administration of public affairs are controlled by public administrations, and for this simple reason, they are central actors of public governance. It is the way, the public administration implements policies (Picci L., 2011).
Bureaucracy reputation among the public as well as academics is pretty bad. The government bureaucracy is criticised by citizens, economists, sociologists, political scientists, policymakers, and even public administration practitioners. Bureaucrats are seen as ineficient, ineffective, wasteful, seeking to maximise the budget, rent seeking, and harsh to their customers. This negative bureaucratic reputation is largely evident and only occasionally supported by
empirical facts. However, some studies (e.g. Goodsell Ch.T., 1994) show that bureaucrats are perceived by clients of public administration as eficient, responsive, honest, respectful, and yielding their satisfaction. According to Goodsell, this is true on all levels of government and even in low reputation ields such as law enforcement and public welfare. The contradiction between general opinion survey results and speciic performance assessments was explained by George Frederickson and David Frederickson as the “paradox of distance” and the “lack of role differentiation”. With the distance paradox: “people trust and even revere those
government oficials who are near at hand”, whilst they “believe that government oficials who are far away are
lazy, incompetent and probably dishonest”. The “lack of role differentiation” denotes that the public has a tendency “not to distinguish between persons elected
to legislative bodies, persons elected as executives,
persons politically appointed, and permanent civil
servants” (Frederickson G., Frederickson D.G., 1965). Corrupt or incompetent behaviour by appointed and elected oficials taints the people’s perception of the competence of all oficials. Moreover, literature suggests that when function of the government bureaucracy is to serve indirectly people’s needs (to create their individual welfare), public administration is positively judged by the public (service recipients). Contrary, those administrative agencies that are viewed from a broad, general and distant perspective might attract almost completely negative public reactions. Theory also predicts that the assessments made by frequent stakeholders of any organisation are more inluential for the formation of reputation, since personal experiences affect the impressions formed more than mediated information does (MacMillan K. et al., 2005).
This paper’s aim is to examine how Polish farmers-clients of the government agricultural agencies perceive their reputation. Farmers’ assessments have been applied as possible measure of reputational capital of the agencies – the capital, which when being high, can contribute to the legitimacy of the public sector organisations (Luoma-aho V., 2007).
Following this introduction, the paper is structured as follows. The irst section approaches the main concepts of reputation as well as perspectives about its role discussed in the relevant literature. The second section consists of
Introduction A good reputation, even in darkness, keeps on shining.
A good reputation is more valuable than money.
Publius Syrus (Lyman D., 1856)

127
Economic Science for Rural Development Nr. 28., 2012
ISSN 1691-3078
an overview of data sources, methods and description of the sample. The third section offers own research results, their limitations and practical implications. The inal section consists of conclusions and recommendations.
Reputation - conceptual backgroundThe concept of reputation has had a vital role in
explaining cooperation and conlict in economics and political science (Sharman J.C., 2007). But what is reputation and what is it worth, particularly in the public administration? A brief literature review has provided several deinitions of corporate reputation
(cited in Table 1) but much less has been written about reputation in public administration.
Selected opinions about the roles played by reputation
are presented in Table 2.Analysis of the elements of the deinition indicates
a reference of reputation to: a perception; a time perspective; an evaluation of a irm’s characteristics; a
A. Zawojska Reputation of Public Administration: Agriculture-Related Agencies in Poland Seen Through Farmers’ Eyes
stakeholder-dependency of the construct; reciprocity; corporate performance when compared with other irms; and assets.
Reputation of public administration organisations can contribute to organisational stability, autonomy, performance, prestige, attracting or retaining qualiied people in the “war for talent”, decreasing transaction costs, and restoring trust.
Methodology/approach of own empirical research
The empirical research is descriptive and qualitative in nature (exploratory, question based, interpretive).
1. Research design and sample characteristics
The focus for the research was nationwide sample of 200 Polish farmers-customers of the two agricultural
Table 1
Selected deinitions of reputation
Author(s) Deinition
Oxford English Dictionary (2011) “the beliefs or opinions that are generally held about someone or something”
Reputation as assessment and awareness
Wartick S.L. (1992, p. 34)
“the aggregation of a single stakeholder’s perceptions of how well organisational responses are meeting the demands and expectations of many organisational stakeholders”
Fombrun C.J. (1996, p. 72) “a snapshot that reconciles images of a company held by all its constituencies”
Bromley D.B. (2000, p. 241)
“the way key external stakeholder groups or other interested parties conceptualise that organisation”
Bromley D.B. (2001, p. 317)
“a distribution of opinions (the overt expression of a collective image) about a person or other entity, in a stakeholder or interest group”
Schultz M. et al. (2001, p. 24)
“reputation combines everything that is knowable about a irm. As an empirical representation, it is a judgement of the irm made by a set of audiences on the basis of perceptions and assessments”
Highhouse et al. (2009, p 783)
“is a global, temporally stable, evaluative judgment about a irm that is shared by multiple constituencies”
Walsh G., Beatty S.E. (2007, p. 129)
“the customer’s overall evaluation of a irm based on his/her reactions to the irm’s goods, services, communication activities, interactions with the irm and/or its representatives (e.g. employees, management) and/or known corporate activities”
Gotsi M., Wilson A.M. (2001, p. 29)
“a stakeholder’s overall evaluation of a company over time. (...) is based on the stakeholder’s direct experience with the company, any other form of communication and symbolism that provides information about the irm’s actions and/or a comparison with the actions of other leading rivals”
Rose C., Thomsen S. (2004, p. 202)
“is identical to all stakeholders’ perception of a given irm, i.e. based on what they think they know about the irm, so a corporation’s reputation may simply relect people’s perceptions”
Post J.E., Grifin J.J. (1997) A collective representation of a irm’s past actions and results
Reputation as assets
Shapiro C. (1983, p. 659) “a irm, which has a good reputation owns a valuable asset”
Fombrun C.J. (2001) Economic assets
Goldberg A.I. et al. (2003) An intangible resource (assets) of organisation
Suh T., Amine L.S. (2007);Lewis S. (2001)
Strategic asset than can create long-term value for an organisation
Source: author’s compilation based on the literature review

Economic Science for Rural Development Nr. 28., 2012
ISSN 1691-3078
128
A. Zawojska Reputation of Public Administration: Agriculture-Related Agencies in
Poland Seen Through Farmers’ Eyes
agencies in Poland: Agricultural Market Agency (AMA)
and Agency for Restructuring and Modernisation of
Agriculture (ARMA). The AMA was established in 1990. Its tasks include mainly interventions in the agricultural commodity markets. The ARMA was created in 1994 with the mission to support the structural changes in agriculture. The two agencies are of the special importance as they carry out their activities on behalf of both the Polish government and the EU (EU payment agencies) and distribute (mainly ARMA) a large part of the budget allocated to the agricultural sector and rural
areas. The research uses two surveys of farmers; one was
conducted in December 2006 - January 2007 and another one in December 2010 – January 2011. Just before the irst survey, there was a boom period in Polish economy (2006-2007), when all the main sectors grew rapidly. The period between the surveys of 2007 and 2011 included the peak of the current business cycle (the irst quarter of 2008) and the trough (the irst quarter of 2009) after which en economic activity once again began to
expand. Poland was the only EU Member State to have avoided a decline in GDP during the late 2000s recession
(Gradzewicz M. et al., 2010; Ministry of Finance, 2011). The sample of target respondents (N=200) was
taken by a two-stage selection process. First, the sample structure was determined using the quota sampling controls based on the known structure of the individual agricultural holdings in Poland according to their farmland size and regional distribution. Then, a purposive sampling was applied in order to target only those managers of the farms who had been customers (service users) of the two agencies.
Table 3 provides a description of the two samples’ characteristics. The majority were aged 41 years or older; just over 70% of each sample were male. In 2007, about 45%, and in 2011, about 54% had been educated through to at least secondary school. Of the 200 respondents, only 29% declared having an access to the Internet in 2007, while in 2011, this fraction achieved 72%, showing remarkable improvement. Nearly half of respondents assessed their farm situation as being
Table 2
Importance of reputation
Author(s) Importance
Akerlof G.A. (1970) Affects a customer’s choice among competing products
Shapiro C. (1983);Barney J.B. (1996)
Increases premium price ... leading to above average proits
Ettenson R., Knowles J. (2008, p. 20) Is “a precondition for people’s willingness to do business with a company”
Selnes F. (1993); Andreassen T.W., Lindestad B. (1998)
Increases customer retention (affects loyalty)
Stigler G.J. (1962); Williamson O.E (1985);
Turban D.B., Cable D.M. (2003)
Makes the irm an employer of choice A positive reputation has a strong impact on one’s willingness to apply for a job at a company
Williamson O.E. (1996, p. 116, 159)
Reputation effects play a minor role in preventing opportunism in ongoing transactions. Improved reputation effects accentuate incentives to behave opportunistically
Milgrom P., Roberts J. (1992) Reduces contracting and monitoring costs (transaction costs) because suppliers and partners are less concerned about contractual hazards
Roberts, P.W., Dowling, G.R. (1997, 2002) Affects a irm’s future inancial performance
Herbig P., Milewicz J. (1995, p. 10)
“as reputation goes, proits follow”
Fombrun, C.J., Shanley M. (1990). A good reputation is a signal of quality and sound company behaviour towards market transactions
Fombrun C.J. et al. (2000, p. 89).
“a good reputation leads to better chances in overcoming crises as reputation serves as a sort of “buffer” or “safety net”
Cavaye J.M. (1997) Reputation of (government) agency has a bearing on the community’s willingness to work with government
Carpenter D.P. (2001, p.17); Whitford A.B. (2002);
Wilson J.Q. (1989)
Agency reputations can serve to enhance bureaucratic autonomy
Wilson J.Q. (1989) Agency reputations can serve to enhance professional prestige
Carpenter (2002, p. 491) Bureaucratic reputations are valuable political assets – they can be used to generate public support, to achieve delegated autonomy and discretion from politicians, to protect the agency from political attack, and to recruit and retain valued employees
Source: author’s compilation based on the literature review

129
Economic Science for Rural Development Nr. 28., 2012
ISSN 1691-3078
neither good nor bad, but the percentage of those who perceived it as bad or very bad increased slightly from 17% in 2007 to 18.5% in 2011. Similarly, there was a rise in the share of surveyed farmers having more than
5 years of experience with the agencies.
2. MeasuresFarmers’ views/perceptions about the two agencies
were collected through structured questionnaires containing questions related to different aspects of each agency’s performance. Farmers were asked to give their responses to the same set of items. The reputation of the agencies is exempliied by sub-set of 13 variables shown in Table 4. Those original attributes were developed based on reputation literature. All items were measured on ten-point Likert-type scales where (depending on question) 1 is “disagree completely”, 10 is “agree completely” or 1 is “not at all satisied”, 10 is “very satisied”. It is assumed that reputation is positively affected by all the attributes, except for “Agency is politicised” variable. Thus, overall reputation score was obtained by calculating the average of the 12 averages of the
samples.
Research results and discussionIt is reasonable to expect that the perception
of reputation (normative reputation) of agricultural agencies amongst surveyed farmers is fairly good as they may believe that the government ought to be involved
A. Zawojska Reputation of Public Administration: Agriculture-Related Agencies in Poland Seen Through Farmers’ Eyes
in protecting agriculture and rural areas or perhaps they
do not think about the agencies generally but about their
own experience and beneits from the policy delivered by those agencies. The study indings are supportive for this assumption (Table 4).
Farmers’ satisfaction with the delivery of payments (payments made on time) received the highest values from the respondents, followed by the statement “Agency is important for the development of Polish agriculture”. The practice of many nations is to use public administration for political purposes. As concerns the judgment of respondents regarding bureaucratic autonomy, i.e. the situation when neither politicians nor organised interests inluence the action of the agencies, the scores for each attribute were neutral. The ARMA generally received more favourable mark for overall (summary) reputation than the AMA. It is possible that higher recognition of the ARMA
was due to its involvement in administration of direct farm payments and Rural Development Programme. For both agencies the overall reputation score as well the all (the ARMA) or majority (the AMA) of its components have slightly improved
between 2007 and 2011. The limitation of results is that they only refer to
Polish public sector organisations and only to the two agencies, so they could not be generalised to other
countries and to the entire public administration in
Poland.
Table 3
Sample characteristics, N=200
Characteristics2007 2011
Percentage
Gender Male 70.0 72.0
Female 30.0 29.0
Age (years) 18-40 33.5 30.0
41-64 60.0 67.0
65 and more 3.5 3.0
No answer 3.0 0.0
Education Primary 11.5 9.0
Basic vocational 44.0 37.5
Secondary 36.0 43.5
University 8.5 10.0
Subjective farm situation Very good 2.0 2.0
Good 29.5 30.5
Regular 51.5 49.0
Bad 16.0 15.0
Very bad 1.0 3.5
Access to Internet Yes 29.0 72.0
Years of cooperation with ARMA Up to 5 85.0 12.5
5 and more 15.0 87.5
Years of cooperation with AMA Up to 5 78.0 33.5
5 and more 22.0 66.5Source: author’s calculations based on the survey data

Economic Science for Rural Development Nr. 28., 2012
ISSN 1691-3078
130
A. Zawojska Reputation of Public Administration: Agriculture-Related Agencies in
Poland Seen Through Farmers’ Eyes
Conclusions, proposals, recommendations
Much of reputation literature concerns private
organisations (corporations) and few studies deal with reputation in the public sector This paper is an initiative
to ill a gap in empirical research on reputation of the government agencies in Poland represented by the ARMA and the AMA that are also executive arms of the EU and the Common Agricultural Policy.
Own research indings challenge the widespread criticism that most public agencies are of law reputation, and reveal that the surveyed agencies have neutral or a
somewhat positive reputation, at least in the eyes of one group of stakeholders. However, the results also suggest that agencies might improve reputation by being more responsive to the demands not only of farmers as the indirect users of public administration services but also of all citizens (by putting a greater focus on the satisfaction
of general public interest). The research can contribute to both theory and practice
by providing alternative results on public administration reputation. The research results may be of interest to those who manage or control the agencies as well as those searching for ways to measure the effectiveness of public sector organisations.
Bibliography 1. Akerlof, G.A. (1970). The Market for “Lemons”:
Quality Uncertainty and the Market Mechanism. The
Quarterly Journal of Economics, Volume 84, Issue 3, pp. 448–500.
2. Andreassen, T.W., Lindestad, B. (1998). The Effect
of Corporate Image in the Formation of Customer Loyalty. Journal of Service Research, Volume 1, Issue 1, pp. 82–92.
3. Barney, J.B. (1996). Gaining and Sustaining
Competitive Advantage. Addison Wesley Publishing
Company. p. 570.4. Bromley, D.B. (2000). Psychological Aspects
of Corporate Identity, Image and Reputation. Corporate Reputation Review, Volume 3, Issue 3, pp. 240–252.
5. Bromley, D.B. (2001). Relationships between Personal and Corporate Reputation. European
Journal of Marketing, Volume 35, Issue 3/4, pp. 316–334.
6. Carpenter, D.P. (2001). The Forging of Bureaucratic
Autonomy: Reputations, Networks, and Policy
Innovation in Executive Agencies, 1862-1928.
Princeton: Princeton University Press.7. Carpenter, D.P. (2002). Groups, the Media, Agency
Waiting Costs, and FDA Drug Approval. American
Journal of Political Science, Volume 46, Issue 2, pp. 490–505.
8. Cavaye, J.M. (1997). The Role of Public Agencies in
Helping Rural Communities Build Social Capital: Case
Studies of the Interaction between the Wisconsin
Department of Natural Resources and Local
Communities. Madison: University of Wisconsin. p.343.
9. Ettenson, R., Knowles, J. (2008). Don’t Confuse Reputation with Brand. MIT Sloan Management Review, Volume 49, Issue 2, pp. 19-21.
Table 4
Averages scores given to reputation attributes and overall reputation
AttributesAMA ARMA
2007 2011 Change 2007 2011 Change
Agency...is an ideal government ofice 6.3 6.9 0.6 6.6 7.6 1.0
acts in the best public interest 6.5 6.8 0.3 7.0 7.2 0.2
effectively manages public money 6.4 6.3 -0.1 6.4 6.6 0.2
is resistant to the inluence of different interest groups 6.0 5.6 -0.4 5.9 6.2 0.2
is politicized 5.8 5.8 0.0 6.1 5.6 -0.5
provides high quality services for farmers 6.7 7.2 0.5 7.1 7.4 0.3
meets farmer’s all expectations and demands 6.2 6.7 0.5 6.6 7.2 0.6
provides reliable/suficient information about the EU-programmes 6.6 7.1 0.5 7.1 7.4 0.3
is trustworthy 6.6 6.8 0.2 7.1 7.4 0.3
is important for the development of national agriculture 7.1 7.2 0.1 7.4 7.9 0.5
Farmers’ satisfaction with delivery of payments 8.2 8.1 -0.1 8.0 8.1 0.1
Farmers’ overall satisfaction with administration of delivered programmes and schemes by the agency 6.1 6.6 0.5 7.1 7.3 0.2
Average (except for Agency is politicised attribute) = overall reputation score
6.6 6.8 0.2 6.9 7.3 0.4
Notes: Ratings were given on a 10-point scale. Average (overall reputation) score = (1 to 2) represents a very negative reputation, (3 to 4) represents a somewhat negative reputation, (5 to 6) represents an average (neutral) reputation, (7 to 8) represents a
somewhat positive reputation, and (9 to 10) represents a very positive reputation
Source: author’s calculations based on the survey data

131
Economic Science for Rural Development Nr. 28., 2012
ISSN 1691-3078
10. Fombrun, C.J. (1996). Reputation: Realizing Value from the Corporate Image, Boston, MA: Harvard Business School Press. p. 72.
11. Fombrun, C.J. (2001). Corporate Reputation as Economic Assets, in: Hitt, M.A., Freeman, R.E., Harrison, J.S. (eds.) Handbook of Strategic
Management. Oxford UK: Blackwell Publishers. pp. 289-312.
12. Fombrun, C.J., Gardberg, N., Barnett, M.L. (2000). Opportunity Platforms and Safety Nets: Corporate Citizenship and Reputational Risk. Business and
Society Review, Volume 105, Issue 1, pp. 85–106.13. Fombrun, C.J., Shanley, M. (1990). What’s in a
Name? Reputation-Building and Corporate Strategy. Academy of Management Journal, Volume 3,
Issue 2, pp. 233–258.14. Frederickson, G., Frederickson, D.G. (1995). Public
Perceptions of Ethics in Government. The Annals
of the American Academy of Political and Social
Science, Volume 537, Issue 1, pp. 163-172.15. Goldberg, A.I., Cohen, G., Fiegenbaum, A. (2003).
Reputation Building: Small Business Strategies for Successful Venture Development. Journal of
Small Business Management, Volume 41, Issue 2, pp. 168–187.
16. Goodsell, Ch.T. (1994). The Case for Bureaucracy:
A Public Administration Polemic. Chatham, NJ: Chatham House Publishers. p. 226.
17. Gotsi, M., Wilson, A.M. (2001). Corporate Reputation: Seeking a Deinition. Corporate Communications,
Volume 6, Issue 1, pp. 24–30.18. Gradzewicz, M., Growiec, J., Hagemejer, J., Popowski,
P. (2010). The Business Cycle in Poland: Conclusions from Spectral Analysis. Bank and Credit, Volume 41, Issue 5, pp. 41–76.
19. Herbig P., Milewicz, J. (1995). The Relationship of Reputation and Credibility to Brand Success. Journal of Consumer Marketing, Volume 12, Issue 4, pp. 5–10.
20. Highhouse, S., Broadfoot, A, Yugo, J.E., Devendorf, S.A. (2009). Examining Corporate Reputation Judgments with Generalisability Theory. Journal
of Applied Psychology, Volume 94, Issue 3, pp. 782–789.
21. Lewis, S. (2001). Measuring Corporate Reputation. Corporate Communications: An International
Journal, Volume 6, Issue 1, pp. 31–35.22. Luoma-aho, V. (2007). Neutral Reputation and Public
Sector Organisations. Corporate Reputation Review, Volume 10, Issue 2, pp. 124-143.
23. Lyman, D. (1856). The Moral Sayings of Publius Syrus, a Roman Slave: From the Latin. Boston: L.E. Bernard & Company. p. 76.
24. MacMillan, K., Money, K., Downing, S., Hillenbrand, C. (2005). Reputation in Relationships: Measuring Experiences, Emotions and Behaviours. Corporate Reputation Review, Volume 8, Issue 3, pp. 214–232.
25. Milgrom, P., Roberts, J. (1992). Economics,
Organisation, and Management. Englewood Cliffs, NJ: Prentice Hall.
26. Ministry of Finance (2011). Quarterly Information
on the Macroeconomic Situation and State of Public Finances, Volume 1, Warsaw.
A. Zawojska Reputation of Public Administration: Agriculture-Related Agencies in Poland Seen Through Farmers’ Eyes
27. Oxford English Dictionary (2011). Retrieved: h t tp : / /ox fo rdd i c t i onar i es . com/de f in i t i on/reputation?q=reputation. Access: 17 December 2010.
28. Picci, L. (2011). Reputation-Based Governance. Stanford, CA: Stanford University Press. p. 223.
29. Post, J.E., Grifin, J.J. (1997). Corporate Reputation and External Affairs Management. Corporate
Reputation Review, Volume 1, Issue 1, pp. 165–171.30. Roberts, P.W., Dowling, G.R. (1997). The Value of
a Firm’s Corporate Reputation: How Reputation Helps Attain and Sustain Superior Proitability. Corporate Reputation Review, Volume 1, Issue 1, pp. 72–76.
31. Roberts, P.W., Dowling, G.R. (2002). Corporate Reputation and Sustained Superior Financial
Performance. Strategic Management Journal. Volume 23, Issue 12, pp. 1077–1093.
32. Rose, C., Thomsen, S. (2004). The Impact of Corporate Reputation on Performance: Some
Danish Evidence. European Management Journal, Volume 22, Issue 2, pp. 201–210.
33. Schultz, M., Mouritsen, J., Gabrielsen, G. (2001). Sticky Reputation: Analysing a Ranking System. Corporate Reputation Review, Volume 4, Issue 1, pp. 24–41.
34. Selnes, F. (1993). An Examination of the Effect of Product Performance on Brand Reputation, Satisfaction, and Loyalty. European Journal of
Marketing, Volume 27, Issue 9, pp. 19–36.35. Shapiro, C. (1983). Premiums for High Quality
Products as Returns to Reputation. The Quarterly
Journal of Economics, Volume 98, Issue 4, pp. 659–679.
36. Sharman, J.C. (2007). Rationalist and Constructivist Perspectives on Reputation. Political Studies, Volume 55, Issue 1, pp. 20–37.
37. Stigler, G.J. (1962). Information in the Labour Market. Journal of Political Economy, Volume 70, Issue 5, pp. 94-105.
38. Suh T., Amine L.S. (2007). Deining and Managing Reputational Capital in Global Markets. Journal of
Marketing Theory and Practice, Volume 15, Issue 3, pp. 2005-2018.
39. Turban, D.B., Cable, D.M. (2003). Firm Reputation and Applicant Pool Characteristics. Journal of
Organisational Behaviour, Volume 24, Issue 6, pp. 733-751.
40. Walsh, G., Beatty, S.E. (2007). Customer-Based Corporate Reputation of a Service Firm: Scale Development and Validation. Journal of the
Academy of Marketing Science, Volume 35, Issue 1,
pp. 127–143.41. Wartick, S.L. (1992). The Relationship between
Intense Media Exposure and Change in Corporate Reputation. Business and Society, Volume 31, Issue 1, pp. 33–49.
42. Whitford, A.B. (2002). Bureaucratic Discretion, Agency Structure, and Democratic Responsiveness: The Case of the United States Attorneys. Journal
of Public Administration Research and Theory, Volume 12, Issue 1, pp. 3–27.
43. Williamson, O.E. (1996). The Mechanism of Governance. New York: Oxford University Press.

Economic Science for Rural Development Nr. 28., 2012
ISSN 1691-3078
132
A. Zawojska Reputation of Public Administration: Agriculture-Related Agencies in
Poland Seen Through Farmers’ Eyes
44. Williamson, O.E. (1985). The Economic Institutions
of Capitalism: Firms, Markets, Relational Contracting. New York: The Free Press. p. 450.
45. Wilson, J.Q. (1989). Bureaucracy: What Government
Agencies Do and Why They Do It. New York: Basic Books. p. 433.

133
Economic Science for Rural Development Nr. 28., 2012
ISSN 1691-3078
R.Zvirgzdina, M. Pelse Development Possibilities of Farms in Latvia
___________________________1 E-mail address: [email protected].
Development Possibilities of Farms in Latvia
Rosita Zvirgzdina1, MBA. School of Business Administration Turiba
Modrite Pelse, Dr.oec. Faculty of Economics, Latvia University of Agriculture
Abstract. The authors of the paper have tried to ind out some possibilities favourable to the development of Latvian rural areas and to diminishing of differences between the regions of Latvia. Taking as basis the concept that a decisive role in such development is played by the increase of the productivity and skilled activities of the farmers, the authors pay attention to effective use of such kind of production resources as material capital and social capital. The authors conclude that the farmers should concentrate their attention not only on economic factors, but they have to pay more attention also to social factors, especially to such ones related to agriculture. Key words: development possibilities, cooperatives, social capital. JEL code: Q1 Q12
Introduction The aim of Latvian economy to approach possibly
soon the living standard of developed countries has
already been for several years. Vital preconditions for the achievement of this aim in Latvia include strengthening of the economic growth, balanced social economic development, and measured living standard.
The economic growth and the processes of social economic development are burdened by implications of the recent crisis, in result of which a slowdown had set in, leading to a decrease in consumption of households nearly about of one third and in investments – almost about of one half. Concerning the amounts, a return to the level of 2004 took place, followed by simultaneous increase of inequality. More or less, the gap between the wealthy and less wealthy strata has increased. The income continued to be distributed more and more unequally. During the period of 2000-2008, the Gini coeficient has increased from 34 to 38 points (Kazaks, 2010).
The consequences of the crisis affect most of all the rural population, since the territorial inequality continues to become stronger. It is evidenced by the social economic differences between the capital Riga and the rest of Latvia’s territory as well as by the proportion of the population living poorly at the time being or close by the poverty threshold. The GDP per capita in Latgale is 3.2 times, in Vidzeme and Zemgale – 2.7 times, and in Kurzeme – 2.2 times less than in Riga. As it is shown by the poverty risk index, in 2008 the proportion of population being poor or near to the poverty threshold
made 16% in Riga, 20% in Pieriga, 34% in Kurzeme, 25% in Zemgale, 32% in Vidzeme, and 42% in Latgale (Gadagramata, 2009), and it is the highest index in the EU. Practically, Riga is one pole and the rest of the
Latvia - the other one. In such situation, when there is a necessity to
overcome the implications of the crisis and to diminish the social economic differences, tending simultaneously to a sustainable even development all over the country, the readiness of all enterprises and individuals to be
prepared for active participation in the increase of
production and its productivity becomes an indispensable topicality, requiring to perceive and use for this target all existing and potential possibilities. In this paper, the authors determine to analyse these problems from the viewpoint of Latvian farmers. The research object is the
development possibilities in rural areas, the research subject – the farms engaged in milk production.
The aim is to ind out the development possibilities of farms in Latvia.
The following tasks will be solved to achieve the aim: 1) to characterise the factors affecting rural farms; 2) to analyse the development possibilities of farms in
Latvia; 3) to evaluate the role of development possibilities in
the growth of milk livestock farming. The methods used in the research: monograph,
analytical, inquiry etc.
Research results and discussionThe increase in production and its productivity depends
on how actively and skilfully the farmers will be able to take advantages of the ensured possibilities related to
a more rational use of disposable resources, getting a return that provides a normal managing of the farm. Normal managing means such kind of managing that leads to creation of a ratio between the production costs and revenues, which result in a situation that the farmer may be well-off and is interested in the development of production, taking advantages of his enterprise and initiatives in close relationship with the adoption of new knowledge, taking the best from the past, paying the main attention to the present and looking helpful in the future (Pennel, 1997).
Only a suficiently knowing farmer may be able to understand fully his role when farming in rural areas, combining the production factors, and carrying out activities forcing resources to create wealth (Drucker, 1985). An important role is played by new combinations of knowledge based on already existing knowledge.

Economic Science for Rural Development Nr. 28., 2012
ISSN 1691-3078
134
Wherewith, it may be said that it turns out as if to be dealt with an interactive learning process that may provide an opportunity to combine single knowledge areas in a new way as well as to create new knowledge, sometimes even coming to new processes or new products. It is essential that such interaction is typical not only to scientiic research area but it is also related to everyday economic activities including progression, production, and marketing. This interaction may have a very great scope and take place between individuals and production structure units in the framework of an enterprise, between enterprises and consumers, between different enterprises, and between enterprises and different organisations (Edquist, 1997). In dairy-farming, for example, such interaction may take place between dairy-farms in the framework of a cooperative, between the cooperative and processors etc. The more expanded is the cooperative, the more vast area will embrace this interaction.
It is indisputable that the more knowledgeable is the farmer; the multi-shaped possibilities will be at his disposal to come to a new creative combination. The knowledge results in human capital, but it is necessary to improve it and that requires investment. In this context, it is worth considering some concepts related to common agriculture policy, namely, that, notwithstanding some essential considerable exceptions, the problem of improvement of human capital becomes neglected in agriculture policy, paying the attention mainly either to support of prices and market management or to the capital adaptation invested into land run, and buildings and equipment. Yet, investment into people is fundamentally important, if they hope to beneit from improvements in other production sectors (Pennel, 1997). Besides, the investment into human capital may have a close relationship to formation of the social capital.
Finding and use of possibilities based on continually
growing knowledge is a many-sided phenomenon, the speciicity of which depends on a concrete area, its structure, management conditions, and results. In the process of using his entrepreneur-capacity and
combining the production factors, the farmer’s success depends greatly on his ability to evaluate the factors
both facilitating and impeding the production, and to perceive the possible sustainable management changes that may be favourable to production development and improvement. The development of an enterprise depends not only on the physical or human capital. The process of connections that relates to the collaboration, conidence, cooperation etc. is also of importance. In this context, it is essential to evaluate the role of social capital.
Originally, the concept of social capital was used in studies related to the society, but recently this concept is to be used widely in studies connected with organisations and enterprises in connection with the social context, with inner relations between the structures and organisations (Jacobs, 1965; Burt, 1992; Nahapiet, 1993).
The social capital contributes to the exchange of resources and their combination between the structural units of the organisation, and it has a positive impact on innovation of the products (Tsai, Ghoshal, 1998). Different success of enterprises may be explained by the intensity in linking to other participants of the social networks (Adler, Kwon, 2002). The social capital may contribute to
increase of the productivity in the enterprise and provide
essential cost preferences in competition (Grave, 2003). The scientiic literature contains several deinitions
of social capital. With the social capital concept in this paper, the authors understand the beneits resulting from interrelations and social structures developing in the network and effecting action of the individual (Pelse, 2006). In its turn, with dairy farms, it is to be understood such farms that produce and sell milk to processors and consumers.
On the basis of their previous research (Pelse, 2003, 2004, 2006; Zvirgzdina, 2009, 2010), the authors are, in practical part of this paper, determined to ind out the possibilities favourable to the development of farms in Latvian rural areas, especially in milk production; originally deining essential factors related to the farms and their development:
— size of the farm; — proportion of proitable farms; — accessible amount of investments; — social capital at disposal of the farm owners; — involvement in the cooperative.
Two inquires of farmers were carried out to ind out the possibilities favourable to rural development in Latvia. The one, being of a common nature, was carried out in 2010 with the aim to ind out the attitude of farmers to intensiication opportunities in the production. In this inquiry, the general multitude was formed by the farms employed in an intensive production of milk throughout Latvia, and the data were interpreted in a regional aspect. The second inquiry was carried out in one of the regions of Latvia – Zemgale in 2006, and it was aimed to ind out the role of social capital in the development of farming. The number of respondents in this inquiry made 207.
If one characterises the size of farms involved in
milk production, then the distinctive size is evidenced by the number of milking cows in them. In 2009, the number of farms with 1-2 cows made 72.0%, 3-5 cows – 13.5%, 6-9 cows – 5,8%, 10-19 cows –
4.6%, 20-29 cows – 1.6%, 30-49 cows – 1.2%, 50-99 cows – 0.8%, and only 0.5% of all farms had more than 100 milking cows in Latvia. The smallest farms, i.e. the farms with 1-2 milking cows, owned only 18% of the whole number of milking cows, whereas, the biggest farms – 23.9% (Data of Latvian CSB). Therefore, it is understandable that the vast majority of quota-holders (60%) are represented by the farmers with the number of cows up to 5. The number of quota-owners with
6-49 cows makes 36% but the number of quota owners with more than 50 – only 4%. In return, the proportion of milk sold is quite the opposite: in the group with the number up to ive cows, the amount of milk sold made only 9% of the whole amount, in the group with 6 to 49 cows – 39% but in the group with more than 50 cows – 52% (ZM Lauksaimniecibas zinojums, 2011). Presently, the small farms in Latvia are disallowed to get involved into large-scale production of milk products, as the milk collection from the cowherds with 1-2 or 3-5 cows does not practically take place. This kind of milk supply is recognised as unproitable by milk processors, thus, approximately 4/5 of the cow owners produce milk for self-consumption and only 1/5 of them develop this activity as business. Wherewith, one of
R.Zvirgzdina, M. Pelse Development Possibilities of Farms in Latvia

135
Economic Science for Rural Development Nr. 28., 2012
ISSN 1691-3078
the development possibilities is related to enlargement of the farms.
As it is to be seen from results of the inquiry carried out in the 2010, the number of proitable farms differs
in both dimensions - years and regions, and the situation on this score cannot be considered as a favourable one. Although, as it is to be seen from Figure 1, the indices for the period of 2005-2007 are characterised by some increase that, to a certain extent, may be counted for a more favourable milk purchasing prices and the support policy implemented by the state, nonetheless a decrease follows thereafter. Since the unfavourable changes have touched Latvian regions, the authors concluded that the differences among the proitable enterprises have had substantial causes related to a different use of production
resources. Not always the fact of a farm being proitable provides
a sustainable development of it. It is essential to estimate
the accessible amount of inancial resources for investments. The insuficiency of inancial resources for investments is evidenced by the fact that not all the farms, being inquired, were able to invest in such important areas as modernisation of fodder preparation, improvement of livestock breed, acquiring of new milking and cooling equipment as well as the livestock welfare (Figure 2).
It is typical that comparatively least inancial resources were invested into improvement of livestock breed, being carried out only by 48% of respondents. It affected negatively the milk production that is evidenced by the fact that the farmers, having invested into improvement of livestock breed, had an
average milk yield per cow, being 15% higher than the yield of farmers without such investments. The highest proportion of farmers without investment into improvement of livestock breed is typical to
Source: authors’ construction based on the inquiry results in 2010
Fig. 1 Proportion of proitable farms in the regions of Latvia in 2004-2008, %
R.Zvirgzdina, M. Pelse Development Possibilities of Farms in Latvia
Source: authors’ construction based on the inquiry results in 2010
Fig. 2 Evaluation of respondents on investments in milk production in 2004-2008, %

Economic Science for Rural Development Nr. 28., 2012
ISSN 1691-3078
136
Latgale region farmers; only 29% of them had invested inancial resources into improvement of milk
cows’ breed. Investments into the purchase of new milking and
milk cooling equipment are more or less the same in all regions, and approximately 75-90% of all respondents had made such investments into the development. Investment potential made into development is the one that determines also, to a great extent, the inclination or its opposite – the disinclination of farmers to continue the business. Overall, the situation is such that not all the conditions are stimulating the inclination to start or continue the production (Figure 3). Only in Pieriga, Vidzeme and Kurzeme regions, more than half of respondents are inclined to continue production, and modernising the farm. On the contrary, a part of milk producers in Kurzeme, Zemgale and, especially, in Latgale are considering the possibility of changing their activity
proile or a full liquidation of the farm. More than half of all respondents in Latgale region have a similar trend.
In all regions, approximately one third of all farms are convinced that they are going to continue their activities
on the present level. It should also be mentioned that milk production in Latvia has been one of the activities subjected to a rather essential impact not only of economic conditions on every farm but also on the demand of products on both local and export markets as well as on milk processors’ capacity, supplied choice of products and changing conditions of marketing having not contributed to the stability and sustainability in this
area. If all the aforementioned and analysed factors were
related to the economic conditions, and to a degree to inances, then the next factor to be veriied – the social capital is related more to the social conditions. Yet, it is necessary to point out its ability to materialise, providing ‘tangible beneits’. To deine the presence of social capital and its impact on the development in the
carried out inquiry, the following variables that show the development level of the farms were used:
— used land area (ha); — changes in the used land area (ha) in the past
10 years; — use of the EU funds for farm development; — current economic situation of the farm; — respondents opinion about their farms viability
in the future. — Farmers’ social capital indicators were: — involvement in different social activities; — cooperation and membership in associations.
Data were calculated using SPSS. To ind any links between variables, the authors used Chi – Square test, while p-value approach was used for decision making. The data credibility rate was assumed at α=0.05. Statistical credibility coeficients Phi and Cramer’s V were used for characterising relationships between two indications.
When analysing the survey data presented in Table 1, one can see that there is a relationship between the criteria of economic success: farmed land area, its changes; respondents’ participation in different professional societies, associations, unions, and farmers’ participation in different public agricultural organisations - the p-value
is less than 0.05. There are also relationships between the farm viability and farmers’ participation in professional societies, associations and unions (c2=6.513), and the use of the EU funds and farmers’ participation in public agricultural organisations (c2=6.343), the p-value is less than 0.05. The social capital indicators like farmers’ participation in local government working groups, organised sport activities and amateur bands are not useful for farm development because the p-value is greater than 0.05, except for one case – a relationship emerges between farmers’ participation in organised sport activities and farm viability – c2=6.343 and is less than 0.05. Respondents’ involvement in political parties and public activities of religious organisations
R.Zvirgzdina, M. Pelse Development Possibilities of Farms in Latvia
Source: authors’ construction based on the inquiry results in 2010
Fig. 3 Opinion of respondents on the development possibilities in the regions of Latvia in 2009, %

137
Economic Science for Rural Development Nr. 28., 2012
ISSN 1691-3078
was ascertained in the survey. Only 6 respondents out of 207 admitted to be involved in a political party or a party group, and only 8 respondents said to be involved in religious organisations. Therefore, these indicators are not included in the table.
Most of relationships emerge between the criteria selected to characterise farms’ development level and social capital indicators, the indicators of farmed land area and its changes point to the farmers’ participation in public activities.
Cooperation is quite poorly developed in Latvia, yet, it has to be noted that cooperation in agriculture is much more developed than in other industries of the national economy. Farmers engaged only in agricultural
cooperatives. Presently, in Latvia, a few dozens of strong cooperatives have emerged in which rural entrepreneurs trust.
In the survey, the authors wished to get to know respondents thoughts whether co-operatives improve or hinder farmers’ performance. Only 123 respondents out of 207 believe that cooperatives improve farmers’ performance, ive respondents think that they hinder, 46 respondents are convinced that there is no effect, while 33 respondents had no opinion on this question.
After assessing the gained survey results, one has to conclude that relationships exist between farmers’
engagement in cooperatives and farm development criteria, since there are relationships between all the indicators; the p-value is less than 0.05 and the Chi-Square value is within the range of 7.699 (farm viability) and 39.249 (farmed land area). Besides, the strongest relationship was observed between the indicator of farmed land area and farmers’ engagement in cooperatives. The author justiies this fact by Cramer’s V=0.435, the weakest association was observed between farmers’ engagement in co-operatives and farm
viability – Cramer’s V=0.193 (Table 2). It means that cooperation plays a signiicant role in developing farms in rural areas.
Conclusions, proposals, recommendations 1. Development possibilities in the rural areas of Latvia
are related close to the entrepreneurship development typical to rural areas. For farmers, it is essential to widen their activities, increasing the number of cows in dairy livestock farms. A proitable farming may provide possibilities of investment attraction to rural farms. In milk industry, the investments are of importance in equipment renovation and improvement, yet, a direct effect, resulting in an increase of the proit, may be provided by cultivation
Table 1
Relation of public activities to farm growth criteria
Involvement of farm managers in public activities
ValueFarmed
land area
Land area
changes
Use of EU Funds
Material position
Farm viability
In professional societies, unions, associations
p
c2
0.00027.772
0.00118.623
0.0832.998
0.6800.771
0.0396.513
In public agricultural organisationsp
c2
0.00053.453
0.00118.378
0.0126.343
0.3781.946
0.0944.729
In working groups tackling local government problems
p
c2
0.3125.938
0.5323.157
0.6250.239
0.0615.587
0.6150.973
In organised sport activitiesp
c2
0.1887.473
0.25.991
0.0613.514
0.232.939
0.0456.193
In amateur bands p
c2
0.4055.088
0.1646.512
0.211.570
0.2093.133
0.7640.540
Note: values having a signiicant relationship between factors are shown in bold
Source: authors’ calculations based on the survey results of 2006
Table 2
Relationships between indicators characterising farm growth and farmers’ participation in cooperatives
Indicators characterising the economic growth of farmsValues
Cramer’s Vc2 p-value
Farmed land area 39.249 0.000 0.435
Land area changes 31.802 0.000 0.392
Use of the EU funds 17.260 0.000 0.289
Material position 10.310 0.006 0.223
Farm viability 7.699 0.021 0.193 Note: values having a signiicant relationship between factors are shown in bold
Source: authors’ calculations based on the survey results of 2006
R.Zvirgzdina, M. Pelse Development Possibilities of Farms in Latvia

Economic Science for Rural Development Nr. 28., 2012
ISSN 1691-3078
138
of the herd, providing an increase in milk yield of 15% thereby.
2. An essential development possibility for rural farms is related to the social capital and potential possibilities
of its increase. The social capital of farmers has an effect on the growth of their farms, since the inner relationship between the farm’s development indices and the indicators of farmers’ social capital such as farmers’ participation in professional societies, unions, associations, and in different agricultural social organisations and participation in agricultural
cooperatives. 3. The farm owners should concentrate their attention
not only on economic factors as the only ones favourable to a development. For the sake of development, the social factors shall also be used more, including the participation in social activities, involvement in social organisations, especially such ones related to agriculture as well as uniting and activating in different cooperatives.
Bibliography 1. Adler, P., Kwon, S.W. (2002). Social Capital: Prospects
for a New Concept. Academy of Management Review, Vol. 27, No. 1, pp. 17-40.
2. Bojars, J., Vilne, V. (1996). Starptautiskas investicijas. Riga: Latvijas Universitates Starptautisko attiecibu instituts. 265 lpp. ISBN 9984-551-30-x.
3. Burt, R. (2004). Structural Holes and Good Ideas. American Journal of Sociology, vol. 110, pp. 349-399.
4. Drucker, P.F. (1985). Purposeful Innovation and the Seven Sources for Innovation Opportunity. In: Innovation and Entrepreneurship: Practice and
Principles, Chapter 2, New York: Harper and Row, 30-36, in the Foundations of Entrepreneurship, Shane S. (Ed.), Volume 1, Cheltenham, UK. ISBN 1-84064-393-5.
5. Edquist, Ch. (1997). Systems of Innovation. London and Washington. p. 432
6. Greve, A., Benassi, M., Sti A.D. (2003). Exploring the Contributions of Human and Social Capital to Productivity. Retrieved: http://209.85.129.104/search?q=cache:69xXl3JOvFgJ:www.chass.utoronto.ca/~agreve/Greve-Benassi_soc%26hum.pdf+Greve+A.+(2003)+Benassi+Exploring+the+ contributions+of+human+and+social+capital+to+productivity+//GESTO&hl=lv&ct=clnk&cd=1&gl=lv. Access: 16 September 2011.
7. Jacobs, J. (1992). The Death and Life of Great American Cities. Retrieved: http://www.walksf.org/essays/janejacobs.html. Access: 16 June
2011.
8. Kazaks, M. (2010). Kam vajag «divu atrumu» sabiedribu? Diena, 25 January 2010.
9. Latvijas statistikas gadagramata 2009. Riga: LR CSP, 2009. 635 lpp.
10. Nahapiet, J., Ghoshal, S. (1998). Social Capital, Intellectual Capital and the Organisational Advantage. Academy of Management Review. Vol. 23, No. 2, pp. 242-266.
11. Pelse, M. (2003). Social Capital in Economy. Economic
Science for Rural Development: Proceedings of
the International Scientiic Conference I. Jelgava: LLU, pp. 207-212.
12. Pelse, M. (2004). Regional Identity and Social Capital in the Management and Development Process of Local Governments. Economic Science for Rural
Development: Proceedings of the International
Scientiic Conference, No. 6 (Regional Development). Jelgava: LLU, pp. 67.-72.
13. Pelse, M. (2006). Interrelationships Between Farm Development and Social Capital in a Regional Context. Economic Science for Rural Development:
Proceedings of the International Scientiic Conference, No. 11 (Finance and Credit Diversiication). Jelgava: LLU, pp. 200-208.
14. Pennel, R. (1997). The Common Agricultural Policy. Disadvantaged Farmers and Problem Regions, The
Development of Farm Workforce. Cleardon Press – Oxford, p. 439.
15. Saktina, D., Varika, A., Lismanis, A., Pohl, B. (2001). Latvijas lauku attistibas politika: kapec un ka? Riga, 2001, 149 lpp.
16. Tsai, W., Ghoshal, S. (1998). Social Capital and Value Creation: An Emiprical Study of Intra-irm Networks. Academy of Management Jornal, Vol. 41, No. 4, pp. 464-476.
17. ZM Lauksaimniecibas zinojums, 2011.18. Zvirgzdina, R. (2009). Problems of Development
of Agricultural Production and Entrepreneurship
in Latvia. Economic Science for Rural
Development: Proceedings of the International
Scientiic Conference, No. 20 (Finances, Taxes, Investment and Support Systems). Jelgava: LLU, pp. 160-166.
19. Zvirgzdina, R. (2010). Intensiication in Agriculture and Development of Cooperatives. International Scientiic Conference “Vision
of the Modern Village”, No. 3 (19), Siauliai, pp. 269-276.
20. Zvirgzdina, R. (2010). Intensiication of Entrepreneurship and Entrepreneur in Rural Areas
of Latvia. Economic Science for Rural Development:
Proceedings of the International Scientiic Conference, No. 21 (Production and Taxes). Jelgava: LLU, pp. 145.-151.
R.Zvirgzdina, M. Pelse Development Possibilities of Farms in Latvia

139
Economic Science for Rural Development Nr. 28., 2012
ISSN 1691-3078
“ECONOMIC SCIENCE FOR RURAL DEVELOPMENT”
Proceedings of theInternational Scientiic Conference
RURAL BUSINESS AND FINANCE2. Finance And Taxes

Economic Science for Rural Development Nr. 28., 2012
ISSN 1691-3078
140
S. Ancans Aspects of Inlation and Interest Rates in Latvia
___________________________1 E-mail address: [email protected]
Aspects of Inlation and Interest Rates in Latvia
Sandris Ancans1, Mg.oec. Faculty of Economics, Latvia University of Agriculture
Abstract. In Latvia, unlike in the developed countries, higher inlation and interest rates as well as their higher luctuations are observed; inlation rates often exceed interest rates. The research aim is to investigate several aspects of inlation and interest rates in Latvia. According to the present research, the large luctuations of inlation rates are caused due to both differences in measuring inlation and fast growth or a recession in the national economy. With the Latvian lat being pegged to the euro, negative real interest rates turn to be an often phenomenon in Latvia, which may not be unambiguously viewed as a inancial loss to an investor. Yet, a high inlation rate due to different weighting patterns for inlation calculation and the so-called B-S effect might prevent Latvia from meeting the Maastricht criterion of inlation. Key words: inlation, interest rate, B-S effect.JEL code: E31, E43
IntroductionIn 2008, a global inancial and economic crisis began
in Europe and Latvia. The crisis was very severe in Latvia compared with other world countries, severer even if compared with other Baltic States. The crisis exposed and explicitly showed many mistakes made during the previous years when the economic growth was imbalanced and based on domestic consumption and imports. One of such mistakes was the fact that both households and enterprises, and the government did not save any funds. It was promoted by several factors. One of these factors is an assertion in economics that inancial capital owners lose purchasing power if a real interest rate is negative, thus, discouraging households and enterprises to save funds. Such an assertion is useful in developed countries whose governments and central banks concentrate mainly on the economic growth, inlation, and interest rates when making their economic policies. A secondary role belongs to their foreign exchange rate. Yet, in Latvia, it is vice versa – the main attention is paid to the foreign exchange rate or stability of the national currency lat. The monetary policy targeting at a stable foreign exchange rate, in its turn, signiicantly determines both economic growth, and inlation and interest rates in the country. Statistical data indicate that changes in both inlation and interest rates in Latvia are much greater than in the developed countries (Eurostat, 2011). It has to be noted that it is not possible to keep the lat pegged to the euro and at
the same time to achieve desired rates of inlation and interest.
Research hypothesis: several factors of inlation increase inlation indicators and their changes in Latvia, which negatively inluence decisions of depositors and investors to make savings and investments.
The research aim is to investigate several aspects of
inlation and interest rates in Latvia.The following research tasks were set to achieve the
research aim:1) to specify the methodology of measuring indexes of
inlation in Latvia in comparative aspect;
2) to ascertain the impact of the Balassa-Samuelson effect on inlation in Latvia;
3) to investigate the real interest rates in Latvia in comparative aspect;
4) to investigate the problem of meeting the Maastricht criterion of inlation in Latvia.
Research methods of analysis and synthesis, the abstract and logical methods, and inductive and deductive methods were applied in the present research. Statistical indicators provided by the Central Statistical Bureau of Latvia (CSB), Eurostat, and the Federal Statistical Ofice of Germany (Destatis) were used for the present research.
Research results and discussion1. Inlation and its measurement in Latvia in comparative aspect
Economics views inlation as a general increase in the price level of goods and services within a certain period. There are several factors of inlation that are usually discussed but the present paper focuses on less-known aspects of inlation.
Every country has its own methodology for measuring the index of inlation, and the main difference in measuring the index of inlation is related to weights of every good and service in the index of inlation. These weights are set as a proportion of expenditure on every commodity and service in the total expenditure of households. At the end of every year, the weights are recalculated in Latvia, and, thus, the weighting pattern for its index of inlation changes (CSB, 2011). In the European Union, the EC Regulation No. 1114/2010 sets the standard for weighting patterns for an index of inlation.
If these weights of goods and services are compared between various countries, certain differences are observed; besides, the differences for certain goods and services or their groups are even very signiicant. If these weights are compared between Latvia and developed countries, the largest differences are observed for such groups of goods and services as food and energy – fuel, heating etc. For instance, in Germany, as a representative

141
Economic Science for Rural Development Nr. 28., 2012
ISSN 1691-3078
developed country and in other developed countries, expenditure on food accounts for approximately 10% of the total household expenditure, while in Latvia it is around 25%, i.e. 2.5 times more (Table 1). In the period of 2005-2010 in Germany, the weights of goods and services in the harmonised consumer price index were based on the weighting pattern of 2005 (National Statistical Institute of Germany, 2011).
More than 15 years ago, the difference in weights of food in the consumer price index between Latvia and developed countries was even greater than now. Since a fast transition from the ineficient command economy to a market economy occurred in the 1990s in Latvia, the standard of living decreased, although, there was a signiicant difference in the standard of living between developed countries and Latvia under the command economy. According to Engel’s law, the share of expenditure on consumer goods (irst of all, food as well as other necessities) decreases with the increase in income. Although, actual expenditure on these goods increases; the shares of expenditure on rent, fuel, electricity as well as clothing do not change signiicantly, whereas, the shares of expenditure on education, health, entertainment, and luxury goods increase (Samuelson P., 1992). According to this law, the lower is income, the greater share of this income households spent on food. Due to the mentioned reasons, the standard of living in the irst half of the 1990s was very low compared with that in developed countries, and it was proved by the high share of expenditure on food, which accounted for more than 50% during that period. Yet, with the national economy developing in the second half of the 1990s, especially during the following decade, household incomes increased, and, thus, the share of expenditure on food declined from 49.7% in 1995 to 29.0% in 2004. After Latvia’s accession to the EU, faster economic growth was observed in the country, unfortunately, it was not a balanced and sustainable growth. Therefore, the share of expenditure on food fell to 23.8% in 2009, and then an increase in this indicator was observed. The change in the weight of food in Latvia’s consumer price index was signiicant during the period of analysis. It made a large impact on the total index of inlation measured
in the country, however, Latvia would not be able to reach the same weight of food in its index of inlation as in developed countries – even according to optimistic forecasts, approximately 30 years would be required (Latvijas Ekonomikas ministrija, 2003). Therefore, the weight of food in the index of inlation in Latvia will be greater than in developed countries for a long time. At an equal change in food prices in the modern global world, the contribution of inlation of the group of food goods to the total index of inlation in Latvia will be comparatively higher than in developed countries, i.e. presently approximately 2.5 times.
As regards other groups of goods and services, their weights in the index of inlation in Latvia are not as large as the weight of the group of food, thus, their impacts on the total index of inlation are not so great. However, the differences in these weights between Latvia and Germany are large as well. The largest difference is observed for thermal energy – its weight in the index of inlation in Latvia exceeds the respective indicator of Germany approximately 3.5 times. Therefore, any change in prices of energy on the world market will make a
3.5 times greater contribution to the total index of inlation in Latvia than in Germany.
Similar to the weight of thermal energy, the weights of several other goods and services signiicantly exceed the respective indicators of Germany, for instance, education and health, petrol and electricity, gas and other fuels. In the period after the accession to the EU, wages and other incomes in Latvia doubled, for instance, an average pre-tax wage was LVL 211 in Latvia in 2004, and the highest indicator or LVL 479 was reached in 2009 (CSB, 2011). Since education and health services are labour intensive, it promoted a signiicant rise in their prices and an increase in their weight in the index of inlation. This increase in weights occurred in accordance with Engel’s law – the share of expenditure on education and health increases with the increase in the standard of living.
In the same way as in the mentioned case of changes in food prices, any change in prices of energy will make a greater contribution to the total index of inlation in Latvia than in developed countries. So signiicant changes in labour costs regarding many services as in Latvia have
Table 1
Weights of certain goods and services in the consumer price index in Latvia and Germany, %
Code
Group or subgroup of goods and services
Latvia GermanyLatvia/
Germany
1995 2004 2008 2009 2010 2011 2005-2010 2010
01 Food and non-
alcoholic beverages49.7 29.0 24.0 23.8 24.3 25.4 10.4 133.7
045 Electrical energy, gas and other fuels
10.0 8.8 6.8 8.0 8.9 10.5 6.0 48.3
0455 incl. thermal energy 4.9 4.6 3.3 3.7 4.1 4.5 1.2 241.7
06 Health 1.1 3.9 4.4 5.1 6.1 5.8 4.0 52.5
07 Transport 6.3 10.4 13.9 13.2 12.9 13.3 13.2 -2.3
0722 incl. fuel 1.5 3.7 4.9 4.2 5.7 5.8 3.6 58.3
10 Education 0.9 1.6 1.3 1.4 1.8 1.7 0.7 157.1 Source: author’s calculations based on the CSB, Destatis
S. Ancans Aspects of Inlation and Interest Rates in Latvia
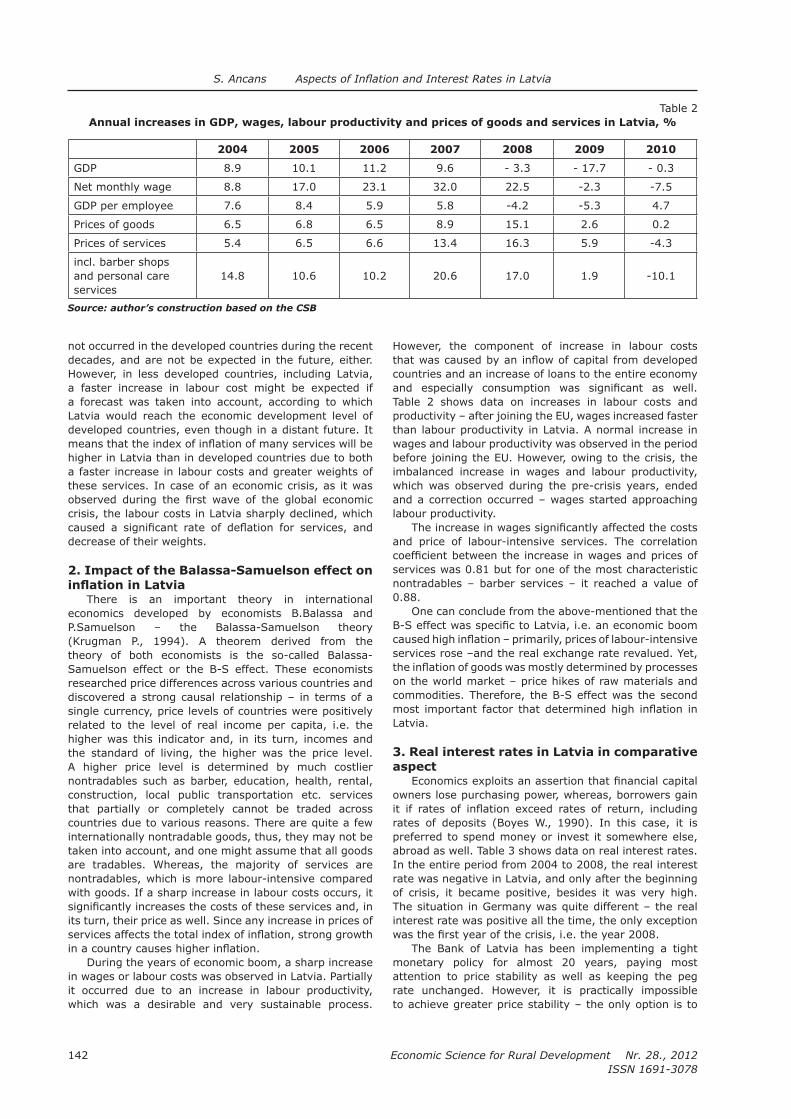
Economic Science for Rural Development Nr. 28., 2012
ISSN 1691-3078
142
not occurred in the developed countries during the recent
decades, and are not be expected in the future, either. However, in less developed countries, including Latvia, a faster increase in labour cost might be expected if a forecast was taken into account, according to which Latvia would reach the economic development level of developed countries, even though in a distant future. It means that the index of inlation of many services will be higher in Latvia than in developed countries due to both a faster increase in labour costs and greater weights of these services. In case of an economic crisis, as it was observed during the irst wave of the global economic crisis, the labour costs in Latvia sharply declined, which caused a signiicant rate of delation for services, and decrease of their weights.
2. Impact of the Balassa-Samuelson effect on inlation in Latvia
There is an important theory in international economics developed by economists B.Balassa and
P.Samuelson – the Balassa-Samuelson theory
(Krugman P., 1994). A theorem derived from the theory of both economists is the so-called Balassa-Samuelson effect or the B-S effect. These economists researched price differences across various countries and
discovered a strong causal relationship – in terms of a single currency, price levels of countries were positively related to the level of real income per capita, i.e. the higher was this indicator and, in its turn, incomes and the standard of living, the higher was the price level. A higher price level is determined by much costlier nontradables such as barber, education, health, rental, construction, local public transportation etc. services that partially or completely cannot be traded across countries due to various reasons. There are quite a few internationally nontradable goods, thus, they may not be taken into account, and one might assume that all goods are tradables. Whereas, the majority of services are nontradables, which is more labour-intensive compared with goods. If a sharp increase in labour costs occurs, it signiicantly increases the costs of these services and, in its turn, their price as well. Since any increase in prices of services affects the total index of inlation, strong growth in a country causes higher inlation.
During the years of economic boom, a sharp increase in wages or labour costs was observed in Latvia. Partially it occurred due to an increase in labour productivity, which was a desirable and very sustainable process.
However, the component of increase in labour costs that was caused by an inlow of capital from developed countries and an increase of loans to the entire economy and especially consumption was signiicant as well. Table 2 shows data on increases in labour costs and productivity – after joining the EU, wages increased faster than labour productivity in Latvia. A normal increase in wages and labour productivity was observed in the period before joining the EU. However, owing to the crisis, the imbalanced increase in wages and labour productivity, which was observed during the pre-crisis years, ended and a correction occurred – wages started approaching labour productivity.
The increase in wages signiicantly affected the costs and price of labour-intensive services. The correlation coeficient between the increase in wages and prices of services was 0.81 but for one of the most characteristic nontradables – barber services – it reached a value of
0.88.One can conclude from the above-mentioned that the
B-S effect was speciic to Latvia, i.e. an economic boom caused high inlation – primarily, prices of labour-intensive services rose –and the real exchange rate revalued. Yet, the inlation of goods was mostly determined by processes on the world market – price hikes of raw materials and commodities. Therefore, the B-S effect was the second most important factor that determined high inlation in Latvia.
3. Real interest rates in Latvia in comparative aspect
Economics exploits an assertion that inancial capital owners lose purchasing power, whereas, borrowers gain it if rates of inlation exceed rates of return, including rates of deposits (Boyes W., 1990). In this case, it is preferred to spend money or invest it somewhere else, abroad as well. Table 3 shows data on real interest rates. In the entire period from 2004 to 2008, the real interest rate was negative in Latvia, and only after the beginning of crisis, it became positive, besides it was very high. The situation in Germany was quite different – the real interest rate was positive all the time, the only exception was the irst year of the crisis, i.e. the year 2008.
The Bank of Latvia has been implementing a tight monetary policy for almost 20 years, paying most attention to price stability as well as keeping the peg rate unchanged. However, it is practically impossible to achieve greater price stability – the only option is to
Table 2
Annual increases in GDP, wages, labour productivity and prices of goods and services in Latvia, %
2004 2005 2006 2007 2008 2009 2010
GDP 8.9 10.1 11.2 9.6 - 3.3 - 17.7 - 0.3
Net monthly wage 8.8 17.0 23.1 32.0 22.5 -2.3 -7.5
GDP per employee 7.6 8.4 5.9 5.8 -4.2 -5.3 4.7
Prices of goods 6.5 6.8 6.5 8.9 15.1 2.6 0.2
Prices of services 5.4 6.5 6.6 13.4 16.3 5.9 -4.3
incl. barber shops and personal care
services
14.8 10.6 10.2 20.6 17.0 1.9 -10.1
Source: author’s construction based on the CSB
S. Ancans Aspects of Inlation and Interest Rates in Latvia

143
Economic Science for Rural Development Nr. 28., 2012
ISSN 1691-3078
revalue the lat against the euro. In this case, Latvia’s exports will be negatively impacted and, on the contrary, the country’s imports will be promoted. It will lead to a decrease in Latvia’s GDP, an increase in the trade gap, instability in the foreign exchange market as well as other negative effects.
Since the weights in the index of inlation in Latvia differ from such indicators in developed countries as well as due to the B-S effect, inlation indicators in Latvia are only conditionally comparable with the respective indicators in developed countries. Therefore, real rates of return do not have to be partially or even completely taken into consideration when making decisions on inancial investments denominated in lats in Latvia on condition that the Bank of Latvia does not change its monetary policy. For instance, the real interest rates in Latvia were negative for a long period until 2009. After the crisis began, those households and enterprises that made savings during that period did not face inancial problems. During the crisis, the real interest rates got positive and very high, and thus, saved funds could be used to gain an additional income. Then, interest rates in lats were very high both due to the lack of trust among commercial banks, thus, it was dificult to them to borrow funds in the interbank market, and the fact that the Bank of Latvia sold its part of its foreign reserves to support the peg rate. Hence, the amount of lats in circulation decreased, and due to expectations for the devaluation of the lat that caused interest rates on assets in lats to
climb in accordance with interest rate parity.Presently in 2011, negative interest rates are
observed again, mostly due to an increase in tax rates in the beginning of the year and an increase in
prices of raw materials and commodities on the world market. It does not mean that it is not proitable to save funds on the present economic conditions in Latvia.
4. Inlation and Latvia’s accession to the euro zone
One more aspect has to be outlined in relation to Latvia’s possible accession to the euro zone. One of the Maastricht criteria, which has to be met to join the euro
zone, is the criterion of inlation. Since members of the euro zone are mostly developed countries, their weights of goods and services in their index of inlation are quite different from those used in Latvia. Therefore, if prices of food and energy rise signiicantly, inlation in Latvia will be much higher than in the euro zone. If the economic growth in Latvia is faster, too, which is needed to reach the welfare level of developed countries, the B-S effect will make its impact on inlation, thus, additionally raising inlation indicators. In case there is a hike in prices of raw materials and commodities and, at the same time, an economic boom is observed in the national economy, both these inlationary factors sum up, and it is impossible to meet the criterion of inlation to join the euro zone. Such a period was observed after joining the EU until the irst wave of the recent crisis broke out when the annual rate of inlation in Latvia stood at a double digit igure for a couple of years, although annual inlation in the euro zone did exceed 3.3%. Several authors who researched the impact size of the B-S effect in the Central and East European countries, for instance, Fritz Breuss (Breuss F., 2002) from the Austrian Institute of Economic Research and Mihaly Andras Kovacs (Kovacs M., 2003) from the Central Bank of Hungary came to a conclusion that the B-S effect did not make a signiicant impact on inlation indicators in these countries including Latvia. These research were done in the period before the EU expansion in 2004; right after it an economic boom started in all the Baltic States. Since the economic growth was very strong after joining the EU, the impact of the B-S effect in Latvia was more signiicant than it was before the accession. Although, the mistakes, which were made by commercial banks allocating loans before the irst wave of the crisis, will never be repeated again
in the future and there will be no risk of imbalanced growth and overheating of the national economy, even relatively moderate economic growth (as before joining the EU) will make a certain impact of the B-S effect on inlation in Latvia. One can conclude that Latvia is able to meet the Maastricht criterion of inlation if there are no hikes in prices of raw materials and commodities and at the same time, no economic boom occurs in its national economy.
Table 3
Harmonised inlation and interest rates in Latvia and Germany
2004 2005 2006 2007 2008 2009 2010
Inlation
Latvia 6.2 6.7 6.5 10.1 15.4 3.5 -1.1
Germany 1.8 1.9 1.8 2.3 2.8 0.2 1.2
Nominal interest rates
Latvia * 4.8 4.0 4.3 6.7 9.9 11.9 5.8
Germany ** 3.0 2.8 2.7 2.6 2.5 2.4 2.4
Real interest rates
Latvia -1.4 -2.7 -2.2 -3.4 -5.5 8.4 6.9
Germany 1.2 0.9 0.9 0.3 -0.3 2.2 1.2 * - long-term deposit rates in LVL
** - rates of household deposits with a maturity of over 2 years
Source: author’s calculations based on the CSB, Destatis
S. Ancans Aspects of Inlation and Interest Rates in Latvia

Economic Science for Rural Development Nr. 28., 2012
ISSN 1691-3078
144
Conclusions1. Since there are differences in measuring the index
of inlation among various countries, any change in prices of raw materials and commodities causes a larger change in inlation in Latvia than in developed countries. These differences in measuring inlation will exist as long as there is a difference in economic development levels between Latvia and developed countries.
2. If an economic boom occurs in Latvia, the B-S effect is also observed – inlation, especially the inlation of nontradables, in Latvia is higher than in developed countries. The B-S effect will make an impact on inlation in Latvia until Latvia reaches the income level of developed countries.
3. If assessing inlation indicators in Latvia for investment purposes, the above-mentioned factors causing larger changes in inlation in Latvia than in developed countries have to be taken into
consideration; thus, inlation indicators in Latvia for the purpose of investments may be disregarded partially or completely.
4. With a tight monetary policy and the lat pegged to the euro on the economic conditions in Latvia, rates of inlation higher than rates of deposits or rates of return on other investments may not be unambiguously viewed as a inancial loss to an investor; otherwise, households and enterprises making no savings might face inancial problems in the future.
5. If relatively strong economic growth occurred in Latvia, which causes the B-S effect, and if at the same time prices of raw materials and commodities rose on the world market, due to different weights of goods and services in the index of inlation, it is dificult or impossible for Latvia to meet one of the Maastricht criteria – the criterion of inlation.
Bibliography1. Boyes, W., Melvin, M. (1990). Economics. Boston:
Houghton Miflin Company. p. 1045.
2. Breuss, F. (2003). Balassa-Samuelson Effects in the CEEC: Are they Obstacles for Joining the EMU? Retrieved: http://epub.wu.ac.at/198/1/document.pdf. Access: 9 December 2011.
3. Central Statistical Bureau of Latvia (2011). Database. Retrieved: http://www.csb.gov.lv. Access: 16 December 2011.
4. Eurostat (2011). Database. Retrieved: http://epp.eurostat.ec.europa.eu/portal/page/portal/eurostat/home/. Access: 9 December 2011.
5. Federal Statistical Ofice of Germany (2009). Prices. Weighting Pattern. Consumer Price Index of Germany. Retrieved: http://www.d e s t a t i s . d e / j e t s p e e d / p o r t a l / c m s / S i t e s /destatis/Internet/EN/Content/Statistics/Preise/Verbraucherpreise/WarenkorbWaegungsschema/WeightingPattern,property=ile.pdf. Access: 11 November 2011.
6. Kovacs, M.A. (2002). On the Estimated Size of the Balassa-Samuelson Effect in CEC5 Countries. Retrieved: http://ies.fsv.cuni.cz/default/ile/download/id/3739. Access: 9 December 2011.
7. Latvijas Ekonomikas Ministrija. (2003). Latvijas integracija Eiropas Savieniba (makroekonomiskais aspekts) (Ministry of Economics of the Republic of Latvia. Integration of Latvia into the European
Union (macroeconomic aspect). Retrieved: http://
old.em.gov.lv/em/images/modules/items/item_ile_847_makroapskats.pdf. Access: 10 November 2011.
8. Krugman, P.R., Obstield, M. (1994). International
Economics. Theory & Policy, 3rd edition. New York: Harper-Collins.
9. National Statistical Institute of Germany (2011). Harmonised Indices of Consumer Prices (HICP). Retrieved: http://epp.eurostat.ec.europa.eu/cache/ITY_SDDS/EN/prc_hicp_nesms_de.htm. Access: 11 November 2011.
10. Samuelson, P.A., Nordhaus W.D. (1992). Economics. Fourteenth edition. Singapore: McGraw-Hill Book
Co-Singapore. p. 784.
S. Ancans Aspects of Inlation and Interest Rates in Latvia

145
Economic Science for Rural Development Nr. 28., 2012
ISSN 1691-3078
V. Alekneviciene, L. Martirosianiene Agriculture Funding Measures in Lithuania: Demand and Opportunities
___________________________1 E-mail address: [email protected].
Agriculture Funding Measures in Lithuania:Demand and Opportunities
Vilija Alekneviciene, Dr.oec., professor; Lina Martirosianiene1, Ms.oec., lecturerAleksandras Stulginskis University, Lithuania
Abstract. Agriculture is a distinctive ield of business, which is distinguished by its competitive environment, amount of the EU support, seasonal impacts, and entrepreneurship of this sector. After evaluating the strive and wish of agricultural sector to become inancially autonomous and stay competitive, various agriculture funding programmes are presented to Lithuanian agricultural business entities whose purpose is to provide more inancial freedom and options while planning daily activities and development of agriculture. Even during the recession, favourable conditions for making the investments were ensured for agricultural sector: direct assignations, preferential credits, credit with the state’s guarantee, favourable funding packages for agriculture from commercial banks etc. This paper analyses the trends of direct assignations for agriculture, evaluates the absorption of the EU support for Rural Development Programme, trends of preferential credits, and credits with guarantee granted for agriculture, and, inally, it explores the share of credits issued to agricultural and forestry entities in all credits’ portfolio issued from credit inancial institutions and its trends. Key words: support, guarantee, preferential credits, assignation, agriculture. JEL code Q14
Introduction Agriculture, which creates gross value added (GVA)
and new jobs, substantially contributes to the state’s economy (it amounts to 3-6% in the GVA structure). Agriculture is important not only from the economic but also from social, etno-cultural, and environmental point of view. During the economic crisis, industrial and construction sectors have declined, however, farmers have not felt such severe recession. According to the data provided by the European Restructuring Monitor, in the years of economic crisis, bankruptcies were mostly occurring in the sectors of construction, textile, wholesale and retail, wooden products manufacture, processing industry, hotels and restaurants, and motor industry
(Coughtrie, D., Morley, J., Ward, T., 2009). Most researchers (Good, D., Irwin, S., 2008; Shane, M., Liefert, W., 2009; Chavarria, H., 2010; Ikhsan, M., 2010) agree that the world economic crisis in 2008-2009 has affected agriculture less than other sectors of economy, yet, it was impossible to avoid any negative impacts (Krisciukaitiene, I., Namiotko, V., Jedik, A., 2011). Value added created by agriculture, hunting and ishing activities during the recession was growing (in 2009 it has increased by 1.43 percent comparing with 2008). Meanwhile the Gross Domestic Product (GDP) of Lithuania has declined remarkably (in 2009, Lithuania’s GDP has decreased by 14.7% comparing
with 2008). Lithuanian inancial analysts (Rudzkis, R., Rojaka, J.,
Genyte, I., 2010) exploring the impact of economic crisis on agricultural sector, indicate the following factors contributing to the leadership of agricultural sector:
1) agriculture is speciied by much bigger resistance to the crisis compared with most other economic activities, as food products are basic commodities; 2) agricultural sector is generously funded from the EU and national
budgets; 3) the amount of grants has substantially grown recently; 4) weather conditions were favourable for agriculture; 5) in recent years, amount of occupations were declining in most economy sectors and it has inluenced the increase of occupations in agricultural sector.
Besides, the environment of Lithuanian agriculture and food industries was positively inluenced by natural disasters in the neighbouring markets caused by climate changes: large drought in Russia that destroyed the yield
of grain and spring loods in Poland that caused much damage to gardening and farming. These losses have caused the decline of agricultural products supply in the
region and a substantial growth of prices that ensured more income for Lithuanian farmers (Lietuvos zemes ir ..., 2011). After evaluating the strive and wish of agricultural business entities to become inancially autonomous and stay competitive, various agriculture funding programmes are presented to Lithuanian agricultural business subjects whose purpose is to provide more inancial freedom and options while planning daily activities and development of agriculture. Even during the recession, favourable conditions of making the investments were ensured for agricultural sector.
The object of the research is the measures of agricultural funding.
The aim of the research is to evaluate the opportunities and demand of Lithuanian agricultural funding.
The aim is implied by the following tasks: 1) to determine the trends of direct assignations to agriculture; 2) to evaluate the absorption of the EU support for Rural Development Programme; 3) to explore the changes of preferential credits and credits with guarantee granted for agriculture; and 4) to evaluate the share of credits issued for
agricultural and forestry entities by crediting inancial

Economic Science for Rural Development Nr. 28., 2012
ISSN 1691-3078
146
institutions in the portfolio of all credits issued, and
its trends.Research methods: analysis of foreign and Lithuanian
authors’ scientiic literature and legal documents, comparison of information, systematisation, detalisation and conclusion methods, and analysis of statistical data. The research period: years 2004-2010.
Research results and discussionIn recent years, Lithuanian farmers were increasingly
using the services of crediting institutions. Credits granted to farmers were constantly growing in 2005-2006 and have stayed stable high during the
economy deceleration in 2007-2008. It was mostly inluenced by the implementation of the common EU and Lithuanian inancial support measures for agriculture. While using these support measures, agricultural subjects implementing investment projects shall borrow from inancial institutions because the support is paid during a speciic period after the project implementation – after implementing the investments planned.
Scientiic researchers have shown that in agriculture of the EU Member States the biggest share of capital was funded through credits, and thus, the biggest inancial risk was taken in agricultural sectors in Denmark (54.6%), France (37.2%), the Netherlands (35.6%), and Sweden (31.3%). The lowest share of capital was funded through credits, and thus, the least inancial risk was taken in agricultural sectors in Greece (0.4%), Italy (1.2%), Slovenia (2.0%), Ireland (2.2%), and Spain
with Cyprus (both amounted 2.4%). The average share of credit-funded capital in the EU agriculture was 14.7%. Lithuanian agriculture was similar to the EU agriculture average, meanwhile Latvia’s agriculture funded 28.2% of its capital through credits, and Estonian agriculture – 26.4% (Alekneviciene, V., Alekneviciute, E., 2010).
In Lithuanian agricultural entities, depending on their size, 1.7 – 30.6% on average of owned capital was funded by credits. The inancial risk grows with the increase of total area of land (Alekneviciene, V., Alekneviciute, E., Martirosianiene, L., 2011).
In Lithuania, like in other EU countries, agricultural entities are being funded through direct assignations that
support farmers’ incomes and promote the development of agriculture. During 1994-2004, the forms and amounts of state’s direct and indirect support were constantly changing (Rimkuviene, D., 2004). Direct assignations to farmers are being provided from 2000 with the implementation of legal acts of Minister for Agriculture of the Republic of Lithuania (Lepeskiene, G., Jaskelevicius, K., Narutaviciute, J., 2004). Direct assignations are annual assignations provided to support
the income of agricultural entities and to increase the competitiveness of Lithuanian agricultural products (Tiesiogines ismokos ..., 2009). In the Republics of Lithuania, the Law on Agriculture, Food Industry and Rural Development (Lietuvos Respublikos ..., 2008) describes direct assignation as inancial support provided to agricultural subject in order to support its income level. In the strategy of agriculture and rural development (Del zemes ukio ..., 2000) the support of agricultural products manufacturers’ income level with direct assignations is indicated as a measure of increasing occupation and improvement of social status. Many scientists (Jazepcikas, D., Uosyte, R., 2004; Spriggs, J., Nelson, T., 1997; Vercammen, J., 2007) state that the main goal of direct assignations is to support the income of agricultural entities and they analyse the inluence of increasing the state’s support for agricultural subjects for stabilisation of income.
According to the declared areas of farming lands and crops, direct assignations are provided to Lithuanian farmers according to the scheme of one-time assignation for a particular area, according to which the EU direct
Source: authors’ construction based on the data of National Paying Agency, Ministry of Agriculture
Fig. 1. Direct assignations to Lithuanian agriculture in 2004 – 2010, million LTL
V. Alekneviciene, L. Martirosianiene Agriculture Funding Measures in Lithuania: Demand and Opportunities

147
Economic Science for Rural Development Nr. 28., 2012
ISSN 1691-3078
assignations are paid for the declared area of farming land and crops, irrespective of the type of production. Besides these assignations, additionally farmers receive national direct assignations from the national budget of Lithuania for declared crop areas, cattle, and milk
(Figure 1).In 2010, totally LTL 1.2 billion were paid in support
form of direct assignations from the EU and Lithuanian budgets, i.e. 4.3% more than in 2009. As illustrated in Figure 1, the share of support provided from national budget decreases with the growing share of the EU support (this is regulated by the Council Regulation (EC) No. 73/2009 of 19 January 2009).
In 2004, when Lithuania became an EU Member State, the funding of agriculture has grown
substantially – new direct and investment support measures were implemented, national support measures were reformed. Lithuanian Rural Development Programme (RDP) for 2007-2013 was conirmed in
2007 after the Single Programming Document (SPD) for the period of 2004-2006.
Large inancial support for agricultural sector was inluenced by the speciics of this sector and by its importance as a primary chain of food production. The support of investment projects is one of the most promising measures to increase the effectiveness of agriculture (Rimkuviene, D., 2004). The investments of agricultural entities to agricultural production in Lithuania are strongly promoted and they have become important funding source of long-term investments made by agricultural companies and farmers (Alekneviciene, V., Jatkunaite, D., 2006).
The amount of the EU support for rural development during 2007-2013 amounts LTL 6096 million, co-funding from the national budget of Lithuania is LTL 1799 million. Total support for agriculture from the EU funds amounts to LTL 7896 million. This Programme is very important to Lithuanian agriculture because of its inancial weight and the complexity of problems solved using inancial interventions (Table 1).
From the beginning of Programme implementation to the end of 2010, totally 520 thousand applications were received in which the requested amount of support was LTL 5350 million (of which LTL 3948 million – the EU support or 64.8% of the total amount of the EU support during the whole period of the Programme). From the beginning of the Programme to the end of 2010, LTL 2732 million were paid (of which LTL 2283 million are the EU funds, i.e. 37.4% of the total funds dedicated
to the Programme by the EU). Several years ago, commercial banks in Lithuania
did not trust the farmers. There was an opinion that agriculture is the most risky sector of economy, thus, it is not worth attention. However, the statistical data reveal that the amount of credits issued to Lithuanian agriculture grows rapidly. It is also inluenced by the preferential credits. The banks began competing for the clients-farmers since agriculture, as mentioned before, has least suffered from the economic crisis.
With the beginning of the inancial crisis, most Lithuanian farmers found themselves at the crossroads: although it was possible to receive investment support from the EU, it became too hard to receive credit and
contribute to a project because of growing interest rates. However, in autumn of 2009, a new opportunity was presented to Lithuanian farmers seeking to receive credits. Lithuania was the irst EU Member State that established Credit Fund, which was meant to provide cheaper credits.
While analysing the opportunity to modernise Lithuanian farms, the Ministry of Agriculture of Lithuania together with the Rural Credit Guarantee Fund presented the project of agricultural funding
on favourable terms, i.e. favourable conditions were created for agricultural subjects willing to invest through inancial intermediaries, credit institutions, which grant preferential credits for investment projects. The purpose of this inancial engineering measure is to create more favourable funding opportunities for agricultural sector and to absorb RDP funds more rapidly and effectively. From the autumn of 2009 preferential credits are granted only for implementation of the investment projects and not for the increase of working
capital. Totally LTL 450 million are planned to be allocated to
the Credit Fund, from which 75% is constituted from the European agricultural funds for rural development and 25% from the funds of the national budget. Four stages of fund allocations to the Credit Fund are planned in the funding contract of this inancial engineering measure. Preferential credit for farmers and agricultural companies are provided through 8 state‘s commercial banks and
8 credit unions selected by the Credit Fund (Zemes ukio paskolu ..., 2009).
In 2010, inancial intermediaries have signed
346 contracts regarding the preferential credits
with the credit recipients, amounting to
LTL 96.5 million. During the three stages of Credit Fund activities LTL 227 million were allocated for credit institutions for preferential credits, leading to signing of 356 contracts for LTL 100 million. In 2010, more than
one half (54%) of projects under implementation, that received preferential credit terms, were being implemented in the ield of plant-growing – the majority was constituted by farms developing the sector of planting crop cultures and rapes. About 28% of the projects were projects related to modernisation of cattle farms and 16% of preferential credits were granted to economy subjects that provide services to agricultural sector (Zemes ukio paskolu ..., 2010).
In most cases, Lithuanian farmers and small rural entrepreneurs willing to begin or develop their business do not have the necessary funds of their own, and the credits are very often unavailable due to the deposit
shortage. Therefore, already in 1997, the Government of Lithuania decided to establish a Rural Credit Guarantee Fund, which function is to provide guarantees for credits granted for investment purposes or for purchasing short-term capital as well as to provide guarantees for the credit lines. The Rural Credit Guarantee Fund issues guarantees to the banks for the credits granted
to farmers, rural entrepreneurs, and processors of agricultural products for investment, short-term assets purchasing, goods, services, raw materials, and other agricultural produce buying purposes. The Fund guarantees to compensate the bank up to 70% (or up to 80% for credits granted to young farmers and
V. Alekneviciene, L. Martirosianiene Agriculture Funding Measures in Lithuania: Demand and Opportunities

Economic Science for Rural Development Nr. 28., 2012
ISSN 1691-3078
148
Table 1
The EU support for rural development in Lithuania in 2007-2010
2007 2008 2009 2010 Total
Applications collected pcs. 114355 134072 136687 135245 520359
Requested amount of support, million LTL 542.72 1272.22 1387.88 2147.59 5350.40
Paid amount of support, million LTL 95.47 302.96 1195.94 1137.26 2731.62
Source: authors’ calculations based on the data of National Paying Agency, Ministry of Agriculture
0
50
100
150
200
250
2004 2005 2006 2007 2008 2009 2010
92.5
180.4
238.5 247.2 246.8
80.4
150.8
57.5
106.4
143.9 142.5 145.3
49.3
92.7
Credits granted Guarantees provided
Source: authors’ construction based on the data of Rural Credits Guarantee Fund
Fig. 2. Granted credits and provided guarantees for Lithuanian agricultural entities in 2004 – 2010, million LTL
Source: authors’ construction based on the data of Rural Credits Guarantee Fund
Fig. 3. Credits granted and guarantees issued to Lithuanian agricultural entities from various credit institutions in 2004 – 2010, million LTL
V. Alekneviciene, L. Martirosianiene Agriculture Funding Measures in Lithuania: Demand and Opportunities
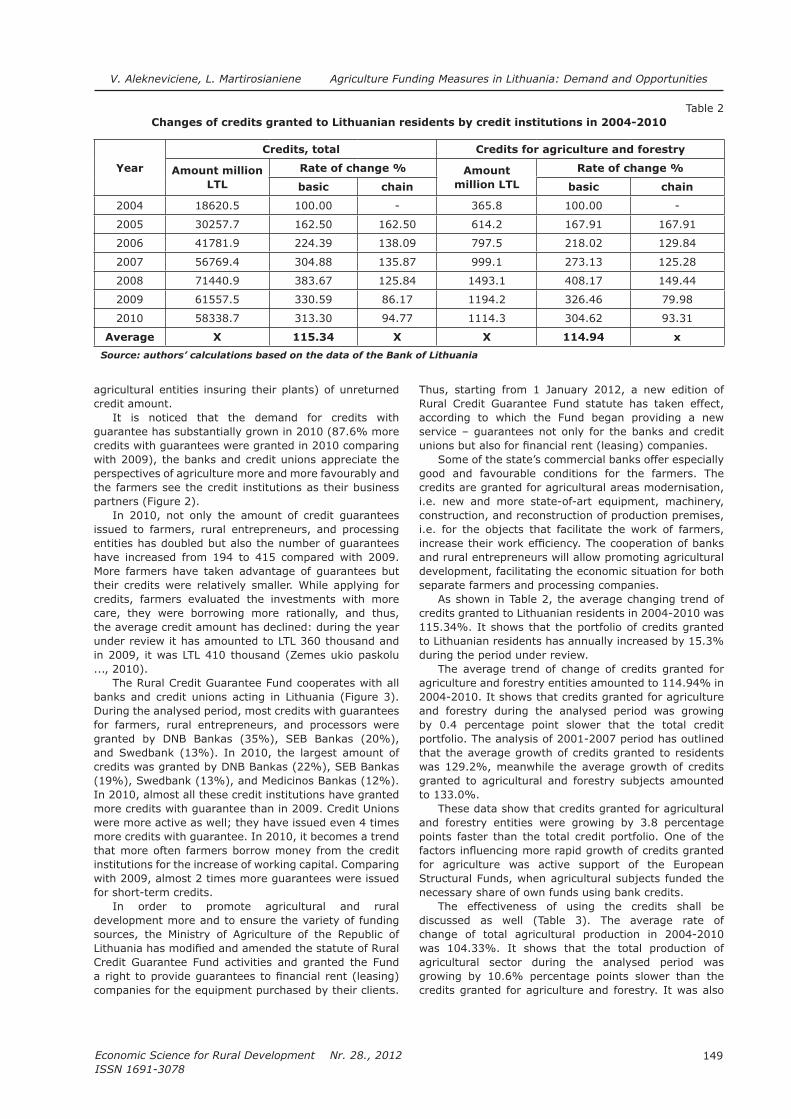
149
Economic Science for Rural Development Nr. 28., 2012
ISSN 1691-3078
agricultural entities insuring their plants) of unreturned
credit amount.It is noticed that the demand for credits with
guarantee has substantially grown in 2010 (87.6% more credits with guarantees were granted in 2010 comparing with 2009), the banks and credit unions appreciate the perspectives of agriculture more and more favourably and the farmers see the credit institutions as their business partners (Figure 2).
In 2010, not only the amount of credit guarantees issued to farmers, rural entrepreneurs, and processing entities has doubled but also the number of guarantees have increased from 194 to 415 compared with 2009. More farmers have taken advantage of guarantees but their credits were relatively smaller. While applying for credits, farmers evaluated the investments with more care, they were borrowing more rationally, and thus, the average credit amount has declined: during the year under review it has amounted to LTL 360 thousand and in 2009, it was LTL 410 thousand (Zemes ukio paskolu ..., 2010).
The Rural Credit Guarantee Fund cooperates with all banks and credit unions acting in Lithuania (Figure 3). During the analysed period, most credits with guarantees for farmers, rural entrepreneurs, and processors were granted by DNB Bankas (35%), SEB Bankas (20%), and Swedbank (13%). In 2010, the largest amount of credits was granted by DNB Bankas (22%), SEB Bankas (19%), Swedbank (13%), and Medicinos Bankas (12%). In 2010, almost all these credit institutions have granted more credits with guarantee than in 2009. Credit Unions were more active as well; they have issued even 4 times more credits with guarantee. In 2010, it becomes a trend that more often farmers borrow money from the credit institutions for the increase of working capital. Comparing with 2009, almost 2 times more guarantees were issued for short-term credits.
In order to promote agricultural and rural development more and to ensure the variety of funding sources, the Ministry of Agriculture of the Republic of Lithuania has modiied and amended the statute of Rural Credit Guarantee Fund activities and granted the Fund a right to provide guarantees to inancial rent (leasing) companies for the equipment purchased by their clients.
Thus, starting from 1 January 2012, a new edition of Rural Credit Guarantee Fund statute has taken effect, according to which the Fund began providing a new service – guarantees not only for the banks and credit
unions but also for inancial rent (leasing) companies. Some of the state’s commercial banks offer especially
good and favourable conditions for the farmers. The credits are granted for agricultural areas modernisation, i.e. new and more state-of-art equipment, machinery, construction, and reconstruction of production premises, i.e. for the objects that facilitate the work of farmers, increase their work eficiency. The cooperation of banks and rural entrepreneurs will allow promoting agricultural development, facilitating the economic situation for both separate farmers and processing companies.
As shown in Table 2, the average changing trend of credits granted to Lithuanian residents in 2004-2010 was 115.34%. It shows that the portfolio of credits granted to Lithuanian residents has annually increased by 15.3% during the period under review.
The average trend of change of credits granted for
agriculture and forestry entities amounted to 114.94% in 2004-2010. It shows that credits granted for agriculture and forestry during the analysed period was growing by 0.4 percentage point slower that the total credit portfolio. The analysis of 2001-2007 period has outlined that the average growth of credits granted to residents was 129.2%, meanwhile the average growth of credits granted to agricultural and forestry subjects amounted to 133.0%.
These data show that credits granted for agricultural and forestry entities were growing by 3.8 percentage points faster than the total credit portfolio. One of the factors inluencing more rapid growth of credits granted for agriculture was active support of the European Structural Funds, when agricultural subjects funded the necessary share of own funds using bank credits.
The effectiveness of using the credits shall be
discussed as well (Table 3). The average rate of change of total agricultural production in 2004-2010
was 104.33%. It shows that the total production of agricultural sector during the analysed period was growing by 10.6% percentage points slower than the credits granted for agriculture and forestry. It was also
Table 2
Changes of credits granted to Lithuanian residents by credit institutions in 2004-2010
Year
Credits, total Credits for agriculture and forestry
Amount million LTL
Rate of change % Amount million LTL
Rate of change %
basic chain basic chain
2004 18620.5 100.00 - 365.8 100.00 -
2005 30257.7 162.50 162.50 614.2 167.91 167.91
2006 41781.9 224.39 138.09 797.5 218.02 129.84
2007 56769.4 304.88 135.87 999.1 273.13 125.28
2008 71440.9 383.67 125.84 1493.1 408.17 149.44
2009 61557.5 330.59 86.17 1194.2 326.46 79.98
2010 58338.7 313.30 94.77 1114.3 304.62 93.31
Average X 115.34 X X 114.94 x
Source: authors’ calculations based on the data of the Bank of Lithuania
V. Alekneviciene, L. Martirosianiene Agriculture Funding Measures in Lithuania: Demand and Opportunities

Economic Science for Rural Development Nr. 28., 2012
ISSN 1691-3078
150
stated that in 2008-2009 the majority (approx. 21%) of borrowed funds was attributed for one LTL of total agricultural production.
Lithuanian inancial analysts forecast stable growth of agricultural demand, thus, they promise good mid-term and long-term opportunities. It is inluenced by growing world population, growing food consumption in China and India caused by growing residents’ incomes and the development of biological fuel due to rising prices of electrical energy. These processes will increase the favourability of investing into Lithuanian agricultural sector. In Lithuania and Latvia, which comprise the “lion“ part of Lithuanian origin food products sales, purchasing power of the residents began declining and the population started declining too. That is the reason why already today much attention should be paid to increase and modernise the effectiveness of agriculture sector (Rudzkis, R., Rojaka, J., Genyte, I., 2010).
Conclusions 1. Agricultural subjects are supported by direct
assignations, which support farmers’ income and promote agricultural development. In 2010, totally LTL 1.2 billion were paid from the EU and Lithuanian budgets in form of direct assignations, which is 4.3% more than in 2009.
2. The amount of the EU support for rural development in 2007-2013 is LTL 6096 million, co-funding from the national budget of Lithuania amounts to
LTL 1799 million. In total, the EU grants LTL 7896 million for agricultural sector. From the beginning of Programme implementation to 2010, totally LTL 2732 million have already been allocated (of which LTL 2283 million are the EU funds, i.e. 37.4% of all the EU funds dedicated to this Programme).
3. In autumn of 2009, new opportunities of receiving credits for Lithuanian farmers were presented – Lithuania was the irst of the EU Member States to establish the new Credit Fund. During the three stages of Credit Fund activity, LTL 227 million were allocated to credit institutions for preferential
credits, which result in signing 356 contracts for total of LTL 100 million.
4. It was concluded that the demand of credits with guarantee has substantially grown in 2010 (87.6% more credits with guarantee were granted compared with 2009), banks and credit unions appreciate the perspectives of agriculture more and more favourably, and farmers see the credit institutions as their business partners.
5. The average changing rate of credits granted to
Lithuanian residents in 2004-2010 was 115.34%. The average changing rate of credits granted to
agriculture and forestry in 2004-2010 was 114.94%. This shows that credits granted to agriculture and forestry during the period under review were growing by 0.4% percentage points slower compared with the total credit portfolio.
6. The average changing rate of total agricultural
production in 2004-2010 was 104.33%. This shows that total agricultural production during the analysed
period was growing by 10.6% percentage points slower than credits granted to agriculture and forestry. In addition, it was concluded that in 2008-2009 the biggest share of borrowed funds (approx. 21%) was attributed to one litas of total agricultural production.
Bibliography1. Alekneviciene, V., Alekneviciute, E. (2010). Ukiu
inansiniu rodikliu lyginamoji analize Europos Sajungos salyse (Comparative Analysis of Agricultural Financial Indicators of EU Member States). Apskaitos ir inansu mokslas ir studijos: problemos ir perspektyvos: septintosios tarptautines mokslines konferencijos straipsniu rinkinys. Kaunas: Akademija. ISSN 2029-1175. Nr. 1(7). pp. 13–19.
2. Alekneviciene, V., Alekneviciute, E., Martirosianiene, L. (2011). Financial Management in Lithuanian Farms: Comparative Analysis According to Farm Size and Types of Farming. Rural Development 2011: the Fifth International Scientiic Conference. Kaunas: Akademija. ISSN 1822-3230. Volume 5. pp. 7 – 14.
Table 3
Rates of changes of total agricultural production and ratio of credits granted for agriculture and forestry, and total agriculture production in Lithuania in 2004-2010
YearTotal agricultural
production, million LTL
Rate of change % Ratio of credits granted for agriculture and forestry and total
agricultural productionbasic chain
2004 4552.3 100.00 - 8.04
2005 5117.3 112.41 112.41 12.00
2006 4913.0 107.92 96.01 16.23
2007 6912.2 151.84 140.69 14.45
2008 7340.0 161.24 106.19 20.34
2009 5707.0 125.37 77.75 20.93
2010 6388.2 140.33 111.94 17.44
Average 5847.1 104.33 x 16.07
Source: authors’ calculations based on the data of the Bank of Lithuania, the Department of Statistics
V. Alekneviciene, L. Martirosianiene Agriculture Funding Measures in Lithuania: Demand and Opportunities

151
Economic Science for Rural Development Nr. 28., 2012
ISSN 1691-3078
3. Alekneviciene V., Jatkunaite D. (2006). Estimation of Cost of Own Capital: Methods and their Application in the Companies of Agricultural Sector. Economic Science for Rural Development: Proceedings of the International Scientiic Conference. Volume 11, Finance and credit diversiication: Jelgava. ISBN 9984784061. pp. 42-48.
4. Chavarria, H. (2010). Global Economic Crisis and Agricultural Trade: Winners and Losers in the Americas at the Close of 2008. Inter – American Institute for Cooperation and Agriculture / COMUNIICA. January–July 2010. pp. 12 – 30.
5. Coughtrie, D., Morley, J., Ward, T. (2009). Restructuring in Bankruptcy: Recent National Case Examples. European Foundation for the Improvement of Living and Working Conditions. Retrieved: http://
www.eurofound.europa.eu/. Access: 22 December 2011.
6. Del zemes ukio ir kaimo pletros strategijos patvirtinimo (Regarding the Conirmation of the Strategy of Agriculture and Rural Development). (2000). Retrieved: http://www3.lrs.lt/pls/inter3/dokpaieska. Access: 22 December 2011.
7. Good, D., Irwin, S. (2008). Implications of Credit Market Problems for Crop Prices. Department of Agricultural and consumer Economics / University of Illinois at Urbana: Champaign. IFEU 08–03. Retrieved: http://www.farmdoc.illinois.edu/ifeu/. Access: 28 December 2011.
8. Ikhsan, M. (2010). Economic Crisis and its Impact to Agriculture. Paper presented for Conference on Fostering Growth and Reducing Poverty and Hunger in Asia and Latin America: Opportunities for Mutual Learning. March 22–24. Lima, Peru. Retrieved: http://ifprilima09.iles.wordpress.com. Access: 27 December 2011.
9. Jazepcikas D., Uosyte R. (2004). Finansines paramos instrumentai (Financial Support Instruments). Lietuvos zemes ukis ir kaimo pletra. Vilnius, pp. 15 -23.
10. Krisciukaitiene, I., Namiotko, V., Jedik, A. (2011). Pasaulines ekonomines krizes itakos zemes ukio sektoriui ES salyse vertinimas 2008–2009 m. (Evaluation of Effects Caused by World Economy Crisis to the Agricultural Sector in EU Member States in 2008-2009). Management Theory and Studies for Rural Business and Infrastructure
Development. 2011. No. 5 (29). Research papers. ISSN 1822-6760. pp. 105-115.
11. Lepeskiene G., Jaskelevicius K., Narutaviciute J. (2004). Finansine parama zemes ukiui (Financial Support for Agriculture). Lietuvos zemes ukis. pp. 35-45.
12. Lietuvos Respublikos Zemes ukio, maisto ukio ir kaimo pletros istatymas (Law on Agriculture, Food Production and Rural Development) (2008). Retrieved: http://www3.lrs.lt/pls/inter3/dokpaieska. Access: 28 December 2011.
13. Lietuvos zemes ir maisto ukis 2010 (Lithuanian Agricultural and Food Production Sector in 2010). (2011). Vilnius: Lietuvos agrarines ekonomikos institutas. Retrieved: http://www.laei.lt/index.php?mt. Access: 11 January 2012.
14. Rimkuviene D. (2004). The Use of Data Envelopment Analysis for Selection of Investment Objects. Ekonomika. – Vilnius, T. 66. pp. 31-42.
15. Rudzkis, R., Rojaka, J., Genyte, I. (2010). Lietuvos ekonomikos perspektyvos 2010 (Perspectives of Lithuanian Economy in 2010). AB DnB NORD banko apzvalga. Retrieved: http://www.dnbnord.lt/iles/Apzvalgos/. Access: 11 January 2012.
16. Shane, M., Liefert, W., Morehart, M., Peters, M., Dillard, J., Torgerson, D., Edmondson, W. (2009). The 2008/2009 World Economic Crisis: What It Means for US Agriculture. Economic Research Service: USDA. Retrieved: http://www.ers.usda.gov/publications/ Access: 29 December 2011.
17. Spriggs, J., Nelson T. (1997). Effects of Enhancing NISA on Income Stabilisation and Support. Canadian journal of agricultural economics, Volume. 45. pp. 123-129.
18. Tiesiogines ismokos ir joms skiriamos lesos (Direct Assignations and Its Allocated Funds). (2009). Retrieved: http://www.zum.lt/lt/ Access:
11 January 2012.19. Vercammen, J. (2007). Farm Bankruptcy Risk
as a Link between Direct Payments Agricultural Investment. European Review of Agricultural Economics, Volume 34(4). pp. 479-500.
20. Zemes ukio paskolu garantijos fondas (Rural Credit Guarantee Fund ) (2009, 2010). 2009, 2010 m. Zemes ukio paskolu garantiju fondo veiklos ataskaita. Retrieved: http://www.garfondas.lt/uploads/documents/. Access: 13 January 2012.
V. Alekneviciene, L. Martirosianiene Agriculture Funding Measures in Lithuania: Demand and Opportunities

Economic Science for Rural Development Nr. 28., 2012
ISSN 1691-3078
152
Value Drivers of Multifunctional and Sustainable Agricultural Organisation: Cash Flow Discounting Approach
Vilija Alekneviciene1, professor, Dr. oec.Neringa Stonciuviene, professor, Dr. oec. Danute Zinkeviciene, professor, Dr. oec.
Aleksandras Stulginskis University, Lithuania
Abstract. Valuation of any business organisation is important for the owners, creditors, state, and other stakeholders in order to assess it as a working economic entity for sale, exchange, mortgage, supporting, and other purposes. Under the principle of market eficiency, business organisation should be sold, exchanged, mortgaged at a fair value. The measurement of the fair value of agricultural organisation using cash low discounting approach is problematic due to the different nature of cash lows and discount rates. The present agricultural organisation generates free cash lows not only from agricultural production and services but also through the multifunctionality of agriculture, the provision of public goods and ensuring the sustainability of economic development. The authors of the paper present the model of value drivers of multifunctional and sustainable agricultural organisation. They reason that free cash lows from agricultural production and services, and subsidies and grants for increasing farms’ eficiency and for business diversiication in rural areas should be discounted at a weighted average cost of capital. Beneit and costs in providing public good should be discounted at a social discount rate.Key words: valuation, value drivers, multifunctional and sustainable agricultural organisation, cash low, discounting.JEL code G32
IntroductionIn terms of cash low discounting, the value of any
business organisation depends on free cash lows (FCF) and discount rate. Agricultural organisations (farms and agricultural companies) have speciics for such an industry assets (biological) and speciic income (grants and subsidies). Due to the high business risk, agricultural sector is supported, and the value of agricultural business organisation is highly dependent on the future inancial support. Calculation of weighted average cost of capital (WACC), at which free cash lows should be discounted, is still quite problematic. Earlier pieces of research were mainly directed towards the methods used for estimation of the cost of equity capital in joint-stock companies. Farms are private organisations and agricultural companies are similar to closed joint-stock companies, so the use of traditional methods for estimation of the cost of equity capital is limited and the appropriate value drivers have to be identiied.
Farms and agricultural companies create not only economic but also social value added. Recently, more attention is paid to the environment, ecology, and public goods. When evaluating the organisation, which creates both economic and social value added, a paradigm of adjustment of the market-based and social discount rates appears. These reasons lead to the research novelty and relevance.
The object of the research is value drivers of
agricultural organisation. The research is based on previous research results. The most important are presented by Fernandez, 2007; Hill and Zeller, 2008; Kazlauskiene and Christauskas, 2008; McConaughy, 2009; McVittie, Moran and Thompson, 2009; Price, 2010; and Vaznonis and Vaznonis, 2011.
The aim of the research is to make the model of value drivers of multifunctional and sustainable agricultural organisation by using cash low discounting approach. The aim is implied by the following tasks: 1) to analyse and summarise the value drivers of conventional agricultural organisation; 2) to analyse and summarise the value drivers of multifunctional and sustainable agricultural organisation; and 3) to make the model of value drivers of multifunctional and sustainable agricultural organisation.
The methods of the research: analysis and synthesis of scientiic literature, comparison method, decomposition and modelling methods.
Research results and discussion1. Value drivers of conventional agricultural
organisationHow can one measure the fair value of agricultural
organisation? To answer such a question, one has to know the right value drivers. A lot of research is done in the ield of irm or company valuation but very poor in valuation of farms or agricultural companies.
Fernandez (2007) raises an issue about discounted
cash lows valuation methods providing always the same value. The researcher has summarised compendium of ten methods: free cash low, equity cash low, capital cash low, adjusted present value, business risk adjusted free cash low and equity cash low, risk-free rate-adjusted free cash low and equity cash low, economic proit, and economic value added. The main conclusion is that all the ten methods give the same value. He stated that the disagreements among the various theories of irm valuation arose from the calculation of the value of tax shields.
___________________________1 E-mail address: [email protected]
V. Alekneviciene et al. Value Drivers of Multifunctional and Sustainable Agricultural Organisation: Cash Flow Discounting Approach
153
Economic Science for Rural Development Nr. 28., 2012
ISSN 1691-3078
Magni, Malagoli and Mastroleo (2006) propose a different method of irm valuation based on fuzzy logic and expert systems. They represent a conceptual transposition of discounted cash lows techniques but the novelty is based on the explicit account of quantitative and qualitative variables and their mutual integration. They focus on 29 value drivers that are combined together via “if-then” rules. The output of the system is the real number in the interval [0, 1], which represents the value creation power of the irm. Zivelova (2004) points three factors, which inluence the value of a irm: operational results of a irm, structure of stock capital, and costs associated with capital acquisition.
Kazlauskiene and Christauskas (2008) point that value drivers shall be based on a systematic approach to business value. Primary (irst level) value drivers are FCF and cost of capital (Fernandez, 2007; Hill and Zeller, 2008). Hill and Zeller (2008) as important factors indicate the value of cash low growth rate and the relationship between return on capital employed (ROCE) and WACC. FCF depend on such drivers as NOPAT (the difference between earnings before interests and taxes (EBIT) and paid income tax), depreciation and amortisation of ixed assets, capital investment and investments in additional working capital. Kazlauskiene and Christauskas (2008) decompose business value drivers into ive levels.
Prices of outputs are one of the main factors inluencing NOPAT. When speaking about agricultural organisations (farms and companies), it depends on the characteristics of production, which result in the speciic industry, for example, in animal husbandry – animal genetics and reproduction, feeding and feed production, animal housing and milking conditions (Galsanova, 2007); in crop production – fertilisers, pesticides, plant genetics and so on. Volume of production is determined by the aforementioned factors and factors of production such as soil type and quality, climatic–weather conditions, seasonality of production, crop rotation, and diseases and pests (Tozer, 2009). One factor which increases an income of agricultural organisation, is the production subsidies (Sapolaite, 2011). Farm income support and production support are implemented through the market intervention mechanisms, the payments associated with the production volume or land area, direct income support (Vaznonis and Vaznonis, 2011). The reserve of revenue growth and cost reduction is specialisation and concentration of production, also consolidation of farms (Galsanova, 2007; Sapolaite, 2011).
Another irst-level value driver is the cost of capital. Francis, and Oswald (2000), Plenborg (2002) in order to set WACC, offer a number of assumptions, one of which is to use the target capital structure instead of debt-equity ratio in the balance sheet.
Typical family-controlled business owners do not diversify their investments, as investors in joint-stock companies. For that reason, they assume all risks, not only systematic. So, in terms of capital market theory, cost of equity capital for private business owners must be greater than investing in publicly traded companies (McConaughy, 2009). Thus, private irms have a lower value in the market than joint-stock companies. Das, Jagannathan and Sorin (2003), Bajaj, Denis, Ferris and Sarin (2001) specify lower liquidity of private irms as
the main reason of lower value but do not associate this phenomenon with the expected return and the level of diversiication. Koeplin, Sarin and Shapiro (2000) founded that such indicators as sales revenue and EBIT were 20-30 percent smaller in private irms. These indicators are directly related to business value. Business-evaluators have several approaches concerning the discount
rate in valuation of private irms. Each approach has its limitations and because it is not a perfect analogy, requires a number of speciic assumptions.
The proposed model for estimating the cost of equity capital for private irms is based on capital market theory (Mishra and McConaughy, 1999). McConaughy (2009) suggested the speciic capital market benchmark measure, Sharpe ratio, estimating cost of equity capital in the closed joint-stock company. Both, the capital asset pricing model (CAPM) and Fama and French (1992) multi-factor model, measure only the systematic risk, and are suitable for liquid markets and investors who make well-diversiied investments. When estimating cost of equity capital, standard deviation, measuring total risk should be used instead of using systematic risk’s beta coeficient. The main value drivers are the following factors: risk-free interest rate, return and standard deviation of return of market portfolio, and return and standard deviation of return of closed joint-stock company.
2. Value drivers of multifunctional and
sustainable agricultural organisationMultifunctional and sustainable agricultural
organisation differs from conventional through ensuring the sustainable development and provision of public goods.
Sydorovych and Wossink (2008), Ueda, Takenaka, Vaneza and Monostori (2009) point out the agricultural components of sustainability: economic, internal social, external social, and environmental. Environmentally friendly behaviour is necessary to ensure a harmonious society but it is usually not proitable. Ecological aspect of sustainability is deined as the ability to maintain ecosystem processes and functions necessary to ensure biological diversity and do not impoverish it. On the contrary, any economic development is sustainable, if not destroying or impairing necessary conditions for the humanity. Sustainable value should be created through the dynamic interaction between social, natural and artiicial systems (Ueda, Takenaka, Vaneza and Monostori, 2009).
Organic farming is recognised as an expression of sustainable agriculture and its potential is signiicant for the issues of agricultural products competitiveness, rural employment and additional income, and works together as a preventive environmental measure (Alroe and Kristensen, 2004; Kerselaers, Cock, Lauwers and Huylenbroeck, 2007). Skulskis (2010) argues that organic farming is recognised as successfully implementing the principles of sustainable development in agriculture: it preserves the existing natural resources, reducing the impact of agriculture caused by environmental pollution, and meets consumer demand for healthy, safe and quality food products. Direct investment support is a factor of organic farming (Skulskis, 2010) and at the same is a value driver of agricultural organisation.
V. Alekneviciene et al. Value Drivers of Multifunctional and Sustainable Agricultural Organisation: Cash Flow Discounting Approach

Economic Science for Rural Development Nr. 28., 2012
ISSN 1691-3078
154
Households with greater economic potential are not oriented to organic farming. Therefore, organic farming is supported by the government (Kerselaers, Cock, Lauwers and Huylenbroeck, 2007). Ueda, Takenaka, Vaneza and Monostori (2009) argue that producers face a much lower cost producing conventional products in comparison with producing environmentally friendly products.
Bioenergy produced by agriculture has advantages over conventional energy both in environmental and socio-economic aspects (Kniuksta and Caplikas, 2011). Bioenergy production provides environmental beneits, emitting less CO
2, sustainable energy production, and
creates the economic potential of rural areas. The production of biofuels from agricultural waste reduces pollution and provides economic beneits. Wind can be one of the clean renewable energies, and wind power creates environmental value because of emission reduction (Hongze, Sen and Bao, 2011).
Aforementioned examples show one of the main functions of agricultural organisation – ensuring the
sustainability. Investments directed towards sustainable agriculture are strongly supported by the government. Subsidies and investment support is a value driver of agricultural organisation. In most cases, it is rendered through PPP (Public Private Partnership) for which the discount rate applied by a government throughout the contract period (Guide to Cost-Beneit Analysis of Investment Projects, 2008).
The value of agricultural organisation is also
created by cash lows from the provision of public goods. Public goods are important for the following reasons (Krieger, 2004, Banzhaf, 2010): 1) environmental (groundwater protection, wildlife protection, conservation of natural areas); 2) agrarian (providing local food, preserving farming as a way of life); 3) aesthetic (preserving rural identity, preserving scenic quality); 4) antigrowth, slowing development; and 5) recreation (providing public access).
McVittie, Moran and Thompson (2009) provide a typology of public goods: agricultural landscapes –
cultural; agricultural landscapes – ecological; farmland biodiversity; climate - GHG emissions mitigation; reduced risk of looding; reduced risk of ire; high functionality soils; water quality; water availability; high quality air; food security; animal welfare; and
animal health.The provision of public goods is important to
assess the beneits received by the farm. The beneits can be obtained through the grants and through the
implementation of investment projects. The beneit from the provision of public goods can be measured using two different methodologies: market valuation and non-market valuation (McVittie, Moran and Thompson, 2009). The value created from provision of public goods depends on the valuation method. The researchers point out these valuation methods: willingness to pay method (Hasund, Mitesh and Lagerkvist, 2011), hedonic methods (Irwin, 2002), method of travel cost, and beneit-sharing method (Rosenberger and Loomis, 2003). Cost of provision of public goods, as value drivers, is associated with investment in ixed assets and additional working capital.
Cost-beneit analysis is a standard methodology for evaluation of public investment projects. In assessment of projects having a signiicant environmental impact on
future generations, the discount rate and time horizon are the main factors inluencing the socio-environmental investment project eficiency (Almansa and Martinez-Paz, 2011).
Groom, Hepburn, Koundouri and Pearce (2005) state that the correct social discount rate (SDR) should
change over time ranging from 3.5% in the short-run and decreasing to 1% in the long-run horizon. Voinov and Farley (2007) state that the discounts function
acquire the form of hyperbole over time. Price (2010) argues that the difference between the consumption discount rate and return on investment is that the former is recognised as the SDR. SDR leads to the expected annual real growth rate and elasticity of marginal utility of income. Long-term annual real growth rate of 1% and the marginal utility of income
elasticity are –2. Taking diminishing marginal utility as the bases of discounting, the annual discount on consumption is 2%. Recently, more and more discussions lead to the conclusion that the elasticity of marginal utility of income has a crucial impact on the SDR and
environmental value.SDR depends on the European Commission and the
governmental decisions, which are based on the following factors: the real growth rate in the long-run, the elasticity of marginal utility of income, the time horizon of social investment projects, and the chosen econometric model.
3. The model of value drivers of
multifunctional and sustainable agricultural
organisationThe authors of the paper have prepared the model
of value drivers of multifunctional and sustainable agricultural organisation based on the previous research
results analysis. The main value drivers of each organisation are FCF and discount rate. The value drivers of FCF and discount rate are decomposed into the second, third or fourth levels as was suggested by Kazlauskiene and Christauskas (2008). The decomposition is not inal, the research is continued reaching to ind out more levels of value drivers.
As mentioned earlier, FCF in conventional agricultural organisation depends on such drivers as NOPAT (the
difference between earnings before interests and taxes (EBIT) and paid income tax), depreciation and amortisation of ixed assets, capital investment, and investments in additional working capital. Using the method of decomposition, value drivers of NOPAT are presented according to the 3 Business Accounting Standard “Income Statement”. Proit from selling products and rendering services as the main value driver of NOPAT is decomposed into three value drivers: quantity, price, and variable cost per unit.
Cash lows from maintaining the sustainability and functionality are composed of subsidies and grants for increasing farms’ eficiency; subsidies and grants for business diversiication in rural areas; beneit and costs in providing public goods. Such composition is made according to the spectrum of means of the Common Agricultural Policy, presented by Vaznonis and Vaznonis (2011).
Cash lows from agricultural production and services, also subsidies and grants for increasing farms’ eficiency
V. Alekneviciene et al. Value Drivers of Multifunctional and Sustainable Agricultural Organisation: Cash Flow Discounting Approach

155
Economic Science for Rural Development Nr. 28., 2012
ISSN 1691-3078
Source: authors’ construction
Fig. 1. The model of value drivers of multifunctional and sustainable agricultural organisation
and for business diversiication in rural areas should be discounted at WACC because of their economic nature.
According to Plenborg (2002), when setting the WACC, the target capital structure should be used instead of debt-equity ratio in the balance sheet. The other two value drivers of WACC are cost of debt and cost of equity capital. Value drivers of cost of debt capital are universally accepted. Value drivers of cost of equity capital are based on McConaughy (2009): risk-free interest rate, return and standard deviation of return of market portfolio, and return and standard deviation of return of agricultural organisation (farms as private organisations and agricultural companies as similar to closed joint-stock companies).
Cash lows from providing public goods include beneit and cost. Beneit in providing public goods depends on typology of public goods presented by McVittie, Moran
and Thompson (2009) as well as on the chosen valuation method. Such cash lows should be discounted at SDR. The main value drivers of SDR are the real growth rate in the long run, the elasticity of marginal utility of income, the time horizon of social investment projects, and the chosen econometric model.
Conclusions1. Under the principle of market eficiency, business
organisation should be sold, exchanged, mortgaged at a fair value. The measurement of the fair value of agricultural organisation using cash low discounting approach is problematic due to the different nature of cash lows and discount rates.
2. The research was focused on the value drivers of FCF and discount rates using decomposition method. In
V. Alekneviciene et al. Value Drivers of Multifunctional and Sustainable Agricultural Organisation: Cash Flow Discounting Approach

Economic Science for Rural Development Nr. 28., 2012
ISSN 1691-3078
156
the proposed model of value drivers of multifunctional and sustainable agricultural organisation, FCF are grouped into two groups: FCF from agricultural production and services, and FCF from maintaining the sustainability and functionality. The former and the part of FCF from maintaining the sustainability and functionality (grants and subsidies for increasing
farms’ eficiency and for business diversiication in rural areas) should be discounted at WACC. Only beneit and cost in providing public goods should be discounted at SDR.
3. The main value drivers of WACC are target capital structure, cost of equity capital, and cost of debt capital. The authors suggest using the modiied CAPM for estimation of cost of equity capital. The modiication is based on using total risk measured by standard deviation instead of systematic risk measured by beta coeficient.
4. The main value drivers of SDR are the following: the real growth rate in the long run, the elasticity of marginal utility of income, the time horizon of social investment projects, and the chosen econometric model.
5. The value drivers of FCF, WACC and SDR are decomposed into the second, third, and fourth levels. The decomposition is not inal, the research is continued reaching to ind out more levels of value drivers.
Bibliography1. Almansa, C., Martinez-Paz, J.M. (2011).
What Weight Should Be Assigned to Future Environmental Impacts? A Probabilistic Cost Beneit Analysis Using Recent Advances on Discounting. Science of the Total Environment, 409, pp. 1305-1314.
2. Alroe, H.F., Kristensen, E.S. (2004). Basic Principles for Organic Agriculture. Why? And What Kind of Principles? Ecology & Farming, No 36, pp. 27–30.
3. Bajaj, M., Denis, D., Ferris, S., Sarin, A. (2001). Firm Value and Marketability Discounts. Journal of
Corporation Law, Fall, pp. 89–115.4. Banzhaf, H.S. (2010). Economics at the Fringe: Non-
market Valuation Studies and Their Role in Land Use Plans in the United States. Journal of Environmental
Management, Vol. 91, pp. 592–602.5. Das, S., Jagannathan, M., Sorin, A. (2003). The
Private Equity Discount: An Empirical Examination of the Exit of Venture Backed Companies. Journal
of Investment Management, 1.1, First Quarter, pp. 1–26.
6. Fama, E., French, K. (1992). The Cross Section of Expected Stock Returns. Journal of Finance, (June), pp. 427–486.
7. Fernandez, P. (2007). Valuing Companies by Cash Flow Discounting: Ten Methods and Nine Theories. Managerial Finance, Vol. 33, No 11, pp. 853–876.
8. Francis, J., Olsson, P., Oswald, J. (2000). Comparing the Accuracy and Explainability of Dividend, Free cash Flow and Abnormal Earnings Equity Value Estimates. Journal of Accounting Research, 38 (1), pp. 45–70.
9. Galsanova, B.S. (2007). Sistema Faktorov Proizvodstva na Urovne Predprijatija kak Vazneisije Uslovije Obespecenija Konkurentospasobnosti
Molochnovo Zivotnovodstva (System of Production Factors in the Enterprise as the Main Condition of Competitiveness in Milk Husbandry). Naucnij Zurnal
KubGai, No 33 (9). Retrieved: http://ej.kubagro.ru/2007/09/pdf/04.pdf.
10. Groom, B., Hepburn, C., Koundouri, P., Pearce, D. (2005). Discounting the Future: the Long and the Short of It. Environmental and Resource Economics, 32, pp. 445–493.
11. Guide to Cost–Beneit Analysis of Investment Projects (2008). Structural Funds, Cohesion Fund and Instrument for Pre-Accession. Final Report, pp. 1–255.
12. Hasund, K.P., Mitech, K., Lagerkvist, C.J. (2011). Valuing Public Goods of the Agricultural Landscape: a Choice Experiment Using Reference Points to Capture Observable Heterogeneity. Journal
of Environmental Planning and Management, Vol. 54 (1), pp. 31–53.
13. Hill, J.W., Zeller, T.L. (2008). The New Value Imperative for Privately Held Companies: The Why, What, and How of Value Management Strategy. Business Horizons, 51, pp. 541–553.
14. Hongze, L., Sen, G., Bao, W. (2011). Analysis of Sensitivity of the Environmental Value of Wind Power. Energy Procedia, 5, pp. 2576–2580.
15. Irwin, E. (2002). The Effects of Open Space on Residential Property Values. Land Economics, 78, pp. 465–480.
16. Kazlauskiene, V., Christauskas, C. (2008). Business Valuation Model Based on the Analysis of Business Value Drivers. Engineering Economics, No 2 (57), pp. 23–31. Retrieved: http://www.ktu.lt/lt/mokslas/zurnalai/in zeko/57/1392-2758-2008-2-57-23.pdf>. Access: 11 January 2012.
17. Kerselaers, E., Cock, L.D., Lauwers, L., Huylenbroeck, G.V. (2007). Modelling Farm-Level Economic Potential for Conversion to Organic Farming. Agricultural Systems, 94, pp. 671–682.
18. Kniuksta, B., Caplikas, J. (2011). Competition for Land Resources from Bioenergy Development: Theoretical Approach. Economics & Rural Development, Vol. 7, No. 1, pp. 39–53.
19. Koeplin, J. A., Sarin, A., Shapiro, A. (2000). The Private Company Discount. Journal of Applied
Corporate Finance, 12.4, Winter, pp. 94–101.20. Krieger, D.J. (2004). Public Preferences for
Undeveloped Land in the Petoskey Area. Report
prepared for the Petoskey Area Open Space Task
Force.
21. Magni, C.A., Malagoli, S., Mastroleo, G. (2006). An Alternative Approach to Firm’s Evaluation: Expert Systems and Fuzzy Logic. International Journal of
Information Technology & Decision Making, Vol.5, No 1, pp. 195–225.
22. McConaughy, D. L. (2009). The Cost of Capital for the Closely-held, Family-Controlled Firm. USASBE Proceedings, pp. 1–13.
23. McVittie, A.; Moran, D.; Thomson, S. (2009). A Review of Literature on the Value of Public Goods
V. Alekneviciene et al. Value Drivers of Multifunctional and Sustainable Agricultural Organisation: Cash Flow Discounting Approach

157
Economic Science for Rural Development Nr. 28., 2012
ISSN 1691-3078
This research was funded by a grant (No. MIP-016/2011) from the Research Council of Lithuania.
from Agriculture and the Production Impacts of the Single Farm Payment Scheme. Report Prepared for
the Scottish Government’s Rural and Environment
Research and Analysis Directorate (RERAD/004/09).24. Plenborg, T. (2002). Firm Valuation: Comparing
the Residual Income and Discounted Cash Flow Approaches. Scandinavian Journal of Management, 18, pp. 303–318.
25. Price, C. (2010). Low Discount Rates and Insigniicant Environmental Values. Ecological Economics, 69, pp. 1895–1903.
26. Rosenberger, R.S., Loomis, J.B. (2003). Beneit Transfer. A Primer on Non-Market Valuation. Kluwer
Academic Publishers, Dordrecht, the Netherlands, pp. 445–482.
27. Sapolaite, V. (2011). Zemes ukio bendroji pridetine verte ir pajamos, ju didinimo
veiksniai (Agricultural Gross Value Added and
Revenue, their Raising Factors). Management Theory and Studies for Rural Business and
Infrastructure Development. Nr. 4 (28), pp. 127–139.
28. Skulskis, V. (2010). Ekologinio ukininkavimo veiksniu modeliavimas (Modelling of Organic Farming Factors). Management Theory and Studies for Rural Business and Infrastructure Development. Nr. 22 (3), pp. 158–166.
29. Sydorovych, O., Wossink, A. (2008). The Meaning of Agricultural Sustainability: Evidence from a Conjoint Choice Survey. Agricultural Systems, 98, pp. 10–20.
30. Tozer, P. R. (2009). Uncertainty and Investment in Precision Agriculture – Is it Worth the
Money? Agricultural Systems, 100 (1-3), pp. 80–87.
31. Ueda, K., Takenaka, T., Vaneza, J., Monostori, L. (2009). Value Creation and Decision Making in Sustainable Society. CIRP Annals – Manufacturing Technology, 58, pp. 681–700.
32. Vaznonis, V.; Vaznonis, B. (2011). Bendrosios zemes ukio politikos perspektyvos: link darnaus vystymosi (Perspectives of CAP: Towards Sustainable Development). Management Theory and Studies for Rural Business and Infrastructure
Development. Nr. 1 (25), pp. 231–238.33. Voinov, A., Farley, J. (2007). Reconciling
Sustainability, Systems Theory and Discounting. Ecological Economics, 63, pp. 104–113.
34. Zivelova, I. (2004). Possible Approaches to the Valuation of a Farm. Agricultural Economics, 50 (5), pp. 204–206.
35. 3 BAS “Income Statement”. Retrieved: http://
www.aat.lt/index.php?id=85. Access: 16 January
2012.
V. Alekneviciene et al. Value Drivers of Multifunctional and Sustainable Agricultural Organisation: Cash Flow Discounting Approach

Economic Science for Rural Development Nr. 28., 2012
ISSN 1691-3078
158
I. Berzina Elaboration and Approbation of Methodology for Estimating the Region-Wide Economic
Signiicance of Tourism in National Parks of the Regions of Latvia
___________________________1 E-mail address: [email protected].
Elaboration and Approbation of Methodology for Estimating the Region-Wide Economic Signiicance of Tourism in National Parks of
the Regions of Latvia
Iluta Berzina1, MBA Faculty of Economics, Latvia University of Agriculture;
Socio-technical Systems Engineering Institute, Vidzeme University of Applied Sciences, Latvia
Abstract. The aim of the paper is to present the estimating methodology and its approbation results concerning economic signiicance of tourism in the regions of NPs of Latvia that is included in the author’s PhD thesis “Assessment of Economic Signiicance of Tourism in the Regions of National Parks in Latvia”. It is based on the problem – lack of previous determined diagnosis for sustainable tourism planning. The research hypothesis: economic signiicance of tourism in the NPs regions of Latvia is statistically signiicant. The methods used in the research: scientiic and applied literature studies; surveys of NPs visitors and entrepreneurs; and data analysis using approaches of an economic impact (EI) estimates and single factor dispersion analysis for determination of statistical signiicance of results. The main conclusions: 1) several estimating approaches for tourism economic importance exist in the world and they are based on the main components: research goals, questions, territory, used types of analysis, veriication of the acquired results, and understanding of results using ields; 2) an appropriate methodology has been elaborated for Latvia and it has been approbated in tourism of the NPs regions; 3) in 2010, tourism in Latvian NPs regions created more than LVL 50.12 million of economic signiicance, thus, the result is more than 81 times larger than the governmental allocations for implementation of tourism policy and its development in 2010; 4) the amount of tax revenues from tourism in local municipalities of NPs regions ranges from 2.1% to 7.57%; these are statistically signiicant indicators; 5) improvements in the terms of the elaborated methodology are not necessary, yet, they enhance the necessity for pre-conditions relating to data periodicity, accumulation, detalisation, and availability.Key words: national park, economic signiicance of tourism, methodology. JEL code: B490, B41
Introduction In rural territories of Latvia, tourism is a means to
facilitate balanced economic development where nature protected areas (PA) and all four national parks (NP)
involved in tourism - Gauja, Kemeri, Slitere, and Razna NPs, which are considered as large PA, are used as a tourism resource.
National parks are wide areas characterised by excellent natural formations that are not affected by humans and are only a little changed landscapes and cultural landscapes with a variety of biotopes, cultural and historical monuments, and characteristics of cultural environment. The main objective of a NP is nature protection, preservation of cultural and historic heritage, scientiic investigations, education, and recreation (Latvijas Vestnesis, 2010). Therefore, the role of tourism is inseparable from the development that is closely connected with the economic development not only in the territories of NPs but in municipalities, in general. NPs have potential beneits from tourism: 1) protection and preservation of natural and cultural heritage; 2) enhancing economics; and 3) increasing the local community’s level of life quality. It requires a regular, systematic, and accepted monitoring – assessing the state, a system of control, analysis, and forecasting, in general (Eagles P.F.J. et al., 2002; Baldunciks J., 2007).
Monitoring of tourism economic development and impact is connected with researching tourism as a phenomenon. Since the 1980s, the major focus of
research in the economics of tourism has been laid on the public sector, and still the burst of “tourism economic impact” can be seen in the world studies done by academics, students, state and commercial organisations, managers and other stakeholders (Veal A.J., 2006). In the direction of academic researching, tourism is relatively
recent – it has been done since the second half of the
20th century. Bernstein (1991) believes that tourism should be researched by an integrative approach. In this aspect, new, standardisable methodological solutions in the disciplines to be researched and connected with tourism should be looked for. Such solutions do not exist in the world (Echtner M.C. et al., 1997). Several methodologies in data acquisition still exist in tourism researching. Different methodological techniques, which depend on the characteristics of the territory, aims, questions, research base, and other factors are used in calculations. Yet, there are arguments on the validity and comparability of results of research done in the academic environment. Research of economic character in tourism is carried out despite lacking standards of research
methodologies.Research on the economic impact and signiicance of
tourism in national parks in the world is done by many scientists. Special experience is demonstrated by the United States, Canada, Finland, Australia etc. In Latvia, tourism research have mainly been initiated and carried out by a non-governmental sector, for instance, Professional Rural Tourism Association of Latvia “Lauku celotajs”

159
Economic Science for Rural Development Nr. 28., 2012
ISSN 1691-3078
(PRTA LC) and Latvian Fund for Nature (LFN). Research and situation analysis on national parks and their nearby
territories carried out by these organisations are little and
mainly descriptive, thus, eliminating economic evaluation in scientiic expressions. Although, the necessity for them is increasing, for instance, in order to implement the principles of the Charter of European Sustainable Tourism for planning tourism development in NPs of Latvia. In 2010, the Ministry of Regional Development and Local Governments of the Republic of Latvia worked out an updated methodology for elaborating developmental programmes on regional and local level; however, it has not deined a pre-research methodological mechanism of economic situation. Methodological Guidelines of Tourism Monitoring in Slitere NP is one of the attempts to facilitate socially economic monitoring of tourism in NPs of Latvia. The guidelines were elaborated by PRTA LC in 2009. However, they only emphasise the process of data acquisition – systematic and regular observations of the number of tourists and their dynamics (Smalinskis J. et al., 2009).
The research problem: since Latvia lacks research on the economic impact and signiicance of tourism in NPs regions, there is a necessity to have a methodology, which could be used in estimating the economic signiicance or impact. Therefore, the author has elaborated a thesis being in the state of defence “Assessing of Economic Signiicance of Tourism in the Regions of National Parks in Latvia”, which is a novelty in Latvia.
The research is based on the hypothesis: economic signiicance of tourism in the NPs regions of Latvia is statistically signiicant.
The aim of the paper is to present the estimating methodology and its approbation results concerning economic signiicance of tourism in the regions of NPs of Latvia.
The tasks: 1) in brief, to explain the theoretical and practical aspects, and approaches of the tourism economic signiicance estimates; 2) to present the main components of the elaborated methodology, which are based on indings in theories and good examples in practice in the world; 3) to present the main results of the approbating elaborated methodology, its defects and reasons, and possible solutions; and 4) to draw the conclusions and recommendations.
The methods. The study is based on scientiic and applied literature studies; surveys of NPs visitors and entrepreneurs; data analysis using approaches of an economic impact estimates; and a single factor dispersion analysis for the determination of statistical signiicance of results.
Research main results and discussion1. The theoretical background for elaboration of a methodology
According to Reeves (2002), who emphasises that the terms economic impact and economic signiicance are
not synonyms, their differences are taken into account.
Economic signiicance is a static term, which can be measured at single point in time, as initial circumstances are a base for measuring the economic impact later (Analitisko petijumu un strategiju laboratorija, 2007). This is the main argument why the author has stated economic signiicance of tourism in the regions of NPs. It is based on the lack of data and dynamics, which can be considered as a limitation of possibly entire assessment. The methodology elaboration process and approbation of estimating economic signiicance of NP tourism in Latvia is based on practical examples and scientiic research worldwide.
Scientiic research is the research, which is conducted within the rules and conventions of science. This means that it is based on logic and reason, and systematic examination of evidence. Ideally, within the scientiic model, it should be possible for research to be replicated by the same or different researchers and for similar conclusions to emerge (Veal A.J., 2006). According to this deinition, the author assumes that an elaborated and repeatedly usable concept or strategy
of a scientiic research can be a methodology2, which includes methods3 and guidance4. Depending on the fact if the tourism research is meant to be theoretical or applied, longitudinal, empirical or non-empirical, descriptive or interpretative, quantitative, qualitative, or experimental, primary or secondary, induction on deduction. Veal (2006) recommends to follow such research procedure: 1) to select a topic; 2) to review literature; 3) to set a conceptual framework; 4) to decide research questions; 5) to list information needs; 6) to decide research strategy; 7) to conduct a research; and 8) to report indings. Besides, when choosing the methods for a tourism research, he recommends at irst to study previous research, data availability or access, data and information resources, time, and uses /users of the research indings (Veal A.J., 2006). Weaver and Lawton (2006) supplement the process of a tourism research with deining the problem, triangulation5, and four actions with the data: 1) data collecting, 2) analysis, 3) presentation, and 4) interpretation (Weaver D. et al., 2006). In order to determine the economic impact of tourism in NP, Stynes (s.y.) recommends to begin with identifying the study region and key economic sectors, and research problems; stating the aim; and deining the questions: 1) how much money visitors spend when visiting the speciic territory; 2) what is the travellers’ expense proportion on sectors; 3) how much money spent by travellers reaches the budgets of households; 4) how many working places tourism provides in the territory; and 5) what is the amount of tax revenues generated by tourism. He suggests to continue the research with calculating the amount of tourism demand; calculating the regional economic effect; and analysis, interpretation, and presentation of research results (Stynes D.J., s.y.). Visitor sampling in economic researches of tourism is very important in order to determine spending distribution by visitor segments (Stynes D.J. et al., 2006). Almost identical approach is demonstrated by Huhtala etc.
I. Berzina Elaboration and Approbation of Methodology for Estimating the Region-Wide Economic Signiicance of Tourism in National Parks of the Regions of Latvia
___________________________2 Methodology – totality of approaches in order to do something (Baldunciks J., 2007).3 Method – a way, an approach, a totality of approaches (Baldunciks J., 2007).4 Guidance – a totality of methods, a totality of general scientiic principles (Baldunciks J., 2007).5 Triangulation – the use of multiple methods, data sources, investigators or theories in a research process (Weaver D. et.al, 2006).

Economic Science for Rural Development Nr. 28., 2012
ISSN 1691-3078
160
(2007; 2010) in economic evaluations of tourism in the national parks in Finland (Huhtala M., 2007; Huhtala M. et al., 2010).
There are several economic analysis methods in NP tourism. For instance, theories suggested by Michigan State University in the United States (US)
and based on Burchell and Listokin (1978), Walsh (1986), Warnell (1986), Johnson and Thomas (1992), Williams (1994), Frechtling (1994) etc. These theories help estimate extended impact: 1) economic impact analysis; 2) iscal impact analysis; 3) inancial analysis; 4) demand analysis; 5) beneit cost analysis (B/C); 6) feasibility study; 7) environmental impact assessment; and 8) tourism income multiplier assessment (Berzina I. et al., 2008). Due to the lack
of dynamics of output data, many of them cannot be used in Latvia, except the economic impact analysis (EI) and tourism income multiplier assessment (Berzina I. et al., 2011).
The EI is used to outline tourism activities in the territory of inancial low, identifying changes in sales amounts, tax incomes, and employment. Basic methods are travellers’ surveys on their expenses; statistic analysis of secondary (state) economics; economic base models including input – output (I/O); and multiplier analysis determining direct, stimulating or induced, and indirect impact (Stynes D.J., s.y.; Jegere S., s.y.). Basic variables for estimating economic impact of tourism are 1) visits or tourism activity (demand) – arrivals, some–days visitors, length of stay, occupancy, etc.; 2) spending (demand) – expenditure and 3) multipliers (supply) – sales, revenue, employment, taxes, and value added; and 4) leakages; (Stynes D.J., s.y.; UNWTO, 2000). Stynes concedes to use or adjust data from similar studies of a similar area/market or region/study visitor spending and multipliers in determining the amount (Stynes D.J., s.y.).
Tourism income multiplier (K) can be determined by using one of these methods: 1) ratio and 2) normal. With the help of ratio method, which is a proportion of direct income against the sum of direct and secondary income, mutual correlation of territory economic sector is stated. However, the result does not show how much income this correlation generates. Therefore, such K measurement for the purposes of tourism planning is senseless. Normal method can be used in assessing the economic impact dynamics (Horwath HTL, 1981).
Probabilistic statements, signiicance, veriication of zero and alternative hypothesis, Chi-square test, T-test, factorial analysis, cluster analysis, correlation, regression, and expert methods are more often used in statistic analysis (Veal A.J., 2006; Weaver D. et al., 2006; Stynes D.J., s.y.).
2. Main components of the elaborated methodology
According to the theories of Veal (2006), Weaver (2006), Stynes (s.y.), Huhtala (2007; 2010), Wells (1997), UNWTO (2000), and others, the author presents the main selected components of created methodology for assessing region-wide economic signiicance of tourism in Latvian NPs:
— the topic: region-wide economic signiicance of NP regions tourism in Latvia;
— the problem to be solved: inexistence of the diagnosis of Latvian NP regions tourism economic
situation necessary for planning sustainable tourism development;
— determined NP regions: administratively territorial borders of local municipalities including NPs. Determination of speciic regions is motivated by the necessity for comparability indicators. The only accessible indicator is the amount of inhabitants’ tax revenues in the basic budget of local municipalities forming NPs;
— the main research issues: 1) how much money visitors spend when visiting the regions of NPs; 2) what is the NP visitors’ expense proportion on sectors; 3) how many working places tourism provides in the territory; 4) what is the amount of income generated by tourism from tax revenues in local municipalities forming the regions of NPs; 5) how statistically signiicant is the proportion of income generated by tourism from tax revenues in local municipalities;
— the aim for use of the methodology: estimating an economic signiicance of tourism in the NP regions of Latvia;
— the type of the research in case the elaborated
methodology is used: applied, quantitative; — the time: the oficial tourism season in Latvia is from
15 May to 15 October, thus, one can obtain a larger amount of data;
— the performers of estimates: state institutions, local municipalities, NGOs, academics, students, commercial enterprises etc.;
— the users of the estimating results: Ministry of Environmental Protection and Regional Development of the Republic of Latvia (MEPRD RL), Ministry of Economics of the Republic of Latvia (ME RL), Latvian Tourism Development Agency (LTDA), Latvian Nature Concervancy Agency (NCA), NP administrations, local municipalities, other state and regional institutions, education institutions providing education in tourism, students, non-governmental organisations (NGOs), commercial enterprises etc. They are stakeholders who are interested in a tourism planning, mostly it is their operational function;
— data sources: primary and secondary: surveys of NP visitors and tourism entrepreneurs (involved in tourism), data and information collected by NPs, state oficial statistics (LR CSD), Europe scale tourism statistics (for instance, Eurostat), scientiic and practical research on tourism in NPs in Europe and the world, literature and informative reports etc.;
— ascertainment of the amount of tax revenues in the basic budget of NPs regions municipalities for at least one year period, thus, one can obtain an indicator for comparability of results;
— the design of NP visitors’ survey: the questionnaire should be elaborated as well as methodology on carrying out the survey. Compulsory questions included in the questionnaire should foresee NP visitors’ segmentation by asking about the place the visitor comes from and residence length in the region and ask about the NP visitors’ expenses for accommodation, public catering, retail sales, tourism activities (programmes) used, and expenses for transport. The survey methodology should provide the procedure how the survey is carried out by
I. Berzina Elaboration and Approbation of Methodology for Estimating the Region-Wide Economic Signiicance of Tourism in National Parks of the Regions of Latvia

161
Economic Science for Rural Development Nr. 28., 2012
ISSN 1691-3078
answering the basic questions: who carries it, where it is carried out, when it is carried out, how it is carried out. There is a need to provide explanations for the questions and the order of recording the answers;
— the design of NP related entrepreneurs’ survey: the following main questions should be included in the questionnaire: how many working places are provided and how large is an average salary for an employee per month. The acquired data allow estimating the amount of tax revenues and employment in the NPs regions;
— data analysis: should be summarised according to the NP visitors’ segment; average expenses per day per person according to the segment and expense positions in spheres should be calculated; and total expenses in NP per year in spheres should be calculated by using the total number of visitors per year which is multiplied by the average expenses per day per person (Graefe A.R. et al., 2001). Estimates of the economic signiicance by calculations of direct economic impact (DEI), caused economic impact (CEI), indirect economic impact (IEI), and total economic impact (TEI) shall be used in the EI analysis technique. Tourism income multiplier (K) effect should also be calculated in economic impact measurements. The amount of NP visitors’ expenses statistic signiicance should be stated by using a single factor dispersion analysis with heterogeneous statistic complex including proving or rejection of zero and alternative hypotheses. The lack of number and dynamics of comparability indicators determines this choice.
4. Main results of approbating the elaborated methodology
NP regions in Latvia are formed by territories of 20 local municipalities and 1 state meaning city where
331 enterprises are directly involved and 158 – indirectly. These enterprises employ 2198 persons directly and
515 – indirectly. Estimating of tourism economic signiicance in NPs in Latvia is based on data from the year 2010 –surveys of 1443 NP visitors and
489 entrepreneurs were carried out during the tourism season. In the result of surveys, the economic signiicance of each NP was calculated and expressed in lats (LVL) (Table 1).
Totally, economic signiicance of more than
LVL 50.12 million was created in the NP regions in 2010. It points to more than 81 times larger indicator than the governmental allocations for the
implementation of tourism policy and development of Latvia in 2010. Each lat spent by NP visitor created resonance on LVL 11.74 on average for tourism and related spheres in NP regions. The major proportion of NP visitors’ expenses (61.8%) was in retail sales, 24.6% - accommodation and only 1.2% - for tourism activities. It can be explained by the fact that provision of the national accessibility principle tourism offer by NP administrations is free of charge in the NP territories. The amount of revenue tax in basic budgets of local municipalities of NP regions: Gauja NP region in total is 6.03%; Kemeri NP region – 5.14%, Razna NP
region – 7.57%, and Slitere NP region – 2.1%. In order to answer to the question on the signiicance of this proportion and to verify the research hypothesis, the author calculated the statistic importance of NP tourism economic signiicance. The author used a single factor dispersion analysis with heterogeneous statistic complex including proving or rejection of zero and alternativehypotheses (Table 2).
Economic statistic signiicance of Gauja and Razna NP regions is 95%, while Kemeri NP – 94%. It is not possible to provide such calculations with data from one year for Slitere NP region, since it is formed by only one municipality. In this case, there is homogeneous
I. Berzina Elaboration and Approbation of Methodology for Estimating the Region-Wide Economic Signiicance of Tourism in National Parks of the Regions of Latvia
Table 1
Calculation results of tourism economic signiicance in NPs of Latvia in 2010 per NP (LVL)
No. Type of economic impact Gauja NP Kemeri NP Razna NP Slitere NP
1. DEI 10195384.00 9666569.30 3345524.94 123962.17
2. CEI 438741.76 445261.96 120535.87 116587.37
3. IEI 10239258.18 9711095.50 3357578.53 1251020.90
4. TEI 20873383.93 19822926.76 6823639.34 2606970.44 Source: author’s calculations based on the data from NP visitors’ surveys
Table 2
Calculation results of statistic importance of tourism economic signiicance in Latvia created by NP visitors in 2010 per NPs
No. Gauja NP Kemeri NP Razna NP Slitere NP
1. Probability (%) 95 94 95 ...
2. Value of Fisher test >=< Fisher’s critical value
F=5.042>Fcrit=4.667
F=5.37>Fcrit=5.02
F=14.4>Fcrit=5.987
...
3. P-value >=< signiicance level value (1-a)
0.042<a=0.05
0.053<a=0.06
0.004<a=0.05
...
4. H0 rejected / not rejected rejected rejected rejected ...
Source: author’s calculations based on Arhipova I. et al., 2006
Economic Science for Rural Development Nr. 28., 2012
ISSN 1691-3078
162
not heterogeneous statistic complex with only one variable in each gradation class. The method can be used only if there were data on two years or if the municipality of Dundaga had divided income amount from tax revenues in basic budget per Kolka area and
Dundaga area. By stating NP tourism economic signiicance statistic
importance, municipalities can ascertain that their income in basic budget from tourism through revenue tax can or cannot be a reason, for example, for investing in developing tourism environment in the future. In order to state statistic signiicance of NP visitors’ expenses against NP administration budgets, initially it would be necessary for NCA to calculate the total amount of inancial means invested directly in tourism per year. Currently, it has not been separated in common expenses.
Conclusions, proposals, recommendations1. Several estimating approaches for tourism economic
importance exist in the world. They are mainly based on such components as research goals, questions, used types of analysis, veriication of the acquired results etc.
2. The most appropriate method for Latvia is an economic impact (EI) estimating approach. It determines the number of circumstances: lack of the dynamics of output data; monitoring of tourism economic processes in the regions of Latvian NPs has never been done before etc.
3. Basing on the EI estimating approach, a new methodology has been elaborated and approbated for estimating economic signiicance of tourism. In 2010, it created more than LVL 50.12 million of economic signiicance of tourism in NP regions of Latvia. It points to more than 81 times larger indicator than the governmental allocations for the implementation of tourism policy and development in 2010. Results provide knowledge for related ministries, NCA, municipalities of NPs regions, and other stakeholders on the researched
territories. 4. The amount of tax revenues from tourism in a
basic budget of NPs regions’ municipalities ranges from 2.1% to 7.57%. It is a statistically signiicant indicator veriied by using a single factor dispersion analysis.
5. Improvements of the elaborated methodology in its terms are not necessary, while it enhances the necessity for pre-conditions relating to data
periodicity, accumulation, detalisation, and availability.
6. The methodology as a scientiic model for estimating tourism economic signiicance can be replicated for similar applied research in other PA of Latvia.
7. The elaborated methodology can also be used for measuring tourism economic impact after some time for estimating the changes (%) taking the year 2010 as a reference point.
Bibliography 1. Analitisko petijumu un strategiju laboratorija
(2007). Petijums par kulturas sektora ekonomisko
nozimi Latvija (Research on Economic Signiicance of Culture Sector in Latvia). Retrieved: http://culturelablv.wordpress.com/2008/05/03/kulturas-sektora-ekonomiska-nozime-un-ietekme-latvija/. Access: 21 December 2011.
2. Arhipova, I., Balina, S. (2006). Statistika ekonomika
un biznesa. Risinajumi ar SPSS un MS Excel (Statistics in Economics and Business. Solutions
with SPSS and MS Excel). Riga: Datorzinibu centrs, 362 lpp.
3. Baldunciks, J. (2007). Svesvārdu vardnica (Dictionary of Foreign Terms). Latvia: SIA J.L.V., 928 lpp.
4. Berzina, I., Grizane, T. (2011). Economic Impact of Tourism in Kemeri National Park. Proceedings
of International Scientiic Conference “Economic Science for Rural Development”, Latvia: Jelgava,
No. 25, pp. 31-37.5. Berzina, I., Livina, A. (2008). The Model on Estimating
Economic Beneit of Nature-based Tourism Services of Territories of National Parks, Latvia. Proceedings
of International Scientiic Conference “Education and New Educational Technologies”, Greece: Corfu, pp. 100-105.
6. Eagles, P.F.J., McCool S.F., Haynes C.D. (2002). Sustainable Tourism in Protected Areas: Guidelines
for Planning and Management. IUCN: The World Conservation Unit. p. 183.
7. Echtner, M.C., Jamal B.T. (1997). The Disciplinary Dilemma of Tourism Studies. Annals of Tourism
Research, Volume 24, No. 4, pp. 868-883.8. Graefe, A.R., Vogelsong, H. (2001). Economic
Impact Analysis: a Look at Useful Methods. The
Learning Material. Retrieved: http://indarticles.com/p/articles/mi_m1145/is_3_36/ai_72868383/. Access: 3 April 2011.
9. Horwath HTL (1981). Tourism Multipliers Explained. The Learning Material. Retrieved: http://www.horwathhtl.co.za/includes/newsroom/Tourism%20Multipliers.pdf. Access: 6 January 2010.
10. Huhtala, M. (2007). Assessment of the Local Economic Impacts of National Park Tourism: the Case of Pallas-Ounastunturi National Park. The Research.
Retrieved: http://www.wsl.ch/dienstleistungen/publikationen/pdf/8192.pdf. Access: 9 December 2010.
11. Huhtala, M., Kajala, L., Vatanen, E. (2010). Local Economic Impacts of National Park Visitors’ Spending in Finland: the Development Process of an Estimation Method. Working Paper of the Finnish
Forest Research Institute. Retrieved: http://www.metla.i/julkaisut/workingpapers/2010/mwp149.pdf. Access: 11 September 2010.
12. Jegere, S. (S.y.). Kulturas pasakumu centru ekonomiskas ietekmes novertejuma metozu un modelu analize un izvele (Analysis and Selection of Estimation Methods and Models for Economic Impact of Culture Events Centres). Research. Retrieved: http://www.tur iba. lv/komunikac i jas_2009/pages/Jegere_lv.html. Access: 14 December 2011.
13. Latvijas Vestnesis (2010). On Specially Protected Nature Territories. The Law of the Republic of Latvia.
Retrieved: http://www.likumi.lv/doc.php?id=59994. Access: 20 November 2010.
I. Berzina Elaboration and Approbation of Methodology for Estimating the Region-Wide Economic Signiicance of Tourism in National Parks of the Regions of Latvia

163
Economic Science for Rural Development Nr. 28., 2012
ISSN 1691-3078
14. Smalinskis, J., Jakovela, A. (2009). Sliteres nacionala parka turisma monitoringa metodologijas vadlinijas (Methodology Guidelines for Tourism Monitoring of Slitere National Park). Working
Paper of the Professional Rural Tourism
Association of Latvia “Lauku celotajs”. Retrieved:
http://www.celotajs. lv/cont/prof/train/doc/Turisma_monit_vadlinijas_01.08.09.pdf. Access: 19 December 2011.
15. Stynes, D.J. (s.y.). Economic Impacts of Tourism. The Learning Material. Retrieved: https://www.msu.edu/course/prr/840/econimpact/pdf/ecimpvol1.pdf. Access: 3 January 2012.
16. Stynes, D.J., White, E.M. (2006). Relections on Measuring Recreation and Travel Spending. Journal
of Travel Research, Volume 45, No. 1, pp. 8-16.17. UNWTO (2000). Data Collection and Analysis for
Tourism Management, Marketing and Planning: a Manual for Manages and Analysts. Spain: UNWTO. p. 150.
18. Veal, A.J. (2006). Research Methods for Leisure and Tourism: a Practical Guide. UK: Financial Times Press. p. 448.
19. Weaver, D., Lawton, L. (2006). Tourism
Management. Australia: John Wiley and Sons, Ltd, p. 490.
I. Berzina Elaboration and Approbation of Methodology for Estimating the Region-Wide Economic Signiicance of Tourism in National Parks of the Regions of Latvia

Economic Science for Rural Development Nr. 28., 2012
ISSN 1691-3078
164
I. Berzkalne, E. Zelgalve Standard vs. Behavioural Finance: The Case of Capital Structure in Latvia
Standard vs. Behavioural Finance: The Case of Capital Structure in Latvia
Irina Berzkalne1, Mg.oec. PhD. student Elvira Zelgalve, Dr.oec., professor
Faculty of Economics and Management, University of Latvia
Abstract. The inancial manager makes decisions on many aspects of inance, such as investments, dividends etc. The inancial manager can make unconscious mistakes as well as purposefully adopt a decision in his or her own interest. The aim of the paper is to analyse and assess the impact of behavioural aspects on the capital structure by evaluating the debt ratio of companies listed on the Stock Exchange NASDAQ OMX Riga. The characteristics of market timing theory were used in the paper. Issuing new equity in favourable times relects the market timing approach; this approach can be included in behavioural inance (irrational investor sentiment affects inancing decisions). Accordingly, another capital market – the loan market – is used in this paper. Five companies were selected for the analysis – all of them are joint stock companies (JSC) publicly traded on the Baltic main list in the Riga Stock Exchange. The linear regression model for JSC Olainfarm explains only 15% of changes in the debt ratio, while the polynomial model in the case of JSC Grindeks explains 43%. If the share price increases, the debt ratio decreases, and vice versa. The JSC Grindeks’ debt ratio has a stronger correlation with the share price than the JSC Olainfarm’s. The market timing theory, which states that the company will raise capital if the particular capital market looks good, is not fully applicable to these two enterprises.Key words: behavioural inance, capital structure, Homo Economicus, the debt ratio. JEL code: G02, G32
___________________________1 E-mail address: [email protected]
Introduction “People in standard inance are rational. People in
behavioural inance are normal” (Meir Statman). This
statement gives an idea on the difference between the standard inance and the behavioural inance.
The inancial manager makes decisions on many aspects of inance, such as investments, dividends etc. Therefore, the inancial manager also decides on the formation of and changes in the capital structure. Optimal equity-debt ratio can maximise the enterprise value and minimise its cost of capital. Although, the theory of standard inance states that the manager is rational and has all the necessary information, such situation is very unlikely in practice. The inancial manager may make unconscious mistakes as well as purposefully adopt a decision in his or her own interest. The market timing theory states that the irms tend to issue equity instead of debt when the market value of equity is high and repurchase equity when the market value is low. The market timing theory pays more attention to the fact that the inancial manager is not so much Homo Economicus but that he can base his capital structure decisions on
other than rational information. It should be taken into consideration that the very source of inancial decision-making is the human factor.
The research hypothesis – capital structure
determination is based on other than rational decisions. The aim of the paper is to analyse and assess the
impact of behavioural aspects on the capital structure by evaluating the debt ratio of companies listed on the Stock Exchange NASDAQ OMX Riga. The aim implies the following tasks: 1) to analyse the theoretical aspects of
behavioural inance; 2) to overview the results of previous research made in this ield; 3) to analyse and compare the capital structure of 5 enterprises (listed on the Stock
Exchange NASDAQ OMX Riga); and 4) to evaluate the impact of behavioural aspects on the capital structure of 2 enterprises by using the market timing theory.
The methods of the research: analysis and synthesis
of scientiic literature, monographic method, statistical analysis (correlation, regression analysis), and the graphical method. The research is based on the published papers on behavioural inance, information provided by the Stock Exchange NASDAQ OMX Riga, the Central Statistical Bureau and the Financial and Capital Market Commission. The research covers the period from 2002 to 2011 (Q3).
Research results and discussion1. Behavioural inance – history and theoretical aspects
Behavioural inance as a new ield began to emerge during the 1990s; however, the foundations can be traced back over 150 years. MacKay’s Delusions and
The Madness of Crowds (1841) presents a chronological timeline of the various panics and schemes throughout history. Le Bon’s work The Crowd: a Study of the Popular
Mind (1896) discusses the role of “crowds” and group behaviour as they apply to the ields of behavioural inance, social psychology, sociology, and history. Psychology of the Stock Market by Selden (1912) applies the ield of psychology directly to the stock market (Ricciardi V., Simon H. K., 2000). Irrational Exuberance by
Robert Shiller was published only days before the 1990s

165
Economic Science for Rural Development Nr. 28., 2012
ISSN 1691-3078
market peaked and the professor warned investors that stock prices, by various historical measures, had climbed too high. Can the Market Add and Subtract? Mispricing in Tech Stock Carve-Outs by Richard Thaler (with Owen Lamont) was also done on the general topic of irrational investor behaviour set amid the tech bubble. Beyond
Greed and Fear: Understanding Behavioural Finance and the Psychology of Investing by Hersh Shefrin also forecasts the demise of the asset bubble (Pompian M. M., 2006). The authors of the paper conclude that there are no major publications regarding behavioural inance and capital structure; most publications and research is done on stock markets and investing.
The favoured approach to the topic of behavioural
inance is to split it into two subtopics (Pompian M. M., 2006):
— Behavioural Finance Micro (BFMI) examines behaviours or biases of individual investors that
distinguish them from the rational actors envisioned in classical economic theory;
— Behavioural Finance Macro (BFMA) detects and describes anomalies in the eficient market hypothesis that behavioural models may explain.
V. Ricciardi and H. K. Simon (2000) state that the behavioural inance attempts to explain and increase understanding of the reasoning patterns of investors, including the emotional processes involved and the degree to which they inluence the decision-making process. Essentially, behavioural inance attempts to explain the what, why, and how of inance and investing from a human perspective. M. Sen and E. Oruc (2009) deine behavioural inance approach as an approach, which also considers the inluence of psychological factors in inancial decisions.
The two basic concepts in standard inance that behavioural inance disputes are the rational markets and the rational economic man (Pompian M. M., 2006). In the following paragraph, the authors will discuss the rational economic man (Homo Economicus) in more detail.
As H. A. Simon (1955) established, the traditional economic theory postulates an “economic man”, who, in the course of being “economic”, is also “rational”. This man is assumed to have knowledge on the relevant aspects of his environment, which, if not absolutely complete, is at least impressively clear and voluminous. M. M. Pompian (2006) identiies two primary reasons why economists like to use the concept of a rational economic man: 1) Homo Economicus makes economic analysis relatively simple. Naturally, one might question how useful such a simple model can be; 2) Homo Economicus allows economists to quantify their indings, making their work more elegant and easier to digest. If humans are perfectly rational, possessing perfect information and perfect self-interest, then perhaps their behaviour can be quantiied.
Most criticisms of Homo Economicus proceed by challenging the bases for these three underlying
assumptions – perfect rationality, perfect self–interest, and perfect information (Pompian M. M., 2006):
— Perfect rationality. When humans are rational, they have the ability to reason and to make beneicial judgments. However, rationality is not the sole driver of human behaviour;
— Perfect self-interest. People are not perfectly self-interested. Perfect self-interest would preclude
people from performing such unselish deeds as volunteering, helping the needy, or serving in the military;
— Perfect information. It is impossible for every person to enjoy perfect knowledge of every subject. In the world of investing, there is nearly an ininite amount to know and learn; and even the most successful investors do not master all disciplines.
Therefore, it is possible to state that the standard inance uses the concept of Homo Economicus to simplify the analysis and the indings; however, such models are not very useful. On the contrary, behavioural inance pays attention not to how investors and managers should behave but how they actually behave and make decisions. As S.Schneider (2010) points out, in an environment like economics and inance, the inluence of psychological factors and sentiment is frequently underestimated precisely because it is perceived as being so highly
rational.
2. Recent publications on behavioural capital structure
V. Dimitrious and D. Nikolaos (2009) investigated whether capital structure determination was based on other than rational decisions. The starting point was the analysis of the current capital structure of the listed irms in the Athens Exchange (ATHEX). The sample consisted of 89 listed corporations on 31 August 2002 and the data derived by the answers to a detailed questionnaire. The questionnaire included a speciic question, which asked managers if they believed that stock price in the stock exchange relected the real market value of their irms. Most of the respondents (61.73%) believed that the market valuated their common stock according to the real value less than half of the time during the year. Only a few irms (8.64%) denoted that the stock price relected the real value at a percentage of over 80% of the time during the year. These results are rather expected. The luctuations of the ATHEX during 1997-2002 do not resemble the luctuations of an eficient market. There was a vast increase in the General Index of the ATHEX during 1997-1999, which was followed by a steady, gradual fall during 1999-2002.
One of the most comprehensive studies was done by J. Graham (2002). The survey research method was used in the study; totally 392 irms completed the survey (9% response rate). The indings were rather surprising. For example, “informal” criteria such as inancial lexibility and credit ratings were the most important factors in setting the debt policy, and that avoiding EPS dilution was the main reason for companies’ reluctance to issue equity. Also, the study found that only 19% irms did not have a target debt ratio or a target range of the ratio; 37% had “lexible” targets; and 44% had “strict” or “somewhat strict” targets or ranges.
H. Cronqvist, A. K. Makhija and S. E. Yonker (2012) attempt to explain corporate capital structures based on what CEOs have revealed about themselves and their debt tolerance through past personal leverage choices. The authors apply behavioural consistency theory to corporate
inance by studying CEOs’ personal leverage (as in their choice of mortgage for their primary residences) and the corporate leverage of the irms they manage. The study found that CEOs’ personal debt preferences carry over to the corporate domain so that CEOs who do not seem
I. Berzkalne, E. Zelgalve Standard vs. Behavioural Finance: The Case of Capital Structure in Latvia

Economic Science for Rural Development Nr. 28., 2012
ISSN 1691-3078
166
to like debt personally manage irms with signiicantly less corporate leverage, all else equal. Particularly when corporate governance is weak, CEOs appear to imprint more signiicantly their personal debt preferences on the corporate capital structure.
However, M. Sen and E. Oruc (2009) used panel data analysis method, and the results show that irms do not follow the sector or the leader in decisions of capital structure. The inding of the analysis for all irms at hand, that the leverage levels of the sector and leader for the
period immediately before the current one are followed, has a relatively weak level of sensitivity, and does not allow judging that the sector or the leader is followed. This means that sector averages or leader irms’ level of leverage do not have a meaningful effect on capital structure decisions of the irms listed on the ISE (Istanbul Stock Exchange).
Recently, more research has been done and more papers have been published on behavioural inance and capital structure. Researchers are using different methods to identify behavioural traits in capital structure development – questionnaires and/or econometric methods. The methods used depend on the data available and they are also subject to the research aim.
3. The market timing inancing behaviour in Latvian companies
More attention should be paid to the development of the capital structure, and how it can be affected by behavioural traits of the inancial manager (who makes decisions on capital structure). However, it is not easy
to identify the decisions of inancial manager that are not rational if the research is done by an external user of the company annual report. Therefore, as discussed previously, common practice is to conduct questionnaires. Still, since the topic of behavioural inance and capital structure is new, not much research has been done yet. Therefore, the characteristics of market timing theory were used in this paper. As D. Vasiliou and N. Daskalakis (2009) pointed out, issuing new equity in favourable times relects the market timing approach; this approach can be included in behavioural inance (irrational investor sentiment affects inancing decisions). Accordingly, another capital market – the loan market – is used in this paper.
For this study, ive companies were selected – all of them are joint stock companies (JSC) publicly traded on the Baltic main list in the Riga Stock Exchange. These companies were selected because their shares are publicly traded; therefore, annual reports are in a good quality and available online as well. In addition, these companies can be considered as leaders in Latvian market. The study uses quarterly data from corporate annual reports beginning from the year 2002 to the year 2011 (Q3). The companies included in this study have a diverse range of operations – JSC Grindeks (irst traded in 1998) and JSC Olainfarm (1997) are pharmaceutical manufacturing companies, JSC Ventspils Nafta (1998) is diversiied holding company, JSC SAF Tehnika (2004) is producing telecommunications equipment, while JSC Latvijas Kugnieciba (2002) is a shipping company.
The data of Table 1 show the correlation between the share prices [data used from 26 May 2004 (irst
Table 1
Correlation between the share prices of the companies in the study
No. JSC Ventspils
NaftaJSC SAF
JSC Olainfarm
JSC Latvijas Kugnieciba
JSC Grindeks
1. JSC Ventspils Nafta 1
2. JSC SAF 0.1117 1
3. JSC Olainfarm 0.6510 -0.1744 1
4. JSC Latvijas Kugnieciba 0.8561 -0.0805 0.4777 1
5. JSC Grindeks 0.7112 -0.2697 0.8209 0.5335 1
Source: authors’ calculation based on the data by NASDAQ OMX Riga from 26 May 2004 to 16 December 2011
Source: authors’ construction based on the data from annual reports from 2002 to 2010
Fig. 1. The structure of assets and the debt ratio of the companies in the study, in 2002 and in 2010
I. Berzkalne, E. Zelgalve Standard vs. Behavioural Finance: The Case of Capital Structure in Latvia

167
Economic Science for Rural Development Nr. 28., 2012
ISSN 1691-3078
date when all ive companies were traded publicly) to 16 December 2011]. The primary objective of correlation analysis is to measure the strength of linear association between two variables. Most correlations are positive (except for JSC SAF). JSC Ventspils Nafta/JSC Latvijas Kugnieciba and JSC Olainfarm/JSC Grindeks have a strong positive correlation (a correlation of 0.8561 and 0.8209), which is reasonable since companies operate in the same/similar industry. JSC SAF stands out since all correlations are negative and weak. In general, this topic – the correlation between the GDP growth and stock returns – is rather contradictory. Some authors support the idea that there is a strong link between the GDP growth and security prices (e.g. Duca G., 2007), however, others conclude that the average cross-country correlation between long-run GPD growth and long-run stock returns are effectively zero (e.g. Davis et al., 2010).
Since the companies have a diverse range of operations, it is understandable that the capital structure of the companies will be diverse, as well. Figure 1 shows the structure of assets (long-term investment and current assets) as well as the proportion of debt in 2002 and in 2010. There is a demonstrable difference in the structure of assets between manufacturing enterprises (for example, JSC Grindeks) and service enterprises (for example, JSC Latvijas Kugnieciba). Manufacturing enterprises have a larger proportion of current assets, while the opposite is true for the service enterprises.
The average proportion of debt has declined from 35.5% (2002) to 29.4% (2010).
The correlation between the debt ratio and the share price for two companies – JSC Olainfarm and JSC Grindeks – was calculated for further analysis (Figure 2). The comparison of these two particular companies was selected because they both operate in the same industry (therefore, better results of the analysis can be achieved). Data from Q4 of 2003 to Q3 of 2011 were used (32 periods). For JSC Olainfarm, the linear regression model was applied (R2=0.1547), however, for JSC Grindeks, the determination coeficient was the highest using the polynomial regression model (determination coeficient for this model was R2=0.4334, while for the linear model R2 was 0.3688). Therefore, the model in the case of JSC Olainfarm explains only 15% of changes in the debt ratio, while the polynomial model in the case of JSC Grindeks explains 43%. The correlation between share price and debt ratio of JSC Olainfarm is -0.39 (weak). The correlation between JSC Grindeks’ share price and debt ratio is -0.61 (medium). In general, one can conclude that if the share price increases, the debt ratio decreases, and vice versa. In addition, one can infer that JSC Grindeks’ debt ratio has a stronger correlation with the share price than JSC Olainfarm’s.
Both companies had almost the same structure of assets in 2010, while JSC Olainfarm’s debt ratio was higher than JSC Grindeks’ – 36.6% and
27.4%, respectively. If one compares some inancial
Source: authors’ construction based on the data from the annual reports and NASDAQ OMX Riga
Fig. 2. Correlation between the debt ratio and share price of JSC Olainfarm and JSC Grindeks, Q4 of 2003– Q3 of 2011
Table 2
Financial ratios of JSC Olainfarm and JSC Grindeks, in 2008 and 2009
No. Company YearLiquidity
ratioROS* ROA* ROE* RCA* RFA*
1.JSC Olainfarm
2008 1.36 -7.2 -4.8 -12.2 -11.3 -7.7
2. 2009 2.33 10.5 7.6 19.2 17.5 13.9
3.JSC Grindeks
2008 3.67 14.5 15.3 20.9 32.7 25.1
4. 2009 2.24 6.7 5.2 7.2 10.4 9.0
*ROS – return on sales, ROA – return on assets, ROE – return on equity, RCA – return on current assets, RFA – return on ixed assets
Source: authors’ calculation based on the data from the annual reports
I. Berzkalne, E. Zelgalve Standard vs. Behavioural Finance: The Case of Capital Structure in Latvia

Economic Science for Rural Development Nr. 28., 2012
ISSN 1691-3078
168
ratios (Table 2) of both companies, using data
from 2008 and 2009, one can conclude that, in 2008, JSC Grindeks had better inancial ratios (since JSC Olainfarm suffered losses in 2008, almost all ratios are negative), however, JSC Olainfarm had a slightly better inancial situation in 2009. In order to deine the factors inluencing the debt ratio, the multiple linear regression models were applied for both enterprises. The multiple linear regression model is used to study the relationship between a dependent variable and one or more independent variables. The underlying generalised model was as follows:
yi = β
0 + β
1x
i + β
2x
i + ... + β
nx
i + e
i, i = 1, ... n,
where:
yi
– dependent variable (the debt ratio);
β – parameters;
x – independent variables.
Table 3 presents the summary of the models for both enterprises. Since the external user of the inancial reports does not know the internal factors, based on which the inancial manager makes decisions on capital structure, it was decided to include such variables as Gross Domestic Product (GDP), amount of disbursed loans, interest rate (weighted average interest rate applied for disbursed loans in euro currency), share price (average of all ive companies) and share price (of particular company). The
analysis was done in three steps: 1) all ive variables were applied; 2) only variables whose coeficients were valid in step 1 (p-value less than 0.05, t-statistics more than 2, signiicance level 95%) were applied; 3) the time period was divided in two periods: Q4 of 2003 – Q3 of 2007 and Q4 of 2007– Q3 of 2011 (16+16) in order to achieve better and more aplicable results (data divided in accordance with the business cycle).
The debt ratio was analysed according to this approach. Therefore, the variables, which describe loans (the amount of disbursed loans and the interest rate) were used, however, these variables did not have valid coeficients in the irst step. The variable “amount of disbursed loans” had a valid coeficient only when applied to JSC Olainfarm from Q4 of 2003 to Q3 of 2007. In general, one can conclude that, for JSC Olainfarm, changes in the GDP and in its share price have an impact on the debt ratio, however, for JSC Grindeks, only its share price has a valid coeficient. Therefore, the market timing theory, which states that the company will raise capital if the particular capital market looks good (loan market is “hot”), is not fully applicable to these two enterprises.
Conclusions 1. It is possible to state that the standard inance uses
the concept of Homo Economicus to simplify the analysis and the indings; however, such models are not very useful. On the contrary, behavioural inance pays attention not to how investors and managers
Table 3
The summary of applied models for JSC Olainfarm and JSC Grindeks
No. Model Description
JSC Olainfarm
1. Variables: GDP, amount of disbursed loans, interest rate, share price (average) and share
price (particular company).
Multiple R = 0.69R squared = 0.48Valid coeficients – GDP and share price (particular company)
2. Variables: GDP, share price (particular company)
Multiple R = 0.64R squared = 0.40Both coeficients are valid
3. The period (32) divided in two: Q4 of 2003 – Q3 of 2007 (16) and Q4 of 2007– Q3 of 2011 (16)
1st period:
Multiple R = 0.83R squared = 0.68Valid coeficients: GDP and loans
2nd period:
Multiple R = 0.96R squared = 0.92Valid coeficients: GDP and share price (average)
JSC Grindeks
4. Variables: GDP, amount of disbursed loans, interest rate, share price (average) and share
price (particular company).
Multiple R = 0.85R squared = 0.73Only share price (particular company) is a valid coeficient
5. The period (32) divided in two: Q4 of 2003 – Q3 of 2007 (16) and Q4 of 2007– Q3 of 2011 (16)
Period 1:
Multiple R = 0.93R squared = 0.86Only share price (particular
company) has a valid coeficient.
Period 2:
Multiple R = 0.64R squared = 0.41No coeficients are valid.
Signiicant at 0.05 level
Source: authors’ calculation based on the data from the annual reports, NASDAQ OMX Riga, Financial and Capital
Market Commission, the Central Statistical Bureau
I. Berzkalne, E. Zelgalve Standard vs. Behavioural Finance: The Case of Capital Structure in Latvia

169
Economic Science for Rural Development Nr. 28., 2012
ISSN 1691-3078
should behave but how they actually behave and make decisions.
2. Recently, more research has been done and more papers have been published on behavioural inance and capital structure. Researchers are using different methods to identify behavioural traits in capital structure development – questionnaires and/or econometric methods. The methods used depend on the data available and they are also subject to the
research aim.3. On the basis of done analysis (JSC Grindeks and JSC
Olainfarm) the following conclusions are made:3.1. For JSC Olainfarm, the linear regression model
was applied (R2=0.1547), however, for JSC Grindeks, the determination coeficient was the highest using the polynomial regression model (determination coeficient for this model was R2=0.4334, while for the linear model R2 was 0.3688). Therefore, the model in the case of JSC Olainfarm explains only 15% of changes in the debt ratio, while the polynomial model in the case of JSC Grindeks explains 43%.
3.2. The correlation between share price and debt ratio of JSC Olainfarm is -0.39 (weak). The correlation between JSC Grindeks’ share price and debt ratio is -0.61 (medium). In general, one can conclude that if the share price increases, the debt ratio decreases, and vice versa. In addition, one can infer that JSC Grindeks’ debt ratio has a stronger correlation with the share price than JSC Olainfarm’s.
3.3. The variable “amount of disbursed loans” had a valid coeficient only when applied to JSC Olainfarm from Q4 of 2003 to Q3 of 2007. In general, one can conclude that, for JSC Olainfarm, changes in GDP and in its share price have an impact on the debt ratio, however, for JSC Grindeks, only its share price has a valid coeficient. Therefore, the market timing theory, which states that the company will raise capital if the particular capital market looks good (loan market is “hot”), is not fully applicable to these two enterprises.
Bibliography 1. Cronqvist, H., Makhija, A. K., Yonker, S. E. (2012).
Behavioural Consistency in Corporate Finance: CEO Personal and Corporate Leverage. Journal of
Financial Economics, Volume 103, pp. 20-40.
2. Data from the Central Statistical Bureau (2011). Retrieved: http://www.csb.gov.lv. Access: 26 December 2011.
3. Financial and Capital Market Commission (2011). Retrieved: http://www.fktk.lv. Access: 26 December 2011.
4. Graham, J. (2002). How do CFOs Make Capital Budgeting and Capital Structure Decisions? Journal of Applied Corporate Finance, Volume 15, Number 1, pp. 8-23.
5. Pompian, M. M. (2006). Behavioural Finance and
Wealth Management. New Jersey: John Wiley & Sons, Inc. p. 317.
6. Ricciardi, V., Simon, H. K. (2000). What is Behavioural Finance? Business, Education and Technology
Journal, Volume 2, Number 1, pp. 26-34.7. Schneider, S. (2010). Homo Economicus – or More
like Homer Simpson? Deutsche Bank Research. Retrieved: http://www.dbresearch.in/PROD/DBR_INTERNET_EN-PROD/PROD0000000000259291.pdf. Access: 26 December 2011.
8. Sen, M., Oruc, E. (2009). Behavioural Dimension of Cross-Sectoral Capital Structure Decisions: ISE (Istanbul Stock Exchange) Application. International
Research Journal of Finance and Economics,
Volume 28, pp. 33-41.9. Simon, H. A. (1955). A Behavioural Model of
Rational Choice. The Quarterly Journal of Economics,
Volume 69, Number 1, pp. 99-118.10. Stock Exchange NASDAQ OMX Riga (2011).
Retrieved: http://www.nasdaqomxbaltic.com. Access: 26 December 2011.
11. Vasiliou, D., Daskalakis, N. (2009). Behavioural Capital Structure: Is the Neoclassical Paradigm Threatened? Evidence from the Field. The
Journal of Behavioural Finance, Volume 10, pp. 19-32.
12. Duca, G. (2007). The Relationship Between the Stock Market and The Economy: Experience from International Financial Markets. Bank
of Valleta Review, No. 36, Autumn 2007, pp. 1-12.
13. Davis, J.H. et al. (2010). Investing in Emerging Markets: Evaluating the Allure of Rapid Economic Growth. Vanguard Research. Retrieved: https://
www.vanguardinvestments.dk/content/dk/en/articles/insights/asset-classes/investing-in-
emerging-markets.shtml. Access: 28 January
2012.
This paper has been supported by the European Social Fund within the project «Support for Doctoral Studies at
University of Latvia».
I. Berzkalne, E. Zelgalve Standard vs. Behavioural Finance: The Case of Capital Structure in Latvia

Economic Science for Rural Development Nr. 28., 2012
ISSN 1691-3078
170
K. Boratynska Predicting Bankruptcy of Selected Companies from The Polish Meat Sector
Predicting Bankruptcy of Selected Companies from The Polish Meat Sector1
Katarzyna Boratynska2, PhD.Department of Economics and Organisation of Enterprises,
Faculty of Economic Sciences, Warsaw University of Life Sciences
Abstract. The primary objective of the paper was to assess exposure of selected meat sector enterprises to bankruptcy risk. The eficiency of seven models developed by E. Maczynska and M. Zawadzki at the IES PAS was also examined to predict bankruptcy of the meat sector companies. Low production concentration is typical for the Polish meat sector. Dispersion of the meat industry is mainly attributable to low concentration of hog and bovine livestock supply as well as the increasing number of entities operating in the meat industry, especially in slaughter business. Adjustments to the EU standards led to substantial investment outlays. These factors make enterprises more exposed to the risk of bankruptcy. Therefore, managers should monitor the company situation in advance to detect early signs of bankruptcy risk. The inancial analysis of the examined enterprises revealed that mainly loss of liquidity and unproitability were the contributing factors to occurrence of the bankruptcy risk. Six out of seven models showed that Zaklady Miesne Herman has been at risk of bankruptcy since 2008; whereas, PKM Duda S.A. faced bankruptcy in 2009. Based on the calculated models, only Mispol S.A. was not exposed to bankruptcy in the analysed period. The experience of Polski Koncern Miesny Duda S.A. proves that even major inancial dificulties occurring in the years 2008-2009 do not translate into bankruptcy. PKM Duda S.A. was given a second chance by implementing a recovery plan as the irst public company and signing a rehabilitation agreement with its creditors.Key words: meat sector, bankruptcy prediction, Polish selected models of bankruptcy prediction.JEL code: G33
Introduction Functioning of any economic entity should be
monitored to detect symptoms indicating business continuity risk. Risk involved in operations of enterprises during the deepening economic crisis enhances the need for tools and methods used to predict bankruptcy, which allow assessing the probability of a company going bankrupt. Managers of companies may use the model results to make relevant business decisions in advance.
Study aim, method and tasksThe paper aims at assessing exposure of selected
meat sector enterprises to bankruptcy risk with the use of discriminant models (whose eficiency in the assessment of meat sector enterprises has also been characterised). The study was divided into several stages. First, the following study tasks were deined:1) to describe the economic situation in the meat
sector;2) to identify and evaluate the factors that drive the
Polish meat sector enterprises towards bankruptcy; 3) to assess the bankruptcy risk of selected Polish
meat companies using seven models created and developed at the Institute of Economic Sciences of the Polish Academy of Sciences by E. Maczynska
and M. Zawadzki (Maczynska E., Zawadzki M., 2006) (Table 1).
The next step was the analysis of inancial data of 212 enterprises from the meat sector, derived from their
inancial statements aggregated in the EMIS database (i.e. Emerging Markets Information Service a Product of ISI Emerging Markets) available at www.securities.com
(accessed on 12 December 2011). Factors of inancial threat and bankruptcy risk, generally conirmed by the previous studies, include lack of proit, high debt level, and inancial liquidity dificulties (Lennox, 1999/quoting Gajdka J., 2002). Therefore, a inancial result generated by companies in the years 2008-2010 was the next selection criterion. Out of 212 enterprises, 22 companies that recorded losses in the analysed period were selected for further studies. The selection based on the organisational and legal form as well as the value of assets narrowed the analysis to the following enterprises: Polski Koncern Miesny Duda S.A., Zaklady Miesne Herman S.A., and Mispol S.A. The study covers the period of 2004-2010.
Discriminant function (function Z) calculated in speciic models is the sum of products of variables “x” (i.e. coeficients that characterise inancial standing of enterprises) multiplied by coeficient weights “w” determined statistically in the model.
The value of the discriminant function in each model is determined as follows:
Z=w1*x
1 + w
2*x
2 + ….......w
n*x
n + w
0
The higher is the value of the discriminant function, the lower is the bankruptcy risk, and vice versa. A negative value of the function in the case of companies,
___________________________1 This Article was prepared in the scientiic project: Przyczyny bankructwa przedsiebiorstw w wybranych branzach przemyslu spozywczego, Decision Number: UMO-2011/01/B/HS4/00841 inanced by the Polish National Science Centre2 E-mail address: [email protected].
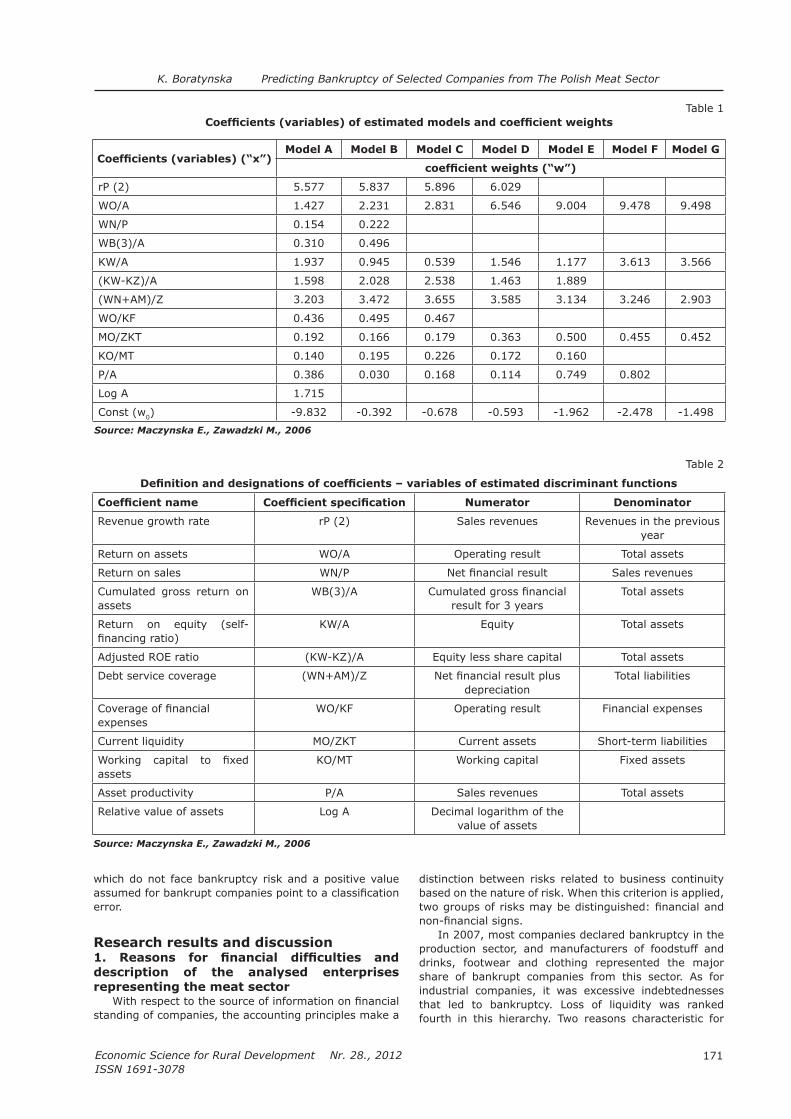
171
Economic Science for Rural Development Nr. 28., 2012
ISSN 1691-3078
which do not face bankruptcy risk and a positive value assumed for bankrupt companies point to a classiication error.
Research results and discussion1. Reasons for inancial dificulties and description of the analysed enterprises representing the meat sector
With respect to the source of information on inancial standing of companies, the accounting principles make a
distinction between risks related to business continuity based on the nature of risk. When this criterion is applied, two groups of risks may be distinguished: inancial and non-inancial signs.
In 2007, most companies declared bankruptcy in the production sector, and manufacturers of foodstuff and drinks, footwear and clothing represented the major share of bankrupt companies from this sector. As for industrial companies, it was excessive indebtednesses that led to bankruptcy. Loss of liquidity was ranked fourth in this hierarchy. Two reasons characteristic for
Table 1
Coeficients (variables) of estimated models and coeficient weights
Coeficients (variables) (“x”)Model A Model B Model C Model D Model E Model F Model G
coeficient weights (“w”)
rP (2) 5.577 5.837 5.896 6.029
WO/A 1.427 2.231 2.831 6.546 9.004 9.478 9.498
WN/P 0.154 0.222
WB(3)/A 0.310 0.496
KW/A 1.937 0.945 0.539 1.546 1.177 3.613 3.566
(KW-KZ)/A 1.598 2.028 2.538 1.463 1.889
(WN+AM)/Z 3.203 3.472 3.655 3.585 3.134 3.246 2.903
WO/KF 0.436 0.495 0.467
MO/ZKT 0.192 0.166 0.179 0.363 0.500 0.455 0.452
KO/MT 0.140 0.195 0.226 0.172 0.160
P/A 0.386 0.030 0.168 0.114 0.749 0.802
Log A 1.715
Const (w0) -9.832 -0.392 -0.678 -0.593 -1.962 -2.478 -1.498
Source: Maczynska E., Zawadzki M., 2006
Table 2
Deinition and designations of coeficients – variables of estimated discriminant functions
Coeficient name Coeficient speciication Numerator Denominator
Revenue growth rate rP (2) Sales revenues Revenues in the previous
year
Return on assets WO/A Operating result Total assets
Return on sales WN/P Net inancial result Sales revenues
Cumulated gross return on assets
WB(3)/A Cumulated gross inancial result for 3 years
Total assets
Return on equity (self-inancing ratio)
KW/A Equity Total assets
Adjusted ROE ratio (KW-KZ)/A Equity less share capital Total assets
Debt service coverage (WN+AM)/Z Net inancial result plusdepreciation
Total liabilities
Coverage of inancial expenses
WO/KF Operating result Financial expenses
Current liquidity MO/ZKT Current assets Short-term liabilities
Working capital to ixed assets
KO/MT Working capital Fixed assets
Asset productivity P/A Sales revenues Total assets
Relative value of assets Log A Decimal logarithm of the value of assets
Source: Maczynska E., Zawadzki M., 2006
K. Boratynska Predicting Bankruptcy of Selected Companies from The Polish Meat Sector

Economic Science for Rural Development Nr. 28., 2012
ISSN 1691-3078
172
this group of enterprises, which, however, did not prove so signiicant for construction and trade companies, were inappropriate structure of assets inancing and excessive production base compared with sales level. The majority of reasons were endogenous in the case of production companies.
Low production concentration is typical for the Polish meat sector, which makes it highly competitive. Competition may lower prices and proitability. Dispersion of the meat industry is mainly attributable to low concentration of hog and bovine livestock supply caused
by dispersed agricultural structure and increasing number of entities in the meat industry, especially in slaughter business, characterised by low technical and sanitary standards. One should underline that hog livestock has decreased in Poland. Insuficient livestock supply rises costs of production for companies specialised in meat processing. Dificult situation of the meat sector is also the result of the transition period (ended in 2009), during which Polish enterprises were required to undertake measures to meet the EU standards. Adjustments led to substantial investment outlays. These factors make enterprises exposed to the risk of bankruptcy. The market is being cleaned up and ineffective enterprises disappear, which will contribute to consolidation and improve production capacity of the meat sector. Between January 2008 and January 2012, approximately 200 companies suspended or ceased production.
Polski Koncern Miesny Duda (abbreviated “PKM” in the paper) is a company founded by the Duda family in 1990. PKM Duda S.A. is the leading company of the PKM Duda Group operating in the broadly-deined agricultural and foodstuff ield of the meat sector. The PKM Duda Group is a vertically integrated group of companies from the meat sector. Their activities range from livestock slaughter, meat cutting and distribution (beef, pork, wild game), and livestock breeding to growing cereals and other plant products, and manufacturing of processed meat products. The manufacturing plant is in Grabkow (Wielkopolskie voivodship). The Group has become one of the three largest entities in the Polish meat sector with FTE nearing 2,400 employees.
The year 2009 was the most dificult for the PKM Duda Group in terms of its functioning on the stock exchange market. Among the factors that mostly affected the company’s operations were the situation on the Forex market, and trends showed by the prices and supply of hog livestock. In 2009, hog livestock production fell, which translated into a decrease of pig meat production and rising prices of livestock in the irst quarter of 2009.
A company, which is a large-scale exporter, must hedge against FX risk. In 2005, PKM DUDA SA began using FX options for hedging purposes. In 2008, the Polish zloty suddenly depreciated. Between July and October, export sales totalled several million euros per month (more than 20% of the company’s turnover). Consequently, the company recorded losses on FX transactions. At the end of 2008, the accounting loss on FX options equalled PLN 29 million and continued to soar. Investors started to sell the company’s shares. The share price slumped by 40% within one week. In July 2009, the company’s debts arising under the option transactions totalled approx. PLN 88 million. After the sudden fall of the prices of the company’s shares, banks made their
demands for debt repayment, which put the company at risk of losing its liquidity and going bankrupt. Bankruptcy of PKM Duda S.A. would mean loss of employment for approx. 2.5 thousand people and pose a inancial threat to farmers since the company is the main buyer of hog livestock (Sprawozdanie zarzadu z dzialalnosci …, 2009).
The Management Board planned to improve effectiveness in the years 2010-2014 and make savings at the level of PLN 80 million (cumulated result) by implementing the restructuring programme. The largest cost savings will be mainly achieved by “building a target procurement organisation – central procurement” – approx. PLN 27 million, coherent model and policy of distribution management – approx. PLN 31 million and optimisation of employment costs – approx. PLN 14 million (Sprawozdanie zarządu z dzialalnosci …, 2009).
On 23 December 2009, the company and a syndicate of banks including Kredyt Bank S.A., Bank Polska Kasa Opieki S.A., Powszechna Kasa Oszczedności Bank Polski S.A., ING Bank Slaski S.A., Bank Zachodni WBK S.A., BRE Bank S.A., and Bank Handlowy, concluded a syndicated consolidation loan agreement under which the company obtained inancing of PLN 102,908 million in total to repay the debts due to the bank lenders arising under loans and
sureties that are subject to restructuring as stipulated by
the recovery plan in force. In the fourth quarter of 2009, PKM Duda S.A. fulilled its obligations related to closing of the rehabilitation procedure.
The company “Zaklady Miesne Herman SA” analysed in this paper is located in Hermanowa, Tyczyn municipality, Rzeszowski poviat, Podkarpackie voivodship. The company employs approx. 220 people and supplies more than 500 customers, including Makro, Real, Carrefour, Kauland, and Auchan store chains. The inancial situation of the company started to worsen in 2008. The following factors contributed to this worsening: growing costs of labour, power supply, fuel, transport, and animal stock. The Management Board of the company stressed that the results in 2008 were adversely affected by the chain of own stores and took the decision to sell nearly 50 retail stores. A recovery plan was formulated based on which the company was provided by its shareholders with a sale and lease back of PLN 1.5 million. These funds will be allocated for reduction of debt and current activity. The recovery plan assumes downsizing of operating costs, improvement of proitability of products, closing of approx. 10 unproitable stores, which generate losses, and sale of non-core assets.
The company Mispol S.A. is a manufacturer and distributor of canned meat, pâtés and pre-cooked meals. The Mispol S.A. Group operates through its four production plants in Poland (two plants in Suwalki and two factories in Bialystok), one plant in Grodno, and three plants in the Czech Republic. Mispol S.A. recorded a negative net working capital in the years 2007-2008 and in 2010. In 2010, the value of short-term liabilities rose by over 500% compared with 2006. Factors that could testify to a worsening inancial condition included growth of the liabilities in total, low liquidity ratios, low proitability, and net loss incurred in the years 2008-2009, loss of the controlling interest and winding-up of one of the acquired companies, and high level of investment inanced mainly by short-term liabilities.
K. Boratynska Predicting Bankruptcy of Selected Companies from The Polish Meat Sector

173
Economic Science for Rural Development Nr. 28., 2012
ISSN 1691-3078
Table 3
Financial ratios used for calculation of the IES PAS models
Coeficients (variables) Enterprises
Years2004 2005 2006 2007 2008 2009 2010
rP Polski Koncern
Miesny Duda S.A. 0.63 0.63 0.20 0.27 0.10 0.08 -0.08
Zaklady Miesne Herman S.A. - -0.02 -0.01 -0.13 -0.01 -0.03 -0.03
Mispol S.A. 0.33 0.25 0.40 0.75 0.35 0.16 0.02WO/A Polski Koncern
Miesny Duda S.A. 0.08 0.08 0.11 0.06 0.08 -0.31 0.07
Zaklady Miesne Herman S.A. -0.03 0.04 0.05 0.04 -0.10 -0.12 -0.07
Mispol S.A. 0.02 0.16 0.12 0.06 0.03 0.02 0.03WN/P Polski Koncern
Miesny Duda S.A. 0.04 0.03 0.05 0.03 -0.01 -0.21 0.02
Zaklady Miesne Herman S.A. -0.01 0.01 0.01 0.01 -0.06 -0.05 -0.04
Mispol S.A. -0.02 0.08 0.08 0.05 -0.01 -0.02 0.0004WB(3)/A Polski Koncern
Miesny Duda S.A. 0.13 0.17 0.20 0.16 0.09 -0.42 -0.41
Zaklady Miesne Herman S.A. -0.04 -0.01 0.02 0.09 -0.04 -0.21 -0.33
Mispol S.A. -0.03 0.12 0.15 0.13 0.08 0.03 -0.01KW/A Polski Koncern
Miesny Duda S.A. 0.45 0.44 0.45 0.51 0.35 0.30 0.39
Zaklady Miesne Herman S.A. 0.66 0.68 0.45 0.47 0.52 0.47 0.39
Mispol S.A. 0.25 0.37 0.74 0.44 0.39 0.43 0.45(KW-KZ)/A Polski Koncern
Miesny Duda S.A. 0.33 0.34 0.37 0.40 0.26 0.0002 0.001
Zaklady Miesne Herman S.A. 0.16 0.14 -0.01 0.01 -0.08 -0.22 -0.30
Mispol S.A. 0.23 0.35 0.73 0.43 0.38 0.42 0.44(WN+AM)/Z Polski Koncern
Miesny Duda S.A. 0.16 0.16 0.21 0.16 0.03 -0.56 0.14
Zaklady Miesne Herman S.A. 0.13 0.35 0.14 0.16 -0.08 -0.07 -0.004
Mispol S.A. 0.04 0.28 0.43 0.12 0.04 0.03 0.06WO/KF Polski Koncern
Miesny Duda S.A. 4.28 2.86 6.73 3.16 0.80 -1.78 2.25
Zaklady Miesne Herman S.A. -2.40 4.85 5.01 2.25 -5.69 -16.57 -5.70
Mispol S.A. 0.42 6.29 3.97 2.21 0.61 0.50 1.21MO/ZKT Polski Koncern
Miesny Duda S.A. 1.15 1.42 1.39 1.05 0.72 0.53 1.00
Zaklady Miesne Herman S.A. 0.97 1.30 1.31 1.23 0.83 0.66 0.88
Mispol S.A. 1.23 1.16 2.56 0.80 0.75 1.09 0.77KO/MT Polski Koncern
Miesny Duda S.A. 0.09 0.22 0.19 0.03 -0.20 -0.35 -0.0002
Zaklady Miesne Herman S.A. -0.01 0.07 0.08 0.08 -0.07 -0.15 -0.06
Mispol S.A. 0.17 0.16 0.66 -0.17 -0.24 0.05 -0.18P/A Polski Koncern
Miesny Duda S.A. 1.35 1.86 1.75 1.51 1.33 2.10 1.86
Zaklady Miesne Herman S.A. 2.15 2.29 1.95 1.68 2.02 2.25 2.19
Mispol S.A. 1.68 1.66 1.04 0.85 1.00 1.24 1.17Log A Polski Koncern
Miesny Duda S.A. 5.60 5.67 5.78 5.94 6.04 5.87 5.89
Zaklady Miesne Herman S.A. 4.45 4.41 4.48 4.48 4.40 4.34 4.34
Mispol S.A. 4.53 4.64 4.99 5.32 5.38 5.35 5.38 Source: author’s calculations based on the Financial Statements of researched companies
K. Boratynska Predicting Bankruptcy of Selected Companies from The Polish Meat Sector

Economic Science for Rural Development Nr. 28., 2012
ISSN 1691-3078
174
Table 4
Results of the models created by Maczynska and Zawadzki at the IES PAS
Coeficients (variables) Enterprises
Years
2004 2005 2006 2007 2008 2009 2010
Model A Polski Koncern
Mięsny Duda S.A. 7.98 7.75 7.46 6.31 3.39 -1.05 2.90
Zaklady Miesne Herman S.A. -0.34 3.60 2.38 0.53 -3.43 -8.72 -3.98
Mispol S.A. 1.86 5.60 7.88 6.95 3.67 2.78 2.41
Model B Polski Koncern
Mięsny Duda S.A. 7.55 6.97 6.69 5.04 1.89 -3.33 1.29
Zaklady Miesne Herman S.A. -0.05 4.42 3.34 1.39 -3.29 -9.25 -3.77
Mispol S.A.2.90 6.92 8.53 7.12 3.44 2.43 2.04
Model C Polski Koncern
Mięsny Duda S.A. 7.38 6.90 6.49 4.88 1.78 -3.43 1.32
Zaklady Miesne Herman S.A. -0.11 4.22 3.05 1.10 -3.42 -9.03 -3.77
Mispol S.A.2.93 6.82 8.48 6.96 3.32 2.38 1.96
Model D Polski Koncern
Mięsny Duda S.A. 6.07 6.25 4.06 3.93 1.94 -3.31 1.06
Zaklady Miesne Herman S.A. 1.53 2.80 1.57 0.85 -0.39 -0.94 -0.52
Mispol S.A. 3.06 4.69 7.52 6.42 3.36 2.43 1.66
Model E Polski Koncern
Mięsny Duda S.A. 2.01 2.56 2.95 2.10 1.08 -4.37 1.46
Zaklady Miesne Herman S.A. 1.35 2.94 1.57 1.36 -0.74 -1.13 -0.64
Mispol S.A.0.97 3.30 4.88 1.29 0.70 1.09 1.09
Model F Polski Koncern
Mięsny Duda S.A. 2.03 2.53 2.91 2.14 1.04 -4.22 2.00
Zaklady Miesne Herman S.A. 2.21 3.92 2.24 2.03 0.19 -0.04 0.41
Mispol S.A. 0.65 3.14 4.73 1.12 0.49 0.85 0.92
Model G Polski Koncern
Mięsny Duda S.A. 1.85 1.94 2.39 1.83 0.92 -4.76 1.42
Zaklady Miesne Herman S.A. 1.39 2.91 1.58 1.58 -0.45 -0.87 -0.39
Mispol S.A. 0.26 2.68 4.69 1.35 0.63 0.81 0.91 Source: author’s calculations based on the Financial Statements of researched companies
2. Study resultsTable 3 presents the calculated coeficients with which
discriminant functions will be illed in. When analysing the inancing ratios, one should emphasise a negative return on sales noted by all the analysed entities in the
years 2008 and 2009. Zaklady Miesne Herman showed a negative revenue growth rate and negative return on assets as well as lack of debt service coverage starting from the year 2008. In the years 2006-2009 (2006 to 2008 in Mispol S.A), the current liquidity ratio fell
substantially below the threshold recommended by banks. ROE has decreased in the majority of the analysed companies since 2007.
Table 4 presents the results for the models created and developed by Maczynska and Zawadzki at the IES PAS (Maczynska E., Zawadzki M., 2006). It should be highlighted that the results of the traditional ratio analysis
covering the examined entities are mainly consistent with the results of the analysis based on discriminant models. The study shows that despite a different set of coeficients
K. Boratynska Predicting Bankruptcy of Selected Companies from The Polish Meat Sector

175
Economic Science for Rural Development Nr. 28., 2012
ISSN 1691-3078
and level of weights used in the analysed models, they give comparable results. The majority of the models (except F) showed that Zaklady Miesne Herman had been at risk of bankruptcy since 2008; whereas, PKM Duda S.A. faced bankruptcy in 2009.
Based on the calculated models, only Mispol S.A. was not exposed to bankruptcy in the analysed period. It seems that the models relect well the economic situation of enterprises operating during the inancial crisis. The model results have been visibly worse since 2008 (beginning of the crisis marked by the decline of Lehman Brothers). The obtained results and the analysis of warning signs detectible in enterprises show that the models were well-selected to assess the bankruptcy risk and constitute a useful tool for company managers.
Conclusions, proposals, recommendations
The performed analysis leads to the following conclusions:
1. Models developed at the IES PAS by E. Maczynska and M. Zawadzki allow eficient assessing of bankruptcy risk. Despite the fact that the model-related writings state that models show the highest eficiency when used for a sample of enterprises based on which they are developed, they enable to assess the analysed enterprises from the meat sector and relect inancial dificulties faced by the companies.
2. The managers should use discriminant models to respond in advance to inancial and non-inancial signs of bankruptcy risk. Such approach would allow implementing a recovery plan and company restructuring. Most companies, however, choose liquidation since it is frequently too late for any remedy measures.
3. Factors pointing to the worsening inancial condition of the analysed companies include, among others, systematic decrease of sales revenues, occurrence and further deepening of the net loss or net proit showing a signiicant decrease, lower liquidity
triggering excessive growth of liabilities, growing demand for loans and credit facilities (in general short-term inancing) and defaulting on loan debts, sales of ixed assets, and long-lasting negative operating cash lows. One should underline the speciic nature of the operations of the meat sector enterprises, which are characterised by very low concentration of production.
4. Discriminant models should be updated on an ongoing basis and cannot be the only tool used to
predict bankruptcy.
Bibliography 1. Financial Statements of Researched Companies,
namely, Polski Koncern Miesny Duda S.A. Zaklady Miesne Herman S.A., Mispol S.A. (collected in the EMIS database (i.e. Emerging Markets Information Service a Product of ISI Emerging Markets). Retrieved: www.securities.com. Access: 12 December 2011.
2. Gajdka, J. (2002). Teorie struktury kapitalu i ich aplikacja w warunkach polskich. (Theories of Capital Structure and its Application in Polish Conditions). Wyd. Uniwersytetu Lodzkiego, Lodz, pp. 167 - 178.
3. Maczynska, E., Zawadzki, M. (2006). Dyskryminacyjne modele predykcji bankructwa przedsiebiorstw. (Discriminant Models for Bankruptcy of Enterprises Prediction). Ekonomista, 2006, nr 2, p. 21. Retrieved: http://www.pte.pl/pliki/2/12/Ekonomista%2025%2002%2006ostfragment.pdf. Access: 5 January 2012.
4. Sprawozdanie zarzadu z dzialalnosci Grupy Kapitalowej PKM Duda za 2009 rok. (Board of Management’s Statement of Grupa Kapitalowa PKM Duda Activity for 2009). Retrieved: http://inwestycje.pl/emitent/PAP/dane/20100504_072731_0000143854_Sprawozdanie_zarzadu_2009_skons.pdf. Access: 15 January 2012.
K. Boratynska Predicting Bankruptcy of Selected Companies from The Polish Meat Sector

Economic Science for Rural Development Nr. 28., 2012
ISSN 1691-3078
176
A. Danilowska Cooperative Banks and a Problem of Adverse Selection in Agricultural Credit Market
Cooperative Banks and a Problem of Adverse Selection in Agricultural Credit Market
Alina Danilowska1
Professor of Warsaw University of Life Sciences –SGGWDepartment of Economics and Economic Policy, Warsaw School of Life Sciences-SGGW, Poland
Abstract. The aim of the paper is to examine how the cooperative banks in Poland consider the role of the informal information and reputation of farmers in overcoming the problem of adverse selection on agricultural credit market. The information from the author’s survey was used in the analysis. The examination showed that cooperative banks as agents, which operate in local societies, use informal information about the potential borrowers in the process of allowing credits. Moreover, the results of survey conirm the role of reputation in economic relations as managers of cooperative banks admitted that they considered it. The low level of impaired loans in cooperative banks can partly stem from application of these tools aimed at solving of the adverse selection problem.Keywords: adverse selection, agricultural credit market, cooperative bank.JEL code: G21
IntroductionAsymmetric information is often deined as the
situation that occurs when at least one participant of contract has information advantage over other participants. This type of asymmetric information is better recognised compared with the second type, which takes place when each party of the transaction knows the full truth of what has occurred, but it is costly to disclose the facts to anyone other than an on-site observer
(Williamson O., 1985). The credit market is especially sensitive to the problem of asymmetric information, and the irst type of it is typical for this market.
Asymmetric information in the credit transactions refers to the situation when the borrowers have better information about their ability and willingness to repay loan than the lenders. Borrowers know their actual plans concerning the using of the money (the problem of credit fungibility occurs), real proitability of the project, and other important factors.
The asymmetric information is strictly connected with problems of adverse selection and moral hazard. The former is sometimes described as precontractual asymmetric information, while the latter - the post contractual asymmetric information. They are very important phenomena because, as the Furuboton and Richter (2003) noticed “The better informed party is
tempted to engage in precontractual opportunism2 in
the irst case and post contractual opportunism in the second”.
The aim of the paper is to examine how the cooperative banks in Poland consider the role of the informal information and reputation of farmers in overcoming the problem of adverse selection on agricultural credit market.
The study concerns particularly the following problems: (i) advantage of the cooperative banks on commercial banks in granting credit to farmers due to
their embedment in local society; (ii) the role of informal information in overcoming the information problem on agricultural credit market; and (iii) the role of farmers’ reputation in the process of granting credits to them by cooperative banks.
Materials and methods The author’s survey on the determinants of granting
agricultural credits by cooperative banks is the main source of data. It encompassed all cooperative banks in Poland (the banks’ chairmen). The investigation was carried out in two steps. In January of 2008, the cooperative banks belonging to one from three afiliations of cooperative banks were examined and in February of 2009, the banks afiliated in two others. As a result, totally 161 questionnaires were obtained (from about 28% of all cooperative banks in Poland). The assumption on embedment of cooperative banks in local societies was taken in the survey. The oficers of cooperative banks are the members of the local community; they take part in its daily life, know people, and have access to different informal information about neighbours. Under such circumstances, the problem of inluence of informal information and opinions of different character on the process of granting credit arise. It can be connected with the sources of advantages of cooperative banks over commercial banks in rural areas. The data of more general character were mainly taken from annual reports of the Polish Financial Supervision Authority, and the Central Statistical Ofice. They are for the years 2000-2009.
Some different methods were applied to achieve the aim of the analysis. The descriptive method is used in the part devoted to the theoretical aspects of asymmetric information in credit market. It is supplemented by comparative method when it comes to the characteristics
___________________________1 E-mail address: [email protected] The term of “opportunism” is used in the paper as Williamson deined “some individuals are likely to be dishonest in the sense that they may disguise preferences, distort data, or deliberately confuse issues” (Williamson 1985).

177
Economic Science for Rural Development Nr. 28., 2012
ISSN 1691-3078
of the agricultural credit market. Data were analysed with the use of the descriptive statistical method.
The problem of adverse selection in credit market
The adverse selection in the credit market occurs because the risky borrowers are those, who are most likely to gamble with both their own and other’s funds, while conservative borrowers are less likely to suffer losses and need a loan (Knoop T. A., 2008). The agents with unfavourable characteristic are more active in the process of applying for the credit than honest, less risky agents. They can accept worse terms of credit if they do not plan to fulil them in the future. Because the lenders are aware of this phenomenon, they use credit selection that entails externalities for honest and less risky potential borrowers in the form of longer procedure of lending, stricter assessment of creditworthiness, or shortages of credit. These activities generate the transaction costs for the borrowers as well as for the creditors. The resolving of the asymmetric information problem is in the interest of the creditors as well as the borrowers if they want to participate in credit market, because as Akerlof (1970) in his famous paper “The Market for Lemons…” showed, the adverse selection can lead to market breakdown.
The market participants on both sides of credit market have invented some devices, which help them resolve the problem of adverse selection. On the borrower’s side, the signalling - mainly reputation is important. In the case of banks, they use appraisal in a form of evaluation of creditworthiness and credit application. During this process, the experiences from long-term relations between banks and applying client (the so-called credit history) are taken into account. The costs connected with these and other devices can be quite high. They are only a part of transaction costs connected with the credit transaction. Van Empel (2001) indicates that many farmers in transition countries have not access to credit because of high transaction costs related to the
value of credit. In the case of banks, as respond to high transaction costs, they can exclude groups of agents when the costs of their service compared with the value of transaction (credits) are relatively high. Farmers are often given as the example of such groups. According to Danilowska (2007), transaction costs of agricultural bank credits for individual farmers can be estimated at 3-5 per cent of bank credit values. The size of transaction costs did not discourage farmers from taking credits.
The characteristics of agricultural credit market in Poland
The agricultural credit market in Poland is a rather small segment of credit market for non-inancial sector3 (Table 1). Their share in credits for non inancial institutions was going down gradually in the course of 2002-2009 (except of 2004) and in 2009, the share was at 3%. This level corresponds to the role of agriculture in the Polish economy, where the share of agriculture in GDP in 2009 was at nearly the same level. However, the decrease stemmed from higher dynamics of credits for other kinds of credits, especially the real estate credits and lower dynamics of agricultural credits.
The data about the internal structure of agricultural
credits shows that the credits for individual farmers prevailed and a noticeable increase of their share in total
agricultural credits took place. At the end of the examined period it was at 90%.
Polish agriculture is supported by the government in the form of subsidised credits. These credits have been allowed since the beginning of the transition until now. On the EU membership conditions, they are granted in the frame of the so-called domestic support. The data relected the scope and signiicance of this intervention for agricultural credit market. According to the data, this intervention was very important. In 2004, the share of preferential credits in total credits was close to 90%. In the following years, the level of this indicator decreased noticeably but it is still very high.
___________________________3 Non-inancial sector consists of enterprises, households, non-proit institutions serving households
Table 1
The characteristic of agricultural credit market
Year
Credits for agriculture/credits
for noninancial sector(%)
Credits for individual farmers/agricultural credits
(%)
Share of cooperative banks in agricultural
credits(%)
Preferential credits for agriculture/ credits for
agriculture(%)
2002 6.88 61.48 41.92 82.73
2003 6.60 66.90 47.00 60.91
2004 7.16 63.70 45.41 87.95
2005 5.13 83.01 60.60 78.92
2006 4.96 85.14 64.69 80.14
2007 4.26 87.83 66.11 81.87
2008 3.20 89.89 67.62 78.82
2009 3.10 90.78 68.65 76.44Source: author’s calculations based on the data from Bilansowe wyniki inansowe bankow w 2002-2004, Monitoring of banks 2005 - 2010 GUS, Warsaw 2003, 2004, 2005, 2011
A. Danilowska Cooperative Banks and a Problem of Adverse Selection in Agricultural Credit Market

Economic Science for Rural Development Nr. 28., 2012
ISSN 1691-3078
178
The credits are allowed by cooperative and commercial banks. The role of cooperative banks was rising in agricultural credit market and at the end of 2009, their share in agricultural credit market reached 70%. Detailed data about the activity of cooperative banks in this market shows that cooperative banks were especially important for the individual farmers. At the end of the examined period, the share of these banks in individual farmers’ debt reached 75%, in the case of commercial credits, the scope of their engagement was much higher and was over 90%. The share of cooperative banks in the debt of agricultural enterprises was rising gradually but at the end of 2009, it was three times lower than the share of commercial banks.
Granting credits for agriculture is a very important activity for cooperative banks, while for commercial banks it is rather marginal (Table 3). In commercial banks, in 2002, the share of credits for agriculture in credits for non-inancial sector was 4%, while seven years later it was only 1%. In 2002, in cooperative banks nearly 47% of the credits for non-inancial sector was due to agricultural credits. This share decreased noticeably during next seven years but remained still high – 37%. Because individual farmers are the main group of economic agents that conduct the agricultural activity, their share in debt was a little lower.
It is interesting to know how the cooperative banks consider the role of farmers among other groups of their
clients. In the survey, the banks were asked to indicate the importance of farmers among other groups of clients like individual entrepreneurs, enterprises, individuals, and local governments.
The survey showed that as many as 59% of the inquired cooperative banks indicated farmers as the main group of their clients. Much smaller group of banks (15.6%) declared that farmers were on the second place among their clients; and for nearly 7.5% of banks farmers were on the third place. It is interesting that one of the enquired bank declared that it did not service agriculture at all.
How cooperative banks sort out the problem of adverse selection in agricultural credit market
Cooperative banks face the problem of adverse selection in credit market. Because of the important role of farmers as their clients, it is interesting to know the scope of adverse selection problem connected to this group of clients and how the banks manage that problem.
The data about the problem of impaired loans in the banking sector showed that in general farmers are very credible borrowers. The proportion of impaired loans in loans granted to them is much lower compared with other groups of the borrowers. Worsening of the indicators for every group of clients is a negative phenomenon.
Table 2
The role of cooperative banks in rural credit market
Speciication 2000 2003 2005 2007 2009
Share of cooperative banks in individual
farmers’ debt (%) 52.3 66.7 70.1 72.5 73.2
Share of cooperative banks in agricultural
debt of enterprises (%) x 7.0 15.4 20.8 24.20
Share of cooperative banks in individual
farmers debt due to commercial credits (%) 49.7 89.3 94.6 93.3 90.9
Share of cooperative banks in farmers’ bank debt due to preferential credits (%) 52.8 62.7 63.0 67.7 67.5
x - data not available Source: author’s calculations based on the data from Bilansowe wyniki inansowe bankow w 2002-2004, Monitoring of banks 2005 - 2010 GUS, Warsaw 2003, 2004, 2005, 2011
Table 3
The role of agricultural agents for the banks by the organisational form
Speciication 2002 2003 2004 2005 2006 2007 2008 2009
Agricultural credits/credits for non-inancial sector in: (%)
-commercial banks 4.3 3.8 4.2 2.2 1.9 1.5 1.1 1.0
-cooperative banks 47.0 46.2 44.3 43.3 45.7 43.2 40.0 37.0
Credits for individual farmers/credits for non-inancial sector in: (%)
-commercial banks 1.58 1.58 1.60 1.37 1.26 1.10 0.83 0.80
-cooperative banks 44.7 43.8 41.9 41.5 43.5 41.7 38.7 35.8Source: author’s calculations based on the data from Bilansowe wyniki inansowe bankow w 2002-2004, Monitoring of banks 2005 - 2010 GUS, Warsaw 2003, 2004, 2005, 2011
A. Danilowska Cooperative Banks and a Problem of Adverse Selection in Agricultural Credit Market

179
Economic Science for Rural Development Nr. 28., 2012
ISSN 1691-3078
Comparison of impaired loans between two sectors of banking demonstrates that the scope of the problem of repayment of debts is bigger in commercial sector of banking. The share of impaired loans in total loans of the different groups of clients was much lower in cooperative banks than commercial ones.
Banks have to deal with asymmetric information and adverse selection. As aforementioned, evaluation of the credit application is the most important way to overcome the problem of adverse selection used by banks. Cooperative banks exploit this tool, however, they do not use as formalised multidimensional ways of evaluation as commercial banks do because they are smaller and their organisational structure is much more lat. Generally, 47% of responding banks admitted that they had special procedure for assessing the farmers’ application for credits.
The characteristic feature of cooperative banks is
their local character. The bank oficers live in the local society. They possess a very vast range of information about their clients regarding their economic and inancial situation as well as other information like family network and social behaviours, character, reputation etc. Of course, employees of commercial banks are in the same situation, but the procedures of granting credits in their banks are generally very centralised and there is rather
no possibility to use this “knowledge”. Most chairmen of banks (82.5%) admitted that informal information about the applicant’s economic situation or of other character inluenced the inal decision during the evaluation of credit application, 2% took them into account if the information was veriiable. Only 11% of respondents declared that the informal information did not play any role4 in their banks.
The other aspect, which can inluence the evaluation of the credit application is the client’s credit history. Nearly all chairmen admitted that they paid attention to it, however, signiicance of it differed among banks. For 91% of respondents, it is a considerable factor, whereas for 8% it is of rather low importance.
The signalling is indicated in overcoming the problem of adverse selection. The reputation of the better informed part of transaction can be treated as a form of it. The importance of this instrument depends on sensitivity of
creditor to this tool. The reputation is quite ambiguous term, so the differences between reputation and credit history were indicated in the review by this question. The data showed that in cooperative banks this factor was appreciated. Totally, 42% of respondents declared that the role of reputation was important, while 55% observed it but considered it as not very important.
It is interesting that cooperative banks evaluate very
high the creditworthiness of farmers. According to the 89.3% of respondents, farmers are more credible than enterprises, 90.2% of them think that farmers are more credible than individual entrepreneurs are, and 85.3% - than individuals are. This positive opinion inluences the interest rate on credits granted to farmers only in 45.9% banks.
Conclusions1. Cooperative banks notice the problem of adverse
selection and try to sort out this through the
evaluation of creditworthiness of borrowers (farmers).
2. In spite of the fact that farmers were the most important group of borrowers for the majority of cooperative banks and that the agricultural activity is
speciic, more than 50% of cooperative banks did not have any special methods of evaluation of farmers’ credit applications.
3. During the process of evaluation of farmers’ credit applications banks, took into account different information. The credit history was an important factor but not crucial one.
4. Cooperative banks as organisations, which operate in local societies, use informal information about the potential borrowers in the process of allowing credits.
5. The results of survey conirm the role of reputation in economic relations. The local character of cooperative banks allows them to use this feature in allowing credit process.
6. The most general conclusion concerns the ability of cooperative banks to resolve the problem of adverse selection. It seems that although cooperative banks did not use very advanced techniques and methods of dealing with asymmetric information,
___________________________4 In the case of 3% respondents, there is lack of answer.
Table 4
The impaired loans by groups of clients and banking sectors
Speciication 2009 2010 Speciication2008 2009 2010
CoB CmB CoB CmB CoB CmB
Proportion of impaired loans in loans to:(%)
-individual farmers
-individual entrepreneurs
-enterprises
3.0
8.7
11.6
3.3
10.4
12.4
Proportion of impaired loans in loans to:(%)
-individual farmers and individual entrepreneurs
-enterprises
3.0
6.5
7.6
6.7
3.1
7.9
8.4
12.2
3.8
9.2
9.6
12.8 CoB – cooperative banks, CmB – commercial banks Source: Report on the condition of Polish banks in 2010. The Polish Financial Supervision Authority,
www.knf.gov.pl/en/about_the_market/Banking
A. Danilowska Cooperative Banks and a Problem of Adverse Selection in Agricultural Credit Market

Economic Science for Rural Development Nr. 28., 2012
ISSN 1691-3078
180
in particular adverse selection, they manage the problem of adverse selection better compared with the commercial banks. However, the low share of impaired credits can be a result not only of this management but of the set of different factors as well, for example, the sanctions for delays in repayment in the case of preferential credits.
Bibliography1. Akerlof, G.A. (1970). The Market for “Lemons”:
Quality Uncertainty and the Market Mechanism. The Quarterly Journal of Economics, Vol. 84, Issue 3 (Aug., 1970), pp. 488-500.
2. Bilansowe wyniki inansowe bankow w 2002-2004. GUS, (The Financial Performance of Banks), GUS, Warsaw 2003, 2004, 2005.
3. Danilowska, A. (2007). Poziom, zroznicowanie oraz uwarunkowania kosztow transakcyjnych kredytow i pozyczek rolniczych (The Scope, Differentiation, and Determinants of Transaction Costs of Agricultural
Credit and Loans). Wydawnictwo SGGW, Warszawa, p. 228.
4. Furubotn, E.G., Richter, R. (2003). Institutions and
Economic Theory, Ann Arbor, The University of Michigan Press, Michigan, p. 556.
5. Knoop, T.A. (2008). Modern Financial Macroeconomics. Blackwell Publishing, (Malden USA, Oxford UK Carlton Australia), p. 224.
6. Monitoring of Banks 2005 – 2010. GUS, Warsaw 2011.
7. Report on the Condition of Polish Banks in 2010. Retrieved: http:www.knf.gov.pl/en/about_the_market/Banking. Access: 4 January 2012.
8. Van Empel, G. (2001). Agricultural and Rural Co-operative Banking: EU. Experiences and Lessons for Emerging Markets. Agricultural Finance and Credit
Infrastructure in Transition Economies. Focus on
South Eastern Europe, Proceedings of OECD Expert Meeting, Portoroz, Slovenia, May 2001, OECD, pp. 125-135.
9. Williamson, O. E. (1998). Ekonomiczne instytucje kapitalizmu (The Economic Institutions of Capitalism), Wydawnictwo Naukowe PWN, Warszawa, p. 342.
A. Danilowska Cooperative Banks and a Problem of Adverse Selection in Agricultural Credit Market

181
Economic Science for Rural Development Nr. 28., 2012
ISSN 1691-3078
W. Heijman et al. Regional Competitiveness, Social and Intellectual Capital
Regional Competitiveness, Social and Intellectual Capital
Wim Heijman1, professor; Johan van Ophem2, Dr., associate professorWageningen University
Urszula Bronisz3, Dr.Maria Curie-Sklodowska University
Abstract. The article aims to shed light on competitiveness from a regional perspective and examines the contribution of social capital and intellectual capital to this phenomenon. Further, the concepts of competitiveness, social capital, and intellectual capital are operationalised and applied to Poland. In the paper, the authors evaluated the performance of competitiveness of 16 Polish regions and explored the relationship between social and intellectual capital on the one hand and competitiveness of the 16 Polish regions that correspond to the EU NUTS II level on the other hand.Key words: regional competitiveness, Polish regions, social capital, intellectual capital.JEL code: R11
___________________________1 E-mail address: [email protected] E-mail address: [email protected] E-mail address: [email protected]
IntroductionCompetitiveness has an immense impact on regional
development and growth. It is “a way of discussing the
relative performance of economies in a benchmarking
sense. It can help identify areas of the economy that
are lagging behind but not the reason for those lags” (Dunning J., Bannerman E., Lundan S.M., 1998). The Global Competitiveness Report created by the World Economic Forum (WEF, 2004) ranks countries according to certain key features that affect and improve competitiveness. The WEF pointed out twelve pillars of components that made a country or region competitive. Three most important pillars of competitiveness have been constructed to provide a shorter and less complex version of the Global Competitiveness Index, namely, the Growth Competitiveness Index. This index consists of variables grouped together under Technology and
Innovation, Institutions, and Macroeconomic structure. According to the representatives of the WEF, these are the most important factors of national economies that provide comprehensive picture of competitiveness. There are institutions like the World Economic Forum, which use, what one can call an ex-ante approach to observe the potential level of competitiveness of nations. There is also a second method, which relies on the revealed outcomes of competitiveness, an ex post approach. The competitiveness ranking used in this paper will apply both perspectives and combine them into one approach. Competitiveness is affected and described by many different factors. Social and intellectual capital are two forms of capital to which a lot of attention has been paid in recent literature on the economic development. Social capital is commonly thought as a fourth form of capital, along with inancial, human, and physical one. Like the other forms, it is an important determinant of prosperity and its purpose is to make productive activity possible (Coleman J.S, 1998). Although, the deinition of social capital has remained elusive and ambiguous, this notion is also considered as an important factor in explaining economic success. Hanifan has deined it as ”those
tangible substances that count for most in the daily lives
of people: namely good will, fellowship, sympathy, and
social intercourse among the individuals and families
who make up a social unit“ (Hanifan L.J., 1916). Social capital is the opposite of physical capital, which comprises land, buildings, and all other forms of private or public owned physical capital. Much of the general literature concerning social capital is focused on using it
to build human capital, in the sense of developing strong communities. However, in recent years, a research has grown up around social capital building for community development (Servan L., 1997) and for economic development. Relationships between individuals, norms, and trust, all help facilitate coordination and cooperation that enhance productivity (Routledge B.R., von Amsberg J., 2002). Putnam et. al (Putnam R.D., Leonardi R., Nanetti R.Y., 1993) emphasise that traditions of civic engagement, voter turnout, active community group, and other manifestations of social capital are necessary for both good government, and economic and inancial development. Over the past few years, there has been increasing focus on the issue called knowledge paradigm. In the economy based on information and knowledge, these intangible assets have gained in importance and become perceived as the undeveloped source of future success and a key determinant of development and competitiveness. The concept of intellectual capital is a new way of thinking about new forms of economic value. Knowledge is considered as the key factor of success and foundation of competitive advantage (Bradley K., 1997, Bonits N., 2004; Daley J., 2001; Edvinsson L., 2002; Edvinsson L., and Stenfelt C., 1999; Malhotra Y., 2000; Pasher E., 1999). Intellectual capital is comprehended as a multidimensional concept that is relected in a variety of deinitions, different components, and features. One of the widely used deinitions explains it as the difference between the market value and the book value of the irm (Brooking A., 1997; Daley J., 2001; Pasher E., 1999; Petrash G., 1996). According to Bontis (Bontis, 2004), IC is ”hidden values
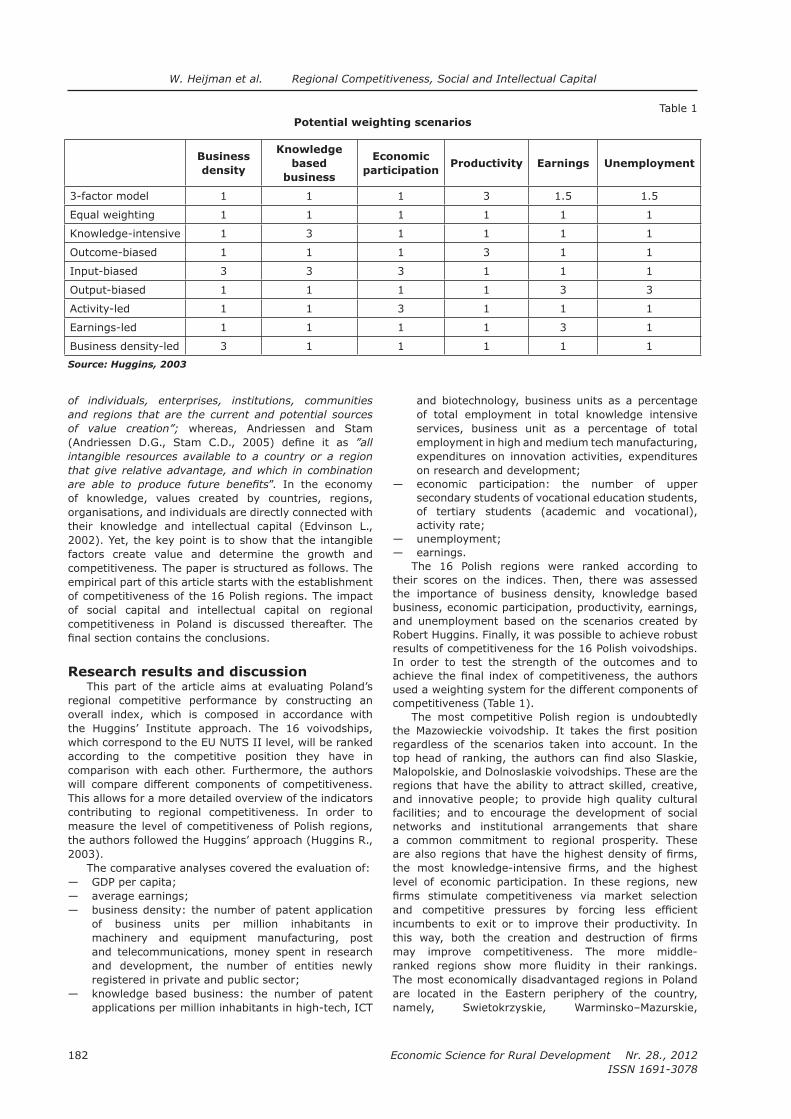
Economic Science for Rural Development Nr. 28., 2012
ISSN 1691-3078
182
of individuals, enterprises, institutions, communities
and regions that are the current and potential sources
of value creation”; whereas, Andriessen and Stam
(Andriessen D.G., Stam C.D., 2005) deine it as ”all
intangible resources available to a country or a region
that give relative advantage, and which in combination
are able to produce future beneits”. In the economy of knowledge, values created by countries, regions, organisations, and individuals are directly connected with their knowledge and intellectual capital (Edvinson L., 2002). Yet, the key point is to show that the intangible factors create value and determine the growth and competitiveness. The paper is structured as follows. The empirical part of this article starts with the establishment of competitiveness of the 16 Polish regions. The impact of social capital and intellectual capital on regional
competitiveness in Poland is discussed thereafter. The inal section contains the conclusions.
Research results and discussionThis part of the article aims at evaluating Poland’s
regional competitive performance by constructing an overall index, which is composed in accordance with the Huggins’ Institute approach. The 16 voivodships, which correspond to the EU NUTS II level, will be ranked according to the competitive position they have in comparison with each other. Furthermore, the authors will compare different components of competitiveness. This allows for a more detailed overview of the indicators contributing to regional competitiveness. In order to measure the level of competitiveness of Polish regions, the authors followed the Huggins’ approach (Huggins R., 2003).
The comparative analyses covered the evaluation of: — GDP per capita; — average earnings; — business density: the number of patent application
of business units per million inhabitants in machinery and equipment manufacturing, post and telecommunications, money spent in research and development, the number of entities newly registered in private and public sector;
— knowledge based business: the number of patent applications per million inhabitants in high-tech, ICT
and biotechnology, business units as a percentage of total employment in total knowledge intensive services, business unit as a percentage of total employment in high and medium tech manufacturing, expenditures on innovation activities, expenditures on research and development;
— economic participation: the number of upper secondary students of vocational education students, of tertiary students (academic and vocational), activity rate;
— unemployment; — earnings.
The 16 Polish regions were ranked according to their scores on the indices. Then, there was assessed the importance of business density, knowledge based business, economic participation, productivity, earnings, and unemployment based on the scenarios created by Robert Huggins. Finally, it was possible to achieve robust results of competitiveness for the 16 Polish voivodships. In order to test the strength of the outcomes and to achieve the inal index of competitiveness, the authors used a weighting system for the different components of competitiveness (Table 1).
The most competitive Polish region is undoubtedly the Mazowieckie voivodship. It takes the irst position regardless of the scenarios taken into account. In the top head of ranking, the authors can ind also Slaskie, Malopolskie, and Dolnoslaskie voivodships. These are the regions that have the ability to attract skilled, creative, and innovative people; to provide high quality cultural facilities; and to encourage the development of social networks and institutional arrangements that share a common commitment to regional prosperity. These are also regions that have the highest density of irms, the most knowledge-intensive irms, and the highest
level of economic participation. In these regions, new irms stimulate competitiveness via market selection and competitive pressures by forcing less eficient incumbents to exit or to improve their productivity. In this way, both the creation and destruction of irms may improve competitiveness. The more middle-ranked regions show more luidity in their rankings. The most economically disadvantaged regions in Poland are located in the Eastern periphery of the country, namely, Swietokrzyskie, Warminsko–Mazurskie,
Table 1
Potential weighting scenarios
Business density
Knowledge based
business
Economic participation
Productivity Earnings Unemployment
3-factor model 1 1 1 3 1.5 1.5
Equal weighting 1 1 1 1 1 1
Knowledge-intensive 1 3 1 1 1 1
Outcome-biased 1 1 1 3 1 1
Input-biased 3 3 3 1 1 1
Output-biased 1 1 1 1 3 3
Activity-led 1 1 3 1 1 1
Earnings-led 1 1 1 1 3 1
Business density-led 3 1 1 1 1 1
Source: Huggins, 2003
W. Heijman et al. Regional Competitiveness, Social and Intellectual Capital

183
Economic Science for Rural Development Nr. 28., 2012
ISSN 1691-3078
and Podkarpackie voivodships. The poor economic performance of these regions may be caused by the predominance of agriculture in regional economy and due to the comparatively unfavourable geographical location of those regions. They border with less economically developed countries like Belarus, Ukraine, and Russia, which is detrimental to new economic initiatives and limits the opportunities for eficient trans-border cooperation
(Sadowska-Snarska S., 2002). It is widely acknowledged that less developed regions particularly face challenges
in promoting and developing the innovation potential (Boeckhout S., 2004). The problem of these regions in the absence of a basis innovative capacity in business
what is especially signiicant in such areas as Podlaskie, Warminsko-Mazurskie, Podkarpackie, and Opolskie voivodships. Therefore, more emphasis should be put on mobile investment and on creating environments where high-quality business can start and succeed (Turok I., 2004).
The standard measure of regional success is the GDP per capita. The most afluent voivodship in Poland with the GDP per capita of 164% of the national average is Mazowieckie. Slaskie, Wielkopolskie, Dolnoslaskie, and Pomorskie voivodships are to be found among the other regions that have an above average GDP
per capita. Furthermore, the GDP growth in Polish regions is characterised by high regional concentration, namely, Mazowieckie, Slaskie, and Wielkopolskie generate one fourth of the total Gross Domestic Product.
In order to present the performance of social capital in Polish regions, the authors created an index of social capital using variables from three different categories, which are often applied in empirical research to estimate the level of social capital. The three categories were knowledge, associational activity, and the local election
turnout. The comparative analyses covered the analysis of the following factors:
— knowledge: the number of upper secondary students, of vocational education students, tertiary students (academic), tertiary students (occupations);
— associational activity: the number of non-governmental organisations, of volunteers, the level of cultural activity, of sports and recreation activities, and of social welfare services;
— local election turnout.The authors consider these factors as crucial
determinants of social capital. They relect both community engagement, community spirit, and territorial membership. The authors examined the relationship between the index of social capital and the index of competitiveness, and between the index of social capital and GDP per capita. Both correlations were signiicant, and the index of competitiveness had a slightly better outcome. The problem is the mutual inluence of index of social capital and index of competitiveness on the GDP per capita. The correlation does not show the direction or causality of the relationship. It is very dificult to distinguish statistically the impact of social capital on competitiveness or the GDP per capita from the relation proceeded in the reverse direction (Herbst M., 2007). Therefore, it is at least theoretically possible that the regional prosperity and competitiveness create or foster regional social capital, or that cumulative causation can be observed in a dynamic perspective. Undoubtedly, the presence of a high level of social capital facilitates mutually beneicial collective actions that foster prosperity of that region. The research results lead to the conclusion that social capital can be regarded as the crucial determinant of regional development and competitiveness (Table 2).
In order to present the performance of intellectual capital in 16 Polish regions, the authors tried to design
Table 2
The social capital index and competitive index of 16 Polish regions (voivodships)
RegionIndex of social
capitalRank
Index of competitiveness
RankGDP per capita
Rank
pl11 Lodzkie 84.3122 8 88.6415 7 99.8993 7
pl12 Mazowieckie 207.4805 2 203.5300 1 164.2591 1
pl21 Malopolskie 121.9266 3 128.9457 3 92.6930 11
pl22 Slaskie 256.5813 1 140.2345 2 121.8801 2
pl31 Lubelskie 69.7999 11 81.1463 10 75.2354 16
pl32 Podkarpackie 95.1373 6 74.3508 13 75.7185 15
pl33 Swietokrzyskie 63.6111 14 62.7492 16 83.9329 13
pl34 Podlaskie 57.4167 15 83.2733 9 80.9953 14
pl41 Wielkopolskie 81.8520 9 110.2475 5 116.5884 3
pl42 Zachodniopomorskie 98.0425 5 78.0590 12 100.8944 6
pl43 Lubuskie 87.9542 7 85.9641 8 97.0740 8
pl51 Dolnoslaskie 111.3091 4 124.4999 4 110.4707 4
pl52 Opolskie 49.6967 16 71.9127 14 93.2258 10
pl61 Kujawsko-Pomorskie 79.9652 10 80.4059 11 96.9875 9
pl62 Warminsko-Mazurskie 68.7524 12 64.7615 15 84.1883 12
pl63 Pomorskie 66.1626 13 103.5250 6 105.9574 5
Source: authors’ calculations based on the statistical data
W. Heijman et al. Regional Competitiveness, Social and Intellectual Capital

Economic Science for Rural Development Nr. 28., 2012
ISSN 1691-3078
184
a framework that enables the investigation of intellectual capital. With the purpose of establishing the intellectual capital of a region, the authors used data for 43 variables that a priori might have some connection with the broad concept of intellectual capital (Table 3). A principal component analysis (PCA) was carried out in order to
investigate which of the 43 variables are related to the concept of intellectual capital. The usual criteria in PCA were applied - Eigen value larger than one, loadings on components eventually larger than 0.8, and theoretically sound labelling of at least the main component. The inal result is given in Table 4. The component intellectual
Table 3
Intellectual capital, factor loadings and relative weights of its relevant variables*
Variable Factor loading Relative Weight**
R&D expenditure in business sector 0.954 0.067
R&D expenditure in the government sector 0.924 0.065
R&D expenditure in higher education sector 0.947 0.066
Employment in R&D -technicians and equivalent staff 0.994 0.069
Participants of doctoral studies (persons) 0.979 0.068
Participants of postgraduate studies (persons) 0.970 0.068
Academic teachers (persons) 0.946 0.066
Number of population (persons) 0.911 0.064
Employment In R&D-technicians and equivalent staff 0.982 0.069
Entities newly registered in private sector 0.945 0.066
Theatres and musical institutions (number) 0.960 0.067
Non-proit organisations (thousand) 0.949 0.066
Number of tertiary education students 0.982 0.069
Patents granted 0.952 0.066
Participation in local elections (%) 0.930 0.065* Explained variance 91.238%
** The relative weights sum up to unity
Source: authors’ calculations based on the Eurostat and the Polish Central Ofice of Statistics data
Table 4
Index of intellectual capital of the 16 Polish regions
Region Code Index of intellectual capital Rank
Lodzkie LD 93.36 7
Mazowieckie MA 405.67 1
Malopolskie MP 156.40 2
Slaskie SL 145.48 3
Lubelskie LU 80.52 8
Podkarpackie PM 62.13 10
Podlaskie PD 43.81 12
Swietokrzyskie SW 39.51 14
Lubuskie LB 32.27 15
Wielkopolskie WP 132.68 4
Zachodniopomorskie ZP 63.16 9
Dolnoslaskie DS 123.48 5
Opolskie OP 31.52 16
Kujawsko-Pomorskie KP 61.94 11
Pomorskie PM 95.62 6
Warminsko-Mazurskie WM 43.41 13
Source: authors’ calculations based on the statistical data of the Polish Central Ofice of Statistics
W. Heijman et al. Regional Competitiveness, Social and Intellectual Capital
185
Economic Science for Rural Development Nr. 28., 2012
ISSN 1691-3078
capital could be discerned, which explains about 91% of the total variance. The 15 variables listed in this table have high loadings (weights) on the component, which can be clearly labelled as intellectual capital. The screen plot indicates once more that the 15 variables may be headed under one component. The component consists of various dimensions of intellectual capital. It shows the importance of technological development (e.g. R&D, patents granted), the university institute (students, teachers) but also the importance of social capital institutions as not for proits, participation in local elections, and the number of theatres and musical institutions.
The Mazowieckie region achieved the highest score in intellectual capital in Poland. In the top of the ranking with outcomes ranging from 156.40 to 123.48, the authors ind Malopolskie, Slaskie, Wielkopolskie, and Dolnoslaskie. The middle-ranked regions are Pomorskie, Lodzkie, and Lubelskie. Finally, the lowest positions are taken by Opolskie, Lubuskie, and Swietokrzyskie. Undoubtedly, the absolute leader is Mazowieckie, the capital region where economic concentration goes together with the political centre of the country. Mazowieckie owes its high position to its very dynamic growth, both economically and socially. Combining the index of intellectual capital with the competitiveness performance shows a positive relationship between intellectual capital and competitiveness. Regions, which achieved high scores in the index of intellectual capital, are also highly classiied in the index concerning regional competitiveness.
ConclusionsIn the world of performance of indicators and
rankings, it is apparent that regions are compared with each other in terms of their economic position. This article looked at competitiveness from a regional perspective and attempted to conceptualise regional competitiveness for Poland as well as to investigate the relationship between social and intellectual capital, and competitiveness for the 16 Polish regions. There is a strong correlation between the presence of social capital and regional competitiveness. The existence of social capital might be helpful to explain the economic progress of certain regions, because the use of regions’ endogenous resources is the key factor of socio-economic development. Sometimes social capital can be insuficient for establishing endogenous sustainable development and economic prosperity, but at least it enhances development. Only regions with the ability to attract and keep intellectual capital can win in a globalised and strongly competitive world. The development of scientiic research, technological progress, and innovation are crucial to attain high competitiveness. Knowledge and its quality, scientiic research, technological progress, and quantity and quality of human capital are considered as crucial factors for the economic growth and high quality of life. Although, the ability of regions to adopt to fundamental changes in economic environmental rests on a range issues including their socio-economic structure, level of initial development, and proximity to capital and innovation as well as the way in which they are affected by national policy decisions (Gorzelak G., 2000). It is widely acknowledged that the development of regional
competitiveness depends mainly on endogenous factors. In this respect, one can expect that intellectual capital will be perceived as one of the most important factors for the economic growth.
Bibliography1. Andriessen, D.G., Stam C. D. (2005). Intellectual
Capital of the European Union. Paper for
the 7th McMaster World Congress on the Management of Intellectual Capital and Innovation, January 19-21, 2005, Ontario, Canada.
2. Boeckhout, S. (2004). Regional Innovation Strategies
in Poland: Lessons and Recommendations. ECORYS Research and Consulting. Rotterdam.
3. Bontis, N. (2004). National Intellectual Capital Index: a United Nations Initiative for the Arab Region, Journal of Intellectual Capital, Vol. 5, No 1, pp. 13-39.
4. Bradley, K. (1997). Intellectual Capital and the New
Wealth of Nations II, Business Strategy Review 8, pp. 33–44.
5. Brooking, A. (1997). The Management of Intellectual Capital, Long Range Planning, p. 30.
6. Coleman, J.S. (1988). Social Capital in the Creation of Human Capital. America Journal of Sociology 94, pp. 95-121.
7. Daley, J. (2001). The Intangible Economy and Australia, Australian Journal of Management 26
(Special Issue), pp. 3-19.8. Dunning, J., Bannerman, E., Lundan, S.M. (1998).
Competitiveness and Industrial Policy in Northern
Ireland. Monograph 5, March. Northern Ireland Research Council.
9. Edvinsson, L., Stenfelt, C. (1999). Intellectual Capital of Nations – For Future Wealth Creation, Journal of
Human Resource Costing and Accounting, Vol. 4, No. 1.
10. Edvinsson, L. (2002). The Knowledge Capital of Nations, Knowledge Management, April.
11. Gorzelak, G. (2000). Poland. In: Bachtler, J., Downes, R., Gorzelak, G. (Eds). Transition, Cohesion
and Regional Policy in Central and Eastern Europe. Ashgate Publishers, Aldershot, UK, pp. 125-154.
12. Hanifan, L.J. (1916). The Rural School Community Centre. In Subrie, A.L. (eds.) New Possibilities in
Education. Philadelphia, The American Academy of Political and Social Science.
13. Herbst, M. (2007). Kapital Ludzki i Kapital Spoleczny a Rozwoj Regionalny (Human and Social Capital and
Regional Development), SCHOLAR, Warszawa.14. Huggins, R. (2003). Debates and Surveys Creating
a UK Competitiveness Index: Regional and Local Benchmarking, Regional Studies, Vol. 37.1, pp. 89-96.
15. Malhotra, Y. (2000). Knowledge Assets in the Global Economy: Assessment of National Intellectual Capital, Journal of Global Information
Management 8.16. Pasher, E. (1999). The Intellectual Capital of the
State of Israel: A Look to the Future – The Hidden Values of the Desert. Kal, Herzlia Pituach.
17. Petrash, G. (1996). Dow’s Journey to a Knowledge Value Management Culture, European Management
W. Heijman et al. Regional Competitiveness, Social and Intellectual Capital

Economic Science for Rural Development Nr. 28., 2012
ISSN 1691-3078
186
Journal 14, pp. 365–373.18. Putnam, R.D., Leonardi, R., Nanetti, RY., (1993).
Making Democracy Work. Princeton University Press, Princeton, NJ.
19. Routledge, B.R., von Amsberg J. (2002). Social
Capital and Growth, Paper Prepared for the Carnegie-Rochester Conference Series on Public Policy.
20. Sadowska-Snarska, S. (2002). Struktura Gospodarki a Poziom Rozwoju Regionow Wschodniej Polski (Economic Structure and the Level of Development of the Eastern Polish Regions). In: Sadowska-Snarska, S. (Eds.). Problemy Rozwoju Przygranicznych
Regionow Wschodniej Polski (Problems of
Development of Border Regions in Eastern
Poland), Bialystok School of Economics, Bialystok, pp. 131-165.
21. Servan, L. (1997). Credit and Social Capital. The Community Development Potential of US Microenterprise Program. Housing Policy Debate, 9 (1), pp. 115-149.
22. Turok, I. (2004). Cities, Regions and Competitiveness, Regional Studies, Vol. 38.9, pp. 1069 – 1083.
23. WEF, (2004). The Global Competitiveness Report
2004-2005. Palgrave Macmillan.
W. Heijman et al. Regional Competitiveness, Social and Intellectual Capital

187
Economic Science for Rural Development Nr. 28., 2012
ISSN 1691-3078
A. Irmeja, I. Leibus State Aid for Self-Employed Persons in Latvia and Other European Union Member States
___________________________1 E-mail address: [email protected] E-mail address: [email protected]
State Aid for Self-Employed Persons in Latvia and Other European Union Member States
Alona Irmeja1, Mg.oec., PhD student; Inguna Leibus2, Dr.oec., associate professorDepartment of Accounting and Finance, Latvia University of Agriculture
Abstract. National competitiveness is based on competitive operators whose successful operation is dependent on favourable business environment. Such an assurance is the mission of the public administration. Regulatory environment, in which an entrepreneur operates, is as important as a relevant infrastructure and possible support for the business start-ups. Self-employment is a form of employment associable with a person’s greater freedom of choice as well as increased risk chance. Even though self-employment is usually considered a part of employment policy, in a diverse sense, it can be regarded to as a irst step towards forming a business. There is a wide range of labour market policies and measures, which support self-employment in the countries covered by the European Employment Observatory (EEO), such as inancial support, subsidies, loans or microinance, and advice; measures to reduce administrative burdens etc. The aim of the research is to explore the Latvian government and other European Union (EU) Member States support measures for self-employed persons. The authors conclude that almost all EEO countries have policies to support self-employment. Public support plays a major role in each country’s aid policy and it is important for self-employed persons.Key words: self-employment, state aid, European Union Member States, business.JEL code: G38
Introduction The search of solution to the unemployment problem
and economic growth problem at the present time is the major for governments around the world, particularly in Europe. One of the ways to improve the economic situation in the country is supporting the small business sector including self-employment with different types of aid instruments. The aim of the research is to explore support measures for self-employed persons applied in Latvia and other EU Member States. Tasks: 1) to ind out national documents which prescribe the support for self-employed persons; and 2) to evaluate measures that exist for self-employment in Latvia and other EU Member States.
The study is based on the monographic method used to assess knowledge on self-employment, the development of a theoretical discussion on support measures and interpretation of the study results, graphical method as well as an abstract - logical method is used to separate the facts for drawing general conclusions.
Research results and discussionAlmost all countries have policies in place to support
self-employment. Although, in some countries (e.g. Hungary, Turkey), it is not said to have been an important part of the political agenda (Self-employment in Europe, 2010).
One of the main long-term economic priorities of Latvia set as the government declaration is a favourable environment for business and investment. Latvia has made an important comprehensive document, which sets a target for the government of Latvia to ensure growth and outlines the main lines of action. This is the Latvian National Development Plan for 2007 - 2013. The
plan aims to promote balanced and sustainable national development and to improve the competitiveness of Latvia among other countries in the short-term period. Section 2 of the Plan refers to a company’s technological excellence and lexibility, which includes subdivision “Creation of a New Competitive Company.” The main challenges related to starting up a business plan are
as follows: irst, to promote public, particularly young people, interest to become entrepreneurs and set up their own business; to improve business prestige and reputation as well as to implement business start-up incentive programmes, training and advice; second, to provide a uniied and effective support for business start-ups (mentor advice, inancial support mechanisms etc.) (LR Regionalas attistibas…, 2006).
The newly proposed Europe 2020 strategy calls on the Member States to remove measures that discourage self-employment but, at the same time, urges countries not to promote involuntary or precarious self-employment. It also refers to self-employment and business in terms of access to education systems and mobility programmes promoting business and innovation among
young people.There is a wide range of labour market policies
and measures, which support self-employment in the countries covered by the European Employment Observatory (EEO). The measures are categorised in this executive summary according to the following headings and are described in more detail below:1) inancial support, such as subsidies, loans, or
microinance;2) speciic support services for people wishing to set up a
business including one stop shops;3) the provision of training, mentoring, and advice
(including consultancy);

Economic Science for Rural Development Nr. 28., 2012
ISSN 1691-3078
188
4) measures to reduce bureaucracy/administrative burdens;
5) existing favourable conditions for the self-employed or changes to tax/social security regimes;
6) measures to increase motivation towards self-employment (Self-employment in Europe, 2010).
1. Measures offering inancial supportThe importance of providing start-up inance to
enable people to access credit in order to set up a
business has been recognised through the creation of the
aforementioned European Progress Micro-inance Facility. This EUR 100 million fund is intended to support people at risk of losing or those who have already lost their jobs to obtain credit in order to set up a business.
In the Czech Republic, there are regular low-scale measures supporting business indirectly provided by the Czech-Moravian Guarantee and Development Bank, and the Export Guarantee and Insurance Corporation. Furthermore, retraining courses provided by labour ofices enable start-up entrepreneurs to seek low interest rate loans from the START programme operated by the Enterprise and Innovation Operational Programme.
Enterprise Estonia offers start-up grants of
approximately EUR 6 400 to those wishing to start a business in speciic sectors, with a requirement of 20% own inancing by the entrepreneur.
In Spain, it is possible to receive unemployment beneits as a lump sum payment, in order to start a new business. The unemployed may receive up to 60% of their total unemployment beneits in one single payment, in order to support them in their business creation process. Certain groups can get a higher proportion of the beneits: men under 30 years of age and women aged less than 35 years may receive 80% of the unemployment beneits that they are entitled to, in one lump sum payment.
In Austria, there are a number of measures to help with access to inance. One strand consists of state guarantees, through which companies can double their equity. For example, guarantees are granted by the Austrian Economic Service for ‘innovative projects’, which are no older than ive years. In addition, the Gründerbonus (Start-up Bonus) consists of a one-off beneit for start-ups (Self-employment in Europe, 2010).
Among the measures to support self-employment and business in Latvia, businesses that are less than a year old will each be eligible for up to LVL 54 000
(EUR 76 205) in loans and up to LVL 5 000 (EUR 7 056) in grants for the starting of business and the repayment of loan. In Latvia, this task is committed to the state joint-stock company “Latvian Mortgage and Land Bank”. These Regulations prescribe the procedure for start-ups, which use the support of the European Social Fund, the National Mortgage Bank from the amount of LVL 23 million
(LVL 14 million inanced by the ESF and the state, LVL 9 million - Mortgage Bank). These activities within the “Latvian Mortgage and Land Bank” are developed in six different support programmes, one of which supports a programme enhancing business start-ups. The Mortgage Bank offers new entrepreneurs a special support programme “Support for Self-employment and Business Start-up” or the Start programme. The programme aims to increase economic activity in the country, business start-ups developing knowledge and
skills as well as providing the necessary inancial support for the economic activities. The programme is open to Latvian residents aged 18 years including the unemployed who have expressed a desire to start a business or self-employment as well as newly established businesses. It is also relevant to experienced entrepreneurs who want to start a new business activity (launch of an entirely new product or service) and consequently a new company. The programme supports projects up to LVL 60 000 with the client’s participation in at least 10%. Participation is not required if the loan amount does not exceed
LVL 5000.Within the period from 1 September 2010 to
31 October 2011, the “Start programme” has provided inancial support to 524 companies, of which 85% - Ltd, 11% - IC, and 4% - self-employed persons.
Most of the companies (all 524 of the project subjects), which participated in the “Start programme”, represented the following industries: restaurants and catering services, tax consultancy, automotive maintenance and repair, clothing retail, and logging. On the contrary, IC and self-employed persons were registered in such sectors as hairdressing and beauty services, maintenance and repair, logging, retail sale of clothing and joiners, and leather goods.
2. Speciic support services for people wishing to set up a business
Many of the national articles report that support
services targeted at people who wish to start up a business have been or are in the process of being set
up. These support services can take the form of one stop shops (as in Malta, Poland, Slovakia, the United Kingdom, or the Republic of Macedonia) or business incubators (for
example, in Bulgaria, Latvia, Lithuania, Slovakia). In Ireland and Latvia, a regional approach has been used to provide support.
In Bulgaria, the Job Opportunities through Business Support project, which ran from 2000 to 2009, aimed to encourage employment by assisting the development of micro and medium-sized enterprises in small agricultural municipalities with high unemployment rates. One of the approaches used was to stimulate self-employment and small business development. All beneiciaries received direct services for facilitating the initial stages of their
business development via a network of business centres and business incubators. The package of services provided included consultations, ofice and informational services, vocational training in small businesses, drafting a business plan and organising marketing surveys; leasing equipment to micro and mini companies; access to the Internet etc.
In Ireland, there are 35 County and City Enterprise Boards, located throughout the country. Their role is to develop indigenous enterprise potential and to stimulate economic activity on local level by assisting micro-enterprises (deined as having 10 or fewer employees). Each County and City Enterprise Board includes representatives from the social partners, state agencies, and local voluntary groups as well as elected local public representatives.
One-stop shops were introduced in Slovakia in
2007 to simplify access to the market for entrepreneurs by integrating all necessary administration related to
A. Irmeja, I. Leibus State Aid for Self-Employed Persons in Latvia and Other European Union Member States

189
Economic Science for Rural Development Nr. 28., 2012
ISSN 1691-3078
business start-up and operation into one place in a time and cost-eficient manner. Apart from administering the registration in the trade and/or commercial register and issuing a trade licence, one stop shops enable persons at business start-up to complete income tax registration or registration for the purpose of compulsory health insurance, and provide for an electronic copy of a ‘defaulter sheet’. Slovakia has also
16 entrepreneurial and technological incubators
supporting new start-ups.The United Kingdom has an established single
service approach for providing support to new business start-ups, and the existing small and medium-sized businesses. Known as Business Link (in England), Business Gateway (in Scotland), and Flexible Support for Business (in Wales), these organisations offer an array of advice and guidance that includes help with developing a business plan (essential if start-up capital is required) and training courses for before and after a business is
underway (Self-employment in Europe, 2010).Eight business incubators are to be set up in Latvia
in all regions with inancial support from the European Regional Development Fund. These business incubators will provide discounted consulting and business services as well as the use of premises and facilities in the early years of business development (Table 1).
Activities are aimed at promoting the formation of new, viable and competitive businesses in the regions of Latvia, providing them with the necessary premises and advisory services. Business incubation is a unique and lexible business development process - a combination of infrastructure and personnel, designed to help develop new and small businesses by supporting the early stage of development with daily consultations based on business development issues.
According to the Appendix 2.3.2.1 Activity “Business Incubators” of the Cabinet Regulations No. 835 “Rules for the Operational Programme Entrepreneurship and Innovation” as well as the Ministry of Economies decision of 10 February 2009, Latvian Investment and Development Agency is the recipient of funding under this programme.
The project was launched on 27 February 2009 and it is scheduled to be completed by 31 December 2014. Total project costs are LVL 20,208,601, of which the European Regional Development Fund funding - LVL 17,179,419
or 85% of eligible costs and state budget inancing - LVL 3,029,182 or 15% of eligible costs (Biznesa inkubatori, 2011). Eight business incubators were
created in various regions of Latvia. Since January 2009, totally 429 companies have already used the
Business Incubator services. Most companies are from Zemgale (Table 1).
3. The provision of training, mentoring and advice
Several countries (Latvia, Lithuania, Luxembourg, Austria, Slovakia, Croatia, and Iceland) provide training, mentoring and/or advice services including consultancy support, either to people who have recently become self-employed or to those who might be thinking about setting up a business.
The Lithuanian Labour Exchange similarly provides information on the conditions for starting up a business, its development, the employment of employees, opportunities for pursuing activities under a business
certiicate; and organises basic business training for jobseekers.
In Luxembourg and Croatia, it is the social partners, which provide training and advice to the self-employed. In Luxembourg, self-employed workers need to be registered members of one of the sector-speciic Professional associations (e.g. Chamber of Trade, Chamber of Agriculture). These associations offer guidance and expertise directly to members, and advise on the design and implementation of projects on self-employment. The Croatian Chamber of Trades and Crafts organises and helps with the education and improving the skills of new self-employed and the lifelong education and learning of the self-employed.
Austria and Iceland have introduced more targeted advice/training programmes. The Impra Unit of the Innovation Centre Iceland promotes innovation and new technology by assisting inventors and entrepreneurs with
Table 1
Business incubators by region and area of activity in Latvia
Region Name of incubator Area of activityNumber of companies
Riga
General partnership “Rigas regiona attistibas inkubators”
Tukums, Limbazi, Ogre 53
Creative industries business incubator Andrejsala Andrejsala, Riga 69
Kurzeme
Foundation “Ventspils Augsto tehnologiju parks” Ventspils,Talsi 49
Ltd “Kurzemes biznesa inkubators” Liepaja, Kuldiga, Saldus 52
Latgale Society “Latgales aparatbuves tehnologiskais centrs”
Rezekne, Balvi, Daugavpils, Livani, Ludza
42
Vidzeme
Society “Biznesa inkubators Cesis” Cesis, Madona, Aluksne 42
“VBII” Ltd Valmiera, Gulbene, Valka 40
Zemgale General partnership “JIC Biznesa inkubators” Jelgava, Dobele, Jekabpils, Aizkraukle
82
Source: authors’ calculations based on Biznesa inkubatori, 2011
A. Irmeja, I. Leibus State Aid for Self-Employed Persons in Latvia and Other European Union Member States

Economic Science for Rural Development Nr. 28., 2012
ISSN 1691-3078
190
advice and support, while in Austria, the AplusB initiative supports the start-up of new businesses stemming from the academic sector. The support offered consists of professional consultancy services for these potential
future entrepreneurs (Self-employment in Europe, 2010).The search of solutions to the unemployment problem
at the present time is the major issue for governments around the world, particularly in Europe. In that sense, much of the discussion on inding solutions to the unemployment problem has focused on the pivotal role to foster business as a way to reduce unemployment, i.e. as an instrument of active labour market policy (Pfeiffer, Reize, 2000).
In Latvia, the State Employment Agency and the Ministry of Welfare provide support in the form of consultancy and inancing to a small number of unemployed people who wish to start their businesses or transition into employment, with the recipients of support being those with the best business plans. The objective of activity “Measures of Business or Self-employment” is to provide advisory and inancial support measures to help the unemployed with prior training and guidance for conducting business and business start-ups or self-
employment and function successfully in a selected area for not less than two years.
The State Employment Agency offers help to registered unemployed persons. The unemployed receive the necessary help and support for business or
self-employment: — consulting business plan preparation and
development (20 consultations within 6 weeks); If the agency’s designated expert has given a positive
opinion on the viability of a business plan and required by the State Employment Agency:
— advice business plan of implementation in the irst year (20 consultations);
— business grants for business plan implementation - not more than LVL 2000 according to the approved business plan estimates;
— monthly grant to su pport the implementation of activities at an early stage (the irst six
months) - the minimum wage (Pasakumi komercdarbibas vai..., 2011).
This programme becomes more urgent with each year passing among Latvian unemployed. If 93 business plans were submitted in 2008, then in 2010, the number increased three times (Figure 1).
An often-applied labour market policy to combat unemployment is to stimulate unemployed individuals to start their own businesses. Such policy may at least, temporarily lead to increases in self-employment. These policies may be called successful when the formerly unemployed individuals remain in employment for a longer period either as self-employed or as paid-employed worker and also when they become employers they contribute to reduce unemployment not only by creating their own jobs but also by hiring new employees (Congregado, Golpe, 2010).
4. Measures to reduce administrative burdens
As indicated above, one of the key areas for action identiied in the 2005 Commission Communication on a modern policy for growth and employment was “red tape”. A number of the national articles (Greece, France, Latvia, Malta, Austria, Portugal, Slovakia) show that steps are being taken on the national level to reduce bureaucracy
and/or the administrative burdens and costs encountered when setting up and running a business. Some examples are listed below.
Greece has put the reduction of administrative burdens high on the political agenda. This is manifested, inter alia, by the recent bill on the simpliication of procedures for the establishment of enterprises, which was submitted to the Parliament for discussion on
17 May 2010. The proposed legislative act foresees great reductions in costs (Self-employment in Europe, 2010).
The Latvian Government’s plan for the support of micro-enterprises aims to decrease the costs of starting micro-enterprises by reducing the minimum capital requirements and simplifying the bureaucratic
93
250
313
20
80
82
0 50 100 150 200 250 300 350
2008
2009
2010
year
numbers
submitted business plans approved business plans
Source: authors’ calculations based on Pasakumi komercdarbibas vai…, 2011
Fig.1 Submitted to and approved business plans by the State Employment Agency in Latvia, 2008 - 2010
A. Irmeja, I. Leibus State Aid for Self-Employed Persons in Latvia and Other European Union Member States
191
Economic Science for Rural Development Nr. 28., 2012
ISSN 1691-3078
requirements. An entrepreneur can establish a limited liability company with reduced share-capital less than LVL 2 000. From 1 May 2010 to 1 May 2011 in Latvia, totally 15,240 new limited liability companies were registered, of which 9508 (62.4%) were with reduced share-capital. Most companies with reduced share-capital were registered with a LVL 1 large capital (47.5%), while 26.6% - with a capital ranging from LVL 2 to 10 (No gada laika registretajam SIA..., 2011).
In Slovakia, recovery measures have been introduced, which simplify and reduce administration related to business operation. These include a shortened period for VAT reclaim (from 60 to 30 days), simpliied fuel records (introduction of lump sum expenditures in the sum of 80% of fuel costs), simpliied tax records and bookkeeping for entrepreneurs with an annual turnover below EUR 170,000. Another important measure to reduce the administrative burden of doing business was the launching of electronic communication with the commercial register (registration, statements, changes, de-registration, 50% lower fees for electronic communication rather than paper etc.). These are mainly legal entities, which beneit from this policy; though, natural entities/self-employed conducting business based on the commercial code may also gain.
In Portugal, the SIMPLEX programme is thought to have contributed to business creation by reducing
bureaucracy and simplifying procedures associated with setting up a business (Self-employment in Europe, 2010).
5. Favourable tax or social security conditions for the self-employed
A number of countries have favourable conditions for the self-employed in terms of tax or social security contributions, or changes have been, or will be made in this area, sometimes in response to the economic crisis (as in Romania, Sweden, and the United Kingdom).
Taxes play a major role in the business environment. Robson and Wren (1998) ind a negative relationship between the self-employment rate and marginal tax rates but a positive relationship between the average tax rates and the self-employment rate. Blau (1987) and Paker (1996) ind that higher marginal tax rates lead to increases in the self-employment rate.
In Slovakia also, the current setting of the tax and social security system favours the self-employed compared with salaried employees. Calculations show that in a situation of equal labour costs and expected retirement pensions, the net income of a sole trader is 39% higher than that of an employee. The self-employed pay contributions from a lower assessment base (half of income attained in the previous year). They can also lower their tax base by lump sum expenses at 40% (and in some cases 60%) of income. The tax and contributions scheme allows various speculative base adjustments, by which entrepreneurs can decrease their tax and non-wage burden. Although, this is by no means a business-promoting policy, it acts as a key motive in the decision to start a business.
In Romania, the most signiicant measure has been the favourable income tax rate applied to micro-enterprises since 2007. Set at 2% in 2007, the rate gradually increased to 2.5 and 3% in 2009 but has been wholly eliminated by the government in 2010 within its crisis budgetary consolidation plan.
In Sweden, in response to the economic crisis, employers were given a respite from paying social security contributions and preliminary taxes for their employees for two months during 2009. The recent emergency budget in the United Kingdom has also
brought about more favourable conditions for business start-ups. This includes an extension of the 10% relief rate for entrepreneurial activities; enlargement of inance for start-ups with the extension of the Enterprise Finance Guarantee; a reduction in corporative tax for small businesses; and exemptions from National Insurance contributions for new employees in areas outside the South East England (Self-employment in Europe, 2010).
From 1 January 2010 in Latvia, a natural entity performing economic activities in certain professions or activities may choose to pay patent fees. Patent fee is a ixed tax, covering income tax and state social insurance contributions for individuals of economic activities in the profession. Within 10 months (January 2011 –
October 2011), the State Revenue Service has recorded 267 persons who wanted to pay patent fees: in
Riga - 129, in Vidzeme – 75, in Zemgale – 28, in
Kurzeme – 24, and in Latgale – 11. Most patents are issued to persons who collect the bounty of forests and meadows (Informativais zinojums …, 2011).
The Micro-enterprise Tax Law was adopted on
1 September 2010. Micro-enterprise – an individual merchant, an individual undertaking, a farm or ishing enterprise as well as a natural entity is registered as a performer of economic activity by the State Revenue Service. The micro-enterprise tax rate shall be 9%. Micro-enterprise tax includes mandatory state social insurance contributions, personal income tax, state fee of the business risk for micro-enterprise employees, and corporate income tax (Micro-enterprise Tax Law, 2010). On 1 July 2011, totally 12,575 micro- enterprise taxpayers were registered, while by 31 July this number had risen to 13,354 taxpayers.
6. Measures to increase motivation towards self-employment
Some people may argue that trying to become self-employed is not the most interesting entrepreneurial behaviour. Business is ultimately about wealth creation, not about the creation of a job for the founder. However, starting a business and entering into self-employment is in most cases the irst step of an entrepreneurial career. To learn really about business, it is not suficient to study success stories, one also needs knowledge on the process entrepreneurs go through on their way to success or failure. To demonstrate that a speciic competence is central for entrepreneurial progress, the authors should incorporate them in business education and training programmes (Kolvereid. L, Isaksen, E. 2006).
In Germany, the Foundation Country Germany initiative, introduced by the Federal Ministry of Economics and Technology, focuses on young people, as it attempts to build motivation for self-employment through better information and promotion work at schools and universities.
In Latvia, the scope is broader; The Motivation programme was approved in December 2008 aiming to encourage as many people as possible to start their own businesses, to raise the overall prestige of business, and
A. Irmeja, I. Leibus State Aid for Self-Employed Persons in Latvia and Other European Union Member States
Economic Science for Rural Development Nr. 28., 2012
ISSN 1691-3078
192
to inform the society about the potential of innovation. It was introduced to support activities that improve the capacity of teaching personnel to motivate young people, activities that spread the best practices in starting
businesses and developing innovation and marketing activities for innovation and businesses. More than
LVL 2 million (EUR 2.8 million) of inancing has been allocated to this activity, of which 85% is provided by the European Regional Development Fund. Finally, in Luxembourg, the Ministry of the Economy and Foreign Trade and the Ministry of Medium-sized Companies ran the Trau dech — maach dech selbststänneg (Have the heart to take part — become self-employed) campaign in 2004 to encourage the population to create new companies (Self-employment in Europe, 2010).
Conclusions, proposals, recommendations 1. Self-employment is an important driver in business
and job creation, and thus, contributes to the European Union’s goals of more growth and better jobs.
2. Almost all European Employment Observatory countries have policies in place to support self-
employment. Exploring the European Employment Observatory public support for self-employment, the authors conclude that it has a major role in each country’s aid policy, and it is important for self-employed persons. Improving the business environment is a focus of policy in some countries (Austria). Some countries have implemented education and awareness-raising activities to increase understanding of the opportunities offered
by self-employment (Sweden), while other countries focus on supporting businesses to grow, or develop (Finland).
3. There is a wide range of labour market policies and measures, which support self-employment. The measures are categorised in this executive summary according to the following headings: Measures offering inancial support; Speciic support services for people wishing to set up a business, including one stop shops; Provision of training, mentoring and advice; Measures to reduce administrative burdens; Favourable tax or social security conditions for the self-employed; and Measures to increase motivation towards self-employment.
4. Turning unemployment into self-employment has become a major focus of the EU countries active labour market policy. In Latvia, the State Employment Agency and the Ministry of Welfare provide support in the form of consultancy and inancing to a small number of unemployed people who wish to start their businesses or transition into unemployment. Policy makers should be careful about what to do with their stimuli, since in the context of a highly regulated labour market, these types of incentives could not generate desired
effects on paid-employees who switch to dependent self-employment.
5. Recommendation for future research: it should investigate effectiveness of each support measure to ind out if the national support programme
objectives have been achieved and what their results are. Future research should investigate the support for the unemployed people to start businesses and engage in self-employment, which could be a good tool in the ight against the unemployment. One of the solutions how to generate jobs and reduce unemployment would be focusing public opinion more on innovative and high-growth businesses than forcing the unemployed into engaging into self-employment.
Bibliography 1. Abeltina, A. (2008). Innovation Phenomenon of the
21st Century. Riga: Turiba, p. 116.2. Audretsh, B. Thurik, A. (2001). What is New about
the New Economy: Sources of Growth in the Managed and Entrepreneurial Economies. Industrial
and Corporate Change, Volume 10, pp. 267-315. 3. Biznesa inkubatori (2011). (Business Incubators).
Retrieved: http://www.liaa.gov.lv/?object_id=2843. Access: 12 November 2011.
4. Blau, D. (1987). A Time Series Analysis of Self-Employment in the United States. Journal pf Political
Economy, Volume 95, pp. 445-467.5. Congregado, E., Golpe, A., Carmona, M. (2010). Is
it a Good Policy to Promote Self-employment for Job Creation? Evidence from Spain. Journal of Policy
Modelling, Volume 32, pp. 828–842. 6. Kolvereid, L., Isaksen, E. (2006). New Business Start-
up and Subsequent Entry into Self-employment. Journal of Business Venturing, Volume 21, pp. 866-885. .
7. Latvijas Nacionalais attistibas plans 2007-2013 (2006). (National Development Plan of Latvia 2007-2013). Retrieved: http://www.nap.lv/upload/nap/national_development_plan_2007-2013_lat.pdf. Access: 30 September 2011.
8. Micro-enterprise Tax Law (2010). Latvijas Vestnesis, No. 131 (4323), 19.08.2010.
9. No gada laika registretajam SIA 62% ir ar samazinatu pamatkapitalu (2011) (Within a Year, 62% of Ltd were Registered with the Reduced Share Capital). Retrieved: http://www.lursoft.lv/press/2011/05/03/ No-gada-laika-registretajam-SIA-62-proc-ir-ar-samazinatu-pamatkapitalu. Access: 12 November 2011.
10. Parker, S. (1996) A Time-series Model of Self Employment Under Uncertainty. Economica, Volume 63, pp. 459-475.
11. Par Mikrouznemumu nodokla likuma praktiskas istenosanas gaitu un rezultatiem no 2010. gada 1. septembra līdz 2011. gada 30. junijam. (2011) (On the Micro-Enterprise Tax Act of Practical Implementation and Results from 1 September 2010 to 30 June 2011). Retrieved: www.mk.gov.lv/doc/2005/LMZino_020911.2182.doc. Access: 15 September 2011.
12. Pasakumi komercdarbibas vai pasnodarbinatibas uzsaksanai. (2011) (Measures to Start Self-employment or Business). Retrieved: http://www.nva.lv/index.php?cid=3&mid=311#komerc. Access: 12 November 2011.
13. Pfeiffer, F., Reize, F. (2000). From Unemployment to Self Employment Public Promotion and Selection.
A. Irmeja, I. Leibus State Aid for Self-Employed Persons in Latvia and Other European Union Member States

193
Economic Science for Rural Development Nr. 28., 2012
ISSN 1691-3078
International Journal of Sociology, Volume 30(3), pp. 71-99.
14. Robsin, M., Wren, C. (1999). Marginal and Average Tax Rates and the Incentive for Self Employment. Southern Economic Journal, Volume 65, pp. 459-475.
15. Self-employment in Europe 2010 (2010). European Employment Observatory Review Luxembourg: Publications Ofice of the European Union, p. 52.
16. Starta Programma (2011). Retrieved: http://www.hipo.lv/lv/attistibas_programmas/ starta_programma. Access: 2 December 2012.
A. Irmeja, I. Leibus State Aid for Self-Employed Persons in Latvia and Other European Union Member States

Economic Science for Rural Development Nr. 28., 2012
ISSN 1691-3078
194
Problematic Aspects of Financial Reporting in Latvia
Anna Jesemcika1, Mg.oec., assoc. professor Faculty of Economics, Latvia University of Agriculture
Abstract. The article outlines the changes of accounting policy in inancial reporting having occurred in Latvia within the past decade. This period is signiicant, since the Latvian system of inancial accounting and reporting was integrated into the European accounting system. The legal regulation of accounting has been developed and improved in the mentioned period. The article focuses on the legal and regulatory enactments deining signiicant changes in Latvian system of inancial accounting, and development tendencies for the regulation of accounting in Latvia within the recent years. The research hypothesis: adjustment of the regulatory enactments on accounting assumes their harmonisation with the requirements of international standards. Key words: accounting policy, signiicant information, inancial reporting, standards, the development of inancial accounting in Latvia.JEL code: M40, M41
A. Jesemcika Problematic Aspects of Financial Reporting in Latvia
___________________________1 E-mail address: [email protected].
Introduction Market relations imply an appropriate economic area,
which encompasses a wide range of different objects and subjects, and where each of them independently, without any mediation, decides on the mutually beneicial economic relations with business partners. This informational connection is provided by inancial reporting, which is a link between an enterprise and the society, and one of the tools for its management. Data of the inancial statements are interesting for a wide range of individuals and legal entities, which are connected with the activity of reporting enterprise. Financial reporting is a means of interaction between an enterprise and the market. For better eficiency, the market as external user shall have appropriate information on the activities of a business entity. Information may be insuficient or excessive for the user; thus, urging for the introduction of the notion “material information”.
Reforming of accounting implies its progressive and harmonious development consistent with the acknowledged principles, assumptions and rules, which are formulated in the International Financial Reporting Standards. Considerable changes have occurred in this direction within the past decade; hence, Latvian Accounting Standards (LAS) becoming the initial basis for the changes (Jesemcika A., 2008). The course of reforms is supported by the Cabinet Regulations No. 427 of 5 August 2003. The Cabinet Regulations No. 488 of 21 June 2011 prescribe the procedure for outlining
events after the balance sheet date, change of the accounting policy, and changes of accounting calculations and adjustment of errors in the inancial statements.
The usefulness of accounting and the information of inancial reporting are achieved by the direct use of the LAS. The IFRS have served as the basis for developing of Latvian inancial accounting and reporting system. Therefore, issues on the practical application of the LAS No. 4 “Change of Accounting Policy, Changes of Accounting Calculations and Errors over Previous Reporting Periods” (hereinafter – standard) in inancial
accounting for making scientiically reasonable economic decisions in strategy of the development of enterprises’ activity are especially important for Latvian enterprises (Latvijas gramatvedibas standarti, 2005). The standard is adopted by the decision of the Accounting Board on
9 February 2005. Article 15.2 of the law “On Accounting” determines the meaning of Latvian accounting standards in the preparation of inancial statements as common and reusable guidance for recognition, estimation of items in inancial statements, and provision of their explanation.
Here, one should note the practical importance of Principle 4 of the LAS principle on the deinition of criteria of choice and changes in the accounting policy. Currently, the standard is the cornerstone of the whole reporting preparation system.
The aim of the research – to ascertain the
tendencies of changes having occurred in the system of inancial accounting and reporting in Latvia within the past decade.
Tasks of the research – to study the criteria of
choice and changes in the accounting policy as well as accounting and representation of the changes of the
accounting policy in inancial statements and changes in accounting calculations.
Methods of the research. Legal and regulatory enactments were analysed for the research purpose. The method of analysis and synthesis, a logically constructive method, and a monographic method were used in the research.
Research results and discussionAnalysis
Reforming of accounting in Latvia, its adaptation to the market demands and international standards will require clariication of the existing provisions of accounting both in the title and the content and more precise classiication. In international practice, the mentioned provisions are known as the principles of accounting, and so they are disclosed in international and Latvian accounting standards (Resina G., 2008).

195
Economic Science for Rural Development Nr. 28., 2012
ISSN 1691-3078
A. Jesemcika Problematic Aspects of Financial Reporting in Latvia
The presence of single principles of accounting is
explained by the very purpose of inancial accounting in the market economy, which is intended to generate complete and authentic data on the property and inancial situation of enterprises, act as a method of communication among entrepreneurs, and to be a part of the general government system forming macroeconomic and microeconomic indicators. The accounting policy of an enterprise should meet the requirements of completeness, accuracy, priority of materiality over form, continuity, and rationality (Starptautiskie inansu parskatu…, 2008).
Latvian accounting system does not contradict the world acknowledged approaches to the accounting. The presence of fundamental principles of accounting (assumptions, requirements, and provisions) suggests its unconditional performance (Gada parskatu likums, 1992; Konsolideto gada parskatu…, 2006). Essentially, they are explained by the very purpose of accounting in the market economy, which forms complete and authentic data on the property and inancial situation of enterprises. Notions of “assumption” and “requirement” are also the provisions of accounting.
The accounting policy is changed only if:
— there is a need for any explanation; — inancial statements result in containing reliable
and more relevant information on the inluence of operations, other events or conditions inluencing the inancial situation of the enterprise, its inancial results of activity, and,
— the cash low.The users of inancial statements shall have the
opportunity to compare inancial reports of an enterprise for several reporting periods to determine the tendencies of inancial situation, operational, and cash low results. The approved accounting policy shall be applied
consistently from period to period to provide comparability of reporting. Therefore, the same accounting policy, excluding the abovementioned cases, is usually applied in inancial statements.
The accounting policy is not changed if it is:
— approved for operations, other events, and services, which essentially differ from the earlier operations, events, and services;
— applied to such operations, other events, or services, which did not happen earlier or were insigniicant.
The management of an enterprise may apply the accounting policy, which is approved by the new documents issued by other standard-setting authorities. Enterprises may voluntarily make a decision to change their accounting policy based on the later-made changes in the mentioned documents.
The change of accounting policy with the retroactive effect means that the enterprise corrects the balance of each equity item, which has been inluenced in all the previous reporting periods. The enterprise also adjusts other comparative indicators for all the reporting periods as if the new accounting policy has always been applied. Application of the new accounting policy retrospectively means the comparison of information of the previous reporting periods as long as it is practically possible. Exceptions are allowed in case it is practically impossible to determine the inluence of this accounting policy on each previous reporting period or its general inluence (Latvijas gramatvedibas standarti, 2005).
It is not practically possible to apply the accounting
policy with retrospective effect in a certain previous period if it is impossible to determine its general inluence on the rest of balance sheet items at the end and the beginning of the reporting period. The sum of adjustments, which relates to the periods prior to the speciied ones in the report, is attributed to the balance of each equity item at the beginning of the oldest speciied period. Usually, the adjustment is attributed to the retained earnings but it may also be attributed to another equity item. Any other information on the previous reporting periods, for example, disclosure of inancial data, is also being adjusted as long as it is practically possible.
In case of practical impossibility to determine the inluence of accounting policy on comparative indicators for one or few previous speciied periods, the enterprise applies the new accounting policy for the book value of assets and liabilities at the beginning of the period, starting from the oldest period it is practically possible. In case of the reporting period, the remaining equity items of this period inluenced at the beginning of the period are respectively adjusted. Hence, in such situation, the enterprise adjusts comparative information prospectively; starting from the date such adjustment is practically possible.
The change of accounting policy is allowed also if its perspective application is impossible in none of the previous periods. The enterprise indicates in the notes to the inancial statements the sum of adjustments occurred due to the application of requirements prescribed by the new external regulatory enactments and Latvian Accounting Standards. The sum is attributed to periods before the speciied period, as long as it is practically possible to determine it.
The annual report ensures the evaluation of the
inancial results of business, the state of settlements with the budget, creditors, lenders of money, and the economic conjuncture (Zarina V., 2004). The violation of individual accounting principles and requirements without suficient reasons may distort the property and inancial situation of an enterprise and its business results. On certain conditions, it may be interpreted as incorrect accounting.
However, it does not mean that the enterprise in any case has no right to neglect the mentioned assumptions. In reality, especially on conditions of the economic crisis, there may be cases when the enterprise has to neglect some assumptions. For example, the assumption of going concern business is not applicable in the accounting policy
in case of liquidation of an enterprise. These situations are exceptions from the general rule (Gada parskatu likums, 1992; Konsolideto gada parskatu…, 2006).
The choice of accounting methods may be linked with the choice of preference for one or another requirement. For example, completeness of the accounting of economic activity may not completely meet the requirement of rationality and vice versa. In this situation, the enterprise management has to evaluate the inluence level of chosen method on the usefulness of inancial information, and to decide on the requirement to be preferred. Hence, the establishment of accounting policy is the process of balance achievement between the mentioned principles and requirements.
The Annual Accounts Law speciies general requirements for the preparation of inancial statements and content of inancial statements, provides the

Economic Science for Rural Development Nr. 28., 2012
ISSN 1691-3078
196
characteristics of statements, the procedure for their submission, terms for storage, and the responsibility (Gada parskatu likums, 1992). The principle of materiality prescribes the disclosure of all the material information related to the basic indicators of the enterprise in
accounting and inancial reporting. It is recommended to set the materiality in the accounting policy of an enterprise expressing its size as a share (Table 1).
Errors may appear in the recognition, estimation, statement, or indication of items in the inancial statements. Financial statements are considered not prepared consistent with the external regulatory enactments and Latvian Accounting Standards if they contain material errors or deliberate trivial errors made to create a deinite opinion on the inancial situation, business results, and cash low of the enterprise. Errors of the reporting period disclosed in the period or at the
end of the period are adjusted before the approval of
inancial statements for publication (Butinjec F., 2008). However, sometimes material errors are not disclosed till
the next periods; and then the adjustment of these errors is indicated in the notes to the inancial statements of the appropriate next reporting period.
Cases of unidentiied or incorrectly identiied information are material if they individually or commonly may affect the business decisions of users made on the basis of the inancial statements. The materiality depends on the amount of unidentiied or incorrectly identiied information and the estimation of the essence in the context of speciic circumstances. The amount or the essence, or both of them may be the decisive factor.
If the accounting policy has been changed in
the annual report, then it is necessary to adjust the respective indicator of the previous period’s item. Each case containing incomparable data or adjustments in data of the previous reporting periods is disclosed in the
notes to the annual report.The author provides an example of changes in the
accounting policy and impact of changes on the inancial statements. In the reporting period, the enterprise has
Table 1
Criteria for setting the principle of materiality
No. Criteria Indicators of inancial statements, LVL Materiality, %
1. Earnings before taxes 0 – 1 000 000
1 000 000 – 3 000 000
3 000 000 - … … …
10
7
5
2. Net turnover … … … . - 3 000 0003 000 000 - … … …
1
0.5
3. Total assets … … … . – 1 000 0001 000 000 – 10 000 000
10 000 000 - … … …
2
1
0.5Source: author’s construction based on legal enactments of the Republic of Latvia
Table 2
The example outlining the inluence of application of the new accounting policy with retroactive effect
No. Sum of inluence
Balancesheet
Proit or loss account
Statement of changes in equity
Inluence on the previous reporting period
1. Increase in interest payments and decrease in the value of objects under construction
(х)
2. Reduction of corporate income tax payments and related liabilities х
3. Reduction of net proit (х)
4. Adjusted balance on 31 December of the previous reporting period (х)
Inluence on the periods from two to more previous years
1. Increase in interest payments and decrease in the value of objects under construction
(х)
2. Reduction of corporate income tax payments and related liabilities х
3. Reduction of net proit (х)
4. Adjusted balance on 31 December 20XX (х)
5. Net inluence of change of the accounting policy on 31 December of the previous period
(х) (х)
Source: author’s construction based on legal enactments of the Republic of Latvia
A. Jesemcika Problematic Aspects of Financial Reporting in Latvia

197
Economic Science for Rural Development Nr. 28., 2012
ISSN 1691-3078
voluntarily changed the accounting policy regarding the
capitalisation of payments on loans. Before the reporting period inclusively, the historic value of objects under construction increases in payments on loans used for formation of ixed assets. From the reporting period, these payments include the business results of the reporting period – the proit or loss account. The accounting policy is changed to ensure more transparent inancing consistent with the needs of the main funding entities of the enterprise. The application of the new accounting policy with retroactive effect has the following inluence:
The accounting policy has been changed with respect to the capitalisation of loan expenses and other expenses. The new accounting policy implies that the initial costs of objects under construction include the direct costs
incurred in respect of the constructed object before its
commissioning, excluding payments on loans that are included in the proit or loss account of the period they have incurred. Thus, it was required to adjust the inancial statements retrospectively.
ProblemsIn Latvia, the “liquidation value” is not being applied
in the development process of accounting policy and calculating the depreciation of ixed assets (Starptautiskie gramatvedibas standarti, 2008; Zarina V., 2004). The depreciation of ixed assets is admissible up to a hundred percent. Expenses related to the liquidation of ixed assets are not being considered in the calculation. Therefore, the residual value of ixed assets equals zero after the end of their useful life determined by each entrepreneur independently. Frequently, such ixed assets are still being used in business activity without their revaluation at fair value. According to the materiality principle, enterprises shall determine the liquidation value, for example, 5-7% of the initial costs of ixed assets. This will help avoid errors in the accounting of ixed assets with zero value.
Issues related to the application of fair value in
accounting and reporting, are not completely studied and methodologically developed in Latvia (Kuzmina I., 2006). Hence, assets in the balance sheet are relected by different evaluations:
— foreign currency is disclosed by the real value
(according to the exchange rate of the Bank of Latvia);
— ixed assets - mostly by the revaluated value (applying very average coeficients), which frequently does not correspond to the actual value of concrete objects;
— accounts receivable and accounts payable - usually
by the historic value; — material reserves – by mixed value, i.e. one part is
relected by the historic value and the other part - by the possible sales value;
— inished goods, in cases when the account “production output” is used in the accounting policy - by the standard (planned) cost etc.
The author believes that such a mix of different evaluations of assets and liabilities in the balance sheet as
one of the basic forms of inancial statements evidences not only the absence of a single concept in inancial
reporting but also forces the users of inancial statements encounter unreasonable dificulties. In addition, the balance sheet as the main source of information thereto, greatly decreases in its value, since it contains only
approximate to reality evaluations of the enterprise’s resources and not the real ones.
Accountants do not apply the principle of fair value
due to the following reasons: — they are afraid to exceed their competence and to
break the law; — determination of “fair” value is perceived as the
function of an evaluator and not of an accountant; — the sphere of the fair value is quite new for the legal
system of Latvia. The accounting by fair value and the disclosure
of information on fair value are the different ways of disclosure of information on fair value, which have different consequences both from the point of view of relection of inancial data in the inancial statements and the analysis of these data by the users of inancial statements.
The disclosure of assets by fair value leads to the
changes not only in the balance sheet data, but also in inancial results of the enterprise’s business that are included in the proit or loss account and in the statement of changes on equity. At the same time, the disclosure of information on fair value provides the user with additional data that could be used for the analysis of the enterprise
activity without changing of the reporting data. Evaluation of ixed assets by their fair value would allow enterprises disclosing their potential and future opportunities in
the reporting as well as providing the opportunity to evaluate business activity of the enterprise. Therefore, the author primarily focuses on the reforming of inancial accounting, since currently, the problem of investment attraction for the sectors of economics remains topical and acute.
The following question immediately arises with respect to changes of the accounting policy: for how many years is it necessary to recalculate the reporting data if an
enterprise is operating, for example, 20 years. From a purely theoretical point of view, the answer is obvious – for the entire 20 years. However, the opportunity to apply this approach in practice is doubtful and the opinions on
this fundamental recalculation will hardly cover its costs.
Conclusions, proposals, recommendations 1. The paper analyses the criteria of choice and
change of the accounting policy in the inancial reporting of Latvia. Signiicant changes in this sphere have occurred within the past decade, Latvian Accounting Standards (LAS) becoming their initial basis. This sphere is regulated by the Cabinet Regulations No. 427 of 5 August 2003 and No. 488 of 21 June 2011.
2. Accounting policies should not be applied when their inluence is insigniicant. However, even insigniicant deviations from the standard, which are committed to present a certain opinion on the inancial situation shall not be allowed or ignored.
3. The biggest problem of the standard No. 4 is the retrospective recalculation of indicators for the past
years related to the change of the accounting policy
or to the detection of serious misstatements related to the previous reporting periods, and the provision of comparability.
A. Jesemcika Problematic Aspects of Financial Reporting in Latvia

Economic Science for Rural Development Nr. 28., 2012
ISSN 1691-3078
198
4. Issues related to the application of fair value in
accounting and reporting are not completely studied and methodologically developed in Latvia.
5. Latvian Accounting Standards, particularly LAS No. 4, are an important step in the reforming of inancial accounting, since currently, the problem of investment attraction for the sectors of economics remains topical and acute.
Bibliography 1. Gada parskatu likums (1992). (Annual Accounts
Law). Retrieved: www.likumi.lv/doc.php?id=66461. Access: 2 November 2011.
2. Jesemcika, A. (2008). Development of the Accounting System in Latvia. In: Economic Science for Rural Development’ 2008: Proceedings of the International Scientiic Conference No. 17: Finances, Taxes, Investment and Support Systems, Jelgava, pp. 86–93. ISSN 1691-3078, ISBN 978-9984-9997-1-5.
3. Konsolideto gada parskatu likums (2006). (Consolidated Annual Accounts Law). Retrieved: www.likumi.lv/doc.php?id=147385. Access: 2 November 2011.
4. Kuzmina, I. (2006). The Concept of Fair Value and
International Financial Reporting Standards (IFRS). Scientiic Papers, University of Latvia, Volume 702, Economics V, pp. 289–298.
5. Latvijas gramatvedibas standarti (2005) (Latvian Accounting Standards). Retrieved:
www.fm.gov.lv/?lat/gramatvedibas_polit ika/latvijas_gramatvedibas_standarti. Access: 2 November 2011.
6. Praude, V. (2009). Finansu instrumenti. I: Ieguldijumi, darijumi, analize (Financial Instruments. I: Investment, Transactions, Analysis). Riga: SIA Burtene, p. 448.
7. Resina, G. (2008). Eiropas Savienibas inansu resursi un budzets (European Union Financial Resources
and Budget). Riga: Biznesa augstskola Turiba, p. 320.
8. Starptautiskie inansu parskatu standarti (International Financial Reporting Standards). Komisijas regula (EK) Nr. 1126/2008. Retrieved: www.fm.gov.lv/eur-lex.europa.eu/LexUriServ/LexUriServ.do?uri=OJ:L:2008:320:0001:0481:LV:PDF. Access: 2 November 2011.
9. Starptautiskie gramatvedibas standarti (2008). (International Accounting Standards). Retrieved:eurlex.europa.eu/LexUriServ/LexUriServ.do?uri=OJ:L:2008:320:0001:0481:LV:PDF. Access: 2 November 2011.
10. Zarina, V. (2004). Gramatvedibas sistema: attistiba, standartu prasibas (Accounting System: Development, Requirements of Standards). Riga: SIA Biznesa augstskola Turiba, p. 264.
11. Butinjec, F. (2008). Buhgalterskij ucjot v stranah mira. (Accounting in the Countries of the World). Vipusk 2. Zjitomir: ZGTU, kollektiv avtorov, str. 150-185. ISBN 978-966-683-165-4.
A. Jesemcika Problematic Aspects of Financial Reporting in Latvia

199
Economic Science for Rural Development Nr. 28., 2012
ISSN 1691-3078
J. Lascenko, A. Jesemcika Improvement of Internal Control System of Agricultural Enterprises
Improvement of Internal Control System of Agricultural Enterprises
Jelena Lascenko1, Mg.oec. State Revenue Service
Anna Jesemcika, Mg.oec., assoc. professor Faculty of Economics, Latvia University of Agriculture
Abstract. Tendencies observed in the development of agricultural sector in Latvia indicate not only to the economic growth but require also a detailed analysis and control that would ensure real prerequisites for the improvement of inancial situation of an enterprise. The economic activity of agricultural sector enterprises is not a topical object in the research ield. This leads to the lack of information in every enterprise in different aspects: accounting, asset management, documentation etc. The lack of information in its turn negatively affects lows of information in the enterprise; thus, leading to serious restrictions in internal control and consequently causing ineficient work of the system.The aim of the research is to study the problems of internal control in agricultural production process and to explore the possibilities for improvement of internal control in Latvia.
The authors have advanced the following tasks to achieve the set research aim: — to analyse opinions of different authors on the possibilities to improve the internal control; — to study the objects of internal control and applied methods within a production cycle of an agricultural enterprise; — to determine the objects and methods of internal control in crop and livestock production; — to explore the problems of internal control related to the prime cost of agricultural produce; — to determine the possibilities for improvement of internal control related to the use of material resources.
The authors identify the necessity for the analysis and internal control of agricultural production process. Therefore, the problem of understanding related to internal control is analysed in the research. Conclusions provide the insight into the application of internal control models from the practical point of view as well as they substantiate the necessity for the improvement of internal control models in agricultural sector enterprises.Key words: internal control, risk-based internal control, control of the production cycle.JEL code: M49
___________________________1 E-mail address: [email protected].
Introduction Eficiency of internal control system is affected not
only by the applied methods and procedures but also by the extent to which enterprises understand the speciication of their business activities. The research will outline possibilities for the improvement of internal control through the general analysis of enterprise
activities. Risk factors having negative effect on the objects of control were determined summarising the data. The objects of control and risks affecting them are linked over time and space; hence, it may be concluded that they would depend on the speciics of an enterprise’s activity. The research authors search for opportunities to improve the internal control in agricultural enterprises.
The authors believe that the control science should
be exactly developed for certain groups of enterprises. It is necessary to distinguish areas or zones where the question of internal control requires advanced research. Such grouping will help determine general characteristics of industry and opportunity to prepare information applicable for industrial enterprises. It is possible to make grouping by types of business activity. Peculiarities of internal control are marked with peculiarities of business process. Therefore, enterprises that are engaged in only one type of business activity will have many contact points, which indicate features for the research scope of internal control. Discussions could lead to the opportunity to outline other features of classiication that according
to the authors provide preconditions for the development of science.
The paper aims to study the problems of internal control of agricultural production process and to explore the possibilities for improvement of internal control in Latvia.
To achieve the research aim, the authors have used the following theoretical research methods as the analysis of literature and methods of data processing: methods of statistical analysis, methods of economic analysis, and economic-mathematical methods. The method of analysis and synthesis, a logically constructive method, and a monographic method were also used in the research.
The performed analysis and research are based on international standards, statistical data, foreign and Latvian research papers, data of Latvian and foreign periodicals, Internet sources, and unpublished data of enterprises.
The authors think that the main object of internal control in agricultural enterprises is exactly the cycle of production. The cycle of production joins all the processes with the common aim to produce inished goods or agricultural produce. The following procedure of control is recommended with regard to the production
cycle:
1) to determine the validity of planning regarding primary production (crop and livestock). The possibility for the performance of planned tasks and
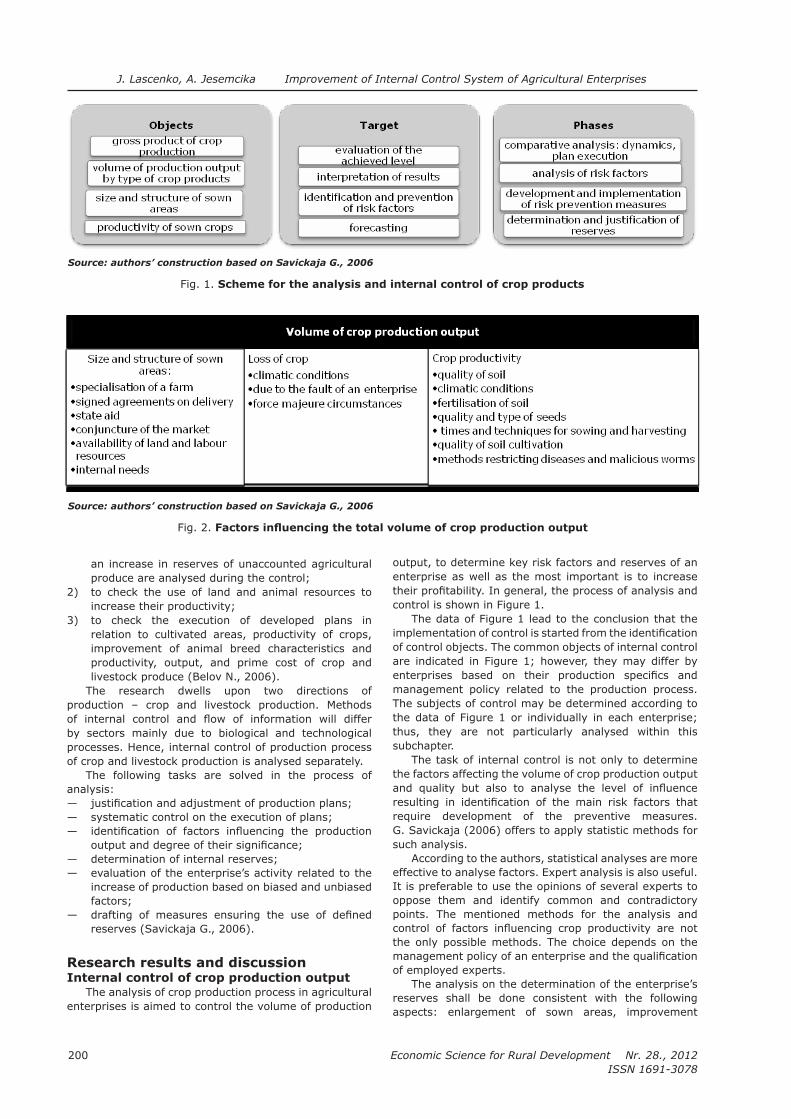
Economic Science for Rural Development Nr. 28., 2012
ISSN 1691-3078
200
an increase in reserves of unaccounted agricultural
produce are analysed during the control;2) to check the use of land and animal resources to
increase their productivity;3) to check the execution of developed plans in
relation to cultivated areas, productivity of crops, improvement of animal breed characteristics and productivity, output, and prime cost of crop and livestock produce (Belov N., 2006).
The research dwells upon two directions of production – crop and livestock production. Methods of internal control and low of information will differ by sectors mainly due to biological and technological processes. Hence, internal control of production process of crop and livestock production is analysed separately.
The following tasks are solved in the process of analysis:
— justiication and adjustment of production plans; — systematic control on the execution of plans; — identiication of factors inluencing the production
output and degree of their signiicance; — determination of internal reserves; — evaluation of the enterprise’s activity related to the
increase of production based on biased and unbiased
factors; — drafting of measures ensuring the use of deined
reserves (Savickaja G., 2006).
Research results and discussionInternal control of crop production output
The analysis of crop production process in agricultural
enterprises is aimed to control the volume of production
output, to determine key risk factors and reserves of an enterprise as well as the most important is to increase their proitability. In general, the process of analysis and control is shown in Figure 1.
The data of Figure 1 lead to the conclusion that the
implementation of control is started from the identiication of control objects. The common objects of internal control are indicated in Figure 1; however, they may differ by enterprises based on their production speciics and management policy related to the production process. The subjects of control may be determined according to the data of Figure 1 or individually in each enterprise; thus, they are not particularly analysed within this subchapter.
The task of internal control is not only to determine the factors affecting the volume of crop production output and quality but also to analyse the level of inluence resulting in identiication of the main risk factors that require development of the preventive measures. G. Savickaja (2006) offers to apply statistic methods for such analysis.
According to the authors, statistical analyses are more effective to analyse factors. Expert analysis is also useful. It is preferable to use the opinions of several experts to oppose them and identify common and contradictory points. The mentioned methods for the analysis and control of factors inluencing crop productivity are not the only possible methods. The choice depends on the management policy of an enterprise and the qualiication of employed experts.
The analysis on the determination of the enterprise’s reserves shall be done consistent with the following aspects: enlargement of sown areas, improvement
Source: authors’ construction based on Savickaja G., 2006
Fig. 1. Scheme for the analysis and internal control of crop products
Source: authors’ construction based on Savickaja G., 2006
Fig. 2. Factors inluencing the total volume of crop production output
J. Lascenko, A. Jesemcika Improvement of Internal Control System of Agricultural Enterprises

201
Economic Science for Rural Development Nr. 28., 2012
ISSN 1691-3078
of their structure, and increase of crop productivity
(Figure 3).If an enterprise implements the policy of reserve
determination, then the main task of internal control is to analyse the policy advantages, factors inluencing its application, and the eficiency of its economic use. The enterprises not implementing this policy are recommended to analyse the eficiency of the use of enterprise’s assets within the internal control. The analysis may be done according to the directions shown in Figure 3. The obtained results will allow identifying the unused reserves that in turn improve the eficiency of use of the enterprise’s assets and the volume of production output.
The range of internal control issues offered by the
authors enables the establishment of a logical and successive mechanism of control, which covers the entire production and the main values characterising its eficiency. The control of crop production volume is based on planned and existing agro-technical data that enable opportunity to control the compliance of production process with the accepted standards and to identify deviations and their causes; thus, generally improving the productivity of production
process.
Internal control of livestock production The initial stages of livestock production and crop
production internal control are similar. Purposes and stages of control are identical with the purposes and stages of crop production control.
Enterprises, which apply the performance scheme of internal control offered by the authors, may establish a suitable internal control model. However, the content of information and sources for its accumulation will be such elements of internal control system that have to be individually deined based on the speciics and experience of an enterprise
activity. Denoting the main risk factors, it is necessary to
establish a set of measures that would prevent risk factors or reduce their negative effect on the livestock
production volumes similar as for crop production. Besides, enterprises have to identify the degree of inluence of each factor on the volume of production output. It is possible to apply statistic methods and experts’ evaluation etc.
The mentioned factors of inluence have already been largely indicated by the area of control’s activity. It is very important to nominate the responsible persons, to draft technological procedure and to follow constantly the execution of the plan. From the part of management, it is hard to control completely the activities of specialists, since it requires special knowledge, which possibly the management does not possess. The evaluation of other experts should be considered in this case.
The analysis of current reserves in livestock
production enterprises and evaluation of their
application possibilities will have a positive impact on the volume of production output. The main directions for determination of reserves are outlined in
Figure 5.
Source: authors’ construction based on Savickaja G., 2006
Fig. 3. Directions of reserves for the increase of the volume of crop productivity
Source: authors’ construction based on Savickaja G., 2006
Fig. 4. Factors inluencing the total volume of livestock production output
J. Lascenko, A. Jesemcika Improvement of Internal Control System of Agricultural Enterprises

Economic Science for Rural Development Nr. 28., 2012
ISSN 1691-3078
202
The main directions for the analysis of reserves are determined when analysing the degree of impact of each factor on the total volume of production. If the analysis outlines a factor whose increase or reduction of the characteristics would have a positive impact on the volume of production, it is useful to analyse the possibilities of an enterprise to inluence this characteristic feature. It is economically reasonable to search for other ways to increase the production volume, only having knowledge on the enterprise’s reserves.
The abovementioned leads to the conclusion that the control of livestock production volume requires a lot of knowledge related exactly to technological process. To reduce the impact of this factor on the eficiency of internal control, it is useful to develop technological procedure in enterprises, and to use the opinions of experts who are not employed by the enterprise. Based on the offered method, livestock production enterprises may develop or improve the mechanisms of internal control system and increase the results of their economic performance.
Internal control of agricultural products prime cost
Reduction of costs is the target, which all enterprises are eager to achieve, since there is a direct link between the enterprise costs and its proit. The level of prime cost characterises the eficiency of production process and serves as one of its control indicators.
The authors believe that the analysis and control
of prime cost provides feasible preconditions for the improvement of business eficiency.
The authors agree with the opinion of G.Savickaja that the control and analysis of prime cost have the following aims:
— control on the execution of the plan for the reduction of prime cost;
— analysis of factors inluencing the prime cost; — determination of reserves for the reduction of prime
cost; — probability analysis for the use of determined
reserves and control on the application of measures for the use of introduced reserves.
It is useful to start the introduction or improvement of control measures from the deinition of a control object (Figure 6). All the expenses analysed by different breakdowns will serve as control objects for the internal control of prime cost.
The process of prime cost internal control and analysis offers the application of phases that are similar to the analysis of crop and livestock production. In the opinion of authors, the mentioned phases allow achieving targets, and they are logical and practically applicable in agricultural enterprises.
V. Ovsijcuk and G. Savickaja in their research believe that the breakdown of costs by responsibility centres plays a signiicant role in the control of prime cost development. The authors agree with this opinion, since the establishment of responsibility centres enables provision of not only qualitative information or the breakdown principle of undertaken responsibilities but also increases the management activity in the process of cost control. The responsible persons administer their cost items and take full responsibility for the
Source: authors’ construction based on Savickaja G., 2006
Fig. 5. Directions of reserves for the increase of the volume of livestock productivity
Source: authors’ construction based on Savickaja G., 2006
Fig. 6. Scheme for the analysis and control of agricultural production prime cost
J. Lascenko, A. Jesemcika Improvement of Internal Control System of Agricultural Enterprises

203
Economic Science for Rural Development Nr. 28., 2012
ISSN 1691-3078
sums included into these items. It means that the breakdown of cost accounting by responsibility centres includes not only the identiied methods and techniques of internal control but also ensures creation of control
environment and inluences the self-conidence of employees.
The opinion of the research authors on the mentioned question coincides with the group of scientists who identify the concepts of “responsibility centre” and “place of cost formation”. Identifying these two concepts, it is possible to implement internal control eficiently and create a logical scheme of internal control. Primarily, the place where costs are incurred is determined. It may be a department or a concrete object. Only after that, the persons who are in direct relation with the object of control are determined. Responsibility centres, i.e. persons which are responsible for the changes in the amount of costs, are determined within the analysis. Therefore, in the range of this research, the concept “responsibility centre” means specialists who control accounting of costs.
The control of costs may positively inluence the level of agricultural production prime cost; however, it is not considered as one of the methods for its reduction. The control and analysis of reserves to reduce the prime cost of production are one of the methods.
Sources of reserves for reduction of prime costs may be as follows:
— reduction of the volume of production output; — reduction of the level of eligible costs.
The mentioned sources allow concluding that the discussed processes (production, control of costs) contribute to the reduction of prime cost. G. Savickaja in her research has outlined this correlation in the following formula:
, (1)
where:
– actual level of production prime cost;
– possible level of production prime cost;
– actual costs of production;
– reserve for reduction of production costs;
– additional costs necessary for the use of resources;
– actual volume of production;
– reserve for the increase of production volume (Savickaja G., 2006).
According to the authors, the offered model precisely outlines the correlation occurred in the production
process of agricultural produce. It is possible to determine objects of internal control and to develop eficient control mechanisms based on this model. Values of two indicators: reserve for the reduction of production costs and reserve for the increase of production volume
restrict the application of this model. Calculations are based on statistical methods and principles of the economic analysis. Studies of the research papers of several authors lead to the conclusion that algorithms of calculations are complex; it means that not all enterprises would be able to make analysis consistent with the theoretical guidelines. Agricultural enterprises have to assess the necessity for the control of prime cost level and they have to choose a suitable model of analysis and control that could be practically applied in a particular
enterprise.
Internal control of the use of material resources
Indicators of the production quality affect not only its sales price but the sales possibility in general. For example, several values of grain quality – humidity, diseases, maturity etc. are checked prior to selling grain. If an enterprise does not control materials used in the production process, then it increases the risk of impossibility to sell inished produce on the market. Hence, an enterprise may suffer losses from its business activity.
The process of analysis and control of material resources in agricultural enterprises does not differ from the implementation measures of control in enterprises of other industries. The items related to agriculture and agricultural process may not be disclosed through the balance sheet; hence, it may not be applied for the purpose of analysis. Therefore, it is necessary for agricultural enterprises to follow the theoretical standards and experience to be able to develop an eficient system for internal control of materials.
The analysis and control of material resources are implemented in the following directions:
— analysis and control of material resources support; — analysis and control of material situation necessary
for the production process; — analysis and control of the use of materials; — factorial analysis of materials capacity; — analysis and control of the level of production
deiciencies (Belov, N., 2006).The research authors agree with the opinion of V.
Jermolajeva who believes that exactly the economic analysis having the following targets plays an important role in the economy of material resources and the analysis and control of effective use:
— necessary volume of material resources for an enterprise;
— interpretation of indicators on the dynamics of fulilment of plans;
— determination of factors inluencing the deviations of the actual indicators from the planned ones;
— quantitative evaluation of inluenced factors and evaluation of internal reserves.
Based on the determination principles of internal control, it is advisable for agricultural enterprises to identify the main materials that have the largest impact on the production process. It allows narrowing the time of control and to control clearly materials based on the nomenclature. Thus, the authors suggest applying the coeficient ( ) for the provision of material resources:
J. Lascenko, A. Jesemcika Improvement of Internal Control System of Agricultural Enterprises

Economic Science for Rural Development Nr. 28., 2012
ISSN 1691-3078
204
(Savickaja G., 2006). (2)
J. Lascenko, A. Jesemcika Improvement of Internal Control System of Agricultural Enterprises
If the coeficient is over 1, then there is an excess in stock, if the coeficient is below 1 – there is a risk of ceasing production (Analiz materialjnih ..., s.y.). According to the authors, the use of this equation is very practical for agricultural enterprises. Naturally, it does not include complex calculations; however, the achieved result relects actual provision of materials and raw materials for the production
process.
Conclusions, proposals, recommendations 1. Summarising the analysed problems, it can
be concluded that the economic analysis, which includes also the statistical methods, plays a signiicant role in the implementation of internal control process in agricultural
enterprises. 2. Objects of the production process in crop and
livestock production differ due to the used resources, types of agricultural produce, and other factors.
3. Internal control and analyses of the agricultural
production process have common aims and implementation phases.
4. For the implementation of internal control of agricultural produce, it is important to create and control production plans in enterprises. It is useful to develop technological procedure
and to use the analysis of expert evaluation in
enterprises.5. In the range of internal control, special attention
should be paid to the analysis of factors inluencing the volume of agricultural production output that would enable enterprises to determine the main risks and to undertake preventive measures for risk elimination.
6. It is necessary to analyse and control reserves
belonging to the enterprise in the scope of internal
control to increase the volumes of agricultural production output.
7. Agricultural enterprises have to evaluate the
necessity for the algorithm of calculations according to the level of prime cost control, and they have to choose a suitable model of analysis and control that is possible to apply in practice.
Bibliography 1. Analiz materialjnih resursov predprijatija (Analysis of
Material Resources of Enterprise). Retrieved: http://
cde.ael.ru/electronik/kompl_ek_an/8.html. Access: 16 November 2011.
2. Belov, N. (2006). Kontrolj i revizija v seljskom hozjaistve (Control and Audit in Agriculture). Moskva: Finansi i statistika. str. 392.
3. Ovsijchuk, V. (2007). Formirovanije
sistemi vnutrihozjaistvennogo kontrolja v seljskohozjaistvennih organizacijah (Establishment of Interbusiness Control Systems in Agricultural Organisations). Disertacija. Moskva, str. 384.
4. Podkhodi k postroeniju sistem vnutrennego kontrolja (Approaches to Development of Internal Control Systems). Retrieved: http://bpm.ucoz.ru/publ/sistema_vnutrennego_kontrolja/
podkhody_k_postroeniju_sistem_vnutrennego_kontrolja/18-1-0-16. Access: 16 November 2011.
5. Savickaja, G. (2006). Analiz hozjaistvennoj dejateljnosti predprijatij (Analysis of Business
Activity of Organisations). АPK. Moskva: Novoje
znanije, str. 652. 6. Smirnov, A. Kak razrabotakj sistemu vnutrennego
kontrolja (How to Develop Internal Control System). Retrieved: http://interimanager.blogspot.com/2010/04/blog-post_12.html. Access: 16 November 2011.
7. Ucjot biologicjeskih aktivov v sootvetstviji s
metodicjeskimi rekomendacijami (Accounting of Biological Assets Consistent with Methodical Guidelines). Retrieved: http://www.glavbukh.ua/glavbuh/met/met_3193.html. Access: 16 November 2011.

205
Economic Science for Rural Development Nr. 28., 2012
ISSN 1691-3078
G. Mazure Mortgage Lending Market Development Tendencies Within the Context of Global Financial Crisis
___________________________1 E-mail address: [email protected]
Mortgage Lending Market Development Tendencies Within the Context of Global Financial Crisis
Gunita Mazure1, Dr.oec., assoc. professor Faculty of Economics, Latvia University of Agriculture
Abstract. Recovery from the global inancial crisis remains fragile. Persistent risks to economic health include high unemployment, debt, and low growth in developed countries, and access to inancing for developing countries. Though, Latvia has started to recover from deep recession and its recovery has been recognised internationally. Crediting and especially mortgage lending is one of the aspects characterising economic and inancial recovery and viability of any state. Mortgage lending is the primary mechanism used in many countries to inance private ownership of residential and commercial property. The aim of the particular research is to analyse the development of mortgage lending market in individual world countries within the context of global inancial crisis. The research allowed concluding that the world inancial decline of 2008 and 2009 has affected the economies of the Baltic States including Latvia more severely than the rest of the EU Member States and even the USA. The economic recession stopped in 2010, since real GDP recorded a moderate decrease (of 0.3%) after the tremendous decline of 2009 (-18%). Nevertheless, the world is still circumspect regarding borrowing and almost the same may be said about the commercial banks and their attitude towards lending.Key words: mortgage, inancial crisis, lending, interest rates, households.JEL code: G01, G15, G21
Introduction Mortgage lending is a special system of crediting with
methods and approaches different from other types of crediting. Attraction and use of long-term resources in mortgage lending as well as trading with mortgage bonds on capital market using sales revenues to cover the necessity for long-term loans serves as the economic basis for mortgage lending system. Mortgage market development is likely to be a key factor in overall inancial market development. Dwight M. Jaffee and Bertrand Renaud (1997) argue that an eficient mortgage market acts as a positive externality for the other capital markets, creating pressure for higher eficiency in these markets, while a poorly functioning mortgage market is likely to “pollute” other inancial markets with
its ineficiency. In Latvia, mortgage loans became outstanding during
the past decade, which may be explained by the revival of banking sector and increase of population welfare. However, the inancial situation has altered for the period of 2008-2010, thus, simultaneously bringing changes in the sector of banking and crediting.
The inancial crisis starting in 2008, and the important role of mortgage loans not only in the subprime crisis in the United States but also in some EU markets, has acted recently as a catalysing factor to change the traditional
perspective. Mortgages and related asset classes, such as developer loans, are so large in proportion to bank assets that, as the crisis developed, the problems on some EU mortgage markets no longer remained conined to national boundaries (Dübel H.J., Rothemund M., 2011).
Mortgage lending has been analysed and discussed
by different researchers (Dübel H.J., Rothemund M. 2011; Novoselova A., 2001; Jaffee D.M., Renaud B., 1997; Wyman M.O., 2005; Franke, A., Gyntelberg J.,
Kjeldsen K., Person M., 2004; Boyce A., 2009; Campbell J.Y., Cocco J.F., 2002; Capozza D.R., Kazarian D., Thomson T.A., 1998; Jaffee D. et al., 2003; Schwartz E.S., Torous W.N., 1992; Andrejeva V., 2005; Tirole J., 2002; Korsaks U., Adamson, A., 2001; Chiquier L., Hassler O., Lea M., 2004; Retsinas N. P., Belsky E.S., 2008; Buch J., Rhoda K.L., James Talaga J., 2002; Ijevleva K., 2011 etc.); though all of them have basically analysed mortgage lending in particular countries or mortgage lending in relation to real estate or housing aspects.
The changing situation in inancial world has promoted the research on mortgage lending market and recent inancial crisis. Therefore, the research hypothesis
is that the global inancial crisis has left marked traces for the expansion of mortgage lending market. The aim of the research is to analyse the development of mortgage lending market in individual world countries within the context of global inancial crisis. The following research tasks have been advanced to achieve
the set aim: 1) to analyse residential mortgage debt in selected
world countries in relation to the changes of interest rates on mortgage loans;
2) to analyse the dynamics of mortgage lending on Latvia mortgage lending market.
The research period covers the years 2000-2010, while in case of Latvia, the period is shortened for the years 2004-2010.
The information compiled by the European Mortgage Federation, Hypostat, information compiled by the Bank of Latvia and Central Statistical Bureau of the Republic of Latvia, scientiic publications of foreign and local researchers, and other materials have been used for the purpose of the study.

Economic Science for Rural Development Nr. 28., 2012
ISSN 1691-3078
206
The research is mainly based on the monographic descriptive method as well as the methods of analysis and synthesis are used to study the problem elements and synthesise coherencies or formulate regularities.
Research results and discussionAnalysis of residential mortgage debt to GDP ratio in selected world countries in relation to the changes of interest rates on mortgage loans
The inancial crisis of 2007-2008 has been called by leading economists the worst inancial crisis since the one related to the Great Depression and it is
contributed to the failure of key businesses declines in
consumer wealth estimated in the US dollars, substantial inancial commitments incurred by governments, and a
signiicant decline in economic activity. Many causes have been proposed, with varying weight assigned by experts. Both market based and regulatory
solutions have been implemented or are under consideration, while signiicant risks remain for the world economy (Global Financial Crisis…, s.y.).
The global economic downturn of 2008 and 2009 affected the Baltic economies more severely than the rest of the EU in 2009, with no clear signs of recovery in 2010. Latvia followed this trend, although the economic recession stopped in 2010 as real GDP recorded a moderate fall (of 0.3%) after the tremendous plunge of 2009 (-18%). The huge process of deleveraging from excess households’ borrowing and the prolonged downturn in the housing market after the crash of 2008 and 2009 continued to impact the Latvian economy during 2010. Government consumption dramatically fell by 11%, as did gross ixed capital formation (19.5%). As a result, domestic demand contribution was again negative, even much less than
in the previous year (0.9% in 2010 against 32.2% in 2009). The economic downturn placed public inances under serious pressure, as government debt to GDP ratio went up from 9% in 2007 to 44.2% in 2010; yet, the
government deicit remained above the 3% Maastricht ceiling in 2010 (7.7% of GDP) but decreased compared with 2009 (9.7%) (Hypostat, 2011). Residential mortgage debt to GDP ratio in the Baltic States, Norway, and the USA for the period of 2000-2010 is outlined in Figure 1.
The analysis of residential mortgage debt to GDP shows that the USA has been the most active borrower on the mortgage market. In 2005, the USA has reached the peak of residential mortgage debt equalling to 88.9% of GDP or showing a 32.5 percentage points increase compared with 2003. Generally, the USA shows a luctuating trend with an increase in 2004-2005 and a decrease in 2007 and 2009-2010. Interesting that an increase of 9.5 percentage points was observed in 2008 compared with the previous year. However, the decline of the GDP amount may explain the increase of residential mortgage debt to GDP ratio. In 2010, the average residential mortgage debts of the
EU-27 were about one-third that of the USA, or 52.4% of GDP against 76.5%.
Dübel H.J. and Rothemund M. (2011) have concluded that it is impossible to speak of a European model. They argue that three main categories can be distinguished within the EU, where transition countries generally feature the lowest debt ratios between 20% and 30% of GDP, with the notable exception of the Baltics (Estonia 54% of GDP, even higher than Latvia’s 46%). These countries are followed by a range of ‘conservative’ established markets in the Central Europe with ratios between 40% and 60% of GDP. Finally, most peripheral and Northern European retail inance markets are highly leveraged with ratios between 80% and 140% (Ireland - 79%, Spain - 83%, Portugal - 84%, the Netherlands - 102%, the UK - 108%, and Denmark - 139%). In both, the irst and the third category – transition countries and periphery – household
debt levels have been strongly rising in the past 15 years
(European Credit Research Institute statistical package 2010, see in Dübel H.J. and Rothemund M. 2011). The basic determinant of USA and European household debt
Source: author’s construction based on Hypostat, 2011
Fig. 1. Residential mortgage debt to GDP ratio in selected countries of the world for 2000-2010, %
G. Mazure Mortgage Lending Market Development Tendencies Within the Context of Global Financial Crisis

207
Economic Science for Rural Development Nr. 28., 2012
ISSN 1691-3078
levels has been a low interest rate environment, with low personal savings rates in the USA and a more varied picture in the EU.
Notably different igures, however, the same trend, are seen when analysing the data of Hypostat, which has collected information from the European Mortgage Federation National Experts, European Central Bank, Eurostat, national central banks, Bureau of Economic Analysis, Federal Reserve, and International Monetary Fund. According to Hypostat (selected data included in Figure 1), mortgage debt of Estonia was 41.7% of GDP, while it was 36.2% and 21.8% for Latvia and Lithuania respectively in 2010. The lowest ratio was for Romania – 5.6% of GDP. The highest ratio was for the Netherlands – 107.1%, Denmark – 101.4%, the USA – 76.55, and Norway – 70.3% of GDP.
In Latvia, the slowdown in lending started in early 2007, driven by concerns among foreign banks on their overexposure to the Baltic States, and at the end of 2007, growth rate in mortgage lending halved compared to what was recorded in 2006 (42.1% vs. 88.1%). As a result of the crisis, mortgage lending in 2008 grew by only 7.3%, while it went into recession for the irst time in 2009, having fallen on the previous year by 4.6%. Recession in mortgage lending continued in 2010 and the same rate of decline as in 2009. Total mortgage debt as a percentage of GDP grew extremely rapidly and went from 0.7% in 1999 to the peak of 36.8% in 2009, after moving around 30% in the three previous years (Hypostat, 2011).
Interest rate developments on new mortgage loans
After the onset of the inancial crisis, which followed the Lehman Brothers crash in September 2008, and also in order to contain the sharp deterioration in the
macroeconomic environment, central banks made several consecutive cuts in their respective policy rates
between Q4 of 2008 and Q2 of 2009 down to historical lows (Hypostat, 2011). Figure 2 shows representative
interest rates on new mortgage loans for several world countries, where interest rates were available for the selected years.
In 2000, the highest interest rates on new mortgage loans were observed in the Baltic States: Estonia (13.1%), Latvia (11.4%), and Lithuania (9.93%). This is the period characteristic with high interest rates in commercial banking sector, in general. The next period or the year 2005, which is marked as the beginning of economic growth shows a sharp decrease in interest rates. In Estonia, the decline equalled to 9.4 percentage points, while Latvia and Lithuania experienced a reduction by
6.85 and 6.57 percentage points respectively. On the contrary, the interest rates grew in 2008 after the beginning of the inancial crisis. Irrespective of the fact that central banks lowered the rate of reinancing, commercial banks were circumspect and increased lending rates to secure against the possible losses. In 2010, the highest interest rates on new mortgage loans stood for Latvia (4.15%) and the USA (4.69%), while the lowest rates among the analysed countries were observed in Finland (2.17%) and Austria (2.71%). Certainly, the remarkably low interest rates in Finland have boosted the development of housing market. Low interest rates, especially, on short-term loans, are based on strong consumer conidence in the economy. Interest rates in the USA, however, have not luctuated so extremely as in the Baltic States and Norway. Thus, interest rates in the USA have stayed almost unchanged for 2006 and 2007 and showed a slight 1-percentage point decline in 2009 and a 0.35-percentage points increase in 2010 compared with the respective previous periods. The relatively stable situation for interest rates is mainly explained by the inancial policy implemented in the USA. In 2010, the USA ended the worst recession since the Great Depression and most macroeconomic indicators started to indicate recovery. It is noted that interest rates on mortgage loans were on historically
low levels.
Source: author’s construction based on Hypostat, 2011
Fig. 2. Representative interest rates on new mortgage loans for the selected years, %
G. Mazure Mortgage Lending Market Development Tendencies Within the Context of Global Financial Crisis

Economic Science for Rural Development Nr. 28., 2012
ISSN 1691-3078
208
Development dynamics of mortgage lending market in Latvia
The assessment of mortgage lending comprises several factors inluencing the growth of mortgage lending. These factors relate to various spheres of activities and differently affect the development of mortgage lending. Therefore, they may be classiied into four groups consistent with the improvement of mortgage lending system:
— factors related with development of the national economy - GDP growth, development of construction and housing, real estate market, and increase of real estate prices;
— factors related with banking activities - interest rates on mortgage loans, repayment terms, availability and suficiency of credit resources, amount of loan against the value of collateral, competitiveness among banks;
— factors related with the population welfare level – increase of population income, quantity and quality of housing, willingness of population for larger living areas and more qualitative housing;
— factors related with legislation and regulating standards - standards of Mortgage Bonds Law and other legislative and regulatory enactments, aspects of taxes and tax system, state aid programmes (Andrejeva V., 2005).
The analysis on the development of mortgage lending market in Latvia shows a rapid increase for the period of 1997-2008. The most expressive growth in mortgage lending or a twofold increase was observed in 2005 compared with 2004. Fast increase in mortgage lending was at the end of 2006 and the beginning of 2007, when the increase of mortgage loans was very high. The inancial crisis of 2008 affected mortgage lending market in Latvia. Nevertheless, the situation on mortgage market was tense; it was not critical, since the demand for housing and qualitative living areas did not decrease dramatically. Thus, mortgage lending market did not ceased its operation and even starting to show the signs of recovery in 2010 and 2011. Certainly, crediting has turned to be less proitable due to the negative aspects caused by the global inancial crisis and this explains also the decline of borrowings and lendings in the banking sector. Several commercial banks have stopped mortgage
lending to avoid risks related with still quite unstable situation on the real estate market. These banks are occupied with the keeping of the credit portfolio quality, while other commercial banks have resumed active crediting and try to involve new clients on mortgage lending market. It shall be mentioned that the prices of housing have dropped drastically compared with the housing boom of 2007-2008 and this aspect prevents the potential borrowers from active involvement in lending market.
Table 1 includes the data on mortgage loans for the period of 2004-2010 and their comparative analysis in relation with mortgage loan amount per one resident and one household for the same period.
At the end of 2005, the amount of disbursed mortgage loans reached LVL 2806.7 million. This amount included new mortgage loans equalling to LVL 1922 million of which LVL 1207 million were aimed for the purchase of housing. Large increase of crediting was also seen in 2006, when the amount of mortgage loans grew by 89.2% compared with the previous year. Increase, though, at a lower rate, continued in 2007 and 2008; thus, reaching the amount of LVL 8287.2 million in 2008. This year is considered as a peak year for mortgage lending, since decline in crediting started from 2009 due to the inancial crisis. However, for the two years of crisis, the decrease in lending is not so rapid as the increase experienced within the years of economic growth. In 2007, the speed of crediting was hindered by the government of Latvia, which undertook several measures stepping out of the anti-inlationary policy. Therefore, the amount of loans disbursed in the second half of 2007 declined by 25% compared with the irst half of 2007. The growth rate related with the amount of disbursed loans continued to slow down also in 2008, when the banks implemented more secure policy of crediting and started to experience problems with attraction of inancial resources. Hence, the increase was only 12.6%. An expressed decrease started in 2009 and 2010, when the amount of disbursed mortgage loans decreased by 4.7% and 9.1% compared with the respective previous periods.
The amount of disbursed mortgage loans was compared with the number of population and households. Here, the analysis showed that in 2010, the mortgage
Table 1
Amount of disbursed mortgage loans in Latvia for the period of 2004-2010
YearMortgage
loansmln. LVL
% vs. the previous
year
% vs. the base year
(2004)
Average per one
resident, LVL
% vs. the previous
year
Average per one
household, LVL
% vs. the previous
year
2004 1392.2 100 - 602.7 100 1529.0 100
2005 2806.7 101.6 101.6 1220.3 102.5 3099.3 102.7
2006 5311.0 89.2 281.5 2319.2 90.1 5871.1 89.4
2007 7359.9 38.6 428.7 3228.0 39.2 8183.1 39.4
2008 8287.2 12.6 495.3 3650.7 13.1 9216.2 12.6
2009 7899.8 -4.7 467.4 3495.5 -4.3 8791.2 -4.6
2010 7180.7 -9.1 415.8 3191.4 -8.7 8080.9 -8.1 Source: author’s calculations based on the Bank of Latvia and CSB data (2004-2010)
G. Mazure Mortgage Lending Market Development Tendencies Within the Context of Global Financial Crisis

209
Economic Science for Rural Development Nr. 28., 2012
ISSN 1691-3078
loans disbursed per one resident averaged to LVL 3191.4, meaning that every inhabitant of Latvia including small children has a mortgage debt of almost LVL 3200 on average. At the same time, each household has a debt of more than LVL 8000 on average. The igures are tremendous. Certainly, the igures are smaller by 12.6% and 12.3% compared with the peak year 2008. Unfortunately, the decline in the amounts results not only from the smaller amounts of loans but mainly to the decreasing number of population and even
households.Assuming that one household has received one
mortgage loan for the purchase, reconstruction, or repair of housing, then 10.9% and 12.4% of all households had received mortgage loans in 2008 and 2010 respectively. The average loan per household equalled to LVL 8286 in 2008 and LVL 7179 in 2010. Speculative transactions were one of the reasons for such high amount of mortgage loans, while the decrease in wages affected the possibility to repay loans. In 2010, the recovery of housing market was observed in Latvia, when construction and reconstruction of housing started to
overcome the collapse of 2008 and 2009. This means that different trends in mortgage lending could be noticed in the coming years.
Conclusions, proposals, recommendations 1. Mortgage lending is a special system of crediting
with methods and approaches different from other types of crediting. Attraction and use of long-term resources in mortgage lending as well as trading with mortgage bonds on capital market using sales revenues to cover the necessity for long-term loans serves as the economic basis for mortgage lending system.
2. The world inancial downturn of 2008 and 2009 affected the economies of the Baltic States including Latvia more severely than the rest of the EU Member States and even the USA. The economic recession stopped in 2010, since real GDP recorded a moderate decrease (of 0.3%) after the tremendous decline of 2009 (-18%). Nevertheless, the world is still circumspect regarding borrowing and almost the same may be said about the commercial banks and their attitude towards lending.
3. In Latvia, the slowdown in lending started in early 2007, driven by concerns among foreign banks about their overexposure to the Baltic States, and at the end of 2007, the growth rate in mortgage lending halved compared with what was recorded in 2006.
4. In Latvia, total mortgage debt as a percentage of GDP grew extremely rapidly and went from 1.6% in 2000 to the peak of 36.8% in 2009, after moving around 30% in the three previous years. In 2010, it decreased slightly to 36.2%. In the EU-27 Member States, the peak is still observed in 2010 amounting to 52.4% of GDP.
5. Speculative transactions and decrease in wages being one of the reasons for high amount of mortgage loans in 2008 and inability to repay loans in the following years have affected the mortgage market most severely. Though, in 2010, the recovery
of housing market was observed in Latvia, when construction and reconstruction of housing started
to overcome the collapse of 2008 and 2009. This means that different trends in mortgage lending could be noticed in the coming years.
Bibliography 1. Andrejeva, V. (2005). Hipotekaras kreditesanas
sistemas attistiba. Problemas un risinajumi, promocijas darba kopsavilkums (Development of Latvian Mortgage Lending System. Problems and Solutions. Resume of PhD Thesis). Riga: RTU, 40 lpp.
2. Bank of Latvia. Statistics. Main Indicators. Retrieved: http://www.bank.lv/en/statistics/data-room/main-indicators/key-macroeconomic-indicators. Access: 14 February 2012.
3. Boyce, A. (2009). Principle of Balance Mortgage Lending: a Better Approach. Retrieved: http://
www.absalonproject.com/.../Principle-of-Balance-
Mortgage-... Access: 10 March 2012.4. Buch, J., Rhoda, K.L., James Talaga, J. (2002). The
Usefulness of the APR for Mortgage Marketing in
the USA and the UK. International Journal of Bank Marketing, Vol. 20, Issue 2, pp. 76–85.
5. Campbell, J.Y., Cocco, J.F. (2002). Household Risk Management and Optimal Mortgage Choice. Harvard Institute of Economic Research Paper No. 1946.
6. Capozza, D.R., Kazarian, D., Thomson, T.A. (1998). The Conditional Probability of Mortgage Default. Real Estate Economics, 26:3, pp. 359–389.
7. Central Statistical Bureau of the Republic of Latvia. Retrieved: htpp://www.csb.lv. Access: 28 February 2012.
8. Chiquier, L., Hassler, O., Lea, M. (2004). Mortgage Securities in Emerging Markets. Washington, DC: World Bank, p. 42.
9. Dübel, H.J., Rothemund, M. (2011). A New Mortgage Credit Regime for Europe Setting the Right Priorities. Retrieved: http://www.Ceps.Eu/Ceps/Download/5840. Access: 14 March 2012.
10. Frankel, A., Gyntelberg, J., Kjeldsen, K., Person, M. (2004). The Danish Mortgage Market. BIS Quarterly Review, March 2004. Retrieved: www.bis.org/speeches/sp071203.htm. Access: 23 January 2012.
11. Global Financial Crisis (s.y.). International Monetary Fund. Retrieved: http://www.businessteacher.org.uk/free-finance-essays/global-financial-crisis-international-monetary-fund/. Access: 30 March 2012.
12. Hypostat (2011). Hypostat 2010. A Review of
Europe’s Mortgage and Housing Markets. November 2011, EMF, p. 100.
13. Ijevleva, K. (2011). Hipotekarais credits ka komercbankas products (Mortgage Loan as a Commercial Bank Product). Ekonomika. Vadibas zinatne. LU Zinatniskie raksti, 766. sej. Riga: Latvijas Universitate, 33.-47. lpp.
14. Jaffee, D., (2003). The Interest Rate Risk of Fannie Mae and Freddie Mac. Journal of Financial Services Research, 24:1, pp. 5–29.
15. Jaffee, D.M., Renaud, B. (1997). Strategies to Develop Mortgage Markets in Transition Economies.
G. Mazure Mortgage Lending Market Development Tendencies Within the Context of Global Financial Crisis
Economic Science for Rural Development Nr. 28., 2012
ISSN 1691-3078
210
Retrieved: http://faculty.haas.berkeley.edu/jaffee/Papers/StrategiesMortgage.PDF. Access: 10 March 2012.
16. Korsaks, U., Adamsons, A. (2001). Mortgage Loan as Financing Tool in Production Sector. Finanses un kredits: problemas, koncepcijas, vadība. LU Zinatniskie raksti, 644. sej. Riga: Latvijas Universitate, 799 lpp.
17. London Economics (2005). The Costs and Beneits of Integration of the EU Mortgage Markets - Report
for European Commission, DG-Internal Market and Services. Retrieved: http://ec.europa.eu/internal_market/finservices-retail/docs/home-loans/2005-report-integration-mortgage-markets_en.pdf. Access: 18 February 2012.
18. Novoselova, A. (2011). Development of Mortgage Lending in Russia. Paper Presented at the Changing
Europe Summer School 2011. Retrieved: http://
www.changing-europe.org/download/CESS2011/novoselova.pdf. Access: 10 March 2012.
19. Retsinas, N.P., Belsky, E.S. (2008). Borrowing to Live: Consumer Mortgage Credit Revisited. Washington, DC, USA: Brookings Institution Press, p. 302.
20. Schwartz, E.S., Torous, W.N. (1992). Prepayment, Default and the Valuation of Mortgage Pass-through Securities. Journal of Business, 65, pp. 221–239.
21. Tirole, J. (2002). Financial Crises, Liquidity and the International Monetary System. Princetom and Oxford: Princeton University Press, pp. 1-13.
22. Wyman, M.O. (2005). Risk and Funding in European Residential Mortgages. Retrieved: http://www.genworth.se/.../Nordic%20Bulletin%20Q205.pdf. Access: 23 January 2012.
G. Mazure Mortgage Lending Market Development Tendencies Within the Context of Global Financial Crisis

211
Economic Science for Rural Development Nr. 28., 2012
ISSN 1691-3078
B. Mistre et al. Elements of the System of Financing Social Transfers and Assessment of Factors Affecting Them in Latvia
___________________________1 E-mail address: [email protected]
Elements of the System of Financing Social Transfers and Assessment of Factors Affecting Them in Latvia
Baiba Mistre1, Mg.oec.Department of Accounting and Finance, Latvia University of Agriculture
Aina Dobele, Dr.oec.
Department of Business and Management, Latvia University of Agriculture Ilva Rudusa, Mg.oec.
Department of Control Systems, Latvia University of Agriculture
Abstract. The aim of the present research paper is to investigate the elements forming the system of inancing social transfers and the factors affecting them.The system of inancing social transfers was investigated, the socio-economic factors affecting the state social insurance special budget were analysed, and the changes in revenues and expenditures of the state social insurance special budget were assessed in the present paper.The key element of the system of inancing social transfers is the state social insurance special budget.The research showed that there was a strong causal relationship between the state social insurance special budget’s revenues and the number of socially insured persons as well as the average wage subject to insurance contributions of socially insured persons.The number of socially insured persons is signiicantly affected by employment – the number of socially insured persons grows at a greater rate, with the increase in the number of employed individuals. An annual deicit has emerged in the state social insurance special budget since 2009, thus, decreasing the amount of accrued funds in this budget. If such a trend continues, a situation might emerge that the special budget lacks funds to pay out social transfers. Key words: social transfers, socially insured person, wage subject to insurance contributions of socially insured persons, system of inancing.
JEL code: G22, G29, I39
IntroductionSocial transfers consist of state pensions and
government beneits. Social transfers play a signiicant role in the system of social security, as they ensure the social protection of residents and affect their welfare in situations of social risk. The majority of social transfers are inanced from the state social insurance special budget (Mistre B., 2009).
Economic development and employment are prerequisites for a social security system of high level. The aging of population, a low birth rate, an increase in the average lifespan, and emigration affect the life of residents in Latvia. Due to these factors, the number of retired persons continues increasing, while the number of employees and payers of social contributions decreases, thus, signiicantly increasing the burden on social insurance system in the
country. To ensure a balanced budget, it is important to assess
the changes in revenues and expenditures of the state social insurance special budget.
Hypothesis: various socio-economic factors affect the state social insurance special budget.
The research aim is to investigate the elements forming the system of inancing social transfers and the factors affecting them.
The following tasks were set to achieve the research aim:
— to investigate the system of inancing social transfers; — to assess the changes in the state social insurance
special budget; — to analyse the socio-economic factors affecting the
state social insurance special budget.The monographic method, analysis and synthesis,
deduction and induction, and statistical analysis methods as well as the graphical method were employed in the present research.
Legal enactments of the Republic of Latvia, data of the Central Statistical Bureau (CSB) and the State Social Insurance Agency (SSIA), and studies in the ield of social insurance in Latvia were used in the present research.
Research results and discussion1. System of inancing social transfers
In Latvia, state social insurance pensions and beneits are inanced from the state social insurance special budget, while state social beneits are inanced from the central government basic budget and social assistance beneits are paid out from the respective local government budget.
The consolidated budget is divided into the central
government budget and local government budgets in Latvia. The central government budget, in its turn, is divided into the basic budget and the state social
insurance special budget.

Economic Science for Rural Development Nr. 28., 2012
ISSN 1691-3078
212
The state social insurance special budget is divided
into the state special budget for old age pensions, the employment special budget, the job injury special budget, and the disability, maternity, and sickness special budget (Figure 1).
Tax payers – entrepreneurs, businessmen, performers of economic activity (employers), and other persons – pay taxes, duties, and other fees, assessed in accordance with the procedure stipulated in legal acts, to the Treasury.
In accordance with the law “On State Social Insurance” (1997), an employer shall calculate a
mandatory contribution to be made for each employee from the object of contributions and pay it to a special budget account.
The object of mandatory contributions of an employer and employee is all calculated employment income from which personal income tax has to be deducted without deducting the non-taxable income, tax concessions, and eligible expenses for which the taxpayer has the right to reduce the taxable income. The object of mandatory contributions of a self-employed person is the freely selected income from the production of goods,
Source: authors’ construction based on laws of the Republic of Latvia
Fig. 1. System of inancing social transfers in Latvia
B. Mistre et al. Elements of the System of Financing Social Transfers and Assessment of Factors Affecting Them in Latvia

213
Economic Science for Rural Development Nr. 28., 2012
ISSN 1691-3078
performance of work, provision of services, creative and professional activity, and other income from economic activity. The minimum amount of the object of mandatory contributions was LVL 200 a month in 2011.
State mandatory social insurance contributions calculated and paid compose revenues of the state social insurance special budget.
Voluntary contributions to pension insurance, dividends from capital shares transferred to the state pension special budget and revenues from the sale thereof and other revenues compose this budget’s revenues in addition to mandatory contributions.
Considering the economic situation in the country, the Cabinet of Ministers sets rates of state mandatory social insurance contributions every year for respective
categories of socially insured persons (Table 1). In general case, if an employee had been insured for
all types of social insurance, the mandatory contribution rate was constant, i.e. 33.09% from 2003 to 2011
(Mistre B., Dobele A., 2010). For the other categories of socially insured persons,
who are not insured for all types of social insurance, mandatory contribution rates are lower and changeable.
The overall distribution of mandatory contribution rate by type of social insurance affects changes in the
mandatory contribution rates for the other categories of taxpayers.
Yet, the economic and demographic situation in the country determines the overall distribution of the mandatory contribution rate by type of social insurance.
To retain the social insurance system in a long-term, the rate for employees was signiicantly increased (by 2 percentage points) in 2011, while the rate for employers was kept at the level of previous years, i.e. 24.09%. Therefore, in general case, the total mandatory contribution rate was 35.09% in 2011.
The mandatory contribution rates for other socially insured persons also signiicantly rose in 2011, which was related with an increase in the mandatory contribution rate in general case.
The increase in the mandatory contribution rate was necessary to inance pensions and other social insurance services, as the number of employed individuals and their income signiicantly declined due to the economic crisis, thus, the revenues in the special budget decreased.
In accordance with the law “On State Social Insurance” (1997), the Treasury credits accounts of the special budget with mandatory contributions every day in accordance with a special budget revenue proportion stipulated in an annual state budget law.
Social insurance services are inanced from the state special budget for old age pensions only in accordance with the law “On State Pensions”, except disability pensions, and administrative expenses of this budget are also covered from it. From the employment special budget, social insurance services and administrative expenses of this budget are inanced in accordance with the law “On Unemployment Insurance”. From the job injury special budget, social insurance services and administrative expenses of this budget are inanced in accordance with the law “On Compulsory Social Insurance in Respect of Accidents at Work and Occupational Diseases”. From the disability, maternity and sickness special budget, social insurance services as well as disability pensions and administrative expenses of this budget may be inanced only in accordance with the law “On Maternity and Sickness Insurance” (On State Social Insurance, 1997).
Appropriations from the special budget cover only expenses that do not exceed real revenues, a budget surplus at the beginning of a iscal year, and borrowed funds from the central government basic budget. All appropriations become invalid at the end of a inancial year.
An annual state budget law is designed in a way that if revenues and a budget surplus of previous years in any
special budget do not cover expenditures of an annual budget while there is a budget surplus in another special budget, funds are redistributed to cover this deicit when calculating the revenue proportion for each special budget. If expected special budget revenues exceed
Table 1
Rates of state mandatory social insurance contributions for certain categories of taxpayers in Latvia in 2001-2011, %
Status of socially insured person 2001 2003 2009 2010 2011
Employees as well as domestic employees employed by a foreign employer who are insured for all types of social insurance. Total rate
Rate for employers
Rate for employees
35.0926.099.00
33.0924.099.00
33.0924.099.00
33.0924.099.00
35.0924.0911.00
Employees as well as domestic employees employed by a foreign employer who has reached the age of retirement. Total rate
Rate for employers
Rate for employees
28.2621.027.24
27.0119.677.34
28.3020.607.70
25.9418.887.06
29.3620.169.20
Self-employed persons 32.1 30.27 30.48 28.17 31.52
Self-employed persons having reached the age of retirement 28.17 26.92 28.04 25.65 29.05
Natural entities who manage a real estate - 28.09 25.24 24.13 27.98
Foreign employees employed by a foreign employer 32.8 31.06 31.13 28.99 32.22 Source: authors’ construction based on the Cabinet Regulations No. 452, 613, 1027, 1557, 1199
B. Mistre et al. Elements of the System of Financing Social Transfers and Assessment of Factors Affecting Them in Latvia

Economic Science for Rural Development Nr. 28., 2012
ISSN 1691-3078
214
expenditures, according to an annual state budget law, funds redistributed among the special budgets are related to the proportion of special budget revenues by taking
into consideration the changes made in the proportion of revenues during the previous years, thus, providing the necessary funding (On State Social Insurance, 1997).
After analysing the system of inancing social transfers, one can deine the key factors that affect revenues and expenditures of the state social insurance special budget; they are wage subject to state social insurance contributions and number of socially insured persons.
2. Analysis of the state social insurance special budget
To assess the role of the state social insurance special
budget in Latvia, it is important to identify the proportions of expenditures on state social insurance and state social beneits in the GDP of Latvia (Table 2).
Table 2 data show that the GDP grew in the period of 2002-2008, which may be explained by the fact that economic growth was observed in the country. The expenditures on social insurance increased during this period, as the average amounts of social insurance pensions and beneits rose (Mistre B., Muska A., 2011). However, the proportion of expenditures on state social insurance in GDP declined by 2.8 percentage points in the period of 2002-2008.
An economic crisis began in 2008, which caused a GDP decrease and an increase in expenditures on social insurance. The increase in expenditures on social insurance may be explained by an increase in unemployment in the country, which caused signiicant increases in the number of recipients of unemployment beneits as well as the average amount of such beneits. The increase in the average amount of unemployment beneits relates to an increase in wages, an increase and legalisation of employment as well as amendments made to Latvian legal enactments (Mistre B., Muska A., 2011).
On average, the proportion of state social beneits in GDP was 1% over the entire period of analysis.
The state social insurance special budget is analysed
further in the research, as it is the main source for inancing social transfers.
The basic principle of the system of social insurance is self-inancing – expenditures on recipients of pensions and state social insurance beneits are covered from contributions made to the budget.
In the period of 2001-2008, the revenues and expenditures in the state social insurance special budget rose, and the increase of revenues was greater; in the result, an annual surplus was observed in the budget (Table 3).
The largest surplus in the social budget was recorded in 2007 – LVL 379.7 million, and it was the fastest increase in revenues of the state social insurance special
budget; the revenues rose by LVL 311.8 million or 31.8% compared with the previous year.
The increase in revenues of the state social insurance
special budget was natural, as the economic growth rate rose in the period of 2002-2007; simultaneously the performance of various government control institutions improved, the retirement age increased, the employment rate in the registered labour market rose. In addition, the number of working-age individuals increased, as individuals born in the 1980s when the demographic situation was favourable entered the labour market (Concept “On State Social …, 2008).
Since 2009, the revenues of the social budget have started decreasing, whereas the expenditures have continued increasing sharply, and thus, an annual deicit has emerged. The decrease in social insurance revenues may be explained by the economic crisis in the country, which resulted in a signiicant decrease in the number of employed individuals and in labour income. The high unemployment rate and the sharp increase in wages during the previous years affected the increase in expenditures of the state social insurance special budget, thus, the amounts of beneits rose. Besides, the amount of newly granted pensions also increased due to the increase in wages during the previous years. The inancing of parental beneits has also been transferred from the central government basic budget to the state social insurance special budget since 2008.
B. Mistre et al. Elements of the System of Financing Social Transfers and Assessment of Factors Affecting Them in Latvia
Table 2
Proportion of expenditures on social insurance and state social beneits in GDP in Latvia in 2002-2010, mln LVL
YearGDP (current
prices) Social insurance % of GDP State social beneits % of GDP
2002 5758.3 508.4 8.8 62.3 1.1
2003 6392.8 516.3 8.1 69.2 1.1
2004 7434.5 577.3 7.8 73.7 1.0
2005 9059.1 645.7 7.1 89.4 1.0
2006 11171.7 770.8 6.9 98.4 0.9
2007 14779.8 891.5 6.0 123 0.8
2008 16188.2 1192.2 7.4 134.3 0.8
2009 13082.8 1439.6 11.0 142.3 1.1
2010 12735.9 1492.7 11.7 148.6 1.2Source: authors’ calculations based on the CSB and Treasury data

215
Economic Science for Rural Development Nr. 28., 2012
ISSN 1691-3078
3. Analysis of the socio-economic factors affecting the state social insurance special budget
A correlation analysis was conducted and correlation coeficients were calculated to identify effects of the number of socially insured persons in the country and the average wage subject to social contributions of socially insured persons on the revenues and expenditures of the state social insurance special budget (Table 4).
The correlation analysis showed that there was a strong causal relationship between the revenues of the special budget and the average wage subject to social contributions of socially insured persons. A medium strong relationship existed between the number of socially insured persons and the revenues of the special
budget.A correlation analysis was conducted between the
revenues of the special budget and the number of socially insured persons and the average wage subject to social contributions of socially insured persons. The calculation showed that there was a strong relationship between the average wage subject to social contributions of socially insured persons and the revenues of the special budget. However, the number of socially insured persons did not affect the revenues of the special budget, as the correlation coeficient was very low (r=0.25).
After analysing the number of socially insured persons, one can conclude that it was volatile. In the period of 2002-2007, the number of socially insured persons tended to increase in Latvia, whereas this number started
sharply decreasing with the beginning of the economic crisis in 2008 (Figure 2).
In 2008 compared with 2007, the number of socially insured persons decreased by 11.2 thousand, while a decrease of 94.4 thousand was observed in 2009 compared with 2008. In 2010, the number of socially insured persons continued declining – by 82.2 thousand compared with 2009, which was a negative fact, as it affected the revenues of the special budget.
The number of socially insured persons signiicantly affects economic activity in the country. The number of socially insured persons has to rise with the increase in the number of employed individuals.
To ind out whether such a causal relationship exists, a regression model was analysed:
ii rXâ â Y 10i +⋅+= , (1)
where Y
i – number of socially insured persons;
bi – regression model parameters;
Xi – number of employed persons;
ri
– casual error.
An analysis of the result produced by the above-
described regression model is presented in Figure 3. After analysing the regression model, presented
in Figure 3, one can conclude that the number of socially insured persons rises faster than the number of employed individuals. The number of socially
B. Mistre et al. Elements of the System of Financing Social Transfers and Assessment of Factors Affecting Them in Latvia
Table 3
Changes in the state social insurance special budget in Latvia in 2001-2010
YearRevenues, mln LVL
Expenditures, mln LVL
Current year surplus/deicit, mln LVL
Annual increase rate, %
Revenues Expenditures
2001 489.5 498.7 -9.2 - -
2002 536.6 534.9 1.7 9.6 7.3
2003 578.9 560.6 18.3 7.9 4.8
2004 658.0 606.8 51.2 13.7 8.2
2005 769.3 678.1 91.2 16.9 11.8
2006 980.3 798.5 181.8 27.4 17.8
2007 1292.1 912.4 379.7 31.8 14.3
2008 1441.1 1213.8 227.3 11.5 33.0
2009 1248.5 1461.5 -213.0 -13.4 20.4
2010 1178.1 1513.9 -335.8 -5.6 3.6Source: authors’ calculations based on the Treasury data
Table 4
Correlation coeficients for the factors affecting the state social insurance special budget in Latvia in 2002-2010
Indicators Special budget revenuesSpecial budget expenditures
Number of socially insured persons 0.74 0.25
Socially insured persons’ average wage subject to social contributions
0.92 0.92
Source: authors’ calculations based on the CSB and SSIA data
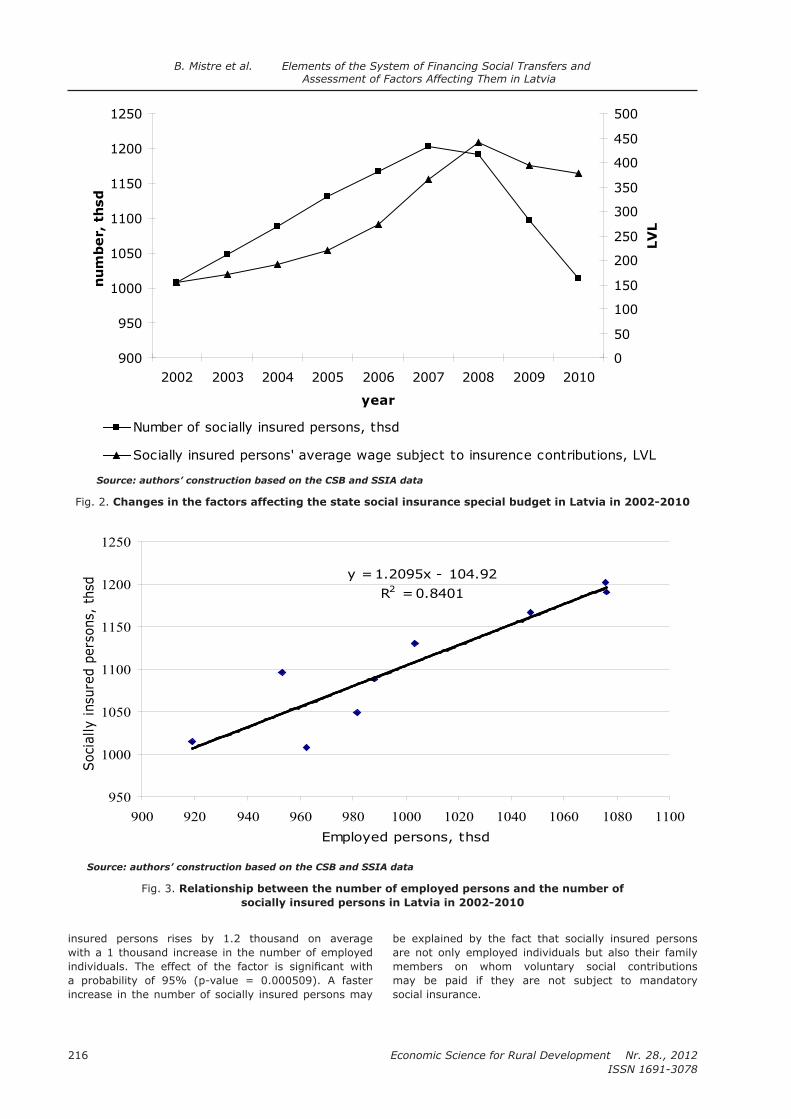
Economic Science for Rural Development Nr. 28., 2012
ISSN 1691-3078
216
insured persons rises by 1.2 thousand on average with a 1 thousand increase in the number of employed individuals. The effect of the factor is signiicant with a probability of 95% (p-value = 0.000509). A faster increase in the number of socially insured persons may
be explained by the fact that socially insured persons are not only employed individuals but also their family members on whom voluntary social contributions may be paid if they are not subject to mandatory
social insurance.
900
950
1000
1050
1100
1150
1200
1250
2002 2003 2004 2005 2006 2007 2008 2009 2010
year
nu
mb
er,
th
sd
0
50
100
150
200
250
300
350
400
450
500
LV
L
Number of socially insured persons, thsd
Socially insured persons' average wage subject to insurence contributions, LVL
Source: authors’ construction based on the CSB and SSIA data
Fig. 2. Changes in the factors affecting the state social insurance special budget in Latvia in 2002-2010
y = 1.2095x - 104.92R2 = 0.8401
950
1000
1050
1100
1150
1200
1250
900 920 940 960 980 1000 1020 1040 1060 1080 1100
Employed persons, thsd
Soci
ally
insu
red
pers
ons,
ths
d
Source: authors’ construction based on the CSB and SSIA data
Fig. 3. Relationship between the number of employed persons and the number of socially insured persons in Latvia in 2002-2010
B. Mistre et al. Elements of the System of Financing Social Transfers and Assessment of Factors Affecting Them in Latvia

217
Economic Science for Rural Development Nr. 28., 2012
ISSN 1691-3078
After analysing the changes in the average wage subject to social contributions of socially insured persons, one can conclude that the average wage tended to rise in the period from 2002 to 2008, which positively affected the revenues of the state social insurance special budget.
Although, the economic downturn started already in 2008, the average gross wage of employees and, in its turn, the average wage subject to social contributions of socially insured persons decreased but they did not fell
as fast as the number of socially insured persons. The average wage subject to social contributions of socially insured persons decreased by LVL 46 or 10.5% in 2009 compared with 2008, while in 2010 it fell by another LVL 16 or 4% compared with 2009.
The correlation analysis showed that wages and their increase played a signiicant role in stabilising the state social insurance special budget and in social security in
the country.
Conclusions1. The determinant element of the system of inancing
social transfers is revenues of the state social
insurance special budget.2. There was an annual surplus in the state social
insurance special budget in Latvia in the period of 2002-2008, whereas an annual deicit has emerged since 2009. Therefore, the amount of accrued funds in this budget has decreased. If such a trend continues, a situation might emerge that there would be a lack of funds for paying out social transfers.
3. The number of socially insured persons and the average wage subject to social contributions of socially insured persons signiicantly affect revenues of the state social insurance special budget. Yet, the average wage subject to social contributions of socially insured persons affects expenditures of the state social insurance special budget.
Bibliography1. Concept on the Stability of Social Insurance System
in a Long-term. Retrieved: www.lm.gov.lv/upload/aktualitates/koncepcija_24052010.pdf. Access:
15 November 2010.2. Explanations to Revenues and Expenditures of
the State Special Budget by Programme and
Subprogramme in 2002. Retrieved: http://www.kase.gov.lv/texts_files/FMInfp27_1_150903.xls. Access: 4 January 2011.
3. Explanations to Revenues and Expenditures of
the State Special Budget by Programme and
Subprogramme in 2003. Retrieved: http://www.kase.gov.lv/texts_files/FMInfp27_1_040804.pdf. Access: 4 January 2011.
4. Law of the Republic of Latvia “On State Social
Insurance”. Retrieved: http://www.likumi.lv/doc.php?id=45466. Access: 20 December 2011.
5. Mistre B., Dobele A. (2010). Evaluation of State Social Security Beneits in Latvian Regions. In: Proceeding of the International Scientiic Conference ”The Application of Sustainable Development:
Critical Assessment” No. 3 “Human Resources - the Main Factor of Regional Development” Klaipeda University, pp. 268-275. ISSN 2029-5103.
6. Mistre B., Muska A. (2011). Synergy of the Amount of Social Beneits and Economic Activity in Latvia. In: European Integration Studies. No. 5 (2011), Kaunas University of Technology, pp. 63-71. ISSN 1822-8402
7. Mistre, B. (2009). Development of Social Transfers in the Social Security System in Latvia. In: Proceeding
of the International Scientiic Conference “Research for Rural Development 2009”, Jelgava: LLU. pp. 211-218. ISSN 1691-4031.
8. Regulations Regarding Distribution of the Rates for
State Mandatory Social Insurance Contributions by Type of Social Insurance in 2001: Cabinet Regulations
No. 452 of 19 December 2000. Retrieved: http://
www.likumi.lv/doc.php?id=13870&from=off. Access: 22 June 2010.
9. Regulations Regarding Distribution of the Rates for
State Mandatory Social Insurance Contributions by Type of Social Insurance in 2003: Cabinet Regulations
No. 613 of 27 December 2002. Retrieved: http://
www.likumi.lv/doc.php?id=69955&from=off. Access: 22 June 2010.
10. Regulations Regarding Distribution of the Rates for
State Mandatory Social Insurance Contributions by Type of Social Insurance in 2009: Cabinet Regulations
No. 1027 of 16 December 2008. Retrieved: http://
www.likumi.lv/doc.php?id=185429. Access: 29 December 2009.
11. Regulations Regarding Distribution of the Rates for
State Mandatory Social Insurance Contributions by Type of Social Insurance in 2010: Cabinet Regulations
No. 1577 of 22 December 2009. Retrieved: http://
www.likumi.lv/doc.php?id=202815. Access: 29 December 2009.
12. Regulations Regarding Distribution of the Rates for
State Mandatory Social Insurance Contributions by Type of Social Insurance in 2011: Cabinet Regulations
No. 1199 of 28 December 2010. Retrieved: http://
www.likumi.lv/doc.php?id=223608. Access: 29 December 2009.
13. Revenues and Expenditures of the State Special
Budget by Programme and Subprogramme in 2004. Retrieved: http://www.kase.gov.lv/texts_iles/FMInfp31_1_300605.pdf. Access: 4 January 2011.
14. Revenues and Expenditures of the State Special
Budget by Programme and Subprogramme in 2005. Retrieved: http://www.kase.gov.lv/uploaded_iles/Parskati/FMInfp36_1_300606.pdf. Access: 4 January 2011.
15. Revenues and Expenditures of the State Special
Budget by Programme and Subprogramme in 2006. Retrieved: http://www.kase.gov.lv/texts_iles/FMInfp30_1_290607.pdf. Access: 4 January 2011.
16. Revenues and Expenditures of the State Special
Budget by Programme and Subprogramme in 2007. Retrieved: http://www.kase.gov.lv/texts_iles/FMInfp32_1_300608.pdf. Access: 4 January 2011.
17. Revenues and Expenditures of the State Special
Budget by Programme and Subprogramme in 2008. Retrieved: http://www.kase.gov.lv/texts_iles/FMInfp36_1_300609.pdf Access: 4 January 2011.
18. Revenues and Expenditures of the State Special
Budget by Programme and Subprogramme
in 2009. Retrieved: http://www.kase.gov.lv/
B. Mistre et al. Elements of the System of Financing Social Transfers and Assessment of Factors Affecting Them in Latvia

Economic Science for Rural Development Nr. 28., 2012
ISSN 1691-3078
218
uploaded_files/Parskati/2009.gada%203.sejums/FMInfp36_1_300610.pdf. Access: 4 January 2011.
19. Revenues and Expenditures of the State Special
Budget by Programme and Subprogramme
in 2010. Retrieved: http://www.kase.gov.lv/
uploaded_files/Parskati/Gada%20parskats/2010.gada%20parskats/2010.gada%203.sejums/FMInfp32_1_300611.pdf. Access: 22 December 2011.
20. Unpublished data of the SSIA.
B. Mistre et al. Elements of the System of Financing Social Transfers and Assessment of Factors Affecting Them in Latvia

219
Economic Science for Rural Development Nr. 28., 2012
ISSN 1691-3078
A. Prohorovs, I. Jakusonoka Financing of Innovation System Development and Attraction of Private Capital
___________________________1 E-mail address: [email protected] E-mail address: [email protected]
Financing of Innovation System Development and Attraction of Private Capital
Anatolijs Prohorovs1, First Deputy of Chairman of Knowledge Economy Council of Latvian Chamber of Commerce and Industry
Ingrida Jakusonoka2, Dr.oec., professorFaculty of Economics, Latvia University of Agriculture
Abstract. Each country is required to have a clearly formulated and detailed national strategy in the transition period for the purpose of management, stimulation, assessment and funding of innovative technology development process. A range of various funding sources includes private venture capital investments that have gradually formed the industry of private venture capital. The authors in their analysis and assessment of venture capital development trends focus on the analysis of external factors. The latest Silicon Valley Venture Capitalist Conidence Index 2011 Q4 conirms the attitude of private risk capital investors towards the expected changes in the venture capital market, since it shows a declining tendency and has returned to 3.27 points after a slight rise in 2010. On the present conditions of Latvia, the private venture capital should be analysed in a close connection with the entire innovative ecosystem, since the private venture capital is one of the main instruments of funding innovation projects. The authors of the paper have analysed the environment and the factors that inluence private venture capital investments in this sector. Key words: venture capital, innovation, Latvia, venture capital funds, R&D expenditure, government policy.JEL code: G24, G28, G32, F21, M13
Introduction The economic development of a country is determined
by geographic, demographic, and technological factors. The future of demographic situation of Latvia seems unfavourable, thus, Latvia has to focus on its convenient geographic situation and the development of technologies. Experts from the ield of economics hold the view that the technological development is supported by promoting innovations, launching new production units, establishing and developing start-up companies, and combining the forces of both the
government and entrepreneurs. Innovation funding sources depend on the
government’s innovation policy, its priorities, and government support level. One of the sources of innovation funding is private venture capital.
The aim of the paper is to analyse the innovation environment and factors that might inluence private venture capital investments in this sector.
The tasks are: 1) to characterise challenges that
Latvia faces in relation with the requirements of the new (sixth) technological cycle in the commercialisation of research indings; and 2) to describe the private venture capital investment development level and its inluencing factors, grouping them according to the areas of inluence.
Data sources and research methods. The authors
based their research on the innovation development index of Latvia and other EU Member States, and the comparative analysis of other indicators. An assessment of the level of innovation performance in Latvia was based on the methodology of the Innovation Union Scoreboard 2011 (IUS 2011) that includes 25 indicators. Reports of the European Commission, the IUS 2011 data compiled by
INNO METRICS, data from Latvia’s CSB, the survey data obtained by Latvia’s marketing public opinion research
centre SKDS, expert interviews etc., and researches of scientists from the Baltic States regarding assessing and inancing innovation performance were used as data sources. In addition, the opinions of the members of the Association of Latvia Private Investors, the publication of Joseph Ghalbouni and Dominique Rousies in the Harvard Business Review (2010) as well as published opinions and forecasts of several venture capital investment experts and Silicon Valley Venture Capitalist Conidence Index etc. were applied in the research.
Research results and discussionResearchers from many countries consider that the
transition to the new technological cycle has started being accompanied by profound structural economic changes. The 5th technological cycle, the driving force of which included microelectronics and many-faceted development of the ICT technologies, has been drained out giving the way to the 6th technological cycle. The new technological wave is characterised by rapid development of nanotechnologies (nanoelectronics, nanomaterials, nanotechnologies, nanometrology, nanobiotechnologies, artiicial intellect, and development of alternative energies). Many countries set up innovation clusters to develop the potential of these industries, dominated by R&D centres, universities, and their research centres (Glazjev S., 2012). The commercialisation of new innovative ideas is possible only in the innovative business environment. The 4 Ps approach of the Marketing Mix is one of the models to be used in the analysis of implementation of innovative economics (Tidd J., Bessant J., 2010):

Economic Science for Rural Development Nr. 28., 2012
ISSN 1691-3078
220
A. Prohorovs, I. Jakusonoka Financing of Innovation System Development and Attraction of Private Capital
‘Product innovation’- changes in the things (products/services) that an organisation offers;
‘Process innovation’- changes in the ways in which they are created and delivered;
‘Position innovation’ – changes in the context in which the products/services are introduced;
‘Paradigm innovation’- changes in the underlying
mental models, which frame what the organization
does.Each country is required to have a clearly formulated
and detailed national strategy in the transition
period for the purpose of management, stimulation, assessment, and funding of innovative technology development process. A range of various funding sources includes private venture capital investments that have gradually formed the industry of private venture
capital. Venture capital (VC) is a long-term risk capital that
is invested in the rapidly growing share capital of a company with the purpose to increase the amount of the company’s proit and the business value on the market, stimulating the large inancial gains in the long-term period. The forms of investments are varied:
— an investor acquires the shares of the company in exchange of inancial resources, and the source of income is the increase of the share value;
— medium-term investments are invested in the time period for 3-7 years;
— mixed-type investments, combining the above mentioned variants.
The expected internal rate of return (IRR) should achieve a suficiently high level, since private venture capital investments have a high-risk level and they achieve the necessary amount (maturity) after several years (2-6 years). The ”exit” from a company in the inal stage is implemented by supplementing the initial shares (IPO) and selling the shares either on the national
or international stock market or by selling the whole
company. Venture capital could be offered in two types of sectors: formal and informal.
The 4 Ps (Product, Price, Place, Promotion) of the Marketing Mix inluence greatly the development of venture capital industry. However, unfavourable business environment might hamper the development of innovative products.
The authors focused on the analysis of external factors of venture capital development trends. On a global scale, venture capital industry is having a decline. Joseph
Ghalbouni and Dominique Rousies (Ghalbouni J., Rousies D., 2010) in their publication Harvard Business Review in October of 2010 analysed the reasons for rapid shrinking
of venture capital investment industry, the internal structural changes of the industry, and development opportunities in the period of the past 10-18 years. They pointed to the signiicant changes in development trends that were relected in the dynamics of such important indicators as Thomson Reuters, Dow Jones venturesource, and Cambridge associates LLC US venture capital index. The indicators characterising the industry dynamics included the number and volume of investment transactions, quarterly proitability, investment cycle, and sales (the exit of venture capital from the project). Several researchers (Josh Learner and William Kerra from Harvard Business School) have analysed activities and eficiency of venture capital. Joseph Ghalbouni
and Dominique Rousies drew a conclusion that venture capital industry was in a deep crisis and its future was endangered.
Likewise, the latest Silicon Valley Venture Capitalist Conidence Index 2011 Q4 conirms the attitude of private venture capital investors towards expected changes in the venture capital market (Figure 2). After a slight rise in 2010, it shows a declining tendency and has returned to 3.27 points (according to 5 points scale).
The Cabinet of Ministers of the Republic of Latvia has highlighted the “the economic breakthrough” in the
Source: authors’ construction
Fig. 1. Providers of venture capital funds and their legal organisation
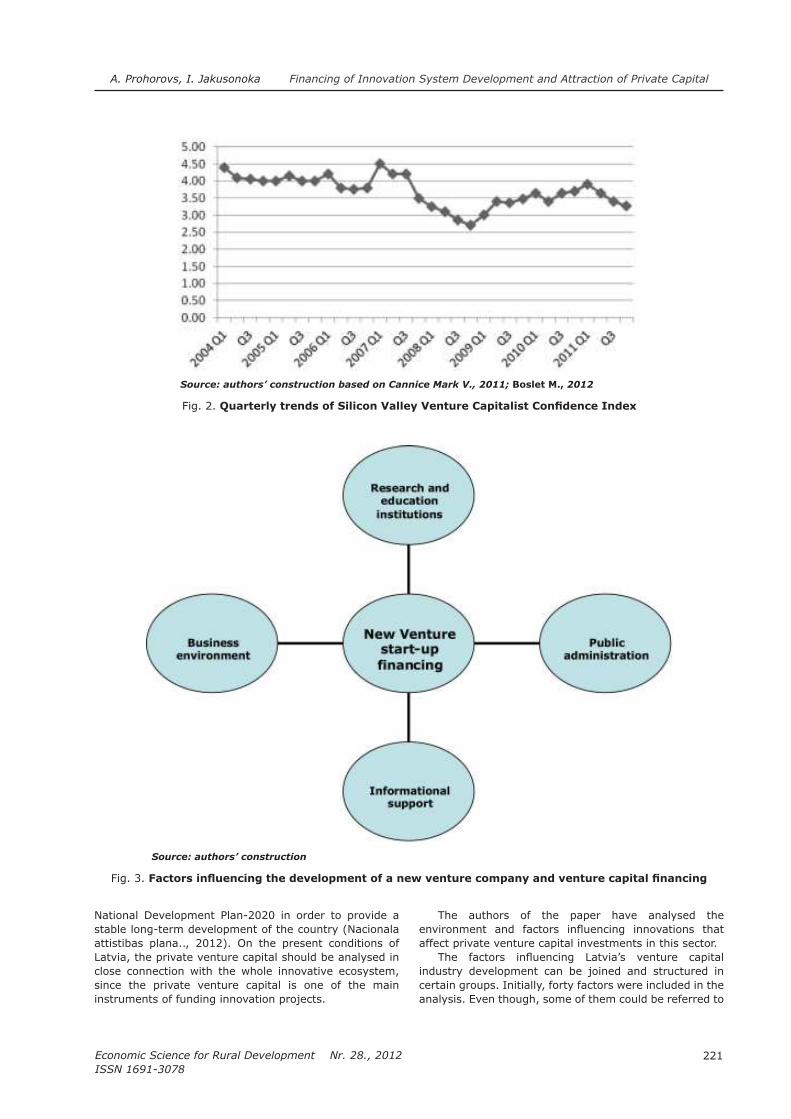
221
Economic Science for Rural Development Nr. 28., 2012
ISSN 1691-3078
A. Prohorovs, I. Jakusonoka Financing of Innovation System Development and Attraction of Private Capital
Source: authors’ construction based on Cannice Mark V., 2011; Boslet M., 2012
Fig. 2. Quarterly trends of Silicon Valley Venture Capitalist Conidence Index
Source: authors’ construction
Fig. 3. Factors inluencing the development of a new venture company and venture capital inancing
National Development Plan-2020 in order to provide a stable long-term development of the country (Nacionala attistibas plana.., 2012). On the present conditions of Latvia, the private venture capital should be analysed in close connection with the whole innovative ecosystem, since the private venture capital is one of the main instruments of funding innovation projects.
The authors of the paper have analysed the
environment and factors inluencing innovations that affect private venture capital investments in this sector.
The factors inluencing Latvia’s venture capital industry development can be joined and structured in certain groups. Initially, forty factors were included in the analysis. Even though, some of them could be referred to

Economic Science for Rural Development Nr. 28., 2012
ISSN 1691-3078
222
A. Prohorovs, I. Jakusonoka Financing of Innovation System Development and Attraction of Private Capital
several groups, they were included purposefully only in one of the groups.
The factors were classiied into four groups (Figure 3):
Group 1 – factors of public administration (all levels are covered from the EU to local government);
Group 2 – factors of business environment; Group 3 – institutions of research and education; Group 4 - informational support.
Public administration factorsThe irst one refers to the economic stimulation
programme of investors. It includes ”venture money” allocation for the project monitoring, auditing, the state participation with ixed interest rate and relevant tax policy, and the policy of allocating grants and subsidies that in many cases de-stimulates the attraction of private venture capital to various research and education
branches. There are neither governmental or private-state
venture capital funds and inancial companies, nor venture capital investment funds and investment banks of the national scale in Latvia. According to the data of Latvia Association of Venture Capital (AVC), applications to the venture capital funds are quite frequent. However, only approximately 5% of applications are granted. In 2011, venture capital funds invested in 10 projects, which is the largest investment amount in the recent years. J. Grisins, a chairman of Latvia AVC, considers that the most active are the following three venture capital funds: Imprimatur
Capital, Baltcap Management, and AB.LV Private Equity
Management as well as several associations of private investors: ”Zalas gaismas investicijas” and several companies that do not offer investments but manage the existing investments (Grisins J., 2012). Besides, there is no state governance and coordinating institution that
would concentrate on the issues of venture projects and attraction of investors.
The government does not reward and morally support the attainments of venture project achievements. The state has not set the policy, strategy, and short-term plans for the development of innovative start-up companies.
Up to now, there is no suficient use of instruments in Latvia (in cooperation with other organisations and persons concerned) that would be oriented towards the creation of favourable environment for start-ups (technological parks for innovative projects and business
incubators, advisory centres in theses technological parks, loans on favourable terms for the development of high risk projects etc.) fostering the attraction of venture capital to the start-up development. Venture Capital foundation Imprematur Capital focuses on the new companies, thus, it offers seed capital to small businesses or sometimes only projects up to EUR 100,000; as regards Baltcap
Management, it is looking for the companies with the planned funding of EUR 1–10 million (Grisins J., 2012). Yet, the government lacks one uniied concept for the attraction of venture capital.
Business environmentThe quantitative and qualitative indicators
characterising private venture capital development refer to this group, e.g. the number of private venture capital (PVC) funds, the number of PVC investment companies and
business angels, which have a clear strategy on Latvia’s market; active participation of funding intermediaries and the support of the state, the availability of information on their activities and specialisation, opportunities of attracting projects in Latvia; the accessibility of start-up managers and specialists in the area of PVC investments; developed business culture and the application of
examples of “best practice” in business that could serve as the basis for trust and willingness of potential investors to invest in the companies without gaining control over the company; the lack of information and practice on the opportunities to attract managers and lawyers (initially in exchange of shares), successful structuring of projects and attraction of investors; the dominating investment climate in the country, Europe and all over the world; economic openness and internationalisation of innovation that would attract start-ups from other countries; insuficient activity of associations including participants of PVC market; a small number of projects suitable for PVC investments; and insuficient knowledge of specialists in growing companies on PVC principles and funding process.
Research and education institutionsThis group includes the following factors: insuficient
understanding of researchers and inventors of the
signiicance, aims, and objectives of attracting PVC funding to new startups; the research activities (the Academy of Science, its institutes, research institutes of universities etc.) are not aimed at the commercialisation of the research indings, this aspect is neglected assessing the research results; the education process of students of technical specialities does not motivate students to participate in innovative projects, and these universities have not established a close link
(in the form of research centres) for the purpose of commercialising these innovative ideas; universities do not train high level professionals, managers for innovation commercialisation, and venture companies; for the period of 10 years, there are very few publications and only some defended PhD theses regarding the issues of PVC, besides, only few funding aspects are touched upon in connection with the government support; the redistribution of the budget within the existing resources, allocating inances for research activities, focusing on those areas in which results of business research might be commercialised in short term, the increase of funding for the research; the close link between research areas and higher education process, close cooperation with research institutions that could serve as premises for the commercialisation and implementation of research results as well as active establishment of research centres at universities promoting and commercialising innovative ideas, students of engineering and business specialities are involved in the development and processes of private venture capital industry.
Informational supportThe most signiicant factors in the group of
informational support contain the database of start-ups; centralised and available information on PVC funds, business angel clubs, and networks that would be potential investors in Latvia’s innovative projects; coordination and information on the promotion of contacts
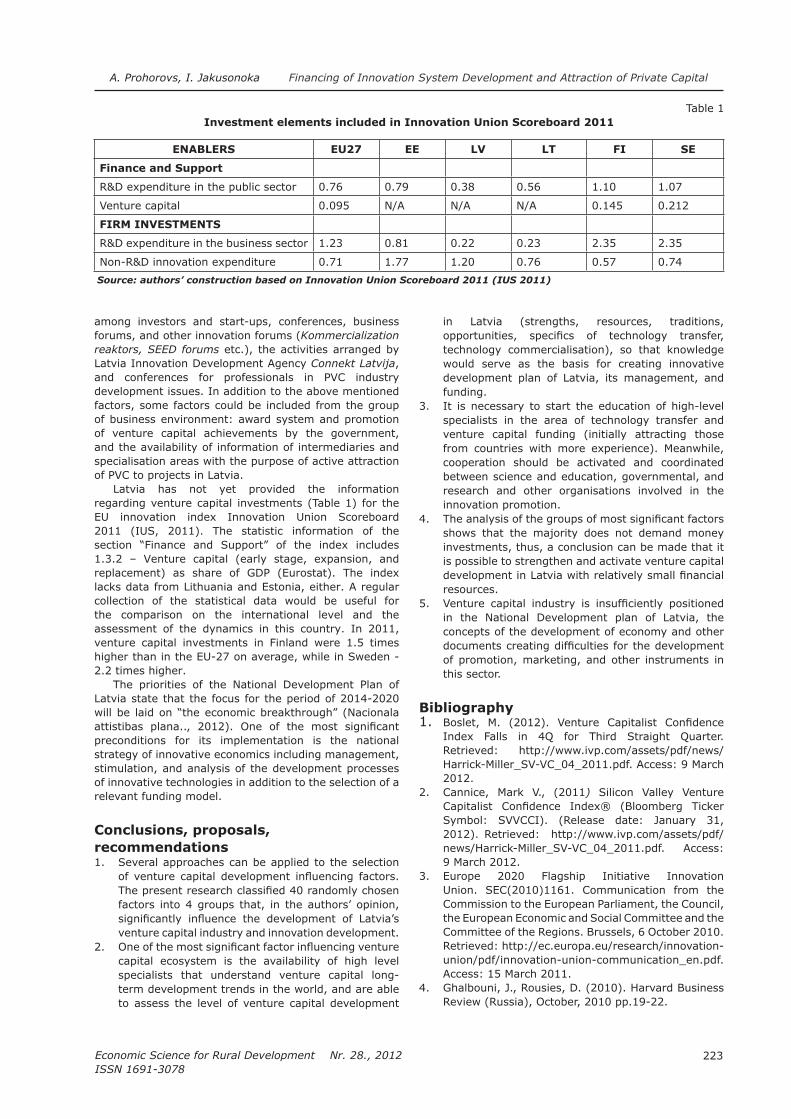
223
Economic Science for Rural Development Nr. 28., 2012
ISSN 1691-3078
among investors and start-ups, conferences, business forums, and other innovation forums (Kommercialization reaktors, SEED forums etc.), the activities arranged by Latvia Innovation Development Agency Connekt Latvija, and conferences for professionals in PVC industry development issues. In addition to the above mentioned factors, some factors could be included from the group of business environment: award system and promotion of venture capital achievements by the government, and the availability of information of intermediaries and specialisation areas with the purpose of active attraction of PVC to projects in Latvia.
Latvia has not yet provided the information regarding venture capital investments (Table 1) for the
EU innovation index Innovation Union Scoreboard 2011 (IUS, 2011). The statistic information of the section “Finance and Support” of the index includes 1.3.2 – Venture capital (early stage, expansion, and replacement) as share of GDP (Eurostat). The index lacks data from Lithuania and Estonia, either. A regular collection of the statistical data would be useful for the comparison on the international level and the assessment of the dynamics in this country. In 2011, venture capital investments in Finland were 1.5 times higher than in the EU-27 on average, while in Sweden - 2.2 times higher.
The priorities of the National Development Plan of Latvia state that the focus for the period of 2014-2020 will be laid on “the economic breakthrough” (Nacionala attistibas plana.., 2012). One of the most signiicant preconditions for its implementation is the national strategy of innovative economics including management, stimulation, and analysis of the development processes of innovative technologies in addition to the selection of a
relevant funding model.
Conclusions, proposals, recommendations1. Several approaches can be applied to the selection
of venture capital development inluencing factors. The present research classiied 40 randomly chosen factors into 4 groups that, in the authors’ opinion, signiicantly inluence the development of Latvia’s venture capital industry and innovation development.
2. One of the most signiicant factor inluencing venture capital ecosystem is the availability of high level specialists that understand venture capital long-
term development trends in the world, and are able to assess the level of venture capital development
A. Prohorovs, I. Jakusonoka Financing of Innovation System Development and Attraction of Private Capital
in Latvia (strengths, resources, traditions, opportunities, speciics of technology transfer, technology commercialisation), so that knowledge would serve as the basis for creating innovative development plan of Latvia, its management, and funding.
3. It is necessary to start the education of high-level
specialists in the area of technology transfer and
venture capital funding (initially attracting those
from countries with more experience). Meanwhile, cooperation should be activated and coordinated
between science and education, governmental, and research and other organisations involved in the
innovation promotion.4. The analysis of the groups of most signiicant factors
shows that the majority does not demand money investments, thus, a conclusion can be made that it is possible to strengthen and activate venture capital
development in Latvia with relatively small inancial resources.
5. Venture capital industry is insuficiently positioned in the National Development plan of Latvia, the concepts of the development of economy and other documents creating dificulties for the development of promotion, marketing, and other instruments in this sector.
Bibliography 1. Boslet, M. (2012). Venture Capitalist Conidence
Index Falls in 4Q for Third Straight Quarter. Retrieved: http://www.ivp.com/assets/pdf/news/Harrick-Miller_SV-VC_04_2011.pdf. Access: 9 March 2012.
2. Cannice, Mark V., (2011) Silicon Valley Venture Capitalist Conidence Index® (Bloomberg Ticker Symbol: SVVCCI). (Release date: January 31, 2012). Retrieved: http://www.ivp.com/assets/pdf/news/Harrick-Miller_SV-VC_04_2011.pdf. Access: 9 March 2012.
3. Europe 2020 Flagship Initiative Innovation
Union. SEC(2010)1161. Communication from the Commission to the European Parliament, the Council, the European Economic and Social Committee and the Committee of the Regions. Brussels, 6 October 2010. Retrieved: http://ec.europa.eu/research/innovation-union/pdf/innovation-union-communication_en.pdf. Access: 15 March 2011.
4. Ghalbouni, J., Rousies, D. (2010). Harvard Business Review (Russia), October, 2010 pp.19-22.
Table 1
Investment elements included in Innovation Union Scoreboard 2011
ENABLERS EU27 EE LV LT FI SE
Finance and Support
R&D expenditure in the public sector 0.76 0.79 0.38 0.56 1.10 1.07
Venture capital 0.095 N/A N/A N/A 0.145 0.212
FIRM INVESTMENTS
R&D expenditure in the business sector 1.23 0.81 0.22 0.23 2.35 2.35
Non-R&D innovation expenditure 0.71 1.77 1.20 0.76 0.57 0.74 Source: authors’ construction based on Innovation Union Scoreboard 2011 (IUS 2011)

Economic Science for Rural Development Nr. 28., 2012
ISSN 1691-3078
224
A. Prohorovs, I. Jakusonoka Financing of Innovation System Development and Attraction of Private Capital
5. Glazjev, S. (2012). Uze nacalos (Have already Started). Ekspert No. 2(785), pp. 40-41.
6. Grisins, J. (2012). Riska kapitalu sanem aptuveni 5% (Venture Capital is Received by Approximately 5%). Dienas bizness, No. 26 (4192). 6 February 2012. p. 11. ISSN 1407- 2041.
7. Innovation Union Scoreboard 2011 (7 February
2012). The IUS Performance Scoreboard for Research and Innovation. Retrieved: http://
www.proinno-europe.eu/metrics. Access:
9 March 2012.8. Jakusonoka, I., Prohorovs, A. (2011). Innovative
Business Development and Financing. In: Economic Science for Rural Development: Proceedings of the International Scientiic Conference, No. 25: Resources and Education. Resources and Sustainable Consumption. Education and Rural Science. Jelgava: LLU
pp. 190.-197. ISSN 1691-3078; ISBN 978-9984- 9997-6-0.
9. Nacionala attistibas plana 2014.-2020.gadam prioritasu pamatojums (Substantiation of Priorities of National Development Plan 2014-2020). Retrieved: www.mk.gov.lv/ile/iles/.../prioritasu_pamatojuma_zinojums20120306.pdf. Access:
18 March 2012.10. Paas, T., Poltimäe, H. (2010). A Comparative
Analysis of National Innovation Performance: The Baltic States in the EU Context, the University of Tartu FEBA, 2010, ISBN 978-9985-4-0653-3. Retrieved: www.mtk.ut.ee/research/workingpapers. Access: 15 December 2011.
11. Research and Development and Innovation Statistics: Statistical Data Collection (2010). Central Statistical Bureau of Latvia, Riga. ISBN 978-9984- 06-400-0.
12. Tidd, J., Bessant, J. (2010). Managing Innovation: Integrating Technological, Market and Organisational Change. 4 th ed. Chichester: John Wiley & Sons., p. 622. ISBN 978-0-470-99810-6.

225
Economic Science for Rural Development Nr. 28., 2012
ISSN 1691-3078
M. Soliwoda Factors Inluencing Productivity of Tangible Fixed Assets in Dairy Cooperatives in Poland
Factors Inluencing Productivity of Tangible Fixed Assets in Dairy Cooperatives in Poland
Michal Soliwoda, MA Department of Economics and Organisation of Enterprises, Warsaw University of Life Sciences – SGGW, Poland
Abstract. The paper presents determining factors inluencing productivity of tangible ixed assets with respect to dairy cooperatives in Poland. The research period covered the years 2004-2009. Empirical data show that Current Ratio and short-term liabilities-to-total assets-ratio have affected positively the analysed productivity. The model that was built by means of MARSSplines non-parametric regression indicated the positive role of supplementary fund as the potential stimulant for the investigated economic indicator. Maintaining the proper capital structure may be positive in the context of improving productivity of tangible ixed assets. Results based on MARSSplines non-parametric regression can be a prerequisite for an alternative use (in addition to the classical regression models) for describing intricate and often complex dependencies between inancial ratios.Key words: productivity, tangible ixed assets, dairy cooperative.JEL code: Q13,Q14.
Introduction All economic organisations possess and use tangible
ixed assets (TFA), regardless of their size and their activity. TFA play a signiicant role as the carrier of innovativeness for the entities representing industrial sectors. The effectiveness of economic organisation is determined by the level of provision of TFA and its rational usage in the
production processes (Mykolaitiene V. et al., 2010). TFA are the essential carrier of the production capacity of
each enterprise. Moreover, business management should put an emphasis on reasonable utilisation of TFA in accordance with their intended use (Bartosinska D., 2001). Enterprises should take care of the utmost possible use of TFA as the key factor inluencing economic effectiveness of business activity. From the perspective of managers, it is necessary to reveal hidden reserves of productive
capacity and select the best methods of utilisation of surplus production capacity (Wasilewski M., Zabadala P., 2011). The overall situation as for effectiveness of TFA management is depicted by the indicator of productivity. These indicators show the relationship between the equipment in TFA and production results. Proitability of TFA is regarded as the most synthetic indicator for assessing effectiveness of usage of this asset component. In practice, inancial analysts use the indicator of the productivity of ixed assets, which equals the ratio of production in the analysed period to the value of TFA. This indicator is more preferable because of the fact that the net proit/loss of the economic entity depends on the set of many factors (often beyond the control of the enterprise) (Nebl Th., 2002).
The peculiarity of management of TFA regards to differences between the valuation of productivity of TFA according to microeconomics (theory of production) and according to accounting and reporting rules (including
depreciation). Some aspects of measurement of productivity of TFA can seem to be slightly paradoxical, namely, even completely depreciated equipment can be characterised by the high level of productivity (in
terms of microeconomics). Productivity of TFA in dairy
cooperatives is inluenced by many various factors, noting the complex aspects of shareholders’ fund policy in cooperatives (more: Dworniak J., 2010) and the fundamental economic aim of the cooperative - taking care of interests of their members (Pietrzak M., 2006). The problem of determining factors that inluence productivity of TFA has become more important from the standpoint of the inancial and economic situation of Polish dairy cooperatives that beneited and beneit from the EU pre- and post-accession EU inancial aid (inter alia, pre-accession “SAPARD” Fund, post-accession “Innovative Economy” Programme).
Aim, methodology and scope of researchThe primary aim of research was to determine factors
inluencing proitability of TFA in dairy cooperatives in Poland, and to build regression models describing proitability of TFA.
The following tasks were undertaken in the framework of the research: (i) extraction of factors (concerning own funds, inancial liquidity, and structure of current assets / liabilities) determining the productivity of TFA in dairy cooperatives; and (ii) building models describing the productivity of TFA (classical linear regression, non-parametric regression).
Two hypotheses have been proposed in the study, and then tested:
H1: The shareholders’ and supplementary funds positively affect the productivity of TFA in dairy
cooperatives.H2: A rise in inancial liquidity increases the
productivity of TFA in dairy cooperatives.The research period covered the years 2004 -
2009. The research objects represent the sector of dairy cooperatives. Sixty-six dairy cooperatives have continuously published inancial statements in Cooperative Monitor B during the analysed period. Those cooperatives operated as independent entities at the date
of 10 January 2011. The research group includes entities beneiting from the diverse sources of funding for TFA as

Economic Science for Rural Development Nr. 28., 2012
ISSN 1691-3078
226
M. Soliwoda Factors Inluencing Productivity of Tangible Fixed Assets in Dairy Cooperatives in Poland
well as characterised by the large scale of production. The analysed group of cooperatives covered more than 80% of assets and 75% of milk processed by Polish cooperative dairy sector.
The multiple linear regression was used as the tool for investigating the impact of selected factors inluencing productivity of TFA in dairy cooperatives. Potential variables determining productivity of TFA were chosen based on the scientiic literature (Pietrzak M., 2006; Pisarska A., 2009; Dworniak J., 2010). The correctness of selection of variables was veriied using the analysis of correlation coeficients between variables.
The so-called method of stepwise regression leads to selecting the best suitable explanatory variables in the model. Independent variables are sequentially added to the model. In the irst step, the explanatory variable,
which is most strongly correlated with the dependent variable and is characterised by signiicant parameters is chosen. Then, the second explanatory variable, the values of which are most strongly correlated with the residues of the irst step, is selected. Hence, the extended model is characterised by the signiicance of all parameters. Next, the statistical signiicance of the coeficients of determination is also tested. The procedure is completed when adding a new variable into the equation model leads to lowering signiicance of parameters or coeficient of determination (Weiers R., 2010).
Table 1 shows the set of independent variables used for explanation of productivity of TFA (Y). The dependant variable is calculated as the ratio of net revenues from sales of products to the value of TFA (as an average from beginning and end of the reporting period). Independent
Table 1
Set of independent variables used for the model of multiple regression
Designation Description of variables
Structure of funds
x1
Own funds / total liabilities [in multiplicities]
x2
Shareholders’ fund / own funds [in multipliciticies]
x3
Supplementary fund / own funds [in multiplicities]
Financial liquidity
x4
Current Ratio [in multiplicities]
x5
Quick Ratio [in multiplicities]
x6
Cash Ratio [in multiplicities]
Relations concerning liabilities/ currents assets
x7
Short-term liabilities / total assets [in multiplicities]
x8 Long-term liabilities / total assets [in multiplicities]
x9 Inventories / currents assets [in multiplicities]
x10
Short-term accounts receivable / current assets [in multiplicities]
x11
Cash / current assets [in multiplicities]Source: author’s construction
Table 2
Descriptive statistics for variables used for the model
Variables Average Median Minimum Maximum SD
y 4.57 4.21 0.00 11.83 2.42
x1
1.13 1.08 0.24 2.55 0.45
x2
0.46 0.47 0.00 0.95 0.17
x3
0.36 0.34 0.00 0.83 0.15
x4
1.45 1.40 0.48 2.95 0.46
x5
1.04 1.01 0.39 2.10 0.37
x6
0.23 0.14 0.00 0.99 0.25
x7
0.34 0.33 0.13 0.53 0.09
x8 0.08 0.07 0.00 0.28 0.07
x9 0.28 0.28 0.07 0.61 0.11
x10
0.56 0.54 0.19 0.93 0.13
x11
0.14 0.12 0.00 0.52 0.13Source: author’s calculations

227
Economic Science for Rural Development Nr. 28., 2012
ISSN 1691-3078
M. Soliwoda Factors Inluencing Productivity of Tangible Fixed Assets in Dairy Cooperatives in Poland
variables (from x1 to x
11) might be divided into three
subsets (concerning the structure of funds, inancial liquidity, and relations concerning liabilities / current assets).
The variable x2 refer to the signiicant role of
shareholders’ fund because the increase of this fund can lead to quicker restructuring of dairy cooperative (Dworniak J., 2010). The subset covering x
4-x
6 regards
inancial liquidity treated as liquidity indicators1 on
the “safe” level, typical of the speciic sector. The last subsets cover the relations that depict the structure of
liabilities and current assets. All explanatory variables are expressed in multiplicities.
The alternative method for the multiple linear regression is a nonparametric method, the so-called Multivariate Adaptive Regression Splines (MARSplines, MARS)2. According to Statsoft (2012), MARSplines is a nonparametric regression procedure that makes no assumption about the functional relationship between the dependent and independent variables. The essence of MARSplines lies in constructing the relation from a set of coeficients and base functions that are selected from the regression data. MARSplines is particularly suitable for problems with higher input dimensions (i.e. with more than 2 variables), where the curse of dimensionality would likely create problems for other techniques, especially, classical methods of linear regression.
Research results and discussionBasic descriptive statistics of variables used in
the model are shown in Table 2, whereas, correlation coeficients between variables are presented in Figure 1.
In the population of dairy cooperatives, there was a strong variation in the level of productivity of TFA (from 0.00 to 11.83). Half of the cooperatives were characterised by the productivity lower than 4.21, close to the average describing the population. Empirical levels of productivity of TFA differed from the average productivity by about ± 2.42. The analysis of the correlation matrix (with outlined statistically signiicant correlation coeficients) indicates a statistically signiicant positive impact of current ratio (x
4), quick ratio (x
5), and the share of short-term-liabilities
in total assets (x7). It should be noted that the rest of
explanatory variables were not signiicantly correlated
with the dependent variable (productivity of TFA). The strong correlation of variables (Current Ratio and Cash Ratio, Current Ratio and Quick Ratio) was also observed.
The average Current Ratio Level was 1.45, whereas, the average Quick Ratio Level - 1.04. Both indicators of inancial liquidity may be characterised by a strong variations. Current Ratio luctuated between 0.48 and 2.95, whereas, Quick Ratio: between 0.39 and 2.10. In dairy cooperatives, empirical levels of inancial liquidity differed from the average levels - Current Ratio by 0.46 and Quick Ratio by 0.47 respectively.
The average level of the ratio of short-term relationship liabilities to total assets reached 0.34. The level of analysed ratio has ranged from 0.13 to 0.53 in dairy cooperatives. In addition, this ratio was higher than 0.33 in half of the population. Moreover, empirical levels of short-term liabilities-to-total assets ratio differed from the average level of x
7 by 0.09.
Results of estimation of parameters for the model (including all explanatory variables) describing the impact of selected factors on productivity of TFA are presented in Table 3. Analysis of the results of estimation of parameters of the basic model parameters indicates a statistically signiicant impact of two variables: x
4 (Current
Ratio) and x7 (short-term liabilities / total assets).
Moreover, the impact of the irst variable underlines the importance of maintaining inancial liquidity (expressed by the level of Current Ratio) in the normative range for the sector. The proper asset structure (mainly the relation of current assets to tangible ixed assets) may stimulate an increase in effectiveness of asset management. Entities characterised by conservative liquidity strategy as well as having the tendency to maintain an excess inancial liquidity, generated easily net revenues from sales of products. In contrast, a low book value of TFA, combined with the high value of net revenues, could lead to raising the level of productivity
of TFA.The share of short-term liabilities in total assets
appeared as the second explanatory variable. According to modern theories concerning capital structure in enterprises, it is strongly recommended to raise the share of liabilities (to some extent) that are characterised by lower cost than structural components of equity.
___________________________1 Current Ratio = Current Assets/ Current Liabilities; Quick Ratio = (Current Assets – Inventories)/ Current Liabilities;
Cash Ratio = Short-term Investments/ Current Liabilities (Loth R., 2012).2 MARS Splines method belongs to the group of Data Mining techniques.
Source: author’s calculations in STATISTICA 9.1 (screenshot)
Fig. 1. Correlation coeficients between variables used for the model

Economic Science for Rural Development Nr. 28., 2012
ISSN 1691-3078
228
It is worth noting that model (at the 5% signiicance level) describes only 17.1% of the variability of productivity of TFA. This may be due to the complexity of factors describing net revenues from sales of products, also a considerable variation in the accounting policy for
tangible ixed assets in the dairy cooperatives.The results from application of MARSSplines method
are presented in Table 4.STATISTICA 9.1 built 10 base functions. Five of
eleven independent variables (x2, x
3, x
4, x
7, x9) were
used as signiicant factor explaining productivity of TFA. Table 5 shows other parameters of modelling by means of MARSSplines method.
It should be noted that there was an improvement as for the level of R-square. In the case of classical
multiple regression this parameter reached 0.1710, while modelling of dependencies by means of non-parametric regression, allows raising the level of R-square (R-square was 0.3257). This indicates that modelling by means of MARSSplines may help explain 32.57% of the variation of the dependant variable: productivity
of TFA. It should be noted that the implementation non-
parametric regression enabled exploiting up to 5 variables. The MARSSplines regression model used two variables that were also signiicant in the classical multiple linear regression (x
4, x
7).
The complex regression equation is shown in
Figure 2. This indicates some intervals characterised by various base functions accepted by the algorithm.
Table 3
Impact of selected variables on the productivity of TFA: panel model
Estimated coeficients Standard error T-statistics p-value
Constant -4.6650 1.26 -3.72 0.0002
x4*
3.2528 0.47 6.94 0.0000
x7*
14.9417 2.07 7.23 0.0000
x3
-1.0994 0.83 -1.33 0.1854
x6
-1.8410 1.15 -1.61 0.1093
x11
2.0848 1.94 1.08 0.2822
R-square 0.1710 Standard error of estimation 2.2168
Adjusted R-square
0.1583 F-statistics 13.449
Source: author’s calculations
Table 4
Impact of selected variables on the productivity of TFA: panel model
Description y
Average (observed) 4.57
SD (observed) 2.42
Average (predicted) 4.57
SD (predicted) 1.38
Average (residuals) 0.00
SD (predicted) 1.98
R-square 0.3257
Adjusted R-square 0.3025Source: author’s calculations
Table 5
Parameters of modelling - MARSSplines
Description y
Value of penalty 2.00
Threshold 0.0005
GCV Error 4.4731
Trimming the least signiicant variables Enabled
Source: author’s calculations
M. Soliwoda Factors Inluencing Productivity of Tangible Fixed Assets in Dairy Cooperatives in Poland

229
Economic Science for Rural Development Nr. 28., 2012
ISSN 1691-3078
The graph depicting the observed values as a function
of the value predicted by the model can be treated as the visual tool for evaluating itting the model. The graph (Figure 3) shows relatively correct correspondence between observed and predicted values (the points indicating observations are arranged approximately along the line, described by the equation y = x).
Conclusions1. Productivity of tangible ixed assets in dairy
cooperatives is inluenced by many various factors including the complex aspects of shareholders’ fund policy in cooperatives and the fundamental economic aim of the cooperative - taking care of interests of their members. The problem of determining factors that inluence the productivity of TFA has become more important because of transformation concerning the inancial and economic situation of Polish dairy cooperatives, which beneited and beneit from the EU pre- and post-accession EU inancial aid.
2. Empirical evidence from 396 observations of dairy cooperatives over the period of years between 2004 and 2009 supports that inancial liquidity is signiicantly linked to the productivity of TFA. The
model of classical regression (based on the stepwise method) indicates that the level of Current Ratio was the stimulant for productivity of TFA.
3. The hypothesis that the shareholders’ and supplementary funds positively affect the productivity of TFA in dairy cooperatives was rejected in the model of classical multiple linear regression. Variables concerning structure of own funds were statistically insigniicant. MARSSplines
regression model indicated the signiicant role of the supplementary fund as the potential stimulant of productivity of TFA.
4. The ratio of short-term liabilities to total assets positively affected the productivity of TFA. This leads to the conclusion that taking care of proper
capital structure (according to modern theories of corporate inance) may improve an effectiveness of TFA management.
5. The regression model built by means of the MARSSplines method was characterised by higher level of R-square and better correspondence between observed and predicted value. This implicates potential possibility of using the MARSSplines method as “the alternative” for the classical regression.
Y = 1.68401763977268e+000 + 7.51734008122576e+000*max(0; X7-3.01737480141621e-001) - 3.77384222295297e+001*max(0; 3.01737480141621e-001-X7) + 3.58525678393210e+000*max(0; X4-4.83304418090643e-001) - 1.30376843808996e+002*max(0; X3-5.14903680487157e-001) + 3.82661958395429e+000*max(0; X2-5.45683907010272e-001) - 2.57287445291785e+001*max(0; 1.53205456245919e-001-X9) + 1.40795035926849e+002*max(0; X3-5.38111863533051e-001) + 1.82626235996917e+001*max(0; X3-3.30609413595912e-001) - 7.17327292331333e+000*max(0; X3-2.19745728671381e-001) - 3.91293969470539e+001*max(0; X3-6.03835653037881e-001)
Source: author’s calculations (computation by STATISTICA 9.1)
Fig. 2. Regression equation - MARSSplines
Source: author’s construction (computation by STATISTICA 9.1)
Fig. 2. Graph of observed and predicted values - MARSSplines
M. Soliwoda Factors Inluencing Productivity of Tangible Fixed Assets in Dairy Cooperatives in Poland

Economic Science for Rural Development Nr. 28., 2012
ISSN 1691-3078
230
Bibliography 1. Bartosinska, D. (2001). Statystyka srodkow trwalych
(Statistics of Tangible Fixed Assets). In: Metody statystyczne w analizie dzialalnosci przedsiebiorstwa (Statistical Methods For Business Analysis) (Ed. by
E. Nowak). Warszawa: PWE Press, pp. 72-96.2. Dworniak, J. (2010). Ekonomiczno – inansowe
skutki zmian funduszu udzialowego w spoldzielniach mleczarskich (The Economic – Financial Results of Shareholders Fund Changes in Dairy Cooperatives). Warszawa: SGGW Press, p. 9.
3. Loth, R. (2012). Liquidity Measurement Ratios. Retrieved: http://www.investopedia.com/university/ratios/liquidity-measurement/ratio3.asp#axzz1kQHdQvGQ. Access: 25 January 2012.
4. Mykolaitiene, V., Vecerskiene, G., Jankauskiene, K., Valanciene, L. (2010). Peculiarities of Tangible Fixed Assets Accounting. Inzierine Ekonomika – Engineering Economics, 21(2), pp. 142-150.
5. Nebl, Th. (2002). Production Management. Oldenbourg Wissenschaftsverlag, p. 488.
6. Pietrzak, M. (2006). Efektywnosc – inansowa spoldzielni mleczarskich – koncepcja oceny (Business
Performance of Dairy Cooperatives – an Evaluation Concept). Warszawa: SGGW Press, p. 36.
7. Pisarska, A. (2009). Efektywnosc gospodarowania rzeczowymi aktywami trwalymi w malych i srednich przedsiebiorstwach regionu swietokrzyskiego (Eficiency of Management of Tangible Fixed Assets in Swietokrzyskie Region). SGGW Press, Warszawa, pp. 197-205.
8. StatSoft, Inc. (2011). Electronic Statistics Textbook. Tulsa. Retrieved: http://www.statsoft.com/textbook/. Access: 25 January
2012.9. Wasilewski, M., Zabadala, P. (2011). Wartosc i zuzycie
srodkow trwalych w ujeciu sektorowym (Value & Consumption of Tangible Fixed Assets – Sector Approach). Zeszyty Naukowe SGGW w Warszawie, Ekonomika i Organizacja Gospodarki Zywnosciowej (Scientiic Papers of WULS-SGGW, Economics and Organisation of Agri-Food System), No. 89, pp. 49-59.
10. Weiers, R. (2010). Introduction to Business Statistics. Mason: South-Western Centgage Learning, pp. 670-671.
M. Soliwoda Factors Inluencing Productivity of Tangible Fixed Assets in Dairy Cooperatives in Poland
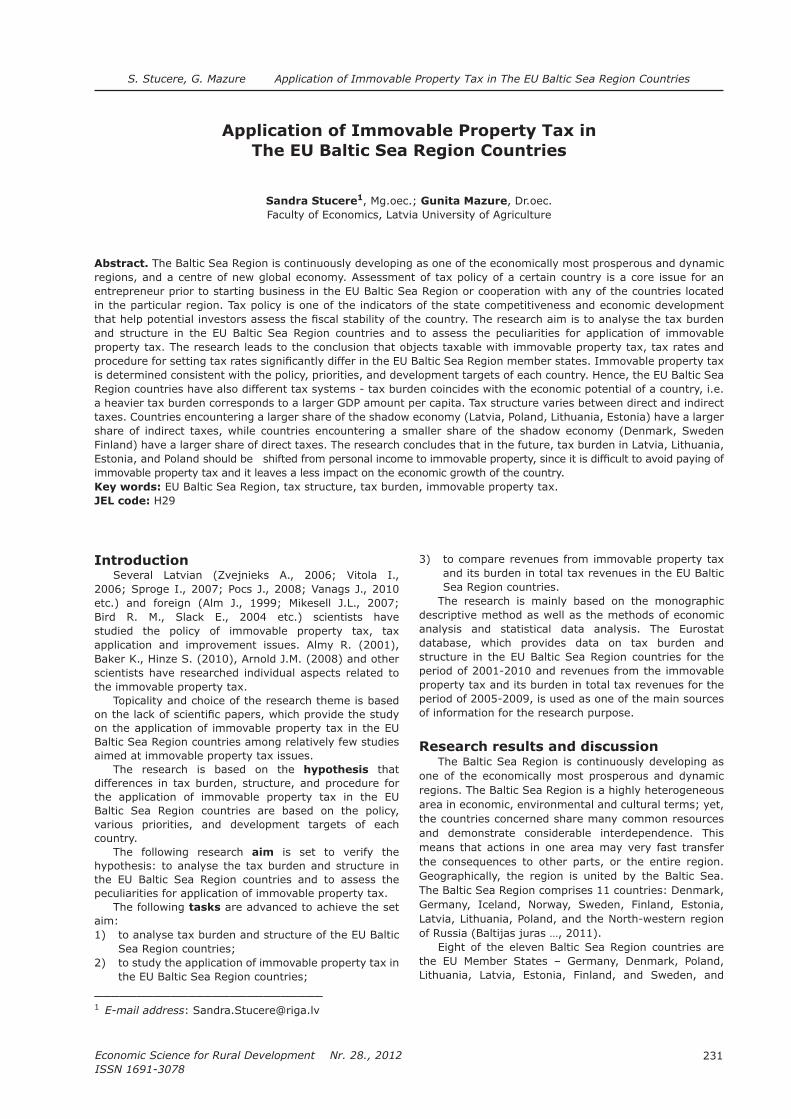
231
Economic Science for Rural Development Nr. 28., 2012
ISSN 1691-3078
S. Stucere, G. Mazure Application of Immovable Property Tax in The EU Baltic Sea Region Countries
___________________________1 E-mail address: [email protected]
Application of Immovable Property Tax in The EU Baltic Sea Region Countries
Sandra Stucere1, Mg.oec.; Gunita Mazure, Dr.oec.Faculty of Economics, Latvia University of Agriculture
Abstract. The Baltic Sea Region is continuously developing as one of the economically most prosperous and dynamic regions, and a centre of new global economy. Assessment of tax policy of a certain country is a core issue for an entrepreneur prior to starting business in the EU Baltic Sea Region or cooperation with any of the countries located in the particular region. Tax policy is one of the indicators of the state competitiveness and economic development that help potential investors assess the iscal stability of the country. The research aim is to analyse the tax burden and structure in the EU Baltic Sea Region countries and to assess the peculiarities for application of immovable property tax. The research leads to the conclusion that objects taxable with immovable property tax, tax rates and procedure for setting tax rates signiicantly differ in the EU Baltic Sea Region member states. Immovable property tax is determined consistent with the policy, priorities, and development targets of each country. Hence, the EU Baltic Sea Region countries have also different tax systems - tax burden coincides with the economic potential of a country, i.e. a heavier tax burden corresponds to a larger GDP amount per capita. Tax structure varies between direct and indirect taxes. Countries encountering a larger share of the shadow economy (Latvia, Poland, Lithuania, Estonia) have a larger share of indirect taxes, while countries encountering a smaller share of the shadow economy (Denmark, Sweden Finland) have a larger share of direct taxes. The research concludes that in the future, tax burden in Latvia, Lithuania, Estonia, and Poland should be shifted from personal income to immovable property, since it is dificult to avoid paying of immovable property tax and it leaves a less impact on the economic growth of the country. Key words: EU Baltic Sea Region, tax structure, tax burden, immovable property tax.JEL code: H29
Introduction Several Latvian (Zvejnieks A., 2006; Vitola I.,
2006; Sproge I., 2007; Pocs J., 2008; Vanags J., 2010 etc.) and foreign (Alm J., 1999; Mikesell J.L., 2007; Bird R. M., Slack E., 2004 etc.) scientists have studied the policy of immovable property tax, tax
application and improvement issues. Almy R. (2001), Baker K., Hinze S. (2010), Arnold J.M. (2008) and other scientists have researched individual aspects related to
the immovable property tax. Topicality and choice of the research theme is based
on the lack of scientiic papers, which provide the study on the application of immovable property tax in the EU Baltic Sea Region countries among relatively few studies aimed at immovable property tax issues.
The research is based on the hypothesis that
differences in tax burden, structure, and procedure for the application of immovable property tax in the EU Baltic Sea Region countries are based on the policy, various priorities, and development targets of each
country.The following research aim is set to verify the
hypothesis: to analyse the tax burden and structure in the EU Baltic Sea Region countries and to assess the peculiarities for application of immovable property tax.
The following tasks are advanced to achieve the set
aim:1) to analyse tax burden and structure of the EU Baltic
Sea Region countries;2) to study the application of immovable property tax in
the EU Baltic Sea Region countries;
3) to compare revenues from immovable property tax and its burden in total tax revenues in the EU Baltic Sea Region countries.
The research is mainly based on the monographic descriptive method as well as the methods of economic analysis and statistical data analysis. The Eurostat database, which provides data on tax burden and structure in the EU Baltic Sea Region countries for the period of 2001-2010 and revenues from the immovable property tax and its burden in total tax revenues for the period of 2005-2009, is used as one of the main sources of information for the research purpose.
Research results and discussionThe Baltic Sea Region is continuously developing as
one of the economically most prosperous and dynamic regions. The Baltic Sea Region is a highly heterogeneous area in economic, environmental and cultural terms; yet, the countries concerned share many common resources and demonstrate considerable interdependence. This means that actions in one area may very fast transfer the consequences to other parts, or the entire region. Geographically, the region is united by the Baltic Sea. The Baltic Sea Region comprises 11 countries: Denmark, Germany, Iceland, Norway, Sweden, Finland, Estonia, Latvia, Lithuania, Poland, and the North-western region of Russia (Baltijas juras …, 2011).
Eight of the eleven Baltic Sea Region countries are the EU Member States – Germany, Denmark, Poland, Lithuania, Latvia, Estonia, Finland, and Sweden, and

Economic Science for Rural Development Nr. 28., 2012
ISSN 1691-3078
232
particularly these countries are profoundly studied in the
research. This choice is based on the fact that cooperation among the EU Member States of the Baltic Sea Region is considered as essential instrument for the establishment of a single EU policy. The EU Strategy for the Baltic Sea Region adopted at the European Council meeting of the EU Member States in October 2009 also evidences the statement. The Strategy aims to advance the cooperation among the Baltic Sea Region countries and to increase global competiveness of the Region as well as to coordinate the efforts of the EU Member States belonging to the Region, organisations and inancial institutions of the Baltic region, and other stakeholders for the achievement of the set aim. The Strategy advances four objectives: to promote environmental sustainability in the Baltic Sea Region, to raise the economic growth and welfare of the Baltic Sea Region, to facilitate accessibility and attractiveness of the Baltic Sea Region as well as to enhance safety and security of the Baltic Sea Region.
The EU Strategy for the Baltic Sea Region is intended as the internal EU strategy, while external cooperation projects are developed to cooperate with those countries of the Region that are outside the European Union. The Strategy enables a more complete use of the EU, regional, national, and international inancial support for a joint implementation of projects signiicant to the entire Region (ES strategija …, 2011).
Analysis of tax burden and structure in the EU Baltic Sea Region countries
Taxes are a pecuniary burden laid upon individuals or property owners to support speciic facilities of the government. Taxes fulil two essential functions – iscal and regulative. The iscal function is implemented through the provision of the state treasury with inancial resources to inance the state expenditure for covering the public necessities (defence, provision of the public policy, education etc.). It is possible to inluence the behaviour of economic subjects and socio-economic processes in the state through changes in tax elements; thus, implementing the regulative function of taxes. Both iscal and regulative functions are closely interconnected. Therefore, the government may not apply only one function, for example, to think on the budget revenues; it shall consider also the possible changes in the economy (Ketners K., 2009).
Taxes may be classiied by different features: by the taxable object, taxes are divided into consumption, income, and property taxes; by the method applied for setting taxes – proportional, progressive, and regressive taxes; by the government level imposing taxes – state, regional, and municipal taxes (Ketners K., 2009).
Most frequently taxes are classiied either by the method for setting the taxable base or an economic function. The irst method foresees the breakdown of taxes into direct and indirect taxes. Indirect taxes are taxes levied by the state on expenditure of a consumer including these taxes into the price of goods and services, contrary to direct taxes that are levied on the income or property of an entity. Indirect taxes are regressive measures, since they are not based on the ability to pay principle. The EU envisages the following direct taxes: property taxes (immovable property tax, motor vehicles
tax, capital tax, wealth tax, and property registration tax) and income taxes (personal income tax, corporate income tax, tax on inheritance and gifts, capital increase tax, distributable proit tax, capital transfer, and deduction tax).
Consistent with the economic functions, taxes may be classiied into consumption, labour, and capital taxes. The breakdown of tax revenues by the economic functions outlines the share of a certain tax group in total tax revenues paid by a consumer for goods and services (consumption taxes), paid by an employee from the salary/wage (labour taxes), and paid by an entity from the earned proit (capital taxes) (Ketners K., 2009).
Since the immovable property tax falls in the category of direct taxes, revenues from direct taxes in the EU Baltic Sea Region countries are discussed in more details for the period of 2001-2010 (Table 1).
The data of Table 1 show that in the EU Baltic Sea Region countries, the highest share of direct taxes of GDP is observed in Denmark, Sweden, and Finland; while the lowest indicators are seen in Lithuania, Latvia, Poland, and Estonia. In 2010, the difference between the highest indicator in Denmark (30.1%) and the lowest indicator in Lithuania (4.7%) equals to 25.4 percentage points.
Analysing the difference between the revenues from direct taxes in 2010 compared with 2001, Denmark shows the highest increase (0.6 percentage points), while Finland has experienced the highest decrease
(-3.4 percentage points). In turn, the comparison
of 2010 and 2008 data, which coincide with the beginning of the global economic crisis, presents the decrease in the share of direct taxes in the entire EU Baltic Sea Region countries (Table 1). A more profound analysis of macroeconomic indicators of each EU Baltic Sea Region country could be required to explain the reasons for such a decrease. In general, the decline might be explained by a sharp decrease of internal consumption, decrease of wages/salaries and corporate proit, increase of unemployment and shadow economy as well as structural changes in the tax base.
Usually the tax burden calculated in per cent of the Gross Domestic Product is used as the key indicator of tax policy, which shows the share of GDP redistributed by means of the state tax policy (Ketners K., 2009).
Determination of the tax burden is one of the key indicators of the state tax policy. There is a generally accepted opinion that business tax burden is an essential factor affecting decision-making when companies choose their address for legal registration. The role of this factor is essentially signiicant within the EU context on the conditions of free capital movement.
The analysis of the tax burden (Figure 1) for the year 2010 in the EU Baltic Sea Region countries outlines quite a lot of variation. The highest tax burden is observed in Denmark (48.8%), followed by Sweden (46.1%), Finland (41.9%), and Germany (39%). The lowest tax burden is observed in Lithuania – 27.2%. This aspect greatly coincides with the economic potential of a country, i.e. a heavier tax burden corresponds to a larger GDP amount per capita. The explanation is rather simple: the possibility to transfer a larger share of GDP for inancing of general public needs increases with the growth of the economic potential. The share of indirect taxes in the Baltic States
S. Stucere, G. Mazure Application of Immovable Property Tax in The EU Baltic Sea Region Countries

233
Economic Science for Rural Development Nr. 28., 2012
ISSN 1691-3078
and Poland exceeds the share of direct taxes; while in Denmark, Finland and Sweden, the situation is quite opposite, i.e. the share of direct taxes exceeds the share of indirect taxes. In Germany, both shares are equal and it has the highest share of social contributions among the EU Baltic Sea Region countries. Social contributions are very low in Denmark (1.9% of GDP) as most welfare spending is inanced out of general budget revenues, basically direct taxation. Nevertheless, Denmark is an exception in this aspect; relatively low share (compared with direct and indirect taxes) of social contributions in total tax revenues is visible also for Sweden (8.8% of GDP). Whereas, in Latvia considering the demographic peculiarities, the share of social contributions (8.6% of GDP) exceeds the share of direct taxes (7.4% of GDP) (Government Finance …, 2011).
Lower level of remuneration and corporate proit simultaneously reducing the possibility to receive direct
tax revenues in the budget is characteristic to the new Member States being the Baltic Sea Region countries. This is evidenced by the GDP per capita indicator
consistent with the purchasing power parity standards and the average wage. In 2010, the highest GDP per capita by purchasing power parity standards was visible in Denmark (123%), Sweden (119%), Germany (116%), and Finland (115%). The same indicators for the Baltic States and Poland were almost twice lower. The lowest indicator was presented by Latvia (51%). The highest average labour remuneration per one employed person was observed in Germany (EUR 53659.9), Sweden
(EUR 50666.7), Finland (EUR 47544.5), and Denmark (EUR 44801.0). The indicators for Lithuania
(EUR 21082.5), Poland (EUR 19203.7), Estonia
(EUR 18424), and Latvia (EUR 16199.1) were more than 2.5 times lower. The analysis leads to a conclusion
that the EU Baltic Sea Region countries having higher
S. Stucere, G. Mazure Application of Immovable Property Tax in The EU Baltic Sea Region Countries
Table 1
Direct taxes in the EU Baltic Sea countries in the period of 2001-2010, % of GDP
Country 2001 2002 2003 2004 2005 2006 2007 2008 2009 2010
Difference in percentage points
2010/2001
2010/2008
Denmark 29.5 29.3 29.6 30.4 31.9 30.7 30.1 29.9 30.2 30.1 +0.6 -0.2
Germany 11.0 10.7 10.6 10.2 10.3 10.9 11.3 11.5 11.0 11.0 0 -0.5
Estonia 7.2 7.5 8.0 7.9 7.0 7.1 7.6 7.9 7.5 6.8 -0.4 -1.1
Latvia 7.6 7.8 7.6 7.9 7.9 8.5 9.2 9.7 7.2 7.4 -0.2 -2.3
Lithuania 7.8 7.5 8.0 8.7 9.0 9.6 9.2 9.3 6.0 4.7 -3.1 -4.6
Poland 6.7 6.9 6.6 6.4 7.0 7.5 8.6 8.6 7.5 6.9 +0.2 -1.7
Finland 19.3 19.2 18.1 17.8 17.9 17.7 17.8 17.9 16.5 15.9 -3.4 -2.0
Sweden 20.8 19.6 20.2 20.9 22.0 22.2 21.2 19.8 19.7 19.3 -1.5 -0.5Source: authors’ summary and calculations based on Taxation Trends …, 2010 and Government Finance …, 2011
13.9 1816.8
11.1 11.3 11.8 13.6 13.3
11
30.1
6.87.4 4.7
6.9
15.9
19.3
1.9
13.3
11.116.9
8.6 10.7
12.7
8.8
14.315.6
14.714.4
29.9
26.1
3027.9
0
10
20
30
40
50
60
Denmark Germany Estonia Latvia Lithuania Poland Finland Sweden
% o
f GD
P
Indirect taxes Direct taxes Social contributions Shadow economy
Source: authors’ construction based on Government Finance …, 2011
Fig.1. Tax burden, tax structure and the share of shadow economy in the EU Baltic Sea Region countries in 2010, % of GDP

Economic Science for Rural Development Nr. 28., 2012
ISSN 1691-3078
234
share of direct taxes experience a higher living
standard – larger GDP per capita and higher average
wage (European Commission …, 2011).The World Economic Forum analysis on the
competitiveness indices of the EU Baltic Sea Region countries for the period of 2009-2010 shows that the EU Baltic Sea Region countries having a higher tax burden are ranked in higher positions by competiveness indices, while the countries having a lower tax burden are ranked in much lower positions. Hence, in 2009-2010, Denmark is ranked in the 5th position according to the
competitiveness index (in 2010, the total tax burden equals to 48.8% of GDP), Sweden – in the 4th position (in
2010, the total tax burden– 46.1% of GDP), Finland – in the 6th position (in 2010, the total tax burden – 41.9% of GDP), and Germany – in the 7th position (in 2010, the total tax burden – 39% of GDP). Latvia, which in 2010 had the second lowest tax burden in the EU Baltic Sea Region, is ranked in the 68th position according to the
competitiveness index (The Global …, 2011).This leads to a conclusion that tax burden is not the
main factor determining the development of a country. Competitiveness indices, GDP, the average salary, inlation, unemployment, shadow economy, and other rates shall be analysed to determine the economic development of countries.
Shadow economy plays a signiicant role in the low share of direct taxes in case of Latvia, Poland, Lithuania, and Estonia, since the shadow economy actors do not pay direct taxes (income taxes) at all. The analysis on the share of the shadow economy (Figure 1) outlines that in 2010, the highest share of shadow economy of GDP among the EU Baltic Sea Region countries was observed in Lithuania (30%), Estonia (29.9%), Latvia (27.9%), and Poland (26.1%). Finland (14.3%), Denmark (14.4%), Germany (14.7%), and Sweden (15.6%) had almost twice lower share of the shadow economy (Schneider Fr., 2010). According to Figure 1, the share of shadow economy in Latvia and Lithuania exceeds the tax burden in these countries. Large share of shadow economy is visible also in Estonia and Poland, which is only slightly lower than the tax burden of the mentioned countries. Therefore, these are the countries among the EU Baltic Sea Region countries, which should think of reduction of the share of shadow economy. Redistribution of the tax burden could be as one of the possible solutions. The structure of direct taxes should be revised in Latvia, Lithuania, Estonia, and Poland and in future, the tax burden should be redirected from personal income tax to immovable property tax, since it is impossible to hide
a taxable object and hence, to avoid paying of the tax. This positive aspect of immovable property tax would signiicantly reduce shadow economy and increase the share of direct taxes in total tax revenues. This is also outlined in the studies of foreign researchers, like Jens
Matthias Arnold, a researcher at the OECD, who analyses
the growth of the OECD countries in his paper “Do Tax Structures Affect Aggregate Economic Growth” and compares it with the tax structure – aspects on which the tax impact is laid on. Depending on aspect whether taxes are basically imposed on property, consumption, or private income, he noticed a difference in the growth rates of countries and the following correlation: the more taxes were imposed on immovable property and less – on private income, the faster economics developed in these countries. The difference is quite considerable, annually
around 2%, thus, within 10-20 years, the difference in revenues of these countries may increase extremely signiicantly (Arnold J., 2008).
Immovable property tax in the EU Baltic Sea Region countries
The European Union has not set a single procedure for
the application of immovable property tax in its Member States. Each country may specify its own procedure for the application of immovable property tax consistent with the policy, priorities, and advanced development targets of the country.
Immovable property tax is a state tax administered by local governments and revenues gained from immovable property tax are transferred to the municipal budget. Usually immovable property tax revenues are an essential source for municipal budget revenues thanks to the relatively simple tax administration and ixing of it to a certain territory. Taxable objects may be land plots, buildings, and constructions. Immovable property tax is collected annually and the tax base is the value of immovable property, which is deined consistent with the land cadastre data, statistics on land market transactions, or budgeted revenues. Usually, the tax base is 40-50% of maximum market value of an object. There are different types for setting and application of
immovable property tax rates. In some countries, ixed immovable property tax rates are set by the legislation (Latvia), or the rates are set by the local government within the limits prescribed by the legislation (Estonia); in some other countries, a ixed tax rate is applied to a certain part of immovable property taxable objects, while the local government may decide on levying the tax for the other part of the property (Sweden, Lithuania, Denmark, Finland). Still, there are countries, where local governments have the rights to set the immovable property tax rate. This phenomenon is characteristic to Germany, which is a country of federal tax system. The structure of tax system in a federal country is determined by the political system of the country and includes relatively independent elements – regions that have individual rights to set immovable property tax rates. In several countries, immovable property tax is set in terms of money according to the area of land or lat (premises). Hence, it is possible to apply norms on premises and impose a tax on “excessive” areas. Immovable property tax reliefs are usually applied by local governments in their administrative territories (Ketners K., 2009).
Positive aspects of the immovable property tax – it is impossible to hide a taxable object, the tax base is easy determinable (information from the cadastre, market statistics on selling similar objects, insurance value), or it is possible to apply a progressive scale. Drawbacks of the tax relate to the necessity to identify the purpose for utilisation of the immovable property – social needs, charity, the only place of residence etc. (Ketners K., 2009).
The analysis on peculiarities for applying immovable property tax in the EU Baltic Sea Region countries (Table 2) shows that the cadastral value is used as the basis for setting immovable property tax rate in all countries of the Region, except for Poland. In Sweden and Denmark, a method of capitalisation is used to determine the cadastral value. This method includes the analysis and determination of revenues from rent
S. Stucere, G. Mazure Application of Immovable Property Tax in The EU Baltic Sea Region Countries

235
Economic Science for Rural Development Nr. 28., 2012
ISSN 1691-3078
Table 2
Application of immovable property tax in the EU Baltic Sea Region countries
Country Tax base Taxable object Tax rate, %Coeficient
applied by a local government
Price for sqm
Latvia Cadastral value LandBuildingsEngineering
constructions
Natural agricultural land
Residential buildings
1.51.51.5
3
0.2-0.6
-
-
-
-
-
-
-
-
-
-
Lithuania Cadastral value LandBuildingsEngineering
constructions
1.50.3-10.3-1
-
-
-
-
-
-
Estonia Cadastral value Land 0.1-2.5 - -
Sweden Cadastral value BuildingsResidential buildings
Engineering
constructions
0.5-10.75
0.2-2.8
-
-
-
-
-
-
Denmark Cadastral value LandBuildings
1.0-3.40.4-2.8
-
-
-
-
Finland Cadastral value BuildingsResidential buildings
Engineering
constructions
0.6-1.350.32-0.75
0.6-2.85
-
-
-
-
-
-
Germany Cadastral value Buildings 0.35 2.8-6.0 -
Poland Value of one sqm of property, PLN
LandBuildingsResidential buildings
-
-
-
-
-
-
0.41-0.80 4.27-21.050.67
Source: authors’ construction based on Taxes in Europe, 2011
Table 3
Amount of immovable property tax and its share in total tax revenues in the Baltic Sea Region countries for the period of 2005-2009
Country 2005 2006 2007 2008 2009Difference
2009/2005
Denmarkshare,% 1.82 1.83 1.88 2.03 2.27 +0.45
amount, mln. DKK 14 348.96 14 842.14 15 601.27 17 000.16 18 102.53 + 3 753.57
Germanyshare,% 1.17 1.13 1.11 1.10 1.14 -0.03
amount, mln. EUR 10 250 10 400 10 710 10 810 10 940 +690
Estonia
share,% 0.95 0.80 0.70 0.93 0.97 +0.02
amount, mln. EEK 506 517 552 755 755 +249
Latviashare,% 2.34 1.95 1.65 1.50 2.10 -0.24
amount, mln. LVL 61.60 66.40 74.20 70.70 73.07 +11.47
Lithuaniashare,% 1.11 1.03 0.90 0.84 1.13 +0.02
amount, mln. LTL 230.1 253.3 262.8 281.3 299 +68.9
Poland
share,% 3.60 3.39 3.08 3.18 3.44 -0.16
amount, mln. PLN 11 614 12 139 12 622 13 899 14 700 +3 086
Finland
share,% 1.04 1.08 1.10 1.14 1.32 +0.28
amount, mln. EUR 725 785 850 914 974 +249
Swedenshare,% 1.85 1.75 1.74 1.60 1.76 -0.09
amount, mln. SEK 25 128.30 25 206.70 25 864.60 23 953.70 25 327.20 +198.9Source: authors’ construction based on Taxes in Europe, 2011
S. Stucere, G. Mazure Application of Immovable Property Tax in The EU Baltic Sea Region Countries
Economic Science for Rural Development Nr. 28., 2012
ISSN 1691-3078
236
or lease which an owner of the property could receive within a year. Denmark and Sweden have strictly set the procedure for accounting of rent payments. The other countries determine the cadastral value based on the method of comparing transactions, which analyses real estate market information on cases of dispossession. Determination of the cadastral value does not include an individual assessment of each object, but a bulk assessment, which is based on the application of standard procedures for calculation of the value of an
object for taxation purposes. This allows evaluating of a large number of objects with relatively low costs (Taxes in Europe, 2011).
Taxable objects signiicantly differ by the EU Baltic Sea Region countries. For example, in Estonia, immovable property tax is levied only on the land; while in Germany, the tax is levied only on buildings. Immovable property tax is applicable to residential buildings in Latvia, Sweden, Finland, and Poland. Latvia has the largest set of taxable objects; here immovable property tax is levied on the land, buildings, engineering constructions, and residential buildings (Taxes in Europe, 2011).
The EU Baltic Sea Region countries outline considerable differences in the techniques applied for setting immovable property tax rates; basically depending on the legislation of a certain country and
economic experience. Fixed and variable tax rates are set depending on the method applied by each country. Local governments have the rights to impose ixed tax rates. Besides, local governments may set additional coeficients. For example, Germany has set a general immovable property tax rate levied at 0.35% and local governments depending on the type of use of immovable property determine additional coeficients ranging between 2.8 and 6.0 that are used for multiplying the ixed rate (Taxes in Europe, 2011). Some countries apply proportional tax rates. For example, in Latvia, residential buildings are levied at 0.2% of the property cadastral value, if the property cadastral value does not exceed
LVL 40 000; at 0.4% of the property cadastral value, for the part of the property cadastral value that ranges
between LVL 40 000 and LVL 75 000; and at 0.6% of the property cadastral value that exceeds LVL 75 000
(Par nekustama ipasuma nodokli, 2011).Local governments have the rights to state tax
reliefs to socially vulnerable taxpayers – retired persons, disabled persons; besides some countries (Sweden, Denmark, and Germany) prior to conferring tax reliefs, consider the family status of a taxpayer and their income level. For example, Sweden, to protect residents against high taxes, has set limits of payments, i.e. the amount of immovable property tax may not exceed 4-5% of a person’s income (Taxes in Europe, 2011).
Immovable property tax reliefs are applied in all the EU Baltic Sea Region countries. In addition, there are types of immovable property that are fully or partially exempted from tax payment. The EU Baltic Sea Region countries apply tax exemptions to the objects used for cultural, education, public needs, state administration, and religious purposes. There are countries, which apply the exemption from immovable property tax for a certain period. This is done to promote certain types of economic activities. For example, in Sweden, immovable property tax shall not be paid 5 calendar years after
the construction of a new residential building, while immovable property tax rate is reduced by 50% for the next 5 years. In Germany, immovable property tax shall not be paid 10 calendar years after the construction
of a new residential building (Taxes in Europe, 2011). However, in Latvia, immovable property tax shall not be paid only one year after construction or reconstruction
of a building to be used for economic purposes (Par nekustama ipasuma nodokli, 2011).
In Denmark and Germany, immovable property tax is included in corporate income tax or personal income tax, if the property is rented or hired (Taxes in Europe, 2011).
Poland is the only EU Baltic Sea Region country, which applies the value of one square metre and not the cadastral value for calculations of immovable property tax. Every year the government of Poland updates and states the value of immovable property per one square metre for each taxable object – land, buildings, residential buildings (Taxes in Europe, 2011). On the one hand, such administration of immovable property tax is simple and understandable; while on the other hand, economically, this leads to disregarding of the real estate market development and uneven distribution of tax burden.
The amount of collected immovable property tax revenues as well as the share of immovable property tax in total tax revenues greatly differ among the EU Baltic Sea Region countries (Table 3).
Characteristics of the share of immovable property tax of the EU Baltic Sea Region countries in total tax revenues of the state consolidated budget reveal the
following peculiarities (Table 3). In 2009, the largest share of immovable property tax was observed in Poland (3.44%), Denmark (2.27%), and Latvia (2.10%). The different method for calculation of immovable property tax explains the high share of immovable property tax in Poland. Irrespective of the place of property location (town/city, countryside), immovable property tax is calculated based on the state determined value of one square metre. Thus, the location and market value of the property inluence the amount of immovable property tax. Besides, Poland has deined a wide range of taxable objects (land, buildings, residential buildings), and considering the large territory of the country, it is saturated with real estate. The relatively high share of immovable property tax in Denmark may be explained by the highest immovable property tax rate for land (up to 3.4%) in the EU Baltic Sea Region countries. Though, the relatively high share of immovable property tax in Latvia is explained by a wide range of taxable objects (land, buildings, engineering constructions). In Latvia, an increase in the share of immovable property tax in total tax revenues was forecasted from 2010, since exactly in 2010, the immovable property tax rate for land was increased (from 1% to 1.5%), simultaneously widening the range of taxable objects – the government initiated the taxation of residential buildings with immovable property tax. Easier and simpler administration of immovable property tax compared with other taxes explains the widening of the range of taxable objects and increase of the tax rates. The government of Latvia prefers those taxes that exclude possibility to avoid paying of them; hence reducing the share of shadow
economy.
S. Stucere, G. Mazure Application of Immovable Property Tax in The EU Baltic Sea Region Countries

237
Economic Science for Rural Development Nr. 28., 2012
ISSN 1691-3078
In 2009, the lowest share of immovable property tax in total state tax revenues was in Estonia (0.97%), Lithuania (1.13%), and Germany (1.14%). The small share of immovable property tax in Estonia and Germany is explained by the fact that in Estonia, immovable property tax is imposed only to land, while in
Germany – only to buildings. The low immovable property tax rate imposed to buildings (0.3-1%) explains the relatively small share of immovable property tax in Lithuania.
Table 3 provides the possibility to analyse the
dynamics in the share of immovable property tax in 2009 compared with 2005. In 2009, the share of immovable property tax in total tax revenues has mostly increased in Denmark (+0.45 percentage points) and Finland (+0.28 percentage points) compared with 2005. Denmark and Finland are the only EU Baltic Sea Region countries, which outlined the increase in the share of immovable property tax for the period of 2005-2009. The largest decrease in immovable property tax has been observed in Latvia (-0.24 percentage points) and Poland (-0.16 percentage points).
However, the analysis on the amounts of immovable property tax for the period of 2005-2009 (Table 3) outlines that irrespective of luctuations in the share of immovable property tax, the tax revenues from immovable property tax in absolute igures have shown an annual growing trend. A decrease in the amount of immovable property tax (in absolute igures) was observed only in 2008 in Latvia and Sweden. In Latvia, the change of immovable property tax rate for land from 1.5% to 1% of the cadastral value explains the decrease in the amount of immovable property tax. The substitution of immovable property tax levied on buildings with the local municipal duty in 2008 explains the decrease in the amount of immovable property tax in Sweden (Taxes in Europe, 2011).
Therefore, luctuations in the share of immovable property tax may be explained by the changes of other taxes (personal income tax, value added tax etc.) in total tax revenues.
Conclusions, proposals, recommendations 1. The Baltic Sea Region is continuously developing
as one of the economically most prosperous and dynamic regions. The cooperation among the Baltic Sea Region countries is considered as signiicant instrument in the establishment of a common
EU policy. 2. The EU Baltic Sea Region countries have different tax
systems - tax burden coincides with the economic potential of a country, i.e. a heavier tax burden corresponds to a larger GDP amount per capita. Tax structure varies between direct and indirect taxes. Countries encountering a larger share of the shadow economy (Latvia, Poland, Lithuania, Estonia) have a larger share of indirect taxes, while countries encountering a smaller share of the shadow economy (Denmark, Sweden Finland) have a larger share of direct taxes.
3. Objects taxable with immovable property tax, tax rates and procedure for setting tax rates signiicantly differ in the EU Baltic Sea Region member states. Immovable property tax is determined consistent with the policy, priorities, and development targets of each country. Immovable property tax revenues range between 0.97% (Estonia) and 3.44% (Poland) of total tax revenues.
4. In the future, the structure of direct taxes in Latvia, Lithuania, Estonia, and Poland should be revised and the tax burden should be shifted from personal income tax to immovable property tax, since it is dificult to avoid paying of immovable property tax. These changes could reduce the share of shadow economy and increase the share of direct taxes in total tax revenues.
Bibliography 1. Arnold, J.M. (2008). Do Tax Structures Affect
Aggregate Economic Growth? Retrieved: http://dx.doi.org/10.1787/236001777843. Access: 6 December 2011.
2. Baltijas juras regionu valstu padome (Council of the Baltic Sea Region Countries) (2011). Retrieved: http://www.iem.gov.lv/lat/starptautiska_sadarbiba/padomes/baltijas_juras_regiona_valstu_padome/. Access: 30 November 2011.
3. European Commission Statistics (2011). Retrieved: http://epp.eurostat.ec.europa.eu/portal/page/portal/eurostat/home/. Access: 30 December 2011.
4. ES strategija Baltijas juras regionam (EU Strategy for the Baltic Sea Region) (2011). Retrieved: http://www.norden.lv/lv/par-mums/es-strategija-baltijas-juras-regionam. Access: 15 November 2011.
5. Government Finance Statistics, Summary Tables – 2/2011 Retrieved: http://epp.eurostat.ec.europa.eu/cache/ITY_OFFPUB/KS-EK-11-002/EN/KS-EK-11-002-EN.PDF. Access: 28 December 2011.
6. Ketners, K. (2009). Nodokli Eiropas Savienibas vide (Taxes in the European Union). Banku augstskola, Biznesa un inansu petniecibas centrs, p. 127.
7. Par nekustama ipasuma nodokli (On Immovable Property Tax): LR likums (2011). Retrieved: http://www.likumi.lv/doc.php?id=43913. Access: 1 December 2011.
8. Schneider, Fr. (2010). Size and Development of the Shadow Economy of 31 European Countries from 2003 to 2010. Retrieved: http://www.econ.jku.at/schneider. Access: 6 December 2011.
9. Taxes in Europe (2011). Retrieved: http://ec.europa.eu/taxation_customs/tedb/taxSearch.html. Access: 22 November 2011.
10. Taxation Trends in the European Union (2010). Retrieved: http://ec.europa.eu/taxation_customs/taxat ion/gen_info/economic_analys is/ tax_structures/index_en.htm. Access: 15 November 2011.
11. The Global Competitiveness Report (2011). Retrieved: http://www.weforum.org/en/initiatives/gcp/Global%20Competitiveness%20Report/index.htm. Access: 30 November 2011.
S. Stucere, G. Mazure Application of Immovable Property Tax in The EU Baltic Sea Region Countries

Economic Science for Rural Development Nr. 28., 2012
ISSN 1691-3078
238
I. Vitola, D. Joma Immovable Property Tax in Latvia: Problematic Aspects and Possibilities for Improvement
___________________________1 E-mail address: [email protected]
Immovable Property Tax in Latvia: Problematic Aspects and Possibilities for Improvement
Irija Vitola1, Dr.oec.; Daiga Joma, Dr.philol.
Faculty of Economics, Latvia University of Agriculture
Abstract. In making a tax policy on the present economic conditions in the world, the role of government is still very large – it can both promote and hinder the unlimited development of business, and social stratiication and differentiation as well as the development of social sphere. The research aim is to investigate and analyse the nature of immovable property tax and its role in the national economy of Latvia and the mechanism used for tax collection and distribution as well as to provide proposals for the improvement of immovable property tax.Since the best method in researching any phenomenon is the historical method, immovable property tax (hereinafter IPT) is studied and viewed historically by exposing its origination and formation, its advantages and disadvantages as well as measures, according to the authors, necessary for its improvement. The present Law on Immovable Property Tax (1997) is mostly based on an assumption that all sectors of economy are equally proitable and different rates of return promote investment in areas where it brings the highest return, thus, raising a nation’s wealth. The authors’ view, which is based on a long-term analysis of all sectors of the national economy, is that any sector features a speciic rate of proitability. Usually, according to a general scheme, the lowest rate belongs to forestry, followed by agriculture, quarrying industry, and manufacturing, whereas the highest rate is observed for commerce, banking and insurance, services, and entertainment and gambling. The authors came to an essential conclusion that IPT rates had to be differentiated by sector depending on the purpose of use of immovable property, since immovable property features different possibilities to ensure income to its owners, besides, capital liquidity is different.Key words: immovable property tax, taxation, improvement, Latvia.JEL code: H21
IntroductionAlways conditions existed on which government tax
policies did not eliminate the ability of taxpayers to pay taxes, but, on the contrary, the government had to ensure the sustainability of enterprises and the sustainable
wellbeing of all residents.The tax base is directly related with the proitability
of economic activity of enterprises including income gained from foreign investments and excluding interest and dividends earned by foreign investors in Latvia. The Central Statistical Bureau usually presents it as a GDP – Gross Domestic Product.
Research aim and tasksThe research aim is to investigate and analyse
the nature of immovable property tax and its role in the national economy of Latvia and the mechanism used for tax collection and distribution as well as to provide proposals for the improvement of immovable
property tax.The following research tasks were set to achieve the
research aim:1) to identify and analyse the purpose and tasks of
immovable property tax;2) to present the performance and role of immovable
property tax in the tax system.
Research methodologyThe research methodology includes a study and
analysis of origination and performance of land and immovable property taxes. The following research
methods were exploited: analysis, comparative surveying, the monographic method as well as inductive and deductive methods.
Research results and discussionIn 1995, a tax reform was implemented in Latvia to
achieve two main goals – to ensure stable government budget revenues for inancing priority social and economic activities, limiting inancial deicits; and promoting economic growth in the country by encouraging fair competition and abolishing unnecessary privileges or tax reliefs and unreasonably high tax rates for several economic sectors. To boost the economic development, consumption instead of income was taxed more in the result of the reform, thus, stimulating an increase in savings and investments in the country (Salmins J., 2005).
The basic principle on which the income tax system is based is the principle of social justice that arises from the imposing of income tax based on the ability of taxpayers to pay taxes. Implementing the principle of social justice becomes apparent as observing the principles of both vertical and horizontal equity.
If implementing the principle of vertical equity, different tax burdens are imposed on taxpayers of different incomes, i.e. those having higher income owing to certain circumstances are taxed at higher tax rates. According to the principle of horizontal equity, taxpayers bear equal tax burdens, i.e. all taxpayers are taxed to the same extent. These principles play a greater role in imposing an income tax on individuals. The majority
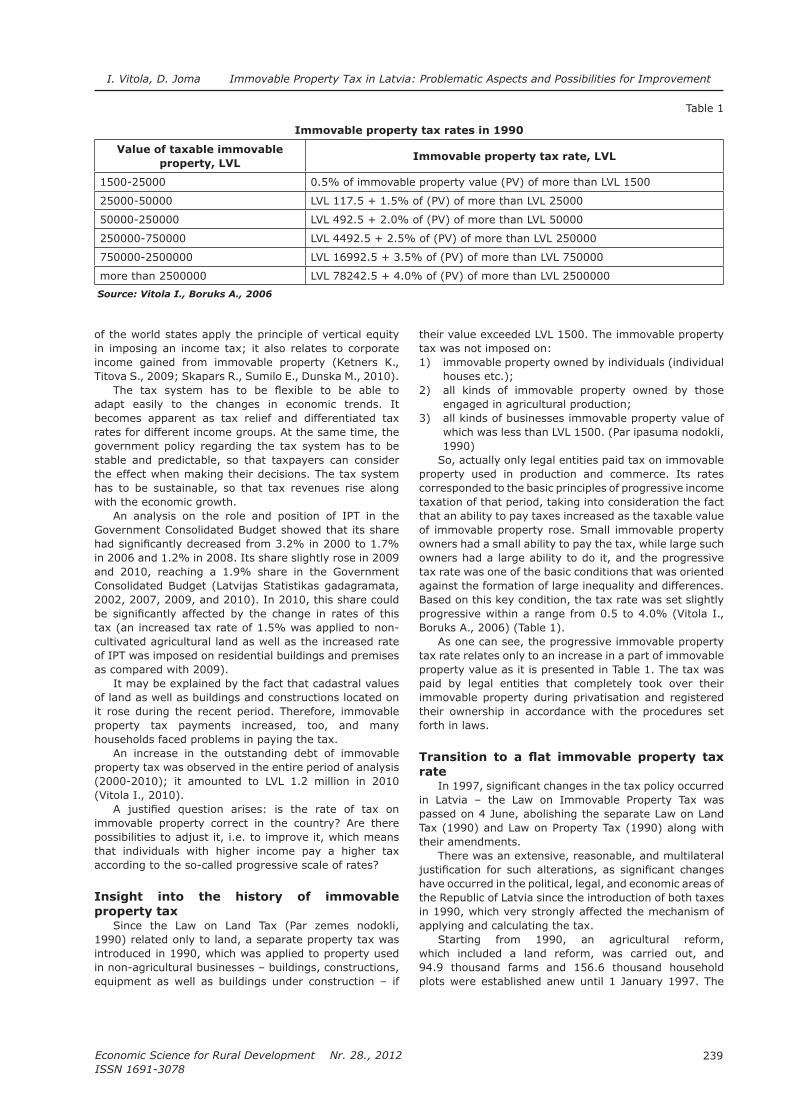
239
Economic Science for Rural Development Nr. 28., 2012
ISSN 1691-3078
of the world states apply the principle of vertical equity in imposing an income tax; it also relates to corporate income gained from immovable property (Ketners K., Titova S., 2009; Skapars R., Sumilo E., Dunska M., 2010).
The tax system has to be lexible to be able to adapt easily to the changes in economic trends. It becomes apparent as tax relief and differentiated tax rates for different income groups. At the same time, the government policy regarding the tax system has to be stable and predictable, so that taxpayers can consider the effect when making their decisions. The tax system has to be sustainable, so that tax revenues rise along with the economic growth.
An analysis on the role and position of IPT in the
Government Consolidated Budget showed that its share had signiicantly decreased from 3.2% in 2000 to 1.7% in 2006 and 1.2% in 2008. Its share slightly rose in 2009 and 2010, reaching a 1.9% share in the Government Consolidated Budget (Latvijas Statistikas gadagramata, 2002, 2007, 2009, and 2010). In 2010, this share could be signiicantly affected by the change in rates of this tax (an increased tax rate of 1.5% was applied to non-cultivated agricultural land as well as the increased rate of IPT was imposed on residential buildings and premises as compared with 2009).
It may be explained by the fact that cadastral values of land as well as buildings and constructions located on it rose during the recent period. Therefore, immovable property tax payments increased, too, and many households faced problems in paying the tax.
An increase in the outstanding debt of immovable property tax was observed in the entire period of analysis (2000-2010); it amounted to LVL 1.2 million in 2010 (Vitola I., 2010).
A justiied question arises: is the rate of tax on immovable property correct in the country? Are there possibilities to adjust it, i.e. to improve it, which means that individuals with higher income pay a higher tax according to the so-called progressive scale of rates?
Insight into the history of immovable property tax
Since the Law on Land Tax (Par zemes nodokli, 1990) related only to land, a separate property tax was introduced in 1990, which was applied to property used in non-agricultural businesses – buildings, constructions, equipment as well as buildings under construction – if
their value exceeded LVL 1500. The immovable property tax was not imposed on:1) immovable property owned by individuals (individual
houses etc.);2) all kinds of immovable property owned by those
engaged in agricultural production;3) all kinds of businesses immovable property value of
which was less than LVL 1500. (Par ipasuma nodokli, 1990)
So, actually only legal entities paid tax on immovable property used in production and commerce. Its rates corresponded to the basic principles of progressive income taxation of that period, taking into consideration the fact that an ability to pay taxes increased as the taxable value of immovable property rose. Small immovable property owners had a small ability to pay the tax, while large such owners had a large ability to do it, and the progressive tax rate was one of the basic conditions that was oriented against the formation of large inequality and differences. Based on this key condition, the tax rate was set slightly progressive within a range from 0.5 to 4.0% (Vitola I., Boruks A., 2006) (Table 1).
As one can see, the progressive immovable property tax rate relates only to an increase in a part of immovable property value as it is presented in Table 1. The tax was paid by legal entities that completely took over their immovable property during privatisation and registered their ownership in accordance with the procedures set forth in laws.
Transition to a lat immovable property tax rate
In 1997, signiicant changes in the tax policy occurred in Latvia – the Law on Immovable Property Tax was passed on 4 June, abolishing the separate Law on Land Tax (1990) and Law on Property Tax (1990) along with their amendments.
There was an extensive, reasonable, and multilateral justiication for such alterations, as signiicant changes have occurred in the political, legal, and economic areas of the Republic of Latvia since the introduction of both taxes in 1990, which very strongly affected the mechanism of applying and calculating the tax.
Starting from 1990, an agricultural reform, which included a land reform, was carried out, and
94.9 thousand farms and 156.6 thousand household plots were established anew until 1 January 1997. The
I. Vitola, D. Joma Immovable Property Tax in Latvia: Problematic Aspects and Possibilities for Improvement
Table 1
Immovable property tax rates in 1990
Value of taxable immovable property, LVL
Immovable property tax rate, LVL
1500-25000 0.5% of immovable property value (PV) of more than LVL 1500
25000-50000 LVL 117.5 + 1.5% of (PV) of more than LVL 25000
50000-250000 LVL 492.5 + 2.0% of (PV) of more than LVL 50000
250000-750000 LVL 4492.5 + 2.5% of (PV) of more than LVL 250000
750000-2500000 LVL 16992.5 + 3.5% of (PV) of more than LVL 750000
more than 2500000 LVL 78242.5 + 4.0% of (PV) of more than LVL 2500000 Source: Vitola I., Boruks A., 2006

Economic Science for Rural Development Nr. 28., 2012
ISSN 1691-3078
240
I. Vitola, D. Joma Immovable Property Tax in Latvia: Problematic Aspects and Possibilities for Improvement
numbers of specialised state farms, statutory farms, and other types of farms signiicantly changed.
An IPT was introduced in 1997 by integrating the former land tax and property tax. At the moment of imposing the IPT, only the land tax functioned in reality, since a theoretical justiication and a calculation methodology were well-developed for it. Whereas, the property tax, which was imposed on non-agricultural buildings and constructions, was not then elaborated – there was no justiication and no methodology. The law envisaged the completion of justiication and methodology before
31 December 2000. It means that the IPT did not have to be paid on buildings and constructions until
1 January 2001. Yet, the government wanted to collect as much revenues from this tax as before 1997. Therefore, the tax rate was raised from 1.0% to 1.5% obliging owners or users of land to pay it depending on the cadastral value of immovable property.
Signiicant amendments to the IPT were introduced in 1999, and they came into force on 1 January 2000, stipulating that:
1) the cadastral value of buildings and constructions
should be set before 31 December 2001;2) the tax should be imposed only on those buildings
and constructions that were used for economic activity. Besides, a book value calculated by IPT payers themselves, which was based on an inventory book value set after 1 January 1997 and taxed at a rate of 1.5%, had to be used before 31 December 2001 (Grozijumi likuma “Par…, 1999).
Therefore, the progressive tax rate was cancelled. In general, it has to be noted that these amendments were made based on a business concept, the purpose of which was to introduce lower tax rates for enterprises, thus, promoting the accumulation of private capital. Elements of social programmes were taken into account at a smaller extent.
The amendments of 22 November 2001 stipulated that:
1) before 31 December 2003, the IPT rate was set at 1.5% of the cadastral value of immovable property;
2) after 1 January 2004, it should be 1.0% of the cadastral value of immovable property as it was before;
3) for IPT taxpayers for the taxation period, the tax was calculated based on the previous cadastral value of
immovable property (Grozijumi likuma “Par…, 2000).The amendments passed in 2003 stipulated that
after 1 January 2004, the IPT rate should be 1.5% of the cadastral value of immovable property. The law also provided tax relief to IPT payers:1) the IPT rate should be reduced by 50% for politically
repressed individuals – on land, individual houses, and constructions owned or held by these individuals for at least ive years and not used in economic activity;
2) local governments might provide and should provide a IPT tax relief of 90%, 70%, 50%, or 25% to certain taxpayer categories (Grozijumi likuma “Par…, 2003).
In the period of 1998-2006, the taxable items were land, buildings, and constructions, while since 2007 – only land and buildings. During this period, the tax base of buildings and constructions was their inventory book value, while from 2007 – their cadastral value. Starting
from 1 January 2008, the tax rate was set at 1.0% of the cadastral value of immovable property, and an increase in the tax on immovable property with unchanged purpose of use might not rise more than 25% compared with the amount of tax calculated for the previous taxation year in 2008, 2009, and 2010 (Par nekustama
ipasuma…, 1997).Starting from 2010, the procedures for calculating
and paying the immovable property tax are regulated by the Law on Immovable Property Tax (1997) (version of 1 December 2009) as well as regulations of the Cabinet of Ministers based on this law.
Taxable itemsFor a long time, land and buildings were regarded as
taxable items, besides, there were several exemptions from the tax set out in the law, and several items were not taxed at all including buildings of individual houses unused in economic activity, residential multi-apartment houses or their parts, and shops of artists as well as auxiliary buildings of these houses.
In accordance with the amendments to the Law on Immovable Property Tax (2009) (hereinafter the Law), Section 1 stipulates that since 1 January 2010 individual and multi-apartment houses or their parts, the tax on which is calculated by applying the differentiated rate based on their cadastral value, are included in the list of taxable items. Buildings as well as constructions that are registered in the Cadastral Register but not yet put into service, become taxable items.
Taxable items of new engineering constructions are set according to the classiication of constructions accepted in corresponding legal acts. Based on the mentioned classiication, taxable items are also determined for buildings. There are several changes and supplements in the list of items exempt from the immovable property tax. These are engineering constructions – railroads, sport facilities, chimneys etc. – owned or legitimately held by state-owned or municipal enterprises and companies providing regulated public services.
The procedure for calculating the share of cadastral
value for real property tax needs set by the Cabinet Regulations No. 1625 is very important (Kartiba, kada aprekina…, 2010).
The Law on Immovable Property Tax (1997) retains tax relief for businessmen – buildings constructed or reconstructed for the purpose of economic activity are exempt from the immovable property tax for one taxation year, starting with the next month after putting a building into service.
Transitional provisions of the Law were supplemented with Paragraph 3 providing that the immovable property tax on buildings that are not owned or legitimately held by an individual is paid by their user. In this case, an individual who actually exploits a building (part of it) is regarded as a user of the building without drawing up documents (Likuma “Par nekustama…, 2006). Some changes were made regarding the procedure for paying taxes on state-owned or municipal land, buildings, and engineering constructions. As before, the tax is paid on the mentioned immovable property but if there is no owner, the IPT on buildings may be paid by their user (tenant).

241
Economic Science for Rural Development Nr. 28., 2012
ISSN 1691-3078
Taxable value and tax calculation Since 2010, the tax on immovable property has been
calculated and collected by municipalities. A cadastral value of immovable property is set by the State Land Service in accordance with the Immovable Property State Cadastre Law (Nekustama ipasuma valsts…, 2005).
The Law on Immovable Property Tax (1997) provides that the tax is calculated from the cadastral value of immovable property set on 1 January of the taxation year. If an immovable property is registered in the Cadastral Register during the taxation year, the tax will be calculated from the moment of its registration.
If a part of land unit or building (a group of premises) is taxed, and if different tax rates are applied to land units or parts of building, a proportion of the cadastral value of land unit or building in the total taxable area of land unit or building is used for tax calculation (Nekustama ipasuma valsts…, 2005; Kadastralas vertesanas noteikumi, 2006).
Tax ratesA lat and unchanged 1.5% IPT rate on land,
buildings, and constructions in Latvia existed from 2000 to 2007, and in 2008 and 2009, it was 1%. From 2010, land, buildings, and constructions are taxed again at a 1.5% rate (from cadastral values set by the State Land Service in 2007). A differentiated IPT rate is in force since
2010 – 0.1%, 0.2%, and 0.3% of the cadastral value but in 2011, the differentiated rate on houses doubled – 0.2%, 0.4%, and 0.6% respectively (Table 2).
In 2010, the immovable property tax on land in specially protected natural territories, except neutral zones and natural monuments, did not exceed the amount of tax set in 2009, respectively, 1% (Par nekustama ipasuma…, 1997).
If an immovable property contains several immovable property items, the immovable property tax rate is set individually for each item of immovable property. A part of building belonging to an apartment (a separate
I. Vitola, D. Joma Immovable Property Tax in Latvia: Problematic Aspects and Possibilities for Improvement
property together with the corresponding undivided part of the commonhold) is regarded as a separate taxable item.
Buildings and engineering constructions used in economic activity are taxed at a rate of 1.5% (instead of a 1% rate set earlier).
A minimum immovable property tax of LVL 5 on any taxable item (land and buildings) has been introduced since 2010. If the tax is set equal to LVL 5, a limitation on tax increases is not effective. If the tax set for poor and low-income individuals after granting a 90% tax relief is less than LVL 5, a municipality has the right not to send a tax notiication to the taxpayer. In this case, the tax is accrued until the moment when legislative amendments are made or the total sum of accrued taxes over several taxation years exceeds LVL 5, and then the municipality sends a joint tax notiication on the accrued tax for all the taxation years (Par nekustama ipasuma…, 1997).
In 2010, an additional tax rate of 1.5% was imposed on non-cultivated agricultural land, except a 25% limitation of tax increases regarding existent taxable items such as land, the area of which did not exceed one hectare or which was bound to limitations in agricultural activity in accordance with legal enactments. A 25% limitation of tax increases regarding non-cultivated agricultural land is not effective anymore (Par nekustama ipasuma…, 1997).
The authors believe that the enhancement of partially progressive IPT tax will only partially improve the present situation in the ield of this tax. Inequalities among IPT taxpayers and tax burdens will remain after passing these positive amendments. Granting tax relief to low income individuals and families is retained as a responsibility of municipalities. Poor individuals get a tax reduction of 90% and low income individuals also get a tax reduction of up to 90% from the assessed tax as long as taxpayers have a status of poor or low-income individuals. The amount of immovable property tax for politically repressed persons regarding land and buildings included
in individual residential house constructions, which have
Table 2
Immovable property tax rates in Latvia since 1 January 2010
Tax rate Taxable items
1.5% of cadastral value 1) land;2) non-cultivated agricultural land, except land, the area of which does not
exceed one hectare or which is bound to limitations in agricultural activity in accordance with legal enactments;
3) buildings and their parts (except single-family and double-family residential houses, multi-apartment houses (their parts) irrespective of whether or not they are divided into apartments, parts of non-residential buildings, the functional use of which is to be residential premises and which (parts of which) are not used for economic activity);
4) engineering constructions.
0.1% of cadastral value exceeding LVL 40 000 0.2% of the part of cadastral value within a range of LVL 40 000-75 000 0.3% of the part of cadastral value exceeding LVL 75 000
1) single-family and double-family residential houses, multi-apartment houses (their parts) irrespective of whether or not they are divided into apartments, parts of non-residential buildings, the functional use of which is to be residential premises and which (parts of which) are not used for economic activity;
2) shops of artists in multi-apartment houses that are regarded as a group of residential premises in terms of their functional use.
Source: authors’ construction based on Ivanova O., 2010; Law on Immovable Property Tax, 1997

Economic Science for Rural Development Nr. 28., 2012
ISSN 1691-3078
242
I. Vitola, D. Joma Immovable Property Tax in Latvia: Problematic Aspects and Possibilities for Improvement
been in the ownership or possession of such persons for not less than ive years, has to be reduced by 50%, if the immovable property is not utilised for economic activity. If the immovable property is partly utilised for economic activity, the tax reduction is not applied to this part of the immovable property. Local governments may grant a relief of 90%, 70%, 50%, or 25% of the tax on the immovable property for separate categories of taxpayers. There are and will be many cases of such tax reliefs granted in Jurmala where the market value of immovable property is very high and the tax actually cannot be paid at equal rates of immovable property tax.
Local governments may grant tax relief as de minimis
aid to those taxpayer categories, which are performers of economic activities pursuant to the Commission Regulation No. 1998/2006 on de minimis aid regarding
the conformity of the individual aid project to the Treaty. When designing the enhancement of IPT, construction amounts and changes in the cadastral value of land were mostly taken into consideration. Irrespective of the existent positive achievements, the work on enhancing the IPT continues. The authors believe that it is useful to grant a 30% immovable property tax relief for up to 5 years to those farms, which perform new drainage activities in accordance with a plan, but to those farms, which work on enhancing their existing system of drainage – for up to 3 years. It would contribute to the national economy in the future.
When making amendments to the Law on Immovable Property Tax (1997), an issue regarding setting the rates of immovable property tax according to various uses of it was not creatively discussed. These differences determine different abilities of immovable property to generate income and differences in capital liquidity. Revenues gained from immovable property used for private life, agriculture, and forestry with a very slow turnover of capital may not be compared with revenues from commerce, banking, various services, or entertainment and gambling. Each of these sectors features a different rate of proitability. For instance, sectors of agriculture and forestry feature a very slow turnover of capital. In forestry, there are speciic requirements of growing for every species of trees; it takes at least 30-40 years before a young forest stand produces income. It means that this period features only expenses. Imposing the IPT on such young forest stands forces forest owners to grow their forest stands not for wood-processing industry, i.e. saw timber but for pulpwood and energy wood that can be sold much sooner. Such a way of economic management might signiicantly affect the wood-processing industry in a distant future, while in the near future funds would be reduced for developing the national economy. In Bulgaria, agricultural and forestland is exempt from the IPT. In the Czech Republic, agricultural land is exempt from the tax for 5 years and forestland – for 25 years but the IPT
has to be paid on a purchase value: 25% on forests and 0.75% on agricultural land (Dzegulis Z., 2010).
In Latvia, the IPT has been partially progressive since 2010. Before, it was not taken into consideration that immovable property was used for various purposes, and the proitability and capital turnover and liquidity of immovable property were different and depended on uses of immovable property in a particular industry. After introducing the enhanced immovable property tax, this
problem was not actually discussed, and its solution was left to be decided by tax policy makers.
In the rest of the EU Member States, the tax rate is differentiated according to the purpose of use of
immovable property. The extent of differentiation may be quite different in each Member State. In Ireland, the IPT is not imposed on immovable property in which individuals live, but if they own other immovable properties, a 25% rate is imposed on their rental income. In Sweden, the IPT rate is differentiated based on real income; a 0.5% rate is set on forest land, 1.0% - on agricultural land, while construction land has a rate of 3.5%. The highest basic IPT rates are in Denmark – from 2% to 7.2%, in Hungary, too, buildings are taxed at a maximum rate per square metre, which is 3% of the market value a year. In the other EU Member States, the average basic IPT rate is, on average, less than 1.5% (The European Union ..., 2008).
The differentiation of immovable property tax rate based on the purpose of use of immovable property and the industry allows setting tax rates more accurately, taking into account the environmental, economic, and social effects and reducing the differentiation of
individuals according to their wealth as well as social tension.
Conclusions and recommendationsConclusions1. In 1990, when several taxes on land and property
were developed, their design authors Boruks A., Seile A., Biezais H. et al. actually made a compromise, taking into consideration interests of both the entire
society and individuals, and admitting the principle of moderate progressiveness as the most correct one. According to this principle, the immovable property tax rate was slightly progressive and ranged from 0.5% to 4.0%.
2. The moderate progressiveness of the tax best suits conditions if both economic development and social factors have to be taken into consideration.
3. In differentiating the rate of IPT on land, the principle of cadastral evaluation based on the cadastral
beneits of land is mostly used in the world; it means that the quality of land as well as the condition of trafic routes and economy is taken into account.
4. When designing the enhancement of IPT, construction amounts and changes in the cadastral value of land were mostly taken into consideration.
5. A lat and unchanged 1.5% IPT rate on land, buildings, and constructions in Latvia existed from 2000 to 2007; while in 2008 and 2009, it was 1%. Since 2010, land, buildings, and constructions have been taxed again at a 1.5% rate (from cadastral values set by the State Land Service in 2007). A differentiated IPT rate is in force from 2010 – 0.1%, 0.2%, and 0.3% of the cadastral value, but in 2011, the differentiated rate on houses doubled – 0.2%, 0.4%, and 0.6% respectively.
6. The enhancement of partially progressive IPT tax will only partially improve the present situation in the ield of this tax in the country. Inequalities among IPT taxpayers and tax burdens will remain after passing these positive amendments.
243
Economic Science for Rural Development Nr. 28., 2012
ISSN 1691-3078
7. Differences in industries determine different abilities of immovable property to generate income and differences in capital liquidity. Revenues gained from immovable properties used for private life, agriculture, and forestry with a very slow turnover of capital may not be compared with revenues from commerce, banking, various services, or entertainment and gambling.
8. Land productivity is still quite low in Latvia and lags behind that in neighbouring developed market economies approximately as many as two times.
Recommendations1. Irrespective of the existent positive achievements,
the work on enhancing the IPT has to be continued. The IPT rates have to be set progressively according
to the purpose of use of immovable property and the economic sector.
2. The differentiation of immovable property tax rates according to the purpose of use of immovable property and the industry has to be introduced to set
the immovable property tax rates correctly, taking into account the environmental, economic, and social effects and reducing the differentiation of individuals
according to their wealth as well as social tension.3. An untaxed minimum exempt from the IPT tax should
be set in Latvia. It might amount to, for instance, LVL 5000.
4. The IPT has to be revised every 5 years after its
imposition. Of course, the rates have to be designed in detail when working on the enhancement of the Law.
5. A further moderately progressive differentiation of IPT rates by industry (less progressive than it was in 1990) will protect immovable property owners from bankruptcy, increase the social protection and wellbeing of residents, and reduce social tension. Moderately progressive tax rates are the most appropriate for a situation if both economic development and social factors have to be taken into consideration.
6. The existing system of IPT tax relief has to be retained in Latvia for repressed individuals and municipality residents having a low pension on condition that they use their immovable property only for private needs and for religious, social, cultural, and educational purposes as well as direct municipality needs.
7. One of the main measures to raise the productivity of land is land reclamation. Therefore, the authors believe that it is useful to grant a 30% immovable property tax relief for up to 5 years to those farms, which perform new drainage activities in accordance with a plan, but to those farms, which work on enhancing their existent system of land
reclamation – for up to 3 years. It would contribute to the national economy in the future.
8. Considering the principle of social justice, the enhancement of IPT according to the purpose of use of immovable property and the industry has to be continued depending on the following purposes of use: family residential house, multi-apartment house, public institution, combined construction zone, and commercial activity; besides, a period of construction has to be considered as well.
Bibliography1. Boruks, A., Vitola,I. (2006). Viens uzvalks visiem
neder (One Suit does not Fit Everyone). Latvijas
Vestnesis. Plus. Nr. 30 (3398), 21. februaris.2. Dzegulis, Z. (2010). Ipasuma nodoklis apdraud
cilveku dzivi (Property Tax Threatens Human Life). Latvijas Avize, Nr. 139, 23. julijs.
3. Grozijumi likuma “Par nekustama ipasuma nodokli” (Amendments to the Law on Immovable Property
Tax): LR 1999. gada 25. novembra likums. Retrieved: http://www.likumi.lv/doc.php?id=14603. Access: 20 August 2011.
4. Grozijumi likuma “Par nekustama ipasuma nodokli” (Amendments to the Law on Immovable Property
Tax): LR 2000. gada 23. novembra likums. Retrieved: http://www.likumi.lv/doc.php?id=13481. Access: 20 August 2011.
5. Grozijumi likuma “Par nekustama ipasuma nodokli” (Amendments to the Law on Immovable Property
Tax): LR 2003. gada 20. junija likums. Retrieved: http://www.likumi.lv/doc.php?id=76865. Access: 20 August 2011.
6. Grozijumi likuma “Par nekustama ipasuma nodokli” (Amendments to the Law on Immovable Property
Tax): LR 2009. gada 1. decembra likums. Retrieved: http://www.likumi.lv/doc.php?id=202366. Access: 20 August 2011.
7. Ivanova, O. (2010). Nekustamie ipasumi – 2010. gada jaunumi (Immovable Property – News of
2010). Gramatvediba un ekonomika. Nr. 2 (106), 54.–64. lpp.
8. Latvijas Statistikas Gadagramata (Statistical
Yearbook) (2002). Riga: LR CSP, 11.-33. lpp. ISSN 1407-0626; ISBN 9984-06-167-1.
9. Latvijas Statistikas Gadagramata (Statistical
Yearbook) (2007). Riga: LR CSP, 11-108.lpp. ISSN 1407-0626-05-001-000; ISBN 978-9984-06-323-2.
10. Latvijas Statistikas Gadagramata (Statistical
Yearbook) (2009). Riga: LR CSP, 54-113.lpp. ISSN 1407-0626-08-001-000; ISBN 978-9984-06-367-6.
11. Latvijas Statistikas Gadagramata (Statistical
Yearbook) (2010). Riga: LR CSP, 51-112.lpp. ISBN 978-9984-06-399-7; ISSN 1407-0626.
12. Likuma “Par nekustama ipasuma nodokli” normu
piemerosanas kartiba: MK 2006. gada 20. junija noteikumi Nr. 495. Retrieved: http://www.likumi.lv/doc.php?id=138366. Access: 10 August 2011.
13. Kadastralas vertesanas noteikumi (Regulations
Regarding Cadastral Assessment): MK 2006. gada 18. aprila noteikumi. Retrieved: http://www.likumi.lv/doc.php?id=138366. Access: 10 August 2011.
14. Ketners, K., Titova, S. (2009). Nodoklu politika
Eiropas Savienibas vide (Tax Policy in the European
Union Environment). Riga: Banku augstskola, 128 lpp. ISBN 978-9984-9985-2-7.
15. Nekustama ipasuma nodokla likmes ES
(Immovable Property Tax Rates in the EU) (2006). Retrieved: http://www.lanida.lv/lv/information/press/archive/?id=682. Access: 15 August 2011.
16. Nekustama ipasuma valsts kadastra likums
(Immovable Property State Cadastre Law):
LR 2005. gada 1. decembra likums. Retrieved: http://www.likumi.lv/doc.php?id=124247. Access 11 August 2011.
I. Vitola, D. Joma Immovable Property Tax in Latvia: Problematic Aspects and Possibilities for Improvement

Economic Science for Rural Development Nr. 28., 2012
ISSN 1691-3078
244
17. Par ipasuma nodokli (Law on Property Tax):
LR 1990. gada 18. decembra likums. Retrieved: http://www.likumi.lv/doc.php?id=64873. Access: 15 August 2011.
18. Par nekustama ipasuma nodokli (Law on
Immovable Property Tax): LR 1997. gada 4. junija likums. Retrieved: http://www.likumi.lv/doc.php?id=43913&from=off. Access: 15 January 2012.
19. Par zemes nodokli (Law on Land Tax): LR 1990. gada 20. decembra likums. Retrieved: http://www.likumi.lv/doc.php?id=64972. Access: 15 August 2011.
20. Salmins, J. (2005). Tautsaimniecibas attistibas
problemas Latvija (Development Problems
of National Economy in Latvia). Nr. 4, R. 107.–115. lpp.
21. Skapars, R., Sumilo, E., Dunska, M. (2010). Nodoklu politikas tiesiskie un ekonomiskie aspekti
un to ietekme uz uznemejdarbibas vidi Latvija (Legal and Economic Aspects of Tax Policy and
their Effect on the Business Environment in
Latvia). Riga: LU Ekonomikas un vadibas fakultate. 17.-228. lpp. ISBN 978-9984-45-186-2.
22. The European Union Information Centre of Saeima (7 August 2008).
23. Vitola, I. (2010). Problematic Aspects of Value Added Tax and their Improvement Possibility in Latvia. Economics Science for Rural
Development: Proceedings of the International Scientiic Conference. Finance and Taxes, No. 21, Jelgava, pp. 183-190. ISSN 1691-3078; ISBN 978-9984-9997-5-3.
I. Vitola, D. Joma Immovable Property Tax in Latvia: Problematic Aspects and Possibilities for Improvement

245
Economic Science for Rural Development Nr. 28., 2012
ISSN 1691-3078

Economic Science for Rural Development Nr. 28., 2012
ISSN 1691-3078
246
ECONOMIC SCIENCE FOR RURAL DEVELOPMENT Nr. 28Editor – in-chief Andra Zvirbule-Berzina
Printed and bound in Drukatava Ltd.Liliju street 95/1, Marupe,
Latvia