economic update and portfolio strategy review
TRANSCRIPT

Economic Update and Portfolio Strategy Review
June 2021

2Public Trust Advisors 2021 ©
Gross Domestic Product
Source: Bloomberg, bea.gov
o The increase in PCE reflected increases in durable goods (led by motor vehicles and parts), nondurable goods (led by food and beverages)
and services (led by food services and accommodations).
o The increase in nonresidential fixed investment reflected increases in equipment (led by information processing equipment) and intellectual
property products (led by software).
o The increase in federal government spending primarily reflected an increase in payments made to banks for processing and administering the
Paycheck Protection Program loan applications as well as purchases of COVID-19 vaccines for distribution to the public.
o The decrease in private inventory investment primarily reflected a decrease in retail trade inventories.

3Public Trust Advisors 2021 ©
The Labor Market
Source: Bloomberg
Nonfarm Payrolls
o Nonfarm payrolls growth in June was better than expected
with 850k jobs created (720k expected). More than 1.7mm
jobs were created in the second quarter.
o The debate continues regarding enhanced unemployment
benefits and the impact on new job creation. By early June, 25
states have notified workers of a plan to exit from enhanced
federal benefits earlier than the September 6th expiration.
Unemployment Rate
o The national unemployment rate decreased to 5.9% in June.
o Florida unemployment was 4.9% at the end of May.
o The labor force participation rate of 61.6% in June continues to
highlight underlying factors that the percentage of the working
age population remains near the lowest levels in four decades.
Mar-20(1,683)
Apr-20(20,679)
Jun-204,846 Jun-21
850
(25,000)
(20,000)
(15,000)
(10,000)
(5,000)
0
5,000
10,000
May 17 May 18 May 19 May 20 May 21
Mo
nth
ly J
ob
s (0
00
s)
Non-Farm Payrolls(In Thousands)
Apr-2014.80%
May-215.80%
May-2014.20%
May-214.90%
0.00%
2.00%
4.00%
6.00%
8.00%
10.00%
12.00%
14.00%
16.00%
May-17 May-18 May-19 May-20 May-21
Unemployment Rate
National Florida
4Public Trust Advisors 2021 ©
ISM and the Federal Reserve Balance Sheet
Source: Bloomberg
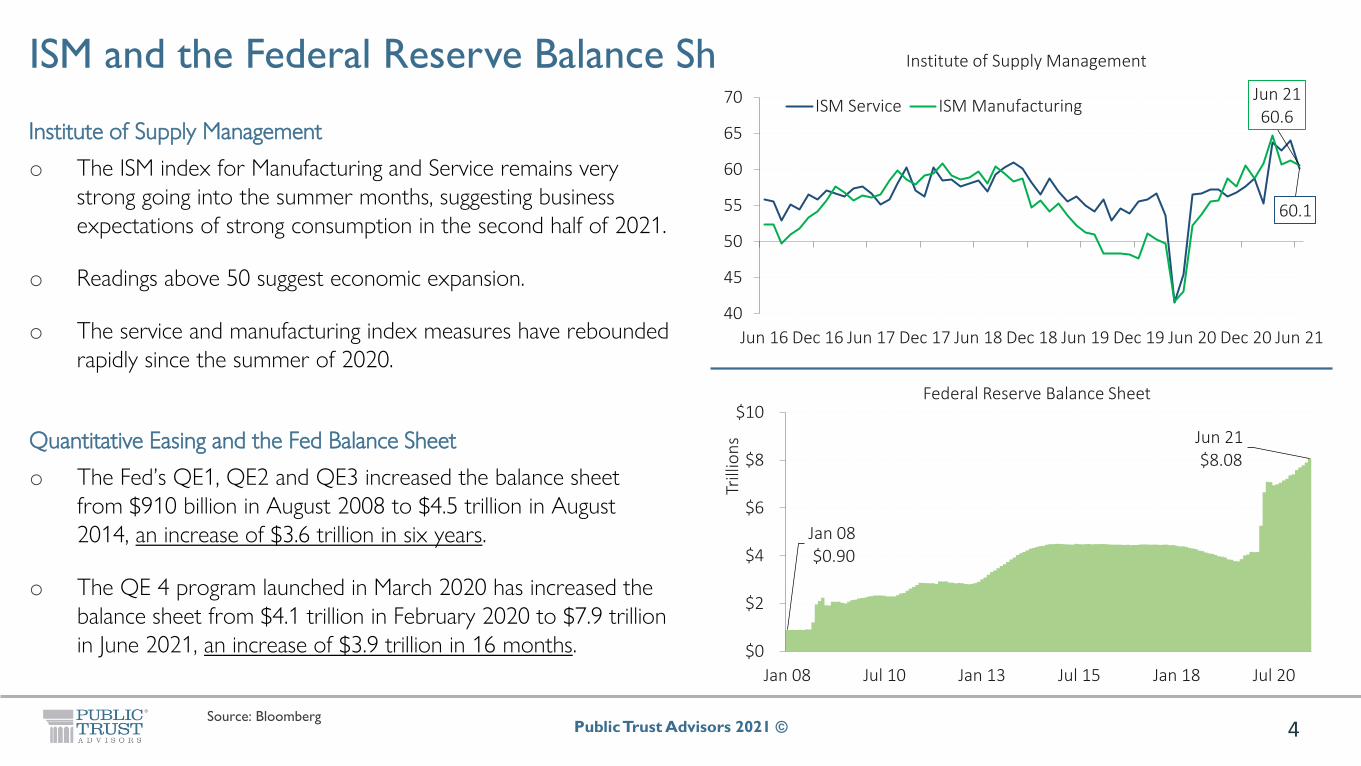
Institute of Supply Management
o The ISM index for Manufacturing and Service remains very
strong going into the summer months, suggesting business
expectations of strong consumption in the second half of 2021.
o Readings above 50 suggest economic expansion.
o The service and manufacturing index measures have rebounded
rapidly since the summer of 2020.
Quantitative Easing and the Fed Balance Sheet
o The Fed’s QE1, QE2 and QE3 increased the balance sheet
from $910 billion in August 2008 to $4.5 trillion in August
2014, an increase of $3.6 trillion in six years.
o The QE 4 program launched in March 2020 has increased the
balance sheet from $4.1 trillion in February 2020 to $7.9 trillion
in June 2021, an increase of $3.9 trillion in 16 months.
60.1
Jun 2160.6
40
45
50
55
60
65
70
Jun 16 Dec 16 Jun 17 Dec 17 Jun 18 Dec 18 Jun 19 Dec 19 Jun 20 Dec 20 Jun 21
Institute of Supply Management
ISM Service ISM Manufacturing
Jan 08$0.90
Jun 21$8.08
$0
$2
$4
$6
$8
$10
Jan 08 Jul 10 Jan 13 Jul 15 Jan 18 Jul 20
Trill
ion
s
Federal Reserve Balance Sheet

5Public Trust Advisors 2021 ©
Bloomberg Forecast – June 2021 Survey
Source: Bloomberg
o GDP growth is expected to remain strong (median 6.6%) based on recent surveys with estimates as high as 8.0% for 2021.
Consumer spending and Private Investment sectors are projected to grow at significant levels during the year.
o The stimulus and other legislation is expected to have a short term impact with GDP growth returning to sub 3% levels by 2023.

6Public Trust Advisors 2021 ©
FOMC Dot Plot – Overnight Rates Remain Near Zero
Source: Bloomberg
o Additional FOMC members anticipate a rate hike in 2022 following June 2021 meeting

7Public Trust Advisors 2021 ©
Yield Curve Steepens on Inflation Expectations
Source: Bloomberg
o Federal Reserve policies and historic levels of cash are keeping short term rates anchored at or very close to 0.0% yields.
0.05%
0.16%
0.22%
0.78%
0.78%
443621.49%
1.32%
(0.25%)
0.00%
0.25%
0.50%
0.75%
1.00%
1.25%
1.50%
1.75%
2.00%
Jan 21 Feb 21 Mar 21 Apr 21 May 21 Jun 21 Jul 21
Yiel
d
U.S. Treasury Yield ComparisonFF/3M/2YR
3M UST 2Yr UST 5Yr UST 10Yr UST Fed Funds

8Public Trust Advisors 2021 ©
0.06% 0.06%0.10% 0.12%
0.17%
0.36%
0.05% 0.05%0.06%
0.22%
0.40%
0.78%
0.00%
0.25%
0.50%
0.75%
1.00%
3M 6M 12M 2Y 3Y 5Y
Yiel
d
U.S. Treasury Yield Comparison
Change 1/1/2021 7/7/2021
Yield Curve Steepens on Inflation Expectations
Source: Bloomberg
o Inflation expectations have resulted in a steeper yield curve in maturities between 2 and 5 years.

9Public Trust Advisors 2021 ©
Strong Demand and Lack of Supply Compressing GSE/Corporate Yields
Source: Bloomberg
o Corporate Yield spreads to U.S. Treasuries are at or near historically low levels
o US Agencies (GSE) yields are trading below U.S. Treasuries
10Public Trust Advisors 2021 ©
DISCLOSURES This presentation is for informational purposes only. The information contained herein has been obtained from sources that we believe to be reliable, but its accuracy and
completeness are not guaranteed. The materials in the attached are opinions of Public Trust Advisors, LLC and should not be construed as investment advice. Many factors
affect performance including changes in market conditions and interest rates and in response to other economic, political, or financial developments. Performance
comparisons will be affected by changes in interest rates. Investing involves risk including the possible loss of principal. The presentation is not a recommendation to buy,
sell, implement, or change any securities or investment strategy, function, or process. Any financial and/or investment decision should be made only after considerable
research, consideration, and involvement with an experienced professional engaged for the specific purpose. All comments and discussion presented are purely based on
opinion and assumptions, not fact. These assumptions may or may not be correct based on foreseen and unforeseen events. All calculations and results presented and are
for discussion purposes only and should not be used for making and calculations and/or decisions. Past performance is not an indication of future performance. Any financial
and/or investment decision may incur losses.
The investment advisor providing these services is Public Trust Advisors, LLC, an investment adviser registered with the U.S. Securities and Exchange Commission (SEC)
under the Investment Advisers Act of 1940, as amended. Registration with the SEC does not imply a certain level of skill or training. Public Trust is required to maintain a
written disclosure brochure of our background and business experience. If you would like to receive a copy of our current disclosure brochure, privacy policy, or code of
ethics please contact us.
There is no guarantee that investment strategies will achieve the desired results under all market conditions, and each investor should evaluate its ability to invest long-term,
especially during periods of a market downturn. This information may contain statements, estimates, or projections that constitute “forward-looking statements” as defined
under U.S. federal and other jurisdictions’ securities laws. Any such forward looking statements are inherently speculative and are based on currently available information,
operating plans, and projections about future events and trends. As such, they are subject to numerous risks and uncertainties.
Public Trust Advisors
717 17th Street, Suite 1850
Denver, Colorado 80202

04/01/2021 to 06/30/2021
City of Cape Coral LT 1-3Investment Report

John Grady | Managing DirectorDirect: (407) 588-0525Mobile: (407) [email protected]
Neil Waud, CFA | Chief Investment OfficerDirect: (303) 244-0468Mobile: (720) [email protected]
Tom Tight | Managing DirectorDirect: (407) 588-9391Mobile: (407) [email protected]
Cory Gebel, CFA | Director, Portfolio ManagementDirect: (720) [email protected]
Relationship Managers Portfolio Manager
Relationship Management Team
Table of Contents
Executive Summary• Portfolio Overview 3• Maturity Distribution 4• Rating Distribution 5• Security Distribution – Market Value 6• Security Distribution – Historical Cost 7
Supporting Reports• Portfolio Holdings 8• Transactions 14• Income 16• GASB 40 20• Portfolio Activity Summary 26
Disclaimers

Public Trust Advisors 3
04/01/2021 to 06/30/2021
City of Cape Coral LT 1-3
Portfolio Overview
03/31/21 06/30/21
Duration 1.879 1.818
Years to Effective Maturity 1.894 1.831
Years to Final Maturity 1.896 1.833
Coupon Rate 0.816 0.713
Book Yield 0.484 0.415
Market Yield 0.187 0.241
Benchmark Yield 0.203 0.265
Portfolio Summary
Asset Allocation
Portfolio Characteristics
Summary 03/31/21 06/30/21
Historical Cost $140,505,206.72 $140,826,303.97
Book Value 140,149,025.36 140,414,833.77
Accrued Interest 213,060.52 222,079.07
Net Pending Transactions 3.49 0.81
Book Value Plus Accrued $140,362,089.37 $140,636,913.65
Net Unrealized Gain/Loss 561,758.54 256,324.85
Market Value Plus Accrued $140,923,847.91 $140,893,238.50
Period Income Income
Interest Income $262,611.21
Net Amortization/Accretion Income (104,289.59)
Net Realized Gain/Loss 116,502.66
Net Income $274,824.28
Income Summary
Detail may not add to total due to rounding.
Executive Summary

Public Trust Advisors 4
04/01/2021 to 06/30/2021
City of Cape Coral LT 1-3
Maturity Distribution by Security Type
Portfolio Overview
Issuer Value
United States 52.49%
Federal Home Loan Banks 16.47%
Federal Home Loan Mortgage Corporation 12.61%
Farm Credit System 12.11%
Federal National Mortgage Association 2.61%
Amazon.com, Inc. 1.34%
PepsiCo, Inc. 0.95%
Apple Inc. 0.66%
Exxon Mobil Corporation 0.58%
U.S. Bancorp 0.18%
Top Ten Holdings Maturity Distribution by Type
Security Distribution 0-3 Months 3-6 Months 6-9 Months 9-12 Months 1-2 Years 2-3 Years 3-4 Years 4-5 Years 5+ Years Portfolio Total
CASH $0.81 -- -- -- -- -- -- -- -- $0.81
CORP 1,744,346.78 3,229,987.74 4,974,334.52
FED INST (GSE) 113,361.89 13,644,544.97 35,330,976.07 12,617,792.69 61,706,675.63
MMFUND 254,947.48 254,947.48
US GOV 1,020,213.74 35,794,678.65 37,142,387.68 73,957,280.07
TOTAL $254,948.29 $113,361.89 -- $14,664,758.71 $72,870,001.50 $52,990,168.11 -- -- -- $140,893,238.50
• Maturity Distribution

Public Trust Advisors 5
04/01/2021 to 06/30/2021
City of Cape Coral LT 1-3
Portfolio Overview
S&P Rating Distribution Moody’s Rating Distribution
Allocation by Standard and Poor’s Rating Allocation by Moody’s Rating
S&P Rating Distribution Jun 30, 2021Ending Balance
PortfolioAllocation
Short Term Rating Distribution
A-1+ $0.00 0.00%
A-1
A-2
Total Short Term Ratings $0.00 0.00%
Long Term Rating Distribution
AAA $254,948.29 0.18%
AA $139,300,919.52 98.87%
A $1,337,370.70 0.95%
Below A
Not Rated
Total Long Term Ratings $140,893,238.50 100.00%
Portfolio Total $140,893,238.50 100.00%
Moody's Rating Distribution Jun 30, 2021Ending Balance
PortfolioAllocation
Short Term Rating Distribution
P-1 $0.00 0.00%
P-2
Total Short Term Ratings $0.00 0.00%
Long Term Rating Distribution
Aaa $135,918,903.99 96.47%
Aa $1,744,346.78 1.24%
A $3,229,987.74 2.29%
Below A
Not Rated
Total Long Term Ratings $140,893,238.50 100.00%
Portfolio Total $140,893,238.50 100.00%
• Rating Distribution

Public Trust Advisors 6
04/01/2021 to 06/30/2021
City of Cape Coral LT 1-3
Market Value Basis Security Distribution
Asset Balance by Security Type
Security Distribution Mar 31, 2021Ending Balance
Mar 31, 2021Portfolio Allocation
Jun 30, 2021Ending Balance
Jun 30, 2021Portfolio Allocation
Change inAllocation Book Yield
Cash $3.49 0.00% $0.81 0.00% (0.00%) 0.00%
U.S. Treasury Notes $69,909,213.65 49.61% $73,957,280.07 52.49% 2.88% 0.34%
Federal Instrumentality (GSE) 67,710,966.78 48.05% 61,706,675.63 43.80% (4.25%) 0.48%
Money Market Funds $215,059.32 0.15% $254,947.48 0.18% 0.03% 0.01%
Corporate Notes 3,088,604.68 2.19% 4,974,334.52 3.53% 1.34% 0.77%
Portfolio Total $140,923,847.91 100.00% $140,893,238.50 100.00% 0.42%
Portfolio Overview
• Security Distribution – Market Value

Public Trust Advisors 7
04/01/2021 to 06/30/2021
City of Cape Coral LT 1-3
Historic Cost Basis Security Distribution
Asset Balance by Security Type
Portfolio Overview
Security Distribution Mar 31, 2021Ending Balance
Mar 31, 2021Portfolio Allocation
Jun 30, 2021Ending Balance
Jun 30, 2021Portfolio Allocation
Change inAllocation Book Yield
Cash $3.49 0.00% $0.81 0.00% (0.00%) 0.00%
U.S. Treasury Notes $69,694,508.87 49.60% $73,908,345.77 52.48% 2.88% 0.34%
Federal Instrumentality (GSE) 67,548,888.28 48.08% 61,724,027.16 43.83% (4.25%) 0.48%
Money Market Funds $215,059.32 0.15% $254,947.48 0.18% 0.03% 0.01%
Corporate Notes 3,046,750.25 2.17% 4,938,983.55 3.51% 1.34% 0.77%
Portfolio Total $140,505,210.21 100.00% $140,826,304.78 100.00% 0.42%
• Security Distribution – Historical Cost

Public Trust Advisors 8
04/01/2021 to 06/30/2021
City of Cape Coral LT 1-3
DescriptionIdentifierCoupon
Effective MaturityFinal MaturityDuration
Trade DateSettle Date
Par Value Original CostBook Value
Market ValueMarket Price
MV + AccruedAccrued Balance
Net Unrealized Gain/Loss
% of Market Value
CallableNext Call Date
Book YieldYTMYTC
S&PMoody's
CASH 0.00%
ReceivableCCYUSD0.00%
06/30/2106/30/210.00
----
0.81$0.81$0.81
$0.811.00
$0.81$0.00
$0.00 0.00%N--
0.00%----
AAAAaa
CASH TOTAL06/30/2106/30/210.00
----
0.81$0.81$0.81
$0.811.00
$0.81$0.00
$0.00 0.00%N--
0.00%----
AAAAaa
MMFUND 0.00%
FIRST AMER:TRS OBG Y31846V8070.01%
06/30/2106/30/210.00
----
254,947.48$254,947.48$254,947.48
$254,947.481.00
$254,947.48$0.00
($0.00) 0.18%N--
0.01%----
AAAmAaa
MMFUND TOTAL06/30/2106/30/210.00
----
254,947.48$254,947.48$254,947.48
$254,947.481.00
$254,947.48$0.00
($0.00) 0.18%N--
0.01%----
AAAmAaa
US GOV 0.00%
UNITED STATES TREASURY912828XG02.12%
06/30/2206/30/220.99
11/25/1911/26/19
1,000,000.00$1,013,242.19$1,005,156.33
$1,020,156.00102.02
$1,020,213.74$57.74
$14,999.67 0.72%N--
1.60%0.11%
--
AA+Aaa
UNITED STATES TREASURY91282CAC50.12%
07/31/2207/31/221.08
03/29/2103/30/21
2,200,000.002,200,859.382,200,694.71
2,200,343.20100.02
2,201,490.301,147.10
(351.51) 1.56%N--
0.10%0.11%
--
AA+Aaa
UNITED STATES TREASURY912828YA21.50%
08/15/2208/15/221.12
12/30/1912/31/19
1,000,000.00997,304.69998,834.54
1,015,586.00101.56
1,021,221.365,635.36
16,751.46 0.72%N--
1.61%0.12%
--
AA+Aaa
UNITED STATES TREASURY912828TJ91.62%
08/15/2208/15/221.11
01/17/2001/21/20
1,100,000.001,101,933.591,100,857.58
1,118,734.10101.70
1,125,449.576,715.47
17,876.52 0.80%N--
1.55%0.11%
--
AA+Aaa
UNITED STATES TREASURY9128282S81.62%
08/31/2208/31/221.16
09/27/1909/30/19
3,000,000.003,002,578.143,001,049.49
3,052,500.00101.75
3,068,794.1616,294.16
51,450.51 2.18%N--
1.59%0.13%
--
AA+Aaa
UNITED STATES TREASURY91282CAN10.12%
09/30/2209/30/221.25
03/03/2103/05/21
4,000,000.003,999,687.523,999,751.75
3,999,220.0099.98
4,000,476.831,256.83
(531.75) 2.84%N--
0.13%0.14%
--
AA+Aaa
UNITED STATES TREASURY91282CBD20.12%
12/31/2212/31/221.50
03/03/2103/05/21
2,700,000.002,699,261.722,699,393.67
2,697,575.4099.91
2,697,584.579.17
(1,818.27) 1.91%N--
0.14%0.18%
--
AA+Aaa
UNITED STATES TREASURY9128283U22.38%
01/31/2301/31/231.55
12/16/1912/17/19
1,350,000.001,378,898.441,364,841.33
1,396,616.85103.45
1,409,990.9913,374.14
31,775.52 1.00%N--
1.67%0.19%
--
AA+Aaa
Portfolio Holdings
Supporting Reports

Public Trust Advisors 9
04/01/2021 to 06/30/2021
City of Cape Coral LT 1-3
DescriptionIdentifierCoupon
Effective MaturityFinal MaturityDuration
Trade DateSettle Date
Par Value Original CostBook Value
Market ValueMarket Price
MV + AccruedAccrued Balance
Net Unrealized Gain/Loss
% of Market Value
CallableNext Call Date
Book YieldYTMYTC
S&PMoody's
UNITED STATES TREASURY91282CBG50.12%
01/31/2301/31/231.58
05/06/2105/10/21
2,750,000.002,749,248.042,749,310.62
2,747,313.2599.90
2,748,747.121,433.87
(1,997.37) 1.95%N--
0.14%0.19%
--
AA+Aaa
UNITED STATES TREASURY91282CBN00.12%
02/28/2302/28/231.66
03/03/2103/05/21
4,000,000.003,998,906.253,999,082.63
3,995,000.0099.88
3,996,671.201,671.20
(4,082.63) 2.84%N--
0.14%0.20%
--
AA+Aaa
UNITED STATES TREASURY912828ZD50.50%
03/15/2303/15/231.70
03/29/2103/30/21
4,000,000.004,027,812.524,024,229.05
4,020,156.00100.50
4,026,025.575,869.57
(4,073.05) 2.86%N--
0.14%0.20%
--
AA+Aaa
UNITED STATES TREASURY912828ZH60.25%
04/15/2304/15/231.79
11/13/2011/16/20
2,500,000.002,503,515.632,502,610.01
2,501,270.00100.05
2,502,584.891,314.89
(1,340.01) 1.78%N--
0.19%0.22%
--
AA+Aaa
UNITED STATES TREASURY912828ZP80.12%
05/15/2305/15/231.87
02/24/2102/25/21
3,000,000.002,998,476.562,998,713.99
2,994,258.0099.81
2,994,736.94478.94
(4,455.99) 2.13%N--
0.15%0.23%
--
AA+Aaa
UNITED STATES TREASURY912828ZU70.25%
06/15/2306/15/231.95
03/03/2103/05/21
4,000,000.004,005,781.254,004,961.89
4,000,468.00100.01
4,000,905.16437.16
(4,493.89) 2.84%N--
0.19%0.24%
--
AA+Aaa
UNITED STATES TREASURY912828ZY90.12%
07/15/2307/15/232.04
03/03/2103/05/21
4,000,000.003,993,125.003,994,071.03
3,989,376.0099.73
3,991,682.632,306.63
(4,695.03) 2.83%N--
0.20%0.26%
--
AA+Aaa
UNITED STATES TREASURY91282CAF80.12%
08/15/2308/15/232.12
02/24/2102/25/21
7,500,000.007,490,625.007,491,942.58
7,476,855.0099.69
7,480,377.103,522.10
(15,087.58) 5.31%N--
0.18%0.27%
--
AA+Aaa
UNITED STATES TREASURY91282CAK70.12%
09/15/2309/15/232.20
03/29/2103/30/21
2,000,000.001,995,546.881,996,003.53
1,992,578.0099.63
1,993,311.70733.70
(3,425.53) 1.41%N--
0.22%0.29%
--
AA+Aaa
UNITED STATES TREASURY91282CAP60.12%
10/15/2310/15/232.29
11/09/2011/10/20
425,000.00423,555.66423,869.97
423,157.2099.57
423,268.97111.77
(712.77) 0.30%N--
0.24%0.31%
--
AA+Aaa
UNITED STATES TREASURY91282CBA80.12%
12/15/2312/15/232.45
03/03/2103/05/21
2,100,000.002,092,042.972,092,967.36
2,089,008.6099.48
2,089,123.35114.75
(3,958.76) 1.48%N--
0.26%0.34%
--
AA+Aaa
UNITED STATES TREASURY91282CBE00.12%
01/15/2401/15/242.53
05/06/2105/10/21
3,125,000.003,113,769.533,114,369.22
3,106,078.1299.39
3,107,880.181,802.05
(8,291.10) 2.21%N--
0.26%0.36%
--
AA+Aaa
UNITED STATES TREASURY91282CBM20.12%
02/15/2402/15/242.62
02/18/2102/19/21
4,000,000.003,990,781.253,991,903.08
3,974,064.0099.35
3,975,942.451,878.45
(17,839.08) 2.82%N--
0.20%0.37%
--
AA+Aaa
Portfolio Holdings
Supporting Reports

Public Trust Advisors 10
04/01/2021 to 06/30/2021
City of Cape Coral LT 1-3
DescriptionIdentifierCoupon
Effective MaturityFinal MaturityDuration
Trade DateSettle Date
Par Value Original CostBook Value
Market ValueMarket Price
MV + AccruedAccrued Balance
Net Unrealized Gain/Loss
% of Market Value
CallableNext Call Date
Book YieldYTMYTC
S&PMoody's
UNITED STATES TREASURY912828W712.12%
03/31/2403/31/242.67
02/24/2102/25/21
5,000,000.005,288,281.255,256,259.71
5,234,570.00104.69
5,261,277.6526,707.65
(21,689.71) 3.73%N--
0.25%0.41%
--
AA+Aaa
UNITED STATES TREASURY91282CBV20.38%
04/15/2404/15/242.77
05/06/2105/10/21
3,125,000.003,130,859.383,130,576.67
3,121,093.7599.88
3,123,559.172,465.42
(9,482.92) 2.22%N--
0.31%0.42%
--
AA+Aaa
UNITED STATES TREASURY91282CCC30.25%
05/15/2405/15/242.86
06/03/2106/07/21
5,725,000.005,712,252.935,712,534.87
5,694,136.5299.46
5,695,964.481,827.96
(18,398.34) 4.04%N--
0.33%0.44%
--
AA+Aaa
US GOV TOTAL07/06/2307/06/232.00
----
73,600,000.00$73,908,345.77$73,853,985.60
$73,860,114.00100.38
$73,957,280.07$97,166.07
$6,128.40 52.49%N--
0.34%0.27%
--
AA+Aaa
GSE 0.00%
FEDERAL FARM CREDIT BANKS FUNDING CORP3133ELJC91.58%
04/21/2204/21/220.80
04/21/2004/22/20
3,000,000.00$3,074,400.00$3,030,081.20
$3,035,171.04101.17
$3,044,387.71$9,216.67
$5,089.84 2.16%N--
0.33%0.13%
--
AA+Aaa
FEDERAL HOME LOAN BANKS3130AJPU70.25%
06/03/2206/03/220.92
06/15/2006/16/20
6,000,000.005,998,140.005,999,124.13
6,007,930.74100.13
6,009,097.411,166.67
8,806.61 4.27%N--
0.27%0.11%
--
AA+Aaa
FEDERAL HOME LOAN MORTGAGE CORP3134GVJ660.25%
06/08/2206/08/220.94
06/11/2006/12/20
2,750,000.002,749,340.002,749,688.62
2,753,980.98100.14
2,754,420.22439.24
4,292.37 1.95%N--
0.26%0.10%
--
AA+Aaa
FEDERAL HOME LOAN BANKS313379Q692.12%
06/10/2206/10/220.94
05/11/2005/12/20
1,800,000.001,870,092.001,831,842.38
1,834,408.39101.91
1,836,639.642,231.25
2,566.00 1.30%N--
0.24%0.10%
--
AA+Aaa
FEDERAL HOME LOAN MORTGAGE CORP3137EAET20.12%
07/25/2207/25/221.07
07/21/2007/23/20
1,675,000.001,671,214.501,672,985.17
1,675,373.44100.02
1,676,280.73907.29
2,388.27 1.19%N--
0.24%0.10%
--
AA+Aaa
FEDERAL HOME LOAN BANKS313380GJ02.00%
09/09/2209/09/221.18
09/09/1909/12/19
1,750,000.001,771,700.001,758,752.42
1,789,374.79102.25
1,800,263.6810,888.89
30,622.37 1.28%N--
1.57%0.11%
--
AA+Aaa
FEDERAL FARM CREDIT BANKS FUNDING CORP3133EHM912.08%
11/01/2211/01/221.32
03/30/2003/31/20
1,400,000.001,458,660.001,430,379.50
1,436,197.99102.59
1,441,051.334,853.33
5,818.49 1.02%N--
0.45%0.14%
--
AA+Aaa
Portfolio Holdings
Supporting Reports

Public Trust Advisors 11
04/01/2021 to 06/30/2021
City of Cape Coral LT 1-3
DescriptionIdentifierCoupon
Effective MaturityFinal MaturityDuration
Trade DateSettle Date
Par Value Original CostBook Value
Market ValueMarket Price
MV + AccruedAccrued Balance
Net Unrealized Gain/Loss
% of Market Value
CallableNext Call Date
Book YieldYTMYTC
S&PMoody's
FEDERAL FARM CREDIT BANKS FUNDING CORP3133EMGX40.12%
11/23/2211/23/221.39
11/16/2011/23/20
3,000,000.002,994,270.002,996,003.59
2,997,311.6199.91
2,997,707.44395.83
1,308.02 2.13%N--
0.22%0.19%
--
AA+Aaa
FEDERAL HOME LOAN BANKS313381BR51.88%
12/09/2212/09/221.43
----
7,200,000.007,465,214.007,351,080.78
7,375,545.79102.44
7,383,795.798,250.00
24,465.01 5.24%N--
0.41%0.18%
--
AA+Aaa
FEDERAL HOME LOAN BANKS3130AJ7E31.38%
02/17/2302/17/231.61
04/21/2004/23/20
4,000,000.004,110,840.004,064,282.19
4,076,563.68101.91
4,097,035.9020,472.22
12,281.49 2.91%N--
0.38%0.20%
--
AA+Aaa
FEDERAL FARM CREDIT BANKS FUNDING CORP3133ELNW01.45%
02/21/2302/21/231.62
02/14/2002/21/20
2,000,000.002,000,180.002,000,099.40
2,041,210.30102.06
2,051,682.5210,472.22
41,110.90 1.46%N--
1.45%0.19%
--
AA+Aaa
FEDERAL FARM CREDIT BANKS FUNDING CORP3133EJFK02.65%
03/08/2303/08/231.65
03/30/2003/31/20
2,500,000.002,657,600.002,590,847.77
2,603,017.95104.12
2,623,813.0920,795.14
12,170.18 1.86%N--
0.48%0.20%
--
AA+Aaa
FEDERAL HOME LOAN BANKS313382AX12.12%
03/10/2303/10/231.66
02/14/2002/18/20
2,000,000.002,040,460.002,022,595.70
2,062,809.46103.14
2,075,913.6313,104.17
40,213.76 1.47%N--
1.45%0.27%
--
AA+Aaa
FEDERAL HOME LOAN MORTGAGE CORP3137EAEQ80.38%
04/20/2304/20/231.80
04/21/2004/22/20
3,500,000.003,494,050.003,496,407.96
3,507,828.10100.22
3,510,416.642,588.54
11,420.14 2.49%N--
0.43%0.25%
--
AA+Aaa
FEDERAL NATIONAL MORTGAGE ASSOCIATION3135G04Q30.25%
05/22/2305/22/231.89
06/02/2006/03/20
1,000,000.00998,017.00998,734.91
999,894.9799.99
1,000,165.80270.83
1,160.06 0.71%N--
0.32%0.26%
--
AA+Aaa
FEDERAL HOME LOAN MORTGAGE CORP3137EAES40.25%
06/26/2306/26/231.98
06/24/2006/26/20
3,645,000.003,634,356.603,637,940.50
3,644,514.4999.99
3,644,641.05126.56
6,573.99 2.59%N--
0.35%0.26%
--
AA+Aaa
FEDERAL NATIONAL MORTGAGE ASSOCIATION3135G05G40.25%
07/10/2307/10/232.02
07/08/2007/10/20
1,390,000.001,387,011.501,387,979.76
1,389,842.0799.99
1,391,492.691,650.62
1,862.31 0.99%N--
0.32%0.26%
--
AA+Aaa
FEDERAL FARM CREDIT BANKS FUNDING CORP3133EMBS00.20%
10/02/2310/02/232.25
10/01/2010/02/20
2,250,000.002,247,120.002,247,834.18
2,243,561.6999.71
2,244,674.191,112.50
(4,272.49) 1.59%N--
0.24%0.33%
--
AA+Aaa
Portfolio Holdings
Supporting Reports

Public Trust Advisors 12
04/01/2021 to 06/30/2021
City of Cape Coral LT 1-3
DescriptionIdentifierCoupon
Effective MaturityFinal MaturityDuration
Trade DateSettle Date
Par Value Original CostBook Value
Market ValueMarket Price
MV + AccruedAccrued Balance
Net Unrealized Gain/Loss
% of Market Value
CallableNext Call Date
Book YieldYTMYTC
S&PMoody's
FEDERAL HOME LOAN MORTGAGE CORP3137EAEZ80.25%
11/06/2311/06/232.34
----
5,100,000.005,095,570.005,096,520.21
5,094,502.6199.89
5,096,450.521,947.92
(2,017.60) 3.62%N--
0.28%0.30%
--
AA+Aaa
FEDERAL NATIONAL MORTGAGE ASSOCIATION3135G06H10.25%
11/27/2311/27/232.40
11/23/2011/25/20
1,235,000.001,233,592.101,233,872.53
1,232,676.4399.81
1,232,968.03291.60
(1,196.10) 0.88%N--
0.29%0.33%
--
AA+Aaa
FEDERAL FARM CREDIT BANKS FUNDING CORP3133EMRZ70.25%
02/26/2402/26/242.64
02/22/2102/26/21
2,660,000.002,659,042.402,659,152.26
2,649,898.2299.62
2,652,207.252,309.03
(9,254.04) 1.88%N--
0.26%0.39%
--
AA+Aaa
GSE TOTAL02/02/2302/02/231.58
----
59,855,000.00$60,610,870.10$60,256,205.14
$60,451,614.75101.02
$60,565,105.27$113,490.52
$195,409.60 42.99%N--
0.44%0.20%
--
AA+Aaa
GSE MBS 0.00%
FN AB539631417B7J03.00%
12/18/2106/01/220.45
08/15/1208/15/12
54,260.77$57,228.15$54,608.21
$56,936.79104.93
$57,072.44$135.65
$2,328.57 0.04%N--
1.34% (7.56%)
--
AA+Aaa
FHMS K-030 A13137B3N952.78%
10/13/2109/25/220.29
06/14/1806/19/18
55,852.6655,499.2255,707.36
56,160.11100.55
56,289.45129.35
452.74 0.04%Y--
3.03%----
AA+Aaa
FHMS K-026 A23137B1BS02.51%
10/15/2211/25/221.27
05/21/1905/24/19
1,000,000.001,000,429.69
999,149.651,026,116.80
102.611,028,208.47
2,091.6726,967.15 0.73%
Y--
2.46%----
AA+Aaa
GSE MBS TOTAL09/12/2211/13/221.18
----
1,110,113.43$1,113,157.06$1,109,465.22
$1,139,213.69102.63
$1,141,570.36$2,356.66
$29,748.47 0.81%--
2.43% (7.56%)
--
AA+Aaa
CORP 0.00%
EXXON MOBIL CORP30231GBB71.90%
08/16/2208/16/221.11
08/13/1908/16/19
800,000.00$800,000.00$800,000.00
$814,795.68101.85
$820,501.68$5,706.00
$14,795.68 0.58%N--
1.90%0.26%
--
AA-Aa2
APPLE INC037833DV90.75%
05/11/2305/11/231.85
05/04/2005/11/20
915,000.00912,511.20913,448.57
922,891.98100.86
923,845.10953.12
9,443.41 0.66%N--
0.84%0.29%
--
AA+Aa1
PEPSICO INC713448FB90.40%
10/07/2310/07/232.26
10/06/2010/07/20
1,335,000.001,334,239.051,334,423.93
1,336,124.70100.08
1,337,370.701,246.00
1,700.76 0.95%N--
0.42%0.36%
--
A+A1
Portfolio Holdings
Supporting Reports

Public Trust Advisors 13
04/01/2021 to 06/30/2021
City of Cape Coral LT 1-3
DescriptionIdentifierCoupon
Effective MaturityFinal MaturityDuration
Trade DateSettle Date
Par Value Original CostBook Value
Market ValueMarket Price
MV + AccruedAccrued Balance
Net Unrealized Gain/Loss
% of Market Value
CallableNext Call Date
Book YieldYTMYTC
S&PMoody's
AMAZON.COM INC023135BW50.45%
05/12/2405/12/242.84
05/11/2105/12/21
1,895,000.001,892,233.301,892,357.82
1,891,456.3599.81
1,892,617.041,160.69
(901.47) 1.34%N--
0.50%0.52%
--
AAA1
CORP TOTAL09/23/2309/23/232.21
----
4,945,000.00$4,938,983.55$4,940,230.33
$4,965,268.70100.42
$4,974,334.52$9,065.81
$25,038.38 3.53%N--
0.77%0.39%
--
AA-Aa3
PORTFOLIO TOTAL04/30/2304/30/231.82
----
139,765,061.72$140,826,304.78$140,414,834.58
$140,671,159.44100.49
$140,893,238.50$222,079.07
$256,324.85 100.00%--
0.42%0.24%
--
AA+Aaa
Portfolio Holdings
Supporting Reports

04/01/2021 to 06/30/2021
City of Cape Coral LT 1-5Investment Report

John Grady | Managing DirectorDirect: (407) 588-0525Mobile: (407) [email protected]
Neil Waud, CFA | Chief Investment OfficerDirect: (303) 244-0468Mobile: (720) [email protected]
Tom Tight | Managing DirectorDirect: (407) 588-9391Mobile: (407) [email protected]
Cory Gebel, CFA | Director, Portfolio ManagementDirect: (720) [email protected]
Relationship Managers Portfolio Manager
Relationship Management Team
Table of Contents
Executive Summary• Portfolio Overview 3• Maturity Distribution 4• Rating Distribution 5• Security Distribution – Market Value 6• Security Distribution – Historical Cost 7
Supporting Reports• Portfolio Holdings 8• Transactions 14• Income 16• GASB 40 20• Portfolio Activity Summary 26
Disclaimers

Public Trust Advisors 3
04/01/2021 to 06/30/2021
City of Cape Coral LT 1-5
Portfolio Overview
03/31/21 06/30/21
Duration 2.644 2.596
Years to Effective Maturity 2.706 2.649
Years to Final Maturity 2.777 2.710
Coupon Rate 1.530 1.430
Book Yield 1.125 1.039
Market Yield 0.381 0.419
Benchmark Yield 0.391 0.434
Portfolio Summary
Asset Allocation
Portfolio Characteristics
Summary 03/31/21 06/30/21
Historical Cost $67,727,755.99 $68,084,670.94
Book Value 67,569,845.66 67,873,497.81
Accrued Interest 233,587.55 181,277.31
Net Pending Transactions 0.99 0.63
Book Value Plus Accrued $67,803,434.19 $68,054,775.74
Net Unrealized Gain/Loss 863,889.30 688,139.55
Market Value Plus Accrued $68,667,323.50 $68,742,915.30
Period Income Income
Interest Income $242,630.03
Net Amortization/Accretion Income (57,546.64)
Net Realized Gain/Loss 66,258.16
Net Income $251,341.55
Income Summary
Detail may not add to total due to rounding.
Executive Summary

Public Trust Advisors 4
04/01/2021 to 06/30/2021
City of Cape Coral LT 1-5
Maturity Distribution by Security Type
Portfolio Overview
Issuer Value
United States 65.52%
Federal Home Loan Banks 12.00%
Farm Credit System 10.08%
Federal National Mortgage Association 5.97%
Apple Inc. 2.07%
Amazon.com, Inc. 1.34%
Federal Home Loan Mortgage Corporation 1.12%
PepsiCo, Inc. 0.96%
Exxon Mobil Corporation 0.60%
U.S. Bancorp 0.33%
Top Ten Holdings Maturity Distribution by Type
Security Distribution 0-3 Months 3-6 Months 6-9 Months 9-12 Months 1-2 Years 2-3 Years 3-4 Years 4-5 Years 5+ Years Portfolio Total
AGCY -- -- -- -- $263,305.69 -- -- -- -- $263,305.69
CASH 0.63 0.63
CORP 1,834,881.64 1,585,008.84 3,419,890.48
FED INST (GSE) 7,346,018.07 8,516,022.13 2,210,244.61 1,980,789.05 20,053,073.85
MMFUND 227,526.69 227,526.69
US GOV 5,470,322.30 12,509,958.20 4,345,488.24 11,787,044.87 10,666,304.35 44,779,117.96
TOTAL $227,527.32 -- -- $5,470,322.30 $21,954,163.59 $14,446,519.21 $13,997,289.47 $12,647,093.40 -- $68,742,915.30
• Maturity Distribution

Public Trust Advisors 5
04/01/2021 to 06/30/2021
City of Cape Coral LT 1-5
Portfolio Overview
S&P Rating Distribution Moody’s Rating Distribution
Allocation by Standard and Poor’s Rating Allocation by Moody’s Rating
S&P Rating Distribution Jun 30, 2021Ending Balance
PortfolioAllocation
Short Term Rating Distribution
A-1+ $0.00 0.00%
A-1
A-2
Total Short Term Ratings $0.00 0.00%
Long Term Rating Distribution
AAA $227,527.32 0.33%
AA $67,854,215.95 98.71%
A $661,172.03 0.96%
Below A
Not Rated
Total Long Term Ratings $68,742,915.30 100.00%
Portfolio Total $68,742,915.30 100.00%
Moody's Rating Distribution Jun 30, 2021Ending Balance
PortfolioAllocation
Short Term Rating Distribution
P-1 $0.00 0.00%
P-2
Total Short Term Ratings $0.00 0.00%
Long Term Rating Distribution
Aaa $65,323,024.82 95.03%
Aa $1,834,881.64 2.67%
A $1,585,008.84 2.31%
Below A
Not Rated
Total Long Term Ratings $68,742,915.30 100.00%
Portfolio Total $68,742,915.30 100.00%
• Rating Distribution

Public Trust Advisors 6
04/01/2021 to 06/30/2021
City of Cape Coral LT 1-5
Market Value Basis Security Distribution
Asset Balance by Security Type
Security Distribution Mar 31, 2021Ending Balance
Mar 31, 2021Portfolio Allocation
Jun 30, 2021Ending Balance
Jun 30, 2021Portfolio Allocation
Change inAllocation Book Yield
Cash $0.99 0.00% $0.63 0.00% (0.00%) 0.00%
U.S. Treasury Notes $44,061,849.62 64.17% $44,779,117.96 65.14% 0.97% 1.23%
U.S. Agency Notes 286,044.18 0.42% 263,305.69 0.38% (0.03%) 1.36%
Federal Instrumentality (GSE) 21,675,432.44 31.57% 20,053,073.85 29.17% (2.39%) 0.68%
Money Market Funds $145,879.68 0.21% $227,526.69 0.33% 0.12% 0.01%
Corporate Notes 2,498,116.59 3.64% 3,419,890.48 4.97% 1.34% 0.75%
Portfolio Total $68,667,323.50 100.00% $68,742,915.30 100.00% 1.04%
Portfolio Overview
• Security Distribution – Market Value

Public Trust Advisors 7
04/01/2021 to 06/30/2021
City of Cape Coral LT 1-5
Historic Cost Basis Security Distribution
Asset Balance by Security Type
Portfolio Overview
Security Distribution Mar 31, 2021Ending Balance
Mar 31, 2021Portfolio Allocation
Jun 30, 2021Ending Balance
Jun 30, 2021Portfolio Allocation
Change inAllocation Book Yield
Cash $0.99 0.00% $0.63 0.00% (0.00%) 0.00%
U.S. Treasury Notes $43,181,717.22 63.76% $44,093,767.61 64.76% 1.01% 1.23%
U.S. Agency Notes 286,046.15 0.42% 262,825.82 0.39% (0.04%) 1.36%
Federal Instrumentality (GSE) 21,634,961.99 31.94% 20,097,750.37 29.52% (2.43%) 0.68%
Money Market Funds $145,879.68 0.22% $227,526.69 0.33% 0.12% 0.01%
Corporate Notes 2,479,150.95 3.66% 3,402,800.45 5.00% 1.34% 0.75%
Portfolio Total $67,727,756.98 100.00% $68,084,671.57 100.00% 1.04%
• Security Distribution – Historical Cost

Public Trust Advisors 8
04/01/2021 to 06/30/2021
City of Cape Coral LT 1-5
DescriptionIdentifierCoupon
Effective MaturityFinal MaturityDuration
Trade DateSettle Date
Par Value Original CostBook Value
Market ValueMarket Price
MV + AccruedAccrued Balance
Net Unrealized Gain/Loss
% of Market Value
CallableNext Call Date
Book YieldYTMYTC
S&PMoody's
CASH 0.00%
ReceivableCCYUSD0.00%
06/30/2106/30/210.00
----
0.63$0.63$0.63
$0.631.00
$0.63$0.00
$0.00 0.00%N--
0.00%----
AAAAaa
CASH TOTAL06/30/2106/30/210.00
----
0.63$0.63$0.63
$0.631.00
$0.63$0.00
$0.00 0.00%N--
0.00%----
AAAAaa
MMFUND 0.00%
FIRST AMER:TRS OBG Y31846V8070.01%
06/30/2106/30/210.00
----
227,526.69$227,526.69$227,526.69
$227,526.691.00
$227,526.69$0.00
$0.00 0.33%N--
0.01%----
AAAmAaa
MMFUND TOTAL06/30/2106/30/210.00
----
227,526.69$227,526.69$227,526.69
$227,526.691.00
$227,526.69$0.00
$0.00 0.33%N--
0.01%----
AAAmAaa
US GOV 0.00%
UNITED STATES TREASURY912828X471.88%
04/30/2204/30/220.83
05/09/1705/11/17
625,000.00$623,242.19$624,694.54
$634,228.75101.48
$636,203.10$1,974.35
$9,534.21 0.93%N--
1.93%0.10%
--
AA+Aaa
UNITED STATES TREASURY912828SV31.75%
05/15/2205/15/220.87
06/28/1706/29/17
1,650,000.001,645,037.111,649,082.76
1,673,847.45101.45
1,677,535.293,687.84
24,764.69 2.44%N--
1.81%0.10%
--
AA+Aaa
UNITED STATES TREASURY912828XG02.12%
06/30/2206/30/220.99
10/02/1710/04/17
1,500,000.001,514,355.471,503,133.49
1,530,234.00102.02
1,530,320.6286.62
27,100.51 2.23%N--
1.91%0.11%
--
AA+Aaa
UNITED STATES TREASURY912828XW51.75%
06/30/2206/30/221.00
07/10/1707/13/17
1,600,000.001,586,375.011,597,158.73
1,626,187.20101.64
1,626,263.2976.09
29,028.47 2.37%N--
1.93%0.11%
--
AA+Aaa
UNITED STATES TREASURY912828L241.88%
08/31/2208/31/221.15
09/15/1709/19/17
1,250,000.001,253,125.001,250,762.67
1,275,488.75102.04
1,283,322.487,833.73
24,726.08 1.87%N--
1.82%0.13%
--
AA+Aaa
UNITED STATES TREASURY9128282W91.88%
09/30/2209/30/221.24
12/11/1712/13/17
1,125,000.001,111,025.391,121,228.89
1,149,302.25102.16
1,154,604.505,302.25
28,073.36 1.68%N--
2.15%0.15%
--
AA+Aaa
UNITED STATES TREASURY912828M802.00%
11/30/2211/30/221.40
12/11/1712/13/17
1,175,000.001,166,600.581,172,515.59
1,205,477.15102.59
1,207,467.591,990.44
32,961.56 1.76%N--
2.15%0.17%
--
AA+Aaa
UNITED STATES TREASURY91282CBN00.12%
02/28/2302/28/231.66
03/03/2103/05/21
2,000,000.001,999,453.121,999,541.31
1,997,500.0099.88
1,998,335.60835.60
(2,041.31) 2.91%N--
0.14%0.20%
--
AA+Aaa
Portfolio Holdings
Supporting Reports

Public Trust Advisors 9
04/01/2021 to 06/30/2021
City of Cape Coral LT 1-5
DescriptionIdentifierCoupon
Effective MaturityFinal MaturityDuration
Trade DateSettle Date
Par Value Original CostBook Value
Market ValueMarket Price
MV + AccruedAccrued Balance
Net Unrealized Gain/Loss
% of Market Value
CallableNext Call Date
Book YieldYTMYTC
S&PMoody's
UNITED STATES TREASURY912828ZH60.25%
04/15/2304/15/231.79
05/06/2105/10/21
2,275,000.002,279,265.632,278,952.28
2,276,155.70100.05
2,277,352.251,196.55
(2,796.58) 3.31%N--
0.15%0.22%
--
AA+Aaa
UNITED STATES TREASURY9128284L12.75%
04/30/2304/30/231.79
09/24/1809/26/18
2,175,000.002,155,289.062,166,840.70
2,274,828.15104.59
2,284,905.2610,077.11
107,987.45 3.32%N--
2.96%0.24%
--
AA+Aaa
UNITED STATES TREASURY9128284U12.62%
06/30/2306/30/231.96
09/24/1809/26/18
2,200,000.002,166,914.072,185,576.57
2,303,813.60104.72
2,303,970.53156.93
118,237.03 3.35%N--
2.97%0.26%
--
AA+Aaa
UNITED STATES TREASURY912828VS62.50%
08/15/2308/15/232.07
09/24/1809/26/18
925,000.00905,416.02916,147.34
968,431.52104.70
977,119.378,687.85
52,284.18 1.42%N--
2.97%0.28%
--
AA+Aaa
UNITED STATES TREASURY912828WE62.75%
11/15/2311/15/232.31
12/17/1812/20/18
700,000.00700,984.38700,497.47
740,140.80105.73
742,599.362,458.56
39,643.33 1.08%N--
2.72%0.32%
--
AA+Aaa
UNITED STATES TREASURY9128285U02.62%
12/31/2312/31/232.43
01/17/2001/21/20
475,000.00493,424.80486,807.36
501,866.95105.66
501,900.8333.88
15,059.59 0.73%N--
1.61%0.35%
--
AA+Aaa
UNITED STATES TREASURY91282CBM20.12%
02/15/2402/15/242.62
02/18/2102/19/21
1,000,000.00997,695.31997,975.77
993,516.0099.35
993,985.61469.61
(4,459.77) 1.45%N--
0.20%0.37%
--
AA+Aaa
UNITED STATES TREASURY912828W482.12%
02/29/2402/29/242.59
09/23/1909/24/19
625,000.00639,453.13633,810.46
653,906.25104.62
658,345.364,439.11
20,095.79 0.96%N--
1.58%0.38%
--
AA+Aaa
UNITED STATES TREASURY912828X702.00%
04/30/2404/30/242.76
01/08/2001/10/20
450,000.00456,697.27454,460.06
470,021.40104.45
471,537.701,516.30
15,561.34 0.69%N--
1.64%0.42%
--
AA+Aaa
UNITED STATES TREASURY912828Y871.75%
07/31/2407/31/242.99
03/03/2103/05/21
2,000,000.002,092,578.122,083,777.76
2,078,594.00103.93
2,093,193.4514,599.45
(5,183.76) 3.04%N--
0.38%0.47%
--
AA+Aaa
UNITED STATES TREASURY9128282Y52.12%
09/30/2409/30/243.14
12/30/1912/31/19
1,900,000.001,936,367.201,925,205.25
1,998,636.60105.19
2,008,785.5110,148.91
73,431.35 2.92%N--
1.70%0.51%
--
AA+Aaa
UNITED STATES TREASURY912828YM61.50%
10/31/2410/31/243.25
12/02/1912/03/19
1,250,000.001,240,185.551,243,257.91
1,289,990.00103.20
1,293,148.973,158.97
46,732.09 1.88%N--
1.67%0.53%
--
AA+Aaa
UNITED STATES TREASURY912828YY01.75%
12/31/2412/31/243.40
02/18/2102/19/21
1,650,000.001,738,816.411,730,484.09
1,717,288.65104.08
1,717,367.1178.46
(13,195.44) 2.50%N--
0.35%0.57%
--
AA+Aaa
Portfolio Holdings
Supporting Reports

Public Trust Advisors 10
04/01/2021 to 06/30/2021
City of Cape Coral LT 1-5
DescriptionIdentifierCoupon
Effective MaturityFinal MaturityDuration
Trade DateSettle Date
Par Value Original CostBook Value
Market ValueMarket Price
MV + AccruedAccrued Balance
Net Unrealized Gain/Loss
% of Market Value
CallableNext Call Date
Book YieldYTMYTC
S&PMoody's
UNITED STATES TREASURY9128283V02.50%
01/31/2501/31/253.41
02/25/2102/26/21
1,700,000.001,836,066.401,824,199.93
1,815,878.80106.82
1,833,606.7017,727.90
(8,321.13) 2.67%N--
0.44%0.58%
--
AA+Aaa
UNITED STATES TREASURY912828ZC71.12%
02/28/2502/28/253.58
02/11/2102/12/21
1,000,000.001,032,382.811,029,369.84
1,018,516.00101.85
1,022,276.193,760.19
(10,853.84) 1.49%N--
0.32%0.61%
--
AA+Aaa
UNITED STATES TREASURY912828ZF00.50%
03/31/2503/31/253.70
----
1,825,000.001,819,271.491,819,595.41
1,816,373.2299.53
1,818,666.942,293.72
(3,222.19) 2.65%N--
0.58%0.63%
--
AA+Aaa
UNITED STATES TREASURY912828ZW30.25%
06/30/2506/30/253.97
01/06/2101/07/21
1,250,000.001,243,603.511,244,288.60
1,228,222.5098.26
1,228,230.998.49
(16,066.10) 1.79%N--
0.37%0.69%
--
AA+Aaa
UNITED STATES TREASURY91282CAJ00.25%
08/31/2508/31/254.13
02/25/2102/26/21
3,300,000.003,249,984.383,253,711.72
3,234,643.5098.02
3,237,400.972,757.47
(19,068.22) 4.71%N--
0.59%0.73%
--
AA+Aaa
UNITED STATES TREASURY91282CAT80.25%
10/31/2510/31/254.30
06/03/2106/07/21
950,000.00931,148.44931,424.18
929,181.7097.81
929,581.84400.14
(2,242.48) 1.35%N--
0.71%0.76%
--
AA+Aaa
UNITED STATES TREASURY91282CBH30.38%
01/31/2601/31/264.52
02/25/2102/26/21
3,400,000.003,350,195.313,353,633.09
3,333,196.8098.04
3,338,515.175,318.37
(20,436.29) 4.86%N--
0.68%0.81%
--
AA+Aaa
UNITED STATES TREASURY91282CBQ30.50%
02/28/2602/28/264.59
03/29/2103/30/21
1,000,000.00983,007.81983,864.66
985,273.0098.53
986,944.201,671.20
1,408.34 1.44%N--
0.85%0.82%
--
AA+Aaa
UNITED STATES TREASURY91282CCF60.75%
05/31/2605/31/264.81
06/03/2106/07/21
950,000.00945,806.64945,860.84
945,027.7099.48
945,631.18603.48
(833.14) 1.38%N--
0.84%0.86%
--
AA+Aaa
US GOV TOTAL04/09/2404/09/242.72
----
43,925,000.00$44,093,767.61$44,107,859.28
$44,665,768.40101.76
$44,779,117.96$113,349.56
$557,909.12 65.14%N--
1.23%0.43%
--
AA+Aaa
GSE 0.00%
FEDERAL HOME LOAN BANKS3130AKDH60.12%
10/21/2210/21/221.31
10/21/2010/22/20
725,000.00$724,043.00$724,373.82
$724,512.1899.93
$724,688.40$176.22
$138.37 1.05%N--
0.19%0.18%
--
AA+Aaa
FEDERAL FARM CREDIT BANKS FUNDING CORP3133EMPH90.12%
02/03/2302/03/231.59
01/26/2102/03/21
1,200,000.001,199,328.001,199,465.21
1,198,999.8799.92
1,199,616.54616.67
(465.34) 1.75%N--
0.15%0.18%
--
AA+Aaa
Portfolio Holdings
Supporting Reports

Public Trust Advisors 11
04/01/2021 to 06/30/2021
City of Cape Coral LT 1-5
DescriptionIdentifierCoupon
Effective MaturityFinal MaturityDuration
Trade DateSettle Date
Par Value Original CostBook Value
Market ValueMarket Price
MV + AccruedAccrued Balance
Net Unrealized Gain/Loss
% of Market Value
CallableNext Call Date
Book YieldYTMYTC
S&PMoody's
FEDERAL HOME LOAN BANKS3130AJ7E31.38%
02/17/2302/17/231.61
10/01/2010/02/20
850,000.00873,817.00866,355.90
866,269.78101.91
870,620.134,350.35
(86.12) 1.27%N--
0.19%0.20%
--
AA+Aaa
FEDERAL HOME LOAN BANKS313382AX12.12%
03/10/2303/10/231.66
03/02/2003/04/20
900,000.00930,150.00917,028.57
928,264.26103.14
934,161.135,896.88
11,235.68 1.36%N--
0.99%0.27%
--
AA+Aaa
FEDERAL HOME LOAN BANKS3133834G32.12%
06/09/2306/09/231.91
06/22/2006/23/20
2,750,000.002,896,740.002,846,285.24
2,842,204.34103.35
2,845,775.523,571.18
(4,080.91) 4.14%N--
0.31%0.39%
--
AA+Aaa
FEDERAL NATIONAL MORTGAGE ASSOCIATION3135G05G40.25%
07/10/2307/10/232.02
07/08/2007/10/20
465,000.00464,000.25464,324.16
464,947.1799.99
465,499.35552.19
623.00 0.68%N--
0.32%0.26%
--
AA+Aaa
FEDERAL HOME LOAN BANKS3130AAHE12.50%
12/08/2312/08/232.38
04/21/2004/23/20
1,525,000.001,636,584.251,600,226.59
1,606,139.91105.32
1,608,575.682,435.76
5,913.32 2.34%N--
0.46%0.31%
--
AA+Aaa
FEDERAL FARM CREDIT BANKS FUNDING CORP3133EDBU53.50%
12/20/2312/20/232.39
03/05/2003/06/20
1,400,000.001,545,362.001,495,212.07
1,507,984.74107.71
1,509,481.971,497.22
12,772.68 2.20%N--
0.72%0.36%
--
AA+Aaa
FEDERAL NATIONAL MORTGAGE ASSOCIATION3135G0V342.50%
02/05/2402/05/242.50
10/29/1910/31/19
1,200,000.001,238,520.001,223,813.39
1,265,536.60105.46
1,277,703.2612,166.67
41,723.21 1.86%N--
1.72%0.38%
--
AA+Aaa
FEDERAL FARM CREDIT BANKS FUNDING CORP3133EMRZ70.25%
02/26/2402/26/242.64
02/22/2102/26/21
1,330,000.001,329,521.201,329,576.13
1,324,949.1199.62
1,326,103.631,154.51
(4,627.02) 1.93%N--
0.26%0.39%
--
AA+Aaa
FEDERAL FARM CREDIT BANKS FUNDING CORP3133ELQD91.23%
03/04/2403/04/242.63
03/30/2003/31/20
1,900,000.001,948,868.001,933,442.18
1,941,878.11102.20
1,949,473.367,595.25
8,435.93 2.84%N--
0.57%0.40%
--
AA+Aaa
FEDERAL FARM CREDIT BANKS FUNDING CORP3133EKWV41.85%
07/26/2407/26/242.97
09/09/1909/12/19
900,000.00913,212.00908,440.05
937,442.29104.16
944,611.047,168.75
29,002.23 1.37%N--
1.54%0.48%
--
AA+Aaa
FEDERAL HOME LOAN BANKS3130AJKW80.50%
06/13/2506/13/253.90
06/15/2006/16/20
1,275,000.001,274,311.501,274,455.02
1,265,314.8299.24
1,265,633.57318.75
(9,140.20) 1.84%N--
0.51%0.70%
--
AA+Aaa
Portfolio Holdings
Supporting Reports

Public Trust Advisors 12
04/01/2021 to 06/30/2021
City of Cape Coral LT 1-5
DescriptionIdentifierCoupon
Effective MaturityFinal MaturityDuration
Trade DateSettle Date
Par Value Original CostBook Value
Market ValueMarket Price
MV + AccruedAccrued Balance
Net Unrealized Gain/Loss
% of Market Value
CallableNext Call Date
Book YieldYTMYTC
S&PMoody's
FEDERAL NATIONAL MORTGAGE ASSOCIATION3135G05X70.38%
08/25/2508/25/254.10
08/25/2008/27/20
1,310,000.001,303,869.201,304,893.48
1,291,103.9798.56
1,292,823.351,719.38
(13,789.51) 1.88%N--
0.47%0.73%
--
AA+Aaa
FEDERAL NATIONAL MORTGAGE ASSOCIATION3135G06G30.50%
11/07/2511/07/254.29
11/09/2011/12/20
695,000.00692,511.90692,825.13
687,444.4598.91
687,965.70521.25
(5,380.68) 1.00%N--
0.57%0.75%
--
AA+Aaa
GSE TOTAL01/20/2401/20/242.51
----
18,425,000.00$18,970,838.30$18,780,716.95
$18,852,991.60102.40
$18,902,732.62$49,741.01
$72,274.65 27.50%N--
0.58%0.40%
--
AA+Aaa
AGCY MBS 0.00%
G2 00530136202F3J33.50%
06/27/2302/20/271.52
06/15/1206/15/12
175,812.98$187,900.12$182,242.26
$187,953.34106.91
$188,466.13$512.79
$5,711.08 0.27%N--
1.58% (0.09%)
--
AA+Aaa
G2 79428336177NXM73.50%
06/18/2303/20/271.54
04/04/1304/04/13
70,311.5174,925.7073,934.62
74,634.49106.15
74,839.56205.08
699.86 0.11%N--
0.83%0.24%
--
AA+Aaa
AGCY MBS TOTAL06/24/2302/28/271.53
----
246,124.49$262,825.82$256,176.88
$262,587.82106.69
$263,305.69$717.86
$6,410.94 0.38%N--
1.36%0.00%
--
AA+Aaa
GSE MBS 0.00%
FHMS K-026 A23137B1BS02.51%
10/15/2211/25/221.27
05/21/1905/24/19
750,000.00$750,322.27$749,362.24
$769,587.60102.61
$771,156.35$1,568.75
$20,225.36 1.12%Y--
2.46%----
AA+Aaa
FN MA108431418AF293.50%
05/12/2406/01/322.15
07/17/1207/17/12
353,346.24376,589.80366,233.65
378,154.29107.02
379,184.881,030.59
11,920.64 0.55%N--
2.12%0.93%
--
AA+Aaa
GSE MBS TOTAL04/23/2301/14/261.56
----
1,103,346.24$1,126,912.07$1,115,595.89
$1,147,741.89104.07
$1,150,341.23$2,599.34
$32,146.00 1.67%--
2.35%0.93%
--
AA+Aaa
CORP 0.00%
EXXON MOBIL CORP30231GBB71.90%
08/16/2208/16/221.11
08/13/1908/16/19
400,000.00$400,000.00$400,000.00
$407,397.84101.85
$410,250.84$2,853.00
$7,397.84 0.60%N--
1.90%0.26%
--
AA-Aa2
APPLE INC037833DE72.40%
12/13/2201/13/231.42
05/11/2005/13/20
925,000.00965,764.75947,968.11
954,872.41103.23
965,232.4110,360.00
6,904.30 1.40%Y
12/13/22
0.68%0.29%0.17%
AA+Aa1
Portfolio Holdings
Supporting Reports

Public Trust Advisors 13
04/01/2021 to 06/30/2021
City of Cape Coral LT 1-5
DescriptionIdentifierCoupon
Effective MaturityFinal MaturityDuration
Trade DateSettle Date
Par Value Original CostBook Value
Market ValueMarket Price
MV + AccruedAccrued Balance
Net Unrealized Gain/Loss
% of Market Value
CallableNext Call Date
Book YieldYTMYTC
S&PMoody's
APPLE INC037833DV90.75%
05/11/2305/11/231.85
05/04/2005/11/20
455,000.00453,762.40454,228.52
458,924.43100.86
459,398.38473.96
4,695.90 0.67%N--
0.84%0.29%
--
AA+Aa1
PEPSICO INC713448FB90.40%
10/07/2310/07/232.26
10/06/2010/07/20
660,000.00659,623.80659,715.20
660,556.03100.08
661,172.03616.00
840.83 0.96%N--
0.42%0.36%
--
A+A1
AMAZON.COM INC023135BW50.45%
05/12/2405/12/242.84
05/11/2105/12/21
925,000.00923,649.50923,710.28
923,270.2599.81
923,836.81566.56
(440.03) 1.34%N--
0.50%0.52%
--
AAA1
CORP TOTAL07/04/2307/12/231.99
----
3,365,000.00$3,402,800.45$3,385,622.12
$3,405,020.96101.21
$3,419,890.48$14,869.52
$19,398.84 4.97%--
0.75%0.36%0.17%
AAAa3
PORTFOLIO TOTAL02/23/2403/16/242.60
----
67,291,998.05$68,084,671.57$67,873,498.44
$68,561,637.99101.63
$68,742,915.30$181,277.31
$688,139.55 100.00%--
1.04%0.42%0.17%
AA+Aaa
Portfolio Holdings
Supporting Reports

Security Distribution(1)
June 30, 2021Ending Balance
Portfolio Allocation
Permitted by Policy(2) Compliant Issuer Description(1)
Sec. Desc.
June 30, 2021Ending Balance
Portfolio Allocation
Permitted by Policy(2) Compliant
Cash 95,130,073.05$ 15.65% 100.00% YES FLCLASS(2) Int Gov 135,092,495.01$ 22.22% 60.00% YESLGIP 135,680,298.67 22.31% 25.00% YES FL SAFE(2) Int Gov 32,512,456.20 5.35% 60.00% YESU.S. Treasury Notes 118,736,398.04 19.53% 100.00% YES FL PRIME (SBA)(2) LGIP 135,680,298.67 22.31% 60.00% YESU.S. Agency Notes 263,305.69 0.04% 25.00% YES MMF - Fidelity Prime MMF 482,474.17 0.08% 10.00% YESFNMA 7,784,875.51 1.28% 25.00% YES Custody Cash Cash - 0.00% 100.00% YESFHLMC 18,537,863.43 3.05% 25.00% YES First Horizon Local Account Cash 4,298,164.11 0.71% 100.00% YESFFCB 23,984,810.06 3.94% 25.00% YES BankUnited Local Account Cash 22,438,491.06 3.69% 100.00% YESFHLB 31,452,200.47 5.17% 25.00% YES Bank of America Local Account(2) Cash 68,393,417.88 11.25% 100.00% YESFed Instrumentality Subtotal 81,759,749.47$ 13.45% 80.00% YES U.S. Treasury Notes UST 118,736,398.04 19.53% 100.00% YESAsset Backed Securities - 0.00% 25.00% YES U.S. Agency Notes US Agy - 0.00% 25.00% YESCommercial Paper - 0.00% 35.00% YES FNMA GSE 7,348,618.19 1.21% 25.00% YESCorporate Notes 8,394,224.99 1.38% 35.00% YES FHLMC GSE 16,682,209.17 2.74% 25.00% YESBankers Acceptances - 0.00% 25.00% YES FFCB GSE 23,984,810.06 3.94% 25.00% YESMoney Market Funds 482,474.17 0.08% 25.00% YES FHLB GSE 31,452,200.47 5.17% 25.00% YESMunicipal Bonds - 0.00% 20.00% YES Amazon Inc Corp 2,816,453.85 0.46% 5.00% YESIntergovernmental Funds 167,604,951.21 27.56% 60.00% YES Apple Inc. Corp 2,348,475.90 0.39% 5.00% YESCertificates of Deposit - 0.00% 25.00% YES Exxon Mobile Corp 1,230,752.52 0.20% 5.00% YESTotal Portfolio Market Value 608,051,475.29$ 100.00% PepsiCo Inc. Corp 1,998,542.73 0.33% 5.00% YES
FNMA MBS MBS 436,257.32 0.07% 15.00% YESFHLMC MBS MBS 1,855,654.27 0.31% 15.00% YESGNMA MBS MBS 263,305.69 0.04% 15.00% YESTotal Portfolio Market Value 608,051,475.29$ 100.00%
MBS - 0.00% 15.00% YESMBS - 0.00% 15.00% YESMBS - 0.00% 15.00% YESMBS - 0.00% 15.00% YESMBS - 0.00% 15.00% YESMBS - 0.00% 15.00% YESMBS - 0.00% 15.00% YESMBS - 0.00% 15.00% YESMBS - 0.00% 15.00% YESMBS - 0.00% 15.00% YESMBS - 0.00% 15.00% YES
(1) Mortgage backed securities included in security description and listed separately in issuer description. Public Trust managed assets represent market value plus accrued interest.
(2) External assets not managed by Public Trust. Information provided by City staff. Asset allocation limits defined in the City's investment policy.
Asset Allocation as of June 30, 2021
Cash15.65%
LGIP22.31%
U.S. Tsy19.53%
U.S. Agy0.04%
Fed Inst13.03% MBS
0.42%Corp
1.38%
MMF0.08%
Int Gov27.56%
Ending Portfolio Allocation

Public Trust Advisors 31
04/01/2021 to 06/30/2021
City of Cape Coral LT 1-5
This information is for the sole purposes of the client and is not intended to provide specific advice or recommendations. Please review the contents of this information carefully. Should you have any questions regarding the information presented, calculation methodology, investment portfolio, security detail, or any other facet of this information, please feel free to contact us.
Public Trust Advisors, LLC (Public Trust) statements and reports are intended to detail our investment advisory activity as well as the activity of any client accounts managed by Public Trust. The custodian bank maintains the control of assets and executes and settles all investment transactions. The custodian statement is the official record of security and cash holdings transactions. Public Trust recognizes that clients may use these reports to facilitate record keeping; therefore, it is recommended that the client reconcile this information with their custodian bank statement. Many custodians use a settlement date basis that may result in the need to reconcile due to a timing difference. The underlying market value, amortized cost, and accrued interest may differ between the custodian and this statement or report. This can be attributable to differences in calculation methodologies and pricing sources used. Please contact your relationship manager or call us at (855) 395-3954 with questions regarding your account.
Public Trust does not have the authority to withdraw funds from or deposit funds to the custodian. Our clients retain responsibility for their internal accounting policies, implementing and enforcing internal controls, and generating ledger entries or otherwise recording transactions. The total market value represents prices obtained from various sources; it may be impacted by the frequency at which prices are reported, and such prices are not guaranteed. Prices received from pricing vendors are generally based on current market quotes but when such quotes are not available, the pricing vendors use a variety of techniques to estimate value. These estimates, particularly for fixed-income securities, may be based on certain minimum principal amounts (e.g. $1 million) and may not reflect all the factors that affect the value of the security including liquidity risk. The prices provided are not firm bids or offers. Certain securities may reflect N/A or unavailable where the price for such security is generally not available from a pricing source. The market value of a security, including those priced at par value, may differ from its purchase price and may not closely reflect the value at which the security may be sold or purchased based on various market factors. The securities in this investment portfolio, including shares of mutual funds, are not guaranteed or otherwise protected by Public Trust, the FDIC (except for certain non-negotiable certificates of deposit), or any government agency unless specifically stated otherwise.
Clients may be permitted to establish one or more unmanaged accounts for the purposes of client reporting. Public Trust defines an unmanaged account as one where the investment direction remains the sole responsibility of the client rather than the Investment Manager. These accounts do not receive ongoing supervision and monitoring services. The Investment Manager does not make any investment recommendations and may not charge a fee for reporting on these accounts. The primary purpose for this service is to include unmanaged accounts owned by the client in the performance reports provided by the Investment Manager. The Investment Manager assumes no liability for the underlying performance of any unmanaged accounts or assets, and it is the client’s sole responsibility for the accuracy or correctness of any such performance.
Beginning and ending balances are based on market value plus accrued interest on a trade date basis. Statements and reports made available to the end user either from Public Trust or through the online reporting platform may present information and portfolio analytics using various optional methods including, but not limited to, historical cost, amortized cost, and market value. All information is assumed to be correct, but the accuracy has not been confirmed and therefore is not guaranteed to be correct. Information is obtained from third party sources that may or may not be verified. The data in this report is unaudited and is only applicable for the date denoted on the report. Market values may change day-to-day based on numerous circumstances such as trading volume, news released about the underlying issuer, issuer performance, etc. Underlying market values may be priced via numerous aspects as certain securities are short term in nature and not readily traded. Performance results are shown net of all fees and expenses and reflect the reinvestment of dividends and other earnings.
Many factors affect performance including changes in market conditions and interest rates and in response to other economic, political, or financial developments. Investment involves risk including the possible loss of principal. No assurance can be given that the performance objectives of a given strategy will be achieved. Past performance is no guarantee of future results. Any financial and/or investment decision may incur losses.
The investment advisor providing these services is Public Trust Advisors, LLC, an investment adviser registered with the U.S. Securities and Exchange Commission (SEC) under the Investment Advisers Act of 1940, as amended. Registration with the SEC does not imply a certain level of skill or training. Public Trust is required to maintain a written disclosure brochure of our background and business experience. If you would like to receive a copy of our current disclosure brochure, Privacy Policy, or Code of Ethics, please contact us.
Disclaimers
Disclaimers

Contact
Regional Office
201 E. Pine Street, Suite 750
Orlando, FL 32801
Headquarters717 17th Street, Suite 1850
Denver, CO 80202