economics 173a and management 183 financial markets fixed income securities: bonds
TRANSCRIPT

Economics 173Aand
Management 183
Financial Markets
Fixed Income Securities:Bonds
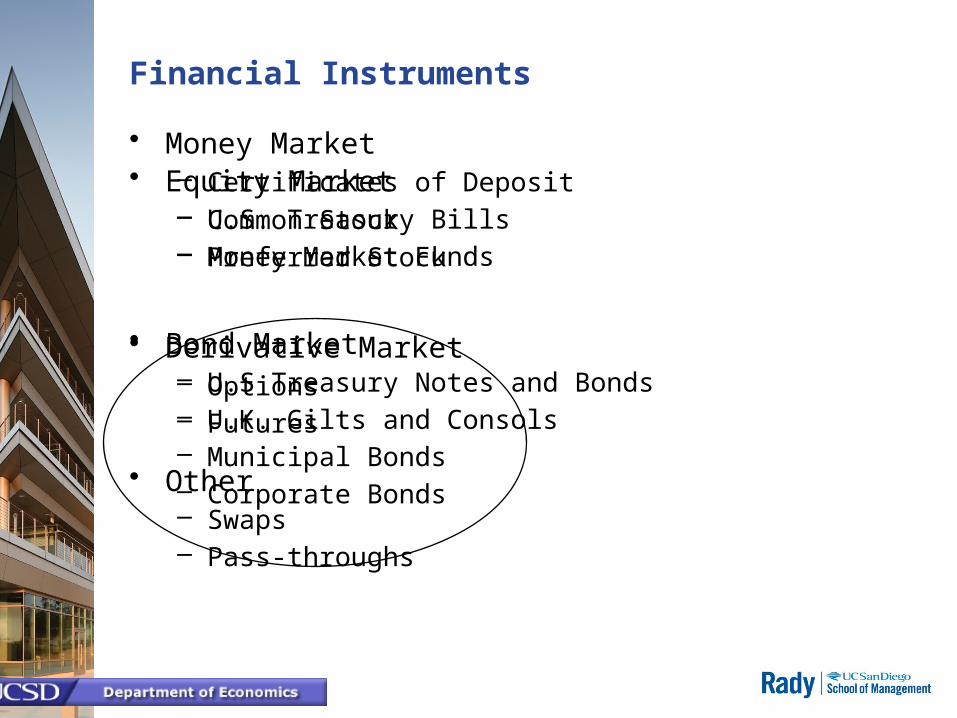
Financial Instruments
• Money Market– Certificates of Deposit– U.S. Treasury Bills– Money Market Funds
• Bond Market– U.S Treasury Notes and Bonds– U.K. Gilts and Consols– Municipal Bonds– Corporate Bonds
• Equity Market– Common Stock– Preferred Stock
• Derivative Market– Options– Futures
• Other– Swaps– Pass-throughs

Fixed Income Securities & Rates
• Fixed– CDs – bank time-deposits– Paper – unsecured, trade-able company debt– Acceptances – bank promises– Eurodollars - $ denominated foreign bonds– Repos, Reverse Repos – of treasury debt– Treasuries – bills, notes, bonds
• Rates– Prime– Fed Funds– LIBOR, HIBOR– TED Spread : LIBOR less the 3-month Treasury yield

Denominated in basis points (bps). Historically 10 to 50 bps – average 30 bps
A rising TED spread indicates shrinking liquidity –an indicator of perceived credit risk:
T-bills are considered risk-freeLIBOR reflects the credit risk of lending banks.
Widening TED spread is a sign that lenders believe default risk on interbank (counterparty) loans is increasing.]
2007 average 150 – 200 bpsSeptember 2008 > 300 bps10/10/2008 465 bps
TED Spread

Pick the Federal Reserve Bank Chairmen
Click Glenn Hubbard for the parody
a c
d e
b


What’s the problem with the Fed balance sheet?
Not it’s size. But the quality of the assets.
The largest piece of the pie is pass-thru-securities (pass thrus from sub-prime mortgages) CDO’s.
No one knows the real value of this balance sheet.
Did the Fed violate the Federal Reserve Act of 1913 by adding lower than Federal government backed securities?

Inflation? Or Deflation?
The problem is losing dollar strength.
Most people get this wrong.
The effects are similar: Prices go up – but the cause is subtly different.
The weakening dollar due to the extreme moves by the Fed undermine American’s buying power.

Bonds
• Debt Security – corporate or government borrowing• Also called a Fixed Income Security• Covenants or Indenture define the contract (this can be
complex)• 2 types of Payments:
interestprincipal
• Interest payments are the Coupon• Principal payment is the Face
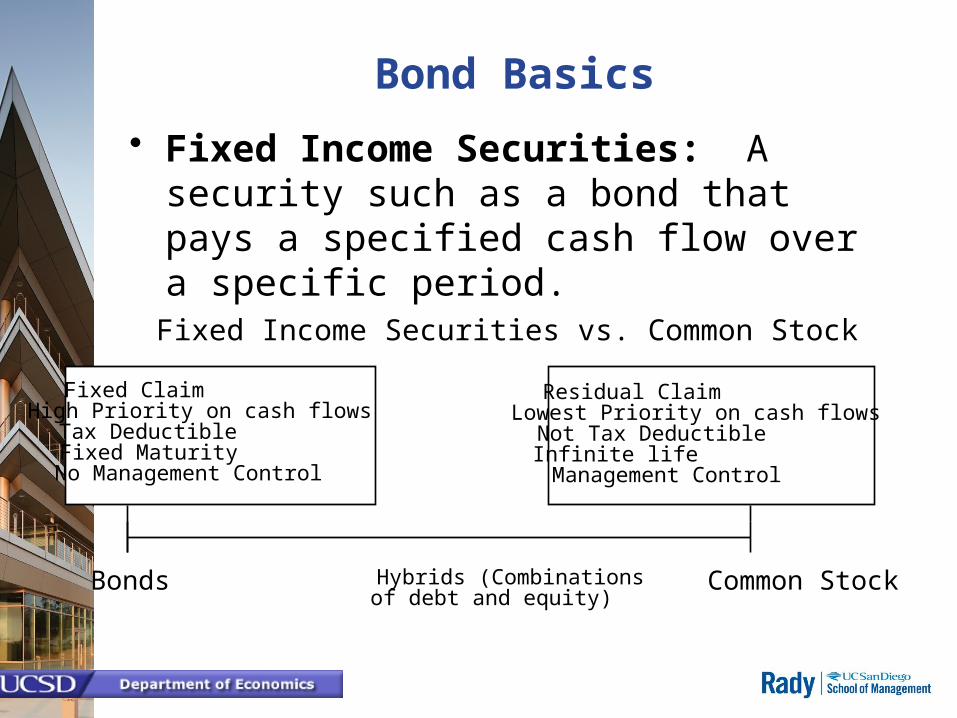
Bond Basics
• Fixed Income Securities: A security such as a bond that pays a specified cash flow over a specific period.
Fixed ClaimHigh Priority on cash flowsTax DeductibleFixed MaturityNo Management Control
Residual ClaimLowest Priority on cash flowsNot Tax DeductibleInfinite life Management Control
Bonds Common StockHybrids (Combinationsof debt and equity)
Fixed Income Securities vs. Common Stock

• Characteristics –– Types: mortgage, callable, convertible, senior or
subordinated, floating rate, zero coupon .– Denomination (Par value) Face– Coupon, Dates of Coupon Payments– Sinking Funds?– Credit Rating
• Pricing – present value of future cash flows• Yields:
– Coupon yield = C / Price– YTM = the DR that makes the NPV of CF’s = 0– RCYTM = Compound all CFs to Term and do CAGR
• Sensitivity to Time, i.e. maturity• Sensitivity to changes in interest rates
Bond Analysis

Treasury Bills, Notes, & Bonds
• Bills – 90 days to 6 months • Notes – 1 year up to 10 years• Bonds – to 30 years• Bond & Note: Face (denomination) of $1,000;
quotes in $100’s• Bills: Face = $10,000. Discounted and quoted at
Yield.• Bond & Note: Coupon (rate) paid semi-annually• Prices quoted in points (of face) + 1/32
• No default / credit risk


US Treasury Bonds Rates
Maturity 7-6-90 9-11-01 4-9-14 7-6-15
3 Month 3.36 % 8.08 % 0.02 % 2 bps
6 Month 3.23 % 8.14 % 0.04 % 9 bps
2 Year 3.53 % 8.32 % 0.40 % 55.7 bps
3 Year 3.82 % 8.41 % 0.87 % 95 bps
5 Year 4.41 % 8.44 % 1.69 % 148.5 bps
10 Year 4.84 % 8.51 % 2.71 % 219.8 bps
30 Year 5.43 % 8.51 % 3.56 % 308.0 bps
http://www.treasury.gov/resource-center/data-chart-center/interest-rates/Pages/TextView.aspx?data=yield

Corporate Bonds April 9, 2014
Maturity 4/9/2014
2yr AA 0.50
2yr A 0.70
5yr AAA 1.80
5yr AA 2.05
5yr A 2.18
10yr AAA 3.10
10yr AA 3.33
10yr A 3.59
20yr AAA 3.99
20yr AA 4.32
20yr A 4.64

Bond Pricing
As with all Financial Assets
The price is a Present Value of the expected cash flows discounted at the appropriate (relative to risk) discount (interest) rate.

Coupon Payments
• Relative to other types of securities, bonds produce cash flows that an analyst can predict with a high degree of precision.
– Fixed rate– Variable rate– Zero coupons– Consols – consolidated annuities - perpetuities
introduced in 1751.

Rates, Returns
Total Return (TR)
Holding Period Return (HPR)
Compound Average Growth Rate (CAGR)
Risk-adjusted Discount Rate (RADR)
Annual Percentage Rate (APR)
Annual Percentage Yield (APY)


Example
We invest $100. 1 year later we have $130 and, a year later, we have $150. Calculate the following:
Total Return
HPR
Annualized HPR
CAGR
APR
APY

Bond Pricing
• DCF Technique
PB = Price of the bond
Ct = interest or coupon payments
T = number of periods to maturity
r = discount rate
1 (1 )(1 )
T
TtTt
t
BFaceCP
rr

Bond Pricingan 8% 10 year bond at 6%.
Ct = 80 (A), F = 1000, T = 10 periods, r = 6% (A)
PB = $1,147.20
t=1+S
10
= PB80
(1+.06) t 1000 1(1+.06) 10

Insert Figure 4-6 here.
Three Bonds in a 10 percent world …

Bond Pricing
• Zero Coupon Bonds
• Consols – Zero Face Bonds
this is “capitalizing” a cash flow
nr 1
par value al)PV(princip price bondcurrent
r
t
r
t
tt
at time flowcash
1
at time flowcash price bondcurrent
1

Bond Yields
• Yield to Maturity: The discount rate that makes the present value of a bond’s payments equal to its price, or NPV = 0– Internal rate of return from holding bond till
maturity.– Example
3 year bond with interest payment of $100, principal of $1,000 and current price of $900
– Assume coupon proceeds are reinvested at the YTM.

• Prices and Yields (required rates of return) have an inverse relationship
– When yields get very high the value of the bond will be very low
– When yields approach zero, the value of the bond approaches the sum of the cash flows
Bond Yields

Price
Yield

Bond Risks
• Price Risks– Default risk– Interest rate risk
• Convenience Risks– Call risk– Reinvestment rate risk– Marketability risk

Default Risk
• The income stream from bonds is not riskless unless the investor can be sure the issuer will not default on the obligation.
• Rating companies – Moody’s Investor Service– Standard & Poor’s– Duff and Phelps– Fitch– Kroll
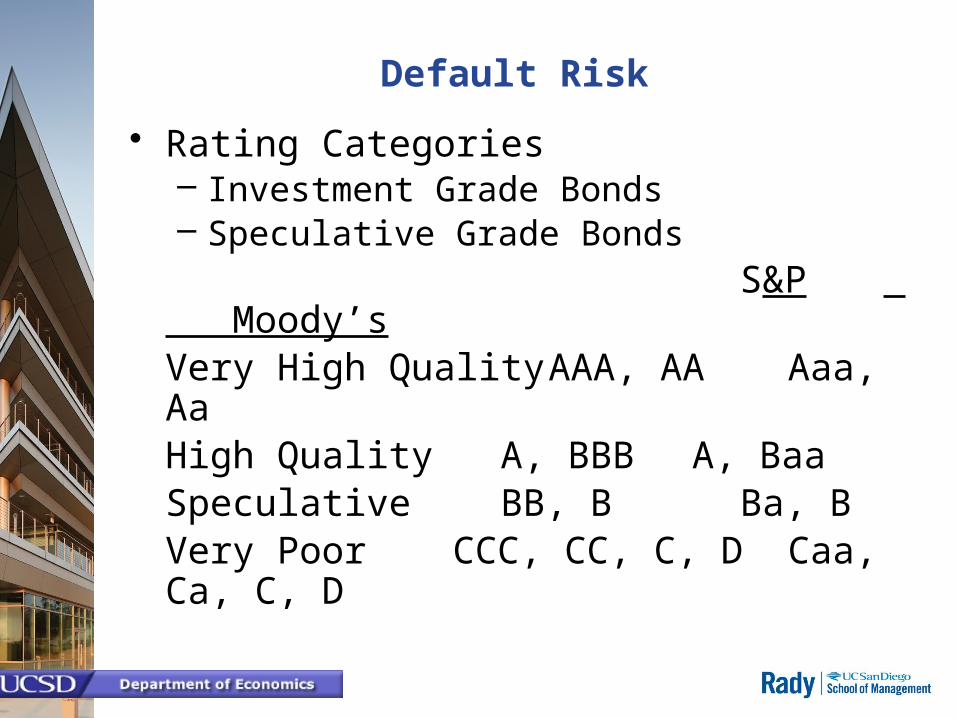
Default Risk
• Rating Categories– Investment Grade Bonds– Speculative Grade Bonds
S&P Moody’sVery High Quality AAA, AA Aaa, AaHigh Quality A, BBB A, BaaSpeculative BB, B Ba, BVery Poor CCC, CC, C, D Caa, Ca, C, D

Bond Yields
• Current or Annual Yield: Annual coupon divided by bond price.
– Different from YTM
• Accrued Interest– Interest is earned for each day that a bond is held, although
interest payments are generally made twice a year only.– A bond buyer must pay the accrued interest to the seller of the
bond.• dirty price = bond price + accrued interest• clean price = bond price
– By convention, accrued interest is calculated using a 360-day year.

Bond Pricing: Accrued Interest
• Example– Consider a bond that is paying a six percent
annual coupon rate in semiannual payments with a yield to maturity of 10 percent and two years and ten months until its maturity.
• What is the quoted price or clean price?
• What is the dirty price?

Bond Pricing: Accrued Interest
•What is the quoted price or clean price?Step One: Calculate the present value of a bond that has 2.5 years until it matures and pays semiannual interest coupons.
Step Two: The $30 coupon is added to $913.39. The sum is $943.19.
Step Three: The value $943.19 is discounted back 4 months to the purchase date.
39.913
2/10.01
000,1
2/10.01
305
5
10
tt
p
16.913
2/10.01
39.9436/40
p

Bond Pricing: Accrued Interest
• What is the dirty price?
Calculate the accrued interest for two months. There are 180 days between semiannual coupon payments and 30 days in a month. Therefore 60/180 is the fraction of the coupon payment earned by the seller. In other words the accrued interest is $10 and the dirty price is $923.16.

2 1 12 0 1 0 1 1
2 1 12 0 1 0 1 1
(1 ) (1 ) (1 )
(1 ) / (1 ) (1 )
r r r
r r r
Forward Rates term years rat year
3 2 13 0 2 0 1 2
3 2 13 0 2 0 1 2
(1 ) (1 ) (1 )
(1 ) / (1 ) (1 )
r r r
r r r
One-year rate one year from now
One-year rate two years from now