edible nuts - groundnuts - international … the national supply company conab issued its “9th...
TRANSCRIPT

0
EDIBLE NUTS - GROUNDNUTS June 2015

Market Insider Groundnuts Building awareness and assisting developing countries with access to trade and market information has been at the heart of the International Trade Centre (ITC) work. The Market Insider is a global public goods service built on a "blog" interface to provide just-in-time content on market prices and industry developments focusing on forward-looking intelligence in anticipation of market opportunities, market dynamics, quality issues, trade events and sector-specific intelligence on commodities of interest to developing countries. No part of these reports may be reproduced, stored in a retrieval system, or transmitted in any form or by any means without the prior permission of the MI/ITC Geneva. Market Insider information is available free of charge to trade support institutions, enterprises and research
institutions in developing and developed countries.
Please log on to:
http://www.intracen.org/itc/market-insider
@ITCMktInsider
Copyright © Market Insider/ITC 2015. All rights reserved

Contents
GLOBAL GROUNDNUT MARKET ........................................................................................................................ 2
HARVESTED AREAS, YIELDS AND PRODUCTION ........................................................................................................................... 2 GROUNDNUT BALANCE......................................................................................................................................................... 0
COUNTRY DEVELOPMENTS ................................................................................................................................ 1
Argentina ................................................................................................................................................................... 1 Brazil .......................................................................................................................................................................... 2 China ......................................................................................................................................................................... 0 Gambia ...................................................................................................................................................................... 2 India .......................................................................................................................................................................... 3 Senegal ...................................................................................................................................................................... 7 South Africa ............................................................................................................................................................... 9 United States of America ......................................................................................................................................... 10
AFLATOXIN ISSUES .............................................................................................................................................. 4
FOOD SAFETY MODERNISATION ACT (FSMA) ................................................................................................ 5
PRICES ..................................................................................................................................................................... 6

Global groundnut market
Harvested areas, yields and production World production of groundnuts in the 2014/15
1 season is estimated at nearly 27 million tons shelled basis,
which represents 5% of the global output of the 10 major oilseeds2 amounting at 528.8 million tons. Ten
countries should cover 84% of the global production in 2015/16. About a third of the world output (8.82 million tons shelled equivalent in 2014/15) is crushed for the production of groundnut oil and meal.
In its “Oil World Annual 2015” publication of May 2015, Ista Mielke GmbH estimated the groundnut areas harvested in the main groundnut producing countries, as well as the average yields and productions over the past 5 seasons. World production of groundnuts (shelled basis) in 2014/15 was preliminary approximated at 26.98 million tons, 5% lower than the previous season. The main reason is the drop in the Chinese, Indian, Indonesian and Senegalese outputs following the decrease in their harvested areas and yields. The current high groundnut prices should push the global production in the 2015/16 season at a record level nearing 28.6 million tons.
1 The split years bring together northern hemisphere annual crops harvested in the latter part of the first year shown, with southern hemisphere annual crops harvested in the early part of the second year shown 2 By order of importance in world output: ssoybeans, rapeseed, cottonseed, sunflower seed, groundnuts, palm kernels,
sesame seed, copra, linseed and castor seed.
Soybeans 60.2%
Rapeseed 13%
Sunseed 7.8%
Cotton seed 8.4%
Groundnut
5.1% Others 5.5%
World production of 10 oilseeds 2014/15 (Total 528.8 million tons)
China, PR 41%
India 11%
Nigeria 7%
USA 7% Sudan 5%
Myanmar 3%
Indonesia 3%
Argentina 3%
Tanzania 2% Senegal 2% Others 16%
Groundnut production by country, 2015/16 (Forecast 40.8 million tons in shell)
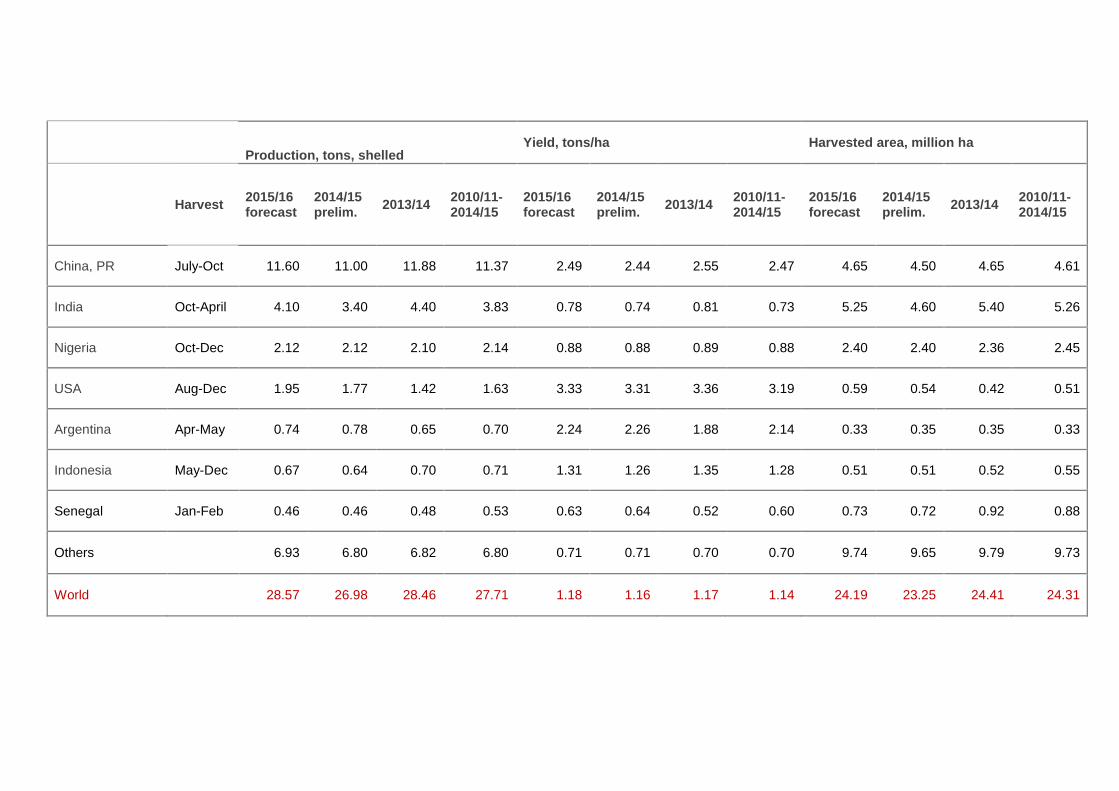
Production, tons, shelled
Yield, tons/ha Harvested area, million ha
Harvest 2015/16 forecast
2014/15 prelim.
2013/14 2010/11-2014/15
2015/16 forecast
2014/15 prelim.
2013/14 2010/11-2014/15
2015/16 forecast
2014/15 prelim.
2013/14 2010/11-2014/15
China, PR July-Oct 11.60 11.00 11.88 11.37 2.49 2.44 2.55 2.47 4.65 4.50 4.65 4.61
India Oct-April 4.10 3.40 4.40 3.83 0.78 0.74 0.81 0.73 5.25 4.60 5.40 5.26
Nigeria Oct-Dec 2.12 2.12 2.10 2.14 0.88 0.88 0.89 0.88 2.40 2.40 2.36 2.45
USA Aug-Dec 1.95 1.77 1.42 1.63 3.33 3.31 3.36 3.19 0.59 0.54 0.42 0.51
Argentina Apr-May 0.74 0.78 0.65 0.70 2.24 2.26 1.88 2.14 0.33 0.35 0.35 0.33
Indonesia May-Dec 0.67 0.64 0.70 0.71 1.31 1.26 1.35 1.28 0.51 0.51 0.52 0.55
Senegal Jan-Feb 0.46 0.46 0.48 0.53 0.63 0.64 0.52 0.60 0.73 0.72 0.92 0.88
Others 6.93 6.80 6.82 6.80 0.71 0.71 0.70 0.70 9.74 9.65 9.79 9.73
World 28.57 26.98 28.46 27.71 1.18 1.16 1.17 1.14 24.19 23.25 24.41 24.31

Groundnut balance Agrocharts (http://www.agrocharts.com/en/) provide the following world groundnut balance based on data from USDA “Oilseeds: World Markets and Trade” report of May 2014.
Unit: 1000 tons in shell groundnuts
2015/16
% change to 2014/15
2014/15 2013/14
Production 40,779 +2.8 39,673 41,154
Beginning stocks 2,257 -11.1 2,540 2,240
Imports 2,456 +0.1 2,453 2,383
Total supply 45,492 +1.8 44,666 45,777
Exports 2,911 -5.6 3,085 2,885
Domestic consumption 39,683 +0.9 39,324 40,352
Food use domestic cons. 19,170 +1.0 18,980 18,901
Feed waste domestic cons. 3,093 +12.2 2,756 3,794
Crush 17,420 -0.95 17,588 17,657
Total disappearance 45,492 +1.8 44,666 45,777
Ending stocks 2,898 +28.4 2,257 2,540
The global output of in shell groundnut in 2015/16 season is projected at 40.8 million tons, nearly 3% above the 2014/15 performance. The increase of 1.1 million tons reflects the rebound in India and Sudan productions. More modest production growths are foreseen for China and the United States. The increase in US plantings should be mainly due to higher groundnut prices in comparison with cotton, corn and soybeans, which are competitors for land. The Chinese production should recover from last season’s decrease caused by reduced plantings (farmers’ response to lower returns), and thus better match the rapidly rising local demand for groundnut oil. World demand for groundnuts is anticipated to rise at a similar pace with the global supply. The export trade could decrease by nearly 6% and imports could maintain their 2014/15 level, leading to an increase in global ending stocks to a record level of nearly 2.9 million tons. Source: http://www.agrocharts.com/en/news/1070/oilseeds-world-markets-and-trade-may-2015-usda.html

Country developments Following is the groundnut planting and harvesting calendar for the major groundnut producing countries.
Country (expected share in 2015/16 world production)
Jan Feb March April May June July Aug Sep Oct Nov Dec
China (41%)
India (12%)
Kharif (summer)
Rabi (winter)
Nigeria (7%)
North (main)
South
USA (7%)
Sudan (5%)
Argentina (5%)
Myanmar (3%)
Summer
Winter
Senegal (2%)
Source: ITC compilation
Argentina By end-April there was not much old crop groundnuts left in the Argentinian market, with the exception of Runner 38/42, Blanched and Splits Blanched grades. The first export shipments of the new crop are expected by end-May. 2016 could see a decrease in plantings and a possible price rise, considering the low market prices of groundnuts at the end of May: 1,200 US$/ton raw 40/50 and 1350 US$/ton blanched CIF. Shellers are already worried about the situation, complaining about their high internal costs, low prices, financing difficulties and possible negative returns. Under adverse weather conditions, harvesting was delayed: by end-May only 8-10% of groundnuts were harvested. By mid-June, some areas were harvested for 40%, some other for 20% and some only for 10%. With yields that are 20 to 40% higher than last year, the output could be about 40% higher. If this expectation becomes reality, Argentinian exports could exceed 700.000 tons this season. Argentina may encounter, however, some difficulties in exporting its groundnuts: China and the US have covered since mid-May a part of their next year needs. The market was quiet: most shellers were still reluctant to offer new crop before its full harvest; they were only willing to deal against firm bids. European buyers, in turn, were refraining from buying until the Euro rate should returns to normal. Sources: Aldebaran Commodities B.V. http://www.aldebaran.nl/ and Golden Peanut and Tree Nuts http://www.goldenpeanut.com/

Brazil
The National Supply Company CONAB issued its “9th Grain Crops Survey” report in June (ISSN 2318-6852). The report presents the prevailing agro-meteorological conditions and the forecast for the next quarter of the year. The current weather and ocean conditions in the tropical Pacific region indicate that a new occurrence of the El Niño phenomenon is forming since March. Positive anomalies of the sea surface temperature can be observed in the equatorial belt in almost its entire length, indicating a typical El Niño pattern, probably of moderate intensity. According to prediction models, this typical pattern may persist until early next summer in the Southern hemisphere. By end-June the first groundnut crop was already harvested and the planting of the second crop was completed. Prevailing weather conditions were good over the country, with the exception of Pernambuco and Alagoas hinterland. Planting and harvesting calendar – first groundnut crop
Regions, States
22/9 - 21/12 Spring
21/12 - 20/03 Summer
20/03 - 21/06 Autumn
21/06 - 22/09 Winter
Oct Nov Dec Jan Feb March April May June July August Sept
South East
Mato Groso P P P H H H
Sao Paulo P P P H H H H P
South
Paranà P P H H H H P
Rio Grande do Sul P P P H H H
Source: CONAB Planting and harvesting calendar – second groundnut crop
Source: CONAB
Regions, States
22/9 - 21/12 Spring
21/12 - 20/03 Summer
20/03 - 21/06 Autumn
21/06 - 22/09 Winter
Oct Nov Dec Jan Feb March April May June July August Sept
North
Tocantins P P H H
North East
Cearà P P P
H H H
Paraiba P P H H
Sergipe P P H H
Bahia P P H H
Centre-West
Mato Groso P P H H
South East
Sao Paolo P P P P H H H H

Estimates of groundnut planted area in 2014/15, 1'000 ha
Crop 2013/14 2014/15 2014/15 versus 2013/14, %
Estimation May 2015 Estimation June 2015 In % In 1000 ha
1st crop 94.2 94.5 97.9 3.9 3.7
2nd crop 11.1 15.8 9.5 - 14.4 - 1.6
Total 105.3 110.3 107.4 2.0 2.1
Source: CONAB
Region/State
Area (1 000 ha) Yield (Kg/ha) Production (1 000 tons)
2013/14 2014/15 prelim.
% 2014/15 vs.
2013/14 2013/14
2014/15 prelim.
% 2014/15 vs. 2013/14
2013/14 2014/15 prelim.
% 2014/15 vs.
2013/14
North 0,8 2,4 200,0 3.556 3.873 8,9 2,8 9,3 232,1
Tocantins 0,8 2,4 200,0 3.556 3.873 8,9 2,8 9,3 232,1
North East 3,9 6,4 64,1 1.215 966 - 20,5 4,8 6,1 27,1
Cearà 1,0 0,6 - 40,0 1.154 914 - 20,8 1,2 0,5 - 58,3
Paraiba 0,3 0,5 66,7 319 800 150,8 0,1 0,4 300,0
Sergipe 1,3 1,3 - 1.74 1.605 - 7,8 2,3 2,1 - 8,7
Bahia 1,3 4,0 207,7 945 787 - 16,7 1,2 3,1 158,3
Centre-West 0,4 0,2 - 50,0 2.5 1.848 - 26,1 1,0 0,4 - 60,0
Mato Grosso 0,4 0,2 - 50,0 2.5 1.848 - 26,1 1,0 0,4 - 60,0
South East 94,8 93,1 - 1,8 3.126 3.313 6,0 296,4 308,4 4,0
Minas Gerais 2.6 2,7 3,8 3.68 3.445 - 6,4 10,8 12,9 19,4
Sao Paolo 92,2 90,4 - 2,0 3.11 3.309 6,4 286,8 299,1 4,3
South 5,4 5,3 - 1,9 1.998 2.429 21,6 10,8 12,9 19,4
Paranà 2,2 2,3 4,5 2.408 2.402 - 0,2 5,3 5,5 3,8
Rio Grande do Sul 3,2 3,0 - 6,3 1.716 2.45 42,8 5,5 7,4 34,5
North/North East 4,7 8,8 87,2 1.614 1.759 20.4 7,6 15,4 102,6
Centre/South 100,6 98,6 - 2,0 3.063 3.263 6,5 308,2 321,7 4,4
Brazil 105,3 107,4 2,0 2.998 3.140 4,7 315,8 337,1 6,9
Source: CONAB
According to field information, approximately 80% of São Paulo crop is intended for export. Following the Real appreciation, this season farmers invested into groundnut cultivation in anticipation of increased export profitability. About 2.700 hectares are estimated to have been planted in Minas Gerais, a 3.8% increase over the past season. Both the first and the second crops are expected to be significantly higher. Estimation of national average yield this season remained unchanged since February at 3.14 kg/ha, which is 4.7% higher than in 2013/14. Based on this yield, the total groundnut production may reach 337,100 tons, 6.9% higher than the past season. In São Paulo (the main groundnut producing State), expectations are for an output of 299,100 tons, a 4.3% increase over the previous crop. The Northern Tocantins State, where cultivation is largely mechanised, is foreseen to record the highest average yield of 3,873 kg/ha. As planted acreage may increase significantly to 2,400 hectares, groundnut output may reach 232,100 tons. North Eastern States are estimated to have planted 6,400 hectares, out of which 4,000 in Bahia. Sergipe is likely to have the best yield in the region (1,605 kg/ha), while in Bahia it may not 787 kg/ha. Rio Grande do Sul, in the South region, may also record a significant increase in yield to 2, 45 kg/ha (nearly 43% over the past season) and reach a production of 7,400 tons of groundnuts. Source: http://www.conab.gov.br/OlalaCMS/uploads/arquivos/15_06_11_09_00_38_boletim_graos_junho_2015.pdf. On April 2
nd, a fire started at a fuel storage facility near Brazil’s largest port Santos. The port was unable to
ship or to discharge any kind of cargo during 10 days; groundnuts stocked nearby the port were not allowed to leave warehouses until the fire was cleared. Due to rainfall since mid of February, some harvesting has been delayed. The yield for small groundnut counts - 60/70 and 70/80, especially bird feed quality, is 35% lower than last year, whereas the yield for the bigger counts (38/42 to 40/50) and Splits has increased by 25%. Some shellers will use this opportunity to ask for shipments of splits instead of whole kernels. Despite erratic weather, Brazil expects a good crop with an output close to 500,000 tons. First shipments of the new crop should be expected end May. Several big companies stepped out of the market because they do not want to sell at lower prices. These who contracted small counts, such as 60/70 and 70/80, need to be aware of their very limited availability. Source: Aldebaran Commodities B.V. http://www.aldebaran.nl/
China
In normal years, planting in China takes place between mid-April and mid-June and harvesting between mid-September and end-October. The most recent analysis of the Chinese groundnut situation is provided by the USDA GAIN Report CH15008 “Peoples Republic of China - Oilseeds and Products Annual” issued on 3 March 2015. Production
According to preliminary estimates of USDA staff in Beijing, groundnut planted area may be 4% higher than the previous season (4.85 million ha versus 4.65 million ha), but the output could be 3% lower due to adverse weather conditions and lower yields (16.5 million tons versus nearly 17 million tons). The smaller output is likely to push prices up by 40 to 50% and increase farming profits in the large groundnut - producing provinces of Henan, Shandong, Liaoning and Hebei. On the assumption of normal weather conditions, the 2015/16 production is foreseen to recover to 16.7 million tons despite a reduction in planted area, due to a likely increase in yield.

China, PR – groundnut balance 2013/14 to 2015/16, as of 3 March 2015
2013/14
2014/15 (preliminary)
2015/16 (forecast)
USDA official
USDA staff in Beijing
USDA staff in Beijing
Marketing years: 1st October to 31 September
Area planted (1000 ha) 4,650 4,850 4,580
Area harvested (1000 ha) 4,633 4,700 4,580
Production (1000 tons) 16,972 16,500 16,700
Marketing year imports (1000 tons) 15 50 50
Total Supply (1000 tons) 16,987 16,55 16,750
Marketing year exports (1000 tons) 550 400 400
Marketing year exports to EU (1000 tons) 200 200 200
Crush (1000 tons) 8,710 8,530 8,670
Domestic consumption food use (1000 tons) 6,630 6,620 6,630
Domestic consumption feed use (1000 tons) 1,097 1,000 1,050
Total domestic consumption (1000 tons) 16,437 16,150 16,350
Total distribution (1000 tons) 16,987 16,550 16,750
Calendar year imports (1000 tons) 30 30 45
Calendar year exports (1000 tons) 550 600 600
Imports Imports of groundnuts for food use are marginal due to sufficient domestic supply. On the contrary, imports of groundnuts for crushing could rise by 30%, from 30,000 tons in 2014/15 to 45,000 tons in 2015/16, because the local supply cannot meet the growing demand for groundnut oil (averaging some 70,000 tons/year). Imports are subject to 15% ad valorem custom duty and 13% value added tax. Exports Groundnut exports are anticipated to hold steady in 2014/15 and 2015/16, at around 600,000 tons/year (that is 9% higher than in 2013/14). Policy In an effort to stimulate production and raise the domestic self-sufficiency in vegetable oils, the Chinese government implemented a planting seed subsidy for groundnuts of about 24 US$/ha since the beginning of the 2010/11 season. There have been no major significant policy changes since. Source: http://gain.fas.usda.gov/Recent%20GAIN%20Publications/Oilseeds%20and%20Products%20Annual_Beijing_China%20-%20Peoples%20Republic%20of_3-3-2015.pdf)

By end-May planting was well advanced. Despite very high local prices, plantings seemed similar to slightly higher than last season. Trade sources estimated by mid-April that the harvested area may be 3-5% lower than the past season and the quality of groundnuts less than mediocre, because of adverse weather conditions: too much rain in the southern regions, whereas in the north there was pretty much no rain. Many groundnut shipments to Europe have already been rejected because of aflatoxins contamination. By June, very small quantities of good quality, non-contaminated groundnuts were left in the market. The whole situation should have a big impact on the global trade. It is likely that China will remain a buyer in the market, focusing on the cheapest prices they can find. If monsoons are timely, Chinese importers are likely to turn to Argentina up to October and to India from November onwards. Source: Aldebaran Commodities B.V. http://www.aldebaran.nl/ and Golden Peanut and Tree Nuts http://www.goldenpeanut.com/
Gambia Groundnuts are of paramount importance to the Gambia. At present, about 45% of the agricultural land is devoted to their production. Overall, the sector employs nearly 70% of the workforce, and exports account for 66% of the total exports of agricultural products. On April 21
st, the Permanent Secretary at the Ministry of Agriculture informed about the reshuffle of the
Gambia Groundnut Corporation as National Food Security Processing and Marketing Corporation. The restructured corporation has been expanded to deal with other natural resources outside groundnuts, build warehouses and stores all over the and store and resell produce to the community at reasonable prices. Source: http://observer.gm/new-body-to-replace-gambia-groundnut-corporation/ The National Food Security Processing and Marketing Corporation announced the official start of the 2014/15 marketing season on 9th January 2015 and its closure on 31st March. The farm price has been pegged at 15,250 Dalasi/ton at seccos (buying and storing centres). Price at national depots was 16,500 Dalasi/ton, with a commission of 1,250 Dalasi/ton. This year it was targeted to sell the entire groundnut crop, i.e. 30-35,000 tons, through the Corporation. By-end January the company has pre-financed 80 Cooperative Produce Societies and 18 private traders. Despite poor rainfall at the beginning of the season, the quality of the crop this year is higher than the previous one. By end-March, farmers complained about the lack of cash at some seccos which disrupted the trade. Moreover, they protested against being prevented to sell their groundnuts to foreign buyers who were paying prices higher than the government. Therefore, by the official closure date of the season, some farmers retained their crop in order to sell it to middlemen. By mid-May, the National Food Security Processing and Marketing Corporation have announced the reduction of the price of 50kg bag of fertilizer from 1,250 to 750 dalasi. Source: https://www.cma-cgm.com/static/AfricaWatch/Attachments/com-watch-45.pdf, http://www.cma-cgm.com/static/AfricaWatch/Attachments/com-watch-47.pdf, http://en.starafrica.com/news/gambia-groundnut-trading-season-ends-tuesday.html, http://www.aaapd-africa.org/news_detail/8241 In early May 2015, The Office of the President issued a directive imposing an exchange rate overvalued by about 30%. The exchange rate directive has been highly counterproductive, as it severely eroded exports and government revenue. The fiscal position of the country has deteriorated significantly since mid-April. Source: IMF report http://www.imf.org/external/pubs/ft/scr/2015/cr15272.pdf

India Groundnut overview and crop calendar India is the second largest groundnut producer in the world after China (China is expected to produce 41% of the global output in 2015/16 and India 11%) and the leading exporter of shelled groundnuts (600,000 tons forecasted for 2015). Groundnuts account for about a quarter of all oilseeds produced in the country. The main producing States are, by order of importance, Gujarat, Andhra Pradesh, Tamil Nadu, Karnataka and Maharashtra. Production is highly vulnerable to rainfall deviations and displays huge fluctuations from year to year, as more than 90 % of the planted area is cultivated under rain fed condition. The remaining 10% of the groundnuts are cultivated under irrigation, as a summer crop, from January to May. This year, kharif groundnut sowing started by mid-May in the Rajasthan region (second largest peanut belt in India, in particular for Bold variety) under abundant rains. The harvest is expected during October and the first export shipments are foreseen from November/December onwards.
Out of the 5, 2 million tons of groundnuts expected to be produced in 2014/15, about 67% should be crushed to oil and meal, 13% should be used for direct consumption as edible nuts; 10% should be used as seed and for other industrial uses, and 9% exported as shelled products.
Exports are mainly destined to Indonesia, Malaysia, Philippines, Vietnam and Thailand.
Sources: 1. http://www.aldebaran.nl/,
2. http://articles.economictimes.indiatimes.com/2015-06-23/news/63746051_1_groundnut-oil-tonne-
govindbhai-patel,
3. http://www.agrochart.com/en,
4.http://faostat3.fao.org,https://www.quandl.com/data/FAO/FAO_100INDIA2556GROUNDNUTSSHELLEDE
Q-Food-Balance-Sheets-Groundnuts-Shelled-Eq-India,
5.http://gain.fas.usda.gov/Recent%20GAIN%20Publications/Oilseeds%20and%20Products%20Annual_New
%20Delhi_India_4-14-2015.pdf
Abolishment of the compulsory registration rule for export-oriented groundnut shelling units might increase shipments from India The Union Commerce Ministry has abolished the compulsory registration rule for groundnut shelling units to export to countries outside the European Union. The move, industry sources say, might increase shipments from India. Till now, exporters had to buy groundnuts from the shelling units registered with the Agricultural and Processed Food Products Export Development Authority (APEDA); the shelling units had to get themselves registered through the Indian Oilseed and Produce Export Promotion Council. This rule was applicable in

2013. However, many shelling units from Gujarat and Andhra Pradesh had opposed this rule and were engaged in several discussions with commerce ministry and APEDA pressing for its removal. By mid-March the rule was removed. Source: http://www.business-standard.com/article/markets/compulsory-registration-rule-relaxed-for-groundnut-exports-115031200189_1.html Groundnut balance at the beginning of April 2015 The situation of Indian oilseeds, including groundnuts and the groundnut balance, is covered in USDA/GAIN report IN5049 “India - Oilseeds and Products Annual 2015” published on April 4
th.
India - groundnut balance as of April 2015
2013/14 USDA staff India
2014/15 preliminary USDA staff India
2015/16 forecast USDA staff India
Marketing year begins in October
Area planted (1000 ha) 5,400 4,560 5,200
Area harvested (1000 ha) 5,400 4,600 5,200
Beginning stocks 18 139 215
Production (1000 tons) 6,500 5,200 5,915
Marketing year imports (1000 tons) 1 1 0
Total Supply (1000 tons) 6,519 5,340 6,515
Marketing year exports (1000 tons) 580 475 600
Crush (1000 tons) 4,600 3,500 4,500
Domestic consumption food use (1000 tons) 600 650 700
Feed waste* domestic use (1000 tons) 600 500 550
Total domestic consumption (1000 tons) 5,800 4,650 5,750
Ending stocks 139 215 165
Total distribution (1000 tons) 6,519 5,340 6,515
Calendar year imports (1000 tons) 1 0 0
Calendar year exports (1000 tons) 477 400 600
* Waste” broadly includes seeds retained for planting/replanting, as well as feed and industrial uses Deficit rainfall during the 2014/15 southwest monsoon resulted in a sharp drop in groundnut output to 5.2 million tons, 20% lower than in the previous season. Strong market prices for groundnuts should support more planting in 2015/16 (14% over last season) and point to an increased production to 6.3 million tons. Groundnut exports are foreseen to rise to 600,000 tons in the marketing year 2015/16. Indian Hand Picked Select (HPS) peanuts have a strong demand in Southeast Asia and countries neighbouring India.

Source: http://gain.fas.usda.gov/Recent%20GAIN%20Publications/Oilseeds%20and%20Products%20Annual_New%20Delhi_India_4-14-2015.pdf Minimum support prices for in shell groundnuts and APEDA interventions The Agricultural and Processed Food Products Export Development Authority (APEDA) and the Indian Oilseeds and Produce Export Promotion Council (IOPEPC) are jointly working towards the increase of international awareness of Indian groundnut offer and addressing quality-related concerns. APEDA has issued export guidelines for groundnuts and groundnut products, and provides information on registration of groundnut processing units and/or warehouse, as well as on the issuance of export certificates by IOPEPC. Details can be accessed from APEDA website http://apeda.gov.in/apedawebsite/GroundNut/GroundNut.htm. Minimum support price for in shell groundnuts remained at 4,000 Rupees/100 kg since the past season, although the market price this season is 11% higher than in 2013/14.
Minimum support price1, Rupees/100 kg Market price
2 2014/15
(versus 2013/14) 2012/13 2013/14 2014/15
In-shell groundnut 3,700 4,000 4,000 4,000-4,300 (+ 11%) 1Minimum Support Price information at http://eands.dacnet.nic.in/Archive/MSP29102014.pdf
2Average wholesale market price (Rupees/quintal) across major trading centres
Source: Government of India - Directorate of Economics and Statistics and Directorate of Agricultural Marketing, Central Government program to create a national common market in agricultural products The Indian Central Government earmarked at the beginning of June a fund of 31.2 million US$ for a program aiming at supporting the State Governments to reform the wholesale marketing system, in order to break traders’ oligopoly and help create a national common market in agricultural products, The program should be implemented over three years from 2015-16 onwards and identify 50 regulated wholesale markets (mandis) to be initially reformed across 10 states, including groundnut mandis (such as (Rajkot, Shahabad, Bikaner, Saurashtra, etc.). Gradually, all the 585 mandis in the country would be included in the program. The reforms should positively affect the groundnut wholesale markets: they will have to switch to modern practices such as a single trading licence for the entire region, single-point levy of market fee (mandi tax) and electronic auction for price discovery. Each mandi will get about 45,000 US$ equivalent to purchase the hardware needed for electronic auctions. Source: http://www.business-standard.com/article/economy-policy/centre-might-identify-50-mandis-in-10-states-for-reform-115060100027_1.html Summer rain may favour groundnut crop growing According to an Agriculture Department Official, unseasonal rainfall between the beginning of March and mid-April may prove beneficial for the groundnut crop which is in growing stage. This is particularly true for Gujarat, as the State has received insufficient rainfall last year. Source: http://www.business-standard.com/article/current-affairs/summer-rain-may-damage-vegetables-but-aid-oil-seed-crops-115041301200_1.html IOPEPC estimates 52% reduction in summer groundnut output in Gujarat Summer groundnut output in Gujarat (the largest producer of groundnut during summer) will be down by 52.5% this year, according to a survey conducted by the Indian Oilseeds & Produce Export Promotion Council (IOPEPC) by mid-May 2015. The output was estimated at about 91,966 tonnes, as against 193,258 tonnes in 2014. However, according to trade estimates, production may not exceed 75,000-78,000 tons.

According to government data, the acreage under groundnuts was lower by 45% during summer 2015 at 49,300 hectares, compared to 89,500 hectares in 2014. Yield has decreased about 14% to 1,865 kg/ha, 2,159 kg/ha in 2014. Many farmers could not be provided with the required amount of irrigation, which contributed to lower yields. Moreover, due to non-availability of best-adapted quality seeds (recommended varieties TG-37 and TPG41), farmers used lower-yielding seeds (GG2 and J11 varieties). According to IOPEPC, Indian groundnut exports from April 2014 to February 2015 amounted to 646,114 tons, while shipments during April 2013 to February 2014 stood at 509,515 tons. Source: http://www.business-standard.com/article/markets/iopepc-estimates-52-reduction-in-summer-groundnut-output-in-gujarat-115052201826_1.html Groundnut exports India retains its position as largest exporter of groundnuts in world. According to the Chairman of the Indian Oilseed and Produce Export Promotion Council, exports recorded a substantial increase of 38.97% in quantity and 46.67% in value this financial year (April 2014 to March 2015) over the previous one. The volume of exports rose from 509,000 to 708,000 tons, valued at 7.2 billion US$ in 2015, versus 4.9 billion US$ in 2014. The monitoring and enforcement of quality controls, the good crop quality and a robust international demand contributed to India’s export performance. Lower freight rates and weaker rupee also helped exports. Vietnam, Indonesia, Malaysia and the Philippines are accounting together for about 71% of the total Indian exports of groundnuts. The Indian Oilseed and Produce Export Promotion Council organized workshops for spreading awareness related to the upgrading of export –oriented groundnut processing units, as well as to the menace of aflatoxins contamination, with the support of the APEDA. It also participated in the fixation of Codex standards for ‘Ready to Eat Peanuts’, and issued Export Certificates and Units Registration as per APEDA-mandated procedure. Source: http://www.iopepc.org/chairman-agm-speech.pdf Groundnut kharif plantings this season may rise by 25% According to data of the Department of Agriculture, plantings of groundnuts by mid-June 2015 (kharif season) are thought to have reached 136,000 ha, against 79,000 ha by mid-June 2014, which is an increase of 72%. Good groundnut prices last year have been the reason for the expected higher groundnut acreage this year; mainly cotton farmers will switch over to groundnut. On the basis of current progress of sowing and the assumption of a continuing favourable monsoon, the total groundnut plantings are likely to rise by 25%. A clear picture will only appear by mid-July. Plantings in Gujarat, the largest groundnut-producing State in India, amounted to 60,400 ha, slightly down the 64,000 ha. of last year. Sowing in Andhra Pradesh and Telangana has risen marginally to 28,800 ha, from 28,000 ha last year. Plantings have also increased from 8,000 ha to 19,000 ha in Tamil Nadu. Although it is among the major groundnut producing states, Karnataka has seen a slow start in planting (27,000 ha against 43,000 ha the past year). The Central Organisation for Oil Industry & Trade has estimated kharif groundnut production at 3.57 million tonnes for 2014/15, down by 1.14 million tons from the output of 4.71 million tons in 2013/14. According to data of the Agricultural and Processed Food Products Export Development Authority, India has exported 708,386 tonnes of groundnuts during 2014/15 season, against 509,664 tonnes in the previous one. Source: http://www.business-standard.com/article/markets/groundnut-sowing-area-may-rise-by-25-115062300971_1.html

Groundnut exports to rise by 40% in 2014-15 According to trade, the lower groundnut price in the domestic market in comparison with the international market and the good demand for the Indian product may result in a 40% increase in 2015 exports. During November 2014 and March 2015, the average price of Indian groundnuts in international market was quoted between 600 and 800 US$/ton, whereas in domestic market they ranged between 850 and 1,050 Rupees/20 kg (675 and 835 US$/ton equivalent). Usually, India exports mostly Java and Bold varieties. This year, demand for Bold is good, especially from China. Source: http://www.business-standard.com/article/markets/groundnut-exports-rise-by-40-in-2014-15-115070301200_1.html
Senegal
Senegal is the world leading exporter of groundnut oil. Groundnuts are grown on about 40% of the cultivated land, employing some 60% of the rural population (over one million people). The crop is the main source of cash income for rural farmers in the groundnut basin. The economic and commercial activities related to groundnut cultivation and trade take place in both the formal and the informal sectors. In an average year, 60 to 70% of the groundnut production is sold through formal channel to the three big export-oriented industrial crushers: SUNEOR, NOVASEN and CAI Touba. Farm prices for sales through the formal sector are fixed for each marketing period (October to April) by the Government and the National Inter Professional Groundnut Committee (CNIA). The remaining 30 to 40% of the crop is sold through informal channels. Unlike the formal sector, informal channel prices are free; producers may sell the crop at any time of the year, at prices which are generally higher than the formal price for crushers. Cropping season 2014/15 The main constraints in the implementation of the 2014/15 groundnut crop are related to the late start of the rainy season, the deficit in rainfall and the insufficient and belated provision of inputs and agricultural equipment due to operators’ failure. The lower than normal rainfall activity and soil water deficits prevented the proper maturing of the crop in all farming areas. The smaller planted areas compared to 2013/14 season (- 4%) and the lower average yield (- 3%) translated into a production shortfall of 1% compared to the previous season and 21% less than the average of the past 5 seasons. The 2015/16 groundnut output is foreseen to reach 725,000 tons. Following are the official estimates of the Ministry of Agriculture, Direction of forecast analysis and statistics for the 2014/15 season, compared with the average groundnut crop performance in 2013/14 and during the past 5 seasons.
Planted surface, ha
Average yield, Kg/ha Production, tons
2014/15 season 878 659 762 669 329
2013/14 season 916 750 739 677 456
Average past 5 seasons 949 228 875 843 413
2014/15 vs. 2013/14, % -4 - 3 -1
2014/15 vs. past 5 years average, % -7 -13 -21
Crushing 2014/15 386
Crushing 2013/14 414
Average past 5 seasons 453
2014/15 vs. 2013/14, % -7
2014/15 vs. past 5 years average, % -15
Source: MA/DAPS Ministry of Agriculture, Direction of forecast analysis and statistics, ISSN 0850 -1467 http://www.ansd.sn/ressources/publications/Bulletin_avril_2015.pdf

Marketing season 2014/15 The groundnut marketing season which started at end-December 2014 and was supposed to be closed by end-March was still slowly on-going by end June. The campaign is marked by difficulties related to both local market constraints and to evolution of international market demand for crushing groundnuts. The local market constraints include bank delays and insufficient financing of crushers for groundnut purchases, the strong influx of producers/traders to informal markets, as well as technical and administrative difficulties of Suneor in receiving and disposing of groundnut deliveries. Moreover, the limited ability of major dealers to obtain needed financing caused them to default on payments, causing many groundnut farmers to sell their crop on weekly markets in Tambacounda and Kolda at prices 12.5% to 25% lower than the official prices of respectively 150 and 175 FCFA/kg. In order to facilitate the campaign, the Government has disbursed 11.5 billion FCFA (19.6 million 19.6 million US$) for marketing in accordance with the memorandum of agreement between crushers and the authorities. In addition, an agreement has been signed with China, which allowed Chinese traders to purchase groundnuts in Senegal, despite the opposition of several sector stakeholders fearing a subsequent rise in market speculation. According to the Director of Agriculture, the 2014/15 marketing season has been greatly facilitated by the financial support extended to crushers and the export of crop to China, Tunisia, Morocco, Vietnam and Congo. As far as the international groundnut market constraints are concerned, groundnut demand for edible use and for crushing in 2013/14 was lower than in previous years, due to sufficient crop availability in consumer countries including China (the largest world importer of groundnut oil). Therefore, international groundnut markets have experienced low prices at the beginning of the 2014/15 season (by early 2014 they were 38% below the 2013 level). In Senegal, these developments coincided with the rise of the minimum groundnut farm gate price at 200 FCFA/kg (5% above 2013). This resulted in low profit margin for oil mills, as the price of their groundnut raw material was too high relative to sale price of groundnut oil on the international market. To minimize their losses, the crushers have decreased significantly their purchases during the marketing period October 2014 to April 2015. In 2014/15 season, oil millers are thought to have processed 386,000 tons of groundnuts via formal channels, or 47% of their total needs, providing farmers with a cash income of about 104 million US$ (61 billion FCFA). The quantity of groundnuts purchased is estimated to be 7% lower than in 2013/14 and 15% lower than the average of the past 5 seasons. World Bank projections are not foreshadowing significant changes in the dynamics of international oil markets. This situation should contribute to a continuation of weak groundnut demand for industrial use and low groundnut producer prices in Senegal. Although planting are not expected to start before June, it is likely that farmers would reduce the planted areas in favour of cereals. Sources: http://www.ansd.sn/ressources/publications/Bulletin_avril_2015.pdf, http://www.ipar.sn/fr/evaluation-de-la-campagne-agricole-2014-2015-%C2%AB-les-r%C3%A9sultats-sont-tr%C3%A8s-rassurants-%C2%BB-selon-dogo-seck, http://reliefweb.int/sites/reliefweb.int/files/resources/Senegal%20Mise%20a%20jour%20sur%20la%20securite%20alimentaire%20Mai%202014.pdf, http://econ.worldbank.org/WBSITE/EXTERNAL/EXTDEC/EXTDECPROSPECTS/0,,contentMDK:21574907menuPK:7859231pagePK:64165401piPK:64165026theSitePK:476883,00.html, http://www.tradefm.net/redaction/?p=33950, http://www.riadinfos.com/?p=421

Cropping season 2015/16 On May 15th, the Government took the decision to prohibit exports of groundnut seed in order to lessen the risk of seed shortage at the beginning of the cropping season. On June 30th, the Minister of Agriculture and Rural Equipment met the Cropping Season Monitoring Committee, which evaluated the start of the 2015 groundnut cultivation campaign. The commission established that 80% of the planned amount of seed has already been distributed to farmers and planted. Some delay has accumulated in the distribution of fertilizers due to a poor organization of distributors. The government set also up a groundnut seed subsidy at 50% of the market price: seeds are sold to farmers at 350 FCFA/kg, against the market price of 500-750 FCFA/kg. However, the provision of seeds has been delayed in some regions and the quota per farmer is low. Sources : http://www.seneweb.com/news/Agriculture/demarrage-campagne-agricole-2015-80-des-_n_158348.html, http://www.igfm.sn/index-261/
South Africa The voluntary association of grain farmers Grain SA overviewed by mid-April the South African groundnut industry from a production, consumption and export market perspective. In a nut shell, the industry has not performed well due to erratic production, low groundnut yields and low price competitiveness on the international market. The local groundnut consumption was faced with a downward trend, being highly price-elastic and decreasing with the rise in import prices. Production South African groundnut production in 2014/2015 amounted to 74 500 tons, which is 80% higher than the previous season. This increase was due to an expansion of the planted acreage from 46 900 ha in 2013/14 to 52 125 ha. South Africa has enjoyed good weather during harvesting which is still underway. The latest June estimate put the groundnut output this season at 62,855 tons, but trade consensus sees it probably closer to 55,000 tons. Quality so far looks good, but the drought certainly affected yields and the maturity of the crop. A larger than normal part of the crop is expected to be 70/80 grades and smaller. Very little quantities of groundnuts are left for export; with such a small crop, South Africa will import. Nevertheless import rules have changed this year, and blanched product will command as well a 10% duty. Consumption and correlation with prices From 2004/2005 to 2015/2016, the South African population grew by 16%, being now estimated at 54 million people. This growth, coupled with the increasing middle-class, affected positively the demand for groundnuts. In South Africa, groundnuts are mainly consumed as edible nuts and as processed peanut butter. The annual peanut butter consumption has been fairly stable during the 2000/01 to 2010/11 period - just below 24 000 tons, but grew up to 27 641 tons in 2014/2015. The edible groundnut market was also stable up to 2010/11, but declined significantly (by 47%) during the following three seasons. This was largely due to increased prices in the domestic market. From 2010 to March 2015, domestic producer prices increased 23 times, from 500 to 11 500 Rand/ton for Choice grade groundnuts. Prices for Sundry grades rose by 40% (from 2 500 to 3 500 Rand/ton) and these for Crush grades by 129% (from 3 500 to 8 000 Rand/ton).

Foreign trade Groundnut exports have not benefited for the rise in global demand, decreasing threefold - from 29 655 tons in 2010 to 9 844 tons in 2014. The leading South African export markets were Mozambique, Japan, Netherlands, Belgium, Egypt, United Kingdom, Norway and Swaziland. Likewise, imports decreased by 17%, from 12 534 tons in 2010 to 10 395 tons in 2014. The main import sources were Namibia, India, Mozambique, United States, Zambia, Malawi and China. Sources: http://www.grainsa.co.za/grain-market-overview-2 and Tree Nuts http://www.goldenpeanut.com/
United States of America Farm Bill Conservation Requirements The Peanut Grower issue of March 2
nd provided information on the Farm Bill Conservation requirements.
The 2014 Farm Bill continues to request producers to adhere to conservation compliance guidelines in order to be eligible for most programs administered by FSA and NRCS. This includes financial assistance foreseen by the New Price and Revenue Protection Program, the Conservation Reserve Program, the Marketing Assistance Loans and many others. It also includes the Environmental Quality Incentives Program, the Conservation Stewardship Program and other conservation programs implemented by NRCS. In order to be eligible for premium support on their federal crop insurance, farmers are required to have the Highly Erodible Land Conservation and Wetland Conservation Certification (AD-1026) on file. When a farmer submits a completed AD-1026 certification form, FSA and NRCS staff should review the associated farm records and outline any additional actions that may be required. FSA recently released a revised form AD- 1026, which is available at USDA service centres and at www.fsa.usda.gov. The deadline is June 1, 2015. Seed Prices Announced Producers are planning the seed quantities needed and are contacting their seed dealers. Some seed dealers published prices when contracts became available, while others are waiting. Runner prices announced were as follows: certified non high oleic seed at 67 cents/lb. cash to grower and 70 cents/lb. fall payment; registered non-high-oleic varieties at 69 cents/lb. cash to grower and 72 cents/lb. fall payment; high-oleic certified varieties at 70 cent/lb. cash to grower and 72 cents/lb. fall payment; registered high-oleic seed at 72 cents/lb. cash to grower and 75 cents/lb. fall payment. Source: http://www.peanutgrower.com/news-briefs/farm-bill-conservation-requirement/ Groundnut planting intentions by end March 2015 USDA estimated an increase in area under groundnuts in 2014/15 by 9% over the previous season, up to 1.48 million acres. The expected increase is due mainly to lower prices of land-competing crops, cotton in particular, and the Farm Bill changes in cotton base (called generic base) which allows producers to cultivate cotton under another crop program. USDA estimates of groundnut planted area by States, as of 31
st March 2015, in 1000 acres
State 2012/13 2013/14 2014/15 2014/15 vs.
2013/14
Alabama 140 175 185 + 6%
Florida 140 175 160 - 9%
Georgia 430 600 720 + 20%
Mississippi 35 32 33 + 3%
New Mexico 7 5 5 0
North Carolina 82 94 94 0
Oklahoma 17 12 19 + 58%

State 2012/13 2013/14 2014/15 2014/15 vs.
2013/14
South Carolina 81 112 115 + 3%
Texas 120 130 130 0
Virginia 16 19 20 + 5%
USA total 1,191 1,354 1,481 + 9%
2014 and 2015 groundnut supply and demand highlights The University of Georgia (Extension Peanut Team) is often undertaking updates of US groundnut situation. Sponsored by the Georgia Peanut Commission, these updates aim at providing groundnut producers with information that can be used in the upcoming growing seasons to make cost-effective management decisions. Below are their estimations of 2014/15 and 2015/16 groundnut situation as of beginning April 2015. 2014/15 planted acreage to rebound over the past season and the 2015/16 acreage to increase by at least 10%. US groundnut planted acreage in 2014/15 increased by 26% over the past season, up to 1.34 million acres, reflecting lower prices of corn, cotton and soybeans relative to groundnuts, a return to normal rotations, the passage of the 2014 Farm Bill and the crop insurance projected price at 534 US$/ton. Two main factors are weighing the 2015/16 outlook for groundnuts. One is their low prices relative to land-competing crops, cotton in particular. The other one is the entry into force of the 2014 Farm Bill which allowing that groundnuts can be grown on generic base (old cotton base) in anticipation of payments related to the Price Loss Coverage Program. Given these factors, groundnut acres are expected to increase at least by 10%, to 1.47 million acres; 2014/15 average yield to fall, but still remain the 3rd best compared to the previous two years. 2015/16 yield foreseen to remain unchanged
The average 2014/15 US and Georgia groundnut yields are expected to be lower compared to the previous two seasons (by 3.5% to 3,85 lbs. / acre, and by 7.4% at 4,10 lbs. / acre respectively), but remain the 3rd best on record. Based on trend, the 2015/16 yield is projected at 3, 85 lb. / acre;
Total US groundnut production estimated at 2.53 million tons in 2014/15 foreseen to rise by 9% in 2015
Total US production of groundnuts in 2014/15 season is estimated at 2.53 million tons, on 1.3 million harvested acres. The expectation for much of 2014 was for groundnut production to exceed 2.6 million tons; however, it fell short of expectations because of lower average yields. On the assumption of a 10% increase in plantings and of an average yield of 3, 85 lb. /acre, the projected size of the 2015 crop would be 2.77 million tons;
Total groundnut use in 2014/15 down by nearly 2% over both the previous season and the 2015/16 forecast.
Total groundnut use in 2014/15 is projected to fall by nearly 2% below the previous season record of 2.588 million tons, while the 2015/16 use may increase by 2.2% to nearly 2.60 million tons;
Crushing
The Southeast region has experienced a larger than normal level of Segregation I groundnuts (farmers stock groundnuts free from visible Aspergillus flavus mould, with at least 99% groundnuts of one type), Segregation II groundnuts (farmers stock groundnuts free from visible Aspergillus flavus mould, with less than 99% peanuts of one type) and Segregation III groundnuts (farmers stock groundnuts with visible Aspergillus flavus mould, for non-edible market use). Therefore the volume of groundnuts crushed for oil could increase above the past season level;

Seed and residual use As planted acres to groundnuts are expected to increase in 2015, seed use should increase also. Residual use could also increase with a larger crop. Thus, a new record use is not out of the question given low shelled prices and an abundant groundnut supply; Plenty of groundnuts to carryover
Stocks of groundnuts carried over into the next marketing year are large as a result of high yields of the last two years. Production in 2013 fell short of consumption, leading to a carryover stock of 929,000 ton on August 1, 2014. The ending stocks for the 2014 crop are projected to not change much; Exports
Total exports reached 600,000 tons after China purchased U.S. groundnuts in 2012/2013. Exports to Europe increased to 550,000 tons in 2013/14 season, while China exited the market quickly and stopped purchasing US groundnuts. Subsequently, export destinations diversified to Canada, Mexico and Europe and are projected to reach 500,000 tons in 2014/15. USDA groundnut supply and demand estimates and 2015 projections (tons)
2012/13 2013/14 2014/15 estimate 2015/16 forecast*
Beginning Stocks 502 1,386 929 946
Production 3,382 2,087 2,523 2,768
Total supply 3,943 3,517 3,484 3,746
Total use 2,557 2,588 2,539 2,596
Ending stocks 1,386 929 946 1,150
*Forecast assumptions for 2015: + 10% acres and + 2.2% use Source: Economic Research Service, USDA
Groundnut farmer stock prices not expected to move much Farmer stock prices in Southeast and Georgia were settled in 2014/15 at around 425 US$/ton for Runners. They are expected to start at 400 US$/ton in 2015/16, but may fall if the planted acreage should rise above 1.4 million. Source: http://www.gagroundnuts.com/growerinfo/2015_ugagroundnutupdate.pdf

Groundnut management calendar 2015 On June 1
st, the Peanut Grower magazine published the 2015 groundnut management calendar.
Source: http://www.peanutgrower.com/feature/peanut-management-calendar/

Russian import ban on groundnuts from USA
In 2014, about 15,000 tons of groundnuts went to Russia, equivalent to 3% of the total US groundnut exports.
The Russian Federal Service for Veterinary and Phytosanitary Surveillance (http://www.fsvps.ru/fsvps/main.html?_language=en) introduced a ban on imports of groundnuts from the United States starting May 1, 2015, because of the perceived excessive content of cadmium. Groundnuts shipped before May 1 could be imported only after laboratory tests confirm the compliance of each single batch of the product.
The American Groundnut Council declared that they had not received any official notification, and responded: “U.S. groundnuts meet all food quality standards. Cadmium has not been a health concern in the United States and there is no established standard.”
Source: http://www.groundnutgrower.com, June 1st 2015
Groundnut crop outlook at the beginning of June 2015 In its “Oil Crops Outlook” report issued on June 15, USDA estimated the acreage sown to groundnuts this season very close to its typical pace, at 92%.

Groundnuts: US supply and disappearance as of June 7, 2015
Area
Yield
Supply Disappearance
Year start
Planted Harvest Beginning
Product. Imports Total Domestic
Crush
Seed and
Exports Total Ending
1-Aug stocks food residual stocks
1,000 acres lb./acre Million pounds
2013/141 1,067 1,043 4,001 2,771 4,173 88 7,032 2,886 663 530 1,096 5,174 1,858
2014/152 1,354 1,325 3,932 1,858 5,210 80 7,148 2,964 662 524 1,110 5,260 1,888
2015/162 1,481 1,451 3,980 1,888 5,775 85 7,748 3,054 722 561 1,135 5,472 2,276
1 Estimated
2 Forecasts
Sources: USDA, National Agricultural Statistics Service, Crop Production and Groundnut Stocks and Processing, and U.S. Department of Commerce U.S. Census Bureau - Foreign Trade Statistics. Last update 6/12/2015, at http://www.ers.usda.gov/media/1852993/ocs-15f.pdf Groundnut crop progress by mid-June 2015 In its “Crop progress report” released on 15 June 2015, USDA/NASS estimated the acreage already planted with groundnuts in the 8 States cultivating the crop at 96%. About 32% of the planted crop was at pegging stage, against 25% in 2013/14. On the average, 11% of the crop was in excellent condition, 61% in good condition, 26% in fair condition and 2% in poor condition. Source: http://usda.mannlib.cornell.edu/usda/nass/CropProg//2010s/2015/CropProg-06-29-2015.txt Groundnut planting and harvest situation by end-June 2015 According to USDA/NASS acreage report released on June 30, by that date groundnuts have been planted on 1.354 million acres and harvested on 1.325 million acres. Area planted and harvested in 2015/16 is forecasted to increase by 18%. Source: http://www.usda.gov/nass/PUBS/TODAYRPT/acrg0615.pdf

Groundnut stocks and processing by end-June 2015 The situation of groundnut stocks and processing was estimated in USDA/NASS “Peanut Stocks and Processing” report ISSN: 1949-1875. Apparent disappearance of milled groundnut products by month - June 2015, in 1000 lb. with comparisons, including in transit, exports, and domestic use; blank data cells indicate that estimation period has not yet begun
At month end
Shelled groundnuts
Roasting stock
Crude groundnut oil
1
Cake and meal
1 Edible
grades Oil
stocks Total
2014
August 264,638 35,934 300,572 25,002 17,596 22,494
September 262,305 36,381 298,686 20,409 16,152 25,900
October 226,263 25,961 252,224 32,666 20,257 24,350
November 232,770 35,105 267,875 16,947 18,667 19,974
December 280,356 25,289 305,645 19,987 19,150 18,861
2015
January 214,234 30,242 244,476 26,607 15,348 24,273
February 278,522 30,364 308,886 15,873 15,242 22,686
March 289,616 29,638 319,254 22,988 16,599 23,824
April 271,162 38,094 309,256 27,767 22,497 26,349
May 263,639 36,470 300,109 24,957 18,080 22,569
June 249,850 32,317 282,167 27,254 19,493 23,877
2014
June 287,659 32,196 319,855 26,796 19,437 22,767
2014/15
August to June 2,833,355 355,795 3,189,150 260,457 199,081 255,157
2013/14
August to June 2,815,524 358,116 3,173,640 296,726 194,379 253,886
1 Relates to oil mills only.
Monthly use of shelled (raw basis) and in-shell groundnuts by month, as of June 2015, in 1000 lbs., with comparisons and excluding groundnuts milled for seed
Month ending
Edible grades used in products1 All shelled
groundnuts crushed
5
In shell groundnuts
6 Candy
2 Snacks
3 Butter
4
Other products
Total
2015
August 28,821 37,983 107,411 5,083 179,298 228,608 11,441
2014
August 32,783 35,829 109,532 2,797 180,941 227,279 10,726

1 Shelled edible grades include blanched and shelled roasted peanuts converted to a raw basis using
conversion factors of 1.08 and 1.12, respectively 2 Includes peanut butter made by manufacturers for own use in candy
3 Includes salted, unsalted, dry and honey roasted, salted and unsalted roasted, snack bars, and trail mixes
4 Includes peanut butter made by manufacturers for own use in cookies and sandwiches, but excludes
peanut butter used in candy 5 Includes all shelled peanuts crushed regardless of grade
6 Includes peanuts re-packaged, roasted in shell, salted in shell, and raw in shell
Source: “Groundnut Stocks and Processing” ISSN: 1949-1875 of July 30, 2015 http://www.usda.gov/nass/PUBS/TODAYRPT/pnut0915.pdf Groundnut yield and production at the beginning of July 2015 According to information provided by USDA in its “Crop production” report released on July 10
th, the US
groundnut yield in 2014 averaged 4.41 tons/ha. The 2015 crop was not yet planted. The production of groundnuts in 2014 was estimated at 2.36 million tons. Source: http://www.usda.gov/nass/PUBS/TODAYRPT/crop0715.pdf An unusual beginning begs for a calm ending of the 2015 groundnut season The U.S. groundnut industry has experienced an unusual start for 2015. Seed quantities were good and quality was mostly good as well. There were some problems getting accurate information on germination and the process was slower than normal. Weather was most unusual in Texas with flooding during planting season and in the Southeast, where 80% of groundnuts are grown, no rains came until early June. Georgia and South Carolina had the driest May in history, but are starting to get scattered showers and seasonal afternoon thunderstorms since the beginning of July. The groundnut market will likely remain quiet until the industry has a better handle on acreage. Until then, sunshine has arrived; while farmers feel that the season is late, researchers and extension specialists assure them the delay is okay. Most planting decisions have been made on the basis of the calculation of the best planting ratio to maximize Farm Bill participation.
Normally, groundnut should have been competing with other crops for land. This season however, corn and cotton acreage have been reduced in the Southeast because of low prices and wet fields. Farmers were hoping for a groundnut price of 70 cents /lb. before planting, but they reconsidered it at about 66 cents/ lb. Lower profitable prices for alternate crops will favour more groundnuts planting this season.
Main groundnut market indicators as of 2nd
June 2015:
2015 USDA Acreage estimate up 9% to 1,48 million acres 2015 Production estimate on 3,98 lb. /acre yield at 2,89 million tons 2014 Market Loan: 2,12 million tons in storage 2014 Market Loan outstanding: 61%, that is 826,356 tons 2014 Loan by type, in tons: Runners - 561,631; Virginias - 248,443; Spanish - 14,025; Valencias -
2,257. 2014-15 Domestic usage over past 9 month up 5.4% 2014-15 Exports over past 8 month up 10.5% National Posted Price by type, in US$/ton: Runners 424.86; Spanish 403.91; Virginia/Valencia
427.79.
Planting deadline
The final planting deadline is the last date a groundnut producer may plant; the acreage at that date is eligible for full crop insurance coverage, or the payment of 100% of the production or revenue guarantee. The farmer is not required to plant after the date, but may do so at a reduced coverage of 1%/day through the late-planting period. The final planting date was May 31 in some counties including Georgia, and June 5 in the others. The late-planting period can continue until June 15 for all areas. Farmers can still plant groundnuts after June 15, but the guarantee drops to 50%. If the farmer is unable to plant by the final

planting date, he may file for “prevented planting” and must do so within 72 hours after the final planting date.
Help from the groundnut program
The projected price loss coverage payment for 2014, which comes in October to the base holders, will be important to bankers and financial companies. USDA has its own system of calculating the annual average price of groundnuts, but this is a fair explanation or guess. This estimate is before sequestration (if applied) and the 85% factor. Considering the published weekly prices of groundnuts since Aug. 1, 2014, the marketing year average of groundnuts is 438 US$/ton. The current estimated PLC payment for groundnuts is calculated by subtracting the marketing year average from the statutory reference price: 535 US$/ton –438.15 US$/ton = 96.85 US$/ton. The final payment rate for 2014 will not be determined until after July 31, 2015. Payments for the 2014 production year will not be paid until October 2015.
Planting acreage and yield
Acreage is the number one factor in buying groundnuts for next season. USDA estimated a 9% increase of the groundnut acreage versus the past season, up from 1, 35 million to 1, 45 million acres. Farmers must report the planted surfaces by July 15. The average yield was estimated at 3, 98 lbs. /acre, which would result in a total crop of 2, 89 million tons. That is a 9.9% increase over the past season.
Demand and exports
USDA predicts a rise in domestic demand of 3% and a growth in exports of 2.2%. Because of a strong local market demand, the usage of peanut butter is up 5.4% through the first six months of 2015. Exports have also trended upward, up 10.5% during this period.
Market Coverage
With all the unknowns and rumours of acreage increases, most farmers and shellers shellers have already booked this season groundnut crop. Farmers covered mostly at 400 US$/ton on Runners, 425 US$/ton on High Oleic Runners, 425 US$/ton on Virginias and 450 US$/ton on Spanish. Food manufacturers have booked forward into 2016 with prices of shelled peanuts from 45 to 52 cents/lb. Shellers are caught in the middle, hoping that excess groundnuts will not push prices lower.
2016 worries
The entire industry worries that excessive plantings could cause the market to shut down, by clogging up the groundnut pipeline for 2016. An eventual re-estimation of 25% increase of plantings to 1.65 million acres and a yield of 3.95 lbs. /acre would result in an output of 3.27 million tons of groundnuts. That’s a half-million tons over the current demand of 1 million tons.
Storage would also be a big problem: shellers would need warehouses for the 2016 crop; the government would start accepting forfeitures with nowhere to go; and prices for 2016 would fall to 355 US$/ton. In this case, farmers would need bank loans to keep their farms afloat.
Source: http://www.peanutgrower.com/market-watch/1232/
Vietnam
Vietnam groundnut production continues to fall well below demand from the food industry due to low yields and strong land competition from other crops, such as corn or cotton. This competition will get fiercer in the future, as the Ministry of Agriculture and Rural Development has approved the commercial cultivation of genetically improved corn varieties. According to USDA/ GAIN Report (VM 5019) “Vietnam oilseeds and products annual 2015” published on 10 April 2015, groundnut production and consumption are foreseen to increase in 2015/16 over the previous two seasons.

The Government Statistical Office and the USDA staff in Hanoi are forecasting an extension of cultivated area to 215 000 ha in 2014/15 (nearly 3% over the previous season). Favourable weather conditions, the rise in the cultivated area and the use of improved groundnut varieties may boost the 2015/16 production by about 4%, up to 484 000 tons. The Vietnamese domestic output falls short of the local groundnut consumption, by about 65%, with imports completing the remaining consumption requirements. The majority of groundnuts locally produced and imported are used in the snack and confectionery manufactures; small quantities of in-shell nuts are used for household consumption and the extraction of oil. The domestic demand in 2015/16 is foreseen to grow up to 760,000 tons, a 5% increase over the past season. Vietnam: groundnut
* balance 2013/14 to 2015/16
2013/14 2014/15
(preliminary) 2015/16
(forecast)
GSO and estimates
USDA staff in Hanoi
GSO and estimates
USDA staff in Hanoi
GSO and estimates
USDA staff in Hanoi
Marketing years start in January
Area planted/harvested (1000 ha) 209 215 220
Yield (tons/ha) 2.17 2.20 2.20
Beginning stocks 49 19 19
Production (1000 tons) 455 473 484
Marketing year imports (1000 tons) 217 250 300
Total Supply (1000 tons) 721 742 803
Marketing year exports (1000 tons) 2 3 4
Crush (1000 tons) 20 30 40
Domestic consumption food use (1000 tons) 680 690 720
Total domestic consumption (1000 tons) 700 720 760
Ending stocks 19 19 39
Total distribution (1000 tons) 721 742 803
* In-shell basis equivalent, including in-shell groundnuts (HS codes 120210 and 120241) and shelled groundnuts (HS codes 120220, 120242 and 200811 excluding peanut butter) Source: General Statistics Office of the Ministry of Agriculture and Rural Development, the Global Trade Atlas and the local USDA staff. Groundnut exports are marginal, not exceeding 1% of the total crop. They amounted to 2,000 tons in 2013/14, and are foreseen to raise to 3,000 and 4,000 tons this and the next season respectively. They are mainly destined to Thailand, Malaysia, Taiwan and Singapore. Imports of in-shell and shelled groundnuts expressed as in-shell equivalent are estimated to have doubled, from 210,000 tons in 2013/14 to 3,000 tons in 2014/15, and are foreseen to rise to 300,000 tons in 2015/16 (33% over this season). Shelled groundnuts constitute over 98% of the total imports; they originate for over 90% from India, followed far behind by Senegal, Paraguay and China. Source: http://gain.fas.usda.gov/Recent%20GAIN%20Publications/Oilseeds%20and%20Products%20Annual_Hanoi_Vietnam_4-8-2015.pdf
Aflatoxin issues The main Western and Asian importing markets for groundnut products have set strict sanitary and phytosanitary standards and regulations, that many African countries are unable to meet. The non-compliance with these standards and regulations seriously affects the export performance of many countries, reflected mainly in the decline of exports of groundnut products (kernels, oil cake or peanut butter) and the decrease of export earnings. The high incidence of toxins caused by humid weather conditions and inadequate harvest, post-harvest, storage and shipping conditions are limiting the export of groundnuts to major import markets. For instance, the current African export losses caused by mycotoxin contamination are estimated between 450 and 670 million US$. The World Bank reported in 2013 that the reduction of aflatoxin contamination could cause an annual increase of groundnut export value of Senegal by an average of 300 million US$. The strict European Union legislation on aflatoxin content and contamination, including groundnut products, is set into: the Commission Regulation (EC) No 1881/2006 on the Maximum levels of aflatoxins (aflatoxins B1, B2, G1, G2 and M1), and the Commission Regulation (EC) No 401/2006 Provisions for methods of sampling and analysis for the official control of mycotoxins including aflatoxins (http://eur-lex.europa.eu/legal-content/EN/TXT/?uri=CELEX:02006R1881-20140701). Two guidance documents were issued to assist competent authorities on the official control of aflatoxin contamination in food products which are subject to Commission Implementing Regulation (EU) 884/2014: the Guidance on the application of Article 9(4) of the Commission Implementing Regulation (EU) No 884/2014 of 13 August 2014 (http://ec.europa.eu/food/food/chemicalsafety/contaminants/docs/guidance_art-9-4.pdf), and The European Union (Special Conditions Governing the Import of Certain Food from Certain Third Countries Due to Contamination Risk by Aflatoxins) Regulations 2015 of 3 July 2015 (http://health.gov.ie/wp-content/uploads/2015/07/si250.pdf). The Rapid Alert System for Food and Feed (RASFF) reports the risks to public health and provides a round-the-clock service of notifications on aflatoxin contamination, shipment rejections and bans among others (http://ec.europa.eu/food/safety/rasff/index_en.htm). The service covers the food chains of its members (EU-28 national food safety authorities, Commission, EFSA, ESA, Norway, Liechtenstein, Iceland and Switzerland. Asian countries established also strict regulatory limits of mycotoxins in edible nut products including groundnuts http://www.hsa.gov.sg/content/dam/HSA/ASG/Food_Safety/ASEANRefLab/Aflatoxins_2015.pdf. On-going strategies, measures and projects are under implementation, addressing the aflatoxin contamination issues in groundnut producing countries. For example, Malawi’s National Export Strategy is built on the premise that the promotion of exports and domestic value addition can contribute to economic growth and poverty reduction in a meaningful way. Legumes including groundnuts have been earmarked to have a huge market in Europe and Asia, but the high levels of aflatoxin contamination threaten to disrupt the export development. At present, 49% of groundnuts sold on the local markets and 60% of those sold in shops and supermarkets were found to have aflatoxin levels exceeding those considered safe for human consumption. The Policy Note 21of May 2015 “Promoting Exports of Low-Aflatoxin Groundnut from Malawi”, explores the barriers to increasing Malawi’s access to low-aflatoxin export markets, the progress currently underway to this end (http://www.ifpri.org/publication/promoting-exports-low-aflatoxin-groundnut-malawi). By end of June the government of Malawi, through the Lilongwe University for Agriculture and Natural Resources, has installed an equipment to detect levels of aflatoxins of groundnuts before exporting them to Europe (http://en.starafrica.com/news?s=groundnut). Another example: The International Institute of Tropical Agriculture (IITA), in collaboration with the United States Department of Agriculture – Agricultural Research Service and the University of Thies, has developed a natural, safe, and cost-effective bio control product that drastically cuts aflatoxin contamination in African food crops including groundnuts. The bio control product aflasafe™ uses native strains of fungus A. flavus that do not produce aflatoxins, called atoxigenic strains, to “push out” their toxic cousins so that crops become less contaminated in a process called “competitive exclusion”. When appropriately applied before the plants produce flowers, these native atoxigenic strains completely exclude the aflatoxin producers.

Aflasafe™ has been tested over the past 6 years and is now mass produced at the Aflasafe manufacturing plant at IITA in Ibadan, Nigeria. Nigeria, Tanzania, Kenya, Mozambique, Senegal and Burkina Faso approved the unrestricted use of this type of biological aflatoxin control and are now in different stages of assessment, development or commercialization. Sources: www.aflasafe.com, https://www.facebook.com/pages/Aflasafe/734343473318805?sk=notes, https://www.facebook.com/media/set/?set=a.847709281982223.1073741833.734343473318805&type=3, http://r4dreview.org/2013/07/ensuring-the-safety-of-african-food-crops/)
Food Safety Modernisation Act (FSMA) The FDA Food Safety Modernization Act (FSMA) is an US public food safety and security law entered into force on January 4, 2011 and further amended and supplemented since. The law (Act) aims to ensure that US food supply is safe, by shifting the focus from responding to contamination to preventing it. Its content was passed in response to the demands of a broad coalition of produce growers, food processors, retailers and consumers concerned by a series of illness outbreaks and contamination incidents involving both domestic and imported food. The law rests on the core principle that those who produce food for the commercial market have the responsibility and capability to make it safe, in accordance with recognized best practices for preventing harmful contamination. Its broad goals are to protect consumer health, together with preserving the food system from the loss of consumer confidence, and to avoid market disruptions and high costs to industry resulting from foodborne illness. The Act has 4 titles, namely: (I) Improving capacity to prevent food safety problems; (II) Improving capacity to detect and respond to food safety problems; (III) Improving the safety of imported food, and (IV) Miscellaneous provisions. The full text of the law is accessible at http://www.gpo.gov/fdsys/pkg/PLAW-111publ353/pdf/PLAW-111publ353.pdf.
Since January 2013, FDA has proposed seven foundational rules to implement FSMA, which are/will be finalised in 2015 and 2016, including:
Preventive Controls for Human Food , requiring that food facilities have safety plans that set forth how they will identify and minimize hazards. The final rule will be issued on Sept. 10, 2015 and compliance dates for some businesses should begin in September 2016. The rule comprises the Current Good Manufacturing Practice and Hazard Analysis and Risk-Based Preventive Controls for Human Food (http://www.fda.gov/Food/GuidanceRegulation/FSMA/ucm334115.htm);
Produce Safety, establishing science-based standards for growing, harvesting, packing and holding produce on domestic and foreign farms. The final rule will be issued on Sept. 10, 2015 (http://www.fda.gov/Food/GuidanceRegulation/FSMA/ucm334114.htm);
Foreign Supplier Verification Program, through which importers will be required to verify that food imported into the US, has been produced in a manner that provides the same level of public health protection as that required of U.S. food producers (http://www.fda.gov/Food/GuidanceRegulation/FSMA/ucm361902.htm). This final rule deadline is Oct. 31, 2015;
Third Party Certification, establishing a program for the accreditation of third-party auditors to conduct food safety audits and issue certifications of foreign facilities producing food for humans or animals (http://www.gmaonline.org/issues-policy/product-safety/food-and-product-safety/food-and-product-safe/third-party-rule/). The final rule deadline is Oct. 31, 2015;
Sanitary Transportation, requiring those who transport food to use sanitary practices to ensure the safety of food (http://www.fda.gov/Food/GuidanceRegulation/FSMA/ucm383763.htm). The final rule deadline is March 31, 2016;
Intentional Adulteration, requiring domestic and foreign facilities to address vulnerable processes in their operations to prevent acts intended to cause large-scale public harm (http://www.fda.gov/Food/GuidanceRegulation/FSMA/ucm378628.htm). The final rule deadline is May 31, 2016

Groundnut producers, importers and exporters are more particularly concerned by the following FDA rules specifically affecting imports: - FSVP - Foreign Supplier Verification Programs for Importers of Food for Humans and Animals
(http://www.fda.gov/Food/GuidanceRegulation/FSMA/ucm361902.htm). When finalized, the FSVP rule will require importers to assume greater responsibility to verify that the foods they import into the United States meet the same safety standards required of domestic producers;
- Voluntary Qualified Importer Program (http://www.fda.gov/downloads/Food/GuidanceRegulation/GuidanceDocumentsRegulatoryInformation/UCM448558.pdf);
- Voluntary Third-Party Certification Programs for Foods and Feeds, scheduled to become final the fall of 2015 (http://www.fda.gov/regulatoryinformation/guidances/ucm125431.htm#I)
Prices Groundnut prices from January 2011 to March 2014 A comparison is made between the evolutions of average monthly prices Cost and Freight (CFR) Northern Europe, of Runners 40/50 groundnuts of US, Argentinian and Chinese origins between January 2011 and the first quarter of 2014.
Source: Olam The US and Argentinian prices followed an upward trend from the beginning of 2011 to the last quarter of that year, from about 1,500 US$/ton to 2,800/2,900 US$/ton and 2,250 US$/ton respectively. The US prices fell further to less than 1250 US$/ton by March 2014. Following the US cost-leadership position, Argentinian prices decreased also, maintaining however a small premium. It is noticeable that Argentinian prices have been below the cost of production since September 2012. The drop in Chinese prices was more gradual. They fluctuated during 2011 from about 1550 US$/ton to a high peak of 2250 US$/ton, and decreased further to about 1,550/1,600 US$/ton by the first quarter of 2015. Prices of 40/50 Runner groundnuts CFR N.W Europe, May - June 2015 Prices of US Runner groundnuts are leading the market. Form mid-May to end-June, the prices of US Runners 40/50 shelled basis, CFR N.W Europe, decreased continually, from 1350 to 1250 US$/ton. Prices of Argentinian Runners 40/50 had a similar trend, decreasing from 1250 to 1150 US$/ton, at a constant discount of 115 US$/ton. For comparison, South African HPS 40/50 groundnuts prices stagnated at 1550 US$/ton over the period.

Source: https://www.agra-net.net/agra/public-ledger/ Average groundnut farm prices received by U.S. farmers in 2015 Price information included in USDA/NASS reports « Peanut Prices » is provided at the beginning of each week by first buyers of farmer stock groundnuts. The reported data cover all qualities and grades of groundnuts excluding those used as seed. The global average prices received by farmers for all farmer stock between April and June 2015 varied only marginally, averaging 22.1 cents/lb. The evolution was similar for the prices of Runner variety (average 20.9 US cents/lb.). Price trend of Virginia groundnuts paralleled that of Runner variety, with consistent premiums of 6.5 cents/lb. on the average. Spanish groundnuts were commercialised from beginning of May to mid-June only. Their prices zoomed from an average of 16.3 cents/lb. during May, to a high peak of 40.6 cents/lb. at the beginning of June, and decreased to 30.3 cents/lb. a week later. Source: USDA, National Agricultural Statistics Service, Agricultural Prices http://usda.mannlib.cornell.edu/MannUsda/viewDocumentInfo.do?documentID=1640
1100
1200
1300
1400
1500
1600
13-May 20-May 27-May 03-Jun 10-Jun 17-Jun 24-Jun 01-Jul
Prices groundnuts Runners 40/50 and HPS Runners 40/50 shelled basis, CFR N.W Europe, US$/ton
ArgentinaRunners40/50
USRunners40/50
SouthAfricanHPS 40/50
10
15
20
25
30
35
40
45
US groundnut - average farm price for all farmer stock, cts./lb.
Runner
Spanish
Virginia
All

India Monthly wholesale prices Four Indian States covered over the three quarters of the national groundnut production in 2013/14, as follows: Gujarat (nearly 27%), Andhra Pradesh (24%), Tamil Nadu (15%) and Karnataka (11%).
Source: Agricultural Produce Market Committees, Directorate of Marketing & Inspection, Ministry of Agriculture, Government of India, http://agmarkweb.dacnet.nic.in/SA_Month_PriMar.aspx Minimum Support Prices The Minimum Support Price, which is a form of market intervention by the Government of India, is announced at the beginning of the sowing season.
The price is set in order to insure agricultural producers against any sharp fall in farm prices. The Minimum Support Price is a Government guaranteed price protecting farmers against excessive falls in prices during bumper production years.
3500
4000
4500
5000
5500
6000
6500
7000
March April May June
India groundnut wholesale prices by State March-June 2015, Rs/Quintal
Gujarat
Andra Pradesh
Tamil Nadu
Karnataka
2100
2500
2900
3300
3700
4100
2010/11 2011/12 2012/13 2013/14 2014/15 2015/15
Minimum Support Prices fixed by Government for groundnut in shell, Rupees/quintal

In case the market price falls below the announced minimum price in years of overproduction and glut in the market, government agencies purchase the entire quantity offered by the farmers at the previously announced minimum price. Source: http://agriexchange.apeda.gov.in
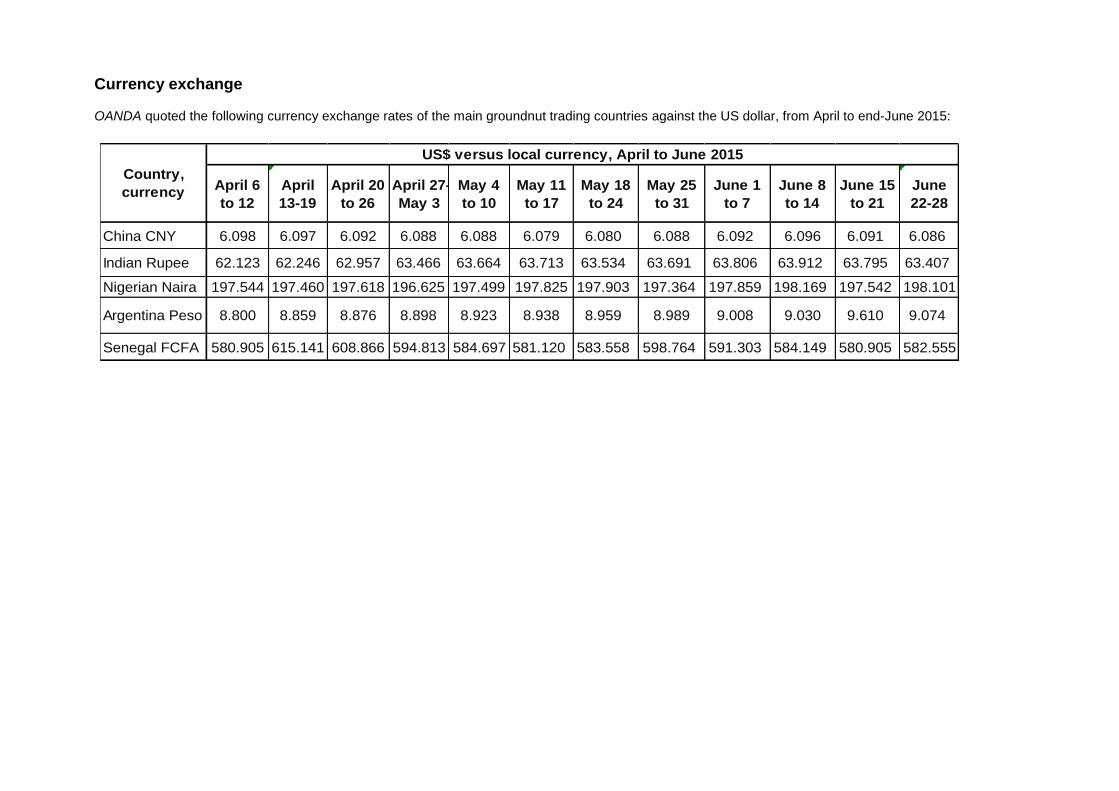
Currency exchange OANDA quoted the following currency exchange rates of the main groundnut trading countries against the US dollar, from April to end-June 2015:
April 6
to 12
April
13-19
April 20
to 26
April 27-
May 3
May 4
to 10
May 11
to 17
May 18
to 24
May 25
to 31
June 1
to 7
June 8
to 14
June 15
to 21
June
22-28
China CNY 6.098 6.097 6.092 6.088 6.088 6.079 6.080 6.088 6.092 6.096 6.091 6.086
Indian Rupee 62.123 62.246 62.957 63.466 63.664 63.713 63.534 63.691 63.806 63.912 63.795 63.407
Nigerian Naira 197.544 197.460 197.618 196.625 197.499 197.825 197.903 197.364 197.859 198.169 197.542 198.101
Argentina Peso 8.800 8.859 8.876 8.898 8.923 8.938 8.959 8.989 9.008 9.030 9.610 9.074
Senegal FCFA 580.905 615.141 608.866 594.813 584.697 581.120 583.558 598.764 591.303 584.149 580.905 582.555
Country,
currency
US$ versus local currency, April to June 2015