edinburgh research explorer...distribution of cyst nematodes at the level of the country, the field...
TRANSCRIPT

Edinburgh Research Explorer
A metagenetic approach to determine the diversity anddistribution of cyst nematodes at the level of the country, thefield and the individual
Citation for published version:Eves-van den Akker, S, Lilley, CJ, Reid, A, Pickup, J, Anderson, E, Cock, PJA, Blaxter, M, Urwin, PE,Jones, JT & Blok, VC 2015, 'A metagenetic approach to determine the diversity and distribution of cystnematodes at the level of the country, the field and the individual', Molecular Ecology, vol. 24, no. 23, pp.5842-5851. https://doi.org/10.1111/mec.13434
Digital Object Identifier (DOI):10.1111/mec.13434
Link:Link to publication record in Edinburgh Research Explorer
Document Version:Publisher's PDF, also known as Version of record
Published In:Molecular Ecology
General rightsCopyright for the publications made accessible via the Edinburgh Research Explorer is retained by the author(s)and / or other copyright owners and it is a condition of accessing these publications that users recognise andabide by the legal requirements associated with these rights.
Take down policyThe University of Edinburgh has made every reasonable effort to ensure that Edinburgh Research Explorercontent complies with UK legislation. If you believe that the public display of this file breaches copyright pleasecontact [email protected] providing details, and we will remove access to the work immediately andinvestigate your claim.
Download date: 19. Jun. 2020

A metagenetic approach to determine the diversity anddistribution of cyst nematodes at the level of thecountry, the field and the individual
SEBASTIAN EVES-VAN DEN AKKER,*† CATHERINE J . LILLEY,† ALEX REID,‡ JON PICKUP,‡ERIC ANDERSON,§ PETER J .A. COCK,¶ MARK BLAXTER,k PETER E. URWIN,† JOHN T.
JONES**† † and VIVIAN C. BLOK**
*Division of Plant Sciences, College of Life Sciences, University of Dundee, Dundee DD1 5EH, UK, †Centre for Plant Sciences,University of Leeds, Leeds LS2 9JT, UK, ‡Science and Advice for Scottish Agriculture, Edinburgh EH12 9FJ, UK, §ScottishAgronomy Ltd, Arlary Farm, Milnathort, Kinross KY13 9SJ, UK, ¶Information and Computational Sciences Group, Dundee
Effector Consortium, The James Hutton Institute, Invergowrie, Dundee DD2 5DA, UK, kInstitute of Evolutionary Biology,
University of Edinburgh, Edinburgh EH8 9YL, UK, **Cell and Molecular Sciences Group, Dundee Effector Consortium, The
James Hutton Institute, Invergowrie, Dundee DD2 5DA, UK, ††School of Biology, University of St Andrews, North Haugh, St
Andrews KY16 9TZ, UK
Abstract
Distinct populations of the potato cyst nematode (PCN) Globodera pallida exist in the
UK that differ in their ability to overcome various sources of resistance. An efficient
method for distinguishing between populations would enable pathogen-informed cul-
tivar choice in the field. Science and Advice for Scottish Agriculture (SASA) annually
undertake national DNA diagnostic tests to determine the presence of PCN in potato
seed and ware land by extracting DNA from soil floats. These DNA samples provide a
unique resource for monitoring the distribution of PCN and further interrogation of
the diversity within species.
We identify a region of mitochondrial DNA descriptive of three main groups of G. pal-lida present in the UK and adopt a metagenetic approach to the sequencing and analysis
of all SASA samples simultaneously. Using this approach, we describe the distribution
of G. pallida mitotypes across Scotland with field-scale resolution. Most fields contain a
single mitotype, one-fifth contain a mix of mitotypes, and less than 3% contain all three
mitotypes. Within mixed fields, we were able to quantify the relative abundance of each
mitotype across an order of magnitude. Local areas within mixed fields are dominated by
certain mitotypes and indicate towards a complex underlying ‘pathoscape’. Finally, we
assess mitotype distribution at the level of the individual cyst and provide evidence of
‘hybrids’. This study provides a method for accurate, quantitative and high-throughput
typing of up to one thousand fields simultaneously, while revealing novel insights into
the national genetic variability of an economically important plant parasite.
Keywords: distribution, diversity, metagenetics, mitotype, potato cyst nematode
Received 9 August 2015; revision received 16 October 2015; accepted 21 October 2015
Introduction
Cyst nematodes are microscopic obligate root para-
sites that cause significant economic damage;
predicted global costs associated with yield loss
and control measures extend into the billions of
US dollars. Cyst nematodes pose a significant chal-
lenge to modern agricultural practice due to a combi-
nation of their unusual biology and the absence of
effective control measures for many species (Nicol
et al. 2011).Correspondence: Sebastian Eves-van den Akker,
E-mail: [email protected]
© 2015 The Authors. Molecular Ecology Published by John Wiley & Sons Ltd.This is an open access article under the terms of the Creative Commons Attribution License,
which permits use, distribution and reproduction in any medium, provided the original work is properly cited.
Molecular Ecology (2015) 24, 5842–5851 doi: 10.1111/mec.13434

The juvenile potato cyst nematode (PCN), Globodera
spp., invades host roots, establishes a feeding site and
develops into a mature female or male. Females remain
sedentary, while males leave the root and migrate to
locate a female. Females are polyandrous and each
may mate with multiple males. Once fertilized, the
female’s body dries to encase the eggs in a hard cyst.
Nematodes within eggs inside the cysts can remain
dormant in the soil for up to 20 years (Turner 1996)
and may be dispersed by wind, land cultivation,
human travel and even crops. As a result, cyst nema-
todes are easily spread across long distances. PCN is
present on both EPPO and USDA quarantine organism
lists.
Two species of PCN are of agronomic importance in
many temperate potato growing regions: G. rostochiensis
and G. pallida. Wide-scale deployment of the H1 resis-
tance gene in the UK has been highly effective in con-
trolling the former (Barone et al. 1990). However, this
has led to strong selection of G. pallida, which has sub-
sequently increased in prevalence and is now present in
approx. 92% of the potato fields in England and Wales
infested with PCN (Minnis et al. 2002). The spread of
G. pallida is of concern for the protection of seed potato
land in Scotland. Development of effective resistance to
G. pallida has been challenging and commercially
acceptable potato varieties with high levels of resistance
have only recently become available. The performance
of these varieties in the field with regard to suppressing
G. pallida and in terms of other traits is still under eval-
uation.
Despite the fact that the genetic variation of both spe-
cies in Europe reflects only a small component of the
total diversity that was introduced from South America
(Plantard et al. 2008), it is hypothesized that this dispar-
ity between species with regard to the availability of
host resistance reflects their respective genetic variation.
For example, a recently identified family of parasitism
genes contained substantially more variation in UK
G. pallida populations compared to G. rostochiensis
(Eves-van den Akker et al. 2014). Consistent with this,
multiple genetically distinct populations of G. pallida
have been characterized in the UK (Kort et al. 1977;
Phillips & Trudgill 1998; Hockland et al. 2012). Further-
more, G. pallida pathotypes exist which differ in their
ability to overcome various sources of resistance and
therefore cultivar choice can be critical. Even prior to
the recent restrictions in nematicide applications (EU
Regulation EC 1107/2009), one of the most effective
control measures for PCN was host resistance. Thus,
recent work has focused on identifying rapid and accu-
rate means to distinguish PCN populations to ulti-
mately assist in cultivar choice (Hoolahan et al. 2012;
Mimee et al. 2015).
In this vein, a mitochondrial gene, cytochrome B (cyt
B), has been used for phylogenetic inference of three
genetically distinct groups of G. pallida consistent with
the three main introductions into Europe (Plantard et al.
2008). Clades Ic2, 3 and 6 contain European populations
with phenotypes of pathotype 1, 2 and 3 (Hockland
et al. 2012). While clearly not the causal mutations
underlying differences in pathogenicity, these three ‘mi-
totypes’ represent a promising opportunity to study the
diversity of G. pallida in the UK and to examine their
distributions.
Science and Advice for Scottish Agriculture (SASA)
carry out annual preplant PCN tests of seed potato land
and, following the implementation of EU Directive 2007/
33/EC, have also carried out an annual random survey
of 0.5 % of ware land for PCN since 2010 (Reid et al.
2015). Between 80 and 300, soil cores across each field are
collected and pooled (https://www.sasa.gov.uk/sites/
default/files/PCN%20Booklet%202014.pdf). DNA is
extracted from sample float material, which contains
nematode cysts, and independent qPCR-based assays are
used to estimate the abundance of either G. rostochiensis
or G. pallida. These pre-existing SASA samples provide a
unique resource for monitoring the distribution of PCN
and for further interrogation of the diversity within the
species.
The use of cyt B as a proxy for distinct G. pallida
groups, in conjunction with both a unique DNA sample
catalogue and the advent of massively parallel next-
generation sequencing, allows questions to be posed
that were previously technically unfeasible. We describe
a metagenetic approach to determine the presence, and
quantify the relative abundance, of each G. pallida mito-
type in ~800 samples, covering 687 fields across potato
growing regions of Scotland, in a single high-through-
put experiment. The approach described is broadly
applicable to many pathosystems and has revealed
novel insights into the complexity of PCN genetic diver-
sity at the level of the country, the field and the indi-
vidual animal.
Methods
DNA samples
The mitotype diversity was studied in 687 fields (sam-
pled between 2011 and 2014), 64 samples taken at regu-
lar intervals across two field sites, 22 individual cysts
and various control mixes described in the relevant sec-
tion.
Individual field samples were collected by SASA as
part of annual surveys (https://www.sasa.gov.uk/
sites/default/files/PCN%20Booklet%202014.pdf). In bri
ef; each sample is a pool of either 80 or 300 individual
© 2015 The Authors. Molecular Ecology Published by John Wiley & Sons Ltd.
GLOBODERA PALLIDA METAGENETICS 5843

five millilitre cores per hectare (depending on the out-
come of previous tests or growing seasons), collected
from a ‘W’-shaped transect across each area. Samples
were processed for DNA extraction and PCN detection
as described (Reid et al. 2015). Each sample (standard
1500 ml/ha or reduced 400 ml/ha) was dried at 37 °Cfor a minimum of 2 days, and an automated MEKU
nematode carousel was used to collect the float material
into 200-lm sieves. DNA was extracted from up to 2 ml
of float material (which contains any cysts) using a Tis-
sueLyser II with 2 9 24 adapter set (QIAGEN) and
MagMAXTM Express-96 Deep Well Magnetic Particle
Processor (Life Technologies). DNA samples were
tested for the presence of PCN using a qPCR-based
method (Reid et al. 2015). PCN-positive samples (~200per species per year) were collated into individual
plates and archived at �20 °C. In addition, a grid sam-
pling approach was employed across two regions of a
field (OS Ref: NT 484 810), either 15 by 10 m squares or
5 by 16 m squares. Float material from each position in
the grid was prepared separately as described above.
Primer and barcode design
While cyt B has been used for phylogenetic inference of
G. pallida populations (Plantard et al. 2008), a specific
region amenable to the strict requirements of a metage-
netic approach had not been identified. A region, less
than 450 base pairs (bp), which is descriptive of each of
the three mitotypes by at least two SNPs in a total of 5
polymorphic positions and is flanked by highly con-
served regions for primer binding, was identified from
66 available cyt B sequences (Dryad Accession doi:
10.5061/dryad.pd7r6). Several different primer combi-
nations, all specific to G. pallida, were explored, the pair
which produced the most reliable amplification at low
template concentrations (F1, R1) was selected for further
study (Table S1, Supporting information). With respect
to GenBank DQ631912.1, this primer pair amplifies the
region 281–590 bp from the start codon.
To distinguish between ~800 samples postsequencing,
each sample was amplified with a unique identifier or
barcode appended to the primer. Synthesis of 900
unique primers is prohibitively expensive. However,
pairwise combinations of 30 unique forward and 30
unique reverse primers were used to generate 900
unique pairs. In the first instance, unique primers were
generated by fusion to Illumina adapters and barcode
sequences. The reduction in amplification efficiency
attributed to the 55-bp overhang was prohibitive for the
low template concentration intrinsic to SASA samples.
Thus, 30 unique 4-bp barcodes were designed, each at
least two base pairs different from any other (Table S2,
Supporting information). For each unique 4-bp barcode,
forward and reverse oligonucleotide primers were syn-
thesized with two 50 adenosines, followed by the rele-
vant barcode, and finally the primer sequence. There
was no observable detrimental effect of these 6-bp over-
hangs on amplification efficiency (not shown).
Given that every pairwise combination of primers
was mixed to generate 900 unique pairs, cross-contami-
nation between successive synthesis reactions would
drastically affect the validity of the approach. Addi-
tional precautions can be requested from certain compa-
nies, but at a vastly increased cost. For the number of
primers required, these additional costs restrict the
scope for wide adoption and regular use of the
approach. Here, standard primer synthesis reactions
were commissioned, however, one primer was ordered
per day from three different companies for 20 days.
This ensures that other unrelated reactions will inter-
sperse the metagenetic primers. We accept that metage-
netic primers will contain traces of other primers, but it
was deemed unlikely they would target the same spe-
cies, gene, region of gene, and utilize the novel barcode
structure. This reduced the cost for this aspect of the
project by ~20 fold.
PCR, library preparation and sequencing
For all liquid handling steps prior to PCR, filter tips
were used to minimize cross-contamination from aero-
sols. All PCRs were carried out using Phusion Hi-fide-
lity proofreading polymerase following the
manufacturer’s instructions (NEB), with 5 ll of tem-
plate. Thirty seven cycles of 20 s at 98 °C, 30 s at 64 °Cand 60 s at 72 °C were followed by a final extension of
5 min at 72 °C. All PCRs were analysed by gel elec-
trophoresis and assigned to two groups. One microlitre
of the high amplification group or 10 ll of the low
amplification were pooled to ensure sufficient read
depth per sample. Total pooled PCR products (2–3 ml)
were precipitated at �80 °C overnight with the addition
of 1 volume isopropanol and 0.2 volumes 3 M sodium
acetate. Precipitated DNA was pelleted by centrifuga-
tion at 13 000 g for 20 min at 4 °C. The pellet was
washed once in 70% ethanol, allowed to air dry, and
resuspended in 180 ll of 10 mM Tris-Cl, pH 8.5. Con-
centrated PCR products were additionally purified by
size selection using MagJET NGS Cleanup and Size
Selection beads (Thermo Scientific) following the manu-
facturer’s instructions for adapter removal for an ampli-
con of 300 bp. Size selected blunt ended DNA was
eluted from the beads in 50 lL and analysed by gel
electrophoresis. Library preparation was carried out by
Edinburgh Genomics (University of Edinburgh, Edin-
burgh, UK) using an Illumina TruSeq PCR Free kit fol-
lowing the manufacturer’s instructions but omitting the
© 2015 The Authors. Molecular Ecology Published by John Wiley & Sons Ltd.
5844 S . EVES- VAN DEN AKKER ET AL.

shearing step prior to blunt-end adapter ligation. The
library was sequenced on a MiSeq instrument using 300
base paired-end reads (v3 chemistry) and 30% PhiX
spike-in.
Bioinformatic analyses
All custom python scripts and detailed protocols are
available under GitHub repository https://github.com/
sebastianevda/SEvdA_metagen.git. In brief, raw reads
were trimmed of leading and trailing low-quality bases
(Phred < 30), followed by a 10-bp sliding window of
average Phred score <30, followed by a minimum
length restriction of 150 bases using Trimmomatic (Bol-
ger et al. 2014). Overlapping pairs of reads were assem-
bled using Pear (Zhang et al. 2014), converted to Phred
64 coding using Trimmomatic, and subsequently con-
verted into FASTA format using the FASTX toolkit (Gor-
don & Hannon 2010). All sequences were prepared in
the same orientation and those which contained the for-
ward and reverse primer binding sites were retained
for further analysis. Custom python script 1 was used
to trim remaining adenosines 50 to the barcode site, trim
the primer binding site, impose a minimum length
restriction of 305 bp and return a tabular output in the
format, barcode 1 barcode 2 amplicon. The number of
unique amplicons per barcode pair was counted
(count_unique_seq_per_barcode_pair.sh) and those
amplicons which contributed to less than 5% of the total
for each barcode pair were identified using custom
python script 2 and removed from further analysis.
Data analysis
The frequency of all remaining amplicons was counted,
and the 50 most common were aligned and refined
using MUSCLE (Edgar 2004). The alignment was used
to construct a Bayesian phylogeny with 2 million gener-
ations. Model selection (F81) and molecular phyloge-
netic construction was carried out using TOPALi (Milne
et al. 2009). The phylogenetic tree was mid-point
rerouted and formatted in FIGTREE v1.4 (http://
tree.bio.ed.ac.uk/software/figtree/). For each barcode
pair, the number of reads corresponding to each of the
mitotypes from the phylogeny was counted using cus-
tom grep scripts (see list of commands), and the relative
contribution to the total was calculated in Excel. An
integer cut-off for each mitotype was set at the maxi-
mum number of reads observed in barcode pairs which
were known not to contain that mitotype. Relative
abundance plots on maps or 3D surface plots were gen-
erated using custom python scripts 3a/b and 4a/b,
respectively, in the Canopy wrapper for Cartopy and
matplotlib (enthought.com/products/canopy).
Results
Thirty unique barcodes were designed, 4 base pairs in
length, with at least 2 base pairs mismatch between any
two (Table S2, Supporting information). Thirty forward
and 30 reverse oligonucleotide primers were synthe-
sized, each within a set having a different 50 barcode.
Due to exponential scaling, every pairwise combination
of primers gives rise to 900 unique pairs. Each unique
pair was used to amplify a 310-bp region of cyt B from
one sample only. The result is that PCR products can
be pooled, sequenced in parallel and subsequently
deconvoluted into their original samples bioinformati-
cally based on the barcode sequence.
Amplification and sequencing
Samples included various levels of resolution from
fields across a country (687), two grid samples across a
field (64), a range of individual cysts (22) and various
controls (35). All PCRs were pooled approximately
quantitatively prior to sequencing to ensure adequate
read depth of each. Each 310-bp amplicon was
sequenced almost in its entirety from both ends to gen-
erate overlapping 300-bp paired-end reads. From an ini-
tial population of ~12 million reads, 60% (7 076 131)
remained with a minimum length of 150 bp after trim-
ming of adapter sequences and low-quality bases
(Phred <q30). Following trimming, overlapping paired-
end reads were recapitulated into the full-length cyt B
amplicon with >98% success rate. Only sequences
which contained both the forward and reverse primer
site used to generate the amplicon, one barcode on each
end, and that had a minimum length of 305 bp were
retained for further analysis (6 614 854). Not including
the barcode sequences, the 6 614 854 reads comprised
46 503 unique amplicons – vastly more than anticipated
– the majority of which occurred only once.
Sensitivity
A range of controls was used to determine the sensitiv-
ity of the approach. Seven different control amplifica-
tions (each replicated with 5 unique barcode pairs)
contained template mixes of either two or three plas-
mids encoding known cyt B sequences. For each control
condition, reads corresponding to the plasmid
sequences with 100% identity were considered signal,
while all other reads were considered noise. Approxi-
mately 1000 unique sequences corresponding to noise
were consistently identified for each barcode pair
(Fig. 1a). The cumulative noise contribution can be up
to 35% of the total number of reads (Fig. 1b). However,
the vast majority of the ~1000 noise sequences occurred
© 2015 The Authors. Molecular Ecology Published by John Wiley & Sons Ltd.
GLOBODERA PALLIDA METAGENETICS 5845

only once, and none of them individually contributed
to more than 5% of the total reads for a given barcode
pair (Fig. 1b). Thus, there was a large amount of effec-
tively random, low-frequency noise, rather than high-
frequency contamination by a particular sequence. By
removing all unique sequences which contributed <5%to the total number of sequences for that barcode pair,
we could efficiently remove all noise from the control
samples. A 5% cut-off was imposed for all other bar-
code pairs based on the above controls. This deter-
mined the sensitivity of the approach, such that if a
genuine sequence in the population is present below
5%, it will not be detected.
The percentage cut-off efficiently removed most
noise from the system. However, if the total number
of reads per barcode pair is low, the percentage con-
tribution of noise to the total can exceed 5% and
would therefore wrongly be retained as true signal.
Thus, spare barcode pairs which were never used in
the experiment, but which do contain low numbers of
reads, are critical to remove remaining noise. These
cases typically consist of low total numbers of reads
(hundreds rather than thousands) and result from
either cross-contamination or sequencing/PCR error
on the barcode. The maximum read number observed
for any unused barcode pair which should not
contain any reads was used as an integer cut-off,
below which all reads were discarded on a per mito-
type basis. A total of approximately 5.6 million ampli-
cons remained after percentage cut-off followed by
integer cut-off, with an average of ~10 000 reads per
unique barcode pair.
Specificity
The combination of cut-off procedures drastically
reduced the number of unique amplicons from 46 000
to 2 060. To determine the specificity of the approach,
the 50 most common amplicons (numbered in order of
frequency) were used to construct a Bayesian phy-
logeny, that efficiently separated them into three major
clades (Fig. 2a). The consensus sequence in each clade
corresponds with 100% identity to one of the three
known mitotypes (Fig. 2b), giving confidence in the
approach. These 50 most common amplicons represent
just 2.5% of the unique sequences, but account for
99.63% of the total number of reads postcleaning. For
each barcode pair, the numbers of sequences corre-
sponding with 100% identity to any sequence in clades
1, 2 or 3 only were counted, resulting in a relative fre-
quency of each mitotype for that sample. The 7th most
common sequence is similar to mitotype 3, as seen from
its position in the phylogeny and sequence. Sequence 7
contains all SNPs descriptive of mitotype 3, with the
exception of position 61, normally descriptive of mito-
types 1 and 2 (Table S3, Supporting information).
In addition, known ratios of either two or three mito-
types (encoded by plasmids) were mixed and used for
PCR amplification alongside field samples, each with 5
technical replicates. Fig. 3 describes the expected and
1
10
100
1000
1 2 3 4 5 6 7
Total # signal sequences Total # noise sequences
0
25
50
75
100
1 2 3 4 5 6 7
% of total which is signal % of total which is noise
% of total which is noise on a per amplicon basis%
Independent barcode-pairs - each replicated 5 mes
23
Independent barcode-pairs - each replicated 5 mes
(a) (b)
Fig. 1 Sensitivity. Seven different control conditions (each replicated with five unique barcode pairs) contained mixes of either two
or three plasmids encoding known cyt B sequences. (a) The number of unique signal sequences (black) compared to the number of
unique noise sequences (white). (b) The contribution of unique sequences to signal (black), noise (grey) or noise on a per unique
sequence basis (white). Removing all unique sequences which contribute <5% to the total number of sequences for that barcode pair
efficiently removes all noise from the control samples.
© 2015 The Authors. Molecular Ecology Published by John Wiley & Sons Ltd.
5846 S . EVES- VAN DEN AKKER ET AL.

observed percentages in terms of mitotype 1: mitotype
2: mitotype 3. For a range of ‘two mitotype’ mixes
within an order of magnitude (10:90, 25:75, 33:66,
50:50), and even complex ‘three mitotype’ mixes across
a similar range (10:45:45 and 33:33:33), observed ratios
do not differ significantly from expected ratios, with the
exception of mitotype 3 only in the 33:33:33 mix (v2 P
value cut-off 0.05, Fig. 3a). This suggests the ratio of
reads corresponding to each mitotype within a barcode
pair is a faithful reproduction of the ratio of mitotypes
in the original sample. Furthermore, comparison of one
mitotype between mixes shows that 10% is significantly
different from 25%, and indeed 33% and 50% (Student’s
t-test with Bonferroni correction for multiple tests,
P < 1E�5, Fig. 3b). Together, these data show that the
approach used here can be used to infer frequency of
mitotypes within and between samples.
The distributions of G. pallida mitotypes at country-scale resolution
During the sampling procedure, several soil cores from
a range of loci across a given field are collected and
pooled to build a complete picture of the PCN diversity
in a single mixed DNA sample. With the high strin-
gency approach, we were able to detect G. pallida in
~76% of fields previously identified as ‘G. pallida posi-
tive’ by qPCR (Reid et al. 2015). Of the fields, ~79% con-
tain a single mitotype, ~18% contain a mix of two
mitotypes, and ~2.3% contain a mix of all three mito-
types. Given that a single barcode pair was used per
sample, and the location of the field was recorded upon
sampling, the national distribution of each mitotype can
be plotted (Fig. 4a–c). As is clear from Fig. 4, all three
mitotypes are broadly prevalent across the majority of
Scotland. Mitotype 3 dominates and contains the most
sequence variability (Fig. 2), while mitotype 2 is the
least prevalent yet contains more variation in sequence
than mitotype 1. Interestingly, mitotypes 1 and 3 are
approximately twice as likely to co-occur as 1 and 2, or
2 and 3 (even when scaled by total occurrences). The
7th most common sequence only occurs in a single field
and is present at 8% relative to 92% mitotype 2. For
mixed fields only, the relative abundance of each mito-
type in each field can be plotted where the size of the
segment scales by the relative abundance of each mito-
type (Fig. 4d). This identifies well those fields which
contain more than one mitotype and indeed the relative
abundance of each mitotype within that field. However,
due to the inclusive sampling approach across each
field, this does not intrinsically inform as to the distri-
bution of mitotypes within a field.
The distribution of G. pallida mitotypes at field-scaleresolution
A grid sampling approach was employed across two
fields to determine the distribution of mitotypes within
(a) (b)
Fig. 2 Bayesian phylogeny of the 50 most common sequences. (a) The 50 most common sequences (numbered in order of frequency)
were used to construct a Bayesian phylogeny with 2 million iterations. All sequences were subdivided into three Clades, each corre-
sponding to one of the known mitotypes, with the exception of the 7th most common sequence. Sequence 7 contains all SNPs
descriptive of mitotype 3, with the exception of position 61, normally descriptive of mitotypes 1 and 2. (b) The consensus sequence
in each clade corresponds with 100% identity to the descriptive SNPs of each mitotype.
© 2015 The Authors. Molecular Ecology Published by John Wiley & Sons Ltd.
GLOBODERA PALLIDA METAGENETICS 5847
mixed fields. Each sample was prepared separately and
assigned its own barcode pair. Thus, the distribution of
mitotypes across the field can be plotted where the X
and Y axes correspond to the particular coordinates
within a field, and the Z axis represents the relative
abundance of each mitotype (Fig. 5). Mixed fields do
not contain an even distribution of mitotypes; local
peaks and troughs of single mitotypes dominate and
may reflect a complex underlying ‘pathoscape’ within
mixed fields. Furthermore, we were able to replicate
this complex pattern at an additional site (Fig. S1, Sup-
porting information), albeit with a drastically different
composition. This highlights the importance of
sampling multiple cores from a single field as described
above (80–300 per hectare) for analysing national distri-
butions.
The distribution of G. pallida mitotypes withinindividual cysts
The level of resolution can be extended to allow analy-
sis of single cysts. DNA extracted from 22 individual
cysts was included in the PCRs, each with its own bar-
code pair. The vast majority of single cysts tested con-
tained DNA of a single mitotype (Fig. 6). However, cyst
22 appears to contain a mix of mitotypes 1 and 3. Given
%
0102030405060708090
100
ns
ns
ns
ns
ns
ns
nsns
ns ns
ns
ns
ns*
10:90:0 25:75:0 33:66:0 50:50:0 33:33:33 10:45:45
0
10
20
30
40
60
70
80
90
100
%
Type 1
Type 2
Type 3
Type 1Observed
Expected
Expected
Expected
Observed
Observed
KEY
a
b
c
d
d
c
b
a
(a) (b)
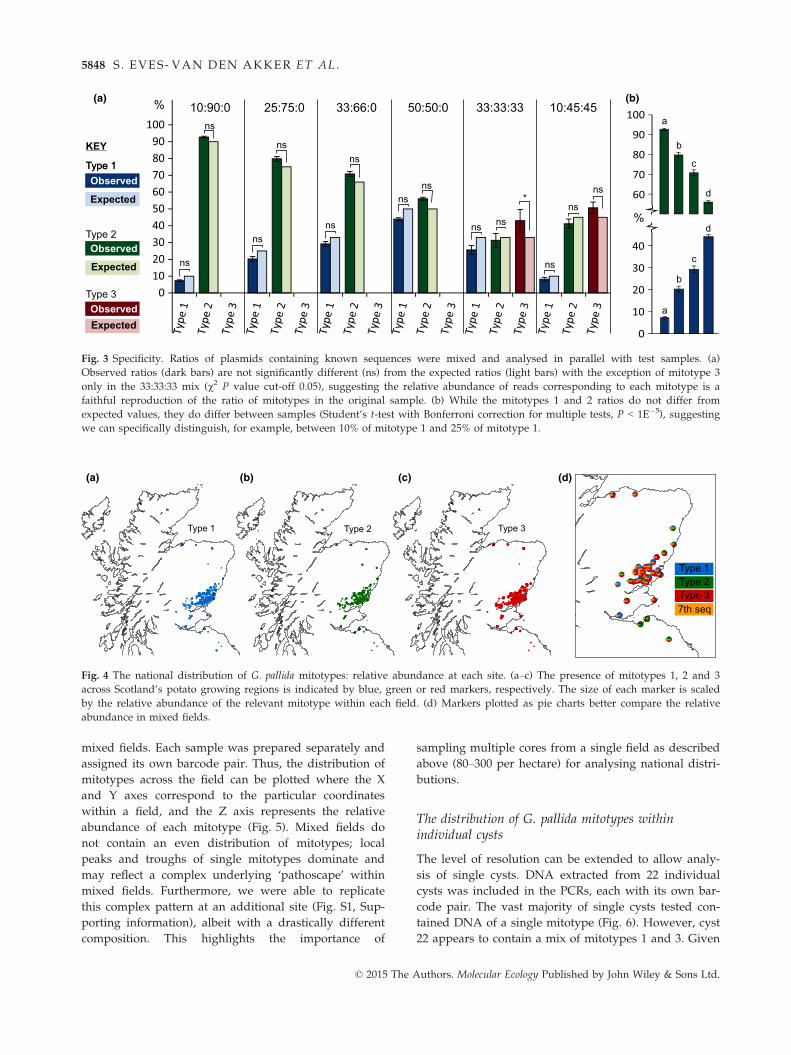
Fig. 3 Specificity. Ratios of plasmids containing known sequences were mixed and analysed in parallel with test samples. (a)
Observed ratios (dark bars) are not significantly different (ns) from the expected ratios (light bars) with the exception of mitotype 3
only in the 33:33:33 mix (v2 P value cut-off 0.05), suggesting the relative abundance of reads corresponding to each mitotype is a
faithful reproduction of the ratio of mitotypes in the original sample. (b) While the mitotypes 1 and 2 ratios do not differ from
expected values, they do differ between samples (Student’s t-test with Bonferroni correction for multiple tests, P < 1E�5), suggesting
we can specifically distinguish, for example, between 10% of mitotype 1 and 25% of mitotype 1.
Type 3Type 2Type 1
Type 2Type 1
Type 37th seq
(a) (b) (c) (d)
Fig. 4 The national distribution of G. pallida mitotypes: relative abundance at each site. (a–c) The presence of mitotypes 1, 2 and 3
across Scotland’s potato growing regions is indicated by blue, green or red markers, respectively. The size of each marker is scaled
by the relative abundance of the relevant mitotype within each field. (d) Markers plotted as pie charts better compare the relative
abundance in mixed fields.
© 2015 The Authors. Molecular Ecology Published by John Wiley & Sons Ltd.
5848 S . EVES- VAN DEN AKKER ET AL.

that (i) cyst nematodes are polyandrous; (ii) multiple
mitotypes co-occur within fields; (iii) cysts contain hun-
dreds of eggs, each of which is an individual animal;
and (iv) the 33:66 distribution is well within our confi-
dence limits, and cyst 22 is designated as a putative
‘hybrid’. We are unable to determine whether hybrid
cysts contain a mixture of homogenous and/or hetero-
geneous individuals.
Discussion
Here we demonstrate the power of a metagenetic
approach to simultaneously describe the genetic diversity
of an economically important plant parasite at three
levels of resolution: country, field and individual animal.
The unusual biology of cyst nematodes introduces
complexity into the above scenario. While the polymor-
phisms in the cyt B show a relationship with popula-
tions that differ in their virulence, they are presumably
not the causal agent. This is particularly important
given the, albeit rare, precedent for paternal inheritance
of mitochondrial DNA (Hoolahan et al. 2011) and the
multipartite mitochondrial genome of G. pallida with
associated gene duplications (Gibson et al. 2007). The
region of cyt B used in the present study contains an
A/T polymorphism which distinguishes between the
copies present on circles 1 and 3 (Armstrong et al. 2000;
Gibson et al. 2007). Crucially, this polymorphism is not
used to describe the mitotypes (Fig. 2b), is not present
in the 50 most common sequences used for the phy-
logeny (Fig. 2a) and therefore was not included in any
of the mitotype counts (Figs 3–6). Despite this, further
work needs to be carried out to determine the validity
of mitotypes as a proxy for pathotypes and indeed if
suitable causal polymorphisms can be identified. Thus,
we describe the distribution of mitotypes, with refer-
ence to the pathotype system, until further evidence in
favour is acquired. Nevertheless, cyt B mitotypes pro-
vide an ideal proof of concept for the approach, which
can be readily re-adopted to any genetic sequence for
cyst nematodes, or indeed any other organism of inter-
est, for which suitable samples can be acquired or are
available.
We expected the adopted approach could identify
novel mitotypes which represent either new introduc-
tions or new mutations. Sequence 7 lies above our strin-
gent sensitivity and specificity criteria and therefore
may represent a novel mutation/introduction rather
than resulting from an artefact of the approach. Errors
in the approach are likely to be randomly distributed
across all samples rather than being highly localized.
Nevertheless, the identified field, and adjacent fields,
should form the basis of future sampling. Re-identifica-
tion in an independent experiment would be testament
to the validity and will inform distribution/spread.
The data presented here suggest that all 3 mitotypes
are more widely and evenly distributed across Scotland
than previously thought, particularly for mitotype 1
(Hockland et al. 2012). Given that the majority of fields
contain only a single mitotype, the approach described
here has the potential to provide recommendations as
to appropriate cultivar choice on a per-field basis. How-
ever, multiple introductions of cysts into the same field,
even separated by decades, can result in highly hetero-
geneous population structures due to the long dor-
mancy time. We demonstrate that over one-fifth of all
fields contain a mix of at least two mitotypes. In these
cases, and in particular those containing all three mito-
types, cultivar recommendations will remain challeng-
ing. The discovery that certain combinations of
mitotypes co-occur more frequently than others is sur-
prising. This may result from frequent co-introductions
of these populations or reflect the lack of discrete
boundaries between true pathotypes (Phillips & Trudg-
ill 1998).
Despite regular ploughing, mixed fields are dominated
by local peaks of single mitotypes. This discovery pre-
sents an interesting opportunity to test the selection pres-
010203040506070
8090 10
2030
404535
2515
50m
20406080
100%
m
0
50
75
100
25
0
50
75
100
25
0
50
75
100
25
Type 1 Type 2 Type 3
010203040506070
8090 10
2030
404535
2515
50m
20406080
100%
m
010203040506070
8090 10
2030
404535
2515
50m
20406080
100%
m
(a) (b)
(c) (d)
Fig. 5 Mapping of the distribution of mitotypes within a mixed
field yields complex ‘Pathoscapes’. A series of samples taken at
15 by 10 m squares across a field were prepared separately
and each assigned their own barcode pair. The relative abun-
dance of each mitotype at each locus in the field may reflect a
complex underlying ‘pathoscape’. Highly localized peaks of
primarily single mitotypes dominate.
© 2015 The Authors. Molecular Ecology Published by John Wiley & Sons Ltd.
GLOBODERA PALLIDA METAGENETICS 5849

sures imposed by various cultivars on the pathoscape
and indeed critical evaluation of mitotypes as a proxy for
pathotypes. The field can be planted, resampled and re-
assessed to determine effect of cultivar choice, or indeed
nematicide application, on the population composition.
Given the accuracy with which we are able to distinguish
between narrow ratios of mitotypes (Fig. 3), even fine
perturbations from a single cropping cycle should be
detectable. Regularly sampling the same fields across a
country will allow analysis of the spread or decline of
certain mitotypes over time. This is particularly poignant
for the study of putative novel mutations/introductions,
as described above, which may increase in prevalence.
The risks associated with emergence and subsequent
spread of new highly virulent lineages of the potato late
blight Phytophthora infestans are well recognized (Chow-
dappa et al. 2013).
It has been suggested that genetic variation at the level
of field, or indeed region, is already described at the
level of the individual host plant (Plantard et al. 2008).
Given that (i) all mitotypes have a broad national distri-
bution and yet ~80% of fields have a single mitotype
and (ii) within mixed fields, local troughs and peaks of
single mitotypes dominate, the data presented indicate
this suggestion underestimates the true detail of PCN
genetic variation. Our study also provides evidence in
favour of ‘hybrid’ cysts and identifies geographical
locations where these are likely to occur (on the basis of
the presence of mixed populations of PCN). If the origi-
nal introductions of G. pallida from S. America were geo-
graphically isolated, as suggested in the study by
Plantard et al. (2008), then multiple mitotypes within a
field could give rise to novel hybrids. Also given the
polyandrous nature of the female potato cyst nematode,
the implications for virulence of interpathotype breeding
require investigation. Furthermore, the restricted inheri-
tance of mitochondrial genomes may suggest that hybrid
mitotypes are actually underestimated.
Errors can be introduced at every step in the
described approach: barcode design, primer synthesis,
PCR, library preparation, sequencing and bioinformatic
analyses. While some error is unavoidable, error propa-
gation throughout the experiment was of real concern,
and thus at every stage, at least one measure was
included to minimize error where possible. This, cou-
pled with the stringent bioinformatic filtering and inclu-
sion of appropriate controls, resulted in a useful level
of sensitivity and specificity. The adopted approach
was designed to, as far as possible, reduce costs and
facilitate reproduction of the results. The aim is to
promote adoption of this technique in nematology and
further afield. The ability to simultaneously address
multiple high-value questions in a single experiment is
testament to the power of next-generation sequencing.
Acknowledgements
The James Hutton Institute receives funding from the Scottish
Government Rural and Environment Science and Analytical
Services division. This study was supported by the Scottish
Society for Crop Research and The University of Leeds Sustain-
able Agriculture Bursary Fund. SE-vdA is supported by BBSRC
grant BB/M014207/1.
References
Armstrong MR, Blok VC, Phillips MS (2000) A multipartite
mitochondrial genome in the potato cyst nematode Globodera
pallida. Genetics, 154, 181–192.Barone A, Ritter E, Schachtschabel U, Debener T, Salamini F,
Gebhardt C (1990) Localization by restriction-fragment-
length-polymorphism mapping in potato of a major domi-
nant gene conferring resistance to the potato cyst nematode
Globodera rostochiensis. Molecular and General Genetics, 224,
177–182.Bolger AM, Lohse M, Usadel B (2014) Trimmomatic: a flexible
trimmer for Illumina sequence data. Bioinformatics, 30, 2114–2120.
Chowdappa P, Kumar NB, Madhura S et al. (2013) Emergence
of 13_A2 blue lineage of Phytophthora infestans was responsi-
ble for severe outbreaks of late blight on tomato in south-
west India. Journal of Phytopathology, 161, 49–58.Edgar RC (2004) MUSCLE: multiple sequence alignment with
high accuracy and high throughput. Nucleic Acids Research,
32, 1792–1797.
0
25
50
75
100
1 2 3 4 5 6 7 8 9 10 11 12 13 14 15 16 17 18 19 20 21 22
Type 1 Type 2 Type 3
%
Individual cysts
Fig. 6 The distribution of mitotypes at
the level of individual cysts. The genetic
complement of 22 individual cysts, col-
lected from mixed and single mitotype
fields, with respect to the mitotype struc-
ture was analysed. The vast majority of
cysts comprise only a single mitotype.
However, cyst 22 (arrow) appears to con-
tain a mix of mitotype 1: mitotype 3 at a
ratio of approximately 33:66 – well
within the confidence limits of the exper-
iment.
© 2015 The Authors. Molecular Ecology Published by John Wiley & Sons Ltd.
5850 S . EVES- VAN DEN AKKER ET AL.

Eves-van den Akker S, Lilley CJ, Jones JT, Urwin PE (2014)
Identification and characterisation of a hyper-variable
apoplastic effector gene family of the potato cyst nematodes.
PLoS Path, 10, e1004391.
Gibson T, Blok VC, Phillips MS et al. (2007) The mitochondrial
subgenomes of the nematode Globodera pallida are mosaics:
evidence of recombination in an animal mitochondrial gen-
ome. Journal of Molecular Evolution, 64, 463–471.Gordon A, Hannon G (2010). Fastx-toolkit. FASTQ/A short-
reads preprocessing tools (unpublished) http://hannon-
lab.cshl.edu/fastx_toolkit.
Hockland S, Niere B, Grenier E et al. (2012) An evaluation of
the implications of virulence in non-European populations of
Globodera pallida and G. rostochiensis for potato cultivation in
Europe. Nematology, 14, 1–13.Hoolahan AH, Blok VC, Gibson T, Dowton M (2011) Paternal
leakage of mitochondrial DNA in experimental crosses of
populations of the potato cyst nematode Globodera pallida.
Genetica, 139, 1509–1519.Hoolahan AH, Blok VC, Gibson T, Dowton M (2012) A com-
parison of three molecular markers for the identification of
populations of Globodera pallida. Journal of Nematology, 44,
7–17.Kort J, Ross H, Rumpenhorst H, Stone A (1977) An interna-
tional scheme for identifying and classifying pathotypes of
potato cyst-nematodes Globodera rostochiensis and G. pallida.
Nematologica, 23, 333–339.Milne I, Lindner D, Bayer M et al. (2009) TOPALi v2: a rich
graphical interface for evolutionary analyses of multiple
alignments on HPC clusters and multi-core desktops. Bioin-
formatics, 25, 126–127.Mimee B, Duceppe MO, V�eronneau PY et al. (2015) A new
method for studying population genetics of cyst nematodes
based on Pool-Seq and genomewide allele frequency analy-
sis. Molecular Ecology Resources, 15, 1356–1365.Minnis ST, Haydock PPJ, Ibrahim SK, Grove IG, Evans K, Rus-
sell MD (2002) Potato cyst nematodes in England and Wales
– occurrence and distribution. Annals of Applied Biology, 140,
187–195.Nicol JM, Turner SJ, Coyne DL, den Nijs L, Hockland S, Maafi
ZT (2011) Current nematode threats to world agriculture. In:
Genomics and Molecular Genetics of Plant-Nematode Interac-
tions–Jones (eds Gheysen G, Fenoll C), pp. 21–43. Springer,Dordrecht.
Phillips M, Trudgill D (1998) Variation of virulence, in terms of
quantitative reproduction of Globodera pallida populations,
from Europe and South America, in relation to resistance
from Solanum vernei and S. tuberosum ssp. andigena CPC
2802. Nematologica, 44, 409–423.Plantard O, Picard D, Valette S, Scurrah M, Grenier E, Mug-
niery D (2008) Origin and genetic diversity of Western Euro-
pean populations of the potato cyst nematode (Globodera
pallida) inferred from mitochondrial sequences and
microsatellite loci. Molecular Ecology, 17, 2208–2218.Reid A, Evans F, Mulholland V, Cole Y, Pickup J (2015)
High-throughput diagnosis of potato cyst nematodes in soil
samples. Plant Pathology: Techniques and Protocols, 1302, 137–148.
Turner SJ (1996) Population decline of potato cyst nematodes
(Globodera rostochiensis, G. pallida) in field soils in Northern
Ireland. Annals of Applied Biology, 129, 315–322.Zhang J, Kobert K, Flouri T, Stamatakis A (2014) PEAR: a fast
and accurate Illumina Paired-End reAd mergeR. Bioinformat-
ics, 30, 614–620.
S.E.V.D.A., V.C.B. and C.J.L. designed research.
S.E.V.D.A. performed research and analyzed the data.
A.R., E.A., J.P., M.B., P.E.U. and J.T.J. contributed
regents or analytical tools. S.E.V.D.A. and V.C.B. wrote
the paper.
Data accessibility
All raw DNA sequences are available under ENA Accession no.
PRJEB10033. In addition, all custom scripts used to analyse the
data, detailed list of commands used, and all scripts to repro-
duce computationally generated figures are publically available
under GitHub repository https://github.com/sebastianevda/
SEvdA_metagen.git. All alignments, phylogenetic trees and
analysed data are available under Dryad Accession doi:
10.5061/dryad.pd7r6.
Supporting information
Additional supporting information may be found in the online ver-
sion of this article.
Table S1 Primers which amplify a region of G. pallida cyt B
that is descriptive of each mitotype.
Table S2 Thirty, 4 base pair barcodes, designed to be unique
by at least two base pairs.
Table S3 SNP comparison between mitotypes 1, 2, 3 and the
7th most common sequence.
Fig. S1 Mapping of the distribution of mitotypes at an addi-
tional site within a mixed field supports complex ‘Pathoscapes’.
© 2015 The Authors. Molecular Ecology Published by John Wiley & Sons Ltd.
GLOBODERA PALLIDA METAGENETICS 5851