educ 500: introduction to educational research dr. stephen petrina dr. franc feng department of...
TRANSCRIPT

EDUC 500:
Introduction to Educational Research
Dr. Stephen Petrina
Dr. Franc Feng
Department of Curriculum Studies
University of British Columbia
(Explanation)
Cultural & Social Processes & Forces, Nature, Ideologies,
Mentalities, Grand Narratives Structure

QuickTime™ and aTIFF (Uncompressed) decompressor
are needed to see this picture.
EDUC 500
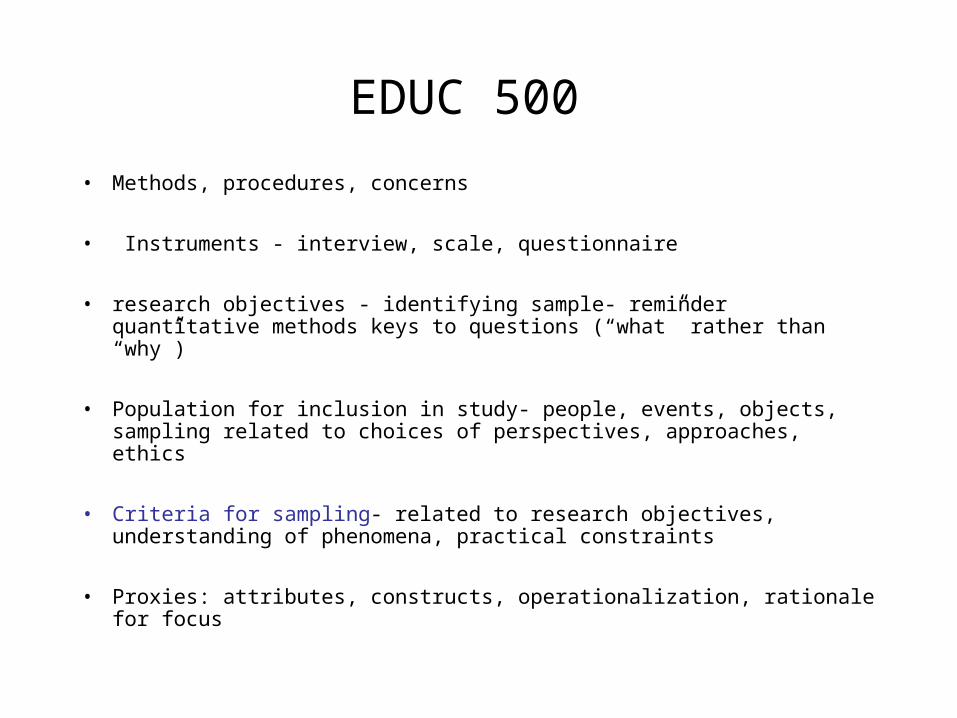
• Methods, procedures, concerns
• Instruments - interview, scale, questionnaire
• research objectives - identifying sample- reminder quantitative methods keys to questions (“what” rather than “why”)
• Population for inclusion in study- people, events, objects, sampling related to choices of perspectives, approaches, ethics
• Criteria for sampling- related to research objectives, understanding of phenomena, practical constraints
• Proxies: attributes, constructs, operationalization, rationale for focus
EDUC 500
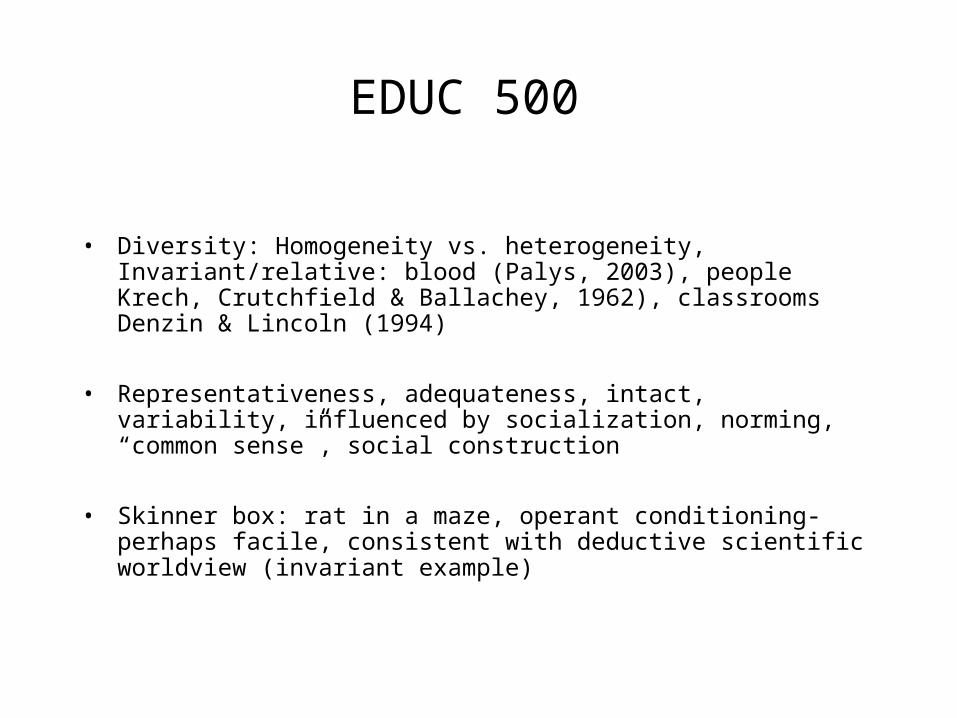
• Diversity: Homogeneity vs. heterogeneity, Invariant/relative: blood (Palys, 2003), people Krech, Crutchfield & Ballachey, 1962), classrooms Denzin & Lincoln (1994)
• Representativeness, adequateness, intact, variability, influenced by socialization, norming, “common sense”, social construction
• Skinner box: rat in a maze, operant conditioning- perhaps facile, consistent with deductive scientific worldview (invariant example)

EDUC 500
• Deductive model - Research in which theory is driven by a priori underlying assumptions
• Functioning to test, explain, affirm (closed); influences sampling choices, exceptions exist (e.g. exploratory factor analysis)
• Limitations in putting theory before research- preconceived notions, socialization factors, where “a procedural research decision implicitly reaffirms and supports a particular social arrangement” (Paly. 2003: 127)
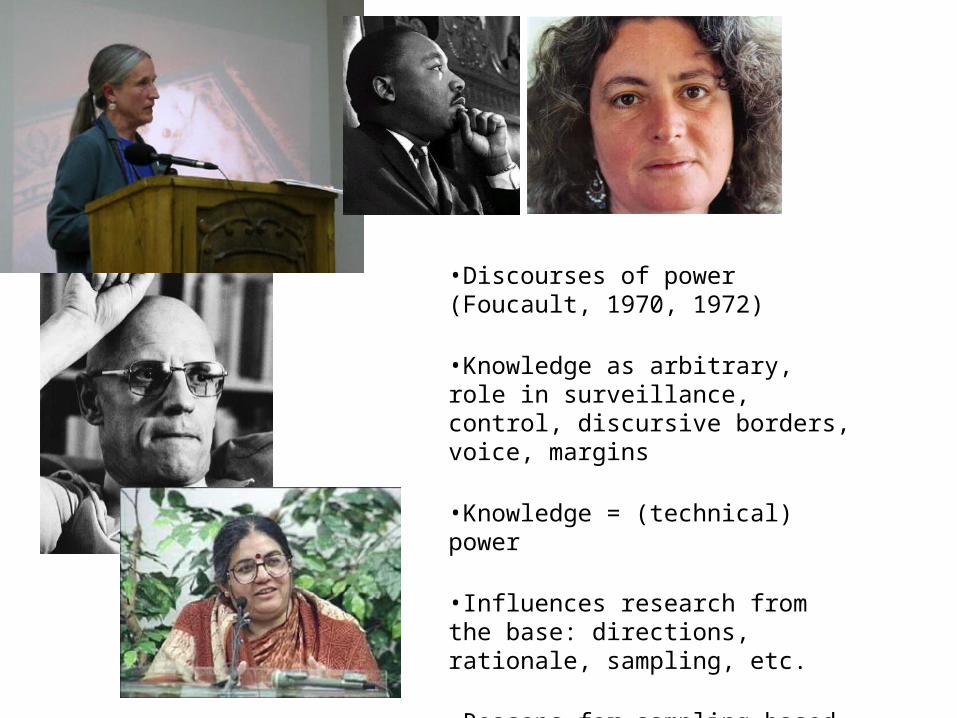
•Discourses of power (Foucault, 1970, 1972)
•Knowledge as arbitrary, role in surveillance, control, discursive borders, voice, margins
•Knowledge = (technical) power
•Influences research from the base: directions, rationale, sampling, etc.
•Reasons for sampling based on alternate rationale that pays attention to the margins
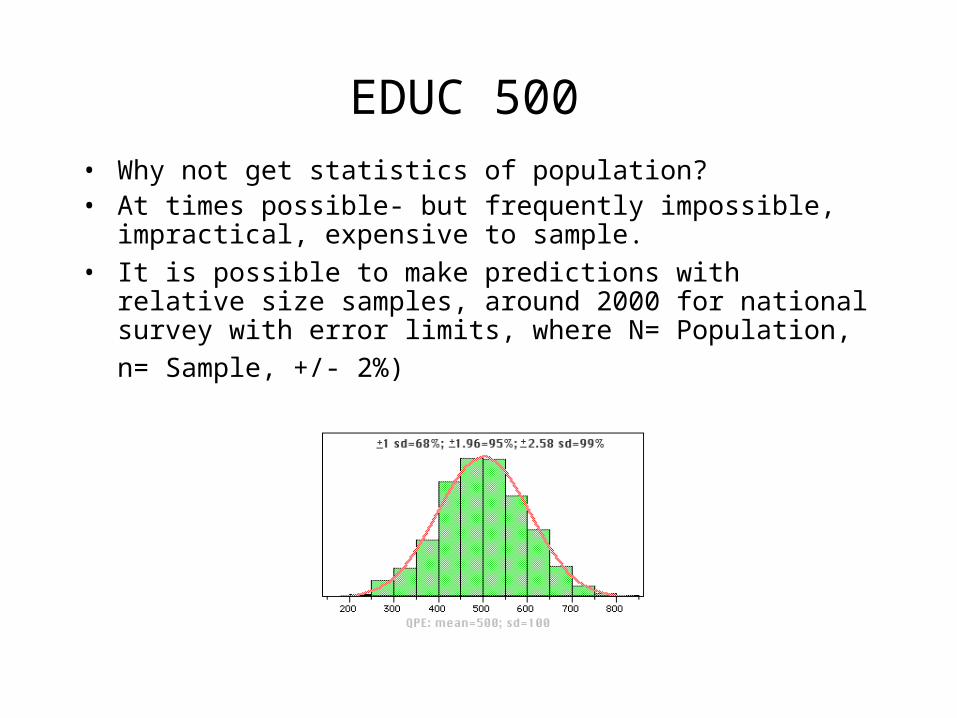
EDUC 500 • Why not get statistics of population? • At times possible- but frequently impossible, impractical,
expensive to sample. • It is possible to make predictions with relative size samples,
around 2000 for national survey with error limits, where N=
Population, n= Sample, +/- 2%)

EDUC 500
• Sampling implications - • Introduce error• Idea is to minimize this error, with larger samples, • Declare the margin error we are willing to tolerate• When we “find” significance when there is none - generally set
the alpha level at 0.05 (1 in 20), can set at 0.01 (1 in 100) or if it is really critical 0.001 (1 in 1000)

Sampling • Sampling language/terminology
– connected with probability theory
– universe, population unit of analysis
– sampling elements
– sampling frame – Representativeness
– sampling ratio
– sampling error
Sampling
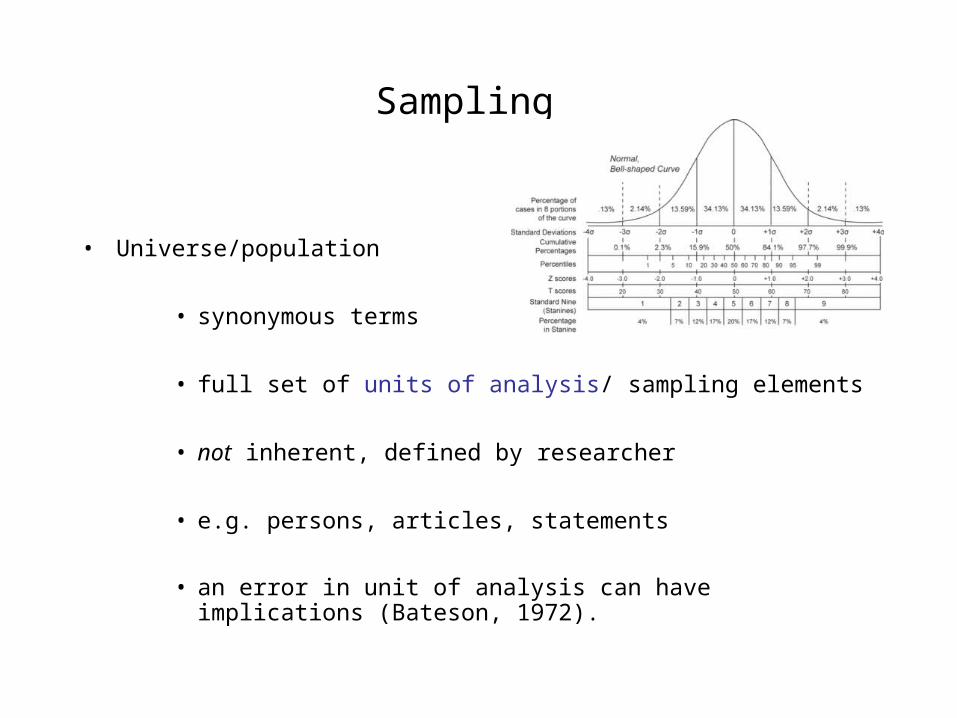
• Universe/population
• synonymous terms
• full set of units of analysis/ sampling elements
• not inherent, defined by researcher
• e.g. persons, articles, statements
• an error in unit of analysis can have implications (Bateson, 1972).
Sampling • Sampling frame
• from population, sampling error
• introduce problems with representativeness
• Probabilistic sampling
• Representativeness
• Descriptions of variability, normality, linearity, outliers
• Implications for ability to generalize back to population
• Larger sample size and random selection helps to minimize errors in probabilistic sampling

Probability-Based Sampling • Probability-Based Sampling
• within margin of error- with random sampling
• all elements have equal probability of being selected
• every element is listed once and once only
• minimizes sampling error, deviation from population mean
Sampling errors
• Two main errors we need to be concerned with :
– 1) Systematic errors - the introduction of systematic bias
– 2) Random errors- due to vagaries of chance variation (range of certainty, e.g. 47 to 53), larger sample size, better estimate of “real” figure
• See table: how as sample size increases
– lower sampling error, as size of confidence interval decreases (Palys, 2003: 131, 132)
– Yet, note counter- example of Bush speech with CBS twin polls: touchtone phone in vs. commissioned survey (p.138-139)
Tyranny of the majority
• Tyranny of the majority (Palys, 132)
– two languages/meanings of representation
– dominant group vs. under-represented minority groups
– one way to ensure rights of the minority groups are “represented”- research sub-groups
– If as researchers, we are concerned with issues of marginalization, minority interests/disparaged social groups, then probabilistic sampling might not be an issue.
– If we are less concerned with need to mirror the population in which representation is disproportionate, as we shall see, there are non-probabilistic sampling/qualitative approaches
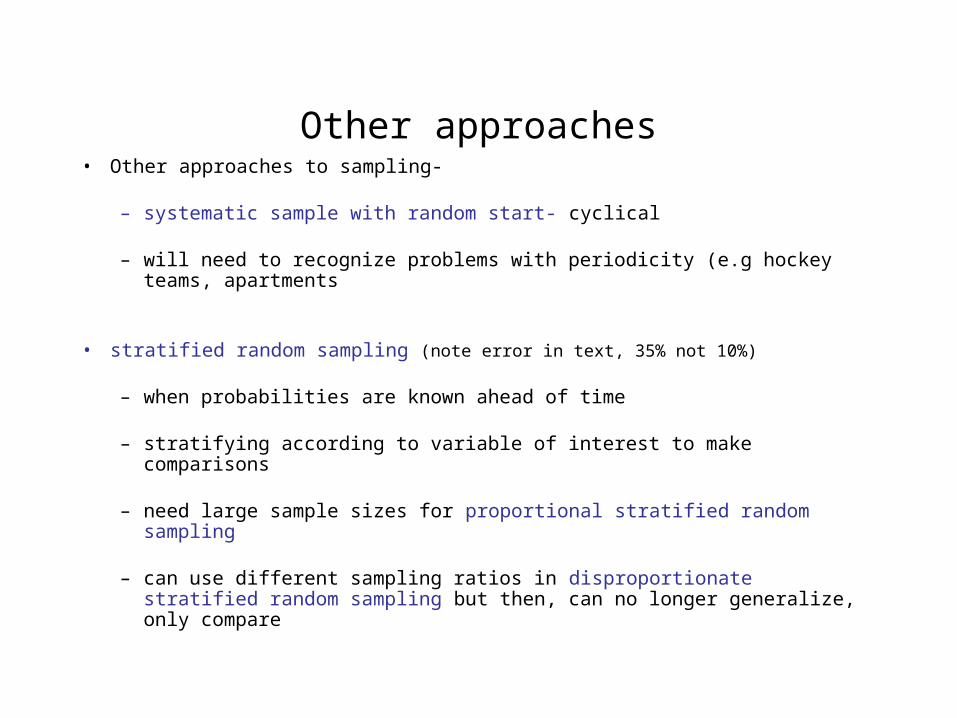
Other approaches• Other approaches to sampling-
– systematic sample with random start- cyclical
– will need to recognize problems with periodicity (e.g hockey teams, apartments
• stratified random sampling (note error in text, 35% not 10%)
– when probabilities are known ahead of time
– stratifying according to variable of interest to make comparisons
– need large sample sizes for proportional stratified random sampling
– can use different sampling ratios in disproportionate stratified random sampling but then, can no longer generalize, only compare
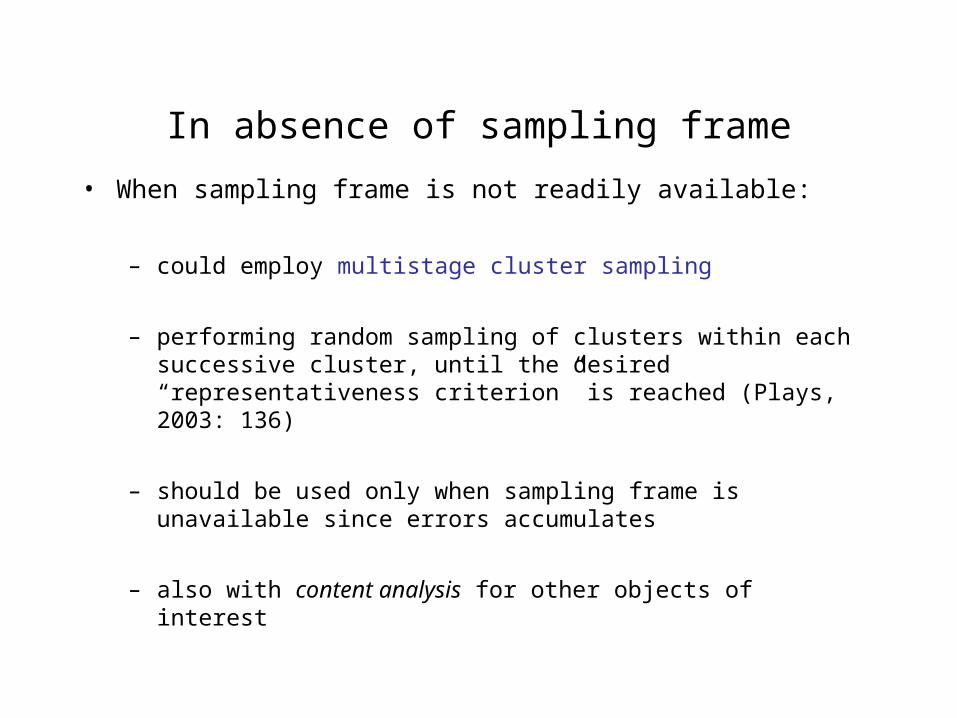
In absence of sampling frame
• When sampling frame is not readily available:
– could employ multistage cluster sampling
– performing random sampling of clusters within each successive cluster, until the desired “representativeness criterion” is reached (Plays, 2003: 136)
– should be used only when sampling frame is unavailable since errors accumulates
– also with content analysis for other objects of interest
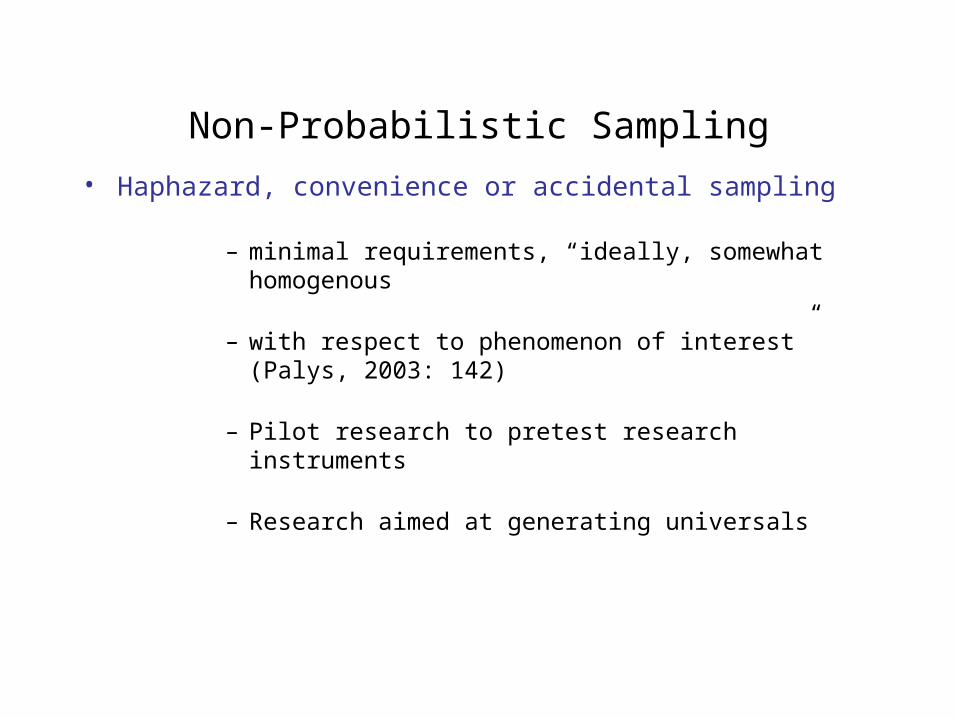
Non-Probabilistic Sampling
• Haphazard, convenience or accidental sampling
– minimal requirements, “ideally, somewhat homogenous
– with respect to phenomenon of interest” (Palys, 2003: 142)
– Pilot research to pretest research instruments
– Research aimed at generating universals

Non-Probabilistic Sampling• Purposive sampling
– Does not aim for formal representativeness
– Intentionally sought for criteria
– Reflects researcher’s interest and understanding of phenomenon of interest
– When sampling individuals could be more inductive, exploratory
– Field-based research : choice of informants- including naïve, frustrated, outsider, rookie, “outs”, old hand (Dean et al., 1969)
– Informants vary in willingness to disclose
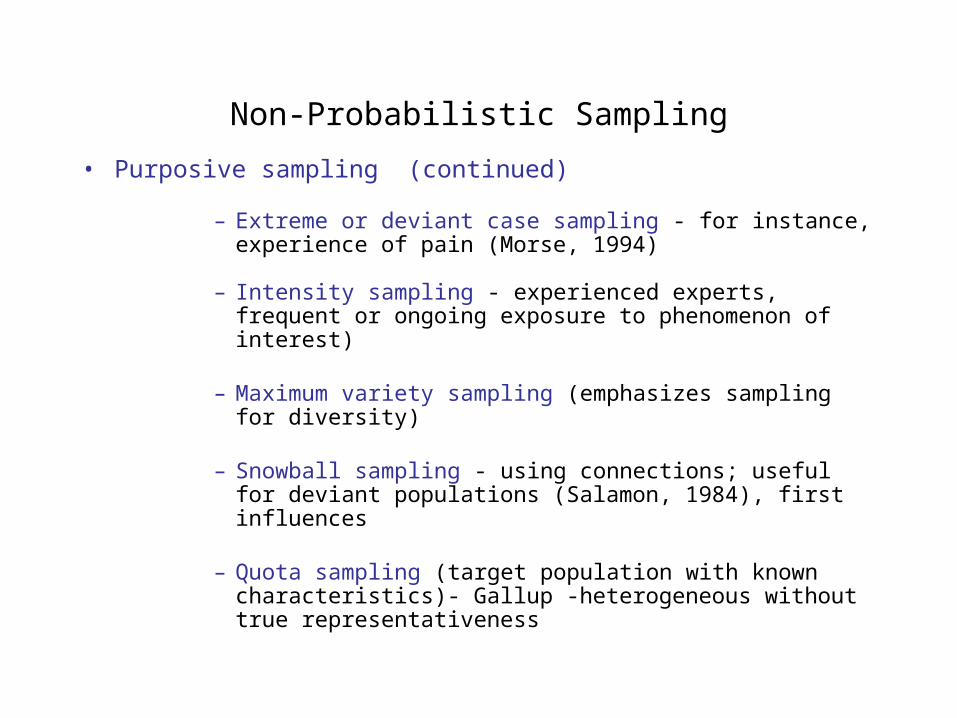
Non-Probabilistic Sampling • Purposive sampling (continued)
– Extreme or deviant case sampling - for instance, experience of pain (Morse, 1994)
– Intensity sampling - experienced experts, frequent or
ongoing exposure to phenomenon of interest)
– Maximum variety sampling (emphasizes sampling for diversity)
– Snowball sampling - using connections; useful for deviant populations (Salamon, 1984), first influences
– Quota sampling (target population with known characteristics)- Gallup -heterogeneous without true representativeness
Eliminating rival hypothesis• Towards relational research: relationships, explanations
• Experimentalist– Classic experiment– Quasi-experimentation– Case-Study analysis
• Share common logic- control over rival plausible explanations
• Make reasonable inferences about causes
• Approaches vary in degree emphasize:
– Manipulative or analytical control

Towards experimental design• Science three types of questions, according to Lofland (1971)
– Characteristics– Causes – Consequences
• Expand to include considerations of antecedents (causes) of phenomena of interest
• Implications (consequences) for other variables of interest
• Focus turns to examining relationships among variables and explaining how variables interact to produce phenomena of interest
• Informed by literature, allows for theorizing by examining relationships
The Problem of Causality
• Causal relationships, causality
• Differ slightly from Palys’ treatment of causality
• Non-trivial to claim causation
• Although Palys adds, “we cannot say that the experiment proved Pascal’s theory.
• Why? Why not? What can we say at best?
• Role of theory in contributing to explanation
Cook and Campbell (1979) - Torricellian vacuum, Pascal’s experiment
• Pascal’s historical experiment, elements of experimental design
• Independent variable - effect to assess, manipulable
• Dependent variable - measure of “effect” of independent variable
• Comparison to test for treatment effect
• Design: compare two tubes exposed to identical conditions except for treatment (change in altitude)
• Support, consistent, although cannot say proved: competing theories, “jury never quite out”
• Towards terminology and logic of experimentation
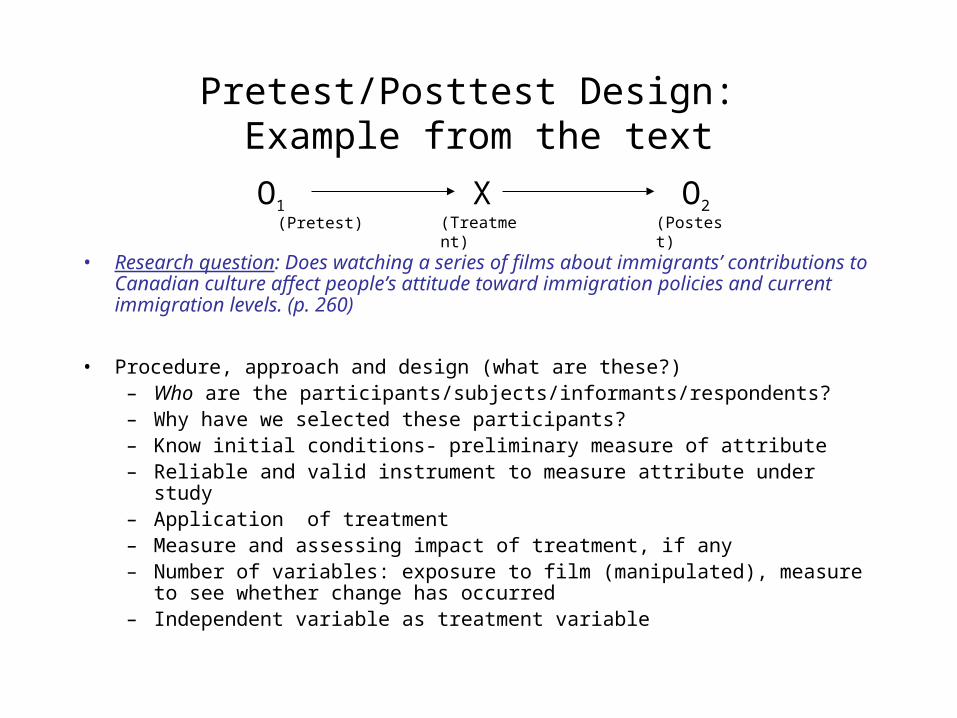
Pretest/Posttest Design: Example from the text
• Research question: Does watching a series of films about immigrants’ contributions to Canadian culture affect people’s attitude toward immigration policies and current immigration levels. (p. 260)
• Procedure, approach and design (what are these?)– Who are the participants/subjects/informants/respondents?– Why have we selected these participants?– Know initial conditions- preliminary measure of attribute– Reliable and valid instrument to measure attribute under study– Application of treatment– Measure and assessing impact of treatment, if any– Number of variables: exposure to film (manipulated), measure to see
whether change has occurred– Independent variable as treatment variable
X O2O1(Pretest) (Treatment) (Postest)

Internal Validity & Research Design
• If there is change, can we attribute it to our independent variable?
• How confident are we that the change was due to the variable that we manipulated?
• Enter internal validity: “the extent to which differences observed in the study can be unambiguously attributed to the experimental treatment itself, rather than other factors” (Campbell & Stanley, 1963) - they “wrote the book”
• Key question: “… to what extent, can we be confident that the differences we observed are caused by the independent variable per se, rather than by rival plausible explanations?” (Palys, 261).
• We need to consider possible “threats” to internal validity (Campbell & Stanley, 1963). What are some of these?
• No matter how we try to minimize the possibility, random errors will occur…
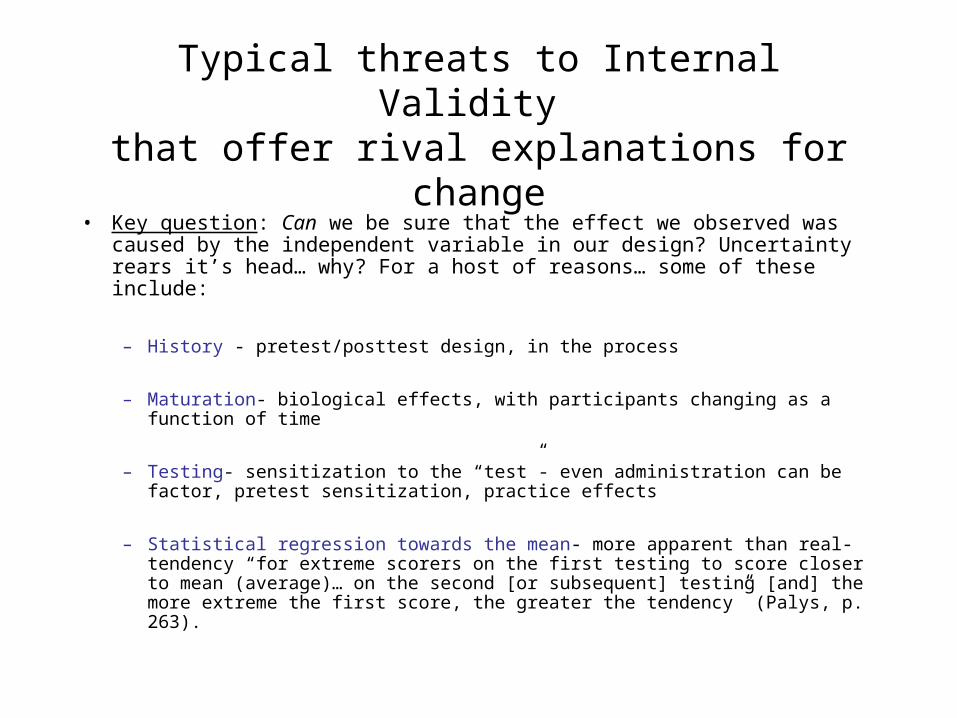
Typical threats to Internal Validity that offer rival explanations for change
• Key question: Can we be sure that the effect we observed was caused by the independent variable in our design? Uncertainty rears it’s head… why? For a host of reasons… some of these include:
– History - pretest/posttest design, in the process
– Maturation- biological effects, with participants changing as a function of time
– Testing- sensitization to the “test”- even administration can be factor, pretest sensitization, practice effects
– Statistical regression towards the mean- more apparent than real- tendency “for extreme scorers on the first testing to score closer to mean (average)… on the second [or subsequent] testing [and] the more extreme the first score, the greater the tendency” (Palys, p. 263).
References
Images used in this presentation were sourced from the following URLs:– People on the move: http://www.freefoto.com/preview.jsp?id=04-26-
13&k=People+on+the+move– Starhawk: http://www.gayblock.com/wsltwo.html– Martin Luther King: http://www.kycourts.net/AOC/MinorityAffairs/Martin Luther King, Jr. --
3.jpg– Donna Haraway: http://www.egs.edu/images/faculty/donna-haraway-2-03.jpg– Vandana Shiva: http://www.workingtv.com/images25/vandana300.jpg– Michel Foucault: http://www.iranao.com/newsimages/Foucault.2.jpg– Normal curve (animated): http://research.med.umkc.edu/tlwbiostats/sem03.html– Normal curve:
http://upload.wikimedia.org/wikipedia/en/thumb/b/bb/Normal_distribution_and_scales.gif/500px-Normal_distribution_and_scales.gif