educational service district 113 tumwater, wa...transfer of contract for spokane international...
TRANSCRIPT

SBE Vision: An education system where students are engaged in personalized education pathways that prepare them for civic engagement, careers, postsecondary education, and lifelong learning.
BOARD MEETING January 15-16, 2020
Educational Service District 113 Tumwater, WA

WASHINGTON STATE BOARD OF EDUCATION
JANUARY 15-16, 2020 BOARD MEETING
Capital Region Educational Service District 113
Tuesday, January 14 6:00-8:00 p.m. Community Forum: Equity and Graduation Pathways Capital Region Education Service District 113 6005 Tyee Dr. SW, Tumwater, Washington 98512 Moderator: Holly Koon, Board Member
Wednesday, January 15 8:00-8:45 a.m. Welcome/Call to Order Peter Maier, Board Chair
• Land Acknowledgement: Squaxin, Nisqually, and Chehalis Tribes • Pledge • Local Welcome: Kristen Jaudon, Senior Director - Communications,
Government Relations & Public Engagement, ESD 113 • Welcome New Board Members • Swearing In • Welcome New Staff
Consent Agenda The purpose of the Consent Agenda is to act upon routine matters in an expeditious manner. Items placed on the Consent Agenda are determined by the Chair, in cooperation with the Executive Director, and are those that are considered common to the operation of the Board and normally require no special board discussion or debate. A board member may request that any item on the Consent Agenda be removed and inserted at an appropriate place on the regular agenda. Items on the Consent Agenda for this meeting include:
• Approval of minutes from the November Board Meeting

WASHINGTON STATE BOARD OF EDUCATION
8:45-9:15 Executive Director Update Randy Spaulding, Executive Director
9:15-9:45 Staffing Enrichment Recommendations Member Holly Koon Michaela Miller, Deputy Superintendent, OSPI 9:45-10:00 Break 10:00-11:00 Committee and Member Updates Randy Spaulding, Executive Director Board Members 11:00-11:45 Equity Statement and Summit Planning Patty Wood, Board Member Stephanie Davidsmeyer, SBE Staff
11:45-12:00 Public Comment 12:00 – 1:00 Lunch 1:00-2:00 High School Graduation Forecast and Class of 2019 Results Andrew Parr, Director of Research, SBE
Patrick Lane, Vice President, Policy Analysis and Research, Western Interstate Commission for Higher Education (WICHE) Deb Came, Assistant Superintendent, Assessment and Student Information, OSPI
2:00-2:30 HS Diploma Requirements and Pathways
Linda Drake, SBE Staff Alisha Strobel, Strobel Consulting
2:30-2:45 Break 2:45-3:45 Phase II Metrics for School Recognition Andrew Parr, SBE Staff

WASHINGTON STATE BOARD OF EDUCATION
Stephanie Davidsmeyer, SBE Staff Michaela Miller, Deputy Superintendent, OSPI
Maria Flores, Director of Title II, Part A, OSPI 3:45-4:15 Basic Education Compliance Parker Teed, SBE Staff
4:15-4:45 Student Presentation Margarita Amezcua, Board Member 5:30-7:00 Dinner
Thursday, January 16 8:00-8:15 a.m. Welcome/Call to Order 8:15-8:45 Legislative Kick-off and Update J. Lee Schultz, Director of Advocacy and Engagement Orlando Cano, Cano Consulting, LLC
8:45-9:30 Charter School Update Andrew Parr, SBE Staff Parker Teed, SBE Staff CSC, Spokane Public Schools, Spokane International Academy
9:30-9:45 Public Comment
9:45-10:30 Business Items
• Approval of Basic Education Compliance for 2019-2020 School Year
• Approval of Charter Public Schools Report • Approval of Transfer of Contract for Spokane International
Academy from Spokane Public Schools to Charter School Commission
• Adoption of Phase II Recognition Methodology • Adoption (or reaffirmation) of Equity Statement

WASHINGTON STATE BOARD OF EDUCATION
• Adoption of Final Rules for Waivers (WAC 180-18) • Approval of Temporary Waiver from Graduation Requirements in
WAC 180-51-068 for Peninsula College • Adoption of Revised Board Norms • Adoption of Revised Board Vision Statement
11:00-12:30 Joint lunch: Professional Educator Standards Board (PESB) and SBE Waterstreet Café, 610 Water St. SW. Olympia, WA 98501 Randy Spaulding, Executive Director SBE Alexandra Manuel, Executive Director PESB 12:30-4:00 Member availability to meet with Legislators

The Washington State Board of Education An education system where students are engaged in personal ized education pathways that prepare them
for civic engagement , careers, postsecondary education , and lifelong learning .
Executive Director Update PREPARED FOR THE JANUARY 2020 BOARD MEETING
Information and Action
Materials included in packet: • Executive Director Update PowerPoint • Public Disclosure Information PowerPoint – Additional Materials • Proposed Waiver Rules (WAC 180-18) - Action • Peninsula College Waiver Application - Action • Mastery-based Learning Interim Report
Synopsis: The executive director’s update for January includes updates on board membership and staffing, a brief overview of public disclosure and public meetings requirements, a summary of comments received and next steps for waiver rules (WAC 180-18), an update of the Mastery-based Learning Workgroup and report, and a preview of planned business items.
Business Items: • Approval of Basic Education Compliance for 2019-2020 School Year • Approval of Charter Public Schools Report • Approval of Transfer of Contract for Spokane International Academy from
Spokane Public Schools to Charter School Commission • Adoption of Phase II Recognition Methodology • Adoption (or reaffirmation) of Equity Statement • Adoption of Final Rules for Waivers (WAC 180-18) • Approval of temporary waiver graduation requirements in WAC 180-51-068 for
Peninsula College • Adoption of Revised Board Norms • Adoption of Revised Board Vision Statement
7

White White
Executive Director Update Washington State Board of Education
January 15, 2020

Conversation Today Business Items Basic Education Compliance for 2019-2020 School Year Charter Public Schools Report Transfer of Contract for Spokane International Academy from Spokane Public
Schools to Charter School Commission Adoption of Phase II Recognition Methodology Reaffirmation of Equity Statement Final Rules for Waivers (WAC 180-18) Waiver from 24-Credit Graduation Requirements for Peninsula College Revised Board Norms Revised Board Vision Statement
Updates Board Member Updates Staff Updates Open Public Meetings and Public Disclosure Waiver Rules (WAC 180-18) Mastery-based Learning Legislative Report
2

Board Member Update
3

Board Member Updates
New Members: • Western Region, Position
3 – Mary Fertakis, M.Ed. • Private School Rep –
Jan Brown
4
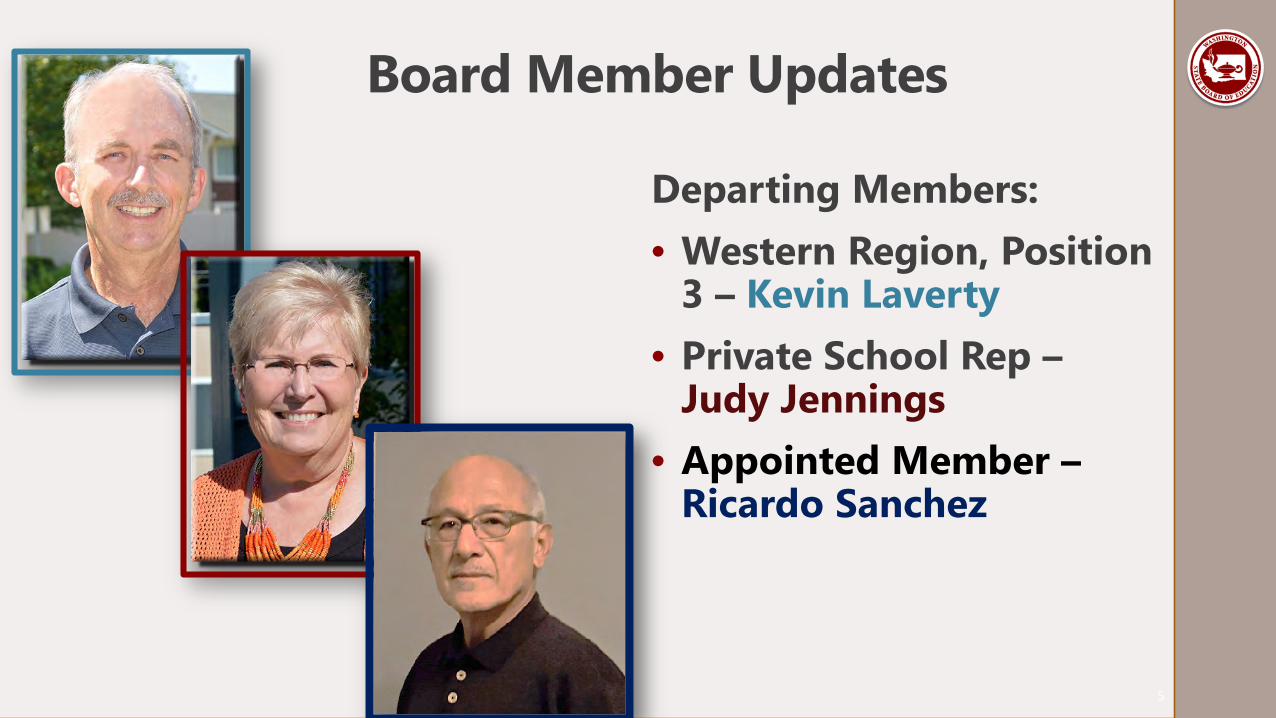
Board Member Updates
Departing Members: • Western Region, Position
3 – Kevin Laverty • Private School Rep –
• Appointed Member – Judy Jennings
Ricardo Sanchez
5

Standing Committees Executive Committee Chair: Peter Maier Vice Chair: MJ Bolt Member At-Large: Harium Martin-Morris Member At-Large: Bill S. Kallappa Member At-Large: Jeff Estes Staff: Randy Spaulding Student Voice Committee Co-Chair: Autymn Wilde Co-Chair: Margarita Amezcua MJ Bolt Ryan Brault Bill S. Kallappa II Patty Wood Staff: Parker Teed
Equity Committee Co-Chair: Patty Wood Co-Chair: Bill S. Kallappa II Ryan Brault Dr. Paul Pitre Dr. Susana Reyes Staff: Stephanie Davidsmeyer
Legislative Committee Chair: Patty Wood Holly Koon MJ Bolt Bill S. Kallappa II Staff: J. Lee Schultz
6

Ad-Hoc Committees School Awards and Recognition Workgroup (Expires June 2020) MJ Bolt Patty Wood Susana Reyes Bill S. Kallappa II Harium Martin-Morris Staff: Andrew Parr
Board Norms (Expires January 2020) Kevin Laverty Jeff Estes Judy Jennings Ryan Brault Dr. Paul Pitre Staff: Randy Spaulding
7

Staff Updates
8

Welcome Logan!
Logan Edward Muller (Alissa’s son) was born on December 11, and weighed 4lbs, 9.5 ounces. He’ll be the youngest
SBE “staff member” to date
9

Director of Advocacy and Engagement
Welcome J. Lee Schultz, Director of Advocacy and Engagement
Key duties include: Advocate for SBE mission and vision Maintain relationships both within and outside the Board Coordinate the development and drafting of agency request
legislation and budget requests. Prepare reports and presentations for the Board, Legislature,
partner organizations, and community groups During legislative session: Advocate for legislation aligned with SBE legislative and
strategic priorities. Coordinate legislative communication, including public
testimony, of Board members and staff. Schedule meetings for Board members, the Executive
Director, or staff with legislators or legislative staff as needed to provide information or to advance the priorities of the Board. 10

Open Public Meetings and Public Disclosure Linda Sullivan-Colglazier
11
i----------0----------t
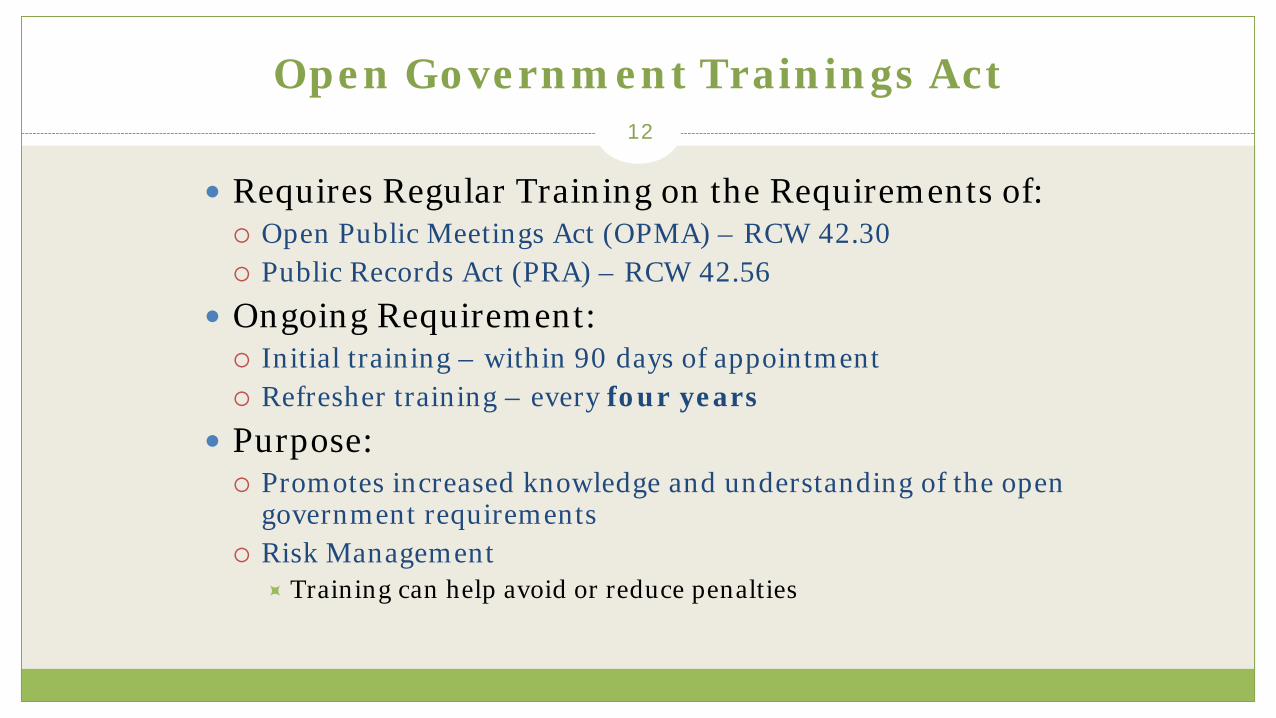
Open Government Trainings Act 12
Requires Regular Training on the Requirements of: Open Public Meetings Act (OPMA) – RCW 42.30 Public Records Act (PRA) – RCW 42.56
Ongoing Requirement: Initial training – within 90 days of appointment Refresher training – every four years
Purpose: Promotes increased knowledge and understanding of the open
government requirements Risk Management
Training can help avoid or reduce penalties

For More Information 13
State Board of Education website
Governor’s Boards and Commissions website
Boards and Commissions Handbook
Online New Appointee Training
Office of the Attorney General website Open Government Resource Manual Open Government Training
Executive Ethics Board website

Adoption of Final Rules for Waivers (WAC 180-18)
14

The proposed rules for Chapter 180-18 make the following changes to:
Streamline the 180-day waiver application process in WAC 180-18-040 to simplify analysis. Remove application requirements that have proven not to be helpful in the approval process and
present an additional burden on applicants. Add a requirement for districts to summarize how equity was considered in their proposed plan.
Remove language in WAC 180-18-050 that would require an application process for parent-teacher conference waivers for up to five days, thus reducing administrative burden for districts or the state.
15

The proposed rules for Chapter 180-18 make the following changes to:
Remove requirement in WAC 180-18-055 that the State Board of Education notify the State Board of Community and Technical Colleges, the Washington Student Achievement Council, and the Council of Presidents every time it passes a waiver from credit-based graduation requirements.
Allow the Office of Superintendent of Public Instruction greater discretion in approving of waivers for the purposes of economy and efficiency in WAC 180-18-065 when districts are competing for the allowable number of slots by considering “other relevant information.” Remove the order of criteria for the consideration of approval and broaden approval criteria. Add a requirement for districts to summarize how equity was considered in their proposed plan.
16

Temporary Waiver from 24-Credit Graduation Requirements for Peninsula College for the Class of 2019 and 2020
17

Peninsula College Requests a Temporary Waiver from 24-CreditGraduation Requirements in WAC 180-51-068
Peninsula College seeks to align to feeder districts, Port Angeles School District in particular.
Peninsula College is able to offer all requirements in WAC 180-51-068 and will continue to do so with students from districts that have already implemented the 24 credit requirements.
18

Mastery-Based Learning Update
19

~ Mastery-based Leaming ~ in Washington State
INTERIM REPORT Maste1y- based Learning Work Group
Decembe r 2019
PREPARED BY:
The Washington State
Board of Education
•- ·- ~ - - - r ., , learn a , ➔ practice ➔
1 . ~ake . . I _ana'l_yze &
' ew skm; ·. · I ·the s~ill mistakes ➔ hx mis .akes
/ ~ rialyze& ,t_
~ mis akes ...--
~ prac ice the skill
ask for help
➔
make ~ mistakes ~
Mastery-based Learning Interim Report to the Legislature
The Mastery-based Learning Interim Report of the Mastery-based Learning Work Group was submitted to the Legislature on December 9. 2019.
The report summarized: Activities of the work group in
2019 Areas for further work in 2020 Definition of terms Preliminary vision of the work
group WBL in Washington currently WBL in other states and countries
http://soltanimath.weebly.com/assessment-and-learning-process.html 20

Lea ..... i g ~ in Washington State
Next Meetings
Mastery-based Learning Work Group Meeting February 27, 2020, location to-be-determined WBL and high school transcripts
Webinar on Higher Education Models of Mastery-based Learning Date to-be-determined
21

Contact Information
Website: www.SBE.wa.gov Facebook: www.facebook.com/washingtonSBE Twitter: @wa_SBE Email: [email protected] Phone: 360-725-6025 Web updates: bit.ly/SBEupdates
22

Strategic Plan Priority I System Design
Goal: School and district structures and systems adapt to meet the evolving needs of the student population and community as a whole. Students are prepared to adapt as needed to fully participate in the world beyond the classroom.
Cover: FINAL ADOPTION OF RULES FOR CHAPTER 180-18 WAC (WAIVERS)
PREPARED FOR THE JANUARY 2020 BOARD MEETING
Information and Action
Proposed rules on waivers (Chapter 180-18 WAC) were filed with the Code Reviser on November 5, 2019. There are no staff recommendations for revision of the proposed rules. A public hearing was held on December 13, 2019 at the Old Capitol Building in Olympia with no comment received. A School District Fiscal Impact Statement was prepared by OSPI and no costs to districts were identified. Staff have received informal positive remarks on the rules from partners. The Board will consider final adoption of the rules at the January 2020 meeting.
Materials included in packet: • Copy of waiver rules recommended by staff for final adoption
Synopsis: The State Board of Education has reviewed WAC Chapter 180-18 to make changes as necessary to align rule to current policy or practice, correct references to law, implement recently passed legislation, improve readability of the rule, or make other changes identified during the review of the WAC Chapter. The proposed rules make the following changes to:
• Streamline the 180-day waiver application process in WAC 180-18-040 to simplify analysis. Remove application requirements that have proven not to be helpful in the approval process and present an
19

additional burden on applicants. Add a requirement for districts to summarize how equity was considered in their proposed plan.
• Remove language in WAC 180-18-050 that would require an application process for parent-teacher conference waivers for up to five days, thus reducing administrative burden for districts or the state.
• Remove requirement in WAC 180-18-055 that the State Board of Education notify the State Board of Community and Technical Colleges, the Washington Student Achievement Council, and the Council of Presidents every time it passes a waiver from credit-based graduation requirements. The schools receiving the waiver are listed on the SBE website and awareness of these waivers within the higher education system is such that these notifications are no longer necessary. Add a requirement for districts to summarize how equity was considered in their proposed plan.
• Allow the Office of Superintendent of Public Instruction greater discretion in approving of waivers for the purposes of economy and efficiency in WAC 180-18-065 when districts are competing for the allowable number of slots by considering “other relevant information.” Remove the order of criteria for the consideration of approval and broaden approval criteria. Add a requirement for districts to summarize how equity was considered in their proposed plan.
Business Items: • Adoption of Final Rule for Chapter 180-18 WAC (Waivers)
20
21
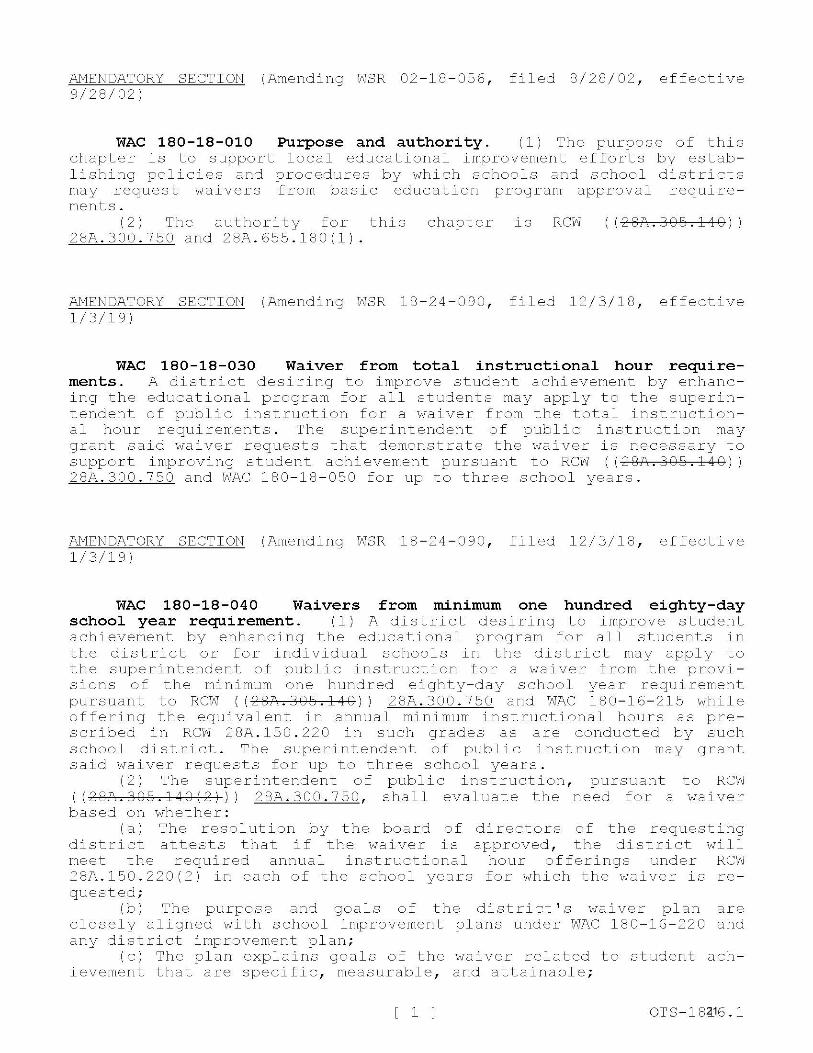
AMENDATORY SECTION (Amending WSR 02 -1 8- 05 6 , fil ed 8 / 28 / 02 , eff ec t iv e 9/2 8/ 02)
WAC 180-18-010 Purpose and authority. ( 1) The p ur p ose o f thi s ch a pter is to su p port local edu ca ti o n a l i mpr oveme n t eff or t s b y e st ab lishing policie s and p r oce dur e s by whi c h sc hool s a nd schoo l d i st ric t s ma y request waivers fr om basic e du ca t io n p r o gr am app r ova l req u ire ments.
(2) The auth o r i ty f or t his c h ap te r is RCW ( (28A.3 05. 1 40)) 2 8A.300. 75 0 a nd 28 A.6 55 .1 80 (1).
AMENDATORY SECTION (Amending WSR 1 8- 2 4- 0 90 , fil ed 1 2/ 3 / 1 8 , e ff ect i ve 1/3/1 9 )
WAC 180-18-030 Waiver from total instructional hour require-ments. A di st ric t d esiring t o impr o v e student a ch i e v e ment by e nhan c in g t he edu ca tion a l pr og ram f or all students may app l y t o th e s uper intendent o f public instruction for a wa i v e r f r om the tot a l in s tru c ti o nal h o ur re q uirements. The su p e rin tendent of p ub li c in s t r uction may g r a nt s aid wai v er requests that de monst ra te th e waiv e r i s n ecessa r y t o support i mpr ov i ng stud e nt a ch i evement p u rs u a nt t o RCW ( (2 8A. 305 . 1 4 0)) 28 A. 300 . 750 a nd WAC 1 80 -1 8-0 50 fo r up to thr ee s c ho ol years .
AMENDATORY SECTI ON (Amending WSR 1 8- 24 - 0 90 , fil ed 1 2/3/ 1 8 , e ff ec t ive 1/ 3 /1 9 )
WAC 180-18-040 Waivers from minimum one hundred eighty-day school year requirement. ( 1) A d i s tri c t d es i r in g t o i mprove s tud e nt a chi e v e me nt by e nh anc i ng t he e du ca t io n al p r og r am for a ll students i n th e di s t r i c t or f o r indivi dua l sc h oo l s i n the d istrict may apply t o the s upe rint e nd e nt of pu bli c in s tru c ti o n for a wa i ve r f rom the provi s i o n s of th e mini mum one hun d r ed e i ghty -d ay sc hoo l yea r req ui re me nt pu r s u a nt to RCW ((2 8A. 305 .14 0 )) 28 A. 300 . 750 a nd WAC 180-16-215 whi l e o fferin g the e q uiv a lent in annual minimum ins truct ional ho u r s as pre s crib e d in RCW 28A . 150 . 220 in s u c h g r ades as are c o nduc t ed b y s u ch sc h oo l d i s t r i c t. Th e s uper i ntendent o f p ub l ic i nstr u ct i o n may gran t sa id wa iver r eq ue s ts for up t o th ree s c hoo l years .
( 2 ) Th e s upe r in t en d en t o f pu bli c i nst r uct i on , p ur s u a nt t o RCW (( 28 A. 305 .140( 2 ))) 28 A. 300 . 750 , s h a ll eva lu a t e the nee d fo r a wa i ve r
base d o n wh e th er : ( a) Th e r es o l uti on b y th e boar d o f d ir ec t o r s of th e req u es t i n g
d i str i ct attests t h at i f t he wa i ve r i s app r ove d, the d istrict will mee t t he req uir e d annua l in s t r u c ti o n a l hou r o ff er in gs unde r RCW 28A .1 50 . 220(2 ) in eac h o f th e sc ho o l yea r s f or wh i ch th e waiver i s re quested ;
(b ) Th e p ur pose a nd goa ls of t he dis t ric t' s waiver plan are c l ose l y a li g n e d with sc h oo l i mprove me nt p l a n s un d e r WAC 1 80 - 16 - 220 and any d i st ri ct i mprovement p l an ;
(c) Th e p l a n explains goa l s o f the wa i ver re l a t ed t o s tu de n t ach i eve me nt th a t a r e spec ifi c , meas ur ab l e , a nd a tt a in ab l e ;
[ 1 l OTS- 1816 . 1

22
(d) The plan states c l ear and specific activities t o be undertak en that are based in evidence and likel y to lead t o a ttainment of the stated go a ls;
(e) The pla n specifies at lea st one st a te o r l oca ll y determined assessment or metric that will be used to collec t evidence to show the degree to whi c h the goals were a tt a ine d ;
(f) The plan descr ibes in detail th e pa rtici pa ti on o f administr a tors, t eachers, other district st aff, pare nts, a nd the com mun i ty in the development of the pla nL
(g) The plan summarizes how t he dist r i c t co ns idered equity i n the development of the plan. Th i s may i ncl ude , b u t is not li mi ted to, an equity analysis, community f eedback, or other mea n s to ass ess t h e con sequences of the wa iver.
(3 ) In addition t o the requireme nts of subsec t io n ( 2) o f this sect i o n, th e superintendent o f public inst r uction sha ll evaluate re quests for a waiver that wou l d represen t the cont i nuat i on o f an existin g wa i ver for add iti ona l years based o n the follo wing:
(a) ( ( The degree to which the prior ,,.raiver p l an I s goals r,,rere met, b ased on the assessments or metrics specified in the prior plan;
--f--B+)) The effect iv e n ess of the i mple mented ac t i v i t i es i n achiev-in g the goa l s of the p l a n for student a chieve ment;
(b) Explan a ti on of how the effectiveness of the plan is meas ured; (c) Any p r oposed ch a nges in the p l a n to a chieve the stated goals ; (d) ( (The lilcelihood that approval of the request would resul t in
advancement of the goals; -f-e-t)) Support by administrat or s, te ac hers, o the r d i str i c t staff ,
pare nt s , a nd the community for co ntinu a ti o n of the wa i ver .
AMENDATORY SECTION (Amend in g WSR 1 8- 2 4- 090 , f il ed 1 2/3/ 1 8 , effective 1/ 3/ 1 9 )
WAC 180-18-050 Procedure to obtain waiver. ( 1) Superin t endent of public i nstruction approval of dist r ict wa i ver r eq u es t s pursuan t t o WAC 1 80 -1 8-030 and 1 80 -1 8 - 040 sha ll occ ur pr i or t o i mple mentat i on . A district's wa iv er applicati o n sha ll i nc l ude, a t a mini mum, a resol ution adopted by th e d i s tri c t boa r d o f d ir ec tor s , a n app li cation f or m, a proposed school calendar, and a summary of the co lle c tive bargaining a g reement with the local educa t io n assoc i at i o n st ati ng the nu mber o f profess i o n a l d eve lopm e nt days , full i ns tr uc tio n days , la te - sta r t and e a rly-release days , and the amount of othe r noninstruction t i me . The resolution shall identif y the basic educati o n req ui reme nt f or which th e wa i ve r i s r eq u es t e d a nd i nc l ud e i nfo rma t i on on h ow t he wa i ve r will support i mproving student ach i evement . Th e res o lut ion must i n cl ude a s t a tement a tt es tin g t ha t t he d is tr ic t will meet th e mi n i mum in s t r u c tion a l h o urs req ui rement of RCW 28A .1 50 . 220 (2 ) und er th e waive r plan . The r eso l u t i on sh a ll be acco mpa n i ed by info rm ation de t a il ed i n the gu id e lin es and appl i cat i o n fo rm available o n the off ic e o f s up eri nt e ndent of pub li c in s tru c tion' s webs it e .
(2 )1..fil.. The app li cation fo r a wa i ver and a ll supporting d oc umenta tion mus t be r e c e i ved by the s uperint endent of pub li c ins t r ucti o n based on a sc h ed ul e iss u ed by th e supe ri nten d ent of public instructi o n and pr i or to i mplementat i on of the wa i ver days . The s uper intend ent o f public in s tru c ti on sha ll r e view al l app li ca ti o n s and supporting d oc ume nt a tion to in s ur e th e acc ur acy o f the inf orma ti o n. In t he eve nt th a t
[ 2 l OTS- 1816 . 1

23
deficiencies are n o t ed in the app li c a tio n or d o c u ment ation, d is tr ic ts will h ave the opportunity to make co rr e c ti ons a nd to seek superintend ent of public in struct ion app rov a l upon resu bmitt a l.
(b) Based o n a s c hedule issued by t h e superi n te nd e n t o f pub l i c instruction, the superintendent of pub li c instru c ti o n will, on a determin a ti o n that the req u ir ed i nforma t io n and docu men tatio n has been submitted, not ify the requesting dis t ric t t h at th e require me nts o f this section h a ve b een met a nd a wa i ver h as b een gr a nted.
(3 ) Under this s ection, a dis t ri ct seek i ng to obta i n a wa i v er o f no more than five d a ys fro m the provisions o f t he mi n im u m one hundred eighty-day school year re qu ireme n t pursuant to RCW ( (28A .3 05 . 140)) 2 8A. 300 . 7 50 solely for t h e p u rpose o f c onduc ti n g p are nt-te ac he r co nferences sh all pr ov i de noti f ication ( (of the district request) ) to the superintendent of public instruction at leas t thi r t y d ays p rior t o implementat i o n o f the plan . A req u est f or more th a n five days must be presented t o the superintendent o f p ub lic instru c ti on under subsecti o n (1) of this section fo r approval. The not ic e shall p rovide i nf o rmati o n and documentation as d irected by the superintendent o f public i nstruc tion. The inf orma tion a nd document a tion sh a ll include, a t a mini mum:
( a ) An adopted res o l u ti on by the s c hoo l distric t boar d of dir ec t o rs which shall st a te, at a minimum, the nu mbe r o f s c ho o l da ys and school years for wh i ch t he waiver i s re qu es t e d , and atte s t th a t the district will meet the minimum in struct i o n a l hours requireme nt o f RCW 28A .1 50 . 220 (2 ) under the wa i ver p l a n; a nd
(b) ( (A detailed explanation of hmr the parent teac h er conferen ces to be conducted under the waiver plan will be used to i mprove stu dent achievement;
(c) The district's reasons for electing to conduct parent teacher conferences through full days rather than partial days;
-fd-t-)) Th e nu mber of partial days th a t will be redu ced as a res ult of implementing the wa i ver p l a n ( (T
( e) A description of participation by administrators, teachers, other staff and parents in the development of the ;raiver re quest ;
( f) An electronic link to t he collective bargaining agreement with the local education association.
Based on a schedule issued by the superintendent of public in struction, the superintendent of public instruction ;rill, o n a deter mination that the required infor mat io n and document a tion have been submitted, notify the requesting district that the re qu ire ments of this section have been met and a waiver has been granted )) .
AMENDATORY SECTI ON (Amend in g WSR 1 8 - 24 - 090 , f il ed 1 2/3/ 1 8 , e ffe c tiv e 1/ 3/ 1 9 )
WAC 180-18-055 Alternative high school graduation requirements. ( 1) The s hi ft f r om a t i me and cred i t base d syste m of education to a s t a nd a rd s a nd pe rf o rm ance bas ed e ducat io n sys t em will be a mul ti year tr a n s ition. In order t o facilitat e th e tr a n si t ion a nd encou r age local i nn ovat i o n , t he state boa r d of ed u cat i o n f i nds th a t cu rr en t c redit based grad u a ti o n r e quirement s may be a limitati on upo n th e abi lit y o f hi g h sc h oo l s a nd di s tri c t s t o make the t rans iti o n wi th the leas t a mo unt of diffi c ulty. Th erefore , the s t ate board will p r ov i de district s an d hi g h sc h oo l s th e oppo r tun i ty t o cr eate a nd i mpl eme n t al t er n a ti ve grad u a ti o n r eq uir eme nt s .
[ 3 l OTS- 1816 . 1

24
(2) A school d i str i ct, or h i gh sc h ool wi th perm i s si on o f the d is trict board of direct o rs, or approved pr i va te h i gh schoo l, de siring t o implement a local restructuring plan to p r ov i de a n effec t i ve educa tion a l system to en h a n ce t he educati o n a l program for h ig h s choo l s tudents, may apply t o the state b oar d o f educ a tion f or a waiv er fro m o ne or more of the requirements of c h ap ter 1 80 - 5 1 WAC.
(3 ) Th e state b o ard o f edu ca ti o n may grant th e wa i ver f or a peri od up to fou r school yea r s .
(4) The wa i ver application sh all be i n t he f orm o f a resolut i on a d opted by the distr i ct o r p riv ate sc h ool boar d o f direct ors whi ch in eludes a reques t for the wa i ve r and a p l an f or res t r u c tu ri ng the edu c a ti o n a l program o f one o r more h i gh sc h oo l s which c onsist s of at le a st the foll owi ng inf ormat i o n:
(a ) Identi f ica t ion of th e require ments of c h apter 1 8 0- 5 1 WAC t o be wa i ved ;
(b) Spec ific st a nd a r d s fo r i ncre a sed s tudent le ar ning th a t the district or sc hool expects to a chieve;
(c) How the d i str i ct or schoo l p la n s to ac hieve the hi g h er stand ar ds, i nc ludi ng timelines for i mple ment at i on ;
(d) How the district o r school pla ns t o determ in e i f the higher sta nd a rds are met ;
( e) Ev iden ce th a t t he board of directors , tea c he rs , administr a t o r s , and class i f i ed empl oyees are c ommitt ed t o work i ng cooper at ive l y in im p le mentin g th e p l a n;
( f ) Evidence t h at stu dent s , f a milies , pare nts, an d ci tizens were in volved in develop in g th e p l a n; a nd
(g) I de n t ifi cat i o n o f the sc hoo l yea rs subject t o the wa i ver . (5 ) The p lan for restructuring the educa ti ona l prog r am of one o r
mo re h i gh schools may consist of the schoo l i mprovement p l ans r equ i red under WAC 1 8 0-16-2 20 , alo n g wi th th e re qu ir emen t s o f subsection ( 4 ) (a ) thr o ugh (d) of th is sect i on .
( 6) The applicati o n also sha ll i n cl ud e documentat i o n th a t th e s chool i s s uc cess ful as d emo n s tr a t e d by indica t ors such as , b ut n o t limited t o , the follow in g :
( a ) The sc h oo l h as clea r ex p ect a ti o n s f or s tudent le a rnin g ; (b) Th e graduat i on ra t e of th e h i gh sc hoo l f or the las t th ree
sch oo l years ; ( c ) Any follow -u p emplo yment data for t he high schoo l's gr aduat e
f or th e l as t thr ee y ea rs ; (d) The co lle ge admission r ate o f the schoo l' s gradu a tes t he l ast
three sc h oo l y e a r s ; ( e) Us e of st ud e nt po rtf o li os to docu men t s tu de n t l ea rnin g ; ( f) Student scores on the high school Wash ingt on assessments o f
s tudent le ar nin g ; (g) Th e l eve l and types of fam il y a nd pare nt in vo l vement a t th e
schoo l; (h) Th e sc ho o l' s annua l per f or mance repor t th e la st th r ee sc h ool
yea r s ; ((-a+tE!-)) (i) The l e vel of s tudent , f a mil y , pare nt , a nd p u b lic satisfacti o n
a nd co n f i denc e i n th e sc h oo l as ref l ec t ed in any s u rvey don e b y th e s chool wi th in th e l as t thr ee sc hoo l years L
(j) The pl a n s ummari zes how t he d i str i c t co ns i de re d equity i n the deve l opment of the pl a n. Th i s may i nc l ude , b u t i s no t li mi t e d t o , a n e qu it y ana l ys i s , commu nit y fee dback, or other mea n s to assess t h e con sequences o f the wa i ve r .
(7) A wa i v e r of WAC 1 80 - 51 - 060 may b e g r anted o n ly i f the dis tri ct o r schoo l p r ov i des docum e ntation a nd ration ale th a t any n oncre -
[ 4 l OTS- 1816 . 1

25
di t based graduation re quirements that will replace i n who le or in part WAC 180-51-060, will suppor t the st a te's performa n ce-based ed u ca ti o n system being i mple mented pursuant to RCW 2 8A. 630. 885, and the noncredit based req u ireme nts meet the mi n i mum college c o re admissi o ns standards as accepted by the higher e du catio n coordinating b oard f or students pl a nning to a ttend a baccalaureate in st ituti o n.
(8) A waiver g ranted un der this sect i on may be renewed upo n the state board of education receiving a renewal re quest from the sch ool district board of d irectors. Bef o re filing the request, t he sch ool district shall conduct at least o ne pu blic mee ting t o eval u ate theeducational requirements t ha t we re i mple mented a s a resul t of the waiver. Th e request to the s t a t e board s h all in c lu de i n formation regarding the a ctivities an d programs impleme nt ed as a resul t o f the waiv er, whether higher standards for s tu de nt s are bei ng ach i eved, assurances that students in advanced placeme nt or other post s econd a ry op ti o ns pr o gr a ms, suc h as but not li mi ted t o: Co llege i n the h ig h s cho ol, running start, and tech-prep, shall no t be dis a d va nt a ged, and a summa ry of the comments re ce ived a t the p ublic meeting or meetings.
( 9 ) ( (The state board of educatio n shall notify the state b oard for community and technical colleges, the Washington student achieve ment council and the council of presidents of any 1,rniver granted under this section.
-f-l-G-t)) Any wa ive r requested under thi s sect i on wi ll be granted with the un dersta ndi n g that the s t a te bo a rd o f educat ion will affi r m th a t students who graduate un der alter n ative graduation requirements have in fact comple t e d state requirements fo r high schoo l graduati o n in a n o ntr ad ition a l program .
((-f-l-±+)) J.1.Qj_ Any sc hoo l or district g ranted a waiv e r under this chapter shall report a nnu a lly to the state boar d o f e du cat ion , i n a form and manner to be deter mined by the board , on the progress and ef fects o f im plement in g the wa i ver .
AMENDATORY SECTIO N (Amend in g WSR 1 8 - 2 4- 090 , file d 1 2/3/ 1 8 , e ff ective 1/ 3/ 1 9)
WAC 180-18-065 Waiver from one hundred eighty-day school year requirement for purposes of economy and efficiency-Criteria for evaluation of waiver requests. ( 1 ) I n order to b e g ra nted a waiver by th e s uperintend e nt of pub li c in s t ruc ti o n under RCW 28 A. 305 .1 4 1 to operate o ne or mo re sch oo ls on a f le x ible c a lend ar f o r p ur pos es o f econo my and e ffici e nc y , a sc h oo l di s tri c t e li g i ble for su c h wa i ver mu s t mee t eac h o f the requir e me nt s o f RCW 28 A. 305 .1 41 (2) .
( 2 ) In the event t ha t a g r e at e r numbe r o f r eques t s f or waive rs are r e c e iv e d th a t meet th e r eq uiremen t of s ub sec ti on (1) of thi s sec ti o n than may be g ra n ted by the superintendent o f p ub li c inst r u c ti o n under RCW 28A . 305 .1 41( 3) , if the super int e ndent o f publ i c inst r ucti o n determin es th a t th e app l y i ng d i st ric ts a r e otherw i se eligible , th e ir appl i ca ti o n s will be p ri o riti zed ( (i n the following order )) based o n the f o ll owing c riteri a :
( a ) Di s t r i c t s t ha t are a l ready operati n g on a flex ibl e calendar und er thi s wa i ver program ; ( (-a-REl:-))
(b) Thos e pl a n s th a t best r ed ir ect mon e t ary sav i ngs from th e pr o posed flexible cale nd ar t o support s tu de nt l ear nin gL
[ 5 l OTS- 1816 . 1

26
(c) The plan su mmarizes how t he dist r ict c ons idered equity in the development of the plan. Th is may i n cl ude, b u t is no t li mi ted t o , an equity analysis, community feedback, or o the r means to assess t he c o nsequences of the wa i ver ; an d
(d) Other r elev a nt info r mat ion th at may include f i nanc ial sav ing s , academ i c indi cators , quality o f app li cation , community supp o rt , an d a lignment to the dist r ict's strategic pl a n .
AMENDATORY SECTION (Amending WSR 1 8 - 23 - 01 2 , filed 11 /8/ 1 8 , effective 12/ 9/ 1 8)
WAC 180-18-100 District waiver from requirement for student access to career and technical education course equivalencies. (1) Any school d i str i ct reporting, in any sc h ool year , a n October P223 headcount of fewer than two th o usand s tu dents as o f Ja nu ary of th at sch ool ye a r may apply t o the superintendent of p ublic instructi on f or a waiv er o f up to two years from the pr ov i s i ons o f RCW 28 A . 2 3 0 . 0 1 0 (2 ) f o r the subsequent school ye a r.
( 2 ) In any ap p lication for a waiver under th i s sec t i o n , the d is trict shall demons t ra te t h at students enr o lled i n the d i st ric t do n o t have and cannot be prov i ded re aso n ab le acces s , thr o ugh h i gh sch ool s , inte rdistrict cooperat i ves, ski ll cen t ers or br a nch or satellite skill centers , or th ro ugh online learning or app li cab l e r unn i ng start v oc a tion a l courses , to ( (at least one career and technical education course that is considered equivalent to a mathemat ics course or at least one caree r and technical education course th at is considered equivalent to a science course as determined by the superintendent of public instructi on) ) gr a nt a cademic course egui valenc y f or a t l east o ne statew ide egui valency h i gh school career a nd te c hni cal educati o n cours e from th e list of cou rses a pprov ed by th e su p e ri n t en de n t of public in struct i o n under RCW 28 A. 7 00 . 070 .
( 3) On a determinati o n ( (, in consultation with the office of the superintendent of public instruction,)) th a t th e stu d ent s en r olle d i n the district do no t and cannot be p r ovided reasonable acce ss t o a t le a st one c a reer and technical educat i on c ou rse th a t i s c o nside red ((equivalent to a mathematics course or at least one career a nd tech nical education course that i s considered equ ival ent to a science course)) t o grant academic course eguiv a len c y for at l e a st o ne state wi de e gui va l en cy h i gh sc h ool c areer and te c hn i cal e ducat i o n cour se under subsecti o n ( 2 ) o f t h i s sect ion, th e su p erintendent of p ub li c instruct i on sh a ll gra nt the wa i ver for th e t erm of y ears reques t ed .
(4) The o ffic e of s up eri nt e nd e nt of p u bl i c in s tru c tion shal l p os t o n it s website an appli c ati on form f or u se by a distri c t in app l ying f o r a wa i ver under thi s sec t io n. A com p l e t e d app li ca ti o n mus t be s i g ne d by th e cha ir or pr es i d e nt o f th e d is tr ic t' s board of d ir ec t o r s and superintendent.
( 5) In o rd e r to prov i de s uffi c i e nt not i ce t o students , pare nt s , a nd s t a ff, th e app li cat i on must b e su bmi tt e d t o th e s upe r in t e nd e nt o f publ i c in s tru c ti o n i n e l ect r on ic fo r m no l a t er th an ( (January 1 5 th of the school year prior to the school year for r,rhich the waiver is re ques t ed)) th e d ea dlin e es tabli s h e d by th e o ffic e o f su p e ri nten d ent o f publi c i ns tru c ti on . The off i ce of s uper in tendent o f p u bl ic instructi o n s h a ll pos t a li st of a ll a pprov ed app li cat i ons ( ( received) ) o n i t s pub li c webs it e .
[ 6 l OTS- 1816 . 1

Strategic Plan Priority I System Design
Goal: School and district structures and systems adapt to meet the evolving needs of the student population and community as a whole. Students are prepared to adapt as needed to fully participate in the world beyond the classroom.
Cover: Temporary Waiver from 24-Credit Graduation Requirements for Peninsula College PREPARED FOR THE JANUARY 2020 BOARD MEETING
Information and Action
Peninsula Community College requested waiver from 24-credit graduation requirements of WAC 180-51-068 for the Class of 2019 and 2020. The Board will consider approval.
Materials included in packet: • Application for waiver from Peninsula College • Resolution from Peninsula College Board of Trustees
Synopsis: Peninsula College has submitted a waiver requested from WAC 180-51-068. While Peninsula College is able to provide a program aligned to the 24 credit Career and College Ready diploma requirements they partner with multiple districts, including Port Angeles School District which currently has a 24-credit waiver for the class of 2019 and 2020. The college is requesting the waiver in order to keep their program aligned with district partners which have been granted the waiver to delay implementation of the career and college ready graduation requirements. The waiver would be available for the Class of 2019 and 2020.
Business Items: • Approval of Temporary Waiver from WAC 180-51-068 for Peninsula
College
27

The Washington State
BOARD OF EDUCATION
APPLICATION Temporary Waiver from High School Graduation Requirements
Under Chapter 217, Laws of 2014
Instructions RCW 28A.230.090(1)(d)(ii) authorizes school districts, private schools, and community colleges to apply to the State Board of Education (SBE) for a temporary waiver from the career and college ready graduation requirements directed by Chapter 217, Laws of 2104 (E2SSB 6552) beginning with the graduating class of 2020 or 2021 instead of the graduating class of 2019. This law further provides:
“In the application, a school district must describe why the waiver is being requested, the specific impediments preventing timely implementation, and efforts that will be taken to achieve implementation with the graduating class proposed under the waiver. The state board of education shall grant a waiver under this subsection (1)(d) to an applying school district at the next subsequent meeting of the board after receiving an application.”
The SBE has adopted rules to implement this provision as WAC 180-51-068(11). The rules provide that the SBE must post an application form on its public web site for use by school districts. The rules further provide:
• The application must be accompanied by a resolution adopted by the district’s board of directors requesting the waiver. The resolution must, at a minimum:
1. State the entering freshman class or classes for whom the waiver is requested; 2. Be signed by the chair or president of the board of directors and the superintendent.
• A district implementing a waiver granted by the SBE under this law will continue to be subject to the prior high school graduation requirements as specified in WAC 180-51-067 during the school year or years for which the waiver has been granted.
• A district granted a waiver under this law that elects to implement the career and college ready graduation requirements in WAC 180-51-068 during the period for which the waiver si granted shall provide notification of that decision to the SBE.
Please send the application and school board resolution electronically to: Parker Teed Policy Analyst 360-725-6047 [email protected]
For questions, please contact: Parker Teed Policy Analyst 360-725-6047 [email protected]
Application Please complete in full. Please identify any attachments provided by reference to the numbered items below.
28

1. Name of district: Peninsula College
2. Contact information Name and title: Sharon Buck, Vice-President of Instruction Telephone: (360) 417-6235 E-mail address: [email protected]
3. Date of application. 4/15/19
4. Please explain why the district is requesting a waiver to delay implementation of career and college ready graduation requirements in WAC 180-51-068. Peninsula College partners with the Port Angeles School District in our service area. We provide instruction to the student population of these districts. Our program is aligned to state graduation requirements and in order to serve the students of our district partners, we are requesting the waiver in order to keep our program aligned with our service district partners which have been granted the waiver to delay implementation of the career and college ready graduation requirements.
5. Please describe the specific impediments preventing implementation of the career and college ready graduation requirements beginning with the graduating class of 2019. We are currently able to fully implement the graduation requirements, but are requesting the waiver in order to remain aligned with our service partner district.
6. Please indicate below the graduating class for which the district will first implement the career and college ready graduation requirements.
__XX____ Class of 2021
7. Please describe the efforts that will be undertaken to achieve implementation of the career and college ready graduation requirements for the graduating class indicated above. We have courses available that fully meet the graduation requirements. Our program has developed high school level courses based on the OSPI curriculum standards that fulfill all credit requirements for the 24 credit high school diploma. Additionally, students that meet eligibility requirements may take college-level coursework that transfer back into their high school diploma program. At the request of the participating districts which have implemented CCR graduation requirements, for those classes prior to 2021, we are fully able to offer the 24 credit diploma option.
Final step Please attach the district resolution required by WAC 180-51-068, signed and dated by the chair or president of the board of directors and the district superintendent.
29

STATE OF WASHINGTON
BOARD OF TRUSTEES, COMMUNITY COLLEGE DISTRICT NO. 1
PENINSULA COLLEGE
~so{ution 2019-01
A resolution recognizing Peninsula College's application to apply for a temporary waiver from high school graduation requirements under Chapter 217, Laws of 2014.
WHEREAS RCW 28A.230.090(1 )(d)(ii) authorizes school districts, private schools, and community colleges to apply to the State Board of Education (SBE) for a temporary waiver from the career and college ready graduation requirements directed by Chapter 217, Laws of 2104 (E2SSB 6552) beginning with the graduating class of 2020 or 2021 instead of the graduating class of 2019.
WHEREAS Peninsula College wishes to remain aligned with their local high school graduation requirements;
FURTHER Port Angeles High School has received such a waiver,
NOW THEREFORE, BE IT RESOLVED that the Board of Trustees of Peninsula College, District No. 1, approves this application for a temporary waiver of graduation requirements for the graduating years 2020 and 2021.
is Date:
~ Date
30

Mastery-Based Learning Work Group Interim Report PREPARED FOR THE JANUARY 2020 BOARD MEETING
Information
Materials included in packet: • Mastery-Based Learning Workgroup Interim Report (December 2019)
Synopsis: This report provides the work group’s vision for mastery-based learning in our state, activities of the work group this year, preliminary findings, and areas for further exploration during 2020. For context, the report also has appendices on definition of terms and the state of mastery-based learning (MBL) in Washington as well as national and international examples. A final report will be provided, detailing all findings and recommendations of the work group by December 1, 2020.

PREPARED BY:
The Washington State Board of Education INTERIM REPORT
Mastery-based Learning Work Group
December 2019
Authorizing legislation: Engrossed Second Substitute House Bill 1599, Chapter 252, Laws of 2019
31

• Mastery-based Leaming in Washington State
.--~~--,, 1 learn a , practice ~_new skm : ➔ the &kill
- - - --➔
make analyze & mis akes ➔ ix mistak&s
as for make quiz on '=- help ~I mistakeis E- he sikill
l ,,111 rk' ... ~
pracrce ➔
re-qui.zon t=i> the skill the s ill
MASTERY-BASED LEARNING WORK GROUP INTERIM REPORT
Overview of the Interim Work Group Report
This report provides the work group’s vision for mastery-based learning in our state, activities of the work group this year, preliminary findings, and areas for further exploration during 2020. For context, the report also has appendices on definition of terms and the state of mastery-based learning (MBL) in Washington as well as national and international examples. A final report will be provided, detailing all findings and recommendations of the work group by December 1, 2020.
WHY DO WE NEED MASTERY-BASED LEARNING IN WASHINGTON? The state of Washington, through the Mastery-based Learning work group,1 is embarking on an exciting journey to reimagine our state’s education system. The work group believes that mastery-based learning (MBL) is a way to transform our education system—with this approach, teaching methods are designed to equitably engage each and every student in ways that best support the individual student’s learning journey. Additionally, through the focus on student voice and choice in learning, MBL prepares all students for the workforce of the future by allowing them to experience ownership over their own learning process.
The key to MBL is the focus on the individual student and providing them an opportunity to receive an education experience tailored to their personal interests. The work group believes strongly in the importance of the state learning standards—but believes a state framework for MBL, would benefit students individually and collectively, by providing richer and deeper learning experiences. With an MBL approach, the learning process to demonstrate mastery of a skill or standard could follow the process in the graphic.2 In this process, students learn at their own pace, and learn from other students working on the same skills, reinforcing teamwork and good communication. Making mistakes and asking for help is part of the process, so students practice self-advocacy, resilience, and persistence in a safe and
1 Established in E2SHB 1599 section 301 2 http://soltanimath.weebly.com/assessment-and-learning-process.html
1 32

• Mastery-based Leaming in Washington State
supportive environment. Within a well-developed system of MBL, both students and educators would have “the freedom to fail,” leading to learning and innovation.
Within MBL, there is a role for authentic assessments that are tied directly to the learning standards. Demonstration of mastery would not be limited to standardized assessments. Demonstration of mastery of the standards could be through portfolios, demonstrations, and presentations. The development of such authentic assessments could help facilitate the development of culturally responsive projects within curricula.
Through work group members’ own experiences with MBL in Washington and across the world, and after hearing from Washington students regarding their experience with MBL, our collective “why” calls for a transformation from a traditional system to an MBL approach because this enables:
• A focus on meeting the needs of each individual student. • Students to enjoy relevancy, engagement, and choice in their learning. • Freedom to actively embrace inclusivity—compassion and belonging for students. • A culture of celebrating the learning and innovation that comes from failure and values
knowledge and skills that students already have. • Each student’s learning progresses at their own pace. • A way to get rid of labels and create a system that recognizes that each student’s
learning happens differently for each subject.
Activities of the Work Group This Year
SBE has created a web page to host all materials for the work group. This year, the work group has focused on understanding the world of possibilities within MBL and creating a vision for MBL in Washington. Some of the activities supporting this work have included:
• Creating a preliminary vision of the work group as well as preliminary definitions. • Discussing the landscape of MBL in Washington currently (see Appendix 2 for more
information on Washington as well as across the nation and internationally). • Holding a webinar focused on MBL in other states. • Hearing both a district perspective and state view on how the High School and Beyond
Plan could support MBL. • Holding a meeting to hear from several local schools currently employing a variety of
mastery-based learning models.
DEFINING TERMS The field of mastery-based learning has many terms that are confusing. Some terms are used interchangeably, even when the meaning of the terms are not, or should not, be interchangeable. One of the communication challenges of the work group is to come to a collective understanding of terms. This is essential so that work group members can consistently
2 33

• Mastery-based Leaming in Washington State
and precisely identify the work that needs to be done, as well as effectively communicate about the progress and final recommendations of the group. As a work group, we believe one of our most important roles is to talk about mastery-based learning in a unified manner—in order to help the Washington State public understand mastery-based learning. One way this can be accomplished is by using shared terms to define what we mean by certain educational terms and approaches.
Appendix 1 defines some of the terms that have arisen in work group discussion. The work of developing a shared understanding of terms is likely to be on-going. This initial list of definitions will be added to, and some of these definitions may be refined as the group progresses in its work.
MASTERY-BASED LEARNING
The work group believes that the principal work of the group, mastery-based learning, is effectively defined in legislation (per E2SHB 1599 Sec. 301):
a) Students advance upon demonstrated mastery of content; b) Competencies include explicit, measurable, transferable learning objectives that
empower students; c) Assessments are meaningful and a positive learning experience or students; d) Students receive rapid, differentiated support based on their individual learning needs;
and e) Learning outcomes emphasize competencies that include application and creation of
knowledge along with the development of important skills and dispositions.
PRELIMINARY VISION OF THE WORK GROUP The work group members engaged in a thorough discussion about their vision for the mastery-based learning in Washington, as well as how their work over the next year will make progress toward their shared vision. Our vision of a mastery-based learning system is one that:
• Equity is celebrated and every student feels a sense of belonging in their school community
• Empowers students to advance upon demonstrated mastery of content, rather than seat time or age
• Enables students to direct their own learning and serves each student based on their personalized needs
• Honors the assets students bring and engages students through their diverse cultures and communities
• Students’ innate creativity shines through in their learning • Welcomes learning experiences that take place in environments outside the classroom • Facilitates students’ voices and transition to higher education and careers • Supports both students and educators as lifelong learners; provides the freedom to fail
and celebrates the resulting learning
3 34

• Mastery-based Leaming in Washington State
• Demonstrates flexibility and responsiveness in our changing world
WEBINAR ON MASTERY-BASED LEARNING IN OTHER STATES Presenters included:
• Jason Swanson, Director of Strategic Foresight, KnowledgeWorks • Lillian Pace, Vice President of Policy and Advocacy, KnowledgeWorks • Stephanie DiStasio and Lauren McCauley, Office of Personalized Learning, South Carolina
Department of Education • Marita Diffenbaugh, Instructional Support for Student-Centered Learning, Idaho State
Department of Education
Information shared from the two webinar states is described in Appendix 2. KnowledgeWorks is a non-partisan organization that focuses on the future of learning by helping states and educators deliver personalized, competency-based education to students. As shared on the webinar, KnowledgeWorks believes that “education’s role in supporting the healthy development of young people, effective lifelong learning and community vitality will be increasingly crucial.3”
Because one must take a different approach to learning and instruction in mastery-based education, it is easier under this system to focus on human-centered learning. In human-centered learning, “educational design principles for crafting learning cultures, experiences, assessments and physical environments guide educators in supporting learners’ healthy development…formative assessments support students in developing their full intellectual, emotional, social, physical, creative and civic potential and in building the foundation for lifelong learning.4”
When designing a new education approach, “stakeholders cannot assume that equity will automatically be a byproduct of adopting new approaches; institutional and cultural barriers are too strong.5” The work group has discussed equity at the center of their vision for a mastery-based learning approach, and how an MBL approach is needed because of the ways our traditional system has not served certain populations of students well. To ensure the success of a state MBL approach, further discussion will be needed to determine strategies that will uphold the interests of systemically marginalized groups of students.
Another critical component of the future of learning includes ensuring that renewed definitions of success for the educations system are based on both current and future workforce needs.
3 Prince, K., Swanson, J., & King, K. (2018). Forecast 5.0 – The Future of Learning: Navigating the Future of Learning. KnowledgeWorks. Retrieved from https://knowledgeworks.org/resources/forecast-5/ 4 Ibid, 19 5 Ibid, 28
4 35

• Mastery-based Leaming in Washington State
Common state policy barriers to a mastery-based learning education system, as identified by KnowledgeWorks and with some applicability to the Washington state context, include accountability (when the state’s measures of success don’t align with a mastery-based learning approach), assessment (if tests don’t support the learning process), educator workforce (if educators aren’t available with the skill set to teach in an MBL system), and funding models (when per-pupil funding is based on seat-time).6
HIGH SCHOOL AND BEYOND PLAN (HSBP) PRESENTATION At the September meeting, members had a chance to engage with the Director of Career and College Readiness at Everett Public Schools around the High School and Beyond Plan (HSBP). At Everett Public Schools, they have a HSBP District Coordinator who spends one day a week in each of the comprehensive high schools. She also builds connections with community partners. The rest of the HSBP program work falls to the individual school counselor. Everett’s online platform for the HSBP program is Naviance, a common platform used by many districts around the state. Naviance has the capability to push out alerts to students based on their identified interests (e.g. a college visit alert). In Everett, they are working to bring in more general education educators to be able to work with their students on their HSBPs (special education educators are already highly invested).
The discussion focused on the varying levels of implementation of the High School and Beyond Plan across the state and how while some districts are doing exceptional work with the HSBP, for many districts, it is simply a “check box.” It was acknowledged it is hard for most districts to provide a robust HSBP program with the current counselor to student ratio, as generally the HSBP is delivered by counselors (either in classes or small groups, less often due to time constraints is counselor delivery 1-on-1). Other delivery options of the HSBP to students are via their homeroom/advisory class or to have components of the HSBP delivered in a core class (which would meet learning standards). For the homeroom or class delivery options—the school counselor trains the educator on the HSBP requirements before the educator then delivers the lessons to students.
Additionally, most parents are unaware of the HSBP. To ensure relevance for students, the HSBP should be able to follow the student as a transportable tool into postsecondary education and beyond.
Work group members want to ensure that in a mastery-based system, the HSBP becomes a key tool used by all educators to track changing student interests and goals and thus inform their
6 Jenkins, S., Olson, A., Pace, L., & Sullivan, T. (2019). State Policy Framework for Personalized Learning. KnowledgeWorks. Retrieved from https://knowledgeworks.org/get-empowered/policy-resources/state-policy-framework-personalized-learning/
5 36

• Mastery-based Leaming in Washington State
individual learning plan accordingly (rather than a tool only used by counselors, as is common in the current system).
MASTERY-BASED LEARNING: PERSPECTIVE FROM THREE WASHINGTON SCHOOLS At the November meeting, work group members heard from school leaders and students from schools employing a variety of mastery-based learning models: Avanti High School, Gibson Ek High School (a waiver school under RCW 28A.230.090), and Odyssey Middle School and Discovery High School. All three schools shared a focus on student mastery of the state learning standards, as demonstrated through project-based learning and other personalized learning strategies, allowing students to progress in their learning at their own pace.
Selected quotes from the student speakers at this meeting:
• Actively embrace inclusivity. • Celebrate different identities. • Comprehensive high schools are built for one type of student. Almost all of the students
left out of the comprehensive high school can be served by a project-based learning, MBL model.
• We cannot wait for the perfect program. With the world changing, we have to change how we do education too—but students have to be given the freedom to do so.
• You do not have to change your entire curriculum to make students feel like they are doing well. Students need to feel like they can explore and enjoy learning.
• Give us the freedom to fail so we can have the groundwork for success.
Work Plan
This work plan was developed in response to discussion at work group meetings about the most critical topics for the group to understand as well as what realistically could be accomplished during the statutorily allotted time for the work group to convene.
Date Activities Topics Outcomes/Deliverable September 23, 2019
• Plan and hold September meeting of the Work Group
• Location: Hearing Room A, O’Brien Building, State Capitol, Olympia
• Vision • Work Plan • Deliverables for the
Interim Report • High School and
Beyond Plan (HSBP)
• Shared vision of Mastery-based Learning (MBL)
• Identification of content topics in Interim Report
• Shared understanding of the requirements and delivery models of the HSBP
• Discussion of HSBP as a tool for Mastery-based Learning
6 37

• Mastery-based Leaming in Washington State
October and November (Submit in December 2019)
• Staff will develop a draft based on September meeting discussion
• Work Group members review and provide feedback
• Create final report and submit to the Governor and Education committees
• Topics identified in September meeting
• Interim Report with preliminary findings o Staff will send a draft of the
report (via email) to members by Oct. 24. Members will need to provide feedback to staff by Nov. 7, in order to bring an updated report to members at the Nov. meeting
November 14, 2019
• Plan and hold November meeting of the Work Group
• School-level mastery-based/personalized learning
• Student panel • Review draft
Interim Report
• Feedback on Interim Report
January • Webinar • Higher education models
• Shared understanding of components of MBL from higher education that could translate to the K-12 system
Winter or Spring
• Update to EOGOAC on the vision and work plan of the mastery-based learning work group
• Identify ways the work group and EOGOAC can collaborate around building shared understanding of the state’s vision for MBL
February 27, 2020
• Plan and hold September meeting of the Work Group
• High School Transcript and Postsecondary admissions
• Course level mastery models (e.g. World Language, or WL)
• Begin to build guidelines and recommendations for recording mastery-based learning on transcripts
April 16, • Plan and hold April • Educator • Build recommendations for 2020 meeting of the Work
Group preparation
• High School and Beyond Plan (HSBP)
supporting educators in professional development around MBL
• Creating recommendations around how HSBP can support MBL
Mid-June • Framing a mastery-based diploma
• Begin to develop draft guidance for schools on how to offer a completely
7 38
• Mastery-based Leaming in Washington State
• System level MBL models
mastery-based program that results in a high school diploma
• Identification of issues to be addressed in policy
Summer retreat
• Further exploration of previously covered topics or new topics, as needed
• Begin developing themes and possible recommendations for the final report
Summer webinar
• Webinar for partner orgs to report on work of the work group?
• Work group members reinforce relationships with partner organizations o Identify challenges and ways of
collaborating around MBL
Mid-August
• ID key themes / issues
Mid-October
• Recommendations
Mid-November
• Final meeting online or in-person
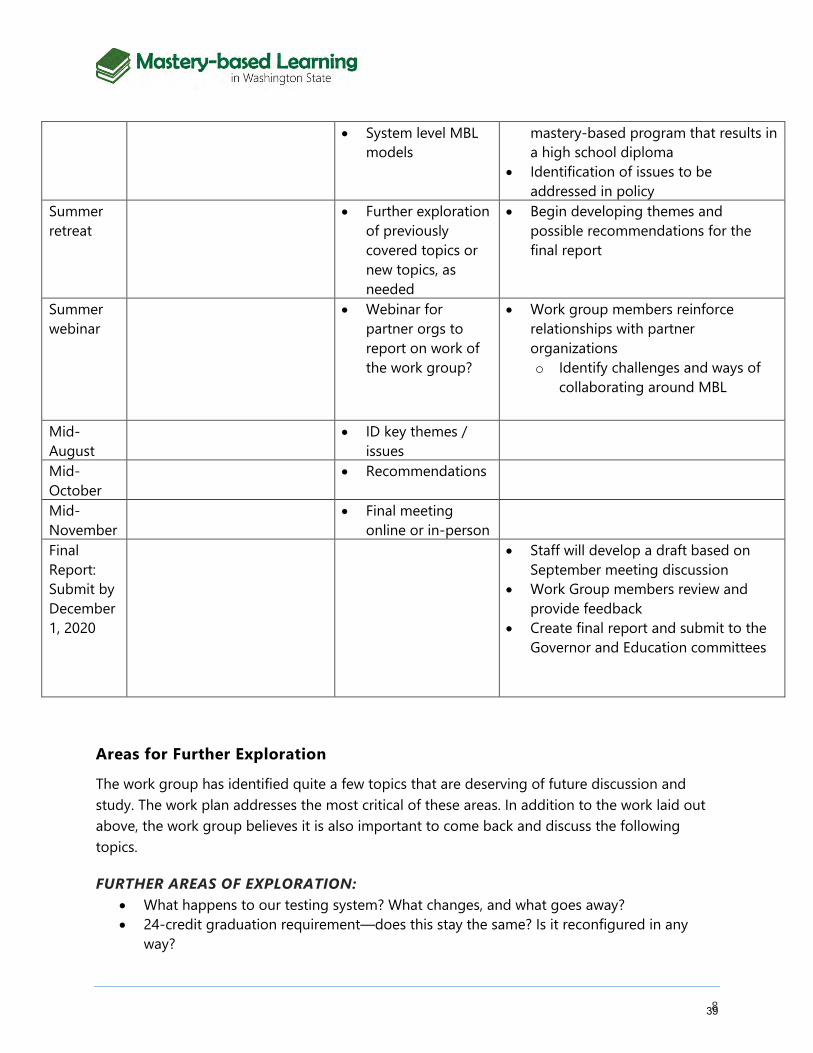
Final Report: Submit by December 1, 2020
• Staff will develop a draft based on September meeting discussion
• Work Group members review and provide feedback
• Create final report and submit to the Governor and Education committees
Areas for Further Exploration
The work group has identified quite a few topics that are deserving of future discussion and study. The work plan addresses the most critical of these areas. In addition to the work laid out above, the work group believes it is also important to come back and discuss the following topics.
FURTHER AREAS OF EXPLORATION: • What happens to our testing system? What changes, and what goes away? • 24-credit graduation requirement—does this stay the same? Is it reconfigured in any
way?
8 39

• Mastery-based Leaming in Washington State
o Alignment/relationship between credits and mastery-based learning • All of Washington’s 295 districts have different contracts—would these allow mastery-
based learning? • What professional development supports are needed for educators to be able to teach in
a mastery-based system? • Communication plan on how do we publicize a system of mastery-based learning so that
it is success? Many people will be relieved that we understand how big of a shift mastery-based learning would be—that we understand things are tough out there, and work group has your back.
• Need another meeting/discussion on the High School and Beyond Plan (HSBP) and making it more robust.
AREAS DESERVING OF MORE STUDY • Funding—how funding might need to change to accommodate a mastery-based
learning system, including consideration of additional staffing needs.
9 40
• Mastery-based Leaming in Washington State
Appendix 1: Preliminary Definition of Terms
This initial list of definitions will be added to, and some of these definitions may be refined as the group progresses in its work.
MASTERY-BASED LEARNING
The work group believes that the principal work of the group, mastery-based learning, is effectively defined in legislation (per E2SHB 1599 Sec. 301):
f) Students advance upon demonstrated mastery of content; g) Competencies include explicit, measurable, transferable learning objectives that
empower students; h) Assessments are meaningful and a positive learning experience or students; i) Students receive rapid, differentiated support based on their individual learning needs;
and j) Learning outcomes emphasize competencies that include application and creation of
knowledge along with the development of important skills and dispositions.
COMPETENCY-BASED LEARNING Competency-based learning is a similar term to mastery-based learning. The choice of using the term mastery-based learning appears a deliberate choice of the Washington Legislature to emphasize that students advance upon mastery of content. In a mastery-based learning experience, teachers and students might work together to define what mastery looks like.
Work group members and others should be aware that in some other states, the term “competency-based learning” is defined essentially identically to how mastery-based learning is defined in Washington’s legislation. When communicating with people from other states or looking at material from other states, it is important to verify the definition of competency-based learning.
PERSONALIZED LEARNING
The concept of personalized learning is foundational to mastery-based learning. Mastery-based learning must be personalized learning. But the two terms are not interchangeable. Personalized learning is a broader concept, and may describe different types of learning experiences as well as be used to describe programs, educational approaches and strategies. Personalized learning is intended to address individual student interests, needs, cultural backgrounds and learning styles. Personalized learning is the opposite of one-size-fits-all learning. For a more in-depth discussion of the convergence of mastery-based learning with personalized learning, see Table 2
10 41

• Mastery-based Leaming in Washington State
in Mean What You Say: Defining and Integrating Personalized, Blended and Competency Education (p. 23)7.
PROJECT-BASED LEARNING
Project-based learning is an instructional method or learning experience typically or ideally characterized by students engaging in:
• Personally meaningful projects over an extended period of time. • Projects that address problems that are authentic and real-world. • Active, inquiry-based, hands-on learning, often across content areas.
Project-based learning may support mastery-based learning.
PROFICIENCY-BASED LEARNING
Proficiency-based learning is a term similar to competency-based learning and mastery-based learning, and like these terms indicates that students advance upon demonstration of proficiency in learning objectives. There are shades of meaning in the words competency, proficiency, and mastery. The words “competency” and “proficiency” indicate a high level of knowledge, skill or ability, but “mastery” suggests a level higher still. The choice of using the term mastery-based learning appears a deliberate choice of the Washington Legislature to emphasize that students advance upon mastery of content.
LEARNING STANDARDS Learning standards “identify the knowledge and skills all public school students need to know and be able to do.” (RCW 28A.655.070).
STANDARDS-BASED EDUCATION
Standards-based Education is a system of education (including instruction, assessment, grading, reporting and other aspects of a system of education) that is based on students demonstrating the explicit knowledge and skills of the standards as they progress through their education. Mastery-based learning is standards-based education, since the explicit, measurable, and transferable learning objectives that characterize mastery-based learning is based on learning standards.
CREDIT According to WAC 180-51-050, "high school credit" means:
(1) Grades nine through twelve or the equivalent of a four-year high school program, or as otherwise provided in RCW 28A.230.090(4):
7 Patrick, S., Kennedy, K., & Powell, A. (2013). Mean What You Say: Defining and Integrating Personalized, Blended and Competency Education. iNACOL. Retrieved from https://www.inacol.org/wp-content/uploads/2015/02/mean-what-you-say-1.pdf
11 42

• Mastery-based Leaming in Washington State
(a) Successful completion, as defined by written district policy, of courses taught to the state's essential academic learning requirements (learning standards). If there are no state-adopted learning standards for a subject, the local governing board, or its designee, shall determine learning standards for the successful completion of that subject; or (b) Satisfactory demonstration by a student of proficiency/competency, as defined by written district policy, of the state's essential academic learning requirements (learning standards).
According to this definition, credits are based on learning standards—the learning standards addressed in a course that is part of a four year high school program. Through MBL, once an educator identifies the learning standards associated with a particular high school course, students do not need to complete that particular classroom-based course to earn that credit. A student who masters those learning standards through any educational experience—work based learning, completing an individual or team project, learning inside a classroom or outside a classroom—may earn the credit upon demonstration of mastery.
CREDIT EQUIVALENCIES
Students may receive credit for recognition of learning that takes place outside of school. Typically, schools or districts will have a policy and a process for awarding such credit, and will have some form of test or assessment that allows the student to demonstrate the skills and knowledge for which they are being awarded credit.
Appendix 2: Mastery-Based Learning Examples in Washington, Across the Nation, and Internationally
MASTERY-BASED LEARNING: WHAT IS HAPPENING IN WASHINGTON? The establishment of the mastery-based learning work group is an important step in launching efforts to expand mastery-based learning in Washington. The work group has the opportunity to learn from a number of states that are ahead of us in developing policies and implementing mastery-based education. In addition, Washington does have existing state policies that support mastery-based learning and that could provide a foundation on which to build greater capacity. However, among Washington school districts knowledge about such policies and implementation of competency-and mastery-based learning practices is uneven. Districts may not know they have the flexibility and authority to create mastery-based learning opportunities, or districts may not feel equipped or adequately supported to take advantage of the flexibility. Furthermore, the current framework of laws, policies, and practices in Washington may be insufficient to allow mastery-based learning to flourish. The work group may consider identifying policies and practices that might be modified or added to better support expanded access to mastery-based learning.
MASTERY-BASED LEARNING LAWS AND POLICIES IN WASHINGTON
Current laws that may govern mastery-based learning in Washington include:
12 43

• Mastery-based Leaming in Washington State
• WAC 180-51-050—Definition of High School Credit o This law defines high school credit based on learning standards, rather than seat-
time. This enables districts to have freedom in designing student learning experiences that result in credit.
• WAC 392-121-182, RCW 28A.232—Alternative Learning o Alternative learning law provides a funding formula and a reporting model for
learning that takes place partly or fully outside of a traditional classroom. • WAC 392-410-315—Work-Based Learning
o This law creates a funding formula and reporting model for worksite learning— learning and credit-earning that takes place at an employer’s workplace or other community setting where the student has a job or internship.
• WAC 392-410-310—Equivalency Course of Study o Equivalency course of study allows for students to earn credit for learning
experiences planned and approved by a school that take place away from school or are conducted by non-district employees.
Additional policies that impact mastery-based learning in Washington include:
• Washington State School Directors’ Association (WSSDA) Model Policy for Competency-Based Credit
o This model policy allows for competency-based credit through students demonstrating proficiency in a specific assessment. The policy was written for world language, but could be modified for any subject area. The policy assumes the existence of an assessment well-aligned to learning standards.
• Policies that allow acceleration in the earning of high school credits o While acceleration policies do not necessarily support innovation in
instruction, they do allow flexibility in the rate at which some students progress. These policies include: Middle school students earning high school credit. Dual enrollment and early college programs.
• District waivers of credit graduation requirements o This waiver excuses schools from defining learning, and a student’s progress,
through high school credits. Schools are not excused from teaching and learning of learning standards.
o Schools operating under these waivers generally employ project-based learning and non-traditional, non-classroom learning, practices which may support mastery-based learning.
o Twelve districts have this waiver. Most of the schools operating under this waiver employ the Big Picture model of learning.
13 44

• Mastery-based Leaming in Washington State
COMPETENCY-BASED CREDITING: BASIC EDUCATION SURVEY DATA
Competency-based credit is related to mastery-based learning. In practice, educators usually use the term “competency-based credit” when students demonstrate proficiency and earn high school credit in a subject through a well-accepted, well-recognized assessment.
Every year, districts confirm their compliance with the requirements of Basic Education through an online survey submitted to the State Board of Education. In recent years, the Basic Education Compliance survey has asked if districts offered competency-based credit, and if yes, in what subjects. These survey results have shown that:
• The number of districts offering competency-based credit increased from 36% to 55% of districts with high schools between 2017 to 2019. The data are summarized below:
Number of districts that allow competency-based crediting
Number of districts that do not allow competency-based crediting
Class of 2017 89 160 Class of 2018 121 130 Class of 2019 138 114
• The number of subjects for which competency-based credit is offered also grew. o World language is the most commonly offered competency-based credit. This is
probably due to the WSSDA model policy that focuses on world language. Furthermore, there is a commonly-used assessment for many languages.
o Next most common is the use of the high school state assessment, the Smarter Balanced Assessment, for competency credit in English or math (Algebra I).
• Responses indicate great variability in how competency-based credit is being offered. Short answer responses submitted through the survey show that:
o Some districts only offer competency-based credit in their alternative high schools.
o Many schools are reluctant to offer competency credit, offering it rarely to only a few students.
o Some districts offer competency-credit through a policy that allows individual students to challenge graduation requirements.
OFFICE OF SUPERINTENDENT OF PUBLIC INSTRUCTION (OSPI) COMPETENCY-BASED ASSESSMENT
REPORT OSPI was tasked with providing a report to the education committees of the legislature detailing available competency-based assessments that meet the state learning standards. Information
14 45

• Mastery-based Leaming in Washington State
A Snapshot of K-12 Competency-Based Education State Policy Across the United States Updated May 2019
• Advanced Slates Those states with comprehens ive policy alignment and/or an active sta te role to bui ld capacity in k>cal school systems fof compe tency education .
• Developing Slates Thos.e states with open state po licy flexib ility for local 5Cnc:>ol sy!ilem!> to transition lo co mpetency educalion
D Emerr,ing Slates Thos e states with limited fle.xibility in state policy-usua lly requiring authorization from the state-for local school sys tems to shift to competency education . lof exploratory initia tives and task forces . a.ndlo r with minima l state activity to build local capacity .
D No Policies in Competency Educalion States w ith no state--.ve l .activity and enabling policies fD< competency education . Significant policy barriefli may exis t. !iUCh as influ ible '5eat-lime restrictions .
-----------------fNAeOL
from this report will inform the MBL work group’s final recommendations regarding ways to demonstrate mastery in accordance with state learning standards.8
MASTERY-BASED LEARNING ACROSS THE NATION AND INTERNATIONALLY There are a number of states leading in the provision of mastery-based learning. Figure 1 shows the level of competency-based education state policy across the nation.9 A few states are highlighted below that are doing particularly interesting work that may inform further development of policies in Washington.
Figure 1: A Snapshot of K-12 Competency-Based Education State Policy Across the United States
IDAHO Idaho is one of the states that is furthest along in its journey toward mastery education, because they have created an entire state framework around MBL. In 2013, an Idaho task force for improving education recommended pursuing the avenue of mastery learning. After an
8 https://www.k12.wa.us/sites/default/files/public/communications/2018-11-CompetencyBasedAssessments.pdf 9 A Snapshot of K-12 Competency-Based Education State Policy Across the United States. (2019, May). Retrieved from https://www.inacol.org/wp-content/uploads/2019/05/2019-Snapshot-of-CBE-State-Policy-updated-5312019.pdf.
15 46

• Mastery-based Leaming in Washington State
implementation committee developed recommendations (2014) and the legislature passed HB 110 (2015), a public awareness campaign was held regarding the legislation (2016) and in 2017, the first cohort of the Idaho Mastery Education network was selected.
In Idaho’s framework—learning is the constant and time is the variable. Idaho’s definition and tenets of mastery-based learning align well with the work group’s definition of MBL.10 Nineteen incubator teams (comprised of 32 schools) assessed standards, mastery, or competencies using various assessment tools, including exhibitions, portfolios, rubrics, project-based assessments, and individual assessments.11
Idaho is now in its second year of mastery education implementation but schools are beginning to see various indicators of success. “Parents, students, and teachers described many benefits of mastery education, including that it is hands-on and has real-world connections.12” Incubator schools measured success most commonly through student engagement, but also through high school graduation rates, test scores, social emotional outcomes, and workplace success.
SOUTH CAROLINA
In 2012, the state developed their Profile of the South Carolina Graduate, which includes a focus on world-class knowledge, world-class skills, as well as life and career characteristics. In 2014, a new state superintendent helped develop the vision to establish a system of personalized learning in every district, leading to state support beginning in 2016. The state Office of Personalized Learning was established in 2017, and the PersonalizeSC network launched the next year.
The South Carolina Personalized Learning Network focuses on student ownership, through learner profiles, learning pathways, and flexible learning environments. Students understand why they are learning what they are learning and have meaningful ways to demonstrate evidence of learning. The pace of instruction is based on the individual student’s learning pathway, and students can take as much or as little time as they need for each content standard.13
Beginning with 10 districts in 2017-18 school year and 25 coaches, the program grew substantially the next year to 55 districts (over 100 school teams) and over 100 coaches. The State Office of Personalized Learning focused on providing professional learning opportunities for each cohort, depending on their stage of implementation.
10 Idaho State Department of Education. (2019). Idaho Mastery Education Progress Report. Retrieved from http://www.sde.idaho.gov/mastery-ed/files/imen/IMEN-Progress-Report-2018.pdf 11 Roccograndi, A., & Stiefvater, E. (2019). Idaho Mastery Education Network Implementation Report. Education Northwest. Retrieved from http://www.sde.idaho.gov/mastery-ed/files/imen/IMEN-Evaluation-Report-2018.pdf 12 Ibid, page 27 13 Competency-Based Education. (2019). Retrieved from https://ed.sc.gov/instruction/personalized-learning/competency-based-education/
16 47

• Mastery-based Leaming in Washington State
UTAH
Legislation in 2013 and 2016 led to a state competency-based education pilot grant program in the 2017-2018 year with 13 participating local education agencies (LEAs).14 The initial legislation in 2013 (HB 393) instructed the State Board of Education to recommend a funding formula for schools and districts using a competency-based education approach. In the 2016 legislative session, a funding pool was established for districts to seek reimbursement for any loss in funding resulting from utilizing a state approved competency-based model.
Before beginning the pilot program, the State Board of Education conducted a needs assessment where they discovered that the interested LEAs were excited about the pilot program but felt “they lacked the knowledge to immediately design a successful competency-based education program.15” Based on this information, the pilot program was redesigned to accommodate first an exploratory phase and then a design phase. The pilot application also required applicants to identify at least four individuals from the LEA who would focus on the competency-based education program to ensure commitment to a successful pilot experience.
Utah released a Competency-Based Education Framework in 2018. The framework includes program quality indicators for the pilot period (e.g. student engagement measured through surveys and absenteeism rates as well as teacher turnover by teacher effectiveness), after the program has been fully implemented for three years (e.g. percent of students demonstrating proficiency at a specific level in core subject areas and performance on state accountability assessments), and long-term indicators (e.g. percent of students with an industry certification and percent of students who persisted from their 1st to 2nd year of college within 3 years of graduation.16)
NEW HAMPSHIRE
New Hampshire has been working toward a competency-based education system for more than twenty years. The state’s first competency-based education high school pilots were created in 1998. Beginning in 2004, the state began convening stakeholders to reevaluate “the goals and design of the state’s high school system.17” Beginning in the 2008-09 school year, local school boards were required to have a policy to ensure students could earn credit by demonstrating mastery of required competencies for a course (rather than by seat time). As of 2013, the state
14 Phillips, K., & Lockett, E. (2017). The Path to Personalized Learning: The Next Chapter in the Tale of Three States. ExcelinEd. Retrieved from https://www.excelined.org/downloads/path-personalized-learning-next-chapter-tale-three-states-october-2017/ 15 Ibid, page 13 16 Utah State Board of Education. (2018). Competency-Based Education Framework. Retrieved from https://www.schools.utah.gov/file/93b6b3c0-85c7-47e5-9f1b-3677b1c9603b 17 Frost, D. (2016, May 10). How New Hampshire Transformed to a Competency-Based System. Retrieved from https://www.inacol.org/news/how-new-hampshire-transformed-to-a-competency-based-system/
17 48

• Mastery-based Leaming in Washington State
now has approved subject competencies for all grade levels in English Language Arts, mathematics, and science.
The state has established statewide standards for their high schools to provide competency-based learning environments. Local districts are encouraged to establish additional academic standards as they determine what might be necessary to serve their students within their local context.18 Since 2012, all school districts are invited to take part in the Performance Assessment of Competency Education (PACE) program that combines standardized testing with locally-developed performance assessments. The goal of the PACE assessments is to “support deeper learning and be more integrated into students’ day-to-day work than current standardized tests.19”
Other areas of innovation in New Hampshire include the “No Grades, No Grades” (NG2) pilot initiative, which utilized multi-grade bands so that students are able to advance upon demonstration of mastery (the participating schools also participated in the PACE program).20
Students participating in the multi-grade bands were able to demonstrate a clear increase in their learning progress.
OTHER STATES
Even in states that do not have a stated focus or program of mastery-based learning, elements of MBL are still present in certain programs and schools.
For example, in Massachusetts, there was a MassGrad initiative to employ evidence-based strategies for dropout prevention. One of the strategies included an “alternative pathways” program implemented in 17 high schools. Some of the schools incorporated elements of mastery-based learning:
• Several schools offered online courses that were self-paced (and did not include seat time restrictions). Students also had the ability to test out of units where they had already mastered the content.
• Teachers at several schools tried new approaches to both instruction and assessment. • At competency-based Boston Day and Evening Academy, when students enroll, they are
assessed and then based on their results, are placed in personalized courses where they can progress at their own pace.21
18 Ibid 19 Ibid 20 Els, J. V., & Holloway, D. (2018, February). Our Quest to Personalize Competency-Based Learning in New Hampshire. Retrieved from https://www.competencyworks.org/case-study/school-models/our-quest-to-personalize-competency-based-learning-in-new-hampshire/ 21 University of Massachusetts Donahue Institute in collaboration with the Massachusetts Department of Elementary and Secondary Education. (2015). Alternative Pathways to a High School Diploma: MassGrad Summary Brief. Retrieved from http://www.doe.mass.edu/ccr/massgrad/SummaryBrief-AlternativePathways.pdf
18 49

• Mastery-based Leaming in Washington State
INTERNATIONAL EXAMPLES OF MASTERY-BASED LEARNING
Across the European Union, member countries have agreed to a set of key competences for lifelong learning critical for all students to achieve (a number of these overlap with the U.S. concept of 21st century skills).22
In Finland, after decades of reform, the education system has shifted from a centralized one that emphasizes standardized tests to a localized focus. Educators are highly respected as professionals, and the state pays for a research-based master’s degree for each educator—which includes a full year of student teaching at a model school associated with the student teacher’s university. At each school, educators and administrators design the educational goals for their local context. One of the guiding themes in competency-education is a focus on equity and students receive feedback on their learning in a variety of ways, including with ongoing formative assessments. Additionally, students engage in self-paced learning and create their own individual study plan, especially in high school.
In Sweden, 33 Kunskapsskolan (knowledge schools) operate through a fully competency-based model where students set their own learning goals as early as eighth grade. A student’s education has two levels: individual subject competency as well as higher level skills that align with the EU’s key competences. Over 100 schools operate under this model around the world in six countries (adapted to each nation’s standards), including in the U.S.
In British Columbia (Canadian province), there is a stated goal in the province’s Education Plan23
that students be at the center of their learning. To develop the province’s plan, there was extensive stakeholder outreach to inform the creation of a new curriculum that was more flexible for all students. This is enabled in several ways, including through a legislative framework allowing each local school board to establish the calendar it believes best fits the schools within its district (there is no standard calendar). One school in British Columbia with a particular focus on mastery-based learning is Thomas Haney Secondary School, where “it is common to see students of different ages collocated and engaged in shared class time. Beginning in the ninth grade, students may design their entire day of classes, as long as it revolves around that day’s learning goal, which is mapped to the learning standards (and which they can articulate).24”
Finland, Scotland, and British Columbia all have leaner standards intended to provide greater autonomy to teachers and more personalization opportunities to students. Both Finland and Scotland have a focus on the “whole child” and providing wraparound support services (e.g. on-site health services) to all students. Both Finland and New Zealand have a focus on ensuring that
22 Bristow, S. F., & Patrick, S. (2014). An International Study in Competency Education: Postcards from Abroad. CompetencyWorks. Retrieved from https://www.inacol.org/resource/an-international-study-in-competency-education-postcards-from-abroad/ 23 Ibid 24 Ibid
19 50

• Mastery-based Leaming in Washington State
students can articulate their learning and that they choose when they are ready to ‘show what they know’ through assessments or other methods.
Using the definition of mastery-based learning, here are some global examples of each of the components of MBL:
a) Students advance upon demonstrated mastery of content; There is a perception that U.S. federal policy presents a barrier to this concept, because of “the expectation that state-level summative assessments be based on age and grade, rather than on the evaluation of where a student is in a learning progression, and the amount of growth that has occurred.25” However, in select programs in districts across the U.S., a few schools have begun using multi-age cohorts—for instance in Idaho, there is a cohort of schools leading the implementation of mastery education with multi-age cohorts.
b) Competencies include explicit, measurable, transferable learning objectives that empower students;
A focus on teacher/school autonomy as well as student agency (that students can describe their own learning objectives and their progress toward them, as well as can demonstrate their mastery of a topic on their own timeline) is essential.
c) Assessments are meaningful and a positive learning experience or students; When students can choose to be assessed on their learning at a time they pick and in a way they design, then assessment is seen as a natural and healthy part of the learning process. Then assessments (especially formative assessments) can help educators and students to better facilitate an individual student’s learning progression.
d) Students receive rapid, differentiated support based on their individual learning needs; and
As identified already by work group members, adequate staffing to provide each student differentiated support based on their learning needs is a critical component of mastery-based learning. In both Kunskapsskolan and Thomas Haney Secondary schools, students have weekly check-ins with their learning coach. All other school schedules are based around this critical one-on-one time between educator and student.
e) Learning outcomes emphasize competencies that include application and creation of knowledge along with the development of important skills and dispositions.
When a country has learning standards or curricula focused on crosscutting skills, this allows individual schools to adapt classroom lessons to their local context with subject-specific knowledge acquisition. One local example of this is the Lummi Nation School in Bellingham, Washington which focuses on instilling cultural awareness in students throughout their
25 Ibid, page 26
20 51

• Mastery-based Leaming in Washington State
academic learning. The European Union, New Zealand, and Australia all have specific competencies identified to ensure equity across their educational system as well as ensure all students have the knowledge and skills they need to be successful in life.
21 52

OSPI Staffing Enrichment Workgroup Recommendations PREPARED FOR THE JANUARY 2020 BOARD MEETING
Information
Materials included in packet: • OSPI Staffing Enrichment Workgroup Recommendations
Synopsis: Member Holly Koon served as the State Board of Education representative on the Staffing Enrichment Workgroup convened and led by OSPI. The workgroup focused its efforts on eliminating opportunity gaps and with that lens reviewed the allocations of staff that the state funds as part of the program of basic education. The found that high supports and high expectations for all students are delivered by a workforce that is diverse, culturally responsive, racially literate, and aware. In addition, the workgroup expressed a belief that Washington’s K–12 students must be served by equity-based policies that support and empower educators, families, and communities. The report includes six high level recommendations:
1. Modify current prototypical school level sizes.
2. Meet students’ needs for safety as well as mental, social, emotional, and behavioral health.
3. Provide impactful professional development to all staff.
4. Increase flexibility with transparency and accountability.
5. Raise staffing levels to meet those set in Initiative 1351 and provide additional funds for schools in the Capital Budget.
6. Reconvene the Workgroup.
This report provides a student-focused, phase-in approach over six years to address the evolving needs of the students of our state.
53

Member and Committee Updates PREPARED FOR THE JANUARY 2020 BOARD MEETING
Information and Action
Materials included in packet: • Draft Board Norms - Possible Action• Draft Revisions to the Vision and Mission Statement – Possible Action
Synopsis: The report is an opportunity for members to provide updates to the full Board on committee discussions, meetings with stakeholder groups, conferences, or professional development activities. For January the Norms committee will present revised draft norms for consideration as well as a recommended change to the vision statement to align with discussions raised by the norms committee and discussion at the November 2019 meeting.
In addition, members who attended conferences and stakeholder meetings in November and December will share comments during this discussion item.
54

1
Board Norms for the Washington State Board of Education January 15, 2020
This brief includes draft norms being discussed by the ad-hoc committee on Norms following Board discussion at the November meeting. The norms are intended to provide a common, agreed-upon set of standards for Board behavior. The norms build on the values adopted by the Board and should define what that value looks like through the expected behavior of the Board and individual members. In addition, the norms fit within a framework that includes SBE’s vision, mission, and statutory roles and responsibilities. The norms share some language and purpose with the bylaws, but unlike the bylaws the norms are non-binding expectations for behavior of the group.
Draft Norms 1. Board meetings will focus on State Board of Education goals as articulated in the
Strategic Plan, while recognizing that other matters may also be part of a meeting agenda.
2. The purpose of Board meetings is to discuss policies that help all students engage in personalized education pathways that prepare them for civic engagement, careers, post-secondary education, and lifelong learning, and healthy and fulfilling lives. Agendas, presentations, and discussions for each board meeting should reflect this overarching purpose.
3. As a policy making and advocacy body, the Board will adhere to shared values expressed in the strategic plan as Board members endeavor to fulfill the Board’s mission and vision. To this end the Board will apply an equity lens when considering and adopting policies and approving reports. In addition, the Board will annually review and update the equity statement and lens to ensure equity remains an integral part of the policy and decision-making process.
4. At Board meetings, and in all communications with the public and staff, Board members will maintain the dignity and integrity appropriate to an effective public body.
5. Every board member is expected to play a meaningful role in the Board’s overall operations. Each member expects of one another a dedication to the work of the Board and will endeavor to understand the views of other members and to
55

2
engage in civil discussion. The Board embraces healthy debate on policy issues. In addition, the board endeavors to:
6. Board meetings include the following procedures:a. Board meetings will start on time and end on time.b. Meeting materials will be made available one week in advance (see Bylaw
Article V section 2) and should consistently be of high quality.c. Board members are expected to consistently attend and prepare for Board
and committee meetings and to read the materials in advance of themeeting (see Bylaw Article III, section 2).
d. As schedule permits, Board members are encouraged to attendcommunity forums, site visits, and other outreach and engagement events.
e. Each presentation will start with a staff introduction providing clarity of thepurpose of the presentation and the decision to be made or issue to beconsidered.
f. Board members will hold their questions (except for brief clarifyingquestions) until the end of each presentation, or until the presenter offersa designated “pause” for questions.
g. The rules contained in the current edition of Robert's Rules of OrderNewly Revised shall govern the State Board of Education in all cases towhich they are applicable and in which they are not inconsistent with thesebylaws, state law and any special rules of order the State Board ofEducation may adopt.
h. Board members will do their best to be succinct to maintain opportunityfor all to express themselves. To avoid repetition of the same ideas andpoints Board members will strive to express agreement with a memberrather than repeat a point that has already been made.
i. In the interest of orderly and efficient meetings, and to balance Boardmembers’ speaking time, the Board Chair will recognize members prior tothem speaking. The Vice Chair or Executive Director will assist the chair intracking who would like to speak on an issue.
j. Each Board member expects of others a commitment to speak and listenwith purpose during each discussion. The Board Chair – or his/herdesignee – will provide leadership to ensure that the discussions anddeliberations are leading to a focused outcome.
56
a. Support new members learning as they become engaged and active members of the Board.
b. Ensure student voice is heard and considered as a critical part of poli cydebate and discussion.

3
k. Board meetings should be a forum for Board discussion. Staff and guest presentations will be structured to facilitate this discussion, not supplant it.
l. Board members may engage in different ways and may find it necessary at times to stand or move around during the meeting time.
7. When considering policy proposals or other decisions, each Board member expects of others an opportunity for advance review. The Board agrees to a “no surprises” mode of operation. To this end, Board members may submit proposed agenda items to the Chair or Executive Director (see Bylaw Article V, section 2) for consideration by the Executive Committee. The Executive Committee will respond to member proposals as appropriate. If, after discussion of an item, the proposing member changes her or his mind or otherwise deems the proposal unnecessary they may withdraw their proposal.
8. Although the Board is composed of appointed and elected members, Board members strive for commonality and unity of purpose through their deliberations.
9. Board members will maintain the confidentiality of executive sessions.
10. Members of the Board will support Board positions, decisions, and policies when
providing information to the public, stakeholder groups, or the legislature. (3) This section does not preclude individual Board members from expressing their personal views. When expressing personal views, members should specify that that they are speaking as an individual and not on behalf of the Board.
11. The chair, executive director, or the executive director’s designee will be the
spokesperson for the Board with the media.
12. The Board is a learning organization. As a body we strive to explore new issues and expand our collective knowledge to better address policy issues facing students and our education system. To this end members and staff engage in professional learning and the board will engage with stakeholders and other experts to inform planning and establishing priorities. Members who attend meetings with exterior stakeholders or participate in professional learning opportunities may report back to the Board during the next regular Board Meeting as appropriate and as agenda time allows
57

1
Draft Board Vision Statement Washington State Board of Education
January 15, 2020
Vision The Washington State Board of Education envisions an education system where students are engaged in personalized education pathways that prepare them for civic engagement, careers, postsecondary education, and lifelong learning, and healthy and fulfilling lives.
Mission The mission of the State Board of Education is to provide transparent leadership in K-12 education policy-making; effective oversight of schools serving Washington K-12 students; and, assertive advocacy for student personal growth and success. These three areas of responsibility will support a system that personalizes learning for each student and values diverse cultures, abilities, and learning styles.
Values
Equity Equity is a primary consideration in our policy-making, initiatives, actions, and interactions. The Board has adopted an Equity Statement of Intent (https://sbe.wa.gov/about-us/equity) and we actively seek to identify and remove barriers that inhibit equitable access to high-quality learning opportunities.
Student-focused Education Provide educational, social, emotional, and mental health supports for the whole child. Enact policies that benefit our students and modify or eliminate policies that are not beneficial. Create meaningful opportunities to hear from and respect diverse student voices. Build authentic, caring relationships with students. Empower students to lead their own learning and provide personalized learning that is relevant to students.
58

2
Strategic Action Enact impactful, sustainable, research-based initiatives to fulfill our mission and vision. Support an innovative and adaptive system that meets the needs of individual students.
Dynamic and Future-Focused Innovation Think, plan, and lead proactively. Anticipate the needs of our students and society. Employ research-based strategies. Encourage schools to innovatively cultivate student achievement and develop transferable skills for a changing workplace. Recognize the changes in our students’ needs and change the system accordingly.
Collaboration, Caring, and Inclusion Engage and collaborate with partners to achieve shared goals. Value, listen, and learn from all voices. Intentionally seek the wisdom of students, families, and communities, particularly those historically marginalized by the educational system, to inform policies and practices.
Integrity Act with honesty, professionalism, and transparency. Fulfill our commitments in a fair and ethical manner.
59

Cover: Equity Statement and Summit Planning PREPARED FOR THE JANUARY 2020 BOARD MEETING
Information and Action SBE’s Equity Committee: • Co-Chair: Patty Wood • Co-Chair: Bill S. Kallappa II • Ryan Brault • Dr. Paul Pitre • Dr. Susana Reyes • Staff: Stephanie Davidsmeyer, Randy Spaulding The Committee would like feedback on the State Board of Education’s equity statement and lens as well as the agenda for the April 22, 2020 summit scheduled to be held at Capitol Region ESD 113 in Tumwater. Materials included in packet: • Draft equity statement - Action • Equity lens (updated December 2019) • Draft summit agenda – Additional Materials
60
Equity Statement
The Washington State Board of Education uses equity as a guiding principle in carrying out its statutory
charges, strategic planning, and policymaking.
The Board believes that the state’s school system exists to empower all students and assure they are
ready to become productive, caring, and civically engaged community members.
The Board is committed to successful academic attainment for all students. It will require narrowing
opportunity and academic achievement gaps between the highest and lowest performing students, and
eliminating predictability and disproportionality in student outcomes by race, ethnicity, and
socioeconomic conditions.
To accomplish this, the Board will work collaboratively and transparently with educational and
community partners to:
Ensure that equity in education is understood as a process to identify and eliminate institutional
policies, practices, and barriers that reinforce and contribute to predictably disparate
educational outcomes;
Honor and actively engage Washington’s underserved communities as partners in developing
and advocating for equity-driven policies, practices, and resources that meet the needs of all
students; and
Use equity as a lens to continuously assess and improve the collective process of policymaking
to ensure our school system’s commitment and ability to meet the needs of all students today
and into the future.
Adopted March 14, 2019
61
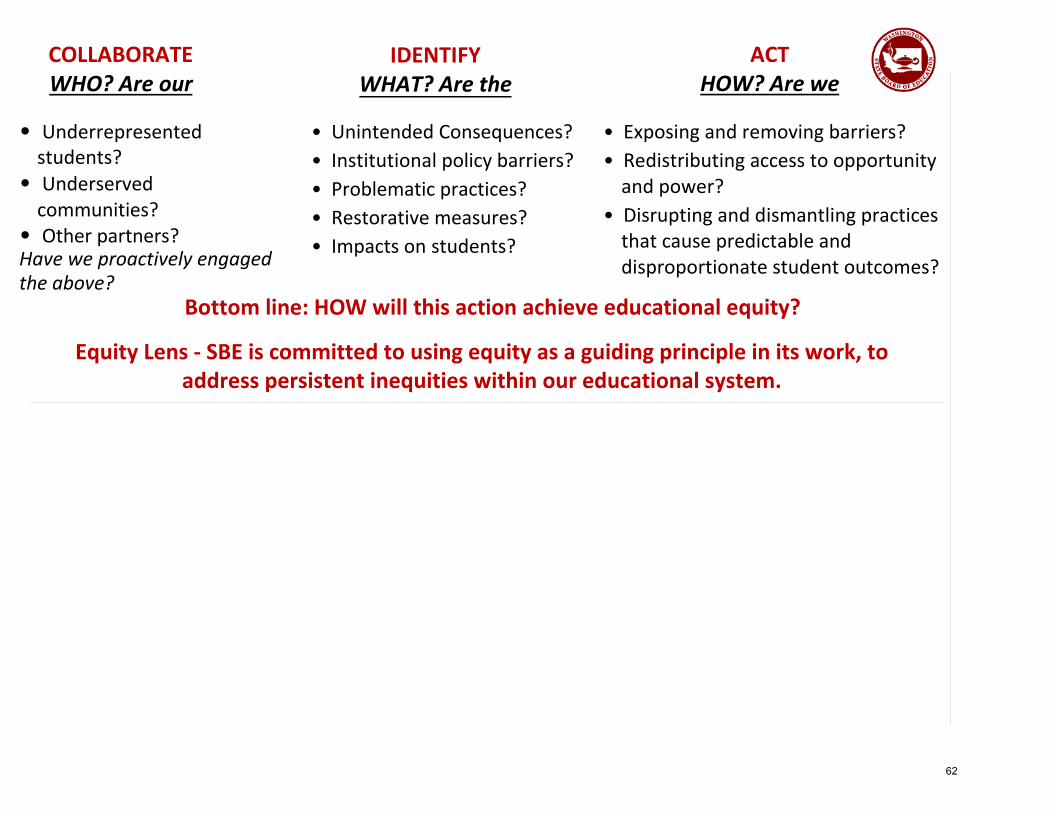
COLLABORATE WHO? Are our
• Underrepresented students?
• Underserved communities?
• Other partners? Have we proactively engaged the above?
IDENTIFY WHAT? Are the
• Unintended Consequences?• Institutional policy barriers?• Problematic practices?• Restorative measures?• Impacts on students?
ACT HOW? Are we
• Exposing and removing barriers?• Redistributing access to opportunity
and power?• Disrupting and dismantling practices
that cause predictable anddisproportionate student outcomes?
Bottom line: HOW will this action achieve educational equity?
Equity Lens - SBE is committed to using equity as a guiding principle in its work, to address persistent inequities within our educational system.
62

High School Graduation Forecast and Graduation Results for the Class of 2019
PREPARED FOR THE JANUARY 2020 BOARD MEETING
Information
Materials included in packet: • 0501 WICHE PowerPoint Presentation • 0502 Class of 2019 Graduation Results PowerPoint Presentation • 0503 OSPI PowerPoint Presentation – Additional Materials
Synopsis: Graduation rates have been rising over the past several years in Washington. As a result, the number of graduates in Washington has exceeded projections. Patrick Lane, Vice President, Policy Analysis and Research, for the Western Interstate Commission for Higher Education (WICHE) will discuss their projections and recent data on graduations in Washington. Andrew Parr, Director of Research with the State Board of Education will then provide a preview of the latest data on graduation rates in Washington followed by a discussion of the use of various graduation alternatives appeal use by Deb Came, Assistant Superintendent, Assessment and Student Information, OSPI.
63

Look who’s
with support from

What is WICHE?

High School Graduates in Washington: Projections & realityOverview• Overall goal: Understand national and Washington-specific
projections for high school graduates (and why they’re probably“wrong!”)
• State/national demographic changes• Methodology matters• Reality vs. Projections• Questions and discussion

Story 1: Peak enrollment

1976 1986 1996 2006 2016 2026
3.14MStrong production of H.S. grads for
two decades
3.44M3.47M
Projected slowdown/stagnation Projected
declines
3.30M
Slowdown and Decline of Traditional-Age Students

Projected Washington high school graduates
0
20,000
40,000
60,000
80,000
100,00020
01
2003
2005
2007
2009
2011
2013
2015
2017
2019
2021
2023
2025
2027
2029
2031
Actual Projection

Where is this coming from?
Source: Gerber

U.S. fertility rates over time
Source: World Bank, via Federal Reserve Bank of St. Louis
Great Recession
Peak fertility rates in 2007
No rebound (unlike past recessions)

1976 1986 1996 2006 2016 2026
3.14MStrong production of H.S. grads for
two decades
3.44M3.47M
Projected slowdown/stagnation Projected
declines
3.30M
18 Years
Slowdown and Decline of Traditional-Age Students

Story 2: Increasing diversification

U.S. Public High School Graduates, by Race/Ethnicity
2001 2011 2021 2031
2,569,200
Hispanic
White
Black
Asian/Pacific Islander
202620162006
3,169,2573,317,313
3,076,509

010,00020,00030,00040,00050,00060,00070,00080,00090,00020
0120
0320
0520
0720
0920
1120
1320
1520
1720
1920
2120
2320
2520
2720
2920
31
WhiteHispanicAfrican AmericanAsian/Pacific IslanderAmerican Indian/Alaska Native
Actual Projection
Washington Public Graduates by Race/Ethnicity

Methodological Interlude

Projections meet reality

Washington 9th Graders (Public) – Projections v. Actuals
020,00040,00060,00080,000
100,000
2013 2014 2015 2016 2017
Projected Actual
Actuals 1.3% below WICHE projections in
2017.
Sources: Western Interstate Commission for Higher Education, Knocking at the College Door: Projections of High School Graduates, 2016, www.wiche.edu/knocking
National Center for Education Statistics, Common Core of Data, 2016-17, https://nces.ed.gov/ccd/stnfis.asp

Washington 12th Graders (Public) – Projections v. Actuals
020,00040,00060,00080,000
100,000
2013 2014 2015 2016 2017
Projected Actual

White 12th Graders (Public) – Projections v. Actuals
0
20,000
40,000
60,000
80,000
2013 2014 2015 2016 2017
Projected Actual
Actuals 4 percent above WICHE projections by
2017
Sources: Western Interstate Commission for Higher Education, Knocking at the College Door: Projections of High School Graduates, 2016, www.wiche.edu/knocking
National Center for Education Statistics, Common Core of Data, 2016-17, https://nces.ed.gov/ccd/stnfis.asp

Latinx 12th Graders (Public) – Projections v. Actuals
Actuals 2 percent above WICHE projections by
2017.
0
5,000
10,000
15,000
20,000
Projected Actual
2013 2014 2015 2016 2017Sources: Western Interstate Commission for Higher Education, Knocking at the College Door: Projections of High School Graduates,
2016, www.wiche.edu/knockingNational Center for Education Statistics, Common Core of Data, 2016-17, https://nces.ed.gov/ccd/stnfis.asp

African American 12th Graders (Public)Projections v. Actuals
6,0005,000 Actuals 29 percent 4,000 above WICHE
projections by 3,000 2017. 2,000
Projected Actual1,000
02013 2014 2015 2016 2017
Sources: Western Interstate Commission for Higher Education, Knocking at the College Door: Projections of High School Graduates, 2016, www.wiche.edu/knocking
National Center for Education Statistics, Common Core of Data, 2016-17, https://nces.ed.gov/ccd/stnfis.asp

Asian/Pacific Islander 12th Graders (Public)Projections v. Actuals
Actuals 12 percent above
WICHE projections by
2017.
0
2,000
4,000
6,000
8,000
10,000
2013 2014 2015 2016 2017
Projected Actual
Sources: Western Interstate Commission for Higher Education, Knocking at the College Door: Projections of High School Graduates, 2016, www.wiche.edu/knocking
National Center for Education Statistics, Common Core of Data, 2016-17, https://nces.ed.gov/ccd/stnfis.asp

American Indian Alaska Native 12th Graders (Public)Projections v. Actuals
Actuals 32 percent above
WICHE projections by
2017.
0
400
800
1,200
1,600
2,000
2013 2014 2015 2016 2017
Projected Actual
Sources: Western Interstate Commission for Higher Education, Knocking at the College Door: Projections of High School Graduates,2016, www.wiche.edu/knocking
National Center for Education Statistics, Common Core of Data, 2016-17, https://nces.ed.gov/ccd/stnfis.asp

Takeaways
• Projections have likely underestimated number of high schoolgraduates
• Improvements in high school graduation rates likely to “blame”• Underestimation larger for non-Hispanic students of color• Although this is a good story, significant equity gaps remain
• Student diversity will continue to increase• Reductions in graduation gaps by race/ethnicity will only increase diversity of
graduating classes

Final Conclusion: Demography isn’t destiny
• Other uncertainties: immigration, migration within states and regions,policy shifts
• Commitment to postsecondary education (with spillover focus onhigh school graduation)
• Another certainty: Funding challenges
• Environmental context can shift: skill demand, automation,recessions/booms, other student populations

Questions and Contact Info
Patrick LaneVice President, Policy Analysis and Research
Western Interstate Commission for Higher Education303.541.0266
Question for you: What other data and information do you need?
White White
Update - Class of 2019 GraduationWashington State Board of Education
January 15, 2020

ESSA and Statewide IndicatorsLong Term Goals - 2018
Eight of 11 groups are currently on track to meet the 2027 ESSA and Statewide Indicators long term graduation rate goals.
2
Four-Year Adjusted Cohort High school Graduation Rate
Actual C/O2017
Actual C/O 2018
C/O 2018 Target
Statewide Indicators Target
All Students 79.3 80.9 80.4 Exceeds annual targetBlack / African American 71.5 74.4 73.4 Exceeds annual target
Amer. Indian / Alaskan Native 60.3 60.4 63.3 Did not meet annual targetAsian 87.5 90.0 87.7 Exceeds annual target
Hispanic / Latinx 72.7 75.2 74.4 Exceeds annual targetHawaiian / Pacific Islander 68.1 74.0 70.3 Exceeds annual target
White 81.9 82.9 82.7 Exceeds annual targetTwo or More Races 79.7 80.7 80.8 Did not meet annual target
Row intentionally Left Blank.
Students with a Disability 59.4 61.7 62.4 Did not meet annual targetLimited English 57.8 64.1 61.0 Exceeds annual target
Low-Income 70.0 72.1 72.0 Exceeds annual target

ESSA and Statewide IndicatorsLong Term Goals - 2019
Seven of 11 groups posted small rate increases for the C/O 2019. Two student groups are currently on track to meet the 2027 ESSA and Statewide Indicators long term graduation rate goals.
3
Four-Year Adjusted Cohort High school Graduation Rate
Actual C/O2018
Actual C/O 2019
C/O 2019 Target
Statewide Indicators Target
All Students 80.9 80.9 81.5 Did not meet annual targetBlack / African American 74.4 73.6 75.2 Did not meet annual target
Amer. Indian / Alaskan Native 60.4 61.7 66.3 Did not meet annual targetAsian 90.0 90.4 88.0 Exceeds annual target
Hispanic / Latinx 75.2 75.7 76.2 Did not meet annual targetHawaiian / Pacific Islander 74.0 74.4 72.5 Exceeds annual target
White 82.9 82.8 83.5 Did not meet annual targetTwo or More Races 80.7 81.2 81.8 Did not meet annual target
Row intentionally Left Blank.
Students with a Disability 61.7 62.1 65.5 Did not meet annual targetLimited English 64.1 62.4 64.2 Did not meet annual target
Low-Income 72.1 72.2 74.0 Did not meet annual target

Four-Year Graduation RateIncremental Improvement Over Time
The All Students group graduation rate increased approximately 4.9 percentage points (0.8 percentage points per year) from the C/O 2013 to the C/O 2019.
4
76.0% 77.2% 78.1% 79.1% 79.3% 80.9% 80.9%
50%
60%
70%
80%
90%
100%
C/O 2013 C/O 2014 C/O 2015 C/O 2016 C/O 2017 C/O 2018 C/O 2019
Perc
ent G
radu
atin
gFour-Year Graduation Rate
All Students

Change in Four-Year Graduation RateRace and Ethnicity Student Groups
5
0 2 4 6 8 10 12 14
White
Two or More Races
Asian
Black
Native American
Hispanic
Pacific Islander
Change in Four-Year Graduation RateClass of 2013 to the Class of 2019
Graduation gaps aredecreasing.
The graduation rates forthe Native American, Black,Hispanic, and PacificIslander student groupsincreased from 1.4 to 2.0percentage points per yearover the most recent years.

Change in Four-Year Graduation RateProgram Participation
6
0 2 4 6 8 10 12 14
Not FRL
FRL
Not SWD
SWD
Not ELL
ELL
Change in Four-Year Graduation RateClass of 2013 to the Class of 2019
Graduation gaps are decreasing for all of these student groups.
The graduation rates for the English learner student group increased an average of two percentage points per year over the most recent years.

Who is Graduating in Greater Numbers from Washington Public Schools?
Fast FactsWith the C/O 2013 as a starting point and the C/O 2019 as an endpoint: The number of White
students graduating in four years fell by nearly 700.
The number of Hispanicstudents graduating in fouryears increased by 5,045.
The number of students(other than White or Hispanic)graduating in four yearsincreased by 3,429.
7
0
20,000
40,000
60,000
80,000
C/O 2013 C/O 2014 C/O 2015 C/O 2016 C/O 2017 C/O 2018 C/O 2019
Num
ber o
f Gra
duat
es
Number of Students Graduating High Schoolin Four Years Less
White Hispanic Other
Student GroupC/O 2013
C/O 2019
Change
White 40,029 39,331 -698Hispanic 8,773 13,818 5,045Other (Not White and Not Hispanic) 11,673 15,102 3,429
All Students 60,475 68,251 7,776

Changes in the Number ofHispanic/Latinx High School Graduates Over Time
Fast Facts
The number of non-graduatesdeclined a little (4600 to 4443) butthe rate declined from 34 to 24percent.
For the C/O 2019 compared to theC/O 2013 Approximately 3200 additional
Hispanic students graduated dueto the increased adjusted cohort(13,000 to 18,000 students).
Approximately 1850 additionalHispanic students graduatedbecause of the grad rate increasefrom 66 to 76 percent.
8
0
5,000
10,000
15,000
20,000
C/O2013
C/O2014
C/O2015
C/O2016
C/O2017
C/O2018
C/O2019
Num
ber
of G
radu
ates
Greater Numbers of Hispanic Students are Graduating from High School Each Year
Increase in the Number of Graduates Due to Graduation Rate Increase
Increase in the Number of Graduates Due to Cohort Size Increase
Number of Graduates at Constant Graduation Rate and Cohort Size
Number of Non-Graduates

Graduation Gap by Poverty Status
9
0
20
40
60
80
100
C/O 2013 C/O 2014 C/O 2015 C/O 2016 C/O 2017 C/O 2018 C/O 2019
Perc
ent G
radu
atin
gFour-Year Graduation Rate
by Poverty Status
Low Income Not Low Income
The graduation gap decreased by 4.4 percentage points from the C/O 2013 to the C/O 2019 (approx. 0.7 percentage points per year).

Graduation Gap by Race/EthnicityHispanic – White
10

Graduation Gap by Race/EthnicityBlack – White
11
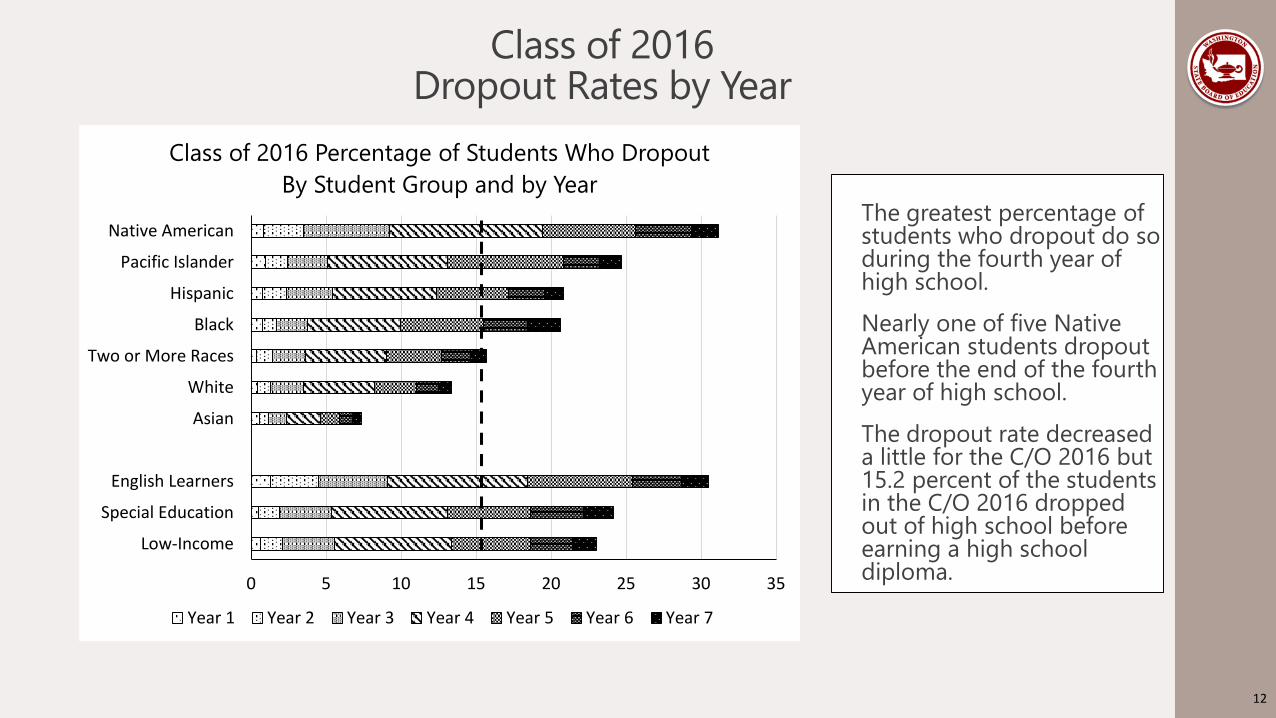
Class of 2016Dropout Rates by Year
12
The greatest percentage ofstudents who dropout do soduring the fourth year ofhigh school.
Nearly one of five NativeAmerican students dropoutbefore the end of the fourth year of high school.
The dropout rate decreaseda little for the C/O 2016 but 15.2 percent of the studentsin the C/O 2016 droppedout of high school beforeearning a high school diploma.0 5 10 15 20 25 30 35
Low-Income
Special Education
English Learners
Asian
White
Two or More Races
Black
Hispanic
Pacific Islander
Native American
Class of 2016 Percentage of Students Who DropoutBy Student Group and by Year
Year 1 Year 2 Year 3 Year 4 Year 5 Year 6 Year 7

Contact Information
Website: www.SBE.wa.gov
Facebook: www.facebook.com/washingtonSBE
Twitter: @wa_SBE
Email: [email protected]
Phone: 360-725-6025
Web updates: bit.ly/SBEupdates
13

HS Diploma Requirements and Pathways PREPARED FOR THE JANUARY 2020 BOARD MEETING
Information
Materials included in packet: • Draft Pathways Report • Strobel Consulting Update
Synopsis: The State Board of Education (SBE) was directed by the Legislature in E2SHB 1599 to survey interested parties regarding what additional graduation pathways should be added to the existing graduation pathways and whether modifications should be made to any of the existing pathways, and report to the Legislature by August 1, 2020. In addition, the Board will report on barriers to implementation and recommendations for changes to gradation pathways by December 10, 2022.
The Board will submit an initial (not required) report to the Legislature in January 2020. SBE contractor Strobel Consulting has started the process of surveying interested parties about pathways. SBE staff will summarize the draft report and Alisha Strobel, Strobel Consulting’s representative, will update the Board on the survey process.
Business Items: No Board action is associated with this agenda item.
83

Prepared by GRADUATION PATHWAY
OPTIONS January 2020 Interim Report
84

CONTENTS
Overview of the Report...............................................................................1
Background ..................................................................................................2
Graduation Pathway Availability ...............................................................4
Feedback Received To Date........................................................................7
Next Steps ..................................................................................................10
Appendix A – Strobel Consulting Work Plan Highlights .......................11
Appendix B – Notes from Community Forum ........................................11
Appendix C – Notes from WSSDA Conference Breakout Session.........15
DRAFT
INTERIM REPORT ON GRADUATION PATHWAYS
OVERVIEW OF THE REPORT
Through Engrossed Second Substitute House Bill 1599 (E2SHB 1599) the Legislature tasked the State Board of Education (SBE) with providing an analysis of the equity and adequacy of the new graduation pathway options through stakeholder outreach and engagement. The first required report is due on August 1, 2020 and the final report is due on December 10, 2022. In addition, SBE plans to provide this initial report in January 2020 as well as an interim report in December 2021.
Since the passage of E2SHB 1599 and throughout the course of SBE’s rulemaking process this year regarding WAC 180-51 (Graduation Requirements), SBE has solicited and received feedback on the graduation pathway options. In the interest of providing timely and actionable information to the Legislature, SBE submits this initial report to summarize:
• What is known so far regarding graduation pathway option availability.• Feedback and input from various interested parties concerning pathways and pathway
implementation issues.
This report does not present recommendations. The Board does not yet have a position on potential changes to graduation pathway options, or on comments or feedback received.
1 | JANUARY 2020
85
Recommendations, required under E2SHB 1599 for the final report in 2022, will be based on outreach, research and analysis the Board had started, as well as on data that the Superintendent of Public Instruction will be reporting to the Legislature. SBE has contracted with Strobel Consulting for conducing and analyzing survey and focus group information on graduation pathways. Highlights of Strobel Consulting’s work plan are included as Appendix A in this report.
In initial feedback from a variety of sources, described in the body of this report, educators and other stakeholders have expressed some of the following issues and concerns about graduation pathway options:
• Challenges in offering CTE sequences, especially for smaller districts, such as obtainingand maintaining CTE certificated teachers.
• Differing standards between the different pathways, particularly between Dual Creditprograms, but also between all the pathways.
• Concerns for student equity, and particularly how pathways will work for students withIndividualized Education Programs, and how different pathways may disproportionatelyaffect students of color.
• A concern for how the graduation pathway options will work with the credit graduationrequirements, and the capacity of schools to provide adequate guidance and counselingto students.
• An interest in additional pathways that might include:o Collections of Evidence.o Work or apprenticeship.o An arts pathway, or other non-English and math subject areas.
BACKGROUND
The 2019 legislation (E2SHB 1599) eliminated the Certificate of Academic Achievement, meaning that state high school assessments will no longer be used as exit exams required for high school graduation. E2SHB 1599 replaced exit exams with graduation pathway options. Graduation pathway options include the state assessments and most previous assessment alternatives, as well as two new graduation pathways: a military pathway (ASVAB, the Armed Services Vocational Aptitude Battery) and a Career and Technical Education (CTE) pathway. The Board was directed by E2SHB 1599 to write rules to implement graduation pathways and set the scores needed to meet the pathway requirement for some of the pathways involving assessments. As described below, the Board did not change scores for assessments already included in the previous alternatives but did establish a score for the new ASVAB pathway.
Because of these changes, including the introduction of graduation pathways, the role of SBE in the assessment system is shifting. The Board will continue to provide consultation to the Office of the Superintendent of Public Instruction (OSPI) concerning the state assessment system,
2 | JANUARY 2020
86

including identifying the scores needed to meet standard on state assessments. In addition, the Board will also work with OSPI to support assessments associated with graduation pathways.
Table 1: Graduation pathway options (More information on Pathways, including the scores needed to meet the pathway options involving assessments may be found on SBE’s Graduation Pathway Options webpage.)
Pathway Course-based Assessment Score Identified by SBE
Assessment Score in Statute
Dual Credit Courses n/a n/a AP/IB/Cambridge Courses n/a n/a Transition Course n/a n/a CTE Sequence* n/a n/a State Assessment n/a n/a SAT/ACT n/a n/a ASVAB* n/a n/a AP/IB/Cambridge Tests n/a n/a
*CTE (Career and Technical Education) and ASVAB (Armed Services Vocational Aptitude Battery)are “stand-alone” pathways. In the other pathways, students must meet the standard in bothEnglish language arts and math; combinations of pathways may be used.
Table 1 lists the graduation pathway options, and shows which are course-based and which are associated with assessments. The SBE is responsible for setting the scores for English language arts and math on three of the pathways, SAT/ACT college admissions tests, ASVAB (Armed Services Vocational Aptitude Battery), and the state assessment (Smarter Balanced). With the implementation of E2SHB 1599, the Board decided to maintain the scores previously used as meeting the graduation standard on the state assessments and on assessment alternatives (SAT and ACT). For the use of the ASVAB as a graduation pathway option the Board noted that the language in statute is “meet standard”. The Board interpreted this language to mean the lowest score in the AFQT (Armed Forces Qualification Test, a portion of the ASVAB) necessary for enlistment in a branch of the military. Since the military may change scores at any time, the Board committed to identifying the score needed and posting it by the beginning of every school year, as well as checking the score and updating it if needed in the spring. Students may meet the score posted at the time they take the test, or any score posted until they turn 21.
DATA COLLECTION AND REPORTING REQUIREMENTS RELATED TO THE GRADUATION PATHWAY OPTIONS E2SHB 1599 assigned both OSPI and SBE roles in collecting and reporting about graduation pathways. Table 2 summarizes the data collection and reporting requirements of each of the agencies.
3 | JANUARY 2020
87

Additional graduation pathways Modifications to existing pathways
survey a sample of school districts unable to provide all the graduation pathways to identify the barriers to implementation
Table 2: Data collection and reporting related to pathways SBE OSPI
Data Collection
• SBE will survey interested parties regarding: o o • Using the data collected by OSPI, the SBE will
• Collect data from each school district on:
o Graduation pathways available to students
o The number of students using each pathway for graduation purposes
• To the extent possible thedata should bedisaggregated by race, ethnicity, gender and receipt of free or reduced-price lunch
Reporting • A summary of the information from the initialsurvey must be reported to the educationcommittees of the Legislature by August 1, 2020
• Using the information from both surveys theSBE will report to the education committees of the Legislature by December 10, 2022 on:
o A review of the existing graduation pathways o Recommendations on whether changes to
the existing pathways should be made and what those changes should be
o Barriers school districts have to offering all of the graduation pathways and recommendations to eliminate or reducethose barriers for school districts.
o Whether all students have equitable access to all the graduation pathways, and if not, recommendations for reducing the barriers to student access
o Whether there should be additional graduation pathways, and if so, recommendations for additional pathways
• Information from the datacollection will be reported annually to the educationcommittees of theLegislature beginning January 10, 2021
GRADUATION PATHWAY AVAILABILITY
Initial information about pathway availability has been obtained by SBE through the Basic Education Compliance process. These data result from a survey of districts as part of the certification that districts are offering a program of Basic Education (RCW 28A.150.220). Since it
4 | JANUARY 2020
88
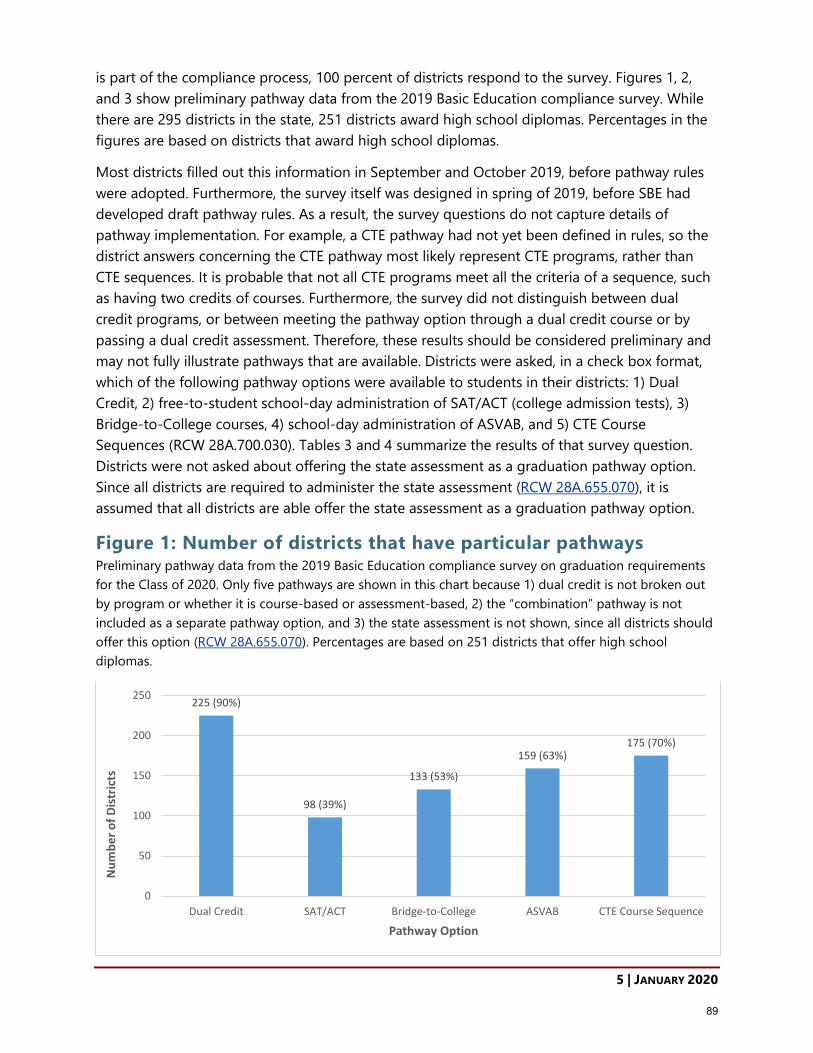
250 225 (90%)
Num
ber o
f Dis
tric
ts
200
150
159 (63%) 175 (70%)
100
50
0 Dual Credit SAT/ACT Bridge-to-College
Pathway Option ASVAB CTE Course Sequence
98 (39%)
133 (53%)
is part of the compliance process, 100 percent of districts respond to the survey. Figures 1, 2, and 3 show preliminary pathway data from the 2019 Basic Education compliance survey. While there are 295 districts in the state, 251 districts award high school diplomas. Percentages in the figures are based on districts that award high school diplomas.
Most districts filled out this information in September and October 2019, before pathway rules were adopted. Furthermore, the survey itself was designed in spring of 2019, before SBE had developed draft pathway rules. As a result, the survey questions do not capture details of pathway implementation. For example, a CTE pathway had not yet been defined in rules, so the district answers concerning the CTE pathway most likely represent CTE programs, rather than CTE sequences. It is probable that not all CTE programs meet all the criteria of a sequence, such as having two credits of courses. Furthermore, the survey did not distinguish between dual credit programs, or between meeting the pathway option through a dual credit course or by passing a dual credit assessment. Therefore, these results should be considered preliminary and may not fully illustrate pathways that are available. Districts were asked, in a check box format, which of the following pathway options were available to students in their districts: 1) Dual Credit, 2) free-to-student school-day administration of SAT/ACT (college admission tests), 3) Bridge-to-College courses, 4) school-day administration of ASVAB, and 5) CTE Course Sequences (RCW 28A.700.030). Tables 3 and 4 summarize the results of that survey question. Districts were not asked about offering the state assessment as a graduation pathway option. Since all districts are required to administer the state assessment (RCW 28A.655.070), it is assumed that all districts are able offer the state assessment as a graduation pathway option.
Figure 1: Number of districts that have particular pathways Preliminary pathway data from the 2019 Basic Education compliance survey on graduation requirements for the Class of 2020. Only five pathways are shown in this chart because 1) dual credit is not broken out by program or whether it is course-based or assessment-based, 2) the “combination” pathway is not included as a separate pathway option, and 3) the state assessment is not shown, since all districts should offer this option (RCW 28A.655.070). Percentages are based on 251 districts that offer high school diplomas.
89
5 | JANUARY 2020

90
80
70
60
50
40 30 (12%)
30
20
6 (2%) 10
0
Num
ber o
f Dis
tric
ts
80 (32%) 74 (29%)
43 (17%)
18 (7%)
Five Four Two Six One (SBA) Three
Number of pathway options available at the district
Figure 2: Number of districts and number of pathway options available Preliminary pathway data from the 2019 Basic Education compliance survey on graduation requirements for the Class of 2020. Only six pathways are shown with this data because 1) dual credit is not broken out by program or whether it is course-based or assessment-based and 2) the “combination” pathway is not included as a separate pathway option. The state assessment is included as a pathway option. Percentages are based on 251 districts that offer high school diplomas.
These results suggest that that:
• The most commonly available pathway options (after the state assessment) are dualcredit pathway options.
• A few districts (six) offer only the state assessment as a pathway option.• About a quarter of districts offer three or fewer pathway options.• About 12% of districts offer all of the pathway options.• Most districts (61%) offer four or five pathway options.• The least common pathway options are SAT/ACT (administered at no charge to students
during the school day) and Bridge to College courses.
Figure 3 illustrates the number of pathways available (three or fewer or four or more) relative to the enrollment of the district.
Figure 3: Number of pathways offered and district enrollment Preliminary pathway data from the 2019 Basic Education compliance survey on graduation requirements for the Class of 2020. Only six pathways were considered in this representation because 1) dual credit is not broken out by program or whether it is course-based or assessment-based and 2) the “combination” pathway is not included as a separate pathway option. The state assessment is included as a pathway option. Percentages are based on 251 districts that offer high school diplomas.
6 | JANUARY 2020
90

Perc
enta
ge
100% 90% 80% 70% 26 7342723 1360% 12 241850% 40% 30% 20% 10%
0%
8 41617
114 33
1 More than 10,000-19,999 5,000-9,999 3,000-4,999 2,000-2,999 1,000-1,999 500-999 100-499 Fewer than
20,000 100 Enrollment
Three or Fewer Four or More
FEEDBACK RECEIVED TO DATE
The SBE has received feedback regarding what additional graduation pathways should be added to the existing pathway options as well as whether any modifications should be made to any of the existing pathways. So far, this feedback has been received through:
• Public input received during SBE rulemaking on Chapter 180-51 WAC,• SBE community forums,• Discussion with stakeholders in a variety of setting including:
o A breakout session at the Washington State School Directors’ Association(WSSDA) annual conference.
o A session at the Washington Student Achievement Council’s Pave the WayConference.
o A joint informational webinar with the Office of the Superintendent of PublicInstruction.
o Various other stakeholder meetings during and following the rulemaking process.
PUBLIC INPUT RECEIVED DURING SBE RULEMAKING A description of how SBE solicited public comment and a summary of issues raised from comments and input during the rulemaking process is available on the SBE rulemaking web page.
The most numerous comments received on the rules for graduation pathway options were about the CTE course sequence pathway. A common theme was the importance of flexibility and student-directed pathways, and permitting a sequence to include more than one CTE program area. Conversely, a common concern expressed was that to best prepare students for postsecondary careers, the sequence should be in the same program area.
7 | JANUARY 2020
91

The pathway that drew the next most numerous comments was the ASVAB pathway. Many comments supported the Board’s rules that use the lowest score needed to serve in a branch of the military as the basis for meeting standard for the pathway. Some stakeholders were concerned that this score was too low and is not a reasonable standard for preparing students for a meaningful postsecondary career, and that this would have a disproportionally negative impact on students of color.
Many members of the public who commented on rules were not familiar with the limited authority of SBE in writing rules. Some of the concerns, comments and suggestions were not within the authority of the Board for rulemaking, but may inform the Board’s work in evaluating graduation pathway options and in developing recommendations to the Legislature. Such comments included:
• Remove the testing requirement;• Increase availability and/or variety of pathway options;• Add multiple types of diplomas rather than having one type of diploma;• Generally, HB 1599 pathways shouldn’t be communicated as a “delink;”• Bringing back the Collections of Evidence as a pathway;• Fund more counselors to implement High School and Beyond Plan and graduation
pathways;• Use the SAT assessment statewide instead of the Smarter Balanced Assessment;• Allow students to meet pathway requirement from work, sports, or volunteering;• Require life skills for each pathway option;• Expand running start to more grade levels;• Various concerns about the relationship of graduation requirements and creating
opportunity or outcome gaps for certain groups of students such as athletes, gender,race/ethnicity, et cetera;
• Focus on student-driven decision-making and flexibility for students (was actionable insome ways detailed above in the summary of specific policy issues but was described ingeneral non-actionable terms frequently);
• Timeline for International Baccalaureate assessments are a problem as a graduationpathway; and,
• Offer Smarter Balanced Assessment fall retakes, it will be the primary pathway.
COMMUNITY FORUMS The State Board of Education held two community forums during 2019 to begin to solicit feedback on additional pathways and modifications to existing pathways. Thirty-three community members attended in Yakima in September, and twenty-four community members attended the forum in Bremerton in November. Participants at SBE community forums tend to be local school district teachers and district staff, as well as representatives from state and community organizations and associations. Participants discussed SBE proposed rules (adopted at the November 2019 meeting), also graduation requirements in general.
8 | JANUARY 2020
92

A common theme expressed at both forums was how graduation pathway options would interact with credit graduation requirements (subject area course requirements). A waiver to delay implementing the 24-credit graduation requirement for two years, from the Class of 2019 to the Class of 2021, was available to districts. About half of districts received this waiver, so many districts are implementing new credit graduation requirements at the same time that they are implementing the graduation pathway requirements.
Notes taken by Strobel Consulting staff from one of the discussion tables at the community forum held on November 5, 2019, in Bremerton is included as Appendix A in this report.
CONFERENCE SESSIONS AND OTHER VENUES SBE has received comments, questions and concern from educators and other stakeholder through several conferences and other events. For example, SBE members and staff conducted a breakout session at the Washington School Directors’ Association (WSSDA) annual conference on November 22, 2019. Approximately 90 educators from around the state attended the session. Approximately half were school directors, and most of the rest were district-level educators. SBE staff presented an overview of pathways, followed by questions and answers, with general discussion and comments. Guiding questions included:
• In your district, are there barriers to implementing the pathways? What are they?What might help reduce the barriers?
• Do you have concerns about the pathways and equity? If so, how could pathwaysbetter address the needs of a wider range of students?
• Do you have suggestions for modifications of the pathways? Do you havesuggestions for additional pathways?
Some of the concerns and suggestions that arose at the WSSDA conference were typical of feedback received:
• How will students with Individualized Education Programs who previously met theassessment requirement with an “off-grade-level” assessment graduate using apathway?
• Small districts will have challenges offering CTE pathways and Advanced Placementand International Baccalaureate pathways.
• Would it be possible to include non-CTE courses in a CTE sequence?• Need for a pathway that includes apprenticeship opportunities.• Districts need more access to post-graduation outcome data to evaluate what is
working.
• Concerns about meeting federal testing participation requirements when state ELAand Math assessment is no longer a graduation requirement.
Notes taken by Strobel Consulting staff from the session are included as Appendix B of this report.
9 | JANUARY 2020
93

NEXT STEPS
SBE has contracted with Strobel Consulting to provide survey research services and identify key findings and potential strategies that could inform SBE’s reports to the legislature regarding graduation pathways.
The research plan is designed to answer the following overarching research questions, based on E2SHB 1599 Section 202:
• What changes, if any, should be made to the existing eight pathways?• What are the perceived barriers to offering all of the graduation pathways at both the
school and district level?• How can districts eliminate or reduce barriers to offering all of the graduation pathways?• Do all students have equitable access to all of the graduation pathways and, if not, what
are potential strategies for reducing barriers to equitable access?• Should additional graduation pathways be included and if so, what pathways should be
added and what is the associated rationale for doing so?
Strobel Consulting’s work plan highlights are included as Appendix A in this report.
10 | JANUARY 2020
94

APPENDIX A – STROBEL CONSULTING WORK PLAN HIGHLIGHTS
Strobel Consulting’s work plan will address the following key evaluation questions:
1. What changes, if any, should be made to the existing eight pathways?2. What are the perceived barriers to offering all of the graduation pathways at both the
school and district level?3. How can districts eliminate or reduce barriers to offering all of the graduation pathways?4. Do all students have equitable access to all of the graduation pathways and, if not, what
are potential strategies for reducing barriers to equitable access?5. Should additional graduation pathways be included and if so, what pathways should be
added and what is the associated rationale for doing so?
To answer these questions, Strobel Consulting will collect data using multiple methods and instruments directly aligned with project objectives. These include:
Pre-focus group survey (yrs. 1 & 2) Focus group protocol (yrs. 1 & 2) Stakeholder survey (yr. 1) First school district follow-up survey (yr. 2) Second school district follow-up survey (yr. 3) Follow-up interview protocol (yrs. 1, 2 & 3)
Results from the pre-focus group survey in years 1 and 2 will inform the development of the stakeholder and school district surveys. Follow-up interviews and focus groups will capture additional insight and clarify survey results with first-hand accounts of the utility of various graduation pathways, enabling firm recommendations to be made based on the above evaluation questions.
This project will rely on both qualitative and quantitative research methods to address the aforementioned research questions. Qualitative data, such as those obtained across the various focus groups, interviews, and open-ended survey responses, will be analyzed using thematic coding techniques. Quantitative data resulting from close-ended survey questions (e.g., Likert-scale style items) will be summarized using descriptive statistics (including frequencies and percentages). Subgroup analyses will be useful to determine if there are significant differences between individuals with varying demographic characteristics (e.g., gender, race/ethnicity), and will be tested with inferential techniques such as independent means or chi-square testing. When necessary, statistical power analyses will be used to inform the sample size required to detect significant differences, particularly when administering the stakeholder survey.
In coordination with the State Board of Education, nine key stakeholder groups have been identified as essential for informing various aspects of the work:
1. School district personnel2. Parents3. Students4. Representatives from the state board for community and technical colleges
11 | JANUARY 2020
95
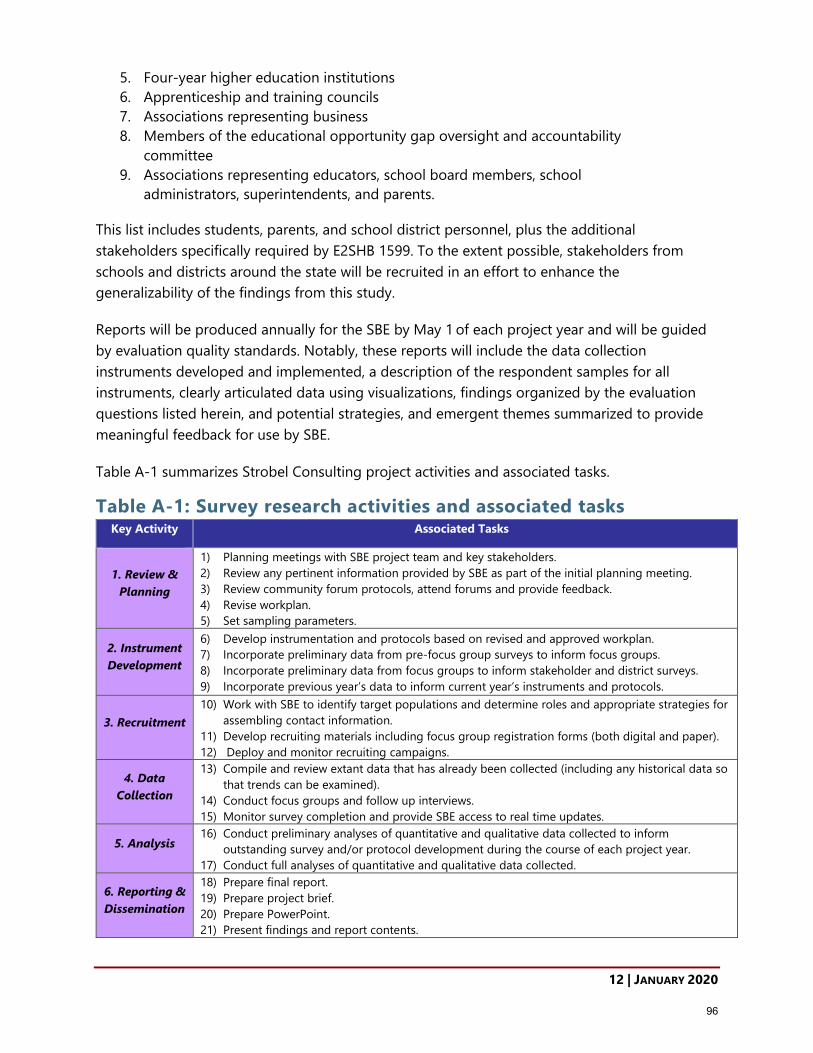
5. Four-year higher education institutions6. Apprenticeship and training councils7. Associations representing business8. Members of the educational opportunity gap oversight and accountability
committee9. Associations representing educators, school board members, school
administrators, superintendents, and parents.
This list includes students, parents, and school district personnel, plus the additional stakeholders specifically required by E2SHB 1599. To the extent possible, stakeholders from schools and districts around the state will be recruited in an effort to enhance the generalizability of the findings from this study.
Reports will be produced annually for the SBE by May 1 of each project year and will be guided by evaluation quality standards. Notably, these reports will include the data collection instruments developed and implemented, a description of the respondent samples for all instruments, clearly articulated data using visualizations, findings organized by the evaluation questions listed herein, and potential strategies, and emergent themes summarized to provide meaningful feedback for use by SBE.
Table A-1 summarizes Strobel Consulting project activities and associated tasks.
Table A-1: Survey research activities and associated tasks Key Activity Associated Tasks
1. Review &Planning
1) Planning meetings with SBE project team and key stakeholders.2) Review any pertinent information provided by SBE as part of the initial planning meeting.3) Review community forum protocols, attend forums and provide feedback.4) Revise workplan.5) Set sampling parameters.
2. InstrumentDevelopment
6) Develop instrumentation and protocols based on revised and approved workplan.7) Incorporate preliminary data from pre-focus group surveys to inform focus groups.8) Incorporate preliminary data from focus groups to inform stakeholder and district surveys.9) Incorporate previous year’s data to inform current year’s instruments and protocols.
3. Recruitment10) Work with SBE to identify target populations and determine roles and appropriate strategies for
assembling contact information.11) Develop recruiting materials including focus group registration forms (both digital and paper).12) Deploy and monitor recruiting campaigns.
4. DataCollection
13) Compile and review extant data that has already been collected (including any historical data sothat trends can be examined).
14) Conduct focus groups and follow up interviews.15) Monitor survey completion and provide SBE access to real time updates.
5. Analysis16) Conduct preliminary analyses of quantitative and qualitative data collected to inform
outstanding survey and/or protocol development during the course of each project year.17) Conduct full analyses of quantitative and qualitative data collected.18) Prepare final report.
6. Reporting & 19) Prepare project brief.Dissemination 20) Prepare PowerPoint.
21) Present findings and report contents.
12 | JANUARY 2020
96

APPENDIX B-NOTES FROM COMMUNITY FORUM
November 5, 2019
Approximately 40 people were in attendance at the community forum. In addition to SBE staff the group consisted of SBE board members, educators and other community members. SBE kicked off the forum by providing a brief overview of the high school graduation pathways and outlined the goals of the community forum. An SBE board member facilitated the remainder of the discussion for the evening. This included roundtable discussions (with at least one SBE board member and SBE staff at each table), followed by whole group sharing. The last thirty minutes of the forum were left open for general discussion of any issue attendees wished to explore. No notes were taken on the general discussion during the final thirty minutes of the forum.
The small group break out session was started with an exercise where everyone was asked to close their eyes and think of a student in great detail and to keep this student, their needs and factors affecting their life in mind as the discussion unfolded. Some of the examples at my table included students that were homeless, worked full time jobs, bounced from school to school, didn’t have support at home, knew the type of job they wanted, but were not interested in attending college and needed a hands on experience, and academically stressed students that were at their breaking point with school workload.
The following feedback includes the specific discussion that occurred at my table, as well as themes shared out in the group discussion.
Current pathwayso Bridge to College has such a challenging math piece that it doesn’t work as a
pathway, because if a student can pass the math required by Bridge to College it is unl ikely they need an alternative pathway, because they should be able to pass the state assessment.
Additional pathway suggestionso Passing the GEDo Portfolio or body of evidenceo Apprenticeship or work-study to address students who are already working full
time jobs and finding success in the job sectoro Pathways that focus on art or musico A “life skills” pathway the focuses more on applied skills (somewhat similar to the
apprenticeship or work-study suggestion) Other
o Bremerton is very diverse and might be a good location for a focus group.o What do we want a high school diploma to mean? That is, what do we want
students to have when they walk away from high school or what do we want themto be able to do? There wasn’t a solid answer to these questions, but it was a great
13 | JANUARY 2020
97

talking point that is certainly relevant to the types of pathways that could be considered.
o In present time, “school” must be so much more than a place to learn basicacademics or prepare for a career. For many students it’s the only place that is safe,a place they can get food, learn basic skills, or have access to services and adultsthat help them survive in general.
Equityo There are issues in terms of access to components of each the pathways (i.e. it’s
not that the pathways themselves are inequitable, it’s that parts of each pathwaymake them inequitable for different populations).
o There are tracking issues for minority populations in general and this means theyget lost in the system and don’t have access to opportunities, including thepathways.
o CTE equity depends on the size of the districto Does “equity” in terms of student access to the pathways mean that there’s at least
one pathway that is accessible to each student, or does it mean that all pathwaysare accessible to every student?
Access/Barrierso There is a general lack of industry access in small areas and this negatively impacts
access to the pathways.o Math is a gatekeeper or barrier to accessing many of the pathways either because
students lack math skills needed for some of the pathways, or they have not passedrequired math classes and therefore don’t have time in their schedule to includethe courses needed to complete a pathway.
o Pathways are more difficult for smaller districts to implement.o The 24 credits required to graduate is a barrier to the point where it dictates
whether or not students can even utilize the pathways (i.e. students are already sobehind credit wise when they hit 9th grade) or that they can graduate regardless.
Barriers to graduation in generalo Students are completing their course work, but not passing the test.
14 | JANUARY 2020
98

APPENDIX C– NOTES FROM WASHINGTON STATE SCHOOL DIRECTORS ASSOCIATION CONFERENCE BREAKOUT SESSION
“Pathways to Graduation: State Policy, District Experiences, and Recommendations for Change.”
November 22, 2019
The community forum was hosted as part of the Washington State School Directors Associations (WSSDA) conference during a breakout session titled, “Pathways to Graduation: State Policy, District Experiences, and Recommendations for Change”. Approximately 90 educators from around the state were in attendance. The SBE’s presentation provided an overview of the high school graduation pathways. There was also an emphasis placed on the equal importance of each pathway. During the presentation there were opportunities for attendees to ask pathway specific questions as each pathway was covered, with a full open Q&A session during the last 15 minutes of the session. Participants in the community forum shared the following feedback on current pathways, student equity, access and barriers, additional pathway suggestions, access to post graduation data and outcomes, and barriers to graduation in general, during the session:
Current pathways• Different standards for dual credit and the AP/IB exams don’t make sense and should
be addressed• The shifting “minimum” score, set by AFQT, needed to successfully complete the
ASVAB pathway is concern.• It was noted as an area of concern that there are no science requirements, or
acknowledgments of why there aren’t science requirements, for the graduationpathways.
• It was suggested that non-certified courses be considered for part of the CTE pathwaysrequirements.
• Pathways need to include more science and social studies related options and/orrequirements.
Student Equity• The need to address the Special Education demographic in terms of the pathways and
a desire for feedback on how this should be done.• Attendees voiced concern about helping underserved and marginalized populations
graduate in general, but also within the context of utilizing the pathway options.• Concern was expressed with state assessments and the level of scores required for off
grade level students. Specifically, how do the graduation pathway requirementsaddress off level students?
Access/Barriers• Size in general
o Access for districts of different sizes, specifically urban versus rural, is not equitable.
15 | JANUARY 2020
99

o Access to the types of advisory boards and industry needed to successfullyimplement some of the pathways is very limited in rural communities and thereforecreates a barrier to offering every pathway.
• Size & AP/IB pathwayo Many smaller, rural districts can’t offer AP/IB.
• Size & CTE pathwayo Small districts aren’t always able to get CTE certified teachers to teach CTE courses
and because this is a requirement of the CTE pathways it makes it challenging forsmall or rural districts to offer this.
o It was suggested that changes be made to the CTE pathways requirements so thatnoncertified CTE teachers can be used to teach pathways related CTE courses insmaller districts.
o Getting a certified CTE teacher to teach just one class (i.e. the class needed tosatisfy the CTE pathway requirement) is a barrier to offering this pathway.
o Smaller districts need more goal oriented and industry requirement focusedflexibility around the CTE pathway.
o Even within larger districts smaller, choice high schools exist and are much like therural schools in terms of their access to all pathways.
o Large districts with smaller choice high schools want to make sure they are notoverlooked when it comes to addressing barriers to offering all pathways, sincetheir smaller choice high schools experience similar challenges as those faced bysmall, rural districts.
• Dual Credito Dual credit pathways are difficult to offer, because community colleges don’t
always cooperate with secondary schools.o If it were possible to make dual enrollment opportunities more cost effective for
post-secondary institutions it would increase the likelihood of schools being ableto offer this pathway.
o Because the colleges aren’t incentivized to offer dual credit enrollment it creates abarrier to implementing this pathway.
o It was suggested that college courses be included in the classes offered at the highschool.
o It was noted that there are economic dis-incentives for community colleges to offerdual enrollment.
o It was suggested there had been success with some districts offering grades 9-14community college courses on their high school campus and this might be a betterway to approach the dual enrollment pathway.
Additional pathway suggestions• There is a need for a pathway offering apprenticeship opportunities.• It was suggested that science requirements should be added.• Soft skills pathways and/or a social/emotional mental health related pathway should
be considered.• It was requested that customized pathways be an option so schools have more
flexibility in creating pathways that work for their students.
16 | JANUARY 2020
100
• It was suggested that mastery based transcripts be used as a way to allow moreflexibility within the graduation pathways.
• One attendee shared that their graduation rates went up with the AVID program andsuggested this might be something to consider for an additional pathway.
Access to post graduation data & outcomes• There’s a need to define what desired graduation outcomes are in terms of post
graduation success for students and use real data to inform this.• There’s an urgent need to create pathways that take into account and look at
outcomes.• More information is needed on student outcomes and tracking post graduation in
order to better inform how successful current pathway options are and to help addressadditional pathways that might be needed.
• Attendees wanted to know if post graduation data was currently available and if not,would there be better access to post graduation data for students graduating underthe new pathways?
Barriers to graduation in general• Is 24 credits the right number to require for graduation?• The 24-credit graduation requirement continues to be sited as a general barrier to
students utilizing the pathways and to graduating in general.• General concerns were expressed regarding graduation rates.• It was suggested that core credit be given for “HS and Beyond” type courses to help
students meet the 24-credit graduation requirements so that they had the option totake the elective courses needed to satisfy some of the graduation pathways options.
Other• It was suggested that diplomas would become a more valuable asset if they included
badges identifying areas of knowledge or success.• The whole child needs to be better addressed in the pathways and what are ways this
can happen?
17 | JANUARY 2020
101

Graduation Pathways Research Project
Washington SBE Board Meeting Presentation 1/15/20Stakeholder Survey #1 Status Update
1

INTENDED PRESENTATION OUTCOMES
1. Board members gain a broad overview of preliminary survey results andunderstand how they are being used to inform the development of theStakeholder Survey.
2. Stakeholder Survey constructs, outcomes and sampling are easilyconceptualized and understood.
3. Board members have an opportunity to ask questions and share input.
2

PRELIMINARY SURVEY RESULTS
3
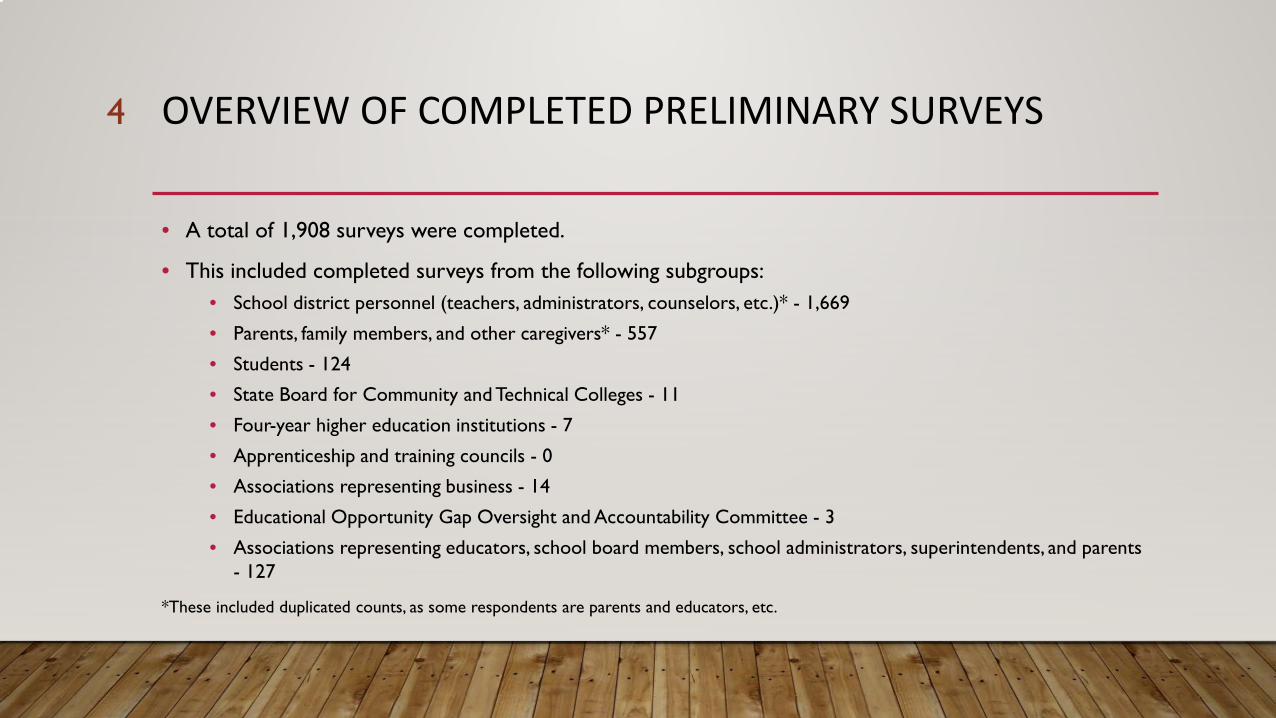
OVERVIEW OF COMPLETED PRELIMINARY SURVEYS
• A total of 1,908 surveys were completed.
• This included completed surveys from the following subgroups:• School district personnel (teachers, administrators, counselors, etc.)* - 1,669
• Parents, family members, and other caregivers* - 557
• Students - 124
• State Board for Community and Technical Colleges - 11
• Four-year higher education institutions - 7
• Apprenticeship and training councils - 0
• Associations representing business - 14
• Educational Opportunity Gap Oversight and Accountability Committee - 3
• Associations representing educators, school board members, school administrators, superintendents, and parents- 127
*These included duplicated counts, as some respondents are parents and educators, etc.
4

SURVEY RESPONDENT DEMOGRAPHICS
• A goal of data collection for this project includes making sure the diversity of Washingtonis represented in our sample. We are please to share that our demographic samplingtargets were met or exceeded for all areas. This includes:
• 1,362 Female, 409 Male and 137 Other (includes Non-binary and Declined to Answer)respondents.
• Approximately 1% of respondents identified themselves as Pacific Islander*, 2% as AfricanAmerican, 2% as Native American*, 3% as Other, 4% as Asian*, 6% as Hispanic, 15% Declinedto Answer, and 73% as White.
5
*These are approximate values, as respondents often selected more than one race/ethnicity category and therefore some counts are duplicated.

RESULTS: FAMILIARITY WITH THE GRADUATION PATHWAYS
• The majority of non-student respondents (81%) were at least somewhat familiar with thenew graduation pathways, versus only half of student respondents (50%).
Extremely Familiar
3%Familiar
12%
Not Familiar At All50%
Somewhat Familiar
28%
Very Familiar7%
Extremely Familiar
9%
Familiar23%
Not Familiar At All
19%
Somewhat Familiar
30%
Very Familiar19%
NON-Student RespondentsStudent Respondents
6

RESULTS: AVAILABILITY OF ALL GRADUATION PATHWAYS NON-STUDENT RESPONDENTS
• 34% of non-student respondents who were at least somewhat familiar with the graduationpathways reported that all graduation pathways were offered in their school/district.
• 24% of students who were at least somewhat familiar with the graduation pathways reportedtheir schools offered all the graduation pathways.
• 37% of non-student respondents reported they did not know if all graduation pathways wereoffered in their school or district, versus 48% of students .
• 48% of student respondents reported they did not know if all graduation pathways wereoffered at their school.
7

RESULTS: AVAILABILITY OF ALL GRADUATION PATHWAYS NON-STUDENT RESPONDENTS
On the preliminary survey respondents were asked if all pathways were offered at the district and school level. The following table shows the percentage of districts and schools offering each pathway, as reported by non-student respondents who indicated their school/district did NOT offer all the pathways.
Pathway District SchoolState Assessment 92.1% 81.5%Dual Credit 74.9% 59.2%AP/IB/Cambridge 62.1% 44.0%SAT/ACT 72.2% 62.5%
Transition Course 42.1% 29.4%Combination 49.0% 42.4%ASVAB 49.8% 40.9%CTE 41.3% 26.0%
8

RESULTS: IMPORTANCE OF GRADUATION PATHWAY RELATED TOPICS (STUDENTS)
Nearly half (45%) of the the STUDENTS surveyed indicated they did not feel adequately prepared to answer the question, “Which of the following graduation pathway related topics are most important to you?”
The table to the right shows the percentage of students that indicated these topics were most important to them, with “Equitable Student Access to all of the pathways” rating the highest.
9

• More than half (62%) of the the NON-STUDENTS surveyedindicated “Equitable Student Access to all of the pathways” wasan important graduation pathway topic.
• Additionally, the majority (90%) of non-student respondentsanswering the question, “Which of the following graduationpathway related topics are most important to you?” feltadequately prepared to answer (in contrast to studentresponses).
• For students and non-students alike equitable student access toall the pathways was the topic most likely to be identified asimportant.
10RESULTS: IMPORTANCE OF GRADUATION PATHWAY RELATED TOPICS (NON-STUDENTS)

STAKEHOLDER SURVEY #1
11

SURVEY CONSTRUCTS
Constructs are the broad concepts or topics for research. They can be defined conceptually, in that they have meaning in theoretical terms. They can also be abstract and do not necessarily need to be directly observable. Each survey question is designed to measure a specific construct.
12

STAKEHOLDER SURVEY #1 CONSTRUCTS
1. Should change be made to the existing eight pathways and if so, what changes should bemade?
2. What are the perceived barriers to offering all of the graduation pathways at both theschool and district level?
3. How can districts eliminate or reduce barriers to offering all of the graduation pathways?
4. Do all students have equitable access to all of the graduation pathways and if not, what arepotential strategies for reducing the perceived barriers.
5. Should additional graduation pathways be included and if so, what pathways should beadded and what is the associated rationale for doing so?
13

THE STAKEHOLDERS
• We will be collecting data from the following stakeholder groups:• School district personnel (teachers, administrators, counselors, etc.)
• Parents, family members, and other caregivers
• Students
• State Board for Community and Technical Colleges
• Four-year higher education institutions
• Apprenticeship and training councils
• Associations representing business
• Educational Opportunity Gap Oversight and Accountability Committee
• Associations representing educators, school board members, school administrators,superintendents, and parents
14

SAMPLING PARAMETERS
• Total Target Sample Size = 2,500
• Ensures a confidence level of 95%
• Margin of error +/- 2%
• Based on census data for Washington
• Demographic and other subpopulations sampling targets (such as highschool students, educators, ethnicities, parents, etc.) will be based onavailable statistics for WA and calculated as a percentage of the total sample
15

SURVEY DESIGN
At the start of the survey respondents will be asked to identify which stakeholder group best describes them.
o Student
o Parent or Caregiver
o School or District Personnel
o Combination Parent/Caregiver and School/District Personnel
o Other
16

INSTRUMENT DEVELOPMENT
Each stakeholder will answer the exact same questions, though the associated narrative will be adjusted to address each stakeholder group.
• For example: Student questions will say, “At your school…” while the same Parent/Caregiver questions willsay, “At your student’s school…”
• All non-student respondents will be asked an additional question regarding their association with:
• State Board for Community and Technical Colleges
• Four-year higher education institutions
• Apprenticeship and training councils
• Associations representing business, educators, school board members, school administrators, superintendents, andparents
• Educational Opportunity Gap Oversight and Accountability Committee
17

SURVEY QUESTIONS
• The majority of survey questions will be closed-ended, requiring respondents toselect a numeric, categorical, or other preconstructed response to ensurequantitative data is collected and that results can be presented in specific, definitiveterms.
• Additionally, there will be a limited number of open-ended survey questions allowingus to collect qualitative data from respondents where they can share their thoughts,ideas, suggestions, or other unique feedback related to the graduation pathways.
18
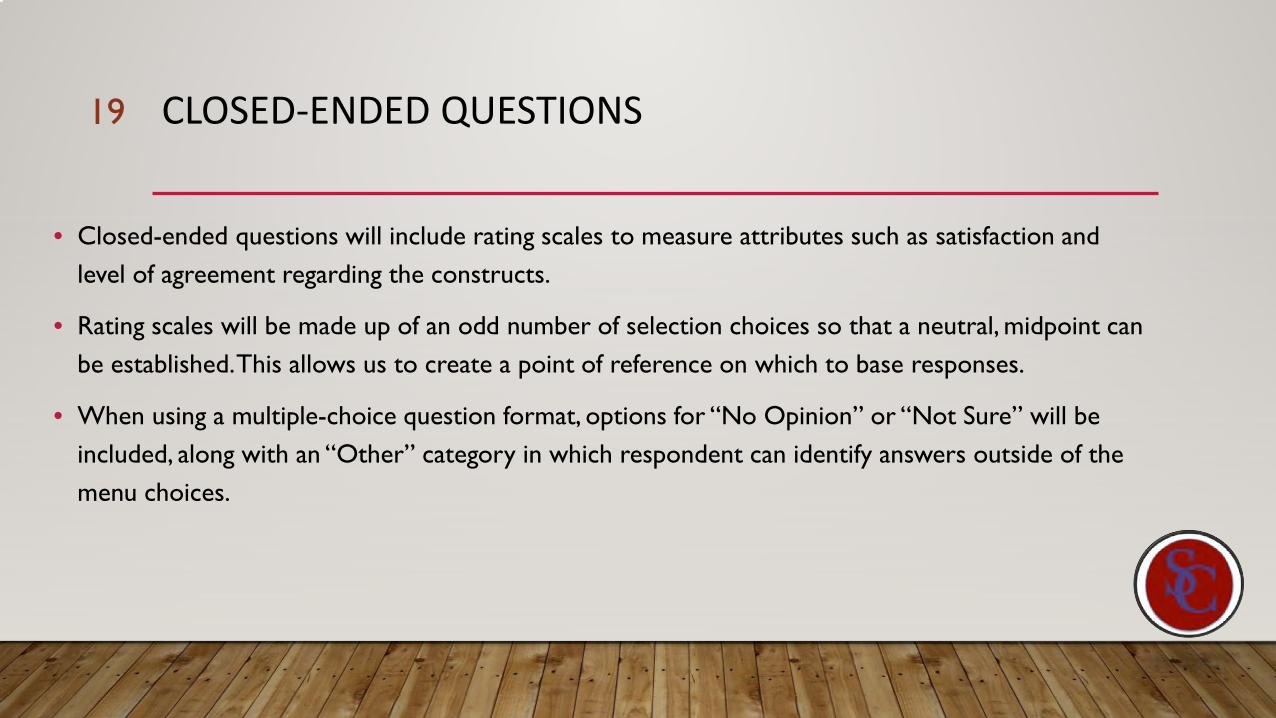
CLOSED-ENDED QUESTIONS
• Closed-ended questions will include rating scales to measure attributes such as satisfaction andlevel of agreement regarding the constructs.
• Rating scales will be made up of an odd number of selection choices so that a neutral, midpoint canbe established. This allows us to create a point of reference on which to base responses.
• When using a multiple-choice question format, options for “No Opinion” or “Not Sure” will beincluded, along with an “Other” category in which respondent can identify answers outside of themenu choices.
19

DEMOGRAPHIC INFORMATION
• In order to make sure we’re receiving responses from a diverse sampling of respondentsthat reflect the unique population of Washington, demographic questions will be asked.
• These will be the same as the demographic questions that were asked on the preliminarysurvey.
• We will include all demographic questions at the end of the survey to ensure we collectthe feedback related to the graduation pathways first, as this is our primary datarequirement.
• Demographic questions are never required and and “decline to answer” is always anoption.
20

DATA COLLECTION
• The survey window is intended to run from February 3 to March 2, 2020
• Surveys will be provided in an online and paper (as requested) version
• Efforts will be made to make the recruiting process as inclusive as possible and to adhereto sampling parameters representing the unique and diverse demographics ofWashington
• The survey and associated directions will be made available in both Spanish and English(this includes digital delivery methods) and other language upon request.
• Next steps include finalizing the survey and preparing for focus group data collection.
21

BOARD ENGAGEMENT OPPORTUNITIES
QUESTIONS?
FEEDBACK?
22

Thank you for allowing us to partner with you on this exciting project!
Alisha Strobel, [email protected]
23

Proposed Phase 2 School Recognition PREPARED FOR THE JANUARY 2020 BOARD MEETING
Information and Action
After thorough and thoughtful discussions on the approach to Phase 2 school recognition, the School Recognition work group agreed to further explore the use of additional metrics and other identification criteria as part of the Phase 3 work. The work group reached consensus on the Phase 2 methodology that includes a “revised Growth Route” which provides schools with the opportunity to be identified for a high performing student group. If the approach had been applied to the Phase 1 methodology, the number of identified schools would have increased from 216 to 354.
Materials included in packet: • Proposed Phase 2 School Recognition PowerPoint• Proposed Phase 2 School Recognition Memo• Phase 2 School Recognition Communications Plan• “Why” One-pager Draft
Synopsis: The report will include a review of the work completed by the School Recognition work group, a collaboration by the State Board of Education (SBE), the Educational Opportunity Gap Oversight and Accountability Committee (EOGOAC), and the Office of the Superintendent of Public Instruction (OSPI). The materials include the following:
• A memo outlining the proposed Phase 2 methodology and theresults of the identification methodology that would have occurred
114

if the methodology were applied to the winter 2019 (last year’s) Washington School Improvement Framework, and
• A draft of the communications plan and one-pager developed bythe SBE and OSPI communications staff.
Business Items: • After discussion, the Board is expected to approve the Phase 2 school
recognition methodology and direct staff to advance the work of theSchool Recognition work group.
115
School Recognition
– Phase 2Work of the School Recognition
Workgroup
(SBE – EOGOAC – OSPI)
January 15, 2020

A New Manner in which to be Recognized through the Growth Route
5
Phase 2Revised Growth
Route
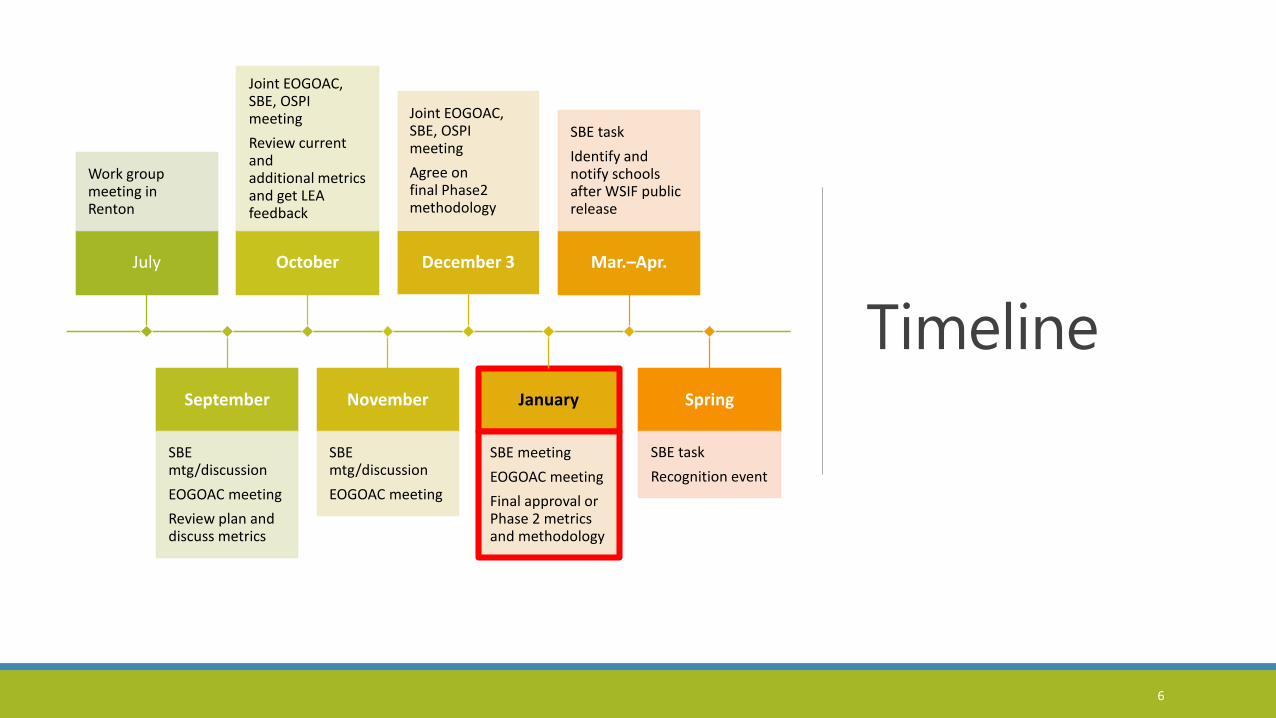
Timeline
6
July
Work group meeting in Renton
September
SBE mtg/discussionEOGOAC meetingReview plan and discuss metrics
October
Joint EOGOAC, SBE, OSPI meetingReview current and additional metrics and get LEA feedback
November
SBE mtg/discussionEOGOAC meeting
December 3
Joint EOGOAC, SBE, OSPI meetingAgree on final Phase2 methodology
January
SBE meetingEOGOAC meetingFinal approval or Phase 2 metrics and methodology
Mar.–Apr.
SBE taskIdentify and notify schools after WSIF public release
Spring
SBE taskRecognition event

Phase 1 Combined Quantitative Model:
Schools Can Demonstrate Being Exemplary in Several Ways via Multiple Measures
7

Revision to Growth Route:
Trial Requested by the School Recognition Workgroup
8
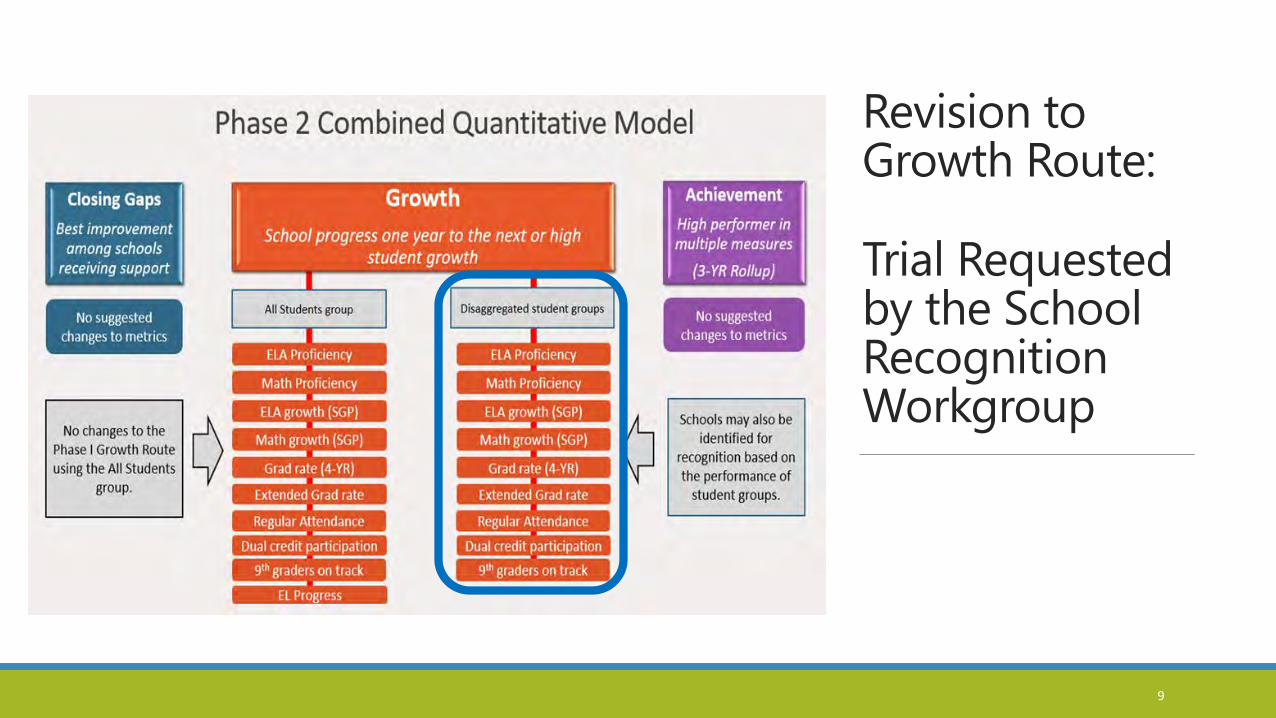
Revision to Growth Route:
Trial Requested by the School Recognition Workgroup
9
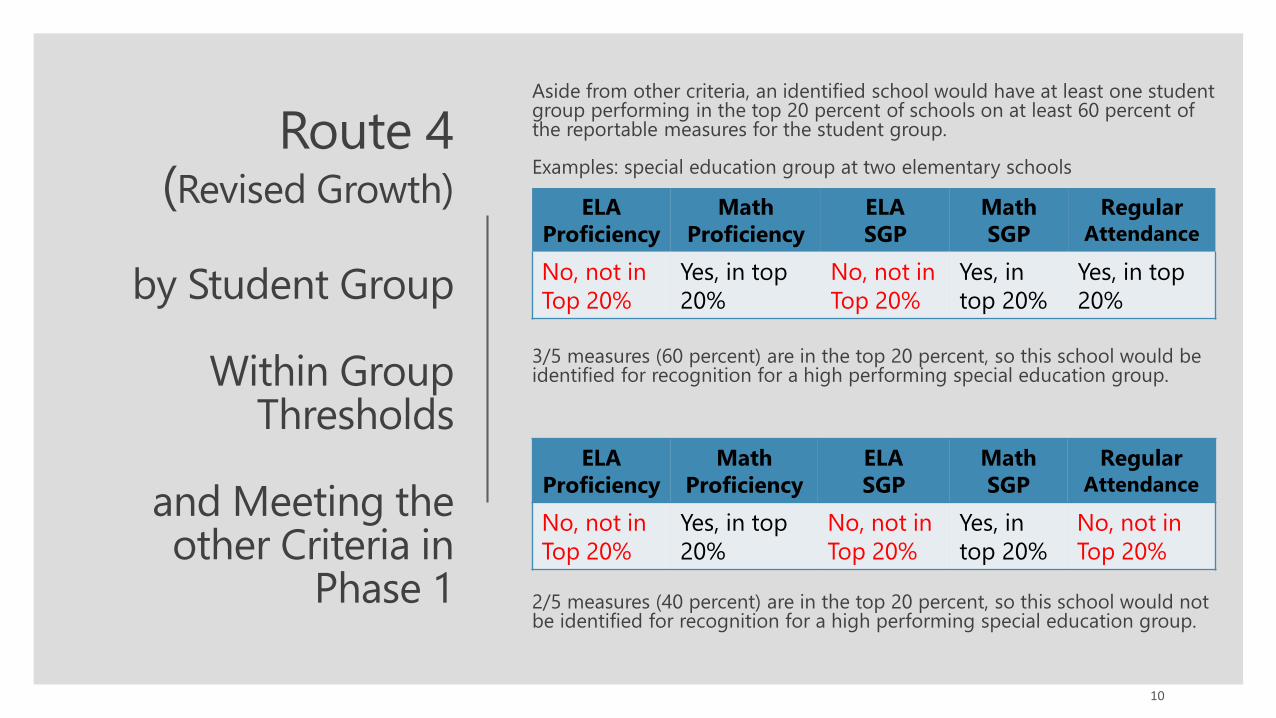
Route 4(Revised Growth)
by Student Group
Within Group Thresholds
and Meeting the other Criteria in
Phase 1
Aside from other criteria, an identified school would have at least one student group performing in the top 20 percent of schools on at least 60 percent of the reportable measures for the student group.
Examples: special education group at two elementary schools
3/5 measures (60 percent) are in the top 20 percent, so this school would be identified for recognition for a high performing special education group.
2/5 measures (40 percent) are in the top 20 percent, so this school would not be identified for recognition for a high performing special education group.
10
ELA Proficiency
Math Proficiency
ELA SGP
Math SGP
Regular Attendance
No, not in Top 20%
Yes, in top 20%
No, not in Top 20%
Yes, in top 20%
Yes, in top 20%
ELA Proficiency
Math Proficiency
ELA SGP
Math SGP
Regular Attendance
No, not in Top 20%
Yes, in top 20%
No, not in Top 20%
Yes, in top 20%
No, not in Top 20%

Identified Schools:
Does the demography of
schools differ by
identification status?
The demography of the 226 schools identified is very similar to the demography of schools not identified and to the Washington public schools.
11
Nat
ive
Amer
ican
Asia
n
Blac
k
His
pani
c
Paci
fic Is
land
er
Whi
te
Two
or M
ore
Engl
ish
Lear
ner
Low
Inco
me
Spec
ial E
duca
tion
Not Identified
2.5% 5.3% 4.1% 22.0% 0.9% 56.6% 7.6% 10.3% 45.1% 16.1%
Identified 1.0% 8.5% 4.3% 20.8% 1.0% 55.8% 8.7% 11.9% 42.8% 14.2%
Washington 2.3% 5.5% 4.1% 21.5% 0.9% 55.6% 7.6% 10.2% 44.0% 15.6%
Table 1 in Board Packet

Identified Schools:
How many schools
identified for how many
groups?
Route 4 identified 226 schools with at least one high performing student group.
88/226 schools were identified through at least one of the Phase 1 recognition routes
12
0 G
roup
s
1 G
roup
2 G
roup
s
3 G
roup
s
4 G
roup
s
5 G
roup
s
6 G
roup
s
Tota
l
ES 969 82 28 22 9 3 2 146
MS 334 22 10 3 1 36
Comb 98 4 4 8
HS 459 14 8 3 1 1 27
Comb HS 272 6 3 9
Total 2132 128 53 28 10 5 2 226
Table 2 in Board Packet

Identified Schools:
Which student groups are
identified at which schools?
Route 4 identified 226 schools with at least one high performing student group.Hispanic students at 59 schools would be identified as highperforming.
13
Nat
ive
Amer
ican
Asia
n
Blac
k
His
pani
c
Paci
fic Is
land
er
Whi
te
Two
or
Mor
e Ra
ces
Engl
ish
Lear
ner
Low
Inco
me
Spec
ial E
duca
tion
ES 2 11 10 42 3 44 29 24 49 53
MS 3 8 1 7 12 8 7 10
Comb 1 4 4 3
HS 1 2 2 6 1 4 4 7 6 15
Comb HS 2 2 1 3 4
Total 3 13 15 59 5 61 45 40 69 85
Table 3 in Board Packet

Identified Schools:
What is the distribution of
identified schools by ESD?
95/226 schools (42 percent) of the identified schools were in EDS 121, which is home to 33 percent of Washington public K-12 schools.
14
Nat
ive
Amer
ican
Asia
n
Blac
k
His
pani
c
Paci
fic
Isla
nder
Whi
te
Two
or
Mor
eEn
glis
h Le
arne
rLo
w
Inco
me
Spec
ial
Educ
atio
nTo
tal
Scho
ols
Perc
ent*
ESD 101 Spokane 1 9 2 5 4 1 9 8 27 12/11
ESD 105 Yakima 3 2 5 3 2 4 11 5/6ESD 112 Vancouver 1 3 6 4 7 4 13 6/9
ESD 113 Tumwater 1 1 5 3 2 6 3 5 17 8/8
ESD 114 Bremerton 2 1 1 2 3 5 2/5ESD 121 Renton 8 9 21 2 22 20 18 24 38 95 42/33ESD 123 Pasco 3 1 4 2 4 4 5 14 6/6
ESD 171 Wenatchee 1 3 3 2 4 8 4/6ESD 189 Anacortes 2 2 3 14 1 15 7 5 16 14 36 16/15
*Note: Percent is shown as the percent of identified schools situatedin the ESD/percent of all Washington public schools in the ESD.
Table 4 in Board Packet

Identified Schools:
How many schools would
be identified by Support Tier?
Route 4 identified 226 schools with at least one high performing student group.25/226 schools (11 percent) were identified for Tier 2 or Tier 3supports in the winter 2018 Washington School ImprovementFramework.
15
ES MS Comb HS Co
HmS
b
Total
Tier 3 Comprehensive 1 5 6
Tier 2 Targeted >2 or Low EL Progress
14 4 1 19
Tier 1 Targeted 1-2 44 15 1 60
Foundational 87 17 8 20 9 141
Total 146 36 8 27 9 226
Table 5 in Board Packet

Identified Schools:
What is the distribution of
identified schools across
the state?
The 226 identified schools are distributed across Washington.
16
Figure 3 in Board Packet

Phase 2 Revised Model
17

How would the possible revisions impact the number of identified schools?
18
Phase 1 Closing
Gaps
Phase 1 Growth All Students
Phase 2Growth StudentGroups
Phase 1 Achievement
Total (Unique Schools)
Phase 1 108 48 69 216
Phase 2 - Final 108 48 226 69 354
Table 6 in Board Packet

Phase 2 Identified
Schools:
Does the demography of
schools differ by identification
status?
The demography of the 354 schools identified is very similar to the demography of schools not identified and to the Washington public schools.
19
Nat
ive
Amer
ican
Asia
n
Blac
k
His
pani
c
Paci
fic Is
land
er
Whi
te
Two
or M
ore
Engl
ish
Lear
ner
Low
Inco
me
Spec
ial E
duca
tion
Not Identified
2.6% 5.1% 4.2% 22.0% 0.9% 56.7% 7.7% 10.1% 45.5% 16.3%
Identified 1.3% 8.5% 3.9% 21.6% 0.9% 55.7% 8.1% 12.3% 41.7% 13.7%
Washington 2.3% 5.5% 4.1% 21.5% 0.9% 55.6% 7.6% 10.2% 44.0% 15.6%
Table 7 in Board Packet

Phase 2 Identified
Schools:
How many schools would
be identified by Support Tier?
Phase 2 would identify 354 unique schools through at least one of the recognition routes.59/354 schools (17 percent) were identified for Tier 2 or Tier 3supports in the winter 2018 Washington School ImprovementFramework.
20
ES MS Comb HSComb
HSTotal
Tier 3 Comprehensive 11 1 11 6 29
Tier 2 Targeted >2 or Low EL Progress
24 4 1 29
Tier 1 Targeted 1-2 73 27 2 1 103
Foundational 119 21 8 28 17 193
Total 227 53 8 42 24 354
Table 8 in Board Packet

Phase 2Identified
Schools:
What is the distribution of
identified schools by ESD?
143/354 schools (42 percent) of the identified schools were in EDS 121, which is home to 33 percent of Washington public K-12 schools.
21
Table 9 in Board Packet
ESD
101
Spok
ane
ESD
105
Yaki
ma
ESD
112
Vanc
ouve
rES
D 11
3 Tu
mw
ater
ESD
114
Brem
erto
nES
D 12
1Re
nton
ESD
123
Pasc
oES
D 17
1 W
enat
che
eESD
189
Anac
orte
s
Number of Schools Recognized
45 24 23 24 6 143 23 12 54
Percent of Recognized Schools by ESD
12.7 6.8 6.5 6.5 1.7 40.4 6.5 3.4 15.3
Percent of Total Schools by ESD
11.7 5.7 8.8 8.1 4.8 32.6 6.1 5.6 14.9

Phase 2Identified
Schools:
What is the distribution of
identified schools across
the state?
The 354 schools that would be identified are distributed across Washington.
22
Figure 4 in Board Packet

Phase 2 – Questions and Discussion
23

Phase 2General Work Plan and Timeline
24
September October November December January Feb March/ April Spring 2020
SBE meeting and discussion
Joint EOGOAC, SBE, OSPI meeting
SBE meeting and discussion
Joint EOGOAC,SBE, OSPI meeting
SBE meeting SBE Task SBE Task
EOGOAC meeting
EOGOAC meeting
EOGOAC meeting
Review workplan and discuss metrics
Review current and additional metrics & get LEA feedback
Agree on finalPhase 2 methodology
Final approval of Phase 2 metrics and methodology
Identify and notify schools after WSIF public release
Recognition event(s)

Summary
PROPOSED PHASE 2 SCHOOL RECOGNITION Prepared for the January 2020 Board meeting
Over the last 18 months, the State Board of Education (SBE), Educational Opportunity Gap Accountability Oversight Committee (EOGOAC), and the Office of the Superintendent of Public Instruction (OSPI) have been collaborating on redesigning the Washington system of school recognition.
The SBE, EOGOAC, and OSPI collaborated on the Phase 1 school recognition system that resulted in the identification of 216 schools for recognition in the spring 2019 based on the metrics in the state accountability system as used in the Washington School Improvement Framework (WSIF). The 216 schools achieved recognition status via one or more of three distinct routes. Each of the routes rely on multiple measures, primarily based on the performance of the All Students group at schools.
In the summer and fall 2019, the SBE, EOGOAC, and OSPI met for a series of full day work sessions for the purpose of revising the Phase 1 recognition methodology. At the December 3 work session, the work group reached consensus on a revised Phase 2 school recognition methodology that would provide schools with the opportunity to be identified for recognition on the basis of a high performing student group. If the Phase 2 methodology had been in place last year, approximately 350 schools would have been identified for recognition, based on an analysis derived from the winter 2019 WSIF.
Analysis of the schools identified through the Phase 2 methodology includes the following:
1. The student demography of the recognized schools is similar to that of the schools notrecognized and similar to all schools in the state.
2. The recognized schools are physically situated in school districts spread across the state.3. The proposed methodology identifies schools for recognition representing
improvements along a continuum of performance. The SBE is expected to adopt the Phase 2 methodology at the January meeting, and expects to make the next identification of recognized schools in anticipation of a spring 2020 school recognition ceremony.
WASHINGTON STATE BOARD OF EDUCATION 128

Background Information
Part 1: Revised Phase 2 Growth Route
The SBE, EOGOAC, and OSPI collaborated on the Phase 1 school recognition system that resulted in the identification of 216 schools for recognition in the spring 2019 based on the state accountability system metrics used in the winter 2019 WSIF. The 216 schools achieved recognition status via one or more of three distinct routes. Each of the routes rely on multiple measures, primarily based on the performance of the All Students group at schools (Figure 1).
Figure 1: shows the measures utilized for each of the Phase 1 school recognition routes.
The SBE, EOGOAC, and OSPI assembled on July 30, October 1, and December 3 in all-day work sessions for the purpose of considering changes to the Phase 1 methodology and approach. At the December 3 work session, the work group reached consensus on a revised Phase 2 school recognition methodology that is reflected in the following paragraphs.
This memo is divided into two parts:
• Part 1: describes the changes to the Growth Route and the characteristics of schools thatwould be identified if the methodology were to be adopted, and
• Part 2: describes the Phase 2 methodology that incorporates the Phase 1 recognitionelements in combination with the Phase 2 Growth Route revisions.
Based on the feedback provided by the workgroup members at the October 1 work session, the staff conducted the analysis depicted in Figure 2.This part of the memo addresses the right side of the Growth route for the student groups.
WASHINGTON STATE BOARD OF EDUCATION 129

Figure 2: shows the added path to the Growth route based on student groups.
In addition to meeting other criteria (High/Low Gap and participation on assessments) and to be identified for recognition via the Growth route, different types of schools must be a top performer on a different number of measures:
• Elementary and middle schools are most often eligible for five or six measures (ELAproficiency, math proficiency, ELA SGP, math SGP, and regular attendance, ± ELProgress). So these schools would need to be a high performer in at least three of five(60 percent) or four of six (67 percent) reportable measures to achieve recognition status.
• Regular high schools are most often eligible for seven or eight measures (ELAproficiency, math proficiency, four-year graduation rate, extended graduation rate,regular attendance, 9th graders on-track, and dual credit participation ± EL Progress). Sothese schools would need to be a high performer in at least five of seven (71 percent) orfive of eight (63 percent) reportable measures to achieve recognition status.
• Combined high schools (e.g. 7-12 or K-12) could be eligible for all ten measures, sothese schools would need to be a high performer in at least six of ten (60 percent) ofreportable measures to achieve recognition status.
• In many cases a given school may not meet n-size requirements to have a reportablescore on a given metric. In that case at least 60 percent of the reportable measures mustbe in the top 20 percent to be identified for recognition.
The revised Phase 2 Growth route analysis followed the same approach as that conducted on the All Students group, but was based on the performance of the race/ethnicity, low income, limited English, and special education student groups. If this revision were to be adopted, a school could be identified for recognition via the Growth route if any student group (Native
WASHINGTON STATE BOARD OF EDUCATION 130

American, Asian, Black, Hispanic, White, Pacific Islander, Two or More races, low income, limited English, or special education) meets the specified criteria.
Results of the Revised Phase 2 Growth Route The work group technical staff conducted the analysis depicted in Figure 2 per the methodology agreed upon by the work group. Please note the following:
• The methodology required the computation of a threshold cut point for the eachstudent group for each measure and applied that threshold cut point the particularstudent group (Appendix A - Tables A1 and A2). To be in the top 20 percent of ameasure, a student group must have met or exceeded the threshold cut point for thatgroup and the threshold cut point differed for each student group on each measure.
• The workgroup reached consensus that a student group would not be recognized if theonly top performing measure was the regular attendance metric.
• The analyses described here include the application of the High/Low Gap (Appendix A)criteria, requiring an identified school to show a reduction the gap on the WashingtonSchool Improvement Framework (WSIF) rating between the highest and lowestperforming student groups.
Be advised that the ensuing discussion addresses only the schools that would be identified for recognition via the revised Growth route for student groups if this Phase 2 revision were to be adopted. Part II of this analysis provides information on the overall impact on recognition (taking into account all the pathways).
The revised methodology identified 226 schools with one or more student groups meeting the recognition criteria. The student demography at the identified schools is very similar to the demography of the schools not identified (Table 1). Schools with at least one high performing student group had an average Free or Reduced Prices Lunch (FRL) rate of 42.8 percent which compares favorably with the state average of 44.0 percent and the average rate for schools not identified.
Table 1: shows the demography of the identified schools in comparison to those schools not identified via the revised Growth route for student groups.
AI %
A %
B %
H %
PI %
W %
TWO %
EL %
FRL %
SWD %
Not Identified 2.5 5.3 4.1 22.0 0.9 56.6 7.6 10.3 45.1 16.1
Identified 1.0 8.5 4.3 20.8 1.0 55.8 8.7 11.9 42.8 14.2
Washington 2.3 5.5 4.1 21.5 0.9 55.6 7.6 10.2 44.0 15.6
*Note: AI = Native American, A = Asian, B = Black, H = Hispanic, PI = Pacific Islander, W = White, TWO =Two or More races, EL = Limited English, FRL = Low Income, and SWD = special education.
WASHINGTON STATE BOARD OF EDUCATION 131

Of the 226 schools, 88 earned recognition in the spring 2019 via one or more of the three Phase 1 recognition routes. If this Phase 2 revised Growth route methodology were to be adopted, an additional 138 schools would be identified for recognition. Of the identified schools:
• Approximately 57 percent of the schools (128/226) had only one high performingstudent group.
• Approximately two-thirds (65 percent) of the 146/226 schools are elementary schools(Table 2).
Table 2: shows the number of schools with at least one high performing student group by school level and by the number of high performing groups at the school.
0 Groups
1 Group
2 Groups
3 Groups
4 Groups
5 Groups
6 Groups Total*
ES 969 82 28 22 9 3 2 146
MS 334 22 10 3 1 36
Comb 98 4 4 8
HS 459 14 8 3 1 1 27
Comb HS 272 6 3 9
Total 2132 128 53 28 10 5 2 226 *Note: total represents the number of schools that would be recognized for at least one high performingstudent group.
The revised Growth route methodology results in the identification of every student group (Table 3) at one or more schools. Of the identified schools:
• 85 schools would be identified for recognition due to high growth among special education students.
• 59 schools would be identified for recognition due to high growth among students identifying as Hispanic or Latinx.
Table 3: shows the number of schools that would be identified for growth among student groups by school level.
AI A B H PI W TWO EL FRL SWD
ES 2 11 10 42 3 44 29 24 49 53
MS 3 8 1 7 12 8 7 10
Comb 1 4 4 3
HS 1 2 2 6 1 4 4 7 6 15
Comb HS 2 2 1 3 4
Total 3 13 15 59 5 61 45 40 69 85
*Note: AI = Native American, A = Asian, B = Black, H = Hispanic, PI = Pacific Islander, W = White, TWO =Two or More races, EL = Limited English, FRL = Low Income, and SWD = special education.
WASHINGTON STATE BOARD OF EDUCATION 132

The revised methodology identified schools in ESDs that are fairly representative of the distribution of schools across the state (Table 4). Approximately 42 percent (95/226) of the schools identified are physically situated in the Puget Sound ESD, which is home to approximately 33 percent of all Washington public schools. The distribution of identified schools by ESD in noteworthy as follows:
• Approximately 12 percent (27/226) of the identified schools are from ESD 101, which ishome for approximately 11 percent of all public schools.
• In the east Puget Sound region, 58 percent (131/226) of the identified schools were inESDs 121 and 189, which is home for approximately 45 percent of all public schools.
Table 4: shows the number of schools with high performing student groups by ESD and by student group.
AI A B H PI W TWO EL FRL SWD Total*
ESD 101 Spokane 1 9 2 5 4 1 9 8 27
ESD 105 Yakima 3 2 5 3 2 4 11
ESD 112 Vancouver 1 3 6 4 7 4 13
ESD 113 Tumwater 1 1 5 3 2 6 3 5 17
ESD 114 Bremerton 2 1 1 2 3 5
ESD 121 Renton 8 9 21 2 22 20 18 24 38 95
ESD 123 Pasco 3 1 4 2 4 4 5 14
ESD 171 Anacortes 1 3 3 2 4 8
ESD 189 Wenatchee 2 2 3 14 1 15 7 5 16 14 36
*Note: Total is the number of schools with at least one high performing group. AI = Native American, A =Asian, B = Black, H = Hispanic, PI = Pacific Islander, W = White, TWO = Two or More races, EL = LimitedEnglish, FRL = Low Income, and SWD = special education.
Of the 226 schools identified through the revised Growth route, 141 schools (62 percent) were identified for Foundational supports in the winter 2019 WSIF (Table 5). A total of 11 percent (25/226) of the identified schools were receiving Tier 2 Targeted or Tier 3 Comprehensive report during the 2017-18 school year.
Schools identified for recognition through the proposed revised Growth methodology are situated in school districts spread throughout the state (Figure 3).
WASHINGTON STATE BOARD OF EDUCATION 133

Table 5: shows the number of schools that would be identified via the revised Growth route if the methodology were to be adopted for the Phase 2 school recognition.
ES MS Comb HS Comb HS Total*
Tier 3 Comprehensive 1 5 6 Tier 2 Targeted >2 or Low EL Progress 14 4 1 19
Tier 1 Targeted 1-2 44 15 1 60
Foundational 87 17 8 20 9 141
Total 146 36 8 27 9 226
*Note: Total is the number of schools with at least one high performing group.
Figure 3: shows the school districts in which one or more schools would be identified for recognition via the revised Growth route if the methodology were to be adopted for use in the school recognition methodology.
State of Washington Phase 2 School Recognition
Washington School Recognition - Trial 6 Revised Growth Route - Final
Identified Schools
0 Schools
1 School
2-5 Schools
> 5 Schools
WASHINGTON STATE BOARD OF EDUCATION 134

Part 2: Description of Proposed Phase 2 Methodology
Closing Gaps Route (From Phase 1)
The proposed Phase 2 school recognition methodology follows the overall approach of the Phase 1 methodology, but a few comments are noteworthy here and are described in more detail in the sections that follow.
• The Phase 2 proposed methodology for the Closing Gaps route is unchanged from thePhase 1 methodology.
• The Phase 2 proposed methodology for the Growth route would be revised as follows:o For the All Students group a change is made that would prevent a school from
being recognized if the regular attendance metric is the only reportable measurefor a school. This change is to be consistent with the new growth route describedbelow. No schools would have been eliminated from recognition in 2019 due tothis change.
o A second Growth route is added that includes the opportunity for a school to beidentified for recognition for one or more high performing student groups. Asdescribed in part one, the net impact of this change would have been torecognize an additional 138 schools in 2019.
• The Phase 2 proposed methodology for the Achievement route is unchanged from thePhase 1 recognition methodology.
The Phase 2 proposed methodology for the Closing Gaps route is unchanged from the Phase 1 methodology. Schools identified for Targeted (Tiers 1 and 2) or Comprehensive (Tier 3) support in the winter 2018 WSIF version are preliminarily identified for recognition when any of the following criteria are met. Also, a school must meet the assessment participation requirements in ELA and math for the spring 2018 statewide assessments.
a. For Comprehensive supports schools, the All Students group must post a gain of at least0.65 decile points (top quintile threshold cut) form the winter 2018 WSIF to the winter2019 WSIF.
b. For Targeted support schools, all of the school’s low performing student groups mustpost an increase on the 2019 WSIF and at least one low performing group must post anincrease of at least 0.65 decile points from the winter 2018 WSIF version to the winter2019 WSIF version. The threshold represents the top 20 percent of schools for a givenmeasure. No new student groups may fall below the 2.30 threshold cut1 and at least onestudent group previously identified as low performing must move above the 2.30threshold cut.
c. Schools identified in the winter 2018 WSIF version for Tier 2: Targeted-Low EL Progresssupports must post an EL progress rate higher than the winter 2018 WSIF threshold cutfor EL Progress identification.
1 The 2.30 threshold cut point is the decile value established through the Washington School Improvement Framework to identify the lowest performing schools or student groups
WASHINGTON STATE BOARD OF EDUCATION 135

Growth Route All Students Group (From Phase 1)
d. Schools identified in the winter 2018 WSIF version for Tier 3: Comprehensive Low GradRate must post a four-year graduation rate of 66.7 percent2 or higher for the class of2018.
The Phase 2 proposed methodology for the Growth route for the All Students group is unchanged from the Phase 1 recognition methodology, except for one change shown in bold font in the paragraph below. Note the fact that no schools would have been impacted by this change if the change had been in effect for the Phase 1 recognition methodology in 2019.
All schools are eligible to be identified on the basis of posting the largest gains in annual performance on any of a number of different measures (Figure 2), which include student growth percentiles (SGPs), proficiency rates, four-year graduation rate, extended graduation rate, EL progress, and SQSS measures. The measures are generally defined as follows:
a. The one-year 2018 school median SGP for ELA and math (separately) is in the topquintile of schools and the school met the performance gap requirement.
b. The change in the ELA and math proficiency rates is sufficiently large to place the schoolin the top 20 percent of schools, and additional participation requirements are met.
c. The change in the four-year graduation rates is sufficiently large to place the school inthe top 20 percent.
d. The extended graduation rate measure from the winter 2019 WSIF is amongst thehighest.
e. The annual change in the percentage of EL students making progress is among thehighest.
f. The annual changes in the school performance on the regular attendance, 9th grade on-track, and dual credit participation measures (separately) are sufficiently large to placethe school in the top 20 percent of schools.
For a school to be identified under the Growth route for the All Students group, the school must have posted outcomes in the top quintile of schools on at least 60 percent of the reportable measures for which the school was eligible. On December 3, the work group reached consensus to add a rule to ensure that a student group at a school will not be recognized if the only top performing measure for the All Students group was the regular attendance metric. The school must also meet the assessment participation requirements in ELA and math for the spring 2018 statewide assessments. Finally, the school must have met the requirement of reducing the WSIF high/low gap from the winter 2018 WSIF to the winter 2019 WSIF.
2 The 66.7 percent threshold cut point for identification of a low graduation rate isdefined and specified in the Washington Every Student Succeeds Act (ESSA) State Accountability Plan.
WASHINGTON STATE BOARD OF EDUCATION 136

Student Groups (Proposed Phase 2)
For a school to be identified under the Growth route for a student group, the school must have posted outcomes in the top 20 percent of schools on at least 60 percent of the measures for which the school was eligible. A student group at a school will not be recognized if the only top performing measure was the regular attendance metric. The school must also meet the assessment participation requirement in ELA and math for the spring 2018 statewide assessments. Finally, the school must have met the requirement of reducing the WSIF high/low gap from the winter 2018 WSIF to the winter 2019 WSIF.
Achievement Route (From Phase 1) The Phase 2 proposed methodology for the Achievement route is unchanged from the Phase 1 recognition methodology. All schools are eligible to be identified through the achievement route on the basis of placing among the highest performers on ELA and math proficiency, four-year high school graduation rate, and SQSS measures. In this model, a school would qualify for recognition under the achievement route if at least two of the following criteria are met.
a. The school performed in the top 20 percent of schools on the three-year proficiencyrates for the ELA and math assessments (separately).
b. The school performed in the top 20 percent of schools on the four-year high schoolgraduation rate aggregated over three years.
c. The school performed in the top 20 percent of schools on the separate SQSS measuresaggregated over three years.
In order to be identified for recognition under the achievement route, the All Students group and all other reportable student groups must have posted a winter 2019 WSIF rating of 6.00 or higher. The school also was required to meet the assessment participation requirements in ELA and math for the spring 2018 statewide assessments.
Results of the Phase 2 Methodology
As a reminder, the ensuing discussion addresses the schools that would have been identified for recognition if the Phase 2 methodology had been applied in 2019 recognition calculations. In this discussion, the revised Phase 2 Growth route for student groups is combined with the Phase 1 methodology.
If the methodology were to be adopted and applied to the winter 2019 WSIF data, a total of 354 unique schools would be identified. The increase from 216 schools to 354 schools represents a 64 percent increase. Details regarding the increase are presented in Table 6.
The student demography at the identified schools is very similar to the demography of the schools not identified (Table 7). The identified schools had an average FRL rate of 41.7 percent which compares favorably with the state average and the average for schools not identified.
WASHINGTON STATE BOARD OF EDUCATION 137

Table 6: shows the number of schools that would be identified if the Phase 2 school recognition methodology by recognition route.
Phase 1 Closing Gaps
Phase 1 Growth
All Students
Phase 2 Growth
Student Groups
Phase 1 Achievement
Total* (Unique Schools)
Phase 1 108 48 n/a 69 216
Phase 2 108 48 226 69 354
*Note: Total shown represents the number of unique schools that would be identified using the winter2019 WSIF data if the methodology was to be adopted. n/a = not analyzed.
Table 7: shows the demography of the identified schools in comparison to those schools not identified via the Phase 2 methodology.
AI %
A %
B %
H %
PI %
W %
TWO %
EL %
FRL %
SWD %
Not Identified 2.6 5.1 4.2 22.0 0.9 56.7 7.7 10.1 45.5 16.3
Identified 1.3 8.5 3.9 21.6 0.9 55.7 8.1 12.3 41.7 13.7
Washington 2.3 5.5 4.1 21.5 0.9 55.6 7.6 10.2 44.0 15.6
*Note: AI = Native American, A = Asian, B = Black, H = Hispanic, PI = Pacific Islander, W = White, TWO =Two or More races, EL = Limited English, FRL = Low Income, and SWD = Special Education.
Of the 354 schools identified through the proposed Phase 2 methodology, 193 schools (55 percent) were identified for Foundational supports in the winter 2018 WSIF (Table 8). Also, approximately 16 percent (58/354) of the identified schools were receiving Tier 2 Targeted or Tier 3 Comprehensive report during the 2017-18 school year.
Table 8: shows the number of schools that would be identified via the revised Growth route if the methodology were to be adopted for the Phase 2 school recognition.
ES MS Comb HS Comb HS Total
Tier 3 Comprehensive 11 1 11 6 29 Tier 2 Targeted >2 or Low EL Progress 24 4 1 29
Tier 1 Targeted 1-2 73 27 2 1 103
Foundational 119 21 8 28 17 193
Total 227 53 8 42 24 354
The proposed Phase 2 methodology identified schools in ESDs that is fairly representative of the distribution of schools across the state (Table 9). Approximately 40 percent (143/354) of the
WASHINGTON STATE BOARD OF EDUCATION 138

schools identified are physically situated in the Puget Sound ESD, which is home to approximately 33 percent of all Washington public schools. The distribution of identified schools by ESD in noteworthy as follows:
• Approximately 12.7 percent (45/354) of the identified schools are from ESD 101, which ishome for approximately 11.7 percent of all public schools.
• In the east Puget Sound region, 56 percent (197/354) of the identified schools were inESDs 121 and 189, which is home for approximately 48 percent of all public schools.
Table 9: shows the regional distribution of identified schools by ESD. For example, of the 354 identified schools, 45 schools (12.7 percent of the identified schools) were situated in ESD 101.
ESD
101
Spok
ane
ESD
105
Yaki
ma
ESD
112
Vanc
ouve
r
ESD
113
Tum
wat
er
ESD
114
Brem
erto
n
ESD
121
Rent
on
ESD
123
Pasc
o
ESD
171
Wen
atch
ee
ESD
189
Anac
orte
s
Number of Schools Recognized 45 24 23 24 6 143 23 12 54
Percent of Recognized Schools by ESD 12.7 6.8 6.5 6.5 1.7 40.4 6.5 3.4 15.3
Percent of Total Schools by ESD 11.7 5.7 8.8 8.1 4.8 32.6 6.1 5.6 14.9
Schools identified for recognition through the proposed Phase 2 methodology are situated in school districts spread throughout the state (Figure 4).
Figure 4: shows the schools districts in which the 354 identified schools are physically situated.
State of Washington DRAFT - Phase 2 School Recognition - DRAFT
Washington School Recognition - DRAFT - Final Phase 2 - DRAFT
Identified Schools
0 Schools
1 School
2-5 Schools
> 5 Schools
WASHINGTON STATE BOARD OF EDUCATION 139

Appendix A Other analytical parameters:
• The High/Low Gap from the winter 2018 and winter 2019 WSIF will be used in the samemanner as is used for the Phase I Growth route. The gap for a school must be decliningand the scores for groups used in the gap analysis must be improving.
• Schools must meet the ESSA assessment participation requirements.• For the ELA and math proficiency rate changes, a rate of < 95 percent in 2017 or 2018
will result in “no harm”, as the record will be removed from the numerator anddenominator calculations.
• A student group must have at least 10 valid records in both years to result in areportable value.
• The top 20 percent threshold cut points for each measure are included in Table A2,• A school will be not be identified for recognition via the growth route if the regular
attendance measure is the only reportable measure.
WASHINGTON STATE BOARD OF EDUCATION 140

Table A1: includes a brief description of the Phase 1 data elements for the Growth route and the top 20 percent threshold cut points for each of the ten possible reportable measures for the All Students group.
Data Element Data Definition Threshold
Top 20 Percent (All Students Group)
2017 and 2018 ELA Proficiency
Change in ELA proficiency rate from 2017 to 2018 if the participation rate was ≥ 95 percent for both years.
5.6409 pp
2017 and 2018 Math Proficiency
Change in math proficiency rate from 2017 to 2018 if the participation rate was ≥ 95 percent for both years.
4.0755 pp
2018 ELA SGP ELA median SGP 59.0 SGP (median)
2018 Math SGP Math median SGP 60.0 SGP (median)
2017 and 2018 Four-Year Graduation Rate Change in four-year graduation rate from 2017 to 2018
6.6507 pp
2017 and 2018 Ext. Graduation Rate
Change in the graduation rate (Four to Seven Year) in the Winter 2019 WISF
Bonus Decile ≥ 1
2017 and 2018 EL Progress Change in EL Progress rate from 2017 to 2018
3.9608 pp
2017 and 2018 Regular Attendance Change in Regular Attendance rate from 2017 to 2018
2.5950 pp
2017 and 2018 9th Graders On-Track
Change in the 9th Graders On-Track rate from 2017 to 2018
7.1429 pp
2017 and 2018 Dual Credit Participation Change in the Dual Credit Part. rate from 2017 to 2018
6.2672 pp
*Note” pp = percentage points.
WASHINGTON STATE BOARD OF EDUCATION 141

Table A2: shows the threshold values for the top 20 percent of schools.
ELA PRO CHANGE
MATH PRO
CHANGE
ELA SGP
MATH SGP
GRAD CHANGE
DUAL CREDIT
CHANGE
ON TRACK
CHANGE
ATT CHANGE
Top Quintile
Top Quintile
Top Quintile
Top Quintile
Top Quintile
Top Quintile
Top Quintile
Top Quintile
All Students 5.6409 4.0775 59.00 60.00 6.6507 6.2672 7.1429 2.5950
Native American 11.1648 7.6471 69.50 70.00 19.5218 13.5870 18.2051 9.9560
Asian 8.7823 6.8182 71.00 73.00 7.1703 13.5934 6.1187 4.1272
Black 10.7639 9.1775 65.00 64.80 9.1149 10.7441 13.7033 6.0642
Hispanic 8.4885 6.6142 59.50 59.50 9.5238 8.0758 9.8354 4.4423
White 6.2450 5.2242 60.50 61.00 7.0523 7.4285 8.2362 3.1297
Pacific Islander 13.1765 13.9929 68.90 66.00 18.8043 14.3838 24.1958 10.0000
Two or More Races 10.8312 8.6255 64.50 64.00 8.8889 11.0765 10.3225 5.5050
English Learner 7.6584 5.9864 61.00 61.00 15.7219 13.1603 17.2389 5.5887
Low Income 7.1440 5.2853 58.00 57.50 8.5195 7.8261 10.0447 3.9155 Special
Education 7.7750 6.4780 55.00 55.50 13.7202 8.3333 14.1143 5.1080
*Note: each change is shown in percentage points change computes as the 2018 value minus the 2017value. A positive result means the 2018 value was greater than the 2017 value indicating that the group atthe school demonstrated improvement on the educational outcome measure.
High/Low Gap In order to qualify for recognition by way of the Growth route, a school was required to demonstrate a decreasing High/Low gap. As an added control, the lowest performing group from the winter 2018 WSIF was required to show an increase on the winter 2019 WSIF.
1. The High/Low gap for winter 2018 WSIF was computed as the WSIF rating for thehighest performing student group minus the WSIF rating for the lowest performingstudent group. The 2019 WSIF gap was computed for the winter 2019 WSIF in the samemanner.
2. The High/Low gap change was computed as the winter 2019 WSIF High/Low gap minusthe winter 2018 WSIF High/Low gap. Three outcomes are possible:
a. A positive value means the winter 2019 WSIF gap increased from the winter 2018WSIF, so the school would not qualify for recognition via this route.
b. A value of zero means the winter 2019 WSIF gap was unchanged from the winter2018 WSIF, so the school would not qualify for recognition via this route becausea gap reduction was required.
WASHINGTON STATE BOARD OF EDUCATION 142

c. A negative value means the winter 2019 WSIF gap decreased from the winter2018 WSIF, so the school would could qualify for recognition via this route.
The WSIF performance by the All Students group was not allowed to factor into the gap calculations as only the seven race/ethnicity groups and the program participation groups (Free and Reduced Price Lunch (FRL), English Learners (EL) and special education (SWD) were considered. The workgroup acknowledged that some recognized schools could have a substantial gap between the highest and lowest performing student groups but found this to be more acceptable knowing that, to be recognized, the gap must be decreasing.
Proficiency Rate Changes The ELA and math proficiency rate changes from the spring 2017 testing to the spring 2018 testing was computed as follows:
1. Spring 2018 proficiency rate for the All Students group minus the spring 2017proficiency rate for the All Students group.
2. The computation was made separately for ELA and math using a minimum n-count of 10student records.
The workgroup members acknowledged that the annual proficiency rates were particularly sensitive to testing participation rates, and that it would be virtually impossible to distinguish an increase attributed to increased performance on tests from an increase attributed to higher participation in testing. In order to minimize the possibility of an erroneous identification, the change in proficiency rate was computed for schools only if the 2017 and 2018 participation rates were at least 95 percent. For calculations relying on these measures, numerators and denominators were coded as a zero so as to not penalize a school for low participation rate on a given change score.
WASHINGTON STATE BOARD OF EDUCATION 143

School Districts
2018-19 State Recognized Schools Communications Plan
Objectives • Expand deliberate communications regarding State Recognized Schools • Promote share-able stories about successful strategies happening now in Washington schools
and districts • Build understanding and awareness of State Recognized Schools and the criteria used to identify
those schools • Bolster unified, co-brand of the State Recognized Schools program
Audiences (Primary)
• State Recognized Schools and their: o Communities and ESDs o o Superintendents o Principals o Educators o Students
• Broad education community: school districts statewide • Stakeholders/partnership organizations
Key Message Options
• The State Board of Education (SBE) along with the Office of the Superintendent of Public Instruction (OSPI) and the Educational Opportunity Gap Oversight and Accountability Committee (EOGOAC) is developing a new recognitionframework that incorporates state-level and local information to identify schools that are exemplars in terms of closing gaps, growth, and achievement. This new recognition framework identifies schools along the entire continuum of support.
• The framework used to measure growth and achievement includes as many as nine indicators (such as graduation rates, attendance, and proficiency on statetests in math and English language arts).
• State Recognized Schools are models of achievement in closing gaps and growth in fundamental areas of education that are crucial to student success.
• State Recognized Schools make great strides to improve outcomes for students by closing gaps and showing tremendous growth and achievement.
Key Date(s) • April 2020: Tentative release of State Recognized Schools • Spring 2020: “School Recognition Week” Event(s) to showcase recipients
Communication Channels and Vehicles
• Printo Banners o Certificate
144

Social Media
o State Recognized Schools data highlight one-pagers
• Digital o Sbe.wa.gov “database” o State Recognized Schools data highlight one-pagers o
Toolkit School features Periodic joint promotion with partners
• Media o Press release (joint from OSPI/SBE/EOGOAC) o Press invitation and media kit (for event) o Earned media? (e.g. editorials or interviews)
Action Items
Date Notes
January 2020 Joint meeting to establish concrete dates/places.
Pre-liminary message: Here’s what’s happening!
• State Recognized Schools are going to beannounced soon!
• Audience: Superintendents, ESDs, Communications Partners
February (all month)
17-18 State RecognizedSchools promotionalcampaign
• Features of 17-18 recognized schools on blog,social media, website, in direct email campaigns,etc.
April TBD Letter/Email: Your school has been recognized!
1. Superintendents and ESD Superintendents first 2. Followed by letter to School
principal/leadership • Should be signed by Work Group leadership • Content: Congrats! Your school is recognized.
Here’s how/why. Here’s what you get. There will bea press release on this day and an event at this place and time. Link to website where listing willoccur.
April TBD Press Release: State Recognized Schools Announced
May TBD State Recognized Schools event(s)
145

Last year’s branding, most recent positive press:
146

*Disaggregated student groups:The breaking down of student data intosmaller groupings, often based on characteristics such as sex, family income, or racial/ethnic group.
Growth is measured by all student groups, and
disaggregated student groups*, with the exception of English Learner Progress.
udents
9th Why are schools beingGraders On-track recognized?
English Washington State’s school recognition program hasLanguage
Arts been reimagined over the past few years. Changes are due in part to the shift to the Every Student Succeeds
Act (ESSA) accountability system and by the desire of the organizations to make the school recognition
sAchievement
Math system more equitable.
High performance in multiple measures Graduation
Rate
WSIF* Change
All st
WSIF* Change
ed nt goup
u
Dual Credit
RegularAttendance
Proficiency&
Growth Graduation Rate
Proficiency&
EnglishLanguage
Arts
Math
RegularAttendance
Dual Credit
9th Graders
English
On-track
Learner Progress
St Growth English
Learner Progress
Graduation Rate
Extended Graduation
Rate
Growth School progress one
year to the next or highstudent growth
Closing Gaps Best improvement
among schools receiving support
*The Washington SchoolImprovement Framework (WSIF) uses academic indicators EnglishLanguage Arts and Mathproficiency and growth, graduation, Englishlearner progress, regular attendance, 9th-graders on-track, and dual credit.
WASHINGTON SCHOOL RECOGNITION
PROGRAM
SBE EOGOAC OSPI
147

2019-2020 SCHOOL DISTRICT BASIC EDUCATION COMPLIANCE REPORT
PREPARED FOR THE JANUARY 2020 BOARD MEETING
Action
School districts have submitted basic education compliance reports that are responsive to improved questions for the 2019-2020 school year. The Board will consider approval of school districts as in compliance with requirements of the program of basic education.
Materials included in packet: • List of school districts being considered for approval• PowerPoint will be included in additional materials
Business Items: Annually, State Board of Education staff process basic education compliance reports from all public school districts. Between late July and November, school districts respond to a survey to attest that they are meeting minimum requirements of the program of basic education. Staff examine the data for errors or issues of non-compliance, verify results by contacting school districts to ensure fidelity to state requirements, and analyze the findings. Based on staff review of each school district’s program assurance form, staff recommend school districts to be certified as being in compliance with basic education approval requirements for the 2019-20 school year. If any school districts are still undergoing corrections, staff will recommend removal of those districts from the approval list.
148

WASHINGTON STATE BOARD OF EDUCATION
For the 2019-2020 school year the following school districts are recommended to be certified as being in compliance with basic education approval requirements. This list comprises all 295 public school districts.
Aberdeen School District
Adna School District
Almira School District
Anacortes School District
Arlington School District
Asotin-Anatone School District
Auburn School District
Bainbridge Island School District
Battle Ground School District
Bellevue School District
Bellingham School District
Benge School District
Bethel School District
Bickleton School District
Blaine School District
Boistfort School District
Bremerton School District
Brewster School District
Bridgeport School District
Brinnon School District
Burlington-Edison School District
Camas School District
Cape Flattery School District
Carbonado School District
Cascade School District
Cashmere School District
Castle Rock School District
Centerville School District
Central Kitsap School District
Central Valley School District
Centralia School District
Chehalis School District
Cheney School District
Chewelah School District
Chimacum School District
Clarkston School District
Cle Elum-Roslyn School District
Clover Park School District
Colfax School District
College Place School District
Colton School District
Columbia (Stevens) School District
Columbia (Walla Walla) School District
Colville School District
Concrete School District
Conway School District
Cosmopolis School District
Coulee-Hartline School District
Coupeville School District
Crescent School District
149

WASHINGTON STATE BOARD OF EDUCATION
Creston School District
Curlew School District
Cusick School District
Damman School District
Darrington School District
Davenport School District
Dayton School District
Deer Park School District
Dieringer School District
Dixie School District
East Valley School District (Spokane)
East Valley School District (Yakima)
Eastmont School District
Easton School District
Eatonville School District
Edmonds School District
Ellensburg School District
Elma School District
Endicott School District
Entiat School District
Enumclaw School District
Ephrata School District
Evaline School District
Everett School District
Evergreen School District (Clark)
Evergreen School District (Stevens)
Federal Way School District
Ferndale School District
Fife School District
Finley School District
Franklin Pierce School District
Freeman School District
Garfield School District
Glenwood School District
Goldendale School District
Grand Coulee Dam School District
Grandview School District
Granger School District
Granite Falls School District
Grapeview School District
Great Northern School District
Green Mountain School District
Griffin School District
Harrington School District
Highland School District
Highline School District
Hockinson School District
Hood Canal School District
Hoquiam School District
Inchelium School District
Index School District
Issaquah School District
Kahlotus School District
Kalama School District
Keller School District
Kelso School District
150

WASHINGTON STATE BOARD OF EDUCATION
Kennewick School District
Kent School District
Kettle Falls School District
Kiona-Benton City School District
Kittitas School District
Klickitat School District
La Center School District
La Conner School District
LaCrosse School District
Lake Chelan School District
Lake Quinault School District
Lake Stevens School District
Lake Washington School District
Lakewood School District
Lamont School District
Liberty School District
Lind School District
Longview School District
Loon Lake School District
Lopez School District
Lyle School District
Lynden School District
Mabton School District
Mansfield School District
Manson School District
Mary M Knight School District
Mary Walker School District
Marysville School District
McCleary School District
Mead School District
Medical Lake School District
Mercer Island School District
Meridian School District
Methow Valley School District
Mill A School District
Monroe School District
Montesano School District
Morton School District
Moses Lake School District
Mossyrock School District
Mount Adams School District
Mount Baker School District
Mount Pleasant School District
Mount Vernon School District
Mukilteo School District
Naches Valley School District
Napavine School District
Naselle-Grays River Valley School District
Nespelem School District #14
Newport School District
Nine Mile Falls School District
Nooksack Valley School District
North Beach School District
North Franklin School District
North Kitsap School District
North Mason School District
151
WASHINGTON STATE BOARD OF EDUCATION
North River School District
North Thurston Public Schools
Northport School District
Northshore School District
Oak Harbor School District
Oakesdale School District
Oakville School District
Ocean Beach School District
Ocosta School District
Odessa School District
Okanogan School District
Olympia School District
Omak School District
Onalaska School District
Onion Creek School District
Orcas Island School District
Orchard Prairie School District
Orient School District
Orondo School District
Oroville School District
Orting School District
Othello School District
Palisades School District
Palouse School District
Pasco School District
Pateros School District
Paterson School District
Pe Ell School District
Peninsula School District
Pioneer School District
Pomeroy School District
Port Angeles School District
Port Townsend School District
Prescott School District
Prosser School District
Pullman School District
Puyallup School District
Queets-Clearwater School District
Quilcene School District
Quillayute Valley School District
Quincy School District
Rainier School District
Raymond School District
Reardan-Edwall School District
Renton School District
Republic School District
Richland School District
Ridgefield School District
Ritzville School District
Riverside School District
Riverview School District
Rochester School District
Roosevelt School District
Rosalia School District
Royal School District
San Juan Island School District
152

WASHINGTON STATE BOARD OF EDUCATION
Satsop School District
Seattle Public Schools
Sedro-Woolley School District
Selah School District
Selkirk School District
Sequim School District
Shaw Island School District
Shelton School District
Shoreline School District
Skamania School District
Skykomish School District
Snohomish School District
Snoqualmie Valley School District
Soap Lake School District
South Bend School District
South Kitsap School District
South Whidbey School District
Southside School District
Spokane School District
Sprague School District
St. John School District
Stanwood-Camano School District
Star School District No. 054
Starbuck School District
Stehekin School District
Steilacoom Hist. School District
Steptoe School District
Stevenson-Carson School District
Sultan School District
Summit Valley School District
Sumner School District
Sunnyside School District
Tacoma School District
Taholah School District
Tahoma School District
Tekoa School District
Tenino School District
Thorp School District
Toledo School District
Tonasket School District
Toppenish School District
Touchet School District
Toutle Lake School District
Trout Lake School District
Tukwila School District
Tumwater School District
Union Gap School District
University Place School District
Valley School District
Vancouver School District
Vashon Island School District
Wahkiakum School District
Wahluke School District
Waitsburg School District
Walla Walla Public Schools
Wapato School District
153

WASHINGTON STATE BOARD OF EDUCATION
Warden School District
Washougal School District
Washtucna School District
Waterville School District
Wellpinit School District
Wenatchee School District
West Valley School District (Spokane)
West Valley School District (Yakima)
White Pass School District
White River School District
White Salmon Valley School District
Wilbur School District
Willapa Valley School District
Wilson Creek School District
Winlock School District
Wishkah Valley School District
Wishram School District
Woodland School District
Yakima School District
Yelm School District
Zillah School District
154

Legislative Session Kick-Off PREPARED FOR THE JANUARY 2020 BOARD MEETING
Information and Possible Action
Materials included in packet: • 2020 Legislative Platform Mark-up – Possible Action • Governor’s Proposed 2020 Supplemental Budget and Policy Highlights
Synopsis: Staff will provide legislative update and suggest minor revisions to the platform document in response to the Governor’s budget release. In addition, staff will brief members on bills aligned with the platform and/or bills that impact the board or the board’s areas of authority.
156

2020 Legislative Platform (January 15 - Draft)
The Board appreciates the progress the 2019 Legislature made in increasing flexibility in high school graduation requirements. During the second year of this biennium, the Board is committed to continued collaboration with the legislature and our other K-12 partners to implement and refine current state policies to ensure all of Washington’s students graduate prepared for civic engagement, careers, postsecondary education, and lifelong learning. The Board’s 2020 legislative platform builds on the priorities established last year. The Board will also advocate to advance additional initiatives consistent with our 2019-2023 strategic plan.
Educational Equity The Board supports legislation targeted to dismantling institutional policies, programs, and practices that contribute to disparate and statistically predictable educational outcomes based on race, ethnicity, socioeconomic background, and other factors. Specifically, the Board supports changes to school funding that are equitable and based on the diverse needs of students and changing societal demands. In addition, the Board supports increasing access to dual credit and high-quality expanded learning opportunities for historically underserved students.
School Safety Safe schools foster academic achievement and a healthy K-12 system. The Board urges the state to create a state-wide framework for mental health support, social emotional learning, and trauma-informed instructional models in the K-12 system; and to further expand and sustain comprehensive statewide school safety and mental health systems via regional coordination.
Special Education Despite critical investments made in 2019, Special Education funding remains inadequate. The Board urges the Legislature to increase funding for students who have Individualized Education Plans and students qualifying for the Safety Net, and to support inclusionary practices.
Early Learning The Board appreciates the progress made last year and urges the Legislature to continue to expand access to affordable, high-quality early childhood education for all of Washington’s children, particularly children of color and children in poverty, to mitigate opportunity and achievement gaps.
Modest Budget Requests The Board has submitted requestsis requesting funding to support our website ADA accessibility and local development of credit-bearing High School and Beyond Plan options. In addition, the Board is advocating for additional staff resources at ERDC to support cross-agency data analysis and reporting in support of Career Connect Washington.
157

Third Annual Charter School Report PREPARED FOR THE JANUARY 2020 BOARD MEETING
Information and Action
In collaboration with the Charter School Commission (CSC), the State Board of Education (SBE) issues an annual report on the charter schools to the Governor, the Educational Committees of the Legislature, and the public, in accordance with RCW 28A.710.250. While this is the third annual report, the data represent three or fewer years of results, with multiple school openings, school closures, and significant changes in enrollment. As a result, trend data is limited so the findings and analysis presented here should be considered preliminary.
Materials included in packet: • Draft Charter School Report • Charter School PowerPoint Presentation
Synopsis: The presentation will summarize the required elements to be included in the charter schools report:
• The academic performance of the charter school students, • The SBE’s assessment of the successes, challenges, and areas for improvement in
meeting the purposes of the Washington Charter Public Schools Act • The SBE’s assessment of the sufficiency of funding for charter schools and the
efficacy of the formula for authorizer funding, and • Any suggested changes in state law or policy necessary to strengthen the state's
charter schools.
Business Items: After discussion, the Board is expected to approve the charter schools report and direct staff to make final revisions and submit the finalized report to the Educational Committees of the Legislature and the Governor.
158
DRAFT – Not for distribution
CHARTER SCHOOLS ANNUAL REPORT
December 2019
The Washington State Board of Education envisions an education system where students are engaged in personalized education pathways that prepare them for civic engagement, careers, postsecondary education, and lifelong learning.
159

DRAFT – Not for distribution
1
ACKNOWLEDGEMENTS
The Washington State Board of Education (SBE) staff would like to acknowledge the support provided by the Washington State Charter School Commission (CSC) and Spokane Public Schools which worked collaboratively to ensure accurate student performance data and identify suggested amendments to statute to strengthen the state’s charter schools. The SBE also wishes to thank the Student Information Office staff at the Office of the Superintendent of Public Instruction (OSPI) for providing certain data to the Board about the Washington charter schools.
Questions regarding this report should be directed to the following SBE staff:
Dr. Andrew Parr, Research Director [email protected]
160

DRAFT – Not for distribution
2
Contents Executive Summary .................................................................................................................................................... 3
Key Findings on the Academic Performance of Charter Schools ........................................................ 3
Key Developments Charter Schools ................................................................................................................ 4
Introduction .................................................................................................................................................................. 6
Charter Schools in Washington ........................................................................................................................ 6
Overview of the Academic Performance of Charter Schools ............................................................. 10
Section I - 2018-2019 Charter School Performance ................................................................................... 10
Summary of Findings ......................................................................................................................................... 11
Academic Performance of Charter School Students in Washington ............................................... 12
Section II – Meeting the purposes of Washington’s Charter Schools Act ......................................... 20
Areas for Improvement: .................................................................................................................................... 22
Funding Sufficiency for Charter Schools .................................................................................................... 22
Efficacy of the Funding for Charter School Authorizers ....................................................................... 25
Section III - Recommended Changes to State Law or Policy .................................................................. 25
Appendix A: Detailed Performance Analysis ................................................................................................. 27
Part A: Academic Performance of the Charter Schools ........................................................................ 27
Part B: Performance of Charter School Students and Similar TPS Students. ................................ 38
161
DRAFT – Not for distribution
3
Executive Summary Washington State’s Charter School Act (RCW 28A.710) was enacted on April 3, 2016. The primary purpose of Washington’s Charter School Act is to allow flexibility to innovate in areas such as scheduling, personnel, funding, and educational programs to improve student outcomes and academic achievement of “at-risk” student populations1. A Washington charter public school is a public school that is not a common school: a public alternative to traditional common schools. The first public charter schools began operating in Washington in fall 2016. In collaboration with the Charter School Commission (CSC), the State Board of Education (SBE) issues an annual report to the Governor, the Legislature, and the public, in accordance with RCW 28A.710.250. While this is the third annual report, the data represent three or fewer years of results, with schools opening and closing, and significant changes in enrollment. As a result, trend data is limited so the findings and analysis presented here should be considered preliminary. The information required to be included in the annual charter school report is as follows:
• The performance of the state's charter schools during the preceding school year, including a comparison of the performance of charter school students with the performance of academically, ethnically, and economically comparable groups of students in traditional public schools2 (TPS);
• The State Board of Education’s assessment of the successes, challenges, and areas for improvement in meeting the purposes of the Washington Charter Public Schools Act (RCW 28A.710), including the Board's assessment of the sufficiency of funding for charter schools, the efficacy of the formula for authorizer funding; and
• Any suggested changes in state law or policy necessary to strengthen the state's charter schools.
Key Findings on the Academic Performance of Charter Schools 1. Most of the charter public schools serve higher percentages of students living in poverty,
higher percentages of students with disabilities, higher percentages of students of color, but lower percentages of English Learners than the state average or than the home school districts.
2. Regarding the percentage of students meeting standard on the statewide assessments for the spring 2019 administration, the performance of the charter schools is mixed:
1 An "At-risk student" is defined in statute as a student who has an academic or economic disadvantage that requires assistance or special services to succeed in educational programs. The term includes, but is not limited to, students who do not meet minimum standards of academic proficiency, students who are at risk of dropping out of high school, students in chronically low-performing schools, students with higher than average disciplinary sanctions, students with lower participation rates in advanced or gifted programs, students who are limited in English proficiency, students who are members of economically disadvantaged families, and students who are identified as having special educational needs. 2 Traditional public school (TPS) students are those students whose primary school assignment is a public common school and who were not enrolled in a charter public school at any time during the year.
162

DRAFT – Not for distribution
4
a. Three charter schools posted results that were better than the home school3 district on the English language arts (ELA), math, and science assessments.
b. Two charter schools posted results that were similar to the home school district on the ELA and math assessments.
c. Two charter schools posted results that were lower to the home school district on the ELA and math assessments.
d. Four charter schools posted mixed results in comparison to the performance of the home school district.
3. Information about the performance of charter schools on the Washington School Improvement Framework (WSIF) is limited and mixed, as only five schools earned a WSIF rating ranging from a low of 1.53 to a high of 8.35.
4. Statewide, charter school students perform approximately the same as demographically and academically similar TPS students on the ELA assessment, but slightly higher than TPS students on the math and science assessments. In most cases the scale score differences are small.
5. Statewide, the student growth percentiles posted by charter school students in ELA and math were slightly higher than the percentiles posted by TPS students.
6. Two charter schools had reportable four year graduation rates, and the rates were similar to the state average.
Key Developments Charter Schools The Washington State Charter School Commission (CSC) and Spokane Public Schools continue as the only charter school authorizers in the state. The two entities oversaw 12 charter public schools operating in Washington during the 2018-19 school year. Total charter public school enrollment increased to approximately 3,400 K-12 students in the 2018-19 school year, a 43 percent enrollment increase over 2017-18 school year.
During the 2018-19 school year, two new schools began operation enrolling a total of 294 students. At the close of the 2018-19 school year, three schools closed citing funding challenges which resulted in the withdrawal from Washington of the Green Dot charter management organization. Together, the closed schools (two Green Dot schools and the SOAR Academy) enrolled a total of 571 students in grades K-10 in the 2018-19 school year.
Additional developments in the fall of 2019 include the closure of Ashé Preparatory Academy after approximately one month in operation due to staffing and enrollment challenges. It is important to note that prior to opening Ashé also experienced challenges finding a suitable space for the school and settled on a location outside the core community they intended to serve. That in turn impacted their enrollment.
3 The home school district is defined as the district in which the charter school is physically located. In some cases charter schools draw students from multiple districts.
163

DRAFT – Not for distribution
5
Space availability was also a factor in another recent development, the decision of Spokane International Academy to relocate to a site outside the boundaries of the Spokane School District, which necessitates a transfer of their authorization contract from Spokane Public Schools to the Charter School Commission. The Board is expected to approve that transfer during the January 2020 meeting.
The key developments for each of the authorizers are listed below:
Charter School Commission
• During the 2018-19 school year, ten CSC authorized charter schools were in operation. • In June 2019 the CSC was notified of the voluntary closure of three charter schools and
in October, the voluntary closure of a fourth charter school. • Twelve organizations submitted Notices of Intent to apply for new charters, and seven
applications to open new charter public schools were received. Three applications were deemed incomplete, and the other four new charter school applications were evaluated and approved by the Commission in May 2019 for operation in the 2020-21 school year.
Spokane Public Schools
• During the 2018-19 school year, two Spokane PS authorized charter public schools were in operation. Pride Prep continues to grow and add a new grade level each year, while Spokane International Academy reached full capacity serving grades K-8 as of the 2018-19 school year.
• As described above Spokane International Academy has recently secured a new location outside the boundaries of Spokane School District and has applied to transfer its authorization contract to the Charter Schools Commission.
• One charter public school was approved in June 2019 for a fall 2020 opening in time for the 2020-21 school year.
164

DRAFT – Not for distribution
6
Introduction
In addition to this short introduction and appended materials, this report is divided in three main sections and each section addresses one of the three requirements specified in RCW 28A.710.250.
I. The performance of the state's charter schools during the preceding school year, including a comparison of the performance of charter school students with the performance of academically, ethnically, and economically comparable groups of students in other public schools;
II. The State Board of Education’s assessment of the successes, challenges, and areas for improvement in meeting the purposes of the Washington Charter Public Schools Act (RCW 28A.710), including the Board's assessment of the sufficiency of funding for charter schools, the efficacy of the formula for authorizer funding; and
III. Any suggested changes in state law or policy necessary to strengthen the state's charter schools.
RCW 28A.710.250(2) stipulates that the annual report must be based on the reports submitted by each authorizer as well as any additional relevant data compiled by the State Board of Education. In accordance with RCW 28A.710.100(4) and WAC 180-19-210, the Washington Charter Schools Commission and Spokane Public Schools annual authorizer reports were submitted in a timely manner and include the status of the authorizer’s charter school portfolio, the authorizer's strategic vision for chartering and progress toward achieving that vision, and the academic and financial performance of all operating charter schools under its jurisdiction, including the progress of the charter schools based on the authorizer's performance framework. Certain information from these two authorizer reports is incorporated into this SBE annual report. The charter school authorizer annual reports are posted on SBE’s website.
Charter Schools in Washington
Washington State’s Charter School Act (RCW 28A.710) was enacted on April 3, 2016. The primary purpose of Washington’s Charter School Act is to allow flexibility to innovate in areas such as scheduling, personnel, funding, and educational programs to improve student outcomes and academic achievement of at-risk student populations. Washington charter public schools:
• Are public schools (not common schools) that are alternatives to traditional common schools,
• Are open to all children free of charge and by choice, with admission based only on age group, grade level, and school enrollment, and
• Must be nonsectarian and nonreligious.
Also, Washington charter public schools: • Must be a Washington nonprofit public benefit corporation with federal tax exempt
status under section 501(c)(3) of the IRS code,
165

DRAFT – Not for distribution
7
• Must be governed by a nonprofit board according to the terms of a renewable, five-year performance-based charter contract executed with an approved authorizer that contains at least the 32 elements required by RCW 28A.710.130,
• Are subject to the supervision of the OSPI and SBE, including accountability measures and the performance improvement goals adopted by SBE, to the same extent as other public schools, must provide a program of basic education, and participate in the statewide student assessment system, and
• Employ educators meeting the same certification requirements as traditional public school teachers, including background checks. Charter schools comply with local, state, and federal health, safety, parents' rights, civil rights, Individuals with Disabilities Education Improvement Act, Elementary and Secondary Education Act, and nondiscrimination laws applicable to school districts.
The charter schools in operation changes from year to year (Table 1). It is not unusual for emerging charter schools to annually add one or two grade levels to be served to accommodate the grade promotion of continuing students, meaning that the grade levels served at each charter school may change from year to year. The SBE is directed in RCW 28A.710.250 to issue the annual report on the performance of the state’s charter schools during the preceding year, meaning that this report is to elaborate on the academic performance of the charter schools operating during the 2018-19 school year.
Table 1: shows the charter public schools in operation over the most recent school years.
2016-17 2017-18 2018-19 2019-20 Ashé Prep*
Destiny Destiny Destiny
Excel Excel Excel
Rainier Valley Rainier Valley Rainier Valley
Impact Puget Sound Impact Puget Sound
PRIDE Prep PRIDE Prep PRIDE Prep PRIDE Prep
Rainier Prep Rainier Prep Rainier Prep Rainier Prep
SOAR SOAR SOAR
Spokane International Spokane International Spokane International Spokane International
Atlas Atlas Atlas
Olympus Olympus Olympus Olympus
Sierra Sierra Sierra Sierra
Willow Willow
*Note: after opening for the 2019-20 school year, Ashé Prep closed in late October 2019.
Together, the Washington Charter School Commission and Spokane Public Schools oversaw 12 charter public schools operating in Washington during the 2018-19 school year, (Table 1). Per
166

DRAFT – Not for distribution
8
the Washington State Report Card, 3363 students attended one of the 12 Washington public charter schools in the 2018-19 school year (Table 2).
Table 2: shows the charter schools operating for the 2018-19 school year
School Name Authorizer Home District
Grades Served Enrollment*
Green Dot Destiny State Charter School Commission Tacoma 6-8 162
Green Dot Excel State Charter School Commission Kent 7-10 189
Green Dot Rainier Valley Leadership Academy
State Charter School Commission Seattle 6-7, 9 253
Impact | Puget Sound* State Charter School Commission Tukwila K-1 180
PRIDE Prep Spokane Public Schools Spokane 6-10 498
Rainer Prep State Charter School Commission Highline 5-8 342
SOAR State Charter School Commission Tacoma K-5 220
Spokane International Academy Spokane Public Schools Spokane K-8 501
Summit Atlas State Charter School Commission Seattle 6-7 and
9-10 336
Summit Olympus State Charter School Commission Tacoma 9-12 194
Summit Sierra State Charter School Commission Seattle 9-12 374
Willow Public School* State Charter School Commission Walla Walla 6-8 114
*Note: the 2018-19 school year was the first year of operation for Puget Sound Elementary and the Willow Public School. The home district is the school district in which the charter school is physically situated. Data from the Washington State Report Card.
RCW 28A.710 directs the CSC to authorize high quality charter public schools throughout the state, especially schools that are designed to expand opportunities for at-risk students4. At-risk students are defined in statute as a student who has an academic or economic disadvantage that requires assistance or special services to succeed in educational programs. The
4 The “At risk” definition in statute connotes a defect in the person, and implies that certain student characteristics are defects. This stems from a deficit approach to people rather than the asset-based approach terminology consistent with the SBE characterization of these student groups. “Systemically underserved” may be more suitable verbiage. The SBE would recommend reconsidering the “at risk” language and would work collaboratively with the legislature, the Educational Opportunity Gap Oversight and Accountability Committee, the Charter School Commission, district charter authorizers, and the Office of Superintendent of Public Instruction in an effort to identify better terminology to recommend the Legislature use to replace “at risk.”
167

DRAFT – Not for distribution
9
demographics of students enrolled in charter schools during the 2018-19 school year are presented in Table 3.
• It is evident that the Washington charter public schools are, for the most part, serving “at-risk” students at a rate higher than the home school district (SD) and the state.
• Most of the charter public schools serve higher percentages of students living in poverty, higher percentages of students with disabilities, higher percentages of students of color, but lower percentages of English Learners than the state average or the home school districts.
Table 3: 2018-19 student demographics for charter schools, home school districts, and Washington.
Amer
ican
Indi
an/
Alas
kan
Nat
ive
Asia
n
Blac
k/Af
rican
Am
erica
n
Hisp
anic
/Lat
ino
Nat
ive
Haw
aiia
n/
Pacif
ic Is
land
er
Whi
te
Two
or M
ore
Race
s
Engl
ish L
earn
ers
Low
inco
me
Spec
ial E
duca
tion
Rainier Prep 0.3 7.3 40.4 36.8 0.9 7.0 7.6 38.6 75.4 13.5
Highline SD 0.9 14.6 14.6 38.9 3.9 20.9 6.1 28.8 69.0 16.8
Excel 1.1 4.8 39.7 12.2 1.6 28.6 12.2 10.1 65.1 20.6
Kent SD 0.3 19.8 12.5 22.5 2.5 32.9 9.5 20.8 53.1 12.1
Atlas 0.9 3.9 34.2 15.2 0.3 33.9 11.6 14.3 54.8 18.8
Rainier Valley 0.4 2.8 75.9 9.5 0.0 6.3 5.1 21.3 75.1 16.6
Sierra 0.0 8.8 34.5 11.0 0.3 31.3 14.2 8.3 40.4 17.1
Seattle PS 0.5 13.8 14.5 12.3 0.4 46.8 11.7 12.1 33.7 16.8
PRIDE Prep 7.0 2.8 12.9 2.0 1.0 73.7 0.6 0.6 54.6 17.1
SIA 1.0 1.6 2.4 11.0 0.0 70.3 13.8 2.0 43.9 13.8
Spokane PS 1.1 2.4 3.1 10.8 1.7 67.2 13.7 6.9 58.2 18.4
Destiny 1.2 1.2 29.6 17.9 3.1 32.1 14.8 9.3 85.8 19.8
Olympus 1.5 2.1 22.7 32.5 1.5 23.7 16.0 7.7 68.6 22.7
SOAR 0.5 0.5 27.7 19.1 5.5 22.7 24.1 4.1 50.9 17.3
Tacoma SD 1.1 9.1 13.9 20.9 3.1 38.3 13.6 10.9 61.6 15.9
Impact-Puget Sound 0.0 7.2 51.7 17.2 0.0 18.3 5.6 40.6 71.7 4.4
Tukwila SD 0.9 27.2 20.4 28.9 3.7 12.5 6.4 33.6 75.6 13.0
Willow 0.0 0.9 0.0 43.9 0.0 52.6 2.6 14.9 49.1 14.9
Walla Walla SD 0.4 1.2 0.7 40.6 0.1 53.8 3.3 13.3 58.4 15.6
Washington 1.4 7.7 4.4 23.1 1.1 54.4 8.0 11.5 42.4 14.1 Note: from the Washington State Report Card.
168

DRAFT – Not for distribution
10
Overview of the Academic Performance of Charter Schools
Drawing broad conclusions about the academic achievement of charter school students across the nation is challenging, as results vary from state to state, by school level, by presence and nature of a management organization, and results differ for specific student groups. The Center for Research on Education Outcomes (CREDO) is one of the most credible entities researching charter schools. In 2013, CREDO published the National Charter School study on the academic performance of students attending charter schools. The highlights of the study include the following:
• Students attending charter schools exhibit the equivalent of eight additional days of learning in reading and the same days of learning in math per year compared to their TPS peers.
• Black students, students in poverty, and English Learners appear to benefit from attending charter schools.
• Like TPS, charter school quality is uneven across the states and across schools.
In January 2019, CREDO released the results of a study on the Charter School Performance in the State of Washington covering the 2014-15, 2015-16, and 2016-17 school years. The authors rightfully acknowledge that the study might be judged to be premature, given the small number of schools and the short history of school operations. Nonetheless, the authors conclude that on average, charter school students in Washington experience annual growth in reading and math similar to the educational gains made by their matched peers5 who enroll in the TPS the charter school students would otherwise have attended.
Also in January 2019, SBE delivered a report to the educational committees of the Legislature and the Governor on the academic performance of charter school students for the 2017-18 school year. The study followed a rigorous design, and similar to the CREDO study covering earlier school years, concluded that charter school students perform approximately the same as demographically similar TPS students on the statewide ELA, math, and science assessments.
Section I - 2018-2019 Charter School Performance This section of the annual report on charter schools provides a comparison of the performance of charter school students with the average results for the home district and the state (Part A), and with the performance of academically, ethnically, and economically comparable groups of students in other public schools (Part B), in accordance with RCW 28A.710.250(2). Put another
5 The CREDO work relies on a peer-reviewed methodology utilizing a virtual control record (VCR) method of analysis. The VCR approach creates a “virtual twin” for each charter student who is represented in the data using student records that match the student’s demographic and academic characteristics. Potential matches are obtained from traditional public schools that serve as “feeders”. In many cases, the “virtual twin” is a composite of up to ten different students fitting the matching criteria. In theory, this “virtual twin” would differ from the charter student only on a single factor: attending a charter school.
169
DRAFT – Not for distribution
11
way, the state law requires that the charter school performance be conducted through two distinct analyses:
Part A is comprised of analyses on the academic performance or achievement of students at charter schools compared to the home district and the state. The charter school student performance data (percentage of students meeting standard on the statewide assessments) is presented in summary tables with accompanying descriptive text in Appendix A. Part B comprises the comparison of the academic performance of students at charter schools to similar students in traditional public schools (TPS). This analysis required the construction of a control group from which to make the comparison of student groups (Appendix A). The charter school student performance data compared to results from similar TPS students are presented in summary tables with accompanying descriptive text.
The findings presented here upon should be considered preliminary, as this is only the SBE’s third annual report assessing the performance of charter schools and charter school students. Also, the SBE has requested staff to conduct additional analyses which may be included in future reports. The SBE requests include but are not limited to the following analyses:
• Performance on the early learning assessment (Washington Kindergarten Inventory of Developmental Skills) by charter school students and similar students,
• Differences in performance based on gender, • Differences in performance based on race/ethnicity and subethnicity, • Differences in performance based on program participation, and • Comparison of performance to the school the charter school student came from.
This report elaborates on the performance of charter schools through data posted to the Washington State Report Card and other student results from the 2018-19 school year only. Because the SBE is expected to conduct additional analyses subsequent to issuing this report it would be premature to make any judgement about the performance of the charter schools until multiple years of results (five years) are available.
Another limitation of this work centers on the fact that only twelve charter schools are reported upon here and the results for approximately 1600 charter school students are included in this initial analysis. Additional charter schools are expected to be authorized in the coming years and the overall enrollment of the charter schools is expected to increase. The meaningfulness of the statistical analyses would be enhanced with the larger student counts and additional schools.
Summary of Findings 1. Regarding the percentage of students meeting standard on the statewide assessments
on the spring 2019 administration, the performance of the charter schools is mixed:
170

DRAFT – Not for distribution
12
a. Three charter schools posted results that were better than the home school district on the ELA, math, and science assessments.
b. Two charter schools posted results that were similar to the home school district on the ELA and math assessments.
c. Two charter schools posted results that were lower than the home school district on the ELA and math assessments.
d. Four charter schools posted mixed results in comparison to the performance of the home school district.
2. Information about the performance of charter schools on the WSIF is limited and mixed, as only five of the 12 charter schools earned a WSIF rating and those ratings ranged from a low of 1.53 to a high of 8.35.
3. Statewide, charter school students perform approximately the same as demographically and academically similar TPS students on the ELA assessment, but higher than TPS students on the math and science assessments. The effect sizes indicate that the differences are very small to small.
4. At every grade level in ELA, charter school students post scale scores similar to TPS students, while math scores for charter school students are higher for the 5th and 10th grades and similar for the other grade levels. The differences are very small to small for the most part.
5. Statewide, the student growth percentiles posted by charter school students were higher than the percentiles posted by TPS students for five of 10 measures and similar to TPS students on four of 10 measures.
6. Two charter schools had a reportable four year adjusted cohort graduation rate and both rates were similar to the state average, and one posted rates lower than the home school district while another posted rates similar to the home school district.
Academic Performance of Charter School Students in Washington
Part A – Academic Performance of the Charter Schools
RCW 28A.710.250(2) requires that the charter school performance include an analysis of the academic performance or achievement of students at charter schools compared to students in the home district and the state. The overall results and findings from the data analyses and data compilations from the Washington State Report Card are best characterized as mixed. Some of the charter schools performed higher, some performed similarly, and some performed lower than the home school district on the ELA, math, or science assessments (Table 4). The academic performance of all charter schools, home districts, and the state are tabulated in Appendix A.
Table 4: identifies the charter schools whose students perform generally similar to, better than, or lower than the home school district.
171

DRAFT – Not for distribution
13
Measure Charter Schools with a
Performance Better than the Home School District
Charter Schools with a Performance Similar to the
Home School District
Charter Schools with a Performance Lower than the Home School District
ELA Rainier Prep Spokane International Olympus
Destiny* PRIDE Prep Atlas
Excel* Rainier Valley SOAR* Sierra Willow
Math Rainier Prep Spokane International Olympus
Destiny* Excel* Rainier Valley Atlas Sierra
PRIDE Prep SOAR* Willow
Science* Rainier Prep Spokane International
Destiny* Excel* PRIDE Prep Olympus Sierra
Four Year ACGR*
Sierra Olympus
*Notes: no science assessment results are available for Rainier Valley, Atlas, SOAR, and Willow because of serving non-tested grades or data being suppressed to protect student privacy. No results for Impact Puget Sound because the school served only non-tested grades (K-1) in 2018-19. ACGR = Adjusted Cohort Graduation Rate. Destiny, Excel, and SOAR surrendered their charters shortly after the 2018-19 school year ended.
The winter 2019 Washington School Improvement Framework (WSIF) scores for the charter schools and the state averages are presented in Table 5. The WSIF ratings for the charter schools are best characterized as limited and mixed.
• Five charter public schools earned a WSIF rating ranging from a low of 1.53 to a high of 8.35 decile points.
• Five charter schools were not rated due to having been in operation for only one year, the 2017-18 school year.
• Two charter schools were not open in 2017-18, the latest year included in the winter 2019 WSIF.
The WSIF data file provides final decile ratings for student groups, provided that the minimum reporting requirements are met. Those final decile ratings are presented in Table 6. Again, the results for the charter public schools are best characterized as limited and mixed.
Table 5: shows the winter 2019 WSIF school rating in decile points for the All Students group by indicator.
172

DRAFT – Not for distribution
14
School Name Prof.
Decile SGP
Decile Grad. Rate
Decile
EL Progress
Decile
SQSS Decile
Total Decile*
Green Dot Destiny* 1.50 1.50 2.00 1.53 Green Dot Excel* 4.50 4.50 1.00 2.00 4.20
Green Dot Rainier Valley 2.00 6.50 5.00
PRIDE Prep 4.50 3.00 2.30 3.42
Rainer Prep 7.50 10.00 1.00 6.00 8.35
SOAR* 1.50 1.00
Spokane International 7.50 5.00 7.00 6.10
Summit Atlas 7.00 10.00 4.30
Summit Olympus 4.00 6.00
Summit Sierra 6.00 5.70 Washington Public
Schools 5.87 5.63 5.64 3.87 5.29 5.79
*Note: a final decile is not computed for a school for various reasons including too few reportable measures or the school having been open for less than two years. The winter 2020 WSIF is the first year in which Willow and Puget Sound will be included. Destiny, Excel, and SOAR surrendered their charters shortly after the 2018-19 school year ended.
Table 6: shows the winter 2019 WSIF school ratings (final decile) for all reportable student groups for the charter schools earning a final decile rating*.
School Name All
Stud
ents
Nat
ive
Amer
ican
Asia
n
Blac
k
Hisp
anic
Pacif
ic
Islan
der
Whi
te
Two
or
Mor
e Ra
ces
Li
mite
d En
glish
Low
In
com
e
Spec
ial
Educ
atio
n
Green Dot Destiny 1.53 1.53 1.25 1.68 1.88 1.93 1.28 1.25 1.28
Green Dot Excel 4.20 2.20 6.93 3.98 2.35 2.40 2.85
Pride Prep 3.42 5.2 2.12 3.83 6.13 2.80 3.73
Rainier Prep 8.35 9.95 8.50 8.60 8.40 9.60 5.78 8.60 4.60
SIA 6.10 6.08 5.75 6.58 5.68 2.15 Washington Public
Schools 5.79 3.24 8.12 4.34 4.89 3.88 6.43 6.18 3.52 4.63 3.12
*Note: a final decile is not computed for a school for various reasons including too few reportable measures or the school having been open for less than two years. Destiny and Excel surrendered their charters shortly after the 2018-19 school year ended.
The 2018-19 school year was the first in which charter public schools served 12th graders and posted an official four year adjusted cohort graduation rate (ACGR). However, it should be noted that Summit Olympus (Olympus) and Summit Sierra (Sierra) first opened for the 2017-18 school
173

DRAFT – Not for distribution
15
year, which means that the graduating class would have attended Sierra or Olympus for only two years at most and at least two years at another high school.
Olympus is physically situated in the Tacoma School District. The four year ACGR results are presented in Table 7.
• For all reportable student groups, the graduation rate for Olympus is approximately 10 to 17 percentage points lower than the rate for the corresponding Tacoma school district group.
• The graduation rate for the All Students group at Olympus was approximately six percentage points lower than the state graduation rate.
• The White student group and the FRL (Low Income) student group at Olympus graduated at a rate similar to the state average for the corresponding student groups.
• The Black student group posted a graduation rate a little higher than and the Hispanic student group posted a graduation rate a little lower than the state average for the corresponding groups.
Table 7: shows the four year graduation rates for reportable student groups for the charter schools, the home school districts, and Washington.
Class of 2019 Four Year Graduation Rate Olympus Tacoma
SD Sierra Seattle PS Washington
All Students 75.0 89.8 84.3 82.9 80.9 American Indian / Alaskan Native -- > 90.0 -- 62.1 61.7
Asian -- 92.6 82.2 85.4 90.4 Black / African American 76.2 89.6 > 91.0 77.1 73.6
Hispanic / Latino 72.2 89.4 72.7 68.7 75.7 Native Hawaiian / Pacific Islander -- 80.8 -- 57.1 74.4
White 81.3 91.0 78.6 89.2 82.8 Two or More Races -- 81.7 83.3 82.1 81.2
Limited English -- 86.3 83.3 61.7 62.4 Low-Income 72.1 85.8 87.9 73.3 72.2
Students with a Disability -- 71.1 -- 57.9 62.1 Female 79.4 91.4 88.2 86.7 84.0
Male 72.2 88.1 80.4 79.2 78.1 *Note: “--“means the data were suppressed to protect personally identifying information or the student group was not represented in the graduation cohort for the school. From the Washington State Report Card.
Sierra is physically situated in Seattle, so the school’s rates are compared to the rates for the Seattle Public Schools. The four year ACGR results for Sierra are presented in Table 7.
174

DRAFT – Not for distribution
16
• The graduation rate for the All Students group at Sierra is similar to the Seattle PS rate and a little higher than the state graduation rate.
• The Asian and White student groups at Sierra graduated at rates lower than the Seattle PS and lower than the state.
• The Black, FRL (Low Income), and English Learner student groups at Sierra graduated at rates higher than the Seattle PS and higher than the state.
• The Hispanic and Two or More races groups posted graduation rates similar to the corresponding groups for the Seattle PS and the state.
Part B – Academic Performance of Charter School Students and Similar TPS Students
Design of the Analysis
RCW 28A.710.250(2) requires that the charter school performance include a comparison of the academic performance of students at charter schools to demographically and academically similar TPS students. The overarching idea of the design is to create two groups differing only by charter school enrollment status and then to analyze the performance of the groups on the assessments. Any difference in performance may then be considered evidence of but not proof that attending a traditional public school versus a charter school results in a different performance on an educational outcome. However, it should be noted that differences in performance could be attributable to other factors not considered here, some of which include the following:
• Differences in educator quality or effectiveness, • Differences in educational materials, technology, and other facilities of the school, • Differences in student engagement and or parent/guardian engagement, • Differences in access to and attendance of before- and after-school support programs
and other enrichment activities • Differences in the curriculum delivered and the learning opportunities provided to
students, and • Differences in the number of exclusionary discipline events and number of days missed
by the students.
In the design, a control group was created following a student-by-student matching process to be as identical as possible to the comparison group of charter school students (Appendix A). In such a design, each charter school student is matched to or paired with a demographically and academically similar TPS student (“TPS twin”) and the group means are then compared using the Independent Sample t-Test. The effect size of the difference is reported as Cohen’s d.
• The comparison group is comprised of students enrolled in charter schools with valid scores for either or both of the Smarter Balanced (SBA) English language arts (ELA) and mathematics assessments. Most, but not all, of the comparison group members have
175

DRAFT – Not for distribution
17
valid results for the Washington Comprehensive Assessment of Science (WCAS) in the grade levels which are tested.
• A control group comprised of demographically and academically similar students enrolled in traditional public schools (TPS) was created through a one-by-one matching process described in Appendix A. TPS students in the control group usually, but not always, are enrolled in the home district in which the charter school is physically situated.
Statewide, charter school students perform approximately the same as similar TPS students on the ELA assessment, but higher than TPS students on the math and science assessments. The students at charter schools posted average student growth percentiles higher than the average student growth percentiles (SGPs) posted by TPS students for both ELA and math (Table 8). When the SGP medians are analyzed, the charter school students perform approximately the same as similar TPS students on the ELA SGPs, but higher than TPS students on the math SGPs.
Table 8: summarizes the performance of charter school students compared to the performance of demographically and academically similar TPS students.
Academic Measure
Charter School Students Perform Higher than TPS
Students
Charter School Students Perform
Similar to TPS Students
Charter School Students Perform Lower than TPS
Students
ELA (Average Scale Score) X
Math (Average Scale Score) X
Science (Average Scale Score) X Row intentionally left blank.
ELA (Mean SGP)* X
Math (Mean SGP)* X Row intentionally left blank.
ELA (Median SGP)* X
Math (Median SGP)* X
*Note: the student growth percentiles (SGP) are computed only for students in the 4th through the 8th grade with valid Smarter Balanced assessment results from the spring 2018 and spring 2019 assessment administrations. SGPs are not computed for science.
Results
For the analyses that follow, the comparison and control groups are aggregated from all of the charter schools. In other words, all of the charter school students are combined into one large group to assess for overall group differences. The results are summarized in Table 9. Both the 3rd grade results and the 10th grade results are included in the table below, notwithstanding the use of a different matching protocol.
176

DRAFT – Not for distribution
18
On the statewide ELA assessment, the comparison group (charter school students) perform no differently than the control group (TPS students). On the math and science assessments, the average scale score for the comparison group was a little higher than the average scale score for the control group. The findings are detailed as follows:
• The performance on the ELA assessment for the charter school students was similar to the performance of the TPS students.
• On the math assessment, the mean scale score for the comparison group (charter school students) was different and approximately 8.1 scale score points higher than the mean scale score for the TPS control group.
• The mean scale score for the comparison group (charter school students) was different and approximately 14.4 scale score points higher than the mean scale score for the control group (TPS students) on the science assessment.
For the math and science assessments, the mean scale score differences are statistically different but the differences are small or very small. Results are characterized as “practically significant” when the difference is medium or large. For the analyses below and for each of the content areas, the effect size described in Appendix A (Cohen’s d) is less than 0.20 which indicates little or no effect. In other words, the difference in group performance is statistically significant but the differences are very small to small.
Table 9: Scale score differences from spring 2019 statewide assessments based on charter school enrollment.
Assessment Number of Students
in each Group (N)
Mean Scale Score Comparison Group Charter Students
Mean Scale Score Control Group TPS Students
Mean Scale Score Difference*
ELA 1614 2551.1 2545.4 -5.69
Math** 1591 2534.2 2526.1 -8.06
Science** 468 692.7 678.2 -14.44 *Note: the mean difference is reported as the value for the non-charter school group minus the value for the charter school group. A negative mean difference indicates that the mean scale score for the comparison group (charter school students) was higher than the mean scale score for the control group (non-charter school students). A positive mean difference indicates that the mean scale score for the comparison group (charter school students) was lower than the mean scale score for the control group (non-charter school students). In a manner similar to the analysis above and as derived from the statewide ELA and math assessments, the comparison group (charter school students) performed differently and higher than the control group (TPS students) on the ELA SGPs and the math SGPs (Table 10). The charter school students made on average more than one year of academic growth in ELA and math, while the non-charter school (TPS) students made approximately one year of academic growth in ELA and math. The findings are as follows:
177

DRAFT – Not for distribution
19
• The ELA SGPs for the charter school students were different and higher than the ELA SGPs of the TPS students. The mean SGP for the comparison group was approximately 3.0 percentile points higher than the TPS students, meaning that the charter school students demonstrated greater academic growth than similar TPS students.
• On the math SGP calculations, the mean SGP for the comparison group (charter school students) was approximately 3.1 percentile points higher than the control group (TPS students). The means differed with the comparison group posting higher SGP, meaning that the charter school students demonstrated greater academic growth than similar TPS students.
For the ELA and math SGPs, the mean SGP differences are statistically different but the differences are very small to small. For the ELA and math SGPs, the effect size is less than 0.20 which indicates little or no effect. In other words, the differences between the group means are statistically significant but are not practically significant.
Table 10: shows the ELA and math growth model data (statistical means) for the control and comparison groups.
Assessment Number of Students
in each Group* (N)
Mean SGP Comparison Group Charter Students
Mean SGP Control Group TPS Students
Mean SGP Difference
ELA** 1352/1361 53.1 50.1 -3.02
Math** 1337/1321 52.4 49.4 -3.07 The mean difference is reported as the value for the non-charter school group minus the value for the charter school group. A negative mean difference indicates that the mean scale score for the comparison group (charter school students) was higher than the mean scale score for the control group (non-charter school students). A positive mean difference indicates that the mean scale score for the comparison group (charter school students) was lower than the mean scale score for the control group (non-charter school students).*Note: shows the number of student records for the control/comparison group. **Note: the double asterisk denotes the assessments where the group performances were statistically different.
A student growth percentile (SGP) is a derived percentile value or rank, and when aggregated, SGPs are often but not always reported as a median value, which usually differs from the mean (average) value. An evaluation of the medians shows that the comparison group (charter school students) performed similar to the control group (TPS students) on the ELA SGPs and better than the control group (TPS students) on the math SGP measure (Table 11). The findings are as follows:
• The ELA SGP median for the charter school students was similar to the ELA SGP median for the TPS students.
• On the math SGP analysis, the median SGP for the comparison group (charter school students was approximately 5.0 percentile points higher than the control group (TPS students). The medians differed with the comparison group posting a higher median
178

DRAFT – Not for distribution
20
SGP, meaning that the charter school students demonstrated greater academic growth than similar TPS students. The effect size indicates that the difference is very small.
• The charter school students made on average more than one year of academic growth in ELA and math (median SGPs greater than 50), while the non-charter school (TPS) students made approximately one year of academic growth (median SGP of 50) in ELA and math.
Table 11: shows the ELA and math growth model data (statistical medians) for the control and comparison groups.
Assessment Number of Students
in each Group* (N)
Median SGP Comparison Group Charter Students
Median SGP Control Group TPS Students
Median SGP Difference
ELA 1352/1361 54.0 50.0 -4.00
Math** 1337/1321 55.0 50.0 -5.00
The mean difference is reported as the value for the non-charter school group minus the value for the charter school group. A negative mean difference indicates that the mean scale score for the comparison group (charter school students) was higher than the mean scale score for the control group (non-charter school students). A positive mean difference indicates that the mean scale score for the comparison group (charter school students) was lower than the mean scale score for the control group (non-charter school students).*Note: shows the number of student records for the control/comparison group. **Note: the double asterisk denotes the assessments where the group performances were statistically different.
Section II – Meeting the purposes of Washington’s Charter Schools Act 28A.710.250 directs SBE to include in this annual report its assessment of the successes, challenges, and areas for improvement in meeting the purposes of the Washington Charter Public Schools Act (RCW 28A.710), including the Board's assessment of the sufficiency of funding for charter schools, and the efficacy of the formula for authorizer funding. The Board approves of school districts as charter school authorizers pursuant to RCW 28A.710.090. The Spokane Public Schools is the only local educational authority (LEA) to file an application and be approved as a charter public school authorizer. All charter school authorizer applications must include:
• Vision for chartering, • Plan to support that vision including budget information and commitment to quality
authorizing, • Draft application for charter schools to apply with the authorizer, • Draft performance framework that would guide the establishment of a charter contract, • Draft of the proposed renewals, revocation, and nonrenewal process, • Statement of assurance that the authorizer is committed to meeting expectations of a
charter authorizer and will engage in training with the state if provided or required, and
179

DRAFT – Not for distribution
21
• Statement assuring public accountability and transparency for all authorizing practices, decisions, and expenditures.
The Washington State Charter School Commission (CSC) and Spokane Public Schools continue as the only charter school authorizers in the state. Together, the Washington Charter School Commission and Spokane Public Schools oversaw 12 charter public schools operating in Washington during the 2018-19 school year, an increase of two schools compared to the 2017-18 school year. Per the Washington State Report Card, 3,363 students attended one of the 12 Washington public charter schools in the 2018-19 school year (Table 2). The total charter school enrollment represents an increase of approximately 1,000 students from the 2017-18 school year and the total charter school enrollment represents approximately 0.30 percent of all public school K-12 students.
RCW 28A.710 directs the CSC to authorize high quality charter public schools throughout the state, especially schools that are designed to expand opportunities for “at-risk students”. At-risk students are defined in statute as a student who has an academic or economic disadvantage that requires assistance or special services to succeed in educational programs. The term includes, but is not limited to:
• Students who do not meet minimum standards of academic proficiency, • Students who are at risk of dropping out of high school, • Students in chronically low-performing schools, students with higher than average
disciplinary sanctions, • Students with lower participation rates in advanced or gifted programs, • Students who are limited in English proficiency, • Students who are members of economically disadvantaged families, and • Students who are identified as having special educational needs.
The demographics of students enrolled in charter schools during the 2018-19 school year are presented in Table 3. It is evident that the Washington charter public schools are, for the most part, serving at-risk students at a rate higher than the home school district. The key developments for each of the authorizers during the 2018-18 school year are listed below:
Charter School Commission – Authorizer Developments
• During the 2018-19 school year, ten CSC authorized charter public schools were in operation, which represents an increase of two schools from the 2017-18 school year.
• In June 2019 the CSC was notified of the voluntary closure of three charter schools and in October, the voluntary closure of a fourth charter school.
• Twelve organizations submitted Notices of Intent to Apply for new charters, and seven applications to open new charter public schools were received. Three applications were
180
DRAFT – Not for distribution
22
deemed incomplete, and the other four new charter school applications were evaluated and approved by the Commission in May 2019 for operation in the 2020-21 school year.
Spokane Public Schools – Authorizer Developments
• During the 2018-19 school year, two Spokane PS authorized charter public schools were in operation. Pride Prep continues to grow and add a new grade level each year, while Spokane International Academy reached full capacity serving grades K-8 as of the 2018-19 school year.
• One charter public school was approved in June 2019 for a fall 2020 opening in time for the 2020-21 school year.
Other Highlights and Challenges
• The Washington State Charter Schools Association (WA Charters) was awarded a $20M competitive federal grant to support new and expanding public charter schools in Washington.
• Charter public schools are serving a higher share of many of the student groups prioritized in law, particularly students with IEPs and students in low-income families.
• Charter public school authorizers implemented comprehensive academic, financial, and organizational frameworks and protocols for high levels of charter public school accountability. This system allows for swift interventions and corrective action in instances of charter school non-compliance with their performance-based charter contract
Areas for Improvement: See Section III for potential law and policy changes. Funding Sufficiency for Charter Schools The legislature has acted in recent years to increase state funding and eliminate district’s reliance on local levy funds for basic education. The legislature intends that state funding for charter schools be distributed equitably with state funding provided for other public schools (RCW 28A.710.280(1)) but RCW 28A.710.030(3) does not entitle public charter schools to receive local levy funds. While state K-12 funding may be distributed equitably to charter public schools, the charter public schools are not entitled to any local levy funds, nor do the schools have access to facilities or capital bonds, as do traditional public schools.
181

DRAFT – Not for distribution
23
Public charter schools face three unique funding challenges with regard to funding.
• Startup funding: because funding is provided to public charter schools based on enrollment there are substantial front-end costs that must be addressed through other sources, such as private philanthropy, local fundraising, federal grants, or some combination of these sources. This makes it challenging for schools to start-up, particularly as schools move from the planning phase to implementation, finding and outfitting a space, and hiring staff.
• Capital funding: public charter schools do not have access to local bonds or state capital funds typically used to finance the purchase of land and school construction. As a result charter schools generally acquire leased space paid for through their operating budget.
• Operation budget: Charter public schools receive an allotment through OSPI based on student enrollments. For the purposes of funding allotment each charter public school is treated as a local education agency and receives funding equivalent to the amounts allotted through basic education. However, since charter public schools are not “common schools” the funding is provided from an account other than the state general fund. In addition, charter public schools are prohibited from receiving local levy funding or state level equalization funding. The state funding allotment, and any private funds received by the school must cover both capital and operating costs. A portion of the per-pupil funding allotment is also provided to the authorizer for specific oversight purposes outlined in RCW 28A.710.100. The amount transferred to the authorizer ranges from three to four percent based on a formula adopted by the SBE.
• Another concern identified by Spokane Public Schools subsequent to their annual report relates to disbursement policies rather than sufficiency. A challenge stems from the fact that apportionment is not paid out evenly across the 12 months. Districts receive a lower amount from the state in November and May because they receive tax levy dollars in those months, but charter public schools do not receive levy funds. This creates a significant cash flow challenge for charter public schools. These payment percentages can result in a charter public school appearing to fail to meet financial performance indicators in those two months, where they would otherwise meet the indicators if the apportionment payment percentages were even across all months.
The CSC contends that the current regulatory structure creates a funding gap in which public charter schools receive less public funding than traditional public schools, resulting in a system in which funding for charter public schools is both insufficient and inequitable. In June 2019, the Commission adopted an educational equity policy driving the Commission’s commitment to advocate for equitable funding for all charter public schools at the state and philanthropic levels.
• The CSC contends that the current funding model, in which students in charter public schools receive significantly lower total public funding than students in non-charter public schools represents a substantial inequity, making sustainability a challenge. In the annual authorizer report (p. 44-46), the CSC provides an analysis enumerating the
182

DRAFT – Not for distribution
24
disparate funding of charter schools. The charter school’s inability to access local levy revenue poses a significant obstacle not faced by traditional public schools.
• The CSC authorizer report (p. 45) includes an analysis of the other support (local fundraising, grants, and gifts) beyond other support provided by the state and federal government. While the charter schools receive substantial resources in the category of other support, the additional resources do not fully offset the funding inequities brought about through the lack of access to local levy revenue.
• Lack of access to capital funding for Washington charter public schools exacerbates the funding challenges. In the 2018-19 school year, charter public schools spent an average of 10 to15 percent of their state apportionment revenue on facilities; and
Three charter public schools voluntarily closed in June after the 2018-19 school year ended and another charter public school voluntarily closed shortly after the 2019-20 school year began. In response to a letter from the SBE to the CSC in October requesting additional information on the closures of the four charter public schools and that the information on the closures be included in the Charter School Commission’s annual authorizer report. The requested information is contained in the CSC’s authorizer report and is summarized below:
o SOAR Academy (SOAR) in Tacoma experienced financial challenges from the onset of operations and was unable to overcome the financial obstacles. The CSC contends that SOAR “…served significant numbers of systemically underserved students who required expensive supports and given charter public schools inability to access in accessing local levy revenue, SOAR was reliant on private funding to offset these costs.” Over much of the 2018-19 school year, SOAR’s board of directors sought and met with several management teams to lead the school, but the meetings did not culminate in the identification of a new management team. In combination, the expense burdens and the lack of a suitable management team further added to SOAR’s challenges.
o Green Dot Public School Washington State voluntarily surrendered the charter contracts for Destiny Middle School in Tacoma and Excel Middle School in Kent. The CSC was in the process of issuing Corrective Action to the two Green Dot schools “…regarding the low academic performance at Destiny and Excel…” Per the Commission’s authorizer report, under enrollment, significant long-term debt obligations, and Green Dot’s inability to control costs led to the voluntary surrendering of the school contracts.
o Ashé Preparatory Academy (Ashé) Directors surrendered their charter contract in October 2019 after operating for approximately one month into the 2019-20 school year. The school faced facility, staffing, and leadership challenges that when coupled with under enrollment, were insurmountable. The Commission’s report includes additional information on the circumstances surrounding the school’s closure.
183
DRAFT – Not for distribution
25
Efficacy of the Funding for Charter School Authorizers In accordance with RCW 28A.710.110, SBE has, through rule-making, established a statewide formula for an authorizer oversight fee, with a sliding scale based on number of schools authorized, not to exceed four percent of each charter school’s annual funding (WAC 180-19-060). The fee structure stipulates that an authorizer of 10 or more schools would be set at three percent of the state operating funding allocation for each authorized school. The rate is set at four percent of the state operating funding allocation for an authorizer of fewer than ten schools.
State law (RCW 28A.710.110(4)) stipulates that an authorizer must use its oversight fee exclusively for the purpose of fulfilling its charter school authorizing duties (under RCW 28A.710.100). The Spokane Public Schools suggests a statutory change that would allow more flexibility in the allowable uses of the authorizer fee to enable the authorizer to assist the charter schools in areas of mutual benefit to both the authorizer and the school if excess funds are available.
Section III - Recommended Changes to State Law or Policy The Board has identified has identified two areas where changes to WAC may be warranted:
• The Board will propose revisions to the rules outlining the application process for districts to become a charter school authorizer. The current rules include steps that go beyond the requirements in statute. The additional steps in rule extend the timeline for districts to become authorizers and add unnecessary complexity to the process. Revised rules could streamline and shorten the process while maintaining the integrity of the application process.
• The Board is responsible for establishing the authorizer fee structure. Spokane Public Schools has asked for greater flexibility in the use of fees. The Board agrees with the need for greater flexibility and finds that the revision would likely require statutory change. However, in reviewing the request SBE staff also noted that that the fee structure is not necessarily aligned to workload. The Board will explore alternatives to the current formula to better align with the cost drivers associated with authorization.
In addition, the Board also recommends that OSPI review disbursement policies for charter public schools to address cash flow issues associated with uneven distribution of funds through the year. Finally, the Board notes additional recommendations raised in the authorizer reports shown in the tables below. In general these recommendations would be improvements to the law. For example, timing of the annual report is an issue given the timeline for availability of data and would allow more time for the Board to respond to the authorizer reports. Both Spokane Public Schools and the CSC identify an issue with the statutory language in RCW 28A.710.050 (3). The language in statute refers to the commission where, given the context, it should refer to the “authorizer”. The Board supports the recommendation to revise the language if the legislation opening this section of law is offered.
184

DRAFT – Not for distribution
26
The Charter School Commission has identified a number of recommended statutory changes it would like to see for the purpose of strengthening the state’s charter schools.
Charter School Commission Recommendations
• 28A.710.050(3): Change, “approved by the commission” to “approved by the authorizer,” which appears to be the intent of the provision.
• 28A.710.070(8): Change, “The commission shall reside within the office of the superintendent of public instruction for administrative purposes only,” to “The Commission may hire an executive director to carry out the duties of the commission. All commission employees must reside within the office of the superintendent of public instruction for administrative purposes only,” which is consistent with the administrative structure of other governing bodies similar to the Commission.
• Add 28A.710.070(10) to read as follows, “The executive director may employ members, who shall be exempt from chapter 41.06 RCW, and any additional staff members as are necessary to administer this chapter and such other duties as may be authorized by law. The employment of such additional staff shall be in accordance with chapter 41.06 RCW, except as otherwise provided.” which is consistent with the administrative structure of other governing bodies similar to the Commission.
• 28A.710.250(1): Change, “By December 1st of each year” to “By March 1st of each year” a later date to enable the authorizer annual reports and the SBE annual report to include graduation and Washington School Improvement Framework data.
• Amend WAC 180-19-210(1) to change “no later than November 1st of each year” to later date for the same reasons provided above.
Spokane Public Schools has also identified, in its annual report to SBE, potential changes to RCW 28A.710 that the district believes would strengthen the state’s charter schools and authorizing practices.
Spokane Public Schools Recommendations
• 28A.710.050(3): Change, “approved by the commission” to “approved by the authorizer,” which appears to be the intent of the provision.
• 28A.710.100(4)(b): In “The academic and financial performance of all operating charter schools,” insert “organizational.” Adding organizational will better align this statute to the “board performance and stewardship” in .170(2)(h) and creates consistency with NACSA’s Principles & Standards (required in this section) and with current practice.
• 28A.710.250(1): Change “By December 1st of each year” to a later date to enable the authorizer annual reports and the SBE annual report to include graduation and Achievement Index data.
• 28A.710.110(4): Increase the flexibility in the allowable use of the authorizer fee to enable the authorizer to assist the charter schools in areas of mutual benefit to both the authorizer and the school.
185

DRAFT – Not for distribution
27
Appendix A: Detailed Performance Analysis Part A: Academic Performance of the Charter Schools Fast Facts: Green Dot Destiny
Charter contract surrendered in June 2019
• Destiny served 162 students in the 6th, 7th, and 8th grades in the 2018-19 school year.
• Approximately 30 percent of the Destiny’s students identify as Black which is more than double the rate of the Tacoma SD and seven times the state rate. The Destiny FRL rate (86 percent) is double the state FRL rate and approximately 24 percentage points higher than the Tacoma SD.
• Since the 2016-17 school year, nearly all reportable student groups improved in ELA, math, and science proficiency rates.
For the 2018-19 school year, the following assessment results from Figure A1 are noteworthy:
• For ELA proficiency, reportable student groups at Destiny perform similar to the corresponding groups for the Tacoma SD, but lower than the rate for the corresponding state rate.
• For math proficiency, reportable student groups at Destiny perform a little lower than the corresponding groups for the Tacoma SD and the corresponding state rate.
• The science results are mixed as some student groups (e.g. Hispanic) at Destiny outperform the Tacoma SD and the state, while other groups (e.g. White) at Destiny perform lower than the district and the state.
186
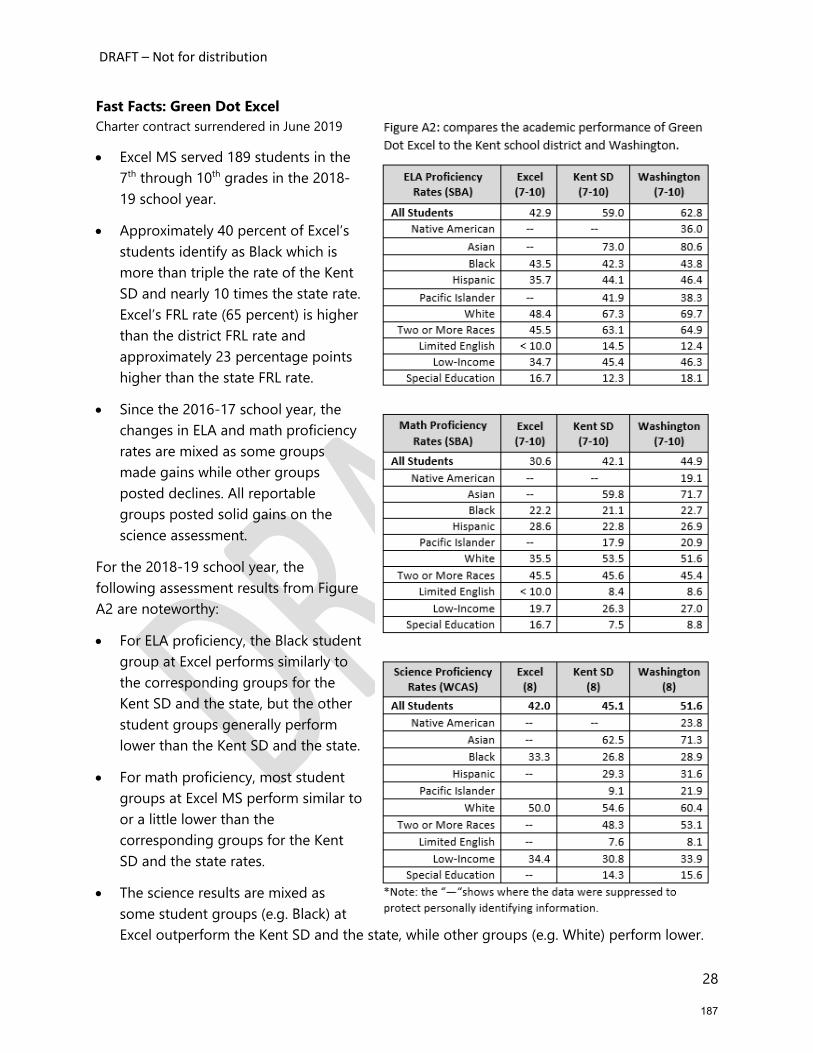
DRAFT – Not for distribution
28
Fast Facts: Green Dot Excel Charter contract surrendered in June 2019
• Excel MS served 189 students in the 7th through 10th grades in the 2018-19 school year.
• Approximately 40 percent of Excel’s students identify as Black which is more than triple the rate of the Kent SD and nearly 10 times the state rate. Excel’s FRL rate (65 percent) is higher than the district FRL rate and approximately 23 percentage points higher than the state FRL rate.
• Since the 2016-17 school year, the changes in ELA and math proficiency rates are mixed as some groups made gains while other groups posted declines. All reportable groups posted solid gains on the science assessment.
For the 2018-19 school year, the following assessment results from Figure A2 are noteworthy:
• For ELA proficiency, the Black student group at Excel performs similarly to the corresponding groups for the Kent SD and the state, but the other student groups generally perform lower than the Kent SD and the state.
• For math proficiency, most student groups at Excel MS perform similar to or a little lower than the corresponding groups for the Kent SD and the state rates.
• The science results are mixed as some student groups (e.g. Black) at Excel outperform the Kent SD and the state, while other groups (e.g. White) perform lower.
187
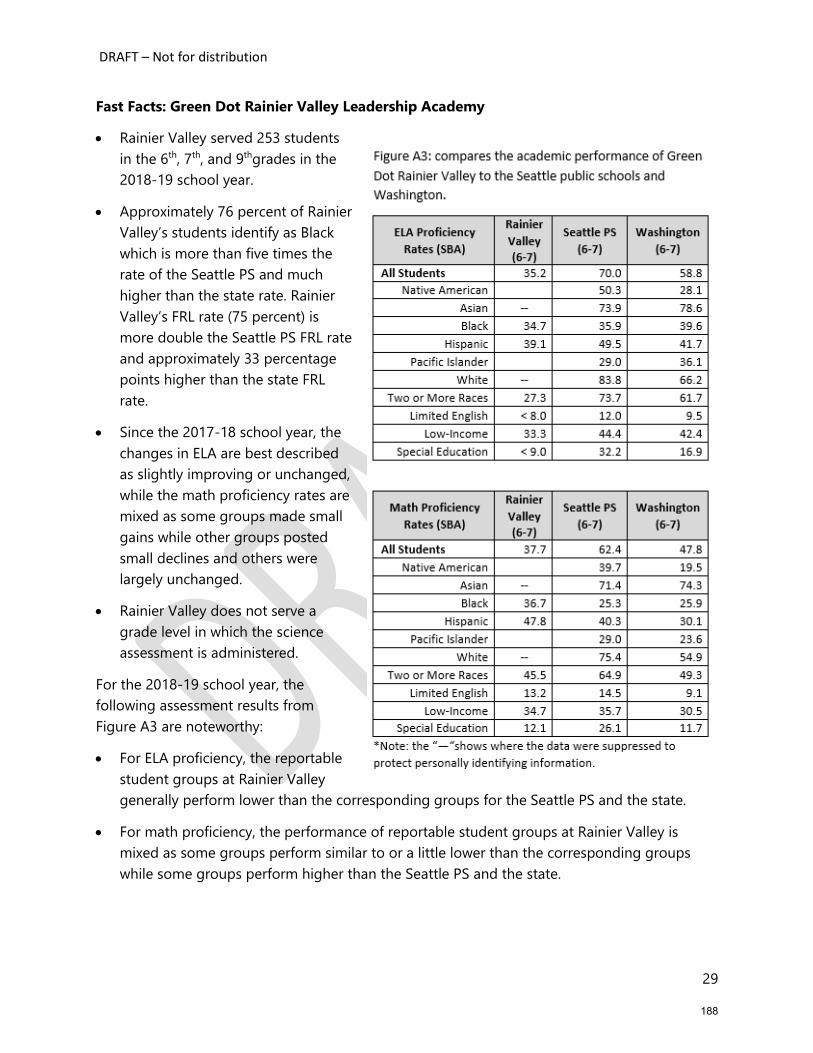
DRAFT – Not for distribution
29
Fast Facts: Green Dot Rainier Valley Leadership Academy
• Rainier Valley served 253 students in the 6th, 7th, and 9thgrades in the 2018-19 school year.
• Approximately 76 percent of Rainier Valley’s students identify as Black which is more than five times the rate of the Seattle PS and much higher than the state rate. Rainier Valley’s FRL rate (75 percent) is more double the Seattle PS FRL rate and approximately 33 percentage points higher than the state FRL rate.
• Since the 2017-18 school year, the changes in ELA are best described as slightly improving or unchanged, while the math proficiency rates are mixed as some groups made small gains while other groups posted small declines and others were largely unchanged.
• Rainier Valley does not serve a grade level in which the science assessment is administered.
For the 2018-19 school year, the following assessment results from Figure A3 are noteworthy:
• For ELA proficiency, the reportable student groups at Rainier Valley generally perform lower than the corresponding groups for the Seattle PS and the state.
• For math proficiency, the performance of reportable student groups at Rainier Valley is mixed as some groups perform similar to or a little lower than the corresponding groups while some groups perform higher than the Seattle PS and the state.
188

DRAFT – Not for distribution
30
Fast Facts: Rainier Prep
• Rainier Prep served 342 students in the 5th through 8th grades in the 2018-19 school year.
• Approximately 40 percent of Rainier Prep’s students identify as Black which is triple the rate of the Highline SD and nearly ten times higher than the state rate. Rainier Prep’s FRL rate (75 percent) is a little higher than the Highline SD FRL rate and approximately 33 percentage points higher than the state FRL rate.
• Since the 2016-17 school year, the changes in ELA, math, and science proficiency rates for Rainier Prep student groups are best described as slightly improving or unchanged.
For the 2018-19 school year, the following assessment results from Figure A4 are noteworthy:
• For ELA proficiency, the reportable student groups at Rainier Prep perform uniformly higher than the corresponding groups for the Highline SD and similar to or better than the corresponding measure for the state.
• For math proficiency, the performance of reportable student groups at Rainier Prep is substantially better than the corresponding measures for groups from the Highline SD and the state.
• For science, Rainier Prep student groups outperform the corresponding groups for both the Highline SD and the state.
189

DRAFT – Not for distribution
31
Fast Facts: PRIDE Prep
• PRIDE Prep served 498 students in the 6th through 10th grades in the 2018-19 school year.
• Approximately 13 percent of PRIDE Prep’s students identify as Black which is four times the rate of the Spokane PS and approximately 74 percent White students which is a little higher than the Spokane PS. PRIDE Prep’s FRL rate (55 percent) is a little lower than the Spokane PS FRL rate and 13 percentage points higher than the state FRL rate.
• Since the 2016-17 school year, the ELA and science proficiency rates are slightly improved, while the math proficiency rates for PRIDE Prep student groups mostly declined.
For 2018-19, the following assessment results from Figure A5 are noteworthy:
• For ELA proficiency, the results for the student groups at PRIDE Prep are mixed as some groups (e.g. Native American) outperform the district and state, while other groups (e.g. White) perform lower than the Spokane PS and the state.
• For math proficiency, the results for the student groups at PRIDE Prep are mixed as some groups (e.g. Native American) outperform the district and state, while other groups (e.g. Asian and White) perform lower than the district and state.
• For science, the performance of the student groups at PRIDE Prep is mixed as some groups (e.g. Students with a Disability) outperform the district and state, while other groups perform lower than the Spokane PS and the state.
190

DRAFT – Not for distribution
32
Fast Facts: Spokane International Academy
• Spokane International Academy (SIA) served 501 students in kindergarten through 8th grades in the 2018-19 school year.
• Approximately 70 percent of SIA’s students identify as White which is similar to the Spokane PS and higher than the state rate. SIA’s FRL rate (44 percent) is 14 percentage points lower than the Spokane PS FRL rate and comparable to the state FRL rate.
• Since the 2016-17 school year, the ELA proficiency rates are mostly unchanged or slightly lower, while the math and science proficiency rates for SIA’s student groups are best described as declining.
For the 2018-19 school year, the following assessment results from Figure A6 are noteworthy:
• For ELA proficiency, the reportable student groups at SIA perform uniformly higher than the corresponding groups for the Spokane PS and better than the corresponding measure for the state.
• For math proficiency, the performance of reportable student groups at SIA is mostly similar to or better than the corresponding measures for groups from the Spokane PS and the state.
• For science, the reportable SIA student groups mostly outperform the corresponding groups for both the Spokane PS and the state.
191

DRAFT – Not for distribution
33
Fast Facts: SOAR Academy Charter contract surrendered in June 2019
• SOAR Academy served 220 students in kindergarten through the 5th grade in the 2018-19 school year.
• Approximately 28 percent of SOAR’s students identify as Black which is double the rate of the Tacoma SD and much higher than the state rate. SOAR’s FRL rate (51 percent) is approximately 10 percentage points lower than the Tacoma SD FRL rate and approximately nine percentage points higher than the state FRL rate.
• Since the 2016-17 school year, the changes in ELA and math proficiency rates for SOAR student groups are mostly improved. SOAR did not have reportable results for science for the 2018-19 school year.
For the 2018-19 school year, the following assessment results from Figure A7 are noteworthy:
• For ELA proficiency, the reportable student groups at SOAR perform uniformly and substantially lower than the corresponding groups for the Tacoma SD and the corresponding measure for the state.
• For math proficiency, the performance of reportable student groups at SOAR is uniformly and substantially lower than the corresponding measures for groups from the Tacoma SD and the state.
• All of the results for science were suppressed to protect student privacy.
192
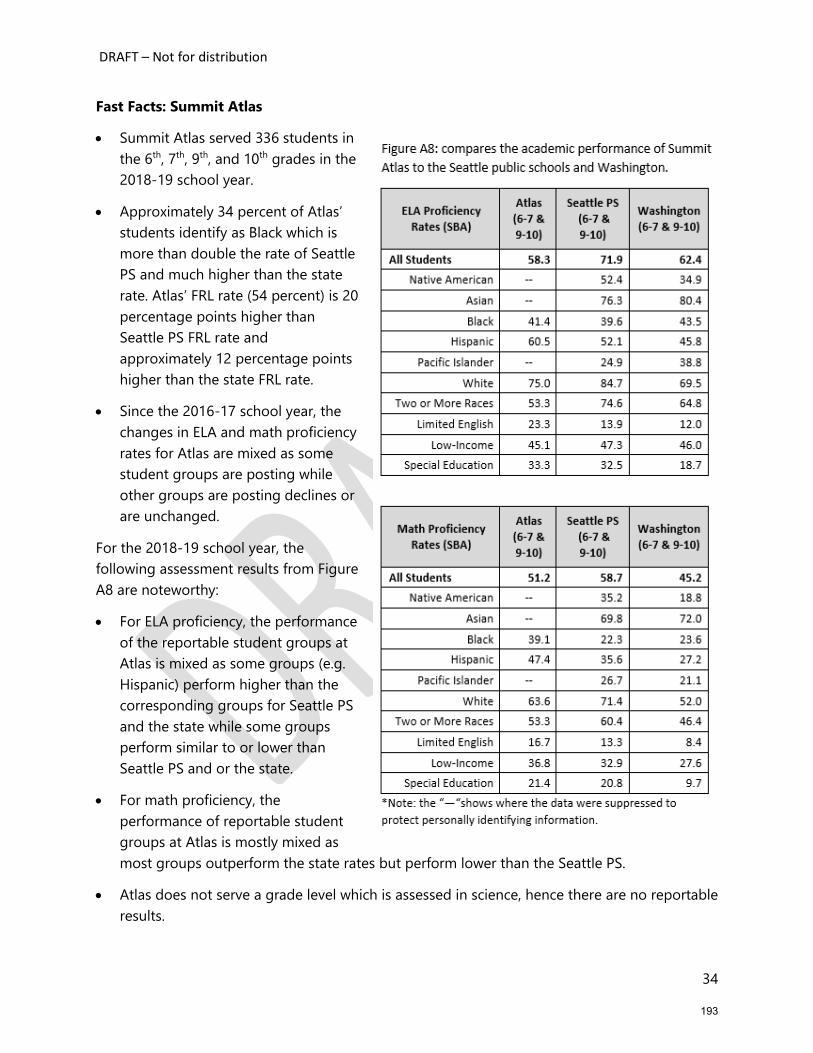
DRAFT – Not for distribution
34
Fast Facts: Summit Atlas
• Summit Atlas served 336 students in the 6th, 7th, 9th, and 10th grades in the 2018-19 school year.
• Approximately 34 percent of Atlas’ students identify as Black which is more than double the rate of Seattle PS and much higher than the state rate. Atlas’ FRL rate (54 percent) is 20 percentage points higher than Seattle PS FRL rate and approximately 12 percentage points higher than the state FRL rate.
• Since the 2016-17 school year, the changes in ELA and math proficiency rates for Atlas are mixed as some student groups are posting while other groups are posting declines or are unchanged.
For the 2018-19 school year, the following assessment results from Figure A8 are noteworthy:
• For ELA proficiency, the performance of the reportable student groups at Atlas is mixed as some groups (e.g. Hispanic) perform higher than the corresponding groups for Seattle PS and the state while some groups perform similar to or lower than Seattle PS and or the state.
• For math proficiency, the performance of reportable student groups at Atlas is mostly mixed as most groups outperform the state rates but perform lower than the Seattle PS.
• Atlas does not serve a grade level which is assessed in science, hence there are no reportable results.
193

DRAFT – Not for distribution
35
Fast Facts: Summit Olympus
• Summit Olympus served 194 students in the 9th through 12th grades in the 2018-19 school year.
• Approximately 23 percent of Olympus’ students identify as Black and 33 percent identify as Hispanic, both of which are approximately 10 to 12 percentage points higher than the Tacoma SD and higher than the state rate. Olympus’ FRL rate (69 percent) is seven percentage points higher than the Tacoma SD FRL rate and 27 percentage points higher than the state FRL rate.
• Since the 2016-17 school year, the reportable student groups are posting improvements in the ELA and math proficiency rates, but declines on the science assessment.
For the 2018-19 school year, the following assessment results From Figure A9 are noteworthy:
• For ELA proficiency, the student groups at Olympus perform uniformly higher than the groups for the Tacoma SD and the state.
• For math proficiency, the performance of reportable student groups at Olympus is substantially better than the corresponding measures for groups from the Tacoma SD and similar to or better than the corresponding state rate.
• For science, Olympus student groups perform as well as or better than the corresponding groups for both the Tacoma SD and the state.
194

DRAFT – Not for distribution
36
Fast Facts: Summit Sierra
• Summit Sierra served 374 students in the 9th through 12th grades in the 2018-19 school year.
• Approximately 34 percent of Sierra’s students identify as Black which is more than double the rate of Seattle PS and much higher than the state rate. Sierra’s FRL rate (40 percent) is six percentage points higher than Seattle PS FRL rate and comparable to the state FRL rate.
• Since the 2016-17 school year, the proficiency rates for ELA and science are mostly declining, while the proficiency rates for math are mixed as some groups (e.g. Black) are improving and others are declining.
For the 2018-19 school year, the following assessment results from Figure A10 are noteworthy:
• For ELA proficiency, the student groups at Sierra perform mostly lower than the corresponding groups for Seattle PS, but the Limited English and Students with a Disability groups outperform the Seattle PS and the state.
• For math proficiency, the performance of student groups at Sierra is mixed as the groups perform similar to, better than, or lower than the corresponding measures for groups for the Seattle PS and or the state.
• For science, Sierra student groups perform lower than the groups for both the Seattle PS and the state, except for the White student group which performs higher than both.
195

DRAFT – Not for distribution
37
Fast Facts: Willow Public School
• Willow Public School (Innovations School) served 114 students in the 6th through 8th grades in the 2018-19 school year.
• Approximately 44 percent of Willow’s students identify as Hispanic which is similar to the Walla Walla SD rate and nearly double the state rate. Willow’s FRL rate (49 percent) is lower than the Walla Walla SD FRL rate (58 percent) and approximately six percentage points higher than the state FRL rate.
• Willow Public School opened in the 2018-19 school year, meaning that a performance baseline has just recently been set making any type of trend analysis impossible.
For the 2018-19 school year, the following assessment results from Figure A11 are noteworthy:
• For ELA proficiency, the reportable student groups at Willow mostly perform lower than the corresponding groups for the Walla Walla SD and the state.
• For math proficiency, student groups at Willow mostly perform lower than the corresponding groups for the Walla Walla SD and the state.
• For science, Willow served a very small number of 8th graders in 2018-19. As a result of the small number of students assessed in science, all results for the science assessment were suppressed to protect student privacy.
Fast Fact: Impact Puget Sound
• Impact Puget Sound served 180 students in kindergarten and the 1st grades in the 2018-19 school year. No assessment results are available.
196

DRAFT – Not for distribution
38
Part B: Performance of Charter School Students and Similar TPS Students.
Data Sources and Data Processing
Between late September and mid-December, the Office of the Superintendent of Public Instruction (OSPI) Office of School Information provided SBE with separate de-identified student enrollment, assessment, absence, and student growth percentile files for the 2018-19 school year to complete the required analyses. The assessment file provided by the OSPI contained results for the Washington Access to Instruction and Measurement (WA-AIM) and the statewide Smarter Balanced assessments. A very small percentage of students at charter schools participated in the WA-AIM, the assessment for selected students with severe disabilities. Because the WA-AIM differs greatly from the SBA and because WA-AIM scores vary considerably based on disability type, SBE made the decision to exclude the WA-AIM results from the analyses presented here. The findings in Part B are derived solely from the SBA ELA and math and the WCAS science assessments for the charter school and TPS student groups. Group differences were evaluated using the Independent Samples t-Test and the group differences are reported as follows.
• A statistically similar performance between groups is where a t-test of the group means resulted in a value of p > 0.050. In this case, the null hypothesis of no difference between the means cannot be rejected. In other words, the researcher must conclude that the means do not differ and the performance is statistically similar.
• A statistically different performance between groups is where a t-test of the group means resulted in a value of p ≤ 0.050. In this case, the null hypothesis of no difference between the means is rejected. The researcher concludes that the means differ and the performance is described as statistically different.
While it is important to report on the statistical significance of group means in work of this nature, it is at least equally important to quantify the magnitude of the effect of the treatment or experimental variable (Table A12). When reporting on t-test results, Cohen’s d is a standardized measure of effect size which provides additional context regarding the magnitude of the difference between group means. For the Independent sample t-test, Cohen's d is determined by calculating the mean difference between the two groups, and then dividing the result by the pooled standard deviation.
Results are characterized as “practically significant” when the difference is medium or large. For many of the analyses reported upon here, the effect size (Cohen’s d) is less than 0.20 which indicates negligible effect. In other words, the difference between the group means is statistically significant but of little or no practically significant in a real life situation.
197

DRAFT – Not for distribution
39
Table A12: shows how the effect size (Cohen’s d) is described for the purpose of providing additional context as to the practical significance or meaningfulness of an experimental treatment.
Cohen’s d From
Cohen’s d To Description of Effect Size from the Experiment al Variable
≤ 0.20 Effect from the treatment is trivial, negligible, or very small
0.20 < 0.50 Effect from the treatment is small.
0.50 < 0.80 Effect from the treatment is medium.
≥ 0.80 Effect from the treatment is large.
This work primarily relies on the statewide assessments in ELA and math developed by the Smarter Balanced Assessment Consortium (SBAC). Based on the items answered correctly, a scale score of approximately 2300 to 2800 is assigned to each student. A scale score of approximately 2425 to 2675 (depending on grade level and content area) is required to meet standard or be deemed as proficient. On the science assessments, scale scores range from approximately 340 to 1190 and a scale score of 700 is required to meet standard or be deemed as proficient. Because the range of scale scores differs by grade level, it is necessary to evaluate for scale score differences by grade level.
In addition to the average scale score by group, the scale score mean difference is reported and provides a meaningful measure of charter school student performance in comparison to the TPS student performance. The mean difference is reported as the value for the TPS group minus the value for the charter school group. A negative mean difference indicates that the mean scale score for the comparison group (charter school students) was higher than the mean scale score for the control group (TPS students). A positive mean difference indicates that the mean scale score for the comparison group (charter school students) was lower than the mean scale score for the control group (TPS students).
The Independent Sample t-Test was conducted to determine whether the comparison group (charter school students) performed differently than the control group (TPS students) on the statewide ELA, math, and science assessments. For the analyses in Part B, the comparison and control groups are aggregated from all of the charter schools. In other words, all of the charter school students are combined into one large group to assess for overall group differences.
Design and Statistical Methods
The overarching idea of the design is to create two groups differing only by charter school enrollment status and then to analyze the performance of the groups on the assessments. Any difference in performance may then be attributed to attending a traditional public school versus a charter school. However, it must be noted that differences in performance can also be attributed to other factors not considered here, some of which include the following:
198
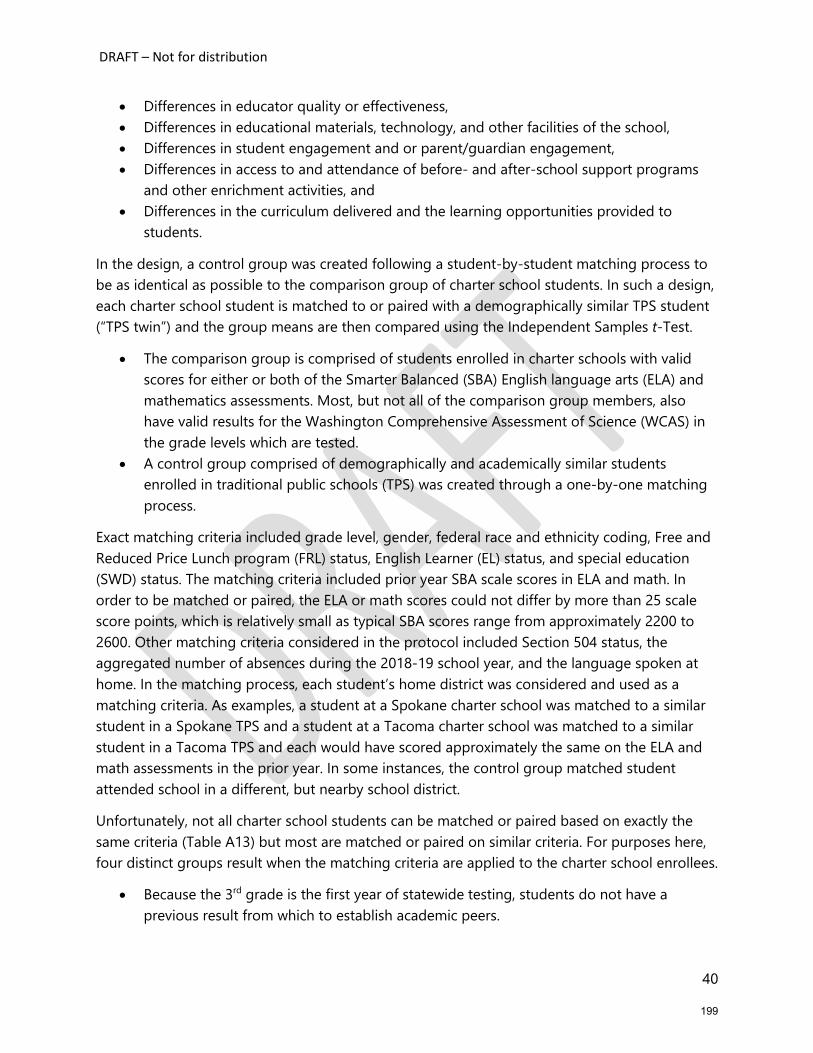
DRAFT – Not for distribution
40
• Differences in educator quality or effectiveness, • Differences in educational materials, technology, and other facilities of the school, • Differences in student engagement and or parent/guardian engagement, • Differences in access to and attendance of before- and after-school support programs
and other enrichment activities, and • Differences in the curriculum delivered and the learning opportunities provided to
students.
In the design, a control group was created following a student-by-student matching process to be as identical as possible to the comparison group of charter school students. In such a design, each charter school student is matched to or paired with a demographically similar TPS student (“TPS twin”) and the group means are then compared using the Independent Samples t-Test.
• The comparison group is comprised of students enrolled in charter schools with valid scores for either or both of the Smarter Balanced (SBA) English language arts (ELA) and mathematics assessments. Most, but not all of the comparison group members, also have valid results for the Washington Comprehensive Assessment of Science (WCAS) in the grade levels which are tested.
• A control group comprised of demographically and academically similar students enrolled in traditional public schools (TPS) was created through a one-by-one matching process.
Exact matching criteria included grade level, gender, federal race and ethnicity coding, Free and Reduced Price Lunch program (FRL) status, English Learner (EL) status, and special education (SWD) status. The matching criteria included prior year SBA scale scores in ELA and math. In order to be matched or paired, the ELA or math scores could not differ by more than 25 scale score points, which is relatively small as typical SBA scores range from approximately 2200 to 2600. Other matching criteria considered in the protocol included Section 504 status, the aggregated number of absences during the 2018-19 school year, and the language spoken at home. In the matching process, each student’s home district was considered and used as a matching criteria. As examples, a student at a Spokane charter school was matched to a similar student in a Spokane TPS and a student at a Tacoma charter school was matched to a similar student in a Tacoma TPS and each would have scored approximately the same on the ELA and math assessments in the prior year. In some instances, the control group matched student attended school in a different, but nearby school district.
Unfortunately, not all charter school students can be matched or paired based on exactly the same criteria (Table A13) but most are matched or paired on similar criteria. For purposes here, four distinct groups result when the matching criteria are applied to the charter school enrollees.
• Because the 3rd grade is the first year of statewide testing, students do not have a previous result from which to establish academic peers.
199

DRAFT – Not for distribution
41
• Because 9th graders are not assessed, academic peers for the 10th graders were established on the basis of 8th grade testing two years prior.
• Science is assessed every three years (5th, 8th, and 11th grades) which is not conducive to establishing academic peers based on science results.
Figure A13: shows the matching criteria used in creating the control group of TPS students.
Matching Criteria
3rd Grade Students
4th to 8th Grade Students
10th Grade Students
11th Grade Students*
Grade Yes, exact Yes, exact Yes, exact Yes, exact Gender Yes, exact Yes, exact Yes, exact Yes, exact Race/Ethnicity Yes, exact Yes, exact Yes, exact Yes, exact Low Income (FRL) Status
Yes, exact Yes, exact Yes, exact Yes, exact
English Learner (EL) Status
Yes, exact Yes, exact Yes, exact Yes, exact
Special Education (SWD) Status
Yes, exact Yes, exact Yes, exact Yes, exact
Previous Assessment Results
No Yes, prior year (+/- 25 points)
Yes, two yrs. prior (+/- 25 points)
No
Cumulative Days Absent
Yes, approximately the same
Yes, approximately the same
Yes, approximately the same
Yes, approximately the same
Home Language Yes, exact or similar
Yes, exact or similar
Yes, exact or similar
Yes, exact or similar
Home School District
Yes, exact or nearby
Yes, exact or nearby
Yes, exact or nearby
Yes, exact or nearby
*Note: the 11th grade matching criteria are for the science assessment results only.
Table A14 and Table A15 show that the demographic characteristics of the control group (TPS students) are identical to the demographic characteristics of the comparison group (charter school students). Table A15 shows that the attendance patterns for each group is essentially the same and that the groups are academically as indicated by the average prior ELA and math scores.
Table A14: Race and ethnicity composition of the student groups in the 2018-19 school year for the 3rd through 10th graders addressed in this analysis.
Student Group Students in Group
(N)
Native Amer.
(%)
Asian (%)
Black (%)
Hispanic (%)
White (%)
Pacific Islander
(%)
Two or More (%)
Control Group (TPS Students) 1614 1.2 3.3 25.5 17.1 41.9 0.9 9.5
Comparison Group (CS Students) 1614 1.2 3.3 25.5 17.1 41.9 0.9 9.5
200

DRAFT – Not for distribution
42
Table A15: Program participation, attendance, and exclusionary discipline patterns for the study groups and Washington for the 2018-19 school year.
Student Group Students in Group
(N)
FRL (%)
EL (%)
SWD (%)
Section 504 (%)
Days Absent*
(M)
Average Prior ELA
Score
Average Prior Math
Score Control Group (TPS Students) 1381 60.4 11.8 13.7 3.8 11.9 2514.6 2512.0
Comparison Group (CS Students) 1381 60.4 11.8 13.7 3.4 12.0 2514.4 2512.5
*Note: the days absent variable was computed from the student absence file, which describes each absence as excused or unexcused and full day or part day. For this work, no distinction was made between excused or unexcused absences. Full day absences were coded as 1.0 day and a part day absence was coded as 0.25 days. The total days absent were summed from the individual absence events.
A number of charter school students with valid SBA results could not be matched due to unusual absence patterns. Also, a number of matches were impossible to make as the required coding (e.g. race/ethnicity or FRL status) was not included in the various data files. For both the control and comparison groups, more than 95 percent of the students were continuously enrolled for the academic year, and student results were included in this comparison regardless of the continuously enrolled status, in a similar manner in which results are reported on the Washington State Report Card.
Grade Level Findings by Content Area
Performance by Scale Score For the seven grades in which analyses on the ELA assessment were conducted, the comparison group (charter school students) performed statistically similar to the control group (TPS students) at all grade levels (Table A16).
Table A16: spring 2019 ELA scale score differences based on charter school enrollment.
Assessment
Number of Students in each Group
(N)
Mean Scale Score Comparison Group Charter Students
Mean Scale Score Control Group TPS Students
Mean Scale Score Difference*
3rd Grade 79 2443.9 2435.7 -8.19 4th Grade 59 2479.8 2502.3 22.46 5th Grade 101 2523.1 2503.4 -19.64 6th Grade 418 2522.2 2524.8 2.57 7th Grade 481 2562.0 2557.1 -4.58 8th Grade 302 2576.3 2564.2 -12.11 10th Grade 174 2635.4 2617.6 -17.93
*Note: the mean difference is reported as the value for the TPS student group minus the value for the charter school group. A negative mean difference indicates that the mean scale score for the comparison group (charter school students) was higher than the mean scale score for the TPS control group. A
201
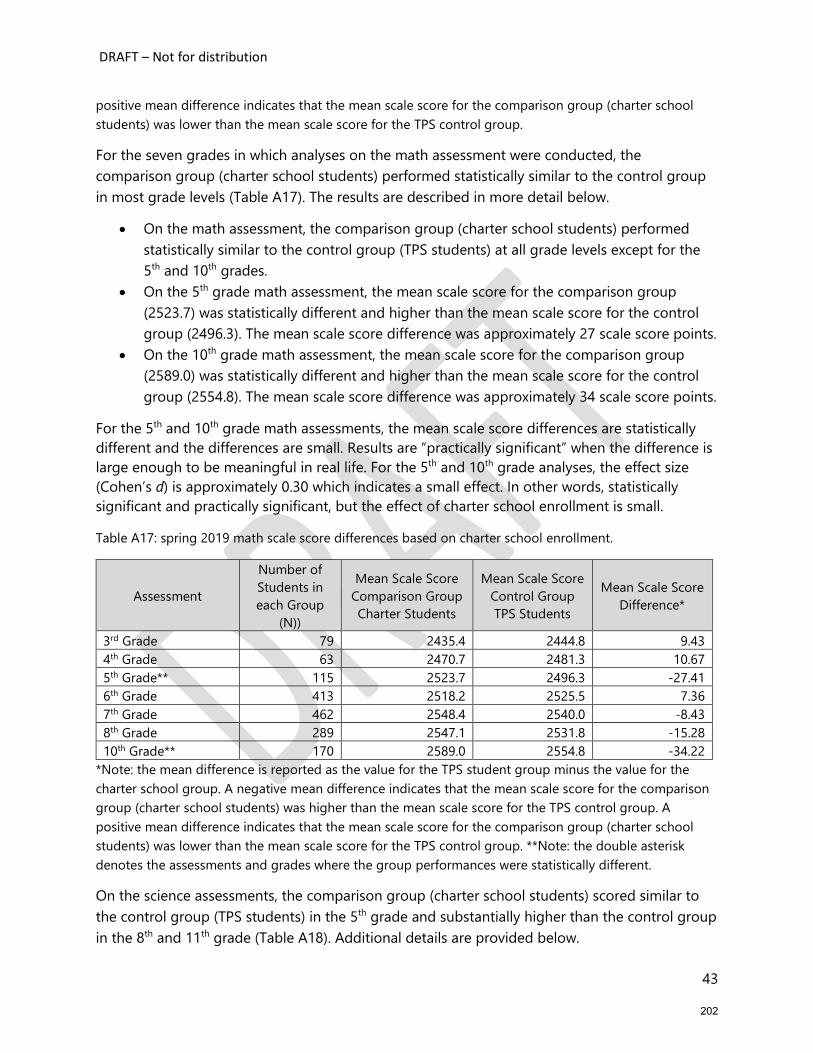
DRAFT – Not for distribution
43
positive mean difference indicates that the mean scale score for the comparison group (charter school students) was lower than the mean scale score for the TPS control group.
For the seven grades in which analyses on the math assessment were conducted, the comparison group (charter school students) performed statistically similar to the control group in most grade levels (Table A17). The results are described in more detail below.
• On the math assessment, the comparison group (charter school students) performed statistically similar to the control group (TPS students) at all grade levels except for the 5th and 10th grades.
• On the 5th grade math assessment, the mean scale score for the comparison group (2523.7) was statistically different and higher than the mean scale score for the control group (2496.3). The mean scale score difference was approximately 27 scale score points.
• On the 10th grade math assessment, the mean scale score for the comparison group (2589.0) was statistically different and higher than the mean scale score for the control group (2554.8). The mean scale score difference was approximately 34 scale score points.
For the 5th and 10th grade math assessments, the mean scale score differences are statistically different and the differences are small. Results are “practically significant” when the difference is large enough to be meaningful in real life. For the 5th and 10th grade analyses, the effect size (Cohen’s d) is approximately 0.30 which indicates a small effect. In other words, statistically significant and practically significant, but the effect of charter school enrollment is small.
Table A17: spring 2019 math scale score differences based on charter school enrollment.
Assessment
Number of Students in each Group
(N))
Mean Scale Score Comparison Group Charter Students
Mean Scale Score Control Group TPS Students
Mean Scale Score Difference*
3rd Grade 79 2435.4 2444.8 9.43 4th Grade 63 2470.7 2481.3 10.67 5th Grade** 115 2523.7 2496.3 -27.41 6th Grade 413 2518.2 2525.5 7.36 7th Grade 462 2548.4 2540.0 -8.43 8th Grade 289 2547.1 2531.8 -15.28 10th Grade** 170 2589.0 2554.8 -34.22
*Note: the mean difference is reported as the value for the TPS student group minus the value for the charter school group. A negative mean difference indicates that the mean scale score for the comparison group (charter school students) was higher than the mean scale score for the TPS control group. A positive mean difference indicates that the mean scale score for the comparison group (charter school students) was lower than the mean scale score for the TPS control group. **Note: the double asterisk denotes the assessments and grades where the group performances were statistically different.
On the science assessments, the comparison group (charter school students) scored similar to the control group (TPS students) in the 5th grade and substantially higher than the control group in the 8th and 11th grade (Table A18). Additional details are provided below.
202

DRAFT – Not for distribution
44
• On the 5th grade science assessment, the average scale score for the comparison group was higher than the control group, but the scores were statistically similar
• On the 8th grade science assessment, the average scale score for the comparison group was statistically higher than the control group,
• The comparison group (672.7 scale score) performed statistically similar to the control group (665.4 scale score) on the 11th grade science assessment. The mean difference was -7.33 scale score points with the charter school student group scoring higher.
For the 8th grade science assessment, the mean scale score difference is statistically significant but the difference is very small. For the 8th grade science assessment, the effect size (Cohen’s d) is less than 0.20 which indicates a very small effect. In other words, statistically significant but not practically significant.
Table A18: Science scale score differences from the spring 2019 assessment administration based on charter school enrollment.
Assessment
Number of Students in Each Group
(N)
Mean Scale Score Comparison Group Charter Students
Mean Scale Score Control Group TPS Students
Mean Scale Score Difference*
5th Grade 101 702.0 687.3 -14.69 8th Grade** 301 693.3 678.0 -15.28 11th Grade 67 672.7 665.4 -7.33
*Note: the mean difference is reported as the value for the TPS student group minus the value for the charter school group. A negative mean difference indicates that the mean scale score for the comparison group (charter school students) was higher than the mean scale score for the control group. **Note: the double asterisk denotes the assessments and grades where the group performances were statistically different.
Performance on Student Growth Percentiles Washington uses the student growth percentiles (SGPs) growth model as the method to determine the relative amount of learning a student makes during a school year. The SGP describes a student’s growth compared to other students with similar prior test scores. The growth model data provides important information about the performance of academically similar students. Because SGP calculations require at least two years of assessment results, ELA and math SGPs are computed for students in the 4th through 8th grades. The OSPI created materials describing the Washington growth model are posted on their website.
The Independent Sample t-Test was conducted to determine whether the comparison group (charter school students) performed differently than the control group (TPS students) on the measure of student growth percentiles (SGPs). Statewide, charter school students posted student growth percentiles similar to or higher than the TPS students in all grades for both ELA and math, except for the measure of the 4th grade ELA SGP (Table A19).
203

DRAFT – Not for distribution
45
• On the ELA SGPs, the comparison group (charter school students) performed similarly to the control group (TPS students) for the 6th and 7th grades.
o On the 4th grade ELA SGP measure, the TPS students performed differently and approximately 5.1 percentile points better than the charter school students.
o On the 5th and 8th grade ELA SGP measures, the charter school students performed differently and approximately 7.8 to 9.3 percentile points better than the TPS students.
• On the math SGPs, the comparison group (charter school students) performed similarly to or higher than the control group (TPS students) at all grade levels. On the 5th, 7th, and 8th grade math SGP measures, the charter school students performed differently and approximately 4.8 to 14.4 percentile points better than the TPS students.
For the 4th, 5th, and 8th grade ELA SGPs, the mean SGP differences are statistically different and the differences are small. The effect sizes (Cohen’s d) are approximately 0.30 to 0.40 which indicates a small effect. In other words, statistically significant and practically significant but a small effect from charter school enrollment.
For the 7th and 8th grade math SGPs, the mean SGP differences are statistically different. The effect sizes (Cohen’s d) are less than 0.20 which indicates little or a very small effect. In other words, statistically significant and but not practically significant. For the 5th grade math SGPs, the effect size is approximately 0.50 which indicates a small to medium effect from charter school enrollment.
Table A19: shows the ELA and math growth model mean (average) data for the groups by grade level.
Assessment Number of Students
in each Group* (N))
Mean SGP Comparison Group Charter Students
Mean SGP Control Group TPS Students
Mean SGP Difference
4th Grade ELA** 59/59 45.9 56.2 10.27 5th Grade ELA** 101/99 59.7 50.4 -9.25 6th Grade ELA 418/416 51.0 51.6 0.59 7th Grade ELA 481/478 52.3 48.9 -3.44 8th Grade ELA** 302/300 56.6 48.8 -7.89 Row intentionally left blank
4th Grade Math 63/63 46.0 52.5 6.51 5th Grade Math ** 114/104 65.1 50.7 -14.38 6th Grade Math 412/410 51.1 52.8 1.70 7th Grade Math** 459/458 53.4 48.6 -4.77 8th Grade Math** 289/286 49.5 44.3 -5.18
The mean difference is reported as the value for the non-charter school group minus the value for the charter school group. A negative mean difference indicates that the mean SGP for the comparison group (charter school students) was higher than the mean SGP for the control group (non-charter school students). A positive mean difference indicates that the mean SGP for the comparison group (charter school students) was lower than the mean SGP for the control group (non-charter school students).*Note: shows the number of student records for the control/comparison group. **Note: the double asterisk denotes the assessments where the group performances were statistically different.
204

DRAFT – Not for distribution
46
A student growth percentile (SGP) is a derived percentile value or rank, and when aggregated, SGPs are often but not always reported as a median value, which usually differs from the mean (average) value. An evaluation of the medians shows that the comparison group (charter school students) performed similar to or better than the control group (TPS students) on the ELA and math SGPs at all grade levels (Table A20). The findings are as follows:
• The ELA SGP medians for the charter school students (comparison group) was similar to the ELA SGP medians for the TPS students for the 4th, 6th, and 7th grades.
• In the 5th and 8th grades, the median values for the charter school students was 15 and 12 percentile points higher than the corresponding value for the TPS students.
• The math SGP medians for the charter school students (comparison group) was similar to the math SGP medians for the TPS students for the 4th and 6thgrades.
• In the 5th, 7th, and 8th grades, the median values for the charter school students was five to 19 percentile points higher than the corresponding value for the TPS students.
For the 5th and 8th grade ELA SGP analyses, an effect size (eta squared) of 0.027 and 0.019 indicate that the experimental variable (enrollment in a charter school) explains approximately two to three percent of the variance found in the ELA SGPs. This represents a very small effect from charter school enrollment.
For the 7th and 8th grade math SGP analyses, an effect size (eta squared) of 0.007 and 0.008 indicate that the experimental variable (enrollment in a charter school) explains less than one percent of the variance found in the math SGPs. This represents a very small effect from charter school enrollment. For the 5th grade math SGP analysis, and effect size of 0.118 indicates that the experimental variable (enrollment in a charter school) explains approximately 11.8 percent of the variance found in the 5th grade math SGPs. This represents a small to medium effect from charter school enrollment.
Table A20: shows the ELA and math growth model data (medians) for the control and comparison groups by grade level.
Assessment Number of Students
in each Group* (N))
Median SGP Comparison Group Charter Students
Median SGP Control Group TPS Students
Median SGP Difference
4th Grade ELA 59/59 40.0 58.0 18.00 5th Grade ELA** 101/99 64.0 49.0 -15.00 6th Grade ELA 418/416 51.0 52.5 1.50 7th Grade ELA 481/478 51.5 50.0 -1.50 8th Grade ELA** 302/300 61.0 49.0 -12.00 Row intentionally left blank
4th Grade Math 63/63 43.0 58.0 15.00 5th Grade Math ** 114/104 73.0 53.5 -19.50 6th Grade Math 412/410 54.0 53.5 -0.50 7th Grade Math** 459/458 57.0 45.0 -12.00 8th Grade Math** 289/286 48.0 43.0 -5.00
205

DRAFT – Not for distribution
47
The median difference is reported as the value for the non-charter school group minus the value for the charter school group. A negative median difference indicates that the median SGP for the comparison group (charter school students) was higher than the median SGP for the control group (non-charter school students). A positive mean difference indicates that the median SGP for the comparison group (charter school students) was lower than the median SGP for the control group (non-charter school students. *Note: shows the number of student records for the control group/comparison group. **Note: the double asterisk denotes the assessments and grades where the group performances were statistically different. The results are derived from the Mann Whitney Independent Sample U Test of Medians.
206

White White
Charter School Report for the 2018-19 School Year
Washington State Board of Education January 16, 2020
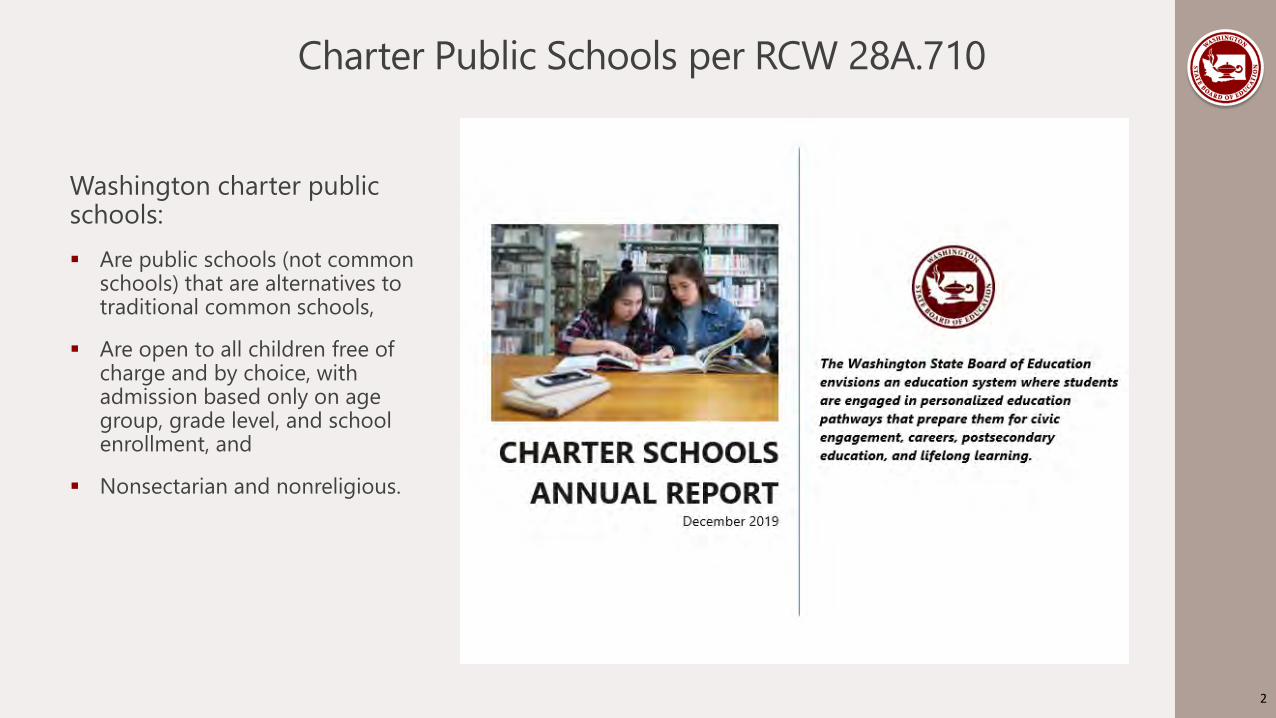
Charter Public Schools per RCW 28A.710
Washington charter public schools: Are public schools (not common
schools) that are alternatives to traditional common schools,
Are open to all children free of charge and by choice, with admission based only on age group, grade level, and school enrollment, and
Nonsectarian and nonreligious.
2

Charter Public Schools - RCW 28A.710
Also, Washington charter public schools: Must be a Washington nonprofit public benefit corporation with federal tax exempt status under section
501(c)(3),
Must be governed by a nonprofit board according to the terms of a renewable, five-year performance-based charter contract executed with an approved authorizer that contains at least the 32 elements required by RCW 28A.710.130,
Are subject to the supervision of the OSPI and the SBE, including accountability measures and the performance improvement goals adopted by the SBE, to the same extent as other public schools, must provide a program of basic education, and participate in the statewide student assessment system, and
Employ educators meeting the same certification requirements as traditional public school teachers, including background checks.
Charter schools comply with local, state, and federal health, safety, parents' rights, civil rights, Individuals with Disabilities Education Improvement Act, Elementary and Secondary Education Act, and nondiscrimination laws applicable to school districts.
3

Reporting Requirement in RCW 28A.710
The academic performance of the state's charter schools: Part A: Educational outcomes (assessment results and high school graduation
results) from the preceding school year, and Part B: A comparison of the performance of charter school students with the
performance of academically, ethnically, and economically comparable groups of students in other public schools.
The SBE’s assessment of the successes, challenges, and areas for improvement in meeting the purposes of the Washington Charter Public Schools Act (RCW 28A.710),
The Board's assessment of the sufficiency of funding for charter schools, the efficacy of the formula for authorizer funding, and
Any suggested changes in state law or policy necessary to strengthen the state's charter schools.
4

Charter Public Schools Operating in the 2018-19 School Year
5
2016-17 2017-18 2018-19 2019-20Ashe Prep*
Destiny Destiny DestinyExcel Excel Excel
Rainier Valley Rainier Valley Rainier ValleyImpact Puget Sound Impact Puget Sound
PRIDE Prep PRIDE Prep PRIDE Prep PRIDE PrepRainier Prep Rainier Prep Rainier Prep Rainier Prep
SOAR SOAR SOAR
Spokane International Spokane International Spokane International Spokane International
Atlas Atlas AtlasOlympus Olympus Olympus Olympus
Sierra Sierra Sierra SierraWillow Willow
*Note After opening for the 2019-20 school year, Ashe Prep closed in late October 2019.

2018-19 Charter Schools
6
School Name Authorizer Location GradesServed Enrollment
Green Dot Destiny State Charter School Commission Tacoma 6-8 162
Green Dot Excel State Charter School Commission Kent 7-10 189
Green Dot Rainier Valley State Charter School Commission Seattle 6-7, and 9 253
Impact | Puget Sound State Charter School Commission Tukwila K-1 180PRIDE Prep Spokane Public Schools Spokane 6-10 498Rainer Prep State Charter School Commission Seattle 5-8 342
SOAR State Charter School Commission Tacoma K-5 220
Spokane International Spokane Public Schools Spokane K-8 501
Summit Atlas State Charter School Commission Seattle 6-7 and 9-10 336
Summit Olympus State Charter School Commission Tacoma 9-12 194
Summit Sierra State Charter School Commission Seattle 9-12 374
Willow Public School State Charter School Commission Walla Walla 6-8 114

Demographics of the Charter Schools
Nearly all of the charter schools in operation for the 2018-19 school year served student populations demographically different from the home school district and the state.
7
Amer
ican
Indi
an
Asia
n
Blac
k
Hisp
anic
Pacif
ic Isl
ande
r
Whi
te
Two
or
Mor
e Ra
ces
Engl
ish
Lear
ners
Low
In
com
e
Spec
ial
Educ
atio
n
Rainier Prep 0.3 7.3 40.4 36.8 0.9 7.0 7.6 38.6 75.4 13.5Highline SD 0.9 14.6 14.6 38.9 3.9 20.9 6.1 28.8 69.0 16.8
Excel 1.1 4.8 39.7 12.2 1.6 28.6 12.2 10.1 65.1 20.6Kent SD 0.3 19.8 12.5 22.5 2.5 32.9 9.5 20.8 53.1 12.1
Atlas 0.9 3.9 34.2 15.2 0.3 33.9 11.6 14.3 54.8 18.8Rainier Valley 0.4 2.8 75.9 9.5 0.0 6.3 5.1 21.3 75.1 16.6Sierra 0.0 8.8 34.5 11.0 0.3 31.3 14.2 8.3 40.4 17.1
Seattle PS 0.5 13.8 14.5 12.3 0.4 46.8 11.7 12.1 33.7 16.8PRIDE Prep 7.0 2.8 12.9 2.0 1.0 73.7 0.6 0.6 54.6 17.1Spokane International 1.0 1.6 2.4 11.0 0.0 70.3 13.8 2.0 43.9 13.8
Spokane PS 1.1 2.4 3.1 10.8 1.7 67.2 13.7 6.9 58.2 18.4Destiny 1.2 1.2 29.6 17.9 3.1 32.1 14.8 9.3 85.8 19.8Olympus 1.5 2.1 22.7 32.5 1.5 23.7 16.0 7.7 68.6 22.7SOAR 0.5 0.5 27.7 19.1 5.5 22.7 24.1 4.1 50.9 17.3
Tacoma SD 1.1 9.1 13.9 20.9 3.1 38.3 13.6 10.9 61.6 15.9Impact-Puget Sound 0.0 7.2 51.7 17.2 0.0 18.3 5.6 40.6 71.7 4.4
Tukwila SD 0.9 27.2 20.4 28.9 3.7 12.5 6.4 33.6 75.6 13.0Willow 0.0 0.9 0.0 43.9 0.0 52.6 2.6 14.9 49.1 14.9
Walla Walla SD 0.4 1.2 0.7 40.6 0.1 53.8 3.3 13.3 58.4 15.6Washington 1.4 7.7 4.4 23.1 1.1 54.4 8.0 11.5 42.4 14.1

Part AComparison of Charter School Results to the Home District and the State
Regarding the percentage of students meeting standard on the statewide assessments on the spring 2019 administration, the performance of the charter schools is mixed: Three charter schools posted results that were better than the home school district on the ELA, math, and
science assessments. Two charter schools posted results that were similar to the home school district on the ELA and math
assessments. Two charter schools posted results that were lower than the home school district on the ELA and math
assessments. Four charter schools posted mixed results in comparison to the performance of the home school district.
Information about the performance of charter schools on the WSIF is limited and mixed, as only five of the 12 charter schools earned a WSIF rating and those ratings ranged from a low of 1.53 to a high of 8.35.
Two charter schools had a reportable four year adjusted cohort graduation rate and both rates were similar to the state average, and one posted rates lower than the home school district while another posted rates similar to the home school district.
8

Overview of Academic Performance
The performance of the charter schools is best characterized as mixed.
Two positive outliers Rainier Prep Spokane International
Academy
Most schools perform similar to the home district on at least one academic measure.
See Appendix A of the Charter School Report
9
Measure
Charter Schools with a Performance Higher
than the Home School District
Charter Schools with a Performance Similar to
the Home School District
Charter Schools with a Performance Lower
than the Home School District
ELA Proficiency
Rainier PrepSpokane InternationalOlympus
Destiny*PRIDE PrepAtlas
Excel*Rainier ValleySOAR*SierraWillow
Math Proficiency
Rainier PrepSpokane InternationalOlympus
Destiny*Excel*Rainier ValleyAtlasSierra
PRIDE PrepSOAR*Willow
Science Proficiency
Rainier PrepSpokane International
Destiny*Excel*PRIDE PrepOlympusSierra
Four Year ACGR
Sierra Olympus
*Note: surrendered school charters at the end of the 2018-19 school year.

Performance on the Winter 2019 (Last Year)Washington School Improvement Framework
**Note: schools need to be operating for at least two years and have sufficient reportable data for the years to earn a WSIF rating.All of these schools will be included in the winter 2020 WSIF.
10
School NameProf.
DecileSGP
Decile
Grad. Rate
Decile
EL Progress
Decile
SQSS Decile
Total Decile**
Green Dot Destiny* 1.50 1.50 2.00 1.53
Green Dot Excel* 4.50 4.50 1.00 2.00 4.20
Green Dot Rainier Valley 2.00 6.50 5.00
PRIDE Prep 4.50 3.00 2.30 3.42
Rainer Prep 7.50 10.00 1.00 6.00 8.35
SOAR* 1.50 1.00
Spokane International 7.50 5.00 7.00 6.10
Summit Atlas 7.00 10.00 4.30
Summit Olympus 4.00 6.00
Summit Sierra 6.00 5.70Washington Public
Schools 5.87 5.63 5.64 3.87 5.29 5.79
*Note: school charters were surrendered at the end of the 2018-19 school year.

Charter Schools, Home Districts, and Statewide ResultsClass of 2019 Four Year Graduation Rate
Graduation results for the charter schools are mixed.
Summit Olympus
Students graduate at a rate lower than the Tacoma SD
Students graduate at a rate similar to the state
Summit Sierra
Students graduate at a rate similar to the Seattle PS
Students graduate at a rate similar to the state
11
Class of 2019 Four Year
Graduation Rate
Summit Olympus
Tacoma SD
SummitSierra
Seattle PS
Washington
All Students 75.0 89.8 84.3 82.9 80.9Native American > 90.0 62.1 61.7
Asian 92.6 82.2 85.4 90.4Black 76.2 89.6 > 91.0 77.1 73.6
Hispanic 72.2 89.4 72.7 68.7 75.7Pacific Islander 80.8 57.1 74.4
White 81.3 91.0 78.6 89.2 82.8Two or More Races 81.7 83.3 82.1 81.2
Limited English 86.3 83.3 61.7 62.4Low-Income 72.1 85.8 87.9 73.3 72.2
Special Education 71.1 57.9 62.1Female 79.4 91.4 88.2 86.7 84.0
Male 72.2 88.1 80.4 79.2 78.1

Part BThe comparison of the performance of charter school students with the performance of academically,
ethnically, and economically comparable groups of students in other public schools
12

Part B – TPS “Pair” or “Twin” Matching Criteria The comparison of the performance of charter school students with the performance of
academically, ethnically, and economically comparable groups of students in other public schools
For nearly every charter school student, a TPS twin is identified based on the matching criteria.
The idea is to create two nearly identical groups differing only by charter school enrollment.
Compare the group performance of charter school students to the TPS student performance.
Approximately 1600 students in each group.
13
MatchingCriteria
3rd Grade Students
4th to 8th Grade Students
10th Grade Students
11th Grade Students
Grade Yes, exact Yes, exact Yes, exact Yes, exactGender Yes, exact Yes, exact Yes, exact Yes, exactRace/Ethnicity Yes, exact Yes, exact Yes, exact Yes, exactLow Income (FRL) Status
Yes, exact Yes, exact Yes, exact Yes, exact
English Learner (EL) Status
Yes, exact Yes, exact Yes, exact Yes, exact
Special Education (SWD) Status
Yes, exact Yes, exact Yes, exact Yes, exact
Previous Assessments
No Yes, prior year (+/- 25 points)
Yes, two yrs. prior(+/- 25 points)
No
Cumulative Days Absent
Yes, approximately the same
Yes, approximately the same
Yes, approximately the same
Yes, approximately the same
Home Language Yes, exact or similar
Yes, exact or similar
Yes, exact or similar
Yes, exact or similar
Home School District
Yes, exact or nearby
Yes, exact or nearby
Yes, exact or nearby
Yes, exact or nearby
ExclusionaryDiscipline
No No No No

Demographic and Academic Comparison of the Groups
The idea is to create two nearly identical groups differing only by charter school enrollment. Exact matching on
race/ethnicity, low income, English learner, and special education status.
Similar matching on cumulative days absent.
Similar matching on prior test results
The groups are comparable.
14
Student GroupStudents in Group
(N)
Native Amer.
(%)
Asian(%)
Black(%)
Hispanic(%)
White(%)
Pacific Islander
(%)
Two or More
(%)Control Group (TPS Students) 1614 1.2 3.3 25.5 17.1 41.9 0.9 9.5
Comparison Group (CS Students)
1614 1.2 3.3 25.5 17.1 41.9 0.9 9.5
Student GroupFRL(%)
EL(%)
SWD (%)
Section 504 (%)
Days Absent
(M)
Average Prior ELA
Score
Average Prior Math Score
Control Group (TPS Students) 60.4 11.8 13.7 3.8 11.9 2514.6 2512.0
Comparison Group (CS Students)
60.4 11.8 13.7 3.4 12.0 2514.4 2512.5
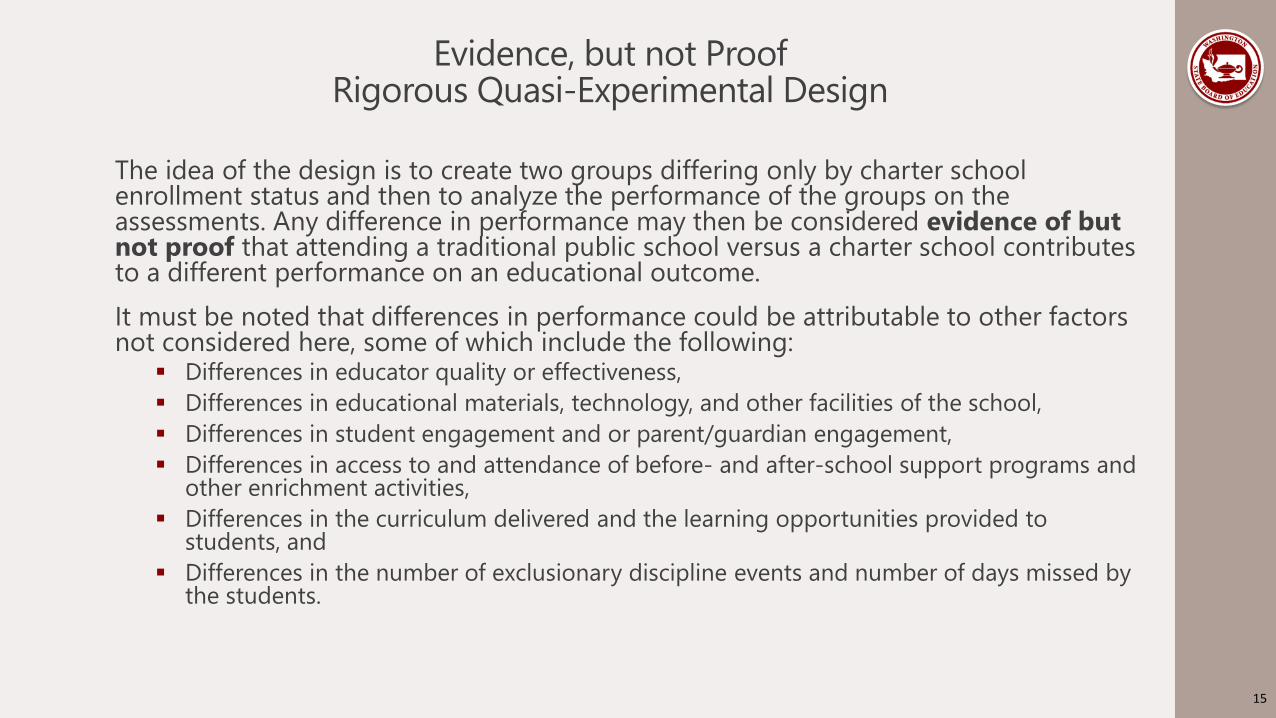
Evidence, but not ProofRigorous Quasi-Experimental Design
The idea of the design is to create two groups differing only by charter school enrollment status and then to analyze the performance of the groups on the assessments. Any difference in performance may then be considered evidence of but not proof that attending a traditional public school versus a charter school contributes to a different performance on an educational outcome. It must be noted that differences in performance could be attributable to other factors not considered here, some of which include the following: Differences in educator quality or effectiveness, Differences in educational materials, technology, and other facilities of the school, Differences in student engagement and or parent/guardian engagement, Differences in access to and attendance of before- and after-school support programs and
other enrichment activities, Differences in the curriculum delivered and the learning opportunities provided to
students, and Differences in the number of exclusionary discipline events and number of days missed by
the students.
15

Part B – Summary of the AnalysesComparing the Performance of Similar Groups
Statewide, charter school students perform approximately the same as similar TPS students on the ELA assessment, but higher than TPS students on the math and science assessments.
Statewide, the student growth percentiles posted by charter school students were similar to or higher than the percentiles posted by similar TPS students.
16
Academic Measure
Charter School Students
Perform Higher than TPS Students
Charter School Students
Perform Similar to TPS Students
Charter School Students
Perform Lower than TPS Students
ELA (Mean Scale Score) XMath (Mean Scale Score) XScience (Mean Scale Score) XRow intentionally left blank.
ELA (Mean SGP) XMath (Mean SGP) XRow intentionally left blank.
ELA (Median SGP) XMath (Median SGP) X
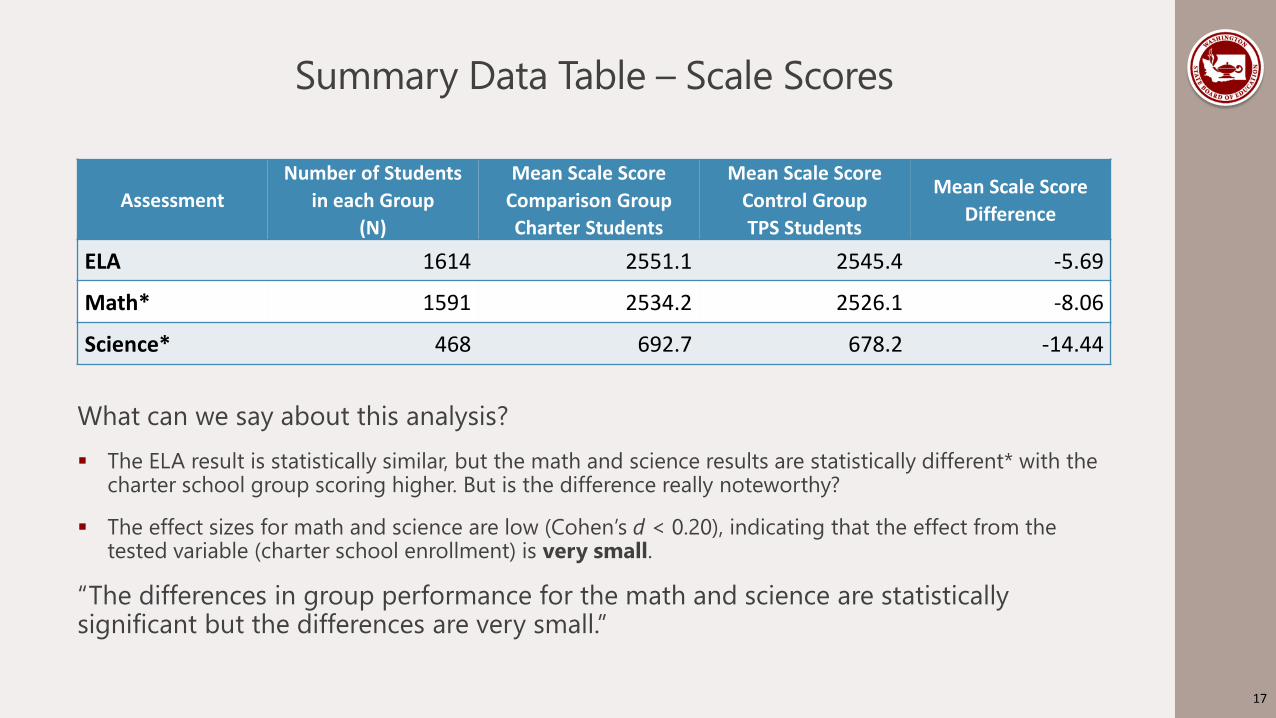
Summary Data Table – Scale Scores
What can we say about this analysis? The ELA result is statistically similar, but the math and science results are statistically different* with the
charter school group scoring higher. But is the difference really noteworthy?
The effect sizes for math and science are low (Cohen’s d < 0.20), indicating that the effect from the tested variable (charter school enrollment) is very small.
“The differences in group performance for the math and science are statistically significant but the differences are very small.”
17
AssessmentNumber of Students
in each Group(N)
Mean Scale Score Comparison GroupCharter Students
Mean Scale Score Control GroupTPS Students
Mean Scale Score Difference
ELA 1614 2551.1 2545.4 -5.69
Math* 1591 2534.2 2526.1 -8.06
Science* 468 692.7 678.2 -14.44

ELA Scale Scores by Grade Level
None of the analyses were statistically different.
“The differences in group performance shown here are not statistically significant and the mean scale score differences are very small.”
18
Assessment
Number of Students in each Group
(N)
Mean Scale Score
Comparison Group Charter
Students
Mean Scale Score
Control Group
TPS Students
Mean Scale Score
Difference
3rd Grade 79 2443.9 2435.7 -8.19
4th Grade 59 2479.8 2502.3 22.46
5th Grade 101 2523.1 2503.4 -19.64
6th Grade 418 2522.2 2524.8 2.57
7th Grade 481 2562.0 2557.1 -4.58
8th Grade 302 2576.3 2564.2 -12.11
10th Grade 174 2635.4 2617.6 -17.93

Math Scale Scores by Grade Level
The 5th and 10th grade results are statistically different* with the charter school group scoring higher.
The effect sizes for both results are meaningful (Cohen’s d is ≈ 0.30), indicating that the effect from the tested variable (charter school enrollment) is small.
“The 5th and 10th grade scale score differences are statistically significant and meaningful but the effect of charter school enrollment is small.”
19
Assessment
Number of Students in each Group
(N))
Mean Scale Score
Comparison Group Charter
Students
Mean Scale Score
Control Group
TPS Students
Mean Scale Score
Difference
3rd Grade 79 2435.4 2444.8 9.43
4th Grade 63 2470.7 2481.3 10.67
5th Grade* 115 2523.7 2496.3 -27.41
6th Grade 413 2518.2 2525.5 7.36
7th Grade 462 2548.4 2540.0 -8.43
8th Grade 289 2547.1 2531.8 -15.28
10th Grade* 170 2589.0 2554.8 -34.22

Science Scale Scores by Grade Level
On the 5th and 11th grade science, the charter student group mean was statistically similar to the TPS group mean.
On the 8th grade science, the means were statistically different with the charter student group scoring higher.
The effect sizes for the 8th
grade result is low (Cohen’s d< 0.20), indicating that the effect from the tested variable (charter school enrollment) is very small.
20
Assessment
Number of Students in Each Group
(N)
Mean Scale Score
Comparison Group
Charter Students
Mean Scale Score
Control Group
TPS Students
Mean Scale Score
Difference
5th Grade 101 702.0 687.3 -14.69
8th Grade* 301 693.3 678.0 -15.2811th Grade 67 672.7 665.4 -7.33
“The difference in group performance for the 8th grade science is statistically significant but the difference is very small.”

Part B – Summary of the AnalysesComparison of Performance of Similar Groups
A slightly different result is produced depending on whether means or medians are analyzed.
“Statewide, the student growth percentiles (SGPs) posted by charter school students were similar to or higher than the percentiles posted by similar TPS students.
21
Academic Measure
Charter School Students
Perform Higher than TPS Students
Charter School Students
Perform Similar to TPS Students
Charter School Students
Perform Lower than TPS Students
ELA (Mean Scale Score) XMath (Mean Scale Score) XScience (Mean Scale Score) XRow intentionally left blank.
ELA (Mean SGP) XMath (Mean SGP) XRow intentionally left blank.
ELA (Median SGP) XMath (Median SGP) X
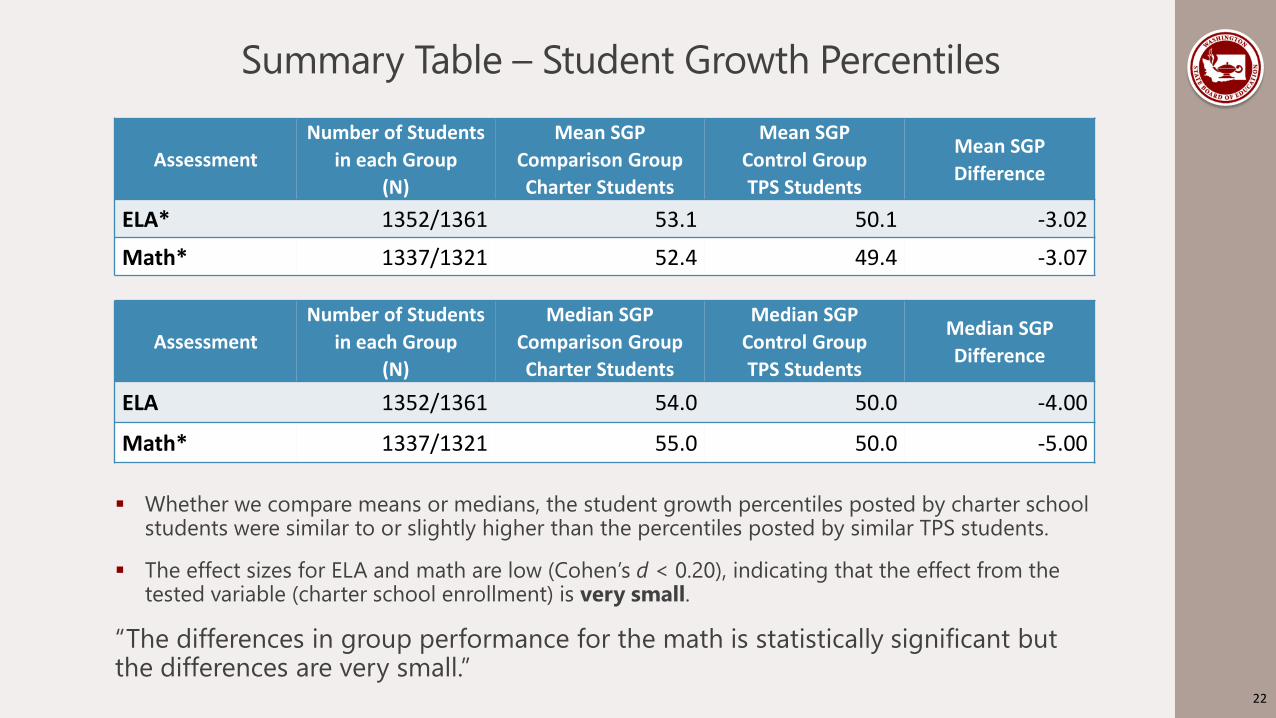
Summary Table – Student Growth Percentiles
Whether we compare means or medians, the student growth percentiles posted by charter school students were similar to or slightly higher than the percentiles posted by similar TPS students.
The effect sizes for ELA and math are low (Cohen’s d < 0.20), indicating that the effect from the tested variable (charter school enrollment) is very small.
“The differences in group performance for the math is statistically significant but the differences are very small.”
22
AssessmentNumber of Students
in each Group(N)
Mean SGP Comparison GroupCharter Students
Mean SGP Control GroupTPS Students
Mean SGP Difference
ELA* 1352/1361 53.1 50.1 -3.02
Math* 1337/1321 52.4 49.4 -3.07
AssessmentNumber of Students
in each Group(N)
Median SGP Comparison GroupCharter Students
Median SGP Control GroupTPS Students
Median SGP Difference
ELA 1352/1361 54.0 50.0 -4.00
Math* 1337/1321 55.0 50.0 -5.00

Student Growth Percentiles (Means) by Grade Level
For the 4th, 5th, and 8th grade ELA SGPs, the mean SGP differences are statistically different. The effect sizes (Cohen’s d) are approximately 0.30 to 0.40 indicating a small effect from charter school enrollment.
For the 7th and 8th grade math SGPs, the mean SGP differences are statistically different. The effect sizes (Cohen’s d) are < 0.20 indicating a very small effect from charter school enrollment.
For the 5th grade math SGPs, the effect size is approximately 0.50 which indicates a small to medium effect from charter school enrollment.
23
Assessment
Number of Students in each Group
(N))
Mean SGPComparison
Group Charter
Students
Mean SGPControl Group
TPS Students
Mean SGP Difference
4th Grade ELA* 59/59 45.9 56.2 10.275th Grade ELA* 101/99 59.7 50.4 -9.256th Grade ELA 418/416 51.0 51.6 0.597th Grade ELA 481/478 52.3 48.9 -3.448th Grade ELA* 302/300 56.6 48.8 -7.89Row intentionally left blank
4th Grade Math 63/63 46.0 52.5 6.515th Grade Math * 114/104 65.1 50.7 -14.386th Grade Math 412/410 51.1 52.8 1.707th Grade Math* 459/458 53.4 48.6 -4.778th Grade Math* 289/286 49.5 44.3 -5.18

Student Growth Percentile (Medians) by Grade Level
For the 5th and 8th grade ELA SGPs, the median SGP differences are statistically different. The effect sizes (eta2) indicate that charter school enrollment explains two to three percent of the variance in the ELA SGPs. This indicates a very small effect from charter school enrollment.
For the 7th and 8th grade math SGPs, the median SGP differences are statistically different. The effect sizes (eta2) are < 0.01 (less than one percent) indicating a very small or trivial effect from charter school enrollment.
For the 5th grade math SGPs, the effect size indicates that charter school enrollment explains 11.8 percent of the variance in the math SGPs. This indicates a small to medium effect from charter school enrollment.
24
Assessment
Number of Students in each Group
(N))
Median SGPComparison
Group Charter
Students
Median SGP
Control Group
TPS Students
Median SGP
Difference
4th Grade ELA 59/59 40.0 58.0 18.005th Grade ELA* 101/99 64.0 49.0 -15.006th Grade ELA 418/416 51.0 52.5 1.507th Grade ELA 481/478 51.5 50.0 -1.508th Grade ELA* 302/300 61.0 49.0 -12.00Row intentionally left blank
4th Grade Math 63/63 43.0 58.0 15.005th Grade Math * 114/104 73.0 53.5 -19.506th Grade Math 412/410 54.0 53.5 -0.507th Grade Math* 459/458 57.0 45.0 -12.008th Grade Math* 289/286 48.0 43.0 -5.00

Contact Information
Website: www.SBE.wa.gov
Facebook: www.facebook.com/washingtonSBE
Twitter: @wa_SBE
Email: [email protected]
Phone: 360-725-6025
Web updates: bit.ly/SBEupdates
25

Cover: Transfer of Contract for Spokane International Academy to the Charter School Commission
PREPARED FOR THE JANUARY 2020 BOARD MEETING
Discussion and Action
Spokane International Academy has requested a transfer of contract from Spokane Public Schools to the Charter School Commission. The Board will consider approval of this transfer.
Materials included in packet: • Spokane International Academy Petition• Announcement of New Building for Spokane International Academy
Synopsis: Spokane International Academy has decided to relocate to a new building within the boundaries of Mead School District. This necessitates a transfer of charter contract to the Charter School Commission because Spokane Public Schools is the sole district charter authorizer in Washington and Spokane International Academy will no longer be within the boundaries of the district. Pursuant to WAC 180-19-260(7) Spokane International Academy’s board submitted a petition to the State Board of Education to transfer the contract to the Charter School Commission. Although the law does not require the consent of Spokane Public Schools, staff reached out to the district to ensure that there are no concerns. Spokane Public Schools did not express concerns with the transfer of contract. Staff also reached out to Mead School District, Spokane International Academy and Commission staff. Mead School District’s Superintendent did express any concerns with the transfer. Staff have reviewed the documentation and recommend the Board approve of the transfer of charter contract to the Charter School Commission.
Business Items:
• Approval of Transfer of Contract for Spokane International Academy to theCharter School Commission
220

PETITION FOR THE TRANSFER OF A CHARTER SCHOOL CONTRACT
RCW 28A.710.210(3) A charter contract may not be transferred from one authorizer to another or from one charter school to another before the expiration of the charter contract term except by petition to the state board of education by the charter school or its authorizer. The state board of education must review such petitions on a case-by-case basis and may grant transfer requests in response to special circumstances and evidence that such a transfer would serve the best interests of the charter school's students.
Please complete this form – with concise information and a list of back-up documentation that you have available should the State Board of Education wish to review it – and submit it to Parker Teed, Basic Education Manager, [email protected].
DATE: September 24, 2019
CHARTER SCHOOL: Spokane International Academy
AUTHORIZER: Spokane Public Schools (Current)
PARTIES TO THE CURRENT CHARTER CONTRACT:
Spokane International Academy and Spokane Public Schools
DATES (START AND END) OF CURRENT CHARTER CONTRACT:
Start - August 23, 2016 End - August 22, 2021
PETITIONER (THE PARTY REQUESTING A TRANSFER OF CURRENT CHARTER CONTRACT):
Spokane International Academy Board of Directors
PROPOSED NEW CHARTER SCHOOL OR AUTHORIZER:
Washington State Charter School Commission
PERSON COMPLETING THIS PETITION: Travis Franklin, SIA Head of School
EMAIL: [email protected]
PHONE: (509) 321-8950
February, 2017 221

SPECIAL CIRCUMSTANCES: Please describe the special circumstances that you believe warrant the State Board of Education to make an exception to the “A charter contract may not be transferred from one another to another or from one charter school to another before its expiration” (“except by petition to the State Board of Education by the charter school or its authorizer”).
Spokane International Academy currently occupies two temporary sites that allow for the enrollment of our Primary (K-5) and Middle (6-8). We have attempted to find a permanent site for the past four years that can accommodate both programs on a single campus which was the intent of our originalapplication. Since Spokane Public Schools is our current authorizer, we are limited to looking within their boundaries. After conducting our search in partnership with our real estate broker, SPS staff, and Washington Charter School Development, we have come to the conclusion that there is no suitable building in Spokane that fits our enrollment size and our financial capacity.
As such, we expanded our search to include outlying areas of the greater Spokane region in order to continue to serve our current students and to grow to serve our expected future student enrollment. We have found a facility that is affordable and could accommodate any future growth and allow us to demonstrate our full program. It is for this reason that we are seeking to transfer our contract from Spokane Public Schools to the Washington State Charter School Commission. We have been fortunate to enjoy a great relationship with Spokane Public Schools and have been pleased with our partnership from idea conception through current day.
EVIDENCE OF STUDENTS’ BEST INTEREST: What evidence can you provide to the SBE that this charter contract transfer would serve the best interest of the charter school’s students?
We believe this contract transfer is in the best interest of our students because it will allow us to continue to serve our students in the model first envisioned. We believe strongly that by being on one campus together we can ensure tighter alignment in academic, cultural and operational expectations. It will allow us to be more efficient in our staffing and to share an economy of scale in regards to transportation, food and nutrition and leadership staffing.
Also, all estimates related to trying to make a facility work within the SPS boundaries have shown a substantially negative effect on our long-term financial sustainability. This move allows us to allocate our resources directly to impacting student outcomes as opposed to the cost of renovating and inhabiting a facility.
Once we know if our petition for transfer has been approved we will work with a group of our parents to design transportation and operational adjustments to allow for as many of our current families to attend SIA at our new site as possible. We believe our students continuing to attend SIA is in their best interest as we have seen firsthand how beneficial the program has been to their growth academically, in their character and in their understanding of the world. Given the close proximity of the new site to our current elementary site, we don't foresee losing more than maybe a handful of families in the move.
BACK-UP DOCUMENTATION YOU COULD PROVIDE UPON REQUEST OF SBE:
Spokane International Academy Is currently working with the Washington State Charter Schools Commission to complete an application to demonstrate the strength of our program for their consideration. Knowing that they would also need to accept our transfer application and ultimately serve as our authorizer, it is hoped that the comprehensive application we submit to them would contain all of the information necessary to aid in your decision. For further information about the contents of the application and their deliberative process, please email Executive Director Joshua Halsey at [email protected].
February, 2017 222
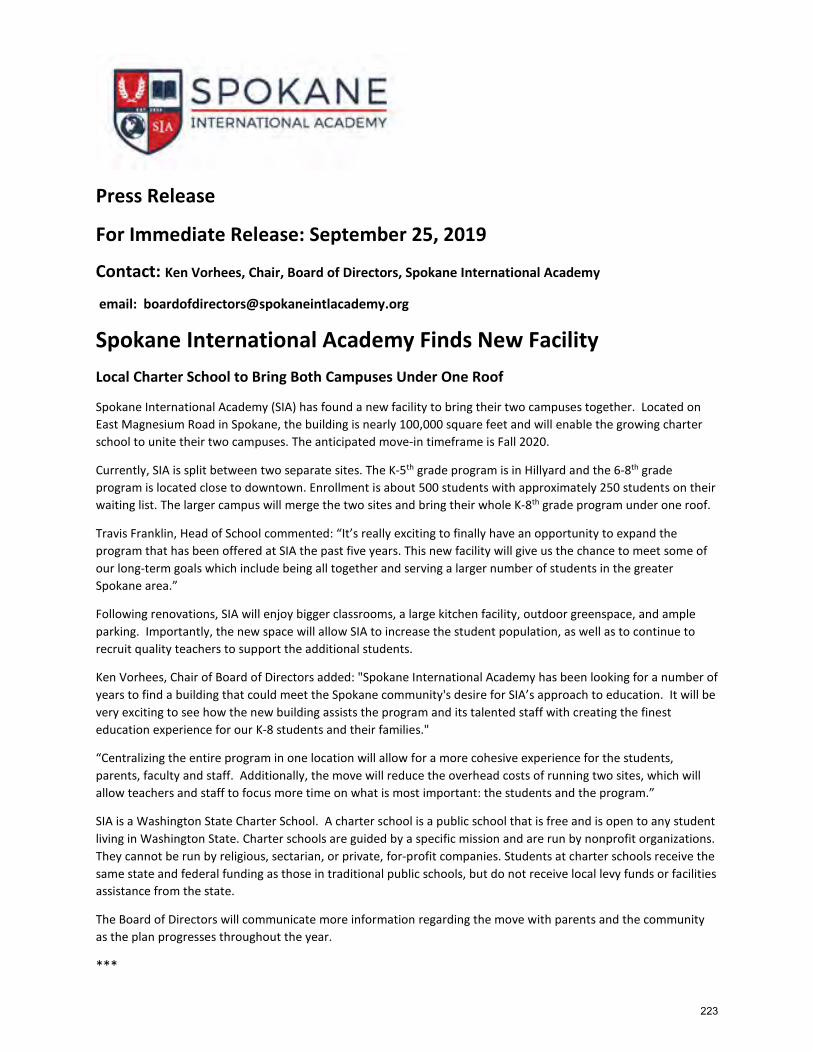
Press Release
For Immediate Release: September 25, 2019
Contact: Ken Vorhees, Chair, Board of Directors, Spokane International Academy
email: [email protected]
Spokane International Academy Finds New Facility Local Charter School to Bring Both Campuses Under One Roof
Spokane International Academy (SIA) has found a new facility to bring their two campuses together. Located on East Magnesium Road in Spokane, the building is nearly 100,000 square feet and will enable the growing charter school to unite their two campuses. The anticipated move-in timeframe is Fall 2020.
Currently, SIA is split between two separate sites. The K-5th grade program is in Hillyard and the 6-8th grade program is located close to downtown. Enrollment is about 500 students with approximately 250 students on their waiting list. The larger campus will merge the two sites and bring their whole K-8th grade program under one roof.
Travis Franklin, Head of School commented: “It’s really exciting to finally have an opportunity to expand the program that has been offered at SIA the past five years. This new facility will give us the chance to meet some of our long-term goals which include being all together and serving a larger number of students in the greater Spokane area.”
Following renovations, SIA will enjoy bigger classrooms, a large kitchen facility, outdoor greenspace, and ample parking. Importantly, the new space will allow SIA to increase the student population, as well as to continue to recruit quality teachers to support the additional students.
Ken Vorhees, Chair of Board of Directors added: "Spokane International Academy has been looking for a number of years to find a building that could meet the Spokane community's desire for SIA’s approach to education. It will be very exciting to see how the new building assists the program and its talented staff with creating the finest education experience for our K-8 students and their families."
“Centralizing the entire program in one location will allow for a more cohesive experience for the students, parents, faculty and staff. Additionally, the move will reduce the overhead costs of running two sites, which will allow teachers and staff to focus more time on what is most important: the students and the program.”
SIA is a Washington State Charter School. A charter school is a public school that is free and is open to any student living in Washington State. Charter schools are guided by a specific mission and are run by nonprofit organizations. They cannot be run by religious, sectarian, or private, for-profit companies. Students at charter schools receive the same state and federal funding as those in traditional public schools, but do not receive local levy funds or facilities assistance from the state.
The Board of Directors will communicate more information regarding the move with parents and the community as the plan progresses throughout the year.
***
223

Spokane International Academy mission statement:
Spokane International Academy empowers its students with the academic skills, habits of mind and global competence necessary to complete advanced courses in high school and a college degree in order to become leaders who can powerfully transform our communities.
About Spokane International Academy: https://www.spokaneintlacademy.org/history
More about Washington charter schools: https://www.spokaneintlacademy.org/charter-schools
224