edward a. firestone attorney at law - california state … · edward a. firestone attorney at law...
TRANSCRIPT

Edward A. Firestone Attorney at Law
775 Guinda St. Palo Alto, CA 94301
Tel. No. (650) 327-0277 Cell No. (650) 269-4561
August 4, 2014 Mr. Bruce Wolfe, Executive Officer California Regional Water Quality Control Board San Francisco Bay Region 1515 Clay Street, Suite 1400 Oakland, California 94612 Subject: Tentative Order – Initial Site Cleanup Requirements for 1643 Contra Costa Boulevard Pleasant Hill, CA (“Site 1”) Regional Board File No. 07S0132 (KEB) Tentative Order – Initial Site Cleanup Requirements for 1705 Contra Costa Boulevard Pleasant Hill, CA (“Site 2”) Regional Board File No. 07S0204 (KEB) Dear Mr. Wolfe: I am writing to you with comments on the above tentative orders on behalf of Gregory Village Partners, L.P (“GVP”). GVP has a very specific reason to place its comments on both orders in a single letter: rather than two orders, an inclusive, single order should be drafted that encompasses both the geographic area and all dischargers associated with that area. Thus, the named dischargers on the single order should be the GVP parties, the Chevron parties and Central Contra Costa Sanitary District (“CCCSD”). GVP’s comments are organized into two sections. The first section explains why there should be a single order. The second section discusses the legal and technical justifications for naming CCCSD to this single order. GVP’s also wishes to provide detailed remarks on various portions and paragraphs of the tentative orders and the Cleanup Team Staff Report (“Staff Report”). These remarks are attached as Exhibit G.

2
I. A Single Order Should be Issued for 1643 Contra Costa Blvd., 1705 Contra Costa Blvd., and CCCSD The Regional Board should issue a single order because the plumes are commingled. The Staff Report states on page 11:
There is evidence that the CVOC plume from Site 2 [Chevron] migrated in groundwater to the north and northwest and beneath the Gregory Village Shopping Center, and commingled with the CVOC plume associated with Site 1 [GVP], which has migrated beneath a residential subdivision north of Site 1.
Plumes that commingle from multiple sites are more effectively handled in a single site order because, as a practical matter, the plumes cannot be adequately addressed separately. In the past, this Regional Board has handled similar situations with a single order1 and we believe that this is the appropriate manner in which to handle the subject sites. As currently structured, the two orders will lead to inefficiencies in addressing the requirements, disagreements between parties (and enforcement challenges), and far greater Staff time to manage than a single order would. The inefficiencies go beyond whether or not it makes sense to have two sensitive receptor surveys and public participation plans. Most significantly, both parties are required to investigate the vertical and lateral extent of their plume (but with differing degrees of specificity). Two orders would be duplicative, with the GVP parties and Chevron parties independently performing overlapping investigations of commingled plumes, which makes no sense. The investigation tasks also illustrate the difficulty of attempting to coordinate two different orders, which should be much easier at this stage compared to when issues arise in the field causing delays for one party or another.2 While both the GVP parties and the Chevron parties are required to define the vertical and lateral extent of their plumes, the GVP parties’ order expressly references the deep zone and the neighborhood but the Chevron parties’ order does not. The likelihood, if the orders remain separate, is that Chevron will do an investigation that does not include those items and there will be needless delays for both sites, as well as GVP having to perform additional work to prove what the RWQCB has already concluded – the plume is commingled down gradient of 1 Order R2-1989-0038 was issued with respect to two sites in Cupertino, CA. Two separate release areas at two separate locations were the subjects of this single order. The Siemens Site had releases of CVOCs from underground waste solvent tanks and an acid dilution basin. The Intersil Site nearby had releases of CVOCs from underground waste handling systems. In a situation very similar to the situation here, the Intersil/Siemens Order states that “[t]he groundwater pollution plumes from Siemens and Intersil have commingled in the A-zone and have migrated to the B-zone and C-zone. The off-site groundwater pollution plume extends approximately 2500 feet down gradient from the sites” (paragraph 6). 2 On a side note, GVP would like to point out that it has worked very hard with the Staff under the Spills, Leaks, Investigation and Cleanup program and has cooperated to mitigate detections of PCE in the neighborhood north of the GVP site. In light of this fact, we find it disturbing that the GVP parties are the only ones that are being expressly required by an order to work on any off-site matters or the deep aquifer. It does not appear to be an approach that will encourage cooperation from parties in the future.

3
P&K cleaners and in the neighborhood. There is no justification to place this extra burden on GVP. In short, a single order is imperative to avoid confusion, higher costs for all parties, and the unnecessary expenditure of valuable Staff resources in mediating disputes between the parties that would occur with separate orders. II. CCCSD Must Be Named to the Order Based on the law and the evidence, CCCSD must be named to the two orders or to a single order for the entire area because, as will be described in detail below, CCCSD is a discharger under the Water Code, and a responsible party under a hybrid Water Code/Superfund (CERCLA) analysis, which the Staff has appeared to have adopted. In addition, as will be discussed below, there is strong evidence that the sewers leaked in both the neighborhood and near the Chevron Site and these leaks are sources of PCE that is detected in soil gas and groundwater.
a) CCCSD Is a Discharger Under Section 13304 of the California Water Code This matter is straightforward. Section 13304 of the Water Code defines a discharger as “(a) Any person who has discharged or discharges waste into the waters of this state … who has caused or permitted, causes or permits, or threatens to cause or permit any waste to be discharged or deposited where it is, or probably will be, discharged into the waters of the state and creates, or threatens to create, a condition of pollution or nuisance...” Further, Section 13030 of the Water Code states that a: “Person includes any city, county, district, the state…” (emphasis added). Section 13304 is a strict liability statute. Strict liability means that an entity has legal responsibility for damages or injuries even if the entity was neither at fault nor negligent. The statute contains no exceptions or defenses. Simply put, if an entity’s actions fit into the definition, it is a discharger.3 3 The Staff Report points out that CERCLA is also a strict liability statute, and that the cases under CERCLA, while “not binding precedent … do provide useful guidance” (footnote 7 on page 12). We agree. However, the Staff report also states that: “courts have refrained from identifying sewer owner/operators as “responsible parties” (the CERCLA rough equivalent of the Water Code’s “discharger”) merely because they owned or operated a sewer system”. This is not a true statement. The Staff Report quotes language from or refers to the Fireman’s Fund, Lincoln Properties and Adobe Lumber cases. In referring to these cases, the Staff Report is misleading and incomplete. For example, the Staff Report is misleading because the quote from Fireman’s Fund is in fact “dicta” and not a holding (i.e. not binding law). The Staff quoted that case as follows: “[“it is doubtful whether Lodi may be considered a PRP merely as a result of operating its municipal sewer system”]”. However, the entire quote from the Court of Appeals in Fireman’s Fund is: “While we decline to decide whether Lodi is a PRP on the record before us, we note that it is doubtful whether Lodi may be considered a PRP merely as a result of operating its municipal sewer system” (emphasis added). After discussing the various cases on the issue, some of which hold that an owner of a sewer lines is liable for discharges of hazardous waste and some of which hold the opposite, the Court of Appeals remanded (i.e. sent back) to the District Court the question of whether Lodi is a PRP. [On remand, the District Court determined that Lodi is a PRP (a holding based on Lodi’s admission in open court that it was a PRP)]. Note also that Lincoln Properties does not hold what the Staff asserts. In that case, the court held that as an owner of the sewer system: “…as a matter of law, the County may be liable for releases from its facilities – viz, its portion of the sewer …” (emphasis added) (823 F. Supp. at 1539). The court then found that the County had an affirmative defense under CERCLA [a portion of that defense was later rejected in Adobe Lumber]. The Staff Report is misleading because it references Adobe Lumber (659 F. Supp.2d 1188 (E.D. Ca. 2009)) to support its statement that: “courts have refrained from identifying sewer owner/operators as

4
GVP has made this point to you before in letters dated July 3, 2012, December 18, 2012 and May 28, 2013 (“GVP Letters”). Due to the length of the letters, they are not attached in their entirety to these comments, but the letters and associated exhibits are in the Regional Board’s files and on GeoTracker. They are an important part of the administrative record for the sites and are incorporated by this reference. Rather than reiterate the points that were made in the letters here, we want to highlight the fact that this question was answered many years ago by the Office of the Chief Counsel of the State Water Resources Control Board. In a letter to Walt Pettit, Executive Director of the State Water Resources Control Board dated April 27, 1992, William R. Atwater, Chief Counsel, reviewed testimony of the Central Valley Regional Water Quality Control Board as follows:
The Staff gave testimony that PCE is discharged to the sewer system by dry-cleaning operations, and that it escapes the sewer collection system by various means, including leaks and permeation as a gas. For purposes of this memorandum, it will be assumed that the testimony of the Regional Water Board staff regarding the movement of PCE through sewer pipes is accurate. Making that assumption, this memorandum will address whether such releases from sewer pipes which are part of the collection system of a POTW are adequate grounds for holding the operator of the POTW responsible for cleanup and abatement of the PCE.
Based on the above facts, Mr. Atwater determined the following:
These owners and operators have sole control over the collection systems and responsibility for proper operation and maintenance. Water Code Section 13304 authorizes the issuance of cleanup and abatement orders to persons who “cause” or “permit” discharges which cause pollution or threaten pollution of ground water. It is clear that owners and operators of POTWs, from which hazardous wastes such as PCE leak or permeate, have caused or permitted such discharges…
Under Section 13304, both the owner or operator of the POTW, who controls the collection system and has responsibility for discharges therefrom, and the dry cleaner who places the waste into the collection system, may be held responsible.
A copy of this memorandum is attached as Exhibit A. “responsible parties” (the CERCLA rough equivalent of the Water Code’s “discharger”) merely because they owned or operated a sewer system.” But that premise is never discussed or considered by the court in the case. Rather, the court found that the City of Woodland was a PRP, that its sewers were “facilities” under CERCLA, and that it was a responsible party under CERCLA. The court refused to dismiss the City from the case and allowed the case to go to trial. It did allow the City to try to carry the burden at trial to establish the innocent party defense under CERCLA §9607(b)(3). Finally, the Staff Report is incomplete because it fails to mention Westfarm Assocs. v. Wash. Suburban Sanitary Comm’n, 66 F.3d 669, (4th Cir.1995) in which the Court of Appeals held that a municipal operator of a sewer system is liable under CERCLA for the acts of a third party that discharges hazardous waste into the system.

5
Given the clarity of the law as described by the Chief Counsel (and that there does not appear to be any dispute over whether CCCSD owns the sewers) the only open question in this analysis is whether the sewers leaked. And CCCSD sewers did in fact leak. It is common knowledge that discharges from sanitary sewers into soil and groundwater around and beneath sanitary sewers continuously occur. By their very design and construction, sanitary sewers leak. If PCE from dry cleaners is placed into a sanitary sewer, it will leak out in many different ways. This fact was discussed in detail in “Dry Cleaners - A Major Source of PCE in Ground Water, Regional Water Quality Control Board, Central Valley Region” (1992), the so-called “Izzo Report”, and has been generally accepted by experts in the field since that publication was released. The Izzo Report is attached as Exhibit B. Additionally, in its records, CCCSD has acknowledged that there have indeed been root intrusions, cracks, and sags in the sewer in the Gregory Village area, which make the likelihood and extent of leakage greater. Finally, the data reflect that leakage from the pipes occurred both near the Chevron property and in the neighborhood downgradient of the Gregory Village property. GVP’s letters present a very detailed analysis describing how the sewers leaked; consequently, those details will not be repeated here. However, because of the critical nature of this fact we would like to remind the Regional Board of the following: 1) CCCSD accepted PCE from dry cleaners into its sanitary sewers; 2) CCCSD’s sanitary sewer lines were installed with a substantial allowable leakage tolerance; 3) sanitary sewer lines built in the 1950s and 1960s used joint compounds that failed and leaked; 4) over time, sanitary sewer lines sag and break due to local earth movements caused by earthquakes, large vehicles passing over the lines, etc.; and 5) PCE as liquid and as vapor escapes from sanitary sewers in the ways described in the Izzo Report, including through places where roots have penetrated and through the pipes themselves. Exhibit C is a short presentation of some of the data by Erler & Kalinowski, Inc. (“EKI”) that provides strong evidence that the sewers leaked in both the neighborhood and near the Chevron Site and these leaks are sources of PCE that is detected in soil gas and groundwater. Exhibit D is a declaration from Bonneau Dickson, P.E. a sanitary sewer expert that provides additional background on sewer construction and operation and discusses how sewers leak in general, and how PCE leaves sewer pipes and enters the environment, including PCE migration in backfill and up-slope as vapor.
b) CCCSD Is Liable Under a Hybrid Water Code/CERCLA Analysis When Appropriate Standards of Proof Are Applied GVP does not believe any further analysis is necessary to find CCCSD liable as a discharger under the Water Code because the Water Code has a strict liability standard and there is evidence that CCCSD’s sewers leaked PCE.

6
However, the Staff proposes four, new, non-statutory criteria that must be met for CCCSD to be named a discharger. These criteria are 1) there was a release from the sewer main that contributed to the plume; 2) the sewer owner/operator knew of leaks and failed to repair them; 3) the sewers were in poor condition and/or were not maintained; and, 4) the sewer owner/operator was aware of/or permitted discharges into a leaking sewer. From discussions with the Staff, GVP understands that these criteria are based on the City of Lodi case, where the City, as the sanitary system operator, was named as a discharger.4 To GVP’s knowledge, these criteria (or similar criteria) have never been published or publicly used by the Staff to determine whether an entity is a discharger. The criteria do not appear in the City of Lodi Order. The criteria are not in California law or regulations. The Staff’s creation of the four criteria appears to be based on a wayward adoption of some concept of CERCLA defenses as a justification for not naming CCCSD as a discharger. Under CERCLA, once a party has been determined to be an owner or operator of a facility from which a release has occurred, it can only escape liability if it pleads and proves the elements of an affirmative defense.5 It is not up to a regulatory agency to make the defense for an otherwise responsible party; the party itself must prove its defense by a preponderance of the evidence. In creating these criteria, the Staff has adopted an approach that has no connection to the concept of a “discharger” in the Water Code. Additionally, the Staff has converted an affirmative defense to be used only by an already responsible party under CERCLA into something wholly different: a methodology used by a regulator as a pretext to discount and avoid evidence. The Staff is forcing other responsible parties to prove the Staff wrong when, in fact, CCCSD should be proving it qualifies for the defense. By its language, the Staff believes that someone else must present some amount of evidence (and the Staff has not shared what that amount is) to support all four criteria before the Staff will name a sanitary district a discharger.
4 It should be noted that there is at least one other applicable California precedent that is not mentioned in the Staff Report. The site is located in Sacramento and is under the jurisdiction of the Central Valley Regional Board. In that case a sanitary district recognized that it was responsible for leaks from its sewer system and voluntarily led the effort to clean up PCE that leaked from its sewers. As presented in that Board’s Executive Officer’s Report dated 23/24 June 2005, the Sacramento County Sanitation District 1 [CSD] “owns and maintains the sewer lines to which wastewater containing PCE was disposed and from which PCE was released to the soil and groundwater. The CSD is cleaning up the soil and groundwater pollution on behalf of itself and all the other responsible parties, including the former owners and operators of Southgate Norge Dry Cleaners.” 5 CERCLA has an affirmative defense (42 USC Sec. 9607(b)(3)) that can be used by an otherwise liable person. This provision provides: “There shall be no liability under subsection (a) of this section for a person otherwise liable who can establish by a preponderance of the evidence that the release or threat of release of a hazardous substance and the damages resulting therefrom were caused solely by (3) an act or omission of a third party other than an employee or agent of the defendant, or than one whose act or omission occurs in connection with a contractual relationship, existing directly or indirectly, with the defendant … if the defendant establishes by a preponderance of the evidence that (a) he exercised due care with respect to the hazardous substance concerned, taking into consideration the characteristics of such hazardous substance, in light of all relevant facts and circumstances, and (b) he took precautions against foreseeable acts or omissions of any such third party and the consequences that could foreseeably result from such acts or omissions…”

7
i) The Staff has not fairly evaluated the available data and provides no clear standard for its evidentiary burden of proof If, for arguments sake, one were to accept that the burden was on non-CCCSD parties to prove that the four criteria were met, given the available data, GVP believes that the criteria have been met and believes that the Staff has not performed a fair evaluation. Instead, the Staff has accepted every statement by CCCSD regarding CCCSD’s evaluation of the data as true and rejected any interpretation that is inconvenient or contradicts CCCSD’s position. (This is an odd approach by the Staff given CCCSD’s assertion to the Staff that it never allowed PCE from dry cleaners to be discharged into its system, when in reality it allowed these discharges until 2007. This fact alone should have cast serious doubt on CCCSD’s credibility.) Rather than objectively analyzing the evidence, or providing clarity as to how it is analyzing the evidence, the Staff instead uses conclusive and inaccurate statements to dismiss any evidence with which it does not agree.6 ii) There is clear evidence to support all four criteria Even though the burden is clearly on CCCSD to exonerate itself, the GVP Letters and Exhibits B, C and D provide the evidence that CCCSD should be named a discharger because the four criteria have been met. Nevertheless, it is instructive to focus, as an example, on information related to CCCSD’s maintenance program, which is the core of two of the Staff’s criteria. CCCSD’s maintenance practices regarding sewer blockages and sewer backups, which appear to be reactive, have remained substantially the same over time. A CCCSD outreach document from 1975 describes rodding in response to sewer backups into homes, a purely reactive approach to the problem. A copy of that document is attached as Exhibit E. In 1983, the Regional Board requested CCCSD respond as to how it was addressing maintenance issues due to concerns over sewer backups. Again CCCSD
6 A review of the Staff’s language in Section VI of the Staff Report regarding why CCCSD is not a discharger is revealing. Nowhere is there a clear explanation regarding the amount and type of evidence that is required. What is clear is that burden of proof was mistakenly put on the other responsible parties rather than CCCSD as all the references are to insufficient evidence or lack thereof. More specifically: - In the second paragraph of the Section, the Staff Report “concludes there is insufficient data to assert that a discharge from CCCSD’s sewer lines resulted in the contamination at issue…” (emphasis added). - In the first paragraph of page 13, the Staff states: “there is no direct evidence that leaking sewer lines under CCCSD ownership have caused or contributed significantly to the groundwater contamination” (emphasis added). - In item #1 on page 13, the Staff Report states: “While there is evidence of incidental leakage from the sanitary sewer lines, there is no direct evidence the leakage contributed substantially to the creation of the CVOC commingled groundwater plume” (emphasis added). - On page 14, in the data discussion of Apparent Source Area in the Vicinity of Manhole M46, the Staff Report states: “Staff does not find this single data set to be compelling evidence of a source area…” (emphasis added). - On page 14, in the data discussion of Suspected Source Area in Linda Drive Along Sewer, the Staff Report states: “There is insufficient soil and groundwater data to reach the conclusion that the older sewer line was a release point” (emphasis added). - In Instance 2 on page 15, the Staff Report states: “Staff does not find evidence of major repairs [NB: there is no definition of “major repairs”] needed on the CCCSD sewer lines in the area of the groundwater contamination. There is no tangible evidence CCCSD was aware of any needed repair beyond routine maintenance” (emphasis added).

8
described a reactive maintenance system. A copy of that letter is attached as Exhibit F. As stated by B. Dixon in his Declaration (Exhibit D, p. 7):
The CCCSD sewer maintenance program consists of cleaning the sewers at various intervals, responding to blockages and sanitary sewer overflows (SSOs) when they occur, and repairing defects when they are found if the defects are deemed to be significant and to require repair. Root penetrations usually are corrected by cutting out the roots or by chemically treating the roots. These methods of getting rid of the roots do not get rid of the openings through which they entered the pipes, i.e. the maintenance procedures are aimed at restoring flow in the sewers but not at stopping leakage from the sewers… Cleaning the sewers tends to reduce the number of blockages that occur but does nothing to stop the sewer pipes from leaking. Similarly, clearing blockages merely clears the sewer pipe, but does not address leaks.
Nothing exemplifies this reactive nature better than CCCSD describing the sewer pipe in Linda Drive adjacent to the Chevron Site in 1977 as “in very poor shape has lots of cracks” but taking at least ten years to replace it. (iii) CCCSD’s assertion that the system is currently in good condition and that it has recent awards for operation and maintenance are not relevant in understanding that its sewers released PCE In its May 28, 2013 response to the Staff’s 13267 letter requesting evidence concerning how CCCSD maintained its system, CCCSD provided no material other than the sparse records that had already been produced in response to GVP’s Public Records Act request. CCCSD provided no evidence of its operations prior to the 1990’s, it merely stated: “the sanitary sewer lines in the Gregory Village area are in good condition, meaning that they were in even better condition in the past…” CCCSD continued: “It is a truism that the capability of sanitary sewer collection systems to retain wastewater does not improve over time and that absent replacement or other major repairs, sewer lines are in the best condition when they are newer” (page 2). “As summarized below, the general condition of the sanitary sewers in the Gregory Village area is good, which means their condition was at least as good, if not better, during the period of time the dry cleaners operated in the area (1956-1991)” (page 3).7 However, CCCSD provided no information and attached no records or documents in its letter regarding these earlier time periods to support this “truism” that, incidentally, is not
7 CCCSD asserts that the “general condition” of the area sewers is “good”. In fact, CCCSD’s records, including its video logs of the sewers, identify sags, cracks and root penetrations, which calls into question what CCCSD’s statement really means.

9
a “truism.” As discussed in Exhibit D (Declaration of B. Dickson), sanitary sewer pipes begin to leak soon after they are installed. The fill in which the pipes were placed settles, causing sags and joint failures in the installed system. In further response to the Staff’s questions concerning maintenance, CCCSD states:
The District operates an award winning operation and maintenance program for its sanitary sewer collection system. These awards are not given out lightly ... Because these award programs have only been in existence for the past 20-25 years, these awards were received after the dry cleaning operations in the Gregory Village area ceased. However, if awards were available prior, the District is confident that its operation and maintenance programs and personnel would have received them (p. 12).
GVP questions whether the statements that the system is now in good condition and that the program is recently “award winning” has any probative value in this situation. To this day, CCCSD’s maintenance system is focused on keeping the sewage flowing, not to prevent leaks from its pipes into the groundwater. Maintenance, short of failure or imminent failure of a pipe, is primarily rodding or chemical treatment to remove roots and other obstructions. These techniques do not repair the cracks or holes created by the roots and, in fact, are reactive – they only address the issue once the roots have substantially penetrated the pipes, long after creating a leakage point (see Exhibit D Declaration of B. Dickson). iv) Lack of evidence should not be used to CCCSD’s benefit Given the Staff’s approach, we note that it is in a sanitary district’s best interest to have no evidence or records that may help to establish, under the Staff’s criteria, that the district is a discharger. Later in the letter to the Staff, CCCSD admits that it has no maintenance records:
Up until the early 1990s, maintenance was tracked by a manual card system (cardex system). Although the cardex records were not retained, the system was used to effectively plan and track the maintenance events on individual sanitary sewer lines including the lines in the Gregory Village area.
Given that there is no substantive evidence that the sewers did not leak, the key question remains: What inference should be drawn concerning the behavior of CCCSD and the quality of its operation in the absence of records or where records have been destroyed? The Staff believes that the lack of records from before 1990 means that it can’t be proven that the CCCSD has any liability. However, the Staff has its analysis backward – in the absence of historical evidence, given that the burden of proof is on CCCSD – the Staff must conclude that CCCSD has not met its burden of proof and is thus a discharger.

10
In short, the evidence is that a) all sanitary sewers leak PCE (see the Izzo Report), b) according to the Staff Report, CCCSD allowed PCE to be discharged to its system (page 16, #4), and c) CCCSD’s system leaked. In this circumstance, there should be no controversy: CCCSD should be named a discharger in the order.
c) There are strong policy reasons for holding the CCCSD is a discharger The Staff has noted that there are policy reasons for not holding CCCSD liable as a discharger, but has failed to enumerate those reasons. It appears that the Staff’s policy reason for not holding CCCSD liable is that costs of investigation and cleanup should not be shifted to the taxpayers and ratepayers when there are other parties that might pay.8 This argument gives little incentive for CCCSD to repair damage caused by root intrusions or heavy traffic rather than just clearing the pipe, which it still does to this day, unless there is an actual or imminent pipe failure. Another policy argument that could be made is that CCCSD should not be liable a discharger because CCCSD is a mere conveyor of materials doing a public service and that it should not, from a public policy perspective, be held responsible for leaks from its system of material that others placed in its system that subsequently leaked out. But CCCSD is not a “mere conveyor.” As noted in the Staff Report (p. 16), CCCSD knowingly accepted CVOCs, including PCE, into its system and thus should be liable for these releases.9 10 To fail to name CCCSD to the order sends a message that sanitary districts are not liable for discharges in violation of the Water Code in the face of clear RWQCB precedent to name sanitary districts for such violations. Sanitary districts are frequently named in orders. Usually this is a result of the sanitary district failing to prevent or control the 8 This argument was made in a CERCLA context by another sanitary district that was contesting liability for releases of PCE that had been discharged to that district’s sanitary sewer. In that case, the Court of Appeals rejected the argument. See Westfarm Assocs. v. Wash. Suburban Sanitary Comm’n, 66 F.3d 669, (4th Cir.1995): “[w]hile the public policy arguments raised by WSSC may be meritorious, we can only presume that those arguments were weighed and rejected by Congress when it enacted CERCLA without including a broad exemption for state and local governments or their POTWs.” Similarly, the Water Code contains no “sanitary district” exemption preventing a district from being named a discharger. As noted earlier, “districts” are a “person” subject to Water Code Section 13304. Section 13030 of the Water Code states that a: “Person includes any city, county, district, the state…”(emphasis added). 9 The Staff has misinterpreted CCCSD’s regulations with respect to the amount of PCE it allowed to be discharged into its system. As the Staff correctly states: “Prior to 2007, CCCSD allowed for PCE to be discharged to the sanitary sewer within specified limits. For example, Ordinance No. 99 (adopted on July 11, 1974) allowed the discharge of “Total Identifiable Chlorinated Hydrocarbons” to sanitary sewers at a concentration not exceeding 0.002 mg/L for “50% of time” and not exceeding 0.004 mg/L for “10% of time.” But the Staff then incorrectly concludes, with respect to the period prior to 1981: “The allowable PCE discharge concentrations before 2007 were far lower than what would be expected in PCE-impacted wastewater, which would be on the order of 150,000 µg/L.” In fact, prior to 1981, CCCSD’s restrictions were temporal, which means that extremely high concentrations, including pure PCE, could be discharged to CCCSD’s sewers so long as the discharges did not violate the temporal restriction contained in the applicable ordinance. 10 A close analogy for holding CCCSD liable involves municipal landfills, as stated in Adobe Lumber: “see, e.g., Transportation Leasing Company. v. The State of California (CalTrans), 861 F. Supp. 931, 939 (C.D.Cal.1993) (holding municipalities liable for contamination from a landfill even though their conduct constituted a “non-contributory exercise of sovereign power”)…” Also, the Court of Appeals in B.F. Goodrich v Murtha, 958 F. 2d 1192, 1199 (2nd Cir.1992) held that there was no exemption under CERCLA “for municipalities arranging for the disposal of municipal solid waste that contains hazardous substances simply because the municipality undertakes such action in furtherance of its sovereign status.”


EXHIBIT A

+Sthte'ck California
M e m o r a n d u m
a .. Walt PettitExecutive Director
Date: APR 21 1992
William R. AttwaterChief Counsel
OFFICE OF THE CHIEF COUNSELFrom : STATE WATER RESOURCES CONTROL BOARD
Subject: RESPONSIBILITY OF OPERATORS OF PUBLICLY OWNED AND OPERATED SEWERSYSTEMS FOR DISCHARGES FROM THEIR SYSTEMS WHICH POLLUTE GROUNDWATER
ISSUE
Is the operator of a publicly owned and operated sanitary sewersystem responsible for discharges of waste from its sewer systemwhich pollute or threaten to pollute ground water?l
Conclusion
Public agencies which own or operate sanitary sewer systems areresponsible for discharges of waste from their collection andtreatment systems. If the waste creates or threatens to createa condition of pollution or nuisance, the public agencies may beordered to clean up the wastes or abate the effects thereof.
Discussion
The Central Valley Regional Water Quality Control Board(Regional Water Board) has requested an opinion concerningwhether operators of publicly owned treatment works (POTW) areresponsible for releases of waste through their sewer collectionsystems. The issue arose in the Regional Water Board's
1 The issue here involves situations where discharges of volatile organicsto.publicly owned treatment works escape from the collection system prior totreatment. The chemical releases occur prior to the planned discharge fromthe system, and also do not occur through any outfall established foroverflows. Rather, the releases are considered leaks through the collectionrsystem.

Walt Pettit -2- APR27 1992 .
consideration of adoption of a cleanup and abatement order (CAO)regarding discharges of solvents used in dry cleaning.
According to testimony of the staff of the Regional Water Board,the use of perchloroethylene (PCE) as a solvent in dry-cleaningoperations has resulted in the detection of PCE in ground waterand the creation of pollution or threats of pollution of waterused for human consumption. The staff gave testimony that PCEis discharged to the sewer system by dry-cleaning operations,and that it escapes the sewer collection system by variousmeans, including leaks and permeation as a gas. The result isthat PCE has been detected in ground water and in municipalwells at levels which threaten to exceed drinking waterstandards.
For purposes of this memorandum, it will be assumed that thetestimony of the Regional Water Board staff regarding themovement of PCE through sewer pipes is accurate. Making thatassumption, this memorandum will address whether such releasesfrom sewer pipes which are part of the collection system of aPOTW are adequate grounds for holding the operator of the POTWresponsible for cleanup and abatement of the PCE.
Section 13304(a) of the Water Code describes persons who may beheld responsible for cleanup and abatement of pollution orthreatened pollution:
"Any person who has discharged or discharges wasteinto the waters of this state in violation of anywaste discharge requirements or other order orprohibition issued by a regional board or the stateboard, or who has caused or permitted, causes orpermits, or threatens to cause or permit any waste tobe discharged or deposited where it is, or probablywill be, discharged into the waters of the state andcreates, or threatens to create, a condition ofpollution or nuisance . ...' (Emphasis added.)
The issue, therefore, is whether operators of POTWs can be foundto "cause" or "permit" the discharge of PCE through the sewerpipes and, thence, to ground water where it creates or threatensto create a condition of pollution or nuisance.
The first issue in determining responsibility for dischargesfrom the sewer pipes is whether the operator is the owner of thecollection system. POTWs are defined by the federalEnvironmental Protection Agency (EPA) as: ,
"[A]ny device and system which is used in thetreatment (including recycling and reclamation) of

._ -
Walt Pettit _3_ .' APR 8 7 _I992
municipal sewage or industrial wastes of a liquidnature which is owned by a ‘State' or 'municipality'.This definition includes sewers, pipes, or otherconveyances only if they convey wastewater to a POTWproviding treatment." 40 CFR Section 122.2.
The language in Section 122.2 clearly includes sewage collectionsystems within the term "treatment works". Throughout thefederal Clean Water Act, responsibilities for such systems isplaced upon the public owners of "treatment works". See, e.g.,Sections 301(b)(l)(B), 301(h), 402(b)(8). While the PCE in thematter before the Regional Water Board leaked from the sewerpipes prior to treatment, these pipes are clearly intended toconvey wastewater to the POTW. See Montgomery EnvironmentalCoalition v. Castle (3d Cir. 1980) 646 F.2d 568 (POTWresponsible for discharges from overflow points). It must beconcluded..that the owner or operator of a POTW is responsiblefor discharges from the sewer collection system.
The responsibility of owners and operators of .POTWs fordischarges into the collection system is also reflected in theprovisions of the California Water Code. Section 13260 providesthat the Regional Water Boards may prescribe waste dischargerequirements for all discharges "except discharges into acommunity sewer system". Section 13260 clearly shiftsresponsibility to the owner or operator of the POTW once thewaste is placed in its system. See State Water Board OrderNo. WQ 80-2 (permit properly included public entitiesresponsible for conveyance of pollutants to a treatmentfacility, as well as the public entity responsible for treatmentoperation). For discharges which are subject to NPDES permits,the POTW owner or operator may in turn place pretreatmentrequirements upon dischargers to its system. Water CodeSection 13370.5. Because owners or operators of POTWs areresponsible for discharges into the collection system, itfollows that they must be responsible for releases therefrom.These owners and operators have sole control over the collectionsystems and responsibility for proper operation and maintenance.Water Code Section 13304 authorizes the issuance of cleanup andabatement orders to persons who "cause" or "permit" dischargeswhich cause pollution or threaten pollution of ground water. Itis clear that owners and operators of POTWs, from whichhazardous wastes such as PCE leak or permeate, have caused orpermitted such discharges.
It is important to note that unlike Section 13260, Section 13304of the Water Code does not restrict its application todischargers to POT'W. Instead, Section 13304 more broadlyapplies to any person:
"[W]ho has caused or permitted, causes or permits, orthreatens to cause or permit.any waste to be

Walt Pettit
01
-4- APR 27 W
discharged or deposited where it is, or probably willbe, discharged into the waters of the state . ..."
Under Section 13304, both the owner or operator of the POTW, whocontrols the collection system and has responsibility fordischarges therefrom, and the dry cleaner who places the wasteinto the collection system, may be held responsible.
cc: Dale Claypoole, EXEC
.
.
.

EXHIBIT B

D R Y C L E A N E R S � A
M A J O R S O U R C E O F
P C E I N G R O U N D W A T E R 27 March 1992
WELL INVESTIGATION PROGRAM
STATE OF CALIFORNIA
RE
GIO
NA
LW
ATER QUALITY CONTRO
LB
OA
RD
★ ★
CENTRALVALLEYREGION
CENTRAL VALLEYCITIES WHERE MUNICIPAL WELLS ARE AFFECTED BY
TETRACHLOROETHYLENE (PCE)
CHICOOROVILLEROSEVILLESACRAMENTOELK GROVELODISTOCKTONMODESTOPATTERSONTURLOCKMERCEDLOS BANOSFRESNOVISALIAPORTERVILLEBAKERSFIELD

Page 25 Regional Water Quality Control BoardCentral Valley Region
STATE OF CALIFORNIAPete Wilson, Governor
CALIFORNIA ENVIRONMENTAL PROTECTION AGENCYJames M. Strock, Secretary
REGIONAL WATER QUALITY CONTROL BOARDCENTRAL VALLEY REGION
John S. Corkins, ChairKarl E. Longley, Vice Chair
Hank Abraham, MemberA. Vernon Conrad, Member
Hugh V. Johns, MemberW. Steve Tompkins, MemberClifford C. Wisdom, Member
________
William H. Crooks, Executive Officer________
3443 Routier Road, Suite ASacramento, California 95827-3098
________
Phone: (916) 361-5600CALNET: 8-495-5600
Current address & phone:11020 Sun Center Drive #200Rancho Cordova, CA 95670
(916) 464-3291
DISCLAIMER
This publication is a technical report by staff ofthe California Regional Water Quality Control Board,
Central Valley Region.No policy or regulation is either expressed or intended.
Page 1 Regional Water Quality Control BoardCentral Valley Region
DRY CLEANERS—A MAJOR SOURCEOF
PCE IN GROUND WATER
VICTOR J. IZZOAssociate Engineering Geologist
Approved by the California Regional Water Quality Control Board,Central Valley Region on 27 March 1992
INDEX
EXECUTIVE SUMMARY . . . . . . . . . . . . . . . . . . . . . . . . . . . . . . . . . . . . . . . . . . . . . . . . . . . . . . . . . 2
INTRODUCTION . . . . . . . . . . . . . . . . . . . . . . . . . . . . . . . . . . . . . . . . . . . . . . . . . . . . . . . . . . . . . . . 3
TETRACHLOROETHYLENE (PCE) . . . . . . . . . . . . . . . . . . . . . . . . . . . . . . . . . . . . . . . . . . . . . . . . 3
SOURCE IDENTIFICATION OF PCE DEGRADED WELLS . . . . . . . . . . . . . . . . . . . . . . . . . . 5Source Investigation . . . . . . . . . . . . . . . . . . . . . . . . . . . . . . . . . . . . . . . . . . . . . . 5Results of PCE Source Investigation . . . . . . . . . . . . . . . . . . . . . . . . . . . . . . . . . 6
DRY CLEANERS OPERATION AND DISCHARGE LOCATIONS . . . . . . . . . . . . . . . . . . . 9
EVIDENCE AND THEORY ON HOW PCE IS LEAVING THE SEWER LINE . . . . . . . . . . 10Soil Gas Survey . . . . . . . . . . . . . . . . . . . . . . . . . . . . . . . . . . . . . . . . . . . . . . . . . . 11Sewer Main Sampling . . . . . . . . . . . . . . . . . . . . . . . . . . . . . . . . . . . . . . . . . . . . 16City of Merced . . . . . . . . . . . . . . . . . . . . . . . . . . . . . . . . . . . . . . . . . . . . . . . . . . . 16Theories on How PCE Leaks From Sewer Lines . . . . . . . . . . . . . . . . . . . . . . 19
CONCLUSION AND RECOMMENDATIONS . . . . . . . . . . . . . . . . . . . . . . . . . . . . . . . . . . . . 21
REFERENCES . . . . . . . . . . . . . . . . . . . . . . . . . . . . . . . . . . . . . . . . . . . . . . . . . . . . . . . . . . . . . . . . . . 23

Dry Cleaners—A Major Sourceof PCE in Ground Water
Page 2
the sewer lines is the major avenue through whichPCE is introduced to the subsurface. With approxi-mately 285 dry cleaners in just the metropolitan areasof Sacramento, Chico, Lodi, Modesto, Turlock, Stock-ton and Merced, one would expect that many morewells will be degraded by PCE in the future. Most ofthe wells degraded by PCE and most of the drycleaners are in residential and retail areas. Based onthe data collected to date and the location of most ofthe degraded wells with confirmed PCE, a greatmajority of these wells will have dry cleaners as thesource.
The solution to part of the problem is to halt thedisposal of waste from dry cleaning units to the sewerline. Regulation of this discharge to the sewer couldbe achieved through new legislation and city ordi-nance. Since this problem exists throughout the state,a statewide policy seems appropriate.
The other part of the problem is ground water cleanup
EXECUTIVE SUMMARY
Tetrachloroethylene (PCE), a known carcinogen, hasdegraded at least 215 wells in the Central Valley ofCalifornia. Figure 1 illustrates the extent of theproblem. The majority of these wells are large systemmunicipal wells of 200 connections of more. TheChico, Sacramento, Modesto, Fresno, Turlock, Lodiand Merced areas all have wells with levels of PCEabove 0.8 ppb which is the estimated one in a millionincremental cancer risk (8). The Maximum Contami-nant Level (MCL) set by the Department of HealthServices for drinking water is five ppb. Forty-seven ofthe 215 wells have PCE levels above the MCL.
The Well Investigation Program of the Central ValleyRegional Water Quality Control Board so far hasidentified the likely PCE sources in 21 of the wells; in20 of those wells, dry cleaners are the likely source. Inareas where PCE well investigations were done, drycleaners are the only present large quantity users ofthis volatile organic chemical (VOC). The Haloge-nated Solvent Industry Alliance 1987 white paper onPCE states that dry cleaners use 56% of the PCE usedin United States (5). All dry cleaners in the vicinity ofdegraded supply wells show evidence of majorground water degradation. Monitoring wells drilledadjacent to dry cleaners had concentration from 120ppb to 32,000 ppb, well above the MCL.
The main discharge point for dry cleaners is the sewerline. The discharge from most dry cleaning unitscontains primarily water with dissolved PCE, but alsocontains some pure cleaning solvent and solidscontaining PCE. Being heavier than water, PCE settlesto the bottom of the sewer line and exfiltrates throughit. This liquid can leak through joints and cracks in theline. PCE, being volatile, also turns into gas andpenetrates the sewer wall. Sewer lines are not de-signed to contain gas. The PCE then travels throughthe vadose zone to the ground water.
Where a source investigation has been done inconnection with PCE contamination, the evidence hasshown that dry cleaners have degraded the groundwater. The data strongly indicate that leakage through
Figure 1
0 50 100 150 200
Miles
CENTRAL VALLEYCITIES WHERE MUNICIPAL WELLS ARE AFFECTED BY PCE
CHICOOROVILLEROSEVILLESACRAMENTOELK GROVELODISTOCKTONMODESTOPATTERSONTURLOCKMERCEDLOS BANOSFRESNOVISALIAPORTERVILLEBAKERSFIELD

Page 3 Regional Water Quality Control BoardCentral Valley Region
which is required so that cities can continue to providesafe water. A state wide fund may be needed to helppay for cleanup.
INTRODUCTION
Over 750 wells have been reported to the CaliforniaRegional Water Quality Control Board, Central ValleyRegion, with confirmed levels of volatile organicchemicals (VOCs). Greater than 35% of the reportedwells contain tetrachloroethylene (PCE). Municipaldrinking water supplies have been affected by PCEthroughout the Central Valley (Figure 1). At least onecity is already treating contaminated ground water inorder to continue its water supply.
This report discusses some of the data and conclusionsabout PCE movement to ground water, the source ofthe PCE, and possible solutions. The report is dividedinto six sections.
*Introduction
* Tetrachloroethylene (PCE)A brief description of the use of PCE and itsphysical and chemical properties.
* Source Identification for PCE Degraded WellsA description of how Board staff determines thesource of VOC(s) in a well and the results ofPCE source investigations.
* Dry Cleaning Operations and Discharge LocationsGeneral discussion of dry cleaning operationsand waste discharge points.
* Evidence and Theory on How PCE is Leaving theSewer
* Conclusion and Recommendations
TETRACHLOROETHYLENE (PCE)
PCE was first formulated in 1821 (22). By the 1960’sand early 1970’s, it had become a widely used solventin dry cleaning, metal degreasing and other industries
(18). In the late 1970’s, most industries moved awayfrom the use of PCE. The exception was the drycleaning industry. By the early 1980’s, dry cleanersused the majority of the PCE in this nation (18). In thelate l980’s, dry cleaners used 56% of the PCE used inUnited States (5).
Compared to many VOCs, PCE is very mobile, withrelatively low solubility and vapor pressure. In itsliquid state, it is heavier and less viscous than waterand will sink through it. In the vapor phase, PCE’sdensity is greater than air. PCE biodegradability islow in the subsurface. The following are some of thephysical and chemical properties of PCE:
Molecular Weight 165.85 gSolubility 150 mg/l at 25°CVapor Pressure 14 torrDensity 1.63 g/cmBoiling Point 121 °CKinematic Viscosity 0.54 (water=l)Henry’s Law Constant 0.0131 atm-m /moleVapor Density 5.83 (air=1)Specific Gravity 1.63 at 20° (water=l)Relative Velocity 1.8 (water=l)
PCE is generally found in three phases in the subsur-face: liquid, vapor, and dissolved in water. More thanone phase usually exists in the subsurface afterdischarge. Figure 2 shows three possible scenarios at adischarge point.
VOCs will not adsorb to subsurface materials to anysignificant degree when those materials are nearlypure minerals which contain little organic matter.Most high-yield aquifers are nearly free of organicmatter. The majority of fresh water aquifers and thevadose zone in the Central Valley are fan depositsfrom the Sierra Nevada and the Coast Range, and arecomposed primarily of low organic soils and sub-strata. Therefore, retention of VOCs in the CentralValley by soil and subsurface strata probably is verylow.
PCE is a known carcinogen. The Water QualityAdvisories for a l-in-a-million incremental cancer risk
3
3

Dry Cleaners—A Major Sourceof PCE in Ground Water
Page 4
Figure 2
Liquid Solvent Phase
Ground Water TableCapillary Fringe
Discharge Point
FlowDirection
PCE Gas Phase Denser ThanAir-Sinks To Capillary Fringe
PCE Dissolves into Water atCapillary Fringe
Vadose Zone
Ground Water
Ground Water TableCapillary Fringe
Discharge Point
FlowDirection
Vadose Zone
Ground Water
Ground Water TableCapillary Fringe
Discharge Point
FlowDirection
Vadose Zone
Ground Water
PCE Solvent Heavier Then WaterSinks Through Ground Water
A
B
C
PCE GAS PHASE REACHES GROUND WATERDISSOLVED PCE IN GROUND WATER
PCE DISSOLVED PHASE REACHES GROUND WATERDISSOLVED PCE IN GROUND WATER
PCE SOLVENT PHASE REACHES GROUND WATERDISSOLVED & SOLVENT PHASE IN GROUND WATER
Dissolved PCE, May Have Concentrations As High As 150,000 ppb
Gas Phase
Dissolved Phase-High Concentration
Dissolved Phase-Low Concentration
SIMPLIFIED MODELSOF PCE MOVEMENT IN
VADOSE ZONE & GROUND WATER
LEGEND

Page 5 Regional Water Quality Control BoardCentral Valley Region
estimate is 0.8 ppb (8). The State of California Depart-ment of Health Services Maximum Contaminant Level(MCL) for PCE is five ppb.
SOURCE IDENTIFICATION FOR PCE DEGRADED WELLS
A source investigation is conducted by Board staff toidentify the source(s) of contaminant found in adrinking water supply well. This section is dividedinto two parts: a description of the steps in a sourceinvestigation and a general discussion of the results ofa PCE source investigation.
SOURCE INVESTIGATION
There are five general steps conducted in a sourceinvestigation as follows:
1. Well reported degraded by VOCs2. Identify possible sources of the VOCs3. Inspect the users of the VOCs4. Identify ground water characteristics5. Conduct a soil gas survey
In step 1, a drinking water well is reported degradedby a VOC to the Board. The main sources of thisinformation are the California Department of HealthServices, counties, municipalities and private watercompanies. The information starts the Board's formalsource investigation.
In step 2, staff attempts to identify all possible uses ofthe VOC(s) of concern. For example, is it used assolvent or refrigerant? Then they identify the type ofbusinesses that would use the VOC(s). At this pointstaff does research using business directories, phonebooks, and county and city records to identify thosefacilities (potential sources) in the past and presentthat might use or have used the VOC(s) found in thewell. This search for potential sources is done for anarea approximately 1/2 mile in radius around thewell. Some record searches for have gone as far backas the 1930’s.
In step 3, inspecting possible sources, a questionnaire
is first mailed to potential sources asking the facilityoperators about their uses of VOCs. This is the initialscreening and reduces the quantity of field inspec-tions. For example, if a facility is listed as a drycleaner in the phone book and the questionnaireresponse says it is only a transfer station and nosolvents are used, then the site would be removedfrom the potential source list and not inspected.
Staff inspects the facilities that use VOCs and deter-mines if the potential source should be investigatedfurther. If an investigation continues on a facility, thenstaff samples all discharges leaving the facility (dis-charges to land, water and sewer).
In step 4, identifying ground water characteristics,staff collects information from government andprivate ground water studies. The data collected fromthese studies are correlated to give a general under-standing of the stratigraphy and ground water charac-teristics. This is not site-specific and is done afteridentifying possible sources so there is not a bias toupgradient sources.
In step 5, the soil gas survey is used to identify areas ofVOCs in the soil and ground water. A survey involvesplacing glass tubes, each containing a carbon coatedwire, open end down, 10-12 inches below the soilsurface (Figure 3). After placement, the tubes arecovered with soil. The evaporating VOC gassesdisperse through the soils and reach the survey
Figure 3
SOIL GAS TUBE
CHARCOAL ADSORBENT
WIRE
PYREX TUBE
GROUND SURFACE

Dry Cleaners—A Major Sourceof PCE in Ground Water
Page 6
Figure 4
IDENTIFIED SOLVENT USERS
*Auto/Boat Industry Service Stations Auto Dealerships Boat Dealerships Truck Repairs Auto Maintenance Facilities*Telephone Companies Elevator Service Companies Public Schools Mobile Home Parks*Dry Cleaners Laundries Print Shops Newspapers *Copying and Printing Businesses Machine Shops Electric Motor Repair Sheet Metal & Welding Lumber/Timber Industry *Over-the-Counter Products Furniture Strippers Antique Shops Upholstery Repair Power Stations Paint Dealers
* - Industries where at least one product has PCE
Figure 5is 100% PCE. Dry cleaning uses a large quantity ofPCE solvent compared to other potential sources. Thetypical cleaner uses between 15 and 40 gallons amonth of pure PCE. Many of the other industries alsocollect the solvent after use for recycling and do notdischarge waste liquids to the land or sewer. Also,many of the solvents used that contain PCE are inaerosol cans. The solvent is sprayed on the part toremove grease and as the part dries, the PCE volatil-izes into the air. Most industries other than drycleaners which use solvents have no daily discharge ofwaste liquids containing PCE.
The staff soil gas surveys, which include all solventusers, show dry cleaners as the source areas. Figures 6and 7 are two examples. None of the soil gas surveyshave shown PCE vapor plumes near other solventusers.
Based on questionnaires, inspections, handlingpractices and soil gas surveys, staff concludes that drycleaning is a major source of PCE ground waterdegradation in the Central Valley.
equipment. Approximately six week later, the tubesare removed and sent to the laboratory for VOCanalysis. The results are in numbers of a specific VOCmolecule retained by the carbon coated wire. Thenumbers are not concentrations, but are relative toeach other. Locations with high counts have more ofthat VOC in the soil vapor than areas with low counts.Figure 4 is an example of the results of one of thesesurveys.
At this point the potential sources have been reducedto a few likely sources. It is at this time that siteinvestigations are requested from the likely sources.
RESULTS OF PCE SOURCE INVESTIGATIONS
Staff source investigations have found that PCE isused in several industries (Figure 5) and is a compo-nent of several over-the-counter products such asbrake and carburetor cleaners and spot removers.Staff surveys of industries other than dry cleanerswhich used these products show that PCE is not themain constituent in most of them. These products areusually less than 30% PCE, while dry cleaning solvent
D
St
C
St
E
St S.
3rd
St.
S.
4th.
St.
S.
5th
St.
S.
6th
St.
S.
7th
St.
Las
Palmas
Del
Pue
rto
Ave
Ave
Salado
Ave
3rd
St.
N.N.
4th
St.I
St.
H
St.
N
5th
St.
33
3333
F
St.
Lateral
Canal
S
1st
St.
N
1st
St.
134,889
288
65,001
134
Petrex Tube Site
PCE Ion Counts at Site
Pumping Well Locations
AZEVEDO MHP PCE INVESTIGATIONWELL INVESTIGATION PROGRAM
Patterson, CA
PETREX-TUBESOIL GAS SURVEY
N
GROUND WATERFLOW DIRECTION
2,000 to 49,999 Ion Counts of PCE
> 50,000 Ion Counts of PCE
DEGRADEDWELL
WESTSIDE CLEANERSAND LAUNDRY
FIGURE 2
1,566
418
240
15,418
320
190
259
60,278
350
2793
2,314
89
170
304
698
12
178
637
134
11,3441,387
17,765 T
2,033
360

Page 7 Regional Water Quality Control BoardCentral Valley Region
Figure 6
AAAAAAAAAAAAAAAAAAAAA
AAAAAAAAA
AAAAAAAAAAAA AAA
AAAAAA
AAAAAA
AAAAA
AAAAAA
AAAAAAAA
AAAAAAAAAAAAAAAAA
LODI
Sch
ool
Sac
ram
ento
Hut
chin
s
Locust
Mai
n
Chu
rch
Ple
asan
t
Tokay St.
Lee
Was
hing
ton
Sto
ckto
n
No. Hutchins St
Gra
nt
Ave
DaisyOlive
Ave
Ct
St
Ros
eS
t
St
St
Pine
Elm
Lockeford
Oak
WalnutLodiComm.Center
Chestnut
Lodi
CW #2
CW #4
CW #3
First StSt
St
St
St
St
St
St
St
St
Ave
St
N
0.30.0 0.1 0.2 0.4 0.5 Miles
SCALE
AAAAAAAAAAAAAAA
AA A
AA
AAAAAAAAA
AAAA
A
A
A
AA
SEWER LINES
10,000 - 100,000 PCE ion counts
100,000 - 200,000 PCE ion counts
AA> 200,000 PCE ion counts
< 10,000 PCE ion counts
ACurrently operating dry cleaners Past dry cleaners
EXPLANATION
GuildCleaners
Busy BeeCleaners

Dry Cleaners—A Major Sourceof PCE in Ground Water
Page 8
Figure 7
?
?
?
??
?? ?
?
??
?
PC
E C
OU
NT
S
5,00
0 -
10,0
00
10,0
00 -
100
,000
> 1
00,0
00
SO
IL G
AS
SU
RV
EY
- J
AN
UA
RY
199
1
R STREET
MA
IN
ST
RE
ET
T STREET
Q STREET
P STREET
O STREET
N STREET
M STREET
S STREET
U STREET
V STREET
16T
H
ST
RE
ET
WE
ST
18
th
ST
RE
ET
CANAL STREET
J STREET
I STREET
H STREET
G STREET
K STREET
WE
ST
19
th
ST
RE
ET
WE
ST
20
th
ST
RE
ET
WE
ST
21
th
ST
RE
ET
WE
ST
1
5th
S
TR
EE
T
WE
ST
14
th
ST
RE
ET
WE
ST
13
th
ST
RE
ET
WE
ST
12
th
ST
RE
ET
AAAAAAAAAAAAAAAAAAAAAAAAAAAAAAAAAAAAAAAAAAAAAAAAAAAAAAAAAAAAAAAAAAAAAAAAAAAAAAAAAAAAAAAAAAAAAAAAAAAAAAAAAAAAAAAAAAAAAAAAAAAAAAAAAAAAAAAAAAAAAAAAAAAAAAAAAAAAAAAAAAAAAAAA
AAAAAAAAAAAAAAAAAAAAAAAAAAAAAAAAAAAAAAAAAAAAAAAAAAAAAAAAAAAAAAAAAAAAAAAAAAAAAAAAAAAAAAAAAAAAAAAAAAAAAAAAAAAAAAAAAAAAAAAAAAAAAAAAAAAAAAAAAAAAAAAAAAAAAAAAAAAAAAAAAAAAAAAAAAAAAAAAAAAAAAAAAAAAAAAAAAAAAAAAAAAAAAAAAAAAAAAAAA
SO
UT
HE
RN
PA
CIF
ICR
AIL
RO
AD
CIT
Y O
F M
ER
CE
DW
EL
LS
3 &
5P
CE
IN
VE
ST
IGA
TIO
N
SC
ALE
in fe
et
010
00
HIG
HW
AY
9
9
CIT
Y O
F M
ER
CE
DW
EL
LS
3A
,3B
&3
CIT
Y O
F M
ER
CE
DW
EL
L 5
CIT
Y O
F M
ER
CE
D W
EL
LON
E H
OU
RM
AR
TN
IZIN
G
EX
XO
N
SIM
PS
ON
CL
EA
NE
RS
TE
XA
CO
BU
LK
ST
AT
ION
UN
OC
AL
BU
LK
PL
AN
T
ME
RC
ED
LA
UN
DR
Y
ME
RC
ED
NIS
SA
N
GR
OU
ND
WA
TE
R IN
VE
ST
IGA
TIO
N
KN
OW
N D
ISC
HA
RG
E O
F P
CE
TO
SO
ILS
,
UN
DE
R IN
VE
ST
IGA
TIO
N
OU
R L
AD
YO
F M
ER
CY
PG
&E
CH
EV
RO
N
SH
EL
L
SH
EL
L
RIG
GS
AM
BU
LA
NC
E
TIN
ET
TI
TIN
ET
TI
TIN
ET
TI
BR
ICE
NO
S
BE
AC
ON
SP
RIG
GS
Su
nsh
ine
Cle
aner
s

Page 9 Regional Water Quality Control BoardCentral Valley Region
DRY CLEANERS OPERATION ANDDISCHARGE LOCATIONS
There are two basic types of dry cleaning machines,transfer and dry-to-dry. Both have similar types ofdischarges with the dry-to-dry machine being moreefficient. The only major difference is that the dry-to-dry unit does the washing and drying of the clothingin the same machine, while a transfer unit use separatemachines. The following section is a general descrip-tion of a facility containing a transfer unit.
Dry cleaning transfer systems include a dry cleaningwash unit, PCE storage tank (generally part of thewash unit), reclaimer (dryer), cooker and vaporcondenser (Figure 8). Pure PCE solvent is addeddirectly from the PCE tank to the wash unit. A smallamount of water and soap is usually added to removestains that PCE will not. Most facilities send the spentsolvent (after washing cycle) through solid filtercanisters to remove solids and then return it to thePCE tank in a closed system. The solvent in the PCEtank also is periodically purified by physical transferto the cooker, which separates solvent from solidsthrough distillation and forms a sludge at the bottom.
Figure 8
MOVEMENT OF THE SOLVENT PERC AT A DRY CLEANING FACILITYUSING A TRANSFER UNIT
Cooling WaterCondensate LiquidSolvent Perc
WASHERFILTERS
PERC TANK
RECLAIMERDRYER
Clothing Placed inReclaimer to Remove
Residual Perc
COOKER
SEWER
Dirty Perc Placed in Cooker to Remove Impurities
HAZARDOUS WASTE
HAULER
OldFilters
Cooker Sludge
AIRTREATMENT
Separator
LEGEND
Condensate Waterto Sewer
PCE Solvent to Perc TankEntering Condensate
Liquid
PERC-WATER SEPARATOR
COOKER
WASHER&
RECLAIMER(dryer)
PERC TANK
FILTERS
SINGLE UNIT
SEWER DRAIN
Dirty PERC is removed for distillation and returned to tank
MOVEMENT OF THE SOLVENT PERC AT A
DRY CLEANING FACILITYUSING A DRY TO DRY UNIT
Cooling Water
Condensate Liquid
Solvent Perc
AIRTREATMENT
LEGEND
Separator
After washing, the clothing is removed from the washunit and placed in the reclaimer to remove residualsolvent. This drying process removes PCE solvent byheating the clothing which causes the solvent and anywater to evaporate. The vaporized solvent and wateris then removed from the drying portion of themachine and condensed. The PCE-water separator,which is connected to the back of the unit, takes thecondensed liquid that contains PCE and water andallows the heavier PCE to settle to the bottom forreuse. The air scrubber (sniffer) extracts and cleansvapors from the other dry cleaning components andthe air. These vapors also are condensed and the PCEand water separated.
In general, information provided by dry cleaneroperators, inspections done by staff, and manufactur-ers’ service manuals show that dry cleaning equip-ment is designed to discharge wastewater to thesewer. Figures 8 and 9 are schematics showing thetwo main types of wastewater discharges from drycleaning equipment: liquid from the PCE-waterseparators and cooling water. Figure 10 is a schematicfrom one manufacturer’s service manual that showsthat wastewater should be discharged to the drain(11). This is typical of service manuals.
Figure 9

Dry Cleaners—A Major Sourceof PCE in Ground Water
Page 10
The water from the PCE-water separators has been indirect contact with PCE. Water samples from separa-tors at some cleaners have had such high concentra-tions of PCE that after the sample bottle sat for a day,solvent had separated out. As much as 30 percent ofsome samples has been pure solvent. PCE-waterseparator waste liquid has had PCE levels up to1,119,300 ug/l (ppb), with an average of 151,800 ppband median 64,000 ppb (Figure 11). Cooling watersamples at dry cleaners have usually ranged from 3 to70 ppb PCE, but some have been as high as 4,000 ppb(Figure 12).
EVIDENCE AND THEORY ON HOW PCEIS LEAVING THE SEWER LINES
Based on site inspections, the majority of the cleanershad only one discharge point and that was to thesewer. Because of these discharges, staff investigatedsewer lines as a possible discharge point for PCE to thesoils. Samples taken from these lines indicated thatliquids or sludges with high concentrations of PCE arelying on the bottom of the sewer. Soil gas surveys
COIN-OP DRY TO DRY UNIT
Graphic From - Norge Sales Corporation, Service Instruction and Parts Catalog, 1961
Figure 10
Busy Bee Lodi 9/11/90 60,699 Reclaimer
Turlock Cleaners Turlock 4/29/91 62,755 Cooker
Snow White Turlock 1/26/89 140 Reclaimer 56 Cooker
Durite Cleaners Turlock 1/30/89 15,000 Sniffer & Reclaimer II 150,000 Reclaimer I
Brite Cleaners Turlock 5/11/89 66,000 Reclaimer
Southgate Norge Sacramento 3/20/91 247,000 Sniffer & Reclaimer
Tillet Cleaners Roseville 4/11/89 74,000 Reclaimer
Merced Laundry Merced 11/29/88 130,000 Sniffer
Modesto Steam Modesto 4/30/91 1,119,300 Reclaimer 139,087 Cooker 8,120 Chiller 53,618 Recalimer
CLEANER CITY DATE RESULT UNITin ppb
DRY CLEANERS SAMPLING RESULTSFROM
CONDENSATE LIQUID
5
Median 64,000Average 151,800
Figure 11
Figure 12
CONCENTRATION OF ORGANIC CHEMICALS IN COOLING WATER
FROM DRY CLEANERS
DRY CLEANERS CITY DATE RESULTS in ppb
Busy Bee Lodi 8/24/89 0.66 PCE2.1 TCE0.69 1.1-DCE
8/28/90 1.2 PCE1 TCE
DuRite Turlock 11/29/91 6.3 PCE4.7 PCE1.7 PCE5.3 PCE
Turlock Turlock 5/21/90 0.8 PCE1.3 PCE
Bright Turlock 5/11/89 2.7 PCE
Tillet Roseville 11/30/88 67 PCE32 Chloroform
2/10/89 1.1 PCE23 Chloroform
Deluxe Roseville 2/26/89 0.8 PCE69 Chloroform
Elwood's Modesto 4/30/91 14 PCE
Parkway Merced 9/8/88 69 PCE
Simpson Merced 9/8/88 38 PCE
Southgate Norge Sacramento 1/12/89 28 PCE
Merced Laundry Merced 11/29/89 4000 PCE

Page 11 Regional Water Quality Control BoardCentral Valley Region
done by staff and by private consultants illustrate highPCE vapor concentrations along the sewer lines. Workdone by the City of Merced shows that intact sewerlines can and have discharged PCE to the soil.
Below are descriptions of sampling done and ourinterpretation of the data. Following these descrip-tions is a section on the theories of how PCE escapesfrom the sewer pipes.
SOIL GAS SURVEYS
Soil gas surveys related to PCE in ground water havebeen done by Board staff in Sacramento, Lodi, Merced,Modesto, Stockton, Roseville and Turlock. Everyplace PCE molecules have exceeded 100,000 counts
and monitoring wells have been installed, PCE levelsin ground water exceeded the MCL. In most cases, thePCE concentration in ground water has exceeded 300ppb, which is 60 times the MCL. Thus, this surveytechnique has been very successful.
Figures 13 through 16 are maps showing results of soilgas surveys from Turlock, Modesto, Lodi and Mercedwhich illustrate that PCE vapors are higher along thesewer lines. The highest counts are usually near thecleaners, but the counts continue high from the sitesdown the sewer line.
Around several dry cleaners near Stockton, a privateconsultant performed a soil vapor survey for PCE.The consultant extracted a volume of air from the soils
FIGURE 13
?
?
?
? ? ??
?
?
? ? ?
PCE COUNTS
5,000 - 10,000
10,000 - 100,000
> 100,000
SOIL GAS SURVEY - JANUARY 1991
R S
TR
EE
T
MAIN STREET
T
ST
RE
ET
Q
ST
RE
ET
P
ST
RE
ET
O
ST
RE
ET
N
ST
RE
ET
M
ST
RE
ET
S
ST
RE
ET
U
ST
RE
ET
V
ST
RE
ET
16TH STREET
WEST 18th STREET
CA
NA
L S
TR
EE
T
J S
TR
EE
T
I S
TR
EE
T
H S
TR
EE
T
G S
TR
EE
T
K S
TR
EE
T
WEST 19th STREET
WEST 20th STREET
WEST 21th STREET
WEST 15th STREET
WEST 14th STREET
WEST 13th STREET
WEST 12th STREET
AAAAAAAAAAAAAAAAAAAAAAAAAAAAAAAAAAAAAAAAAAAAAAAAAAAAAAAAAAAAAAAAAAAAAAAAAAAAAAAAAAAAAAAAAAAAAAAAAAAAAAAAAAAAAAAAAAAA
AAAAAAAAAAAAAAAAAAAAAAAA
AAAAAAAAAAAAAAAAAAAAAAAAAAAAAAAAAAAAAAAAAAAAAAAAAAAAAAAAAAAAAAAAAAAAAAAAAAAAAAAAAAAAAAAASOUTHERN PACIFIC RAILROAD
CITY OF MERCEDWELLS 3 & 5
PCE INVESTIGATION
SCALE
in feet
0 1000
HIGHWAY 99
RIGGSAMBULANCE
ONE HOURMARTNIZING
SUNSHINECLEANERS
EXXON
SIMPSONCLEANERS
TEXACOBULKSTATION
UNOCAL BULKPLANT
MERCEDLAUNDRY
MERCEDNISSAN
GROUND WATER INVESTIGATION
KNOWN DISCHARGE OF PCE TO SOILS, UNDER INVESTIGATION
OUR LADYOF MERCY
PG&E
CHEVRON
SHELL
SHELL
TINETTITINETTITINETTI
BRICENOS
BEACON
SPRIGGS
CITY OF MERCEDWELL 5
CITY OF MERCED WELL
Sewer Line
Sewer Line Flow Direction
CITY OF MERCEDWELLS 3A,3B&3

Dry Cleaners—A Major Sourceof PCE in Ground Water
Page 12
Figure 14
10 - 50
50 - 150
>150
PCE ION COUNTS
CITY OF MODESTO WELL 11, 14 & 21
SOIL GAS SURVEY
(in thousands)
Mc
Hen
ryA
ve
Briggsmore Ave
Orangeburg Ave
Col
lege
Ave
M11
M14
Roseburg Ave
Syc
amor
eA
ve
Fairmont
0 1/2 1
M21
M17
SCALE
in miles
N
Municipal Well
Active Dry Cleaner
Inactive Dry Cleaner
Other Buildings
Grange AveV
irgin
iaA
ve
ANDSEWER LINE LOCATIONS
Sewer Lines
Ground WaterGradient
HalfordCleaners
IdealCleaners

Page 13 Regional Water Quality Control BoardCentral Valley Region
Figure 15
LODI
Sch
ool
Sac
ram
ento
Hut
chin
sLocust
Mai
n
Chu
rch
Ple
asan
t
Tokay St.
Lee
Was
hing
ton
Sto
ckto
n
No. Hutchins St
Gra
nt
Ave
DaisyOlive
Ave
Ct
St
Ros
eS
t
St
St
Pine
Elm
Lockeford
Oak
WalnutLodiComm.Center
Chestnut
Lodi
CW #2
CW #4
CW #3
First StSt
St
St
St
St
St
St
St
St
Ave
St
N
0.30.0 0.1 0.2 0.4 0.5 Miles
SCALE
o
o
o
o
o
o
o
o
o
o
o
o
o
o
oo
oo
o
o
o
o
ooo
o
o
o
o
o
o
o o ooo
o
o
o
o o AA
o
o o o
o
o
o
o
o o o o
o o o
o o
oo o o o
oo
oo
➔
➔
➔➔
➔
➔
➔
➔➔
➔
➔
➔
➔
➔
➔
➔
➔
➔
➔➔
➔➔
➔
➔
➔➔
➔
SEWER LINES
o
o
o
oo
o
➔
➔
➔
➔
➔
➔
o
o
oo
o
o
o
o
o
oo
o
o oo
➔
➔ ➔
➔
➔
➔
➔ ➔
o oooo
➔
➔
Sewer lines
➔
Sewer line flow direction
10,000 - 100,000 PCE ion counts
100,000 - 200,000 PCE ion counts
> 200,000 PCE ion counts
< 10,000 PCE ion counts
Currently operating dry cleaners Past dry cleaners
EXPLANATION
GuildCleaners
Busy BeeCleaners

Dry Cleaners—A Major Sourceof PCE in Ground Water
Page 14
Figure 16
10,000-100,000 PCE ION COUNT
100,000-200,000 PCE ION COUNT
>200,000 PCE ION COUNT
N1/20
MILES
SCALE
ACTIVE DRY CLEANER
INACTIVE DRY CLEANER
WELL
Canal Dr.
TVG Wells
A
ColumbiaSt
N.
First
St
Lexington
Ave
A
St
East
MarshallE.
Main
St
Monro
e
Ave
Thor
St
S.
CenterS.
Golden
W. Olive St
Gee
rR
d
StateBlvd
St
St
Ave
E.
Olive
St
D
St5th
StSt
FWell 5
Well 1
W. Main St
SEWER LINE
TURLOCK SOIL GAS SURVEY
Carr's Cleaners
Turlock Cleaners
Snow White Cleaners
DuRite Cleaners

Page 15 Regional Water Quality Control BoardCentral Valley Region
and ran the sample through a gas chromatograph.This survey also indicates high concentrations of PCEvapor along the sewer line (Figure 17). There are
similar surveys done by other private consultants withthe same results.
Figure 17
?
?
?
?
LINCOLN VILLAGESTOCKTON
PCE CONCENTRATIONS
SOIL GAS SURVEY
10 - 100 ug/l
> 100 ug/l
2SURVEY SAMPLE LOCATIONCONCENTRATION IN ug/l
SEWER LINE
DRY CLEANER
DRY CLEANER
DRY CLEANER
0 100
in feet
SCALE
8
9
2280
0.2 630
290
770810
34
2053
380.002
7 3
0.40.006
0.0004
620
580
0.0006
1000 89 0.04
0.2100 38
210
0.02
10
16
20
55
40.02
0.04
0.003
31
2
0.7

Dry Cleaners—A Major Sourceof PCE in Ground Water
Page 16
SEWER MAIN SAMPLING
Three samples are usually taken from the sewer: anupgradient, a downgradient and a flush sample. Theupgradient (background) and downgradient samplesare taken at the sewer access just above and belowwhere the dry cleaner’s sewer lateral enters the main(Figure 18). All samples are taken by placing a jar on apole and scooping liquid into the jar. The liquid isthen poured into volatile organic analysis (VOA)bottles and sent to a California certified lab for analy-sis. The flush sample is taken after stirring up thebottom sediment by adding large quantities of water(and sometimes running a ball down the line). Theflush sample is taken at the downgradient seweraccess, when an increase of flow is noted (Figure 18).
The concentration of PCE in the downgradient samplehas always exceeded that in the upgradient sample,and in most cases PCE in the upgradient sample wasnot detected. When flush samples were taken, theirPCE content almost always exceeded that in the
downgradient sample. Since water is being added tothe system, one would expect the PCE concentration todecrease in the flush sample because of dilution.Therefore, the increase indicates that PCE liquids orsludges are sitting on the bottom of the sewer line.
CITY OF MERCED
Between 12 January and 2 February 1989, the City ofMerced conducted soil sampling near four dry clean-ers. The City staff did a video scan of the sewer linesat each of the cleaners to check for possible leaks.After these scans, they drilled a soil boring adjacent tothe sewer line downgradient of each facility where aproblem was seen on the video tape. If the tapeshowed no problem, they drilled adjacent to the sewerline near the dry cleaner. In each boring they tookseveral soil samples and had them analyzed for VOCsby EPA Method 8010. They also took soil vapormeasurements using a Sensidyne-Gastec system(similar to Draeger tubes) with a detection limit of 400ppb.
In addition to the City’s work, each dry cleaningfacility had a monitoring well (MW) drilled as re-quired by staff. Soil samples were taken every fivefeet during drilling and analyzed for VOCs using EPAMethod 8010. One ground water sample was takenfrom each well and analyzed for VOCs using EPAMethod 601.
Parkway Cleaners
Figure l9 contains the data from the Parkway Cleanerssite. The MW was drilled approximately 22 feet fromParkway’s sewer lateral and 15 feet from the sewermain. Soil samples from the well boring had lowlevels of PCE (<5 ppb). The concentration of PCE inthe ground water was 160 ppb.
The City’s video scan of the sewer main showed nobreaks in the clay pipe. Because of this, the Cityarbitrarily selected a soil boring site adjacent to thesewer line, six feet downgradient from ParkwayCleaners’ sewer lateral. The PCE concentration in thesoil sample in the City soil boring was 120 times
SEWER SAMPLINGADJACENT TO
DRY CLEANERS
MERCED Merced Laundry - 180 - One Hour Martinizing "R" NF 110 23,000 One Hour Martinizing "G" NF 730 96,000 Simpson Cleaners - - 6,300 Sunshine Cleaners NF - 167,000 Parkway Cleaners NF 853 280,000
SACRAMENTO Southgate Norge Cleaners NF 350 830
ROSEVILLE Deluxe Cleaners - 120 260 Tillets Cleaners NF 28 380
TURLOCK Carr's Cleaners <0.5 14 2.5 Snow White Cleaners 1,800 3,800 220 Turlock Cleaners NF 3,500 <25 Bright Cleaners <0.5 0.6 23,000 Durite Cleaners 35 190 <5
LODI Busy Bee NF 700 280,000 Woodlake Cleaners - 620 210,000 Guild Cleaners <0.5 24 <5
Upgradient Downgradient Flush
NF - NO FLOW
Median 190 3,565Average 748 67,937
in ppbin ppbin ppb
Figure 18

Page 17 Regional Water Quality Control BoardCentral Valley Region
higher than was found in the MW. Also, soil vaporsamples in the City boring contained up to 80,000 ppbPCE.
At this location the levels in the soil are much higheradjacent to the sewer line than in the MW. Also thedata from the sampling adjacent to the sewer lineindicate that PCE has moved from the line into theadjacent soils.
Simpson’s C1eaners
Figure 20 illustrates the data from the Simpson’sCleaners site. Soil samples taken during the drilling ofthe MW at the southwest corner of the facility hadPCE levels from non-detect to 71 ppb. The shallowground water sample had 270 ppb PCE and alsocontained 29 ppb trichloroethylene (TCE), 65 ppb cis-1,2dichloroethene (DCE), two ppb trans-1,2-DCE, and6 ppb 1,2-dichloroethane, all of which are breakdown
products of PCE. The MCL for TCE is 5 ppb and forDCE is 6 ppb.
The City’s video scan of the clay sewer main adjacentto the cleaners showed a break at one of the joints.This break is approximately 40 feet downstream alongthe sewer line from the southeast corner of Simpson'sCleaners. While drilling alongside this joint the soilbecame very wet. One of the soil samples had 140 ppbPCE, higher than samples taken from the MW boring.The soil gas measurement readings were non-detect.
Again the soil sample adjacent to the sewer linecontained higher PCE levels than samples taken fromthe MW boring. One probable reason the soil gasmeasurements were non-detect at the joint was thesoils were very wet, which means the soil pores wereprobably full of water leaving no available room forthe soil vapor.
Sunshine C1eaners
Figure 21 contains the data from the Sunshine Clean-ers site. The MW was drilled near the northeast cornerof the cleaners, 9.5 feet from its sewer lateral. The soilsamples from the MW had PCE concentrations up to
Figure 19
Figure 20
SIMPSON'S CLEANERS
X
approx. 40ft
X32ft
SIMPSON'SCLEANERS
MONITORINGWELL
SOILBORING
FLOW DIRECTION
SEWER LINE
LAT
ER
AL
not to scale
SITE MAP
GROUND WATER RESULTS
Tetrachloroethylene (PCE) - 270 ppbTrichloroethylene (TCE) - 29 ppbc-1,2-Dichloroethene (c-DCE) - 65 ppbt-1,2-Dichloroethene (t-DCE) - 2 ppb1,2-Dichloroethane - 6 ppb
140<25
NDND
trace
WETSOILS
15
71
<5
11
19
42
<10
0
10
20
30
40
50
CROSS SECTION OFSOIL SAMPLE RESULTS
MONITORINGWELL
BORING
DE
PT
H F
RO
M LA
ND
SU
RF
AC
E (in feet)
- Sewer Pipe Crossection
3 - Soil Sample in ppb
23 - Soil Vapor in ppb
0 20SCALE
horizontal
in feet
GROUND WATER ENCOUNTERED
MERCED
ParkwayCleaners
X6ft
22.6ft
15ft
SEWERMAIN
LATERAL
MONITORINGWELL
SITE MAP
not to scale
BORING
X
FLOWDIRECTION
GROUND WATER RESULTS
Tetrachloroethylene (PCE) - 160 ppbTrichloroethylene (TCE) - 1 ppb
PARKWAY CLEANERS
3 - Soil Sample in ppb
0 10
SCALEhorizontal
in feet
23 - Soil Vapor in ppb
- Sewer Pipe Crossection
0
10
20
30
40
50
60
DE
PT
H F
RO
M LA
ND
SU
RF
AC
E (in feet)
79000
800080000
<503
MONITORINGWELL BORING
3
< 1
<1
GROUND WATER ENCOUNTERED
<2
<5
<5
<5
<2
360
MERCED
CROSS SECTION OFSOIL SAMPLING RESULTS

Dry Cleaners—A Major Sourceof PCE in Ground Water
Page 18
100 ppb. The ground water sample had 320 ppb PCE,4.5 ppb TCE and 18 ppb DCE.
The City’s video scan of the sewer line showed nobreaks in the concrete sewer main. The City personnelchose a sag in the sewer main where the water poolsfor the location of the adjacent soil boring. This sitewas 181 feet downgradient of the cleaner’s sewerlateral. PCE in the soil samples was nondetect, but thedetection limit was high at 50 ppb. The Sensidyne-Gastec vapor system had a reading of 40,000 ppb inthe boring.
The high levels detected by the Sensidyne-Gastecsystem indicates even at a distance of 181 feetdowngradient from the dry cleaner, the concentrationof PCE in the soil gas is significant. No comparison ofsoil samples between the MW and City’s soil boringcan be made because of the high detection limit fromthe City’s samples.
One Hour Martinizing “R” Street
Figure 22 shows the data from the One HourMartinizing “R” Street site. The MW was drilled eightfeet northwest of the sewer line approximately 16 feet
Figure 21
Figure 22
from the cleaner’s northwest wall. PCE levels in thesoil samples taken during drilling of the MW were lowin the upper 20 feet ranging from nondetect to 20 ppb,but near the ground water a soil sample had 1,100 ppbPCE. The ground water sample had PCE and TCEwith concentrations of 960 ppb and 2.3 ppb, respec-tively.
The City’s video scan of the clay sewer line showed nobreaks. The City personnel decided to drill adjacent toa bell joint four feet downgradient from where thecleaner’s sewer lateral intersects the sewer main. Soilsamples in this boring had PCE at 610 ppb (depth 461')and 1,300 ppb (depth 63"). The City took threeSensidyne-Gastec system measurements at the follow-ing depths from the surface: 361' (above the main), 461'(bottom side of pipe) and 631' (below the main), andthe readings were 40,000 ppb, 10,000 ppb and 20,000ppb, respectively.
Along the sewer main, the soil gas measurements and
SUNSHINE CLEANERSS
UN
SH
INE
CLE
AN
ER
S
9.5ftX
LATERAL
SEWERLINE
FLOWDIRECTION
XBORING
not to scale
approx. 40ft
181f
t
SITE MAP
GROUND WATER RESULTS
Tetrachloroethylene (PCE) - 320 ppbTrichloroethylene (TCE) - 4.5 ppbc-1,2-Dichloroethene (DCE) - 18 ppb
40000<50<50
28
11
3
<2
<2
100
MONITORINGWELL
BORING
o
10
20
30
40
50
DE
PT
H F
RO
M G
RO
UN
D S
UR
FA
CE
(in feet)
0 60
SCALEhorizontal
in feet
- Sewer Line Crossection
3 - Soil Samples in ppb
23 - Soil Vapor in ppb
GROUND WATER ENCOUNTERED
MERCED
CROSS SECTION OFSOIL SAMPLING RESULTS
ONE HOUR MARTNIZINGR STREET, MERCED
R Street
Alle
y
X
X
8ft
7ft
3ft
SEWER MAIN
LAT
ER
AL
MONITORINGWELL
BORING
ON
E H
OU
RM
AR
TIN
IZIN
G
SITE MAP
not to scale
FLOWDIRECTION
GROUND WATER RESULTS
Tetrachloroethylene - 960 ppbTrichloroethylene - 2.3 ppb
40000610
130010000
20000
0
10
20
30
40
50
60
20
<10
1100
20 - Soil Sample in ppb40 - Soil Vapor in ppb
SCALEhorizontal0 5
in feet
CROSS SECTION OFSOIL SAMPLING RESULTSMONITORINGWELL
BORING
DE
PT
H F
RO
M LA
ND
SU
RF
AC
E (in feet)
- Sewer Line Crossection
GROUND WATER ENCOUNTERED

Page 19 Regional Water Quality Control BoardCentral Valley Region
settlement or poor construction which causes thesewer line to bend. Sewer pipes are brittle, so whenthe line bends, fractures are likely to occur, increasingthe leakage of the pipe. Since PCE is heavier thanwater (1.63 times the weight of water at 20°C), it tendsto collect in these low spots and then flow through thepipe fractures into the vadose zone.
At pipe joints and other connections, PCE can moveout of the sewer as liquid or gas. Also, as the pipesshift after installation, they could separate at the joints,allowing PCE to discharge even more easily to thevadose zone. Current gasket technology and reduc-tion in leakage factors of pipes by the industry hasreduced discharges at this point. But most commercialand retail districts in the cities of the Central Valleyhave pipes that predate this technology.
Method 3
By this method, PCE-containing wastewater or PCEliquid penetrates a sewer pipe without any breaks. Inthis case liquid leaves the pipe and enters the vadosezone (Figure 23). Sewer pipe is not impermeable towater or PCE. When liquid collects in a low spot ofthe sewer pipe, it cause an increase in the hydraulic
head in the line. This extra head provides a largerdriving force downward through the pipe.
From sewer sampling we know that PCE-containingsludges and/or liquids collect on the bottom of thesewer line. Video taping of sewer mains have shownthat almost all lines have low points where liquids andsludges collect. Because PCE is heavier than waterand is attracted to organic matter, it would have atendency to collect in these low spots. Also, PCEviscosity is less than that of water (0.9 for PCE versus 1for water), making it flow easier through a pipe wallthan water. This makes the pipe more permeable forPCE.
Method 4
This is similar to Method 3 except that the hydraulichead in the pipe is not large enough to force liquid
the soil samples had high levels of PCE, indicating thatat this location the sewer main is discharging PCE.
THEORIES ON HOW PCE LEAKS FROM SEWERLINES
Based on staff field work and research, there are fivelikely methods by which PCE can penetrate the sewerline:
1. Through breaks or cracks in the sewer pipes2. Through pipe joints and other connections3. By leaching in liquid form directly through sewer lines into the vadose zone4. By saturating the bottom of the sewer pipe with a high concentration of PCE-containing liquid and then PCE volatilizing from the outer edge of the pipe into the soils5. By penetrating the sewer pipe as a gas
The literature indicates that all sewer lines leak tosome extent. According to Metcalf and Eddy, Inc.,“When designing for presently unsewered areas orrelief of overtaxed existing sewers, allowance must bemade for unavoidable infiltration...” (6). If the soilsbecome saturated and liquids can infiltrate, then aconclusion can be made that liquids on the inside ofthe pipe can exfiltrate when soils are not saturated.
Below is a brief description of the five methods.
Methods 1 and 2
Methods 1 and 2 are similar in that leakage of liquid iscaused by a failure of the sewer pipe system. Thefailure could be catastrophic, causing large volumesof liquids to leave the system, or could consist of manysmall leaks causing constant smaller flow. Thesedischarged liquids then would move down throughthe vadose zone to the ground water. Methods 1 and 2also apply to PCE in vapor form which can moveeasily through breaks, cracks, joints, and other connec-tions.
Many of the sewer lines have low spots in whichliquids accumulate. These low spots are caused by

Dry Cleaners—A Major Sourceof PCE in Ground Water
Page 20
into the vadose zone. In this method, the pipe wallsstill have a high concentration of PCE-containingliquids (Figure 24). Being volatile, PCE turns into agas at the liquid-soil vapor interface at the outer edgeof the pipe. Since the vapor density of PCE is 5.83times greater than air, the PCE gas in soil vapor wouldsink towards ground water, causing ground waterdegradation.
Method 5
In this method, PCE volatilizes inside the pipe andmoves as a gas through the sewer pipe wall (Figure25). The piping material is not designed to containgas. The concentration of PCE gas in the pipe isgreater than in the surrounding soils causing a concen-tration gradient. This causes a dispersion through the
sewer pipe to the less concentrated area.Another reason gas will penetrate the pipe is due topressure. The gasses inside the pipe may increase thepressure above atmospheric. This would cause apressure gradient from higher pressure in the pipe tolower pressure in the vadose zone. The gradientwould force PCE gas into the vadose zone. As de-scribed above, PCE gas is heavier than air and sowould tend to sink towards ground water.
Summary of Methods
Methods 3, 4 and 5 probably occur in all piping. Theywould cause a constant influx of PCE into the vadosezone downgradient from a dry cleaner. This liquidcontaining PCE or PCE in gas form then movesdownward and eventually degrades the ground water.
Figure 23 Figure 24
AAAAAAAAAAAAA
AAAAAAAAAAAAAAAAAAAAAAAAAAAAAAAAAAA
AAAAAAAA
AAAAAAAAAAAAAAAAAAA
AAAAAAAAAAAAAAAAAAAAAAA
AAAAAAAAAAAAAAAAAAA
AAAA
AAAAAAAA
AAAAAAAA
AA
AAAA
AAAAAA
AAAA
AAAAAAAA AA
AAAAAA
AAAAAA
AAAAAAAAAAAA
AAAAAAAAAAA
AAAAAAAAAAAA
AAAAAAAAAAAA
AAAAAAAAAAAA
AAAAAAAAAA
AAAAAAAAAAAAAAA AAAAAAAAAA
AAAAAAAAAAAAA
PIPE EXFILTRATIONPCE IN LIQUID PHASE
AAAA
AAAA
AAAAAAAA
AAAAAAA
AAAAAAAAAAAAAA
AAAAAA
AAAAAAAAAA
AAAAAAAAAAAAAAAAAAA
AAA
A
AAAAA
AAA
AAAAAAAAAAAAAAAAAAAAAA
A
AAA AA
AAAAAAA
AAAA
AA
AA
AA
AAAAAAAAAAAAAA AAAAAAAAAAAAAA
AAAAAAA
AAAAAAA
AAA AAAAA AA
AAAAAAAAA
AAAAAAAAAA
AAAAA
AAAAAAAA
A
A AAAAAA
A
A
A AA
A
AA
AAAA
AA
AAA
AAA
A
Pipe Wall
Backfill
Native SoilsLiquid Containing High PCE Concentration
FLOW FROM PIPE TO GROUND WATER
AAAAAAAAAAAAAAAAAAAAAAAAAAAAAAA
AAAAAAAAAAAAAAAAAAAAAAAAAAAAAAAAAAAAAAAAAAAAAAAAAAAAAAAA
PCE Liquid and Sludges
PCE inSoil Vapor
PCE inLiquid
PCE Degraded Ground Water
Ground WaterTable
PCE Liquidand Sludges
Normal Flow
Hydraulic Head
AAAAAAAAAAAAAAAAAA
A
AAAAAAAAAAAAAAAAAAAAAAA
AAAAAAAAAAAAAAAAAAA
AAAAAAAAA
AAAAAAAAAAAAAAAAAAAAAAAAAAAAAAA
AAAAAAAAAAAAAAAAAA
A
AAAAAAAAAAAAAAAAAAA
AAAAAAAAAA
AA
AAAA
AAAA
AAAA
AAAA AAAAAA
AAAAAA
AAAAAAAAAAAA
AAAAAAAAAAAAAA
AAAAAA
AAAAAAAAAAAAAAAA
AAAAAAA
AAAA
AAAA
AAAAAAAAAAAAAAAAAAAAAAAAAAAAAAAA AAAAAAAAAA
AAAAAAAAAAAAA
PIPE EXFILTRATIONPCE ENTERS PIPE WALL AS A LIQUID
AND THE SOIL AS A GAS
AAAAA
AAAAAAAA
AAAAAAAAAAAAAAAAAAAA
AAA
AA
AAA
AAAAAAA
AAAAA
AAAAAAAAAAAAAAA
A
AAAAAA A
AAAAAA
AAAAAAAAAAAAAAAAAAAAAAAAAAAAA
AAAAAA AAAAAAAAAAAAAA A
AA
AAAAAAAAA
AAAAAAAAAAAAAAA AAAAAAAAA AA
AAAAAAAAAAAAAAAAAAAAAA A
AAAAA
AA
AA AAA
AAA
AA
A
A A
A
AA
AA AAAA
AAA
AAA
A
Pipe Wall
Backfill
Native Soils
FLOW FROM PIPE TO GROUND WATER
AAAAAAAAAAAAAAAAAAAAAAAAAAAAAA
AAAAAAAAAAAAAAAAAAAAAAAAAAAAAAAAAAAAAAAAAAAAAAAAAAAAAAAA
PCE Liquid and Sludges
PCE inSoil Vapor
PCE Degraded Ground Water
Ground WaterTable
PCE Liquidand Sludges
Normal Flow
Hydraulic Head
Liquid Containing High PCE Concentration
PCE Gas Phase

Page 21 Regional Water Quality Control BoardCentral Valley Region
Leakage through small fractures in Method 1 is likelyin most of these brittle pipes as they settle. Smallfractures occur causing an increase in the permeabilityof the pipe. This would cause a constant leakage.These small fractures cannot be seen by video tapingthe inside of the sewer pipe.
CONCLUSION ANDRECOMMENDATION
The Board has identified the potential sources of PCEin 21 wells, and 20 of those are affected by one or moredry cleaners. Because of the location of the remainingwells (i.e. in residential and retail areas), the staffexpects that the majority of the wells with PCE willhave dry cleaners as the source.
The evidence from five years of investigations showsPCE has been found in the ground water and vadosezone near dry cleaners throughout the Central Valley.In most dry cleaners, the only liquid discharge of PCE-containing wastewater is to the sewer line. Thesubstantial evidence collected by dry cleaners’ consult-
Figure 25
ants, muncipalities, and staff, shows or demonstratesthat PCE has discharged from the sewer lines directlyinto the vadose zone. The PCE then migrates throughthe unsaturated subsurface to the ground water.Based on information collected from operators of drycleaners, dry cleaning literature and staff site inspec-tions, the dry cleaning equipment at most facilities isdesigned to discharge to sewer lines.
Presently, all the dry cleaners investigated in a wellsource investigation have been identified as sources ofPCE in the ground water. All of the dry cleaners thathave drilled monitoring wells have had shallowground water contamination well above the MCL of 5ppb set by the State Department of Health Services(monitoring well levels range from 120 - 32,000 ppb).With approximately 285 dry cleaners in the cities ofSacramento, Chico, Lodi, Modesto, Turlock, Stocktonand Merced, and numerous more in other cities, staffexpects that many more wells will be degraded byPCE in the future.
In conclusion, the PCE discharges from dry cleaners tosewer laterals, then to sewer systems and then to soilshave caused soil and ground water degradation.
Two major issues need to be resolved on the drycleaners' PCE discharges:
1. Who should define the extent of ground waterdegradation and do the cleanup?
2. How do we prevent further degradation of theground water by dry cleaners?
Ground water cleanup is required so that watersupply agencies can continue to provide safe water.Deciding who should investigate and cleanup groundwater is a complex political/legal issue since the PCEdischarges from the dry cleaners were all approved,standard practice and those from the sewers wereunsuspected. Because most dry cleaners are smallbusinesses, which may not have the financial capabil-ity to define the contamination plume and conductcleanup, other resources may be needed. A statewidecleanup fund may be appropiate. If no one else cleans
PCE PENETRATES A PIPEAS A GAS
High Levelsof
PCE Vapor
higher pressurelower pressure
High Concentration PCE
Liquids and Sludges
PCE Vapor Heavier Than
Air
Pipe
General PCE Vapor Path

Dry Cleaners—A Major Sourceof PCE in Ground Water
Page 22
up the ground water, water supply agencies will haveto do it by default.
To prevent further degradation, the most obvioussolutions are to set a limit for PCE discharge levels tothe sewer line that will protect ground water or todisallow all future discharges to the sewers from drycleaning. Two possible ways to accomplish this:
1. State legislation to set limits or prohibit dischargeof PCE from dry cleaning facilities to sewersystems.
2. City ordinances to set limits or prohibit anydischarge of PCE from a dry cleaning facility to thesewer line.
Since dry cleaners exist throughout the state a state-wide policies are needed.

Page 23 Regional Water Quality Control BoardCentral Valley Region
REFERENCES
1. California Regional Water Quality Control Board, Central Valley Region, Well Investigation Program files
2. Devitt, D.A., R.B. Evans, W.A. Jury and T.H. Starks, Soil Gas Sensing for Detection and Mapping of Volatile Organics,National Water Well Association, 1987
3. Freeze, R.A. and John A. Cherry, Groundwater, Prentice-Hall, Inc. 1979
4. Hotchkiss, William R., Generalized Subsurface Geology of Water Bearing Deposits Northern San Joaquin Valley,California, U.S. Geological Survey Open-File Report, 12 May 1972
5. Halogenated Solvents Industry Alliance, White Paper, Perchloroethylene, August 1987, 3p
6. Installation, Operation & Maintenance Instructions for VIC Kamero Models 402 & 403 (VMC 1025-A), VicManufacturing Campany, November 1971
7. Lowry, Polly, Personal Communications (1991), Associate Engineering Geologist, California Regional Water QualityControl Board, Central Valley Region
8. Marshack, Jon, A Compilation of Water Quality Goals, California Regional Water Quality Control Board, Central ValleyRegion, September 1991, 29p
9. Mendoza, C.A. and Todd A. McAlary, Modeling of Ground-Water Contamination Caused By Organic Solvent Vapors,Ground Water, Vol. 38 No. 2, March-April 1990, p199-206
10. Metcalf & Eddy, Inc., Revised by George Tchobanoglous, Wastewater Engineering-Treatment/Disposal/Reuse, 2ndEdition, McGraw-Hill, Inc., 1979
11. Norge Service Instructions and Part Catalog (DCSMP-61), Norge Sales Corporation, August 1961
12. Page, R.W., Appraisal of Ground-Water Condition in Merced, California, and Vicinity, U.S. Geological Survey Open-File Report 77-454, December 1977
13. Schwille, Friedrich, Dense Chlorinated Solvents in Porous and Fractured Media, Lewis Publisher, Inc. 1988 , 144p
14. Sittig, Marshall, Handbook of Environmental Data On Organic Chemicals, Second Edition, Van Nostrand ReinholdCompany, 1983
15. Tillman, N., K. Ranlet and T.J. Meyer, Soil Gas Surveys: Part 1, Pollutant Engineering, July 1989, p86-89
16. Tolby, L.G., Personal Communications (1991), District Manager-Technical Services, National Clay Pipe Institute
17. U.S. Environmental Protection Agency, January 1980, Ambient Water Quality Criteria for Tetrachloroethylene, EPA-440/5-80-073, 38p
18. U.S. Environmental Protection Agency, January 1982, Health Assessment Document for Tetrachloroethylene, EPA-600/8-82-005, 193p
19. Verschuerren, Korel, Handbook of Environmental Data on Organic Chemicals, Second Edition, Van Nostrand ReinholdCompany, 1983
20. Walker, Scott, June 1989, Well Investigation Program Assessment Report, City of Merced Wells 3A, 3B, 5, 2A and 2BMerced County, California Regional Water Quality Control Board, Central Valley Region, 29p
21. Weast, R.C., Editor, CRC Handbook of Chemistry and Physics, 70th Edition, CRC Press Inc., 1989
22. Windholz, Editor, The Merck Index, Merck and Co., Inc., 1976
EXHIBIT C

1
EXHIBIT C
SOURCE AREAS IN NORTHERN NEIGHBORHOOD
AND NEAR CHEVRON SITE
1) Neighborhood Area
a) Source Area Near the Intersection of Shirley Drive and Cynthia Drive
There was a release of CVOCs from the Central Contra Costa Sanitary District (“CCCSD”) sewer near the intersection of Shirley Drive and Cynthia Drive. The release source is identified by soil vapor data obtained during investigations completed by Gregory Village Partners, L.P. (see Erler & Kalinowski, Inc.’s Off-Site Property-Specific Soil Vapor and Sub-Slab Vapor Investigation Report, dated 19 January 2011). The soil vapor results show that the concentrations of PCE are high in the vicinity of Shirley Drive and Cynthia Drive, near manhole M54, i.e., MSVP-6 = 52,100 micrograms per cubic meter (“ug/m3”), SVP-15 = 35,000 ug/m3, SVP-16 = 38,000 ug/m3, and SVP-25 = 21,000 ug/m3, and that this area is distinguished from areas of lower concentrations that surround it (Exhibit 8 attached). Importantly, soil vapor samples taken on Cynthia Drive in a line perpendicular to the sewer line demonstrate that the locations of highest vapor concentration are closest to the sewer with diminishing concentrations moving away from the sewer (Exhibit 9 attached). The separation in areas of higher CVOCs in soil vapor concentration between the Shirley Drive / Cynthia Drive area and the P&K Cleaner Site, and the diminishing concentrations of CVOCs in soil vapor with distance from the sewer, both point to the existence of a release from the CCCSD sewer in this area which explains the detected vapor profile.
b) Source Area Near Manhole M46
Both groundwater and soil vapor data establish that there is a source of PCE and other CVOCs in the vicinity of CCCSD manhole M46. The sanitary sewer that enters manhole M46 from the south received waste from both the Chevron Site and the P&K Cleaner Site. Also, this sewer is located at or below the water table and thus any release of CVOCs from it would result in detecting CVOCS at the highest levels in soil vapor nearest to the water table. Of the three soil vapor sample depths at MSVP-17, which is located near manhole M46, the soil vapor sample nearest to the sewer and to the water table had the highest PCE concentration. PCE was detected in a grab groundwater sample at a concentration of nearly 2,000 micrograms per liter (“ug/L”), which is the

2
highest PCE concentration measured to date in groundwater north of the P&K Cleaner Site. Lower PCE and CVOC concentrations near Doray Drive, i.e., between the P&K Cleaner Site and the manhole M46 area, indicate that a separate release or contribution of PCE to groundwater occurred near that manhole (Exhibit 2 attached). In addition, PCE concentrations in soil vapor are higher in the vicinity of manhole M46 (extending to the Shirley Drive and Cynthia Drive area) than in the area between manhole M46 and the P&K Cleaner Site, i.e., within the Doray Drive area (Exhibit 8 attached). The best explanation for the detections of CVOCS near M46 is that there was a CVOC release from the sewer in that area.
2) Linda Drive Adjacent to Chevron Site
a) Source in Linda Drive Near the Sewer
The highest concentration of PCE in groundwater anywhere at the Chevron Site is in Linda Drive near the CCCSD sewer at former monitoring well EA-3 located cross-gradient from the Chevron Site. Chevron’s investigations show very high concentrations of PCE and other CVOCs in soil, soil vapor, and groundwater on the Chevron Site and in Linda Drive near the sewer line (Report of Investigation by EA Engineering, Science and Technology, Inc., 3 February 1989, and Additional Site Investigation Report and Site Conceptual Model by Conestoga-Rovers & Associates, Inc., 2 March 2012). At monitoring well EA-3 in Linda Drive, Chevron detected PCE in soil at 328 micrograms per kilogram from a sample that would have been collected from above the groundwater table and thus resulted from sewer leakage. PCE was detected in groundwater at 5,000 ug/L (Exhibit 10 attached), the highest concentration detected anywhere at Sites 1 and 2, at the same location. A 1977 CCCSD sewer inspection report for Linda Drive describes the sewer as “in very poor shape has lots of cracks,” but the replacement apparently did not occur until 10 years later (see Firestone 7/3/2012 letter to B. Wolfe (see Exhibit 23 to that letter)).

Exhibit 8 Separate Areas of High PCE Concentrations in
Soil Vapor Indicate Separate Releases
Higher Concentrations
Lower Concentrations
Higher Concentrations
Sewer Line Connects Chevron Site to Northern Neighborhood Locations of MSVP-14,
MSVP-15, MSVP-16 and SVP-26 on Exhibit 9
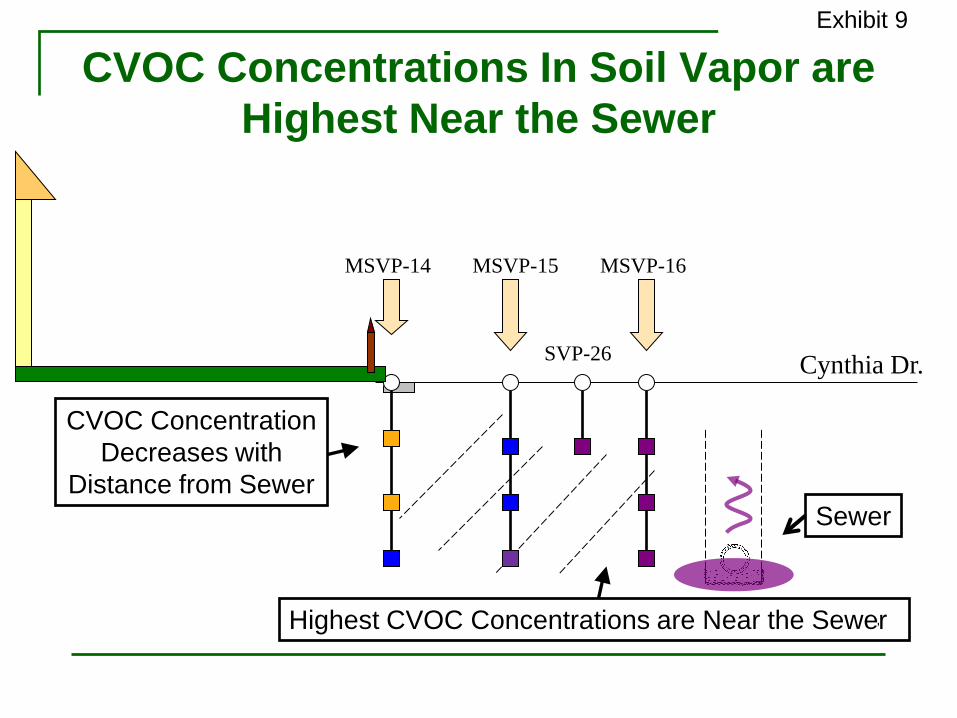
Exhibit 9
CVOC Concentrations In Soil Vapor are Highest Near the Sewer
Cynthia Dr. SVP-26
17 February 2011
Highest CVOC Concentrations are Near the Sewer
MSVP-14 MSVP-15 MSVP-16
CVOC Concentration Decreases with
Distance from Sewer Sewer

Exhibit 2
Separate Areas of High PCE Concentrations in Groundwater Indicate Separate Releases
Lower Concentration Along Doray Drive
Higher Concentration Near Manhole M46
Higher Concentration
PCE Plume Direction
Sewer Line Connects Chevron Site to Northern Neighborhood

Exhibit 10
17 February 2011
PCE in Groundwater in Linda Drive Cross-Gradient from Chevron Site Indicative of a Sewer Leak
Background image is from Report of Investigation, Soil Vapor Contaminant Assessment, Chevron SS 9-6817, 1705 Contra Costa Boulevard, Pleasant Hill, California, prepared for Chevron U.S.A, Inc., by EA Engineering, Science, and Technology, Inc., dated 9 August 1989.
Gregory Village Mall Property
CONTRA COSTA BLVD.
LINDA DRIVE
EA-2 Max. PCE: 4,000 ug/L
Msewer lateral?
EA-3 Max. PCE: 5,000 ug/L
MW-C Max. PCE: 1,800 ug/L

EXHIBIT D

Page - 1
2428 McGee Avenue Berkeley, CA 94703 (510) 845-8625 (510) 845-4606 FAX [email protected] Bonneau Dickson, P.E. Consulting Sanitary Engineer
DECLARATION OF BONNEAU DICKSON, PE
I, BONNEAU DICKSON, P.E., do declare and state as follows: 1. I am currently a Registered Professional Engineer in the State of
California in the area of Civil Engineering. I have over 40 years of experience in the field of Sanitary Engineering. I have participated in the design and/or construction management of approximately 300 water, wastewater and stormwater projects, ranging in size from a single septic tank or well to a 120 MGD pure oxygen wastewater treatment plant and I was the project manager on many of these projects. I have served as a forensic technical consultant, expert witness or claims analyst on over 100 legal cases. Approximately 50 of my cases involved sanitary sewer overflows (SSOs) and approximately ten of my cases have involved PCE contamination.
2. I have a Bachelor of Science Degree in Civil Engineering and a Master of Science Degree in Sanitary Engineering from the Georgia Institute of Technology. I also have a Master of Arts Degree in Sanitary Engineering from Harvard University and a Master of Business Administration from the Harvard Business School. I have been employed by several engineering firms in various engineering capacities. I have been self-employed as a consulting sanitary engineer since 1993.
3. I am a member of the:
Water Environment Federation. California Water Environment Association. American Water Works Association. WateReuse. Pipe Users Group Of Northern California. National Onsite Wastewater Association. California Onsite Wastewater Association.
4. After being retained as an expert consultant in this matter, I have reviewed, among other things, the following documents:
"Off-Site Property-Specific Soil Vapor and Sub-Slab Vapor Investigation Report", Erler & Kalinowski, 1/19/2011.

Page - 2
"Updated Conceptual Site Model For Gregory Village", PowerPoint presentation to the San Francisco Bay Regional Board by Erler & Kalinowski, 2/17/2011. The letter from Edward A Firestone, Esq. to Bruce Wolfe, Executive Director of the San Francisco Bay Regional Water Quality Control Board, 7/3/2012. The letter from Leah S. Goldberg, Esq. of Meyers/Nave to Bruce Wolfe, Executive Director of the San Francisco Bay Regional Water Quality Control Board, dated 8/10/2012, responding to Ed Firestone's letter of 7/3/2012. The letter from Edward A. Firestone, Esq. to Bruce Wolfe, Executive Director of the San Francisco Regional Water Quality Control Board, dated 12/8/2012, responding to Ms. Goldberg's letter of 8/10/2012. The letter from Mary Haber, Esq. of Gregory Village Partners, L. P. to Bruce Wolfe, Executive Director of the San Francisco Regional Water Quality Control Board, dated 5/28/2013, responding to specific questions posed by the Regional Board. The letter from Tim Potter of the Central Contra Costa Sanitary District (CCCSD) to Bruce Wolfe of the San Francisco Regional Water Quality Control Board, dated 5/28/2013, responding to specific questions posed by the Regional Board in a letter dated 2/25/2013. The letter from Curtis W. Swanson, of the Central Contra Costa Sanitary District (CCCSD) to Chuck Headlee of the San Francisco Regional Water Quality Control Board, dated 12/18/2013, responding to specific questions posed by the Regional Board. The San Francisco Regional Water Quality Control Board Tentative Orders, Self Monitoring Plan, and Cleanup Team Staff Report, July 2, 2014. "The Evolution Of Jointing Vitrified Clay Pipe", Evans, Jack and Spence, Marlene N., Advances in Underground Pipeline Engineering, Pipeline Division, ASCE/Madison, WI/ August 27-29, 1985. "Dry Cleaners--A Major Source Of PCE In Ground Water", Victor Izzo, Regional Water Quality Control Board, Central Valley Region, CA, March, 1992.

Page - 3
5. Based upon my experience and my review of documents in this matter, I
have developed the following opinions:
LIST OF OPINIONS Opinion 1. Gravity sewers never were and still are not designed or constructed to be free of leaks. Opinion 2. Immediately after the sewers were installed in the area of the Gregory Village site and the Chevron site (“sites”), it is likely that the sewer lines sagged and the joints failed. Opinion 3. The sewers in and around the sites are certain to have had significant infiltration of groundwater and exfiltration of waste from inside the sewers beginning from the time they were built through this day. Opinion 4. The design and installation of the CCCSD sanitary system in the area of the two sites makes sewer maintenance and sewer cleaning difficult. Opinion 5. The sanitary sewer industry generally accepts as true the mechanisms described in the Izzo Report relating to the release of PCE from sewer lines. Opinion 6. The CCCSD operation and maintenance (“O&M”) program always was and still is designed to keep the wastewater flowing through the sewers but not to prevent leaks from the sewer system, unless the leaks are significant or catastrophic. Opinion 7. Varying flows of waste due to minor or major blockages in the CCCSD sewer system could have forced chlorinated volatile organic compounds (CVOCs), either in a pure or dissolved state, upstream into other branches of the sewer system. Opinion 8. Vapor in the sewer lines, including PCE vapor, can move preferentially upstream in sewers and/or in the backfill around the sewers.
OPINION DETAILS Opinion 1. Gravity sewers never were and still are not designed or constructed to be free of leaks. The evidence I have reviewed indicates that the CCCSD sewers in the vicinity of 1643 Contra Costa Boulevard, Pleasant Hill, CA were built no later than the early 1950s and that they are mostly made of vitrified clay pipe (“VCP”). With the exception of a segment in Linda Drive and a segment across Doray Drive, the current configuration of the sewer system has not changed since it was originally built. The configuration of the sewer system and the manhole (MH) numbering system are shown in Exhibit i of this declaration, which was Exhibit 7 of the Firestone 7/3/12 letter.

Page - 4
Leakage problems from sewers that were built with vitrified clay pipe (VCP) in the 1940s-50s are well known among cities and sewerage agencies. The joints of the sewer therefore are likely to be cement mortar or a poured bituminous material, both of which tend to be brittle. See Exhibits 8, 9 and 10 to the Firestone 7/3/12 letter attached here as Exhibits ii, iii, and iv. This type of joint frequently breaks if there is any movement, such as from an earthquake or the passing of a heavy vehicle. Moreover, 8-inch clay pipe usually was furnished in lengths of 3-feet in the 1940s and 1950s, so there are many joints. Problems with VCP pipes during the 1940s and 1950s are discussed in "The Evolution Of Jointing Vitrified Clay Pipe", Evans, Jack and Spence, Marlene N., Proceedings, Advances In Underground Pipeline Engineering, Pipeline Division, ASCE/Madison, WI/August 27-29, 1985, which is included as Exhibit v of this declaration. At least one of the authors of this article worked for a manufacturer of clay pipes. The article obviously was intended to tout the virtues of VCP, but the discussion of the problems with earlier jointing methods and materials is revealing. The article discusses that little attention was paid to leakage in sewers until after World War II. On the fourth page, the article says, "Early studies of sewers found problems of infiltration to be widespread. The difficulties and expense encountered with the treatment of this extraneous flow into sewer systems lent a bad name to vitrified clay pipe." On the same page, it is noted that the first ASTM specification for VCP joints with resilient properties was not issued until 1958. (See the underlining). Elastomeric joints for VCP did not become available in California until around 1965. Although the writers were discussing “infiltration”, obviously if water can enter the sewer through the pipe from the outside, water and CVOCs can leave the pipe as “exfiltration”. Opinion 2. Immediately after the sewers were installed in the area of the Gregory Village site and the Chevron site (“sites”), it is likely that the sewer lines sagged and the joints failed. Beginning in the 1950s when the sewers were installed, defects and failures in the sewer system were likely similar to the defects and failures reported by CCCSD during the period of 1994 to 2014. While it is true that sewer systems do tend to deteriorate over time, it is likely that many of the defects that were observed in recent years also existed much earlier. It is well known in geotechnical engineering that most of the settlement of re-compacted soil takes place in the first year after construction. As discussed above, the type of joints used on VCP sewers during the era when the sewers were built were brittle and would crack and leak if there was the slightest movement of the pipes. Thus it is likely that many of the joints opened very shortly after the initial construction. It is also likely that sags developed shortly after the initial construction.

Page - 5
Moreover, tree roots very rapidly search out sewer pipes as a source of water and nutrients. In many sewer systems, it is necessary to cut out or chemically treat tree roots every two to three years. Thus it is likely that there was significant root intrusion into the pipes within a few years after they were initially laid. Opinion 3. The sewers in and around the sites are certain to have had significant infiltration of groundwater and exfiltration of waste from inside the sewers beginning from the time they were built through this day. Factors that would have caused the sewers around the site to leak include: a high leakage allowance at the time of installation; the fact that the sewers were made of vitrified clay pipes (VCP), which comes in short lengths and thus has numerous joints; the brittleness of VCP; the requirement that the clay pipes be unglazed, which allows vapor to pass through the walls more easily than for glazed pipe; and the poor gasketing materials. These factors are summarized well starting on Page 5 of the Firestone 7/3/12 letter. Exhibit ii of this declaration (Exhibit 8 to the Firestone 7/3/2012 letter) presents CCCSD sewer specifications from around 1950 that allowed an exfiltration rate of up to 1,400 gallons per day per inch of diameter per mile. Later versions of the CCCSD specifications also included exfiltration and/or infiltration tolerances, although at lesser rates than the earlier specifications. To this day, the latest version of the CCCSD specifications (the 2011 Edition) allows some leakage into (and out of) the sewers. For example, in CCCSD’s current specifications, the last paragraph on Page 32, section 4-01 B., (Design Standards) discusses that a groundwater infiltration (GWI) rate of 170 gpd/acre shall be used in estimating the wastewater flow rate for design. Obviously this means that even new sewers are expected to leak. Section 15.02730 3.4 of the current CCCSD specifications discusses air and hydrostatic testing of sewers. Sewers larger than 17-inches in diameter must be tested hydrostatically, i.e. by how much exfiltration occurs. CCCSD reduced the exfiltration and/or infiltration tolerances over the years, likely due to the infiltration of large volumes of groundwater and stormwater that adversely impacted the wastewater treatment plant. The topography of the site is relatively flat, so the slopes of the sewers were small to minimize the depths of the sewers. As discussed in the Firestone 7/3/2012 letter, the slopes of the sewers are less than the current standard of 0.0077. The flat slopes result in low velocities and long residence time in the sewers. The low velocities allow solids to strand, creating small dams. The pools behind these small dams allow undissolved PCE to collect at the bottoms of the pools because undissolved PCE is denser than water. Where there are leaks at the bottoms of the pipes, PCE will leak out even more than water.

Page - 6
Opinion 4. The design and installation of the CCCSD sanitary system in the area of the two sites makes sewer maintenance and sewer cleaning difficult. A factor that undoubtedly affects maintenance of the sewer system in the area of the sites is the excessive distances between manholes. The longer the distance between manholes, the more difficult it is to clean the sewer segment. The sewer rodding machines or the hydroflushing hoses must be extended out long distances and are more and more difficult to control effectively as they get farther out. The current CCCSD design standard for manholes requires that the distance between manholes be not more than 500-feet. The sewer segment between MH59 and MH46 is 706-feet long. See Exhibit i of this declaration. Moreover, this sewer segment has a peculiar jog in alignment where it crosses Doray Drive. Good practice would have been to place manholes at these changes in direction such as was done between MH28 and MH29 on the backlot sewer line between Doris Drive and Kathryn Drive. It is understood that the "jog" part of this segment was replaced with iron pipe rather than VCP when the original pipe collapsed but details of why this was done have not been found. It is also noted that some of the defect reports noted difficulties in trying to video and/or clean the pipe to and through the jog. Some of the sewer segments in Luella, Cynthia, Margie, Hazel, Doris, Vivian and Mazie Drives exceed 400-feet in length and some cases are well over 600-feet in length. Maintenance of the sewers in these streets is also made more difficult because many of the sewers are only 6-inches in diameter. Current practice requires a minimum diameter of 8-inches. Accumulations of solids in these sewer lines would eventually move downstream, where they would likely contribute to additional blockages. A CCCSD record from 1977 describes the original sanitary sewer in Linda Drive as “very poor shape has lots of cracks” (see the Firestone 7/3/2012 letter (see Exhibit 23 to that letter)). Based on the available records, it appears that that line was not replaced for at least ten years after problems in the line were noted. As at the jog at Doray Drive, the older VCP was replaced with iron pipe. Opinion 5. The sanitary sewer industry generally accepts as true the mechanisms described in the Izzo Report relating to the release of PCE from sewer lines. The Izzo report is attached as Exhibit B to the Firestone letter dated 8/4/14. Izzo identified five likely methods by which PCE can escape from a sewer line. These were:
1. Through breaks or cracks in the sewer pipes. 2. Through pipe joints and other connections.

Page - 7
3. By leaching in liquid form directly through sewer lines into the vadose zone. 4. By saturating the bottom of the sewer pipe with a high concentration of PCE-containing liquid and the PCE volatilizing from the outer edge of the pipe into the soils. 5. By penetrating the sewer pipe as a gas.
Page 19 of the Izzo report states, "The literature indicates that all sewer lines leak to some extent...allowance must be made for unavoidable infiltration...if...liquids can infiltrate, then a conclusion can be made that liquids on the inside of the pipe can exfiltrate...." Opinion 6. The CCCSD operation and maintenance (“O&M”) program always was and still is designed to keep the wastewater flowing through the sewers but not to prevent leaks from the sewer system, unless the leaks are significant or catastrophic. The CCCSD sewer maintenance program consists of cleaning the sewers at various intervals, responding to blockages and sanitary sewer overflows (SSOs) when they occur, and repairing defects when they are found if the defects are deemed to be significant and to require repair. Root penetrations usually are corrected by cutting out the roots or by chemically treating the roots. These methods of getting rid of the roots do not get rid of the openings through which they entered the pipes, i.e. the maintenance procedures are aimed at restoring flow in the sewers but not at stopping leakage from the sewers. As stated by T. Potter, Environmental Compliance Superintendent, CCCSD, in his letter dated 5/2813 to B. Wolfe at the Regional Board (p. 5): “The goal of routine cleaning is keep [sic] the sewer lines clear of obstructions to retain their capacity to convey wastewater to the District’s treatment plant.” Nothing in this statement discusses a goal of correcting leakage. Cleaning the sewers tends to reduce the number of blockages that occur but does nothing to stop the sewer pipes from leaking. Similarly, clearing blockages merely clears the sewer pipe, but does not address leaks. As noted in Opinion 4, the length of the pipe segments in the area and location of jogs makes maintenance and cleaning difficult. As discussed the Firestone 7/3/2012 letter, CCCSD's repairs of defects often were not made until years after the defects were discovered. Thus whatever leakage was caused by the blockages or exacerbated by the blockages went on over extended periods of time. As noted in the Cleanup Team Staff Report (Staff Report), the CCCSD ordinances allowed PCE to be discharged to the sewer system but the CCCSD operation and maintenance program did not prevent leaks of the PCE from the sewer system.

Page - 8
On Page 13 of the Staff Report, the first sentence under Section 1 says, "While there is evidence of incidental leakage from the sanitary sewer lines, there is no direct evidence the leakage contributed substantially to the creation of the CVOC comingled groundwater plume." This statement ignores the fact that a leak in a sewer pipe releasing only a small quantity of PCE is all that is required to create the PCE detected in groundwater in the area. The commingled plumes likely contain only a few dozen gallons of PCE. The pipe specifications in effect around 1950 would have allowed exfiltration of as much as 2 gallons per day per linear foot of 8-inch pipe. The sewers from Linda Drive to Doray Drive are about 1,000-feet long. Thus the amount of leakage from these segments of the sewers could have been as much as 2,000 gallons per day. The dry cleaners that used PCE were in operation for approximately 30 years. Many dry cleaning machines piped their separator water directly to the sanitary sewer. As noted by the Staff Report, under CCCSD’s regulations, PCE was allowed to be discharged into the sewers. Separator water from dry cleaners contains up to 150,000 ppb of PCE, which is the amount of PCE that can be dissolved in water. Often pure PCE was contained in the separator water if the operator was not careful in the separation. Over the thirty or so years that both cleaners operated, substantial amounts of separator water went into CCCSD's sewers. Given the concentrations of PCE in the separator water, it would not take much of it to leak out to create the concentrations detected in the groundwater in the area. Opinion 7. Varying flows of waste due to minor or major blockages in the CCCSD sewer system could have forced chlorinated volatile organic compounds (CVOCs), either in a pure or dissolved state, upstream into other branches of the sewer system. It is likely that blockages occurred in the sewers in the area of the sites because of the flat slopes of the sewer lines or inability to completely clear blockages due to the length of the pipe segments and location of jogs. Such blockages could have surcharged the sewer system until enough depth of water was built up to break the blockages loose. Such occurrences might not have resulted in an overflow to the surface or into buildings or residences; thus no one would be aware that they had occurred. As a result of the blockages, PCE contained in the blocked waste can flow “upstream” in the sewer line to other branches. Opinion 8. Vapor in the sewer lines, including PCE vapor, can move preferentially upstream in sewers and/or in the backfill around the sewers. PCE vapor can and does move upstream through gravity sewers and through the backfill in the sewer trenches, which is always more permeable than the surrounding native soil because it was disturbed when the trench was dug. This would be true even if the native soil contained considerable amount of clay. As the sewers slope downward and go below the water table, vapor can no longer pass through the saturated backfill and may preferentially move toward the higher parts of the sewer system either through

Page - 9
the pipes or through the unsaturated backfill. Thus, PCE could be detected in soil vapor “upstream” of a sewer line leak or penetration. For example, in a case in Arizona that I was a consultant on, there were two side-by-side strip malls, separated by a wide driveway and walkway area, but connecting to a common manhole in the driveway area between them. Hydrogen sulfide gas was being generated in the far end of one of the strip malls. This hydrogen sulfide gas made its way down the gravity drains and sewer from the first strip mall, then up the sewer and drains of the second strip mall over a distance of several hundred feet. August 4, 2014
_______________________________ BONNEAU DICKSON, P.E.

Exhibit i


Exhibit ii


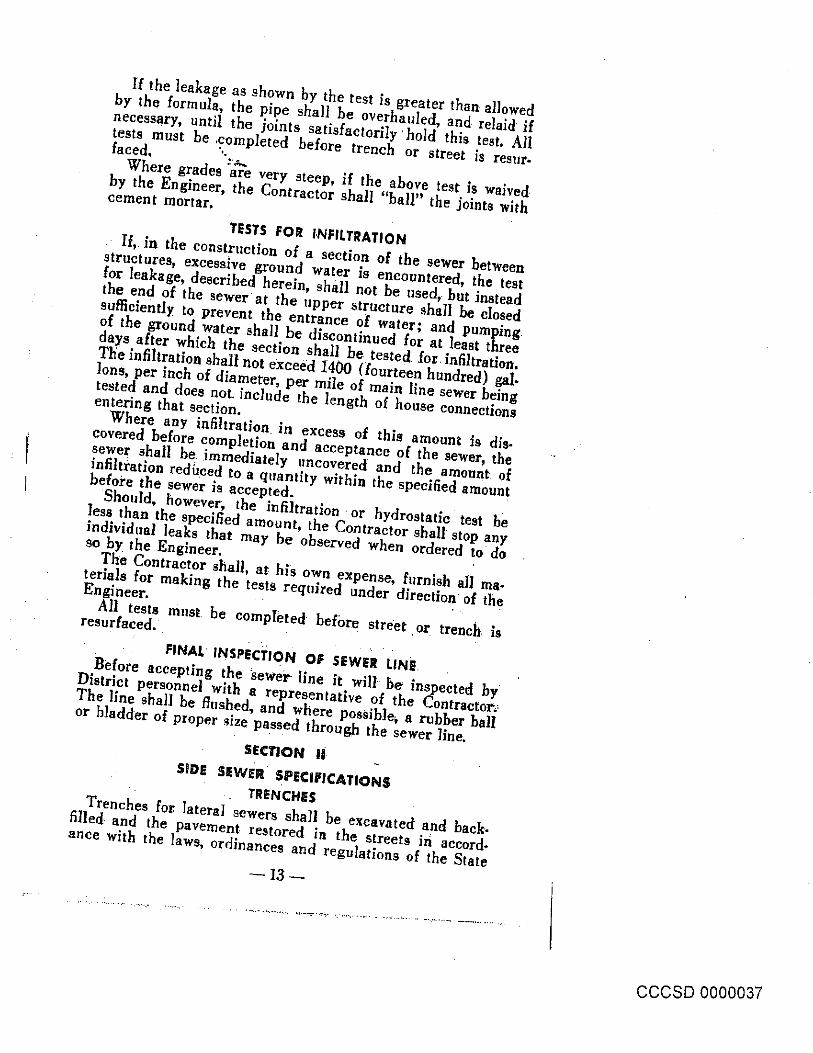

Exhibit iii


Exhibit iv


Exhibit v


EXHIBIT E
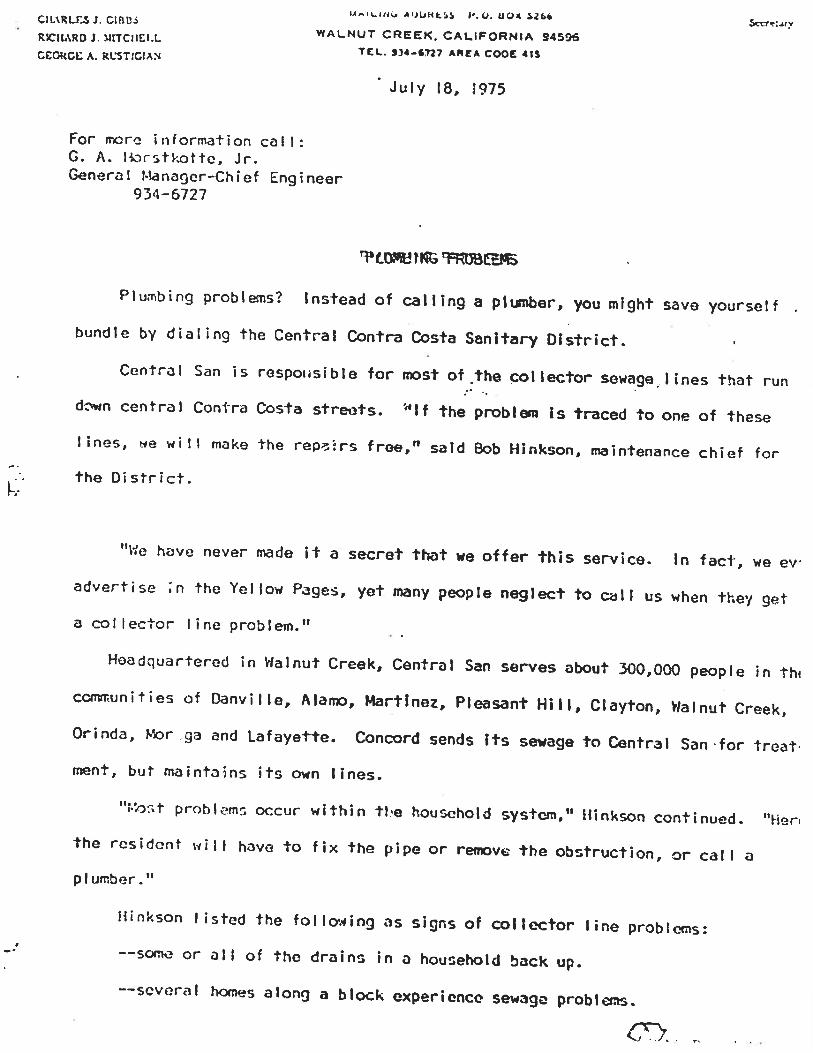


EXHIBIT F


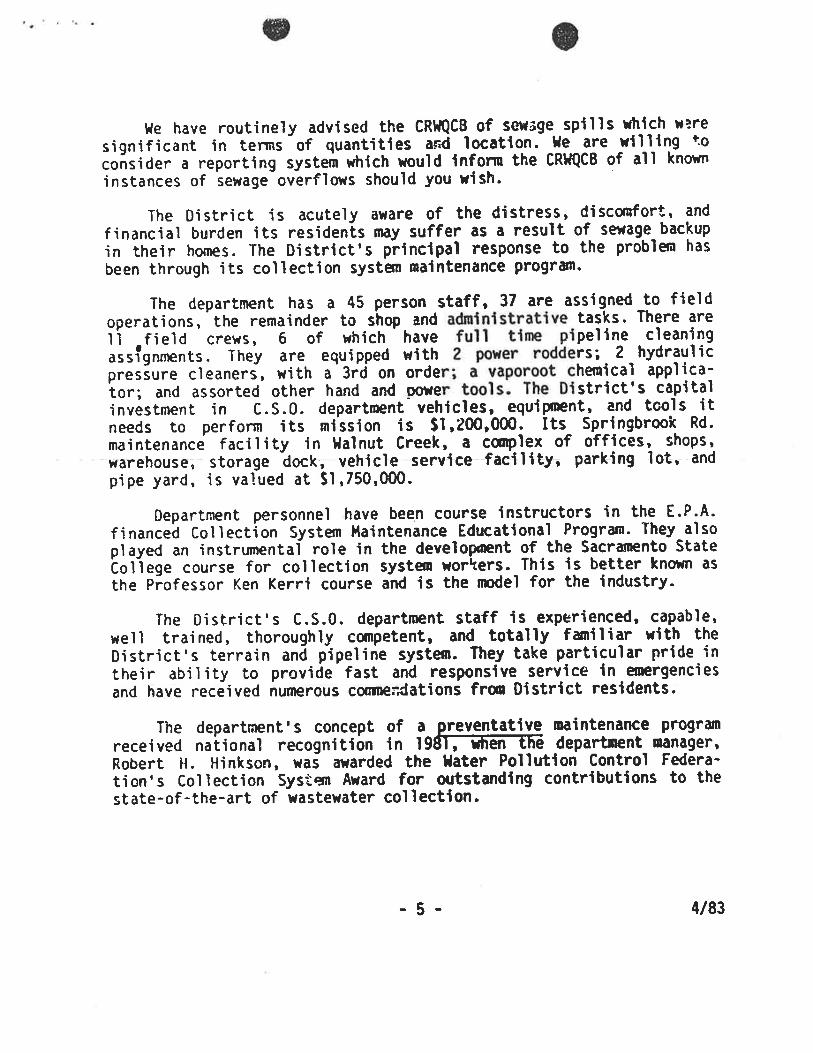

EXHIBIT G

EXHIBIT G
Gregory Village Partner’s Comments, including Erler & Kalinowski, Inc.’s comments, on Tentative Orders Related to the Properties at 1643 Contra Costa
Boulevard and 1705 Contra Costa Boulevard, Pleasant Hill, California
• Tentative Order – Site Cleanup Requirements for 1643 Contra Costa Boulevard (“P&K Cleaner Site” or “Site 1”),
• Tentative Order – Site Cleanup Requirements for 1705 Contra Costa Boulevard (“Chevron Site” or “Site 2”), and
• Cleanup Team Staff Report for File Nos. 07S0132 and 07S0204 (“Staff Report”).
1) Comments on Order for 1643 Contra Costa Boulevard (“Site 1”)
a) Order Finding 3 - Named Dischargers
i) Discharger Not Named (item 3, third paragraph, page 3): The Order broadly
states that it is “common knowledge that releases occurred during routine dry cleaner operations involving chlorinated solvents” but fails to point out that it is also common knowledge to State of California agencies that dry cleaner operations routinely discharged contaminated wastewaters to sanitary sewers and that it is common knowledge that sewers leak (Exhibit B to Firestone letter to Bruce Wolfe dated 4 August 2014 - Dry Cleaners – A Major Source of PCE in Groundwater, by Victor Izzo, dated 27 March 1992). This paragraph in the Order should be modified to add these two points. Both of these points highlight the role of the sanitary sewers and, as explained below, the responsibility of the Central Contra Costa Sanitary District (“CCCSD”) for releases from the sewers.
ii) Sewer Leaks Contributed to the Off-site Groundwater Plume (page 3, item 3, third paragraph): This paragraph states that the dry cleaner pollutants “are present in groundwater at and downgradient of the former dry cleaner in concentrations that generally diminish with distance” from the P&K Cleaner Site. This statement ignores the fact that groundwater at sewer manhole M46 (sample GGP87-01) had the highest detected concentration of tetrachloroethene (“PCE”) in groundwater in the off-site northern neighborhood and higher than the levels found at the well furthest downgradient on the P&K Cleaner Site, a concentration that is due to a sewer leak near manhole M46 (Exhibits 1 and 2). This paragraph in the Order should be modified to acknowledge that sewer leaks are “additional releases” of PCE and have “contributed” to the pollutant plume in groundwater in the

2
northern neighborhood, as well as upgradient of Site 1 in the vicinity of Linda Drive from discharges from Site 2 of PCE containing wastewater to the old sewer in Linda Drive, which was subsequently replaced by CCCSD.
b) Order Finding 4 – Regulatory Status. Although the Site is not subject to a
Regional Water Board order, it was voluntarily entered into the Spills, Leaks, Investigations and Cleanup (SLIC) Program in March 2002. This fact should be noted in this paragraph.
c) Order Finding 9 - Nearby Sites
i) Joint Investigation Needed (page 6, item 9, first paragraph): The last sentence states that the petroleum and chlorinated volatile organic compound (“CVOC”) releases from the Chevron Site have commingled with the CVOC plume from the P&K Cleaner Site. We agree with this RWQCB conclusion and thus a single order should be issued to require the responsible parties for both the P&K Cleaner Site and the Chevron Site to jointly investigate and remediate the commingled plume, including in the northern neighborhood. At a minimum, as stated below, the Order for Site 2 should include Tasks with the same specificity as provided in the Order for Site 1, e.g., requirements for installation and sampling of monitoring wells, soil vapor probes, sub-slab and indoor vapor concentrations, and a deep groundwater investigation, and inclusion of a Self-Monitoring Program for Site 2. In addition, it should be noted that the Chevron Site discharged waste, including dry cleaner separator water containing CVOCs, into the CCCSD sanitary sewer, which is located next to the Chevron Site in Linda Drive and continues north, then east and then north again, adjacent to the Gregory Village Shopping Center (Exhibit 1). P&K Cleaners used the same sewer line for its wastewater disposal. These discharges of wastewaters from both dry cleaners to the same sewer line, which then entered manhole M46 (Exhibit 1) should be noted in this paragraph of the Order.
d) Clarifications and Corrections i) 2. Site History (first sentence at top of page 2): CVOCS and benzene were
detected in the indoor air at “two” houses not “several.”
ii) 7. Remedial Investigation (page 5, table summarizing maximum detected concentrations): The data identified as “Maximum Concentration Detected” include results for chemicals in vapor samples that are listed as not detected with the maximum laboratory report limit shown. Where detected, the

3
maximum concentrations for trichloroethene (“TCE”), cis-1,2 dichloroethene (“cis-1,2-DCE”) and vinyl chloride in soil vapor were 6,240 micrograms per cubic meter (“ug/m3”), 947 ug/m3, and 188 ug/m3, respectively.
iii) Self- Monitoring Program, 2. Monitoring: The current monitoring program at
the P&K Cleaner Site includes semi-annual measurement of groundwater elevations, not quarterly. The SMP should continue semi-annual measurement of groundwater elevations in available monitoring wells.
e) B. Tasks i) The Staff has created unrealistic dates for Tasks 1, 2, and 3. Significant
preparatory work needs to be completed in coordination with other responsible parties prior to initiating these tasks. New, appropriate dates need to be negotiated with the Staff, with particular recognition to the facts that the P&K Cleaner Site parties have limited resources and that Gregory Village Partners, L.P. (“GVP”) has already voluntarily performed significant work in the neighborhood and on the P&K Cleaner Site in cooperation with the Regional Board. The unrealistic time schedule is punitive and unnecessary, especially in light of the fact that GVP has voluntarily investigated and mitigated potential human health risks in the neighborhood and on the P&K Cleaner Site without assistance from other potentially responsible parties for several years. In addition, the tasks in this tentative order are different than the tasks in the tentative order for the Chevron Site (Site 2). As noted below, there should be a single order for both sites. In the absence of a single order, all task paragraphs and schedules for tasks should be identical in orders for Site 1 and Site 2 with respect to common issues, i.e., deeper groundwater, the northern residential neighborhood, etc.
2) Comments on Order for 1705 Contra Costa Boulevard (“Site 2”)
a) Order Finding 3. Named Dischargers: The Chevron Site discharged wastes,
including dry cleaner separator water containing CVOCs, into the CCCSD sanitary sewer which is located next to the Chevron Site in Linda Drive. The evidence from the monitoring well on Linda Drive shows that CCCSD’s sewers leaked in this area; thus CCCSD should be named as a discharger on this order. This should be noted in this paragraph.

4
b) Order Finding 7 – Remedial Investigation i) Plumes Are Commingled (page 4, item 7, first paragraph): This paragraph
states ambiguously that Chevron Site releases have “likely” commingled with the CVOC groundwater plume associated with the P&K Cleaners Site. However, the Staff Report (Section V) provides clear evidence that Chevron Site plume has traveled onto and through the P&K Cleaner Site and commingled with the P&K Cleaner Site plume and that this commingled plume has migrated to the residential neighborhood north of the P&K Cleaner Site. Because of this fact, the Regional Board should issue a single order for both Sites. In the event it does not do so, the Order for Site 2 should be changed to remove any ambiguity regarding the comingling of the plumes, and it should require that the parties responsible for the Chevron Site participate in any and all investigations and remediation associated with the commingled groundwater plume, including soil vapor that may emanate from it, i.e., Tasks 1 through 6 should read the same in both Orders. Furthermore, CCCSD’s sewer leaks have also commingled with both the Chevron Site plume upgradient of the P&K Cleaner Site and commingled with both the Chevron and P&K Cleaner plumes in downgradient areas.
ii) Many Significant Data Gaps (page 4, item 7, last paragraph): The RWQCB states that there are several data gaps for the investigation of the Chevron Site with regards to the “vertical and lateral distribution of CVOCs in soil, soil vapor, and groundwater, both on-Site and off-Site.” At a minimum, the most important of these data gaps should be identified in the Order and include a) the lack of data regarding CVOCs in soil vapor that may have migrated under the Gregory Village Mall building from releases at Site 2, b) the complete absence of monitoring wells to further assess CVOCs in shallow and deep groundwater from releases on Site 2 on the Gregory Village Mall Property and in the vicinity of Linda Drive, c) an understanding of CVOCs in groundwater and soil vapor in the residential neighborhood areas adjacent to the Chevron Site and upgradient of the P&K Cleaners Site, and d) a requirement that the parties responsible for the Chevron Site participate in the shallow and deep groundwater investigation in the commingled plume area on the Gregory Village Mall Property and in the northern neighborhood.
c) Order Section B, Tasks
i) Lack of Specific Survey Requirement (page 10, Section B, Task 1): In Task 1,
the RWQCB requires that a sensitive receptors survey and conduit study be conducted but omits this very specific requirement that is included in the P&K

5
Cleaner Order. Because the RWQCB acknowledges that the Chevron Site plume is commingled with the P&K Cleaner Site plume, the Order for Site 2 should state the same requirements as in the P&K Cleaner Order, which should include the same requirement that “A door-to-door well survey shall be completed in the residential subdivisions to the north and west of the shopping plaza.” We also recommend that such a survey be completed by the parties responsible for the Chevron Site in the adjacent residential neighborhood areas and upgradient of the P&K Cleaners Site.
ii) Lack of Specific Investigation Requirements (page 10, Section B, Task 3): In Task 2, unlike the P&K Cleaner Order which requires that specific investigations be conducted, the Chevron Order does not identify any specific investigations that must be conducted. A 2011 investigation at the Chevron Site found PCE at 2,500,000 ug/m3 in soil vapor (VP-1) and the highest detection of PCE in soil (20 mg/kg) was at the deepest depth sampled at the Chevron source (approximately 35 feet bgs at CPT-14) (Exhibit 3.) These data strongly suggest the need to delineate the extent of vapor migration and the impact to deep groundwater, both on and off the Chevron Site. The Chevron Order should specify certain required investigations, including assessment of CVOCs in soil vapor that may have migrated under the Gregory Village Mall building, the installation of monitoring wells to further assess the lateral and vertical extents of CVOCs in shallow and deep groundwater migrating onto the Gregory Village Mall Property and in the vicinity of and downgradient of Linda Drive, and the investigation of shallow and deep groundwater in the commingled plume area on the Gregory Village Mall Property and in the northern neighborhood.
iii) No Requirement for a Self-Monitoring Program: Chevron Site releases have significantly impacted groundwater but surprisingly the Chevron Site has no groundwater monitoring wells except for one off-site shallow monitoring well that is located in the wrong place, i.e., so-called "compliance point” well EA-5, which is not located within the path of the CVOC contaminant plume that has migrated from the Chevron Site (Exhibit 4). The Order for Site 2 should require new shallow and deep groundwater monitoring wells that are routinely monitored in accordance with an appropriate Self-Monitoring Program.
3) Comments on Staff Report
a) Report Section III, Substantial Evidence of CVOC Releases from the Former
Steel Waste Oil UST and Former Dry Cleaner at Site 2

6
i) Extent of Chevron Plume on Gregory Village Mall Not Delineated (page 10,
fourth paragraph): In the Staff Report, the discussion that provides justification for reopening the RWQCB case on the Chevron Site, includes a comment stating that that the groundwater plume from the Chevron Site underlies the eastern part of the shopping center. It is important to point out that the only investigation to date by the parties responsible for the Chevron Site plume on the shopping center property has been on the eastern side of the Gregory Village Mall Property. No investigation of the groundwater plume has been conducted under or on the western side of the mall building, or along the southern side of the building along Doris Drive, even though PCE from the Chevron Site was found at 3,380 micrograms per liter in groundwater on the Mall property a short distance east of the Mall building (sampling location ECP-2 on Exhibit 4). In addition, there has been no investigation by Chevron of soil vapor under the southern end of the Mall building or elsewhere on the southern end of the Gregory Village Mall Property in the areas where the Chevron site plume is known to have migrated onto the Mall property or where likely to have done so.
b) Report Section IV, Basis for Naming Chevron Under The Water Code as a Discharger at Site 2; i) Chevron was the Former Landowner Where the Dry Cleaner Operated (page
8). In addition to the precedent of State Water Board Orders, there are CERCLA precedents to naming Chevron. In this case, Chevron purchased the dry cleaner property and subsequently built a car wash on that property while it owned it. Chevron’s activity was not passive. Chevron graded the dry cleaner property, moved soil, dug utility trenches, excavated for footings and poured foundations in the subsurface. [Note that Chevron analyzed groundwater samples for CVOCs as early as 1988 and was thus aware of significant groundwater contamination during most of the period it owned the property.] Chevron moved that soil around the Site. 42 U.S.C §9607(a)(2) states that a responsible party is “any person who at the time of disposal of any hazardous substance owned or operated any facility at which such hazardous substances were disposed of.” CERCLA defines “disposal” through the Solid Waste Disposal Act. See 42 U.S.C. § 9601(29) and 42 U.S.C. § 6903(3). The definition in its entirety reads: “The term “disposal” means the discharge, deposit, injection, dumping, spilling, leaking, or placing of any solid waste or hazardous waste into or on any land or water so that such solid waste or hazardous waste or any constituent thereof may enter the
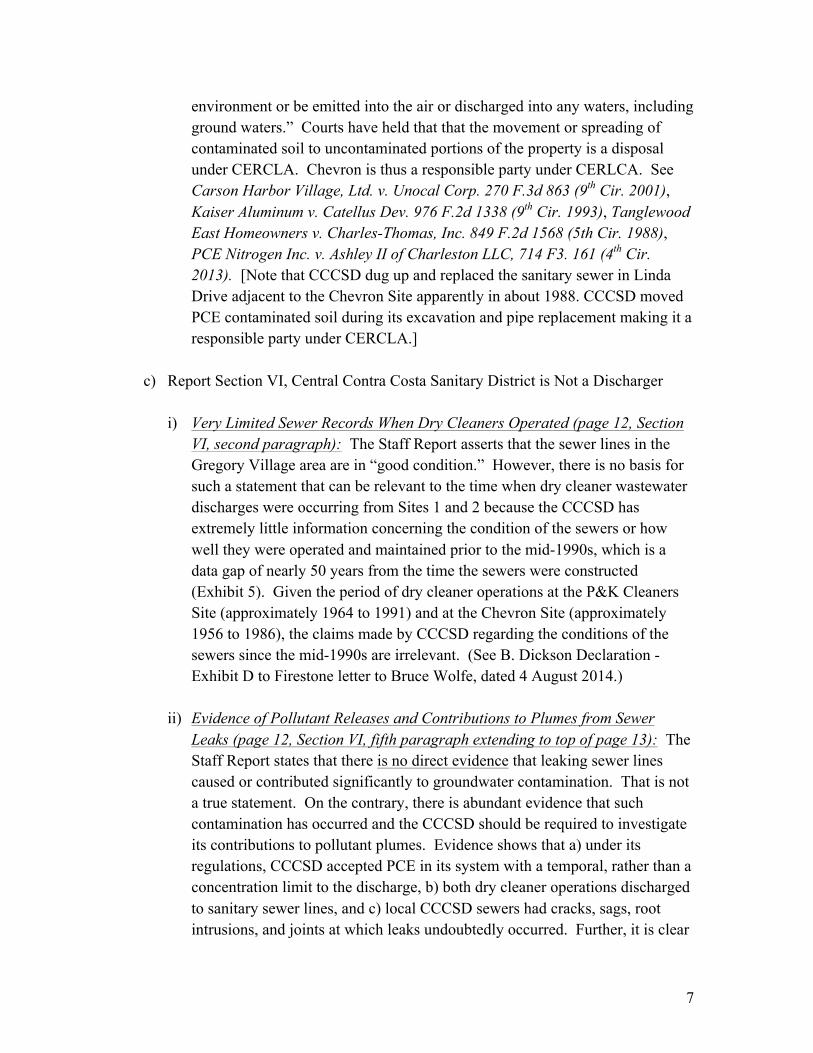
7
environment or be emitted into the air or discharged into any waters, including ground waters.” Courts have held that that the movement or spreading of contaminated soil to uncontaminated portions of the property is a disposal under CERCLA. Chevron is thus a responsible party under CERLCA. See Carson Harbor Village, Ltd. v. Unocal Corp. 270 F.3d 863 (9th Cir. 2001), Kaiser Aluminum v. Catellus Dev. 976 F.2d 1338 (9th Cir. 1993), Tanglewood East Homeowners v. Charles-Thomas, Inc. 849 F.2d 1568 (5th Cir. 1988), PCE Nitrogen Inc. v. Ashley II of Charleston LLC, 714 F3. 161 (4th Cir. 2013). [Note that CCCSD dug up and replaced the sanitary sewer in Linda Drive adjacent to the Chevron Site apparently in about 1988. CCCSD moved PCE contaminated soil during its excavation and pipe replacement making it a responsible party under CERCLA.]
c) Report Section VI, Central Contra Costa Sanitary District is Not a Discharger i) Very Limited Sewer Records When Dry Cleaners Operated (page 12, Section
VI, second paragraph): The Staff Report asserts that the sewer lines in the Gregory Village area are in “good condition.” However, there is no basis for such a statement that can be relevant to the time when dry cleaner wastewater discharges were occurring from Sites 1 and 2 because the CCCSD has extremely little information concerning the condition of the sewers or how well they were operated and maintained prior to the mid-1990s, which is a data gap of nearly 50 years from the time the sewers were constructed (Exhibit 5). Given the period of dry cleaner operations at the P&K Cleaners Site (approximately 1964 to 1991) and at the Chevron Site (approximately 1956 to 1986), the claims made by CCCSD regarding the conditions of the sewers since the mid-1990s are irrelevant. (See B. Dickson Declaration - Exhibit D to Firestone letter to Bruce Wolfe, dated 4 August 2014.)
ii) Evidence of Pollutant Releases and Contributions to Plumes from Sewer Leaks (page 12, Section VI, fifth paragraph extending to top of page 13): The Staff Report states that there is no direct evidence that leaking sewer lines caused or contributed significantly to groundwater contamination. That is not a true statement. On the contrary, there is abundant evidence that such contamination has occurred and the CCCSD should be required to investigate its contributions to pollutant plumes. Evidence shows that a) under its regulations, CCCSD accepted PCE in its system with a temporal, rather than a concentration limit to the discharge, b) both dry cleaner operations discharged to sanitary sewer lines, and c) local CCCSD sewers had cracks, sags, root intrusions, and joints at which leaks undoubtedly occurred. Further, it is clear

8
that the local sewer lines were constructed near, at or below the groundwater table (Exhibit 6). Thus, it is no surprise that soil vapor concentrations have been found to increase with sampling depths nearer to the groundwater table.
iii) Evidence of Pollutant Releases and Contributions to Plumes from Sewer
Leaks (page 13, Section VI, at top of page): Investigation results to date provide evidence of leaks of PCE from sewer lines, with particular attention to the evidence near Manhole M46, the intersection of Shirley Drive and Cynthia Drive, and in Linda Drive (Exhibit 5). As pointed out in the Staff Report (page 4, regarding Groundwater Data), “high groundwater concentrations generally reflect a specific release point/area”, and such is the case at manhole M46 where the highest off-site concentration of PCE in groundwater was detected at nearly 2,000 ug/L. Thus, it is inconsistent for Staff to state that high concentrations reflect releases / sources on Sites 1 and 2 but not at the “single data set” at manhole M46, for example (Staff Report at top of page 14).
iv) Evidence of Pollutant Releases and Contributions to Plumes from Sewer
Leaks (page 13, Section VI, at top of page) : The technical evidence in all available groundwater sampling data and multiple depth soil vapor sampling data shows that there are two contributors to the CVOCs detected in the groundwater and soil vapor plumes in the northern neighborhood area: a) migration of CVOCs in shallow groundwater and b) sewer leaks. In all of our collective past experiences with similar plume conditions at sites overseen by the RWQCB, there is sufficient evidence to name all three parties as dischargers and to task them with the joint responsibility of investigating, remediating, and sharing liability for pollutant plume conditions.
d) Report Section VI.1, No Evidence that the Sewer System Contributed to the
Groundwater Plume i) Assertion That Sewers Are In Good Condition Is Not Supported by CCCSD’s
Records (page 13, Section VI.1, second paragraph): The Staff assertion that the sewer lines have been well maintained and were, by inference, in generally good condition – in the past – is unsupported by CCCSD records because there are no or sparse records regarding sewer maintenance or conditions over a nearly a 30-year period during which dry cleaning operations resulted in wastewater discharges to the sewers. More to the point, the reason the sewers needed to be in “maintained” is that they have been found to have cracks, sags, root intrusions, and joints that leak. Further, these sewers in the 1940s and 1950s were designed and constructed with a tolerance for leaks (Exhibit

9
5) even before there were cracks or root penetrations. See the Dickson Declaration in Exhibit D to Firestone letter to Bruce Wolfe, dated 4 August 2014.
ii) Modeling Does Not Confirm the Source of Contaminants in Groundwater (page 13, Section VI.1, third paragraph): The Staff Report states that the transport modeling conducted by PES Environmental, Inc. on behalf of the CCCSD “adequately demonstrates that the levels and locations of contamination in the environment resulted from the releases of CVOCs directly from past dry cleaning operations and automotive repair businesses, including releases from private sewers laterals, but not directly from the sewage conveyance system owned and operated by the CCCSD.”
This conclusion is an over reach. PES used a relatively simple analytical tool that made broad assumptions regarding general soil properties and that does not preclude other possible and more likely explanations for the presence of PCE in groundwater in the northern neighborhood. The calculations by PES were simple groundwater velocity and retarded pollutant migration velocity estimates calculated assuming uniform soil properties and other generalized hydrologic parameters, i.e., a simple plume velocity under these simplified assumptions. Such calculations are typically highly uncertain and are thus capable of only stating in broad ranges information concerning pollutant releases. For example, such assumptions and calculations produce such a broad range of results as to provide vague or meaningless conclusions: e.g., that the pollutant releases happened 5 to 50 years ago or that the plume migrated 100 to 1000 feet in some assumed period. This calculation does nothing to refute that sewer leaks contributed additional amounts of CVOCs to the plume, e.g., the elevated 2,000 ug/L of PCE found near manhole M46. Thus, the explanations for the CVOCs found in shallow groundwater in the northern neighborhood, i.e., that detected concentrations resulted from both 1) leaks of CVOCs from the CCCSD’s sewers and 2) the migration of CVOCs from the releases from sites that that had dry cleaning operations and automotive repair businesses, is completely consistent with PES’ calculations. The following comments elaborate on the limitations to this “modeling” approach:
(1) PES’s “fate and transport modeling” is actually only a back-of-the-
envelope type calculation using an over simplification of Site hydrogeology and stratigraphy that does not reflect the well-documented geologic complexity found at the Site. Actual site data, however, indicate

10
a significantly heterogeneous subsurface, both vertically and horizontally, with bedded sands, silts and clays that are laterally and vertically complex.
(2) PES calculates a Darcy-equation analytical seepage velocity that treats the entire subsurface from south of Doris Drive to north of Luella Drive as a uniform fine sand. These calculations assume an ideal homogeneous and isotropic porous media and, based on several assumptions and generalizations, provide an average transport velocity for the "center of mass" of an assumed “slug” of dissolved-phase PCE moving in groundwater.
(3) PES calculation appears to assume a slug of dissolved-phase PCE in
groundwater noting a “peak concentration” (a rise, followed by decline) moving past monitoring well MW-8 in approximately 2007 or 2008. The PES figure titled “MW-8 VOC/MTBE Concentrations and Groundwater Elevations” is a logarithmic concentration-versus-time plot over the short period of October 2006 to late 2012 of the aqueous concentrations in monitoring well MW-8 of several chemicals in groundwater more than a decade after both dry cleaning operations ceased. PES interprets these limited data to show “the PCE center of mass migrating through it [the well location] in the 2007-2008 timeframe”. However, the actual time series plot referenced does not support PES’ interpretation, rather it shows a general decline of detected PCE concentrations over the graphed time span. The data are consistent with natural attenuation of dissolved PCE in the groundwater, not a slug of PCE passing through well MW-8.
iii) CVOC Release from Sewers At or Near Manhole M46 (page 13, Section VI.1, second bullet): GVP believes that the available data for the manhole M46 area are sufficient for the RWQCB to require the CCCSD to investigate contributions of CVOCs leaked from sewers to the pollutant plume in this area. (1) The Staff Report points out that the soil gas concentrations near manhole
M46 are higher near the water table than at shallow depths and concludes that CVOCs in soil vapor in this area originated from groundwater. However, CVOCs leaked from the sewer to groundwater at or near this location because the sewer and bottom of manhole M46 are located at or below the groundwater table in this area (Exhibits 6 and 7). Leakage of wastewater containing CVOCs from the sewer system in this area would contribute directly to the detected, elevated pollutant concentrations in shallow groundwater and, therefore, the measured CVOC soil vapors are,

11
at least, in part a consequence of sewer leaks. The potential for CVOCs from a sewer leak entering the groundwater in this area is particularly plausible because wastewaters from both dry cleaners at Site 1 and Site 2 drain directly to manhole M46 (Exhibits 1, 2 and 8).
(2) The Staff concludes that the concentrations of CVOCs in groundwater near manhole M46 are from plumes that have migrated from the P&K Cleaner Site and Chevron Site, dismissing the potential for a separate additional release from the sewer system near manhole M46. As described in prior submittals to the RWQCB (EKI’s Off-Site Property Specific Soil Vapor and Sub-Slab Vapor Investigation Report, dated 19 January 2011 and Exhibit 5), there is a general separation in the specific areas of higher CVOC concentrations in groundwater and soil vapor between the manhole M46 vicinity and upgradient source locations. This separation is evident based on both groundwater data (Exhibit 2) and soil vapor data (Exhibit 8) that is evidence of a separate release / contribution of CVOCs to groundwater and soil vapor near M46.
(3) Regarding the presence of CVOCs detected at the parcels in soil vapor and groundwater between manholes M44 and M46, the Staff Report should also acknowledge migration of CVOCs in soil vapor through sewer pipes and in groundwater from the vicinity of manhole M46 through more permeable backfill associated with the sewer pipe between the two manholes, and hence to downgradient areas under residences.
iv) CVOC Release from Sewers Near the Intersection of Shirley Drive and
Cynthia Drive (page 13, Section VI.1, first bullet): As previously reported to the RWQCB, investigations in the vicinity of this intersection provide evidence of a release from sewers in this area (EKI’s Off-Site Property Specific Soil Vapor and Sub-Slab Vapor Investigation Report, dated 19 January 2011 and Exhibit 5).
(1) The CCCSD should investigate the occurrence of CVOC releases or
migration along permeable backfill material along the sewer, which is nearly flat in this area of Shirley Drive.
(2) The leakage of wastewater containing CVOCs from sewers and the
migration of CVOC vapors from sewers is supported by the results of a multi-depth vapor sampling investigation conducted in several locations by GVP. For example, as illustrated on Exhibit 9, soil vapor samples taken on Cynthia Drive in a line perpendicular to the sewer line

12
demonstrate that the locations of highest vapor concentration are closest to the sewer with diminishing concentrations moving away from the sewer. If the source of the CVOC vapors were only a plume in the groundwater, equivalent CVOC levels would be detected horizontally above the groundwater across the plume. Here, however, the data correlates to a release in the middle of Cynthia Drive and the sewer line located in the middle of Cynthia Drive.
v) CVOC Release from Sewers in Linda Drive (page 14, Section VI.1, third
bullet): A CCCSD record from 1977 describes the sanitary sewer in Linda Drive as in “very poor shape has lots of cracks” (Exhibit 5 (see Exhibit 23 to that letter)). The dry cleaner and Chevron, both at Site 2, used this sewer line to discharge their waste. The Chevron Site is a site known to have high concentrations of CVOCs in soil, soil vapor, and groundwater due to releases from dry cleaner and auto repair operations, as well as elevated concentrations of PCE and TCE on the far western side of Linda Drive as early as 1988. Groundwater at former monitoring well EA-3 located on the western side of Linda Drive near the sewer, and cross gradient from Site 2, was found to have the highest PCE concentration (5,000 ug/L) of all groundwater samples collected for the early investigations of the Chevron Site (Exhibit 10). The proximity of location EA-3 to the sewer and on the opposite side of the street is evidence that that the sewer leaked waste containing CVOCs. The potential for releases for a sewer line described as having many cracks appears high, and such releases should be investigated by CCCSD and the parties responsible for the Chevron Site. The Staff Report notes the need for investigation of CVOCs in and downgradient of Linda Drive, but the Order for Site 2 fails to specify any such required investigations nor is there any current requirement for CCCSD to do so.
e) Report Section VI.2, No Evidence of the Sewer Operator’s Knowledge that the
Sewer System is Leaking or Needs Repair i) There is Evidence of Sewer leaks Despite Sparse CCCSD Records (page 14,
Section VI.2): The Staff Report states that CCCSD asserts it has no knowledge that its sanitary sewer system leaked significantly in the past. First, with respect to CVOCs, small leaks can create high concentrations of CVOCs in groundwater and extensive plumes. The use of the word “significantly” thus must be called into question. Second, the only arguable evidence to support for this supposed “lack of knowledge” is the lack of records describing the sewer conditions for a period of approximately 50 years, i.e., spanning the years when both dry cleaners discharged wastewater

13
to this sewer system as noted above. Where CCCSD records are available, there are several instances where cracks, sags, root intrusions, and/or potentially leaky joints have been reported, with some repaired many years after discovery. Gregory Village has provided the RWQCB staff with information that describes several potential sewer leaks that CCCSD should be required to investigate (Exhibit 5 and Firestone letter dated 18 December 2012).
ii) There is Evidence of Sewer leaks Despite Sparse CCCSD Records (page 14, Section VI.2): Again, the CCCSD qualification that its knowledge regarding ”significant” leaks apparently dismisses leaks it considers insignificant. Given the very low concentration thresholds for CVOCs allowed by the tentative Orders (i.e., drinking water standards and the RWQCB’s Environmental Screening Levels), all leaks are potentially significant. The Staff Report points out that there are “many instances were minor leaks in the sewer mains were detected and repaired.” It should be noted that not all minor leaks were repaired – tree roots were cleared but the penetration was not repaired. In addition, any repairs would have been made after the leaking condition was discovered, and based on CCCSD records since the mid-1990s, there typically was an interval of a number of years between inspections.
iii) Lack of Records Does Not Establish That There Were No Leaks (page 15, item
V.2): The Staff Report appears to ignore the significance of the lack of CCCSD records prior to the mid-1990s. The Staff Report responds to two instances that GVP identified as illustrating the poor condition of the sewers (Exhibit 5). As noted in the Izzo Report, sunken or low spots in sewers are locations where PCE leaks from sewer pipes. Instance 1, a sunken spot in the sewer in Shirley Drive at Luella Drive, was repaired in 2003, even though a CCCSD inspection noted the problem in 1994. It thus could have been leaking at that location for more than 9 years! Surprisingly, the Staff Report says this instance suggests reasonable sewer maintenance. Instance 2 is the sewer in Linda Drive next to Chevron site that had many cracks in 1977 as mentioned above. The Staff Report states that the Linda Drive location needs to be investigated, but the RWQCB does not specifically require Chevron or CCCSD to do it.
f) Clarifications and Corrections
i) Groundwater Data (page 4, second paragraph): The January 1989
concentrations of PCE and TCE in groundwater at monitoring well EA-2 were 1,700 micrograms per liter (“ug/L”) and 2,900 ug/L, respectively. At the

14
same time, monitoring well EA-3 located in Linda Drive was sampled and had PCE and TCE in groundwater at 5,000 ug/L and 750 ug/L, respectively.

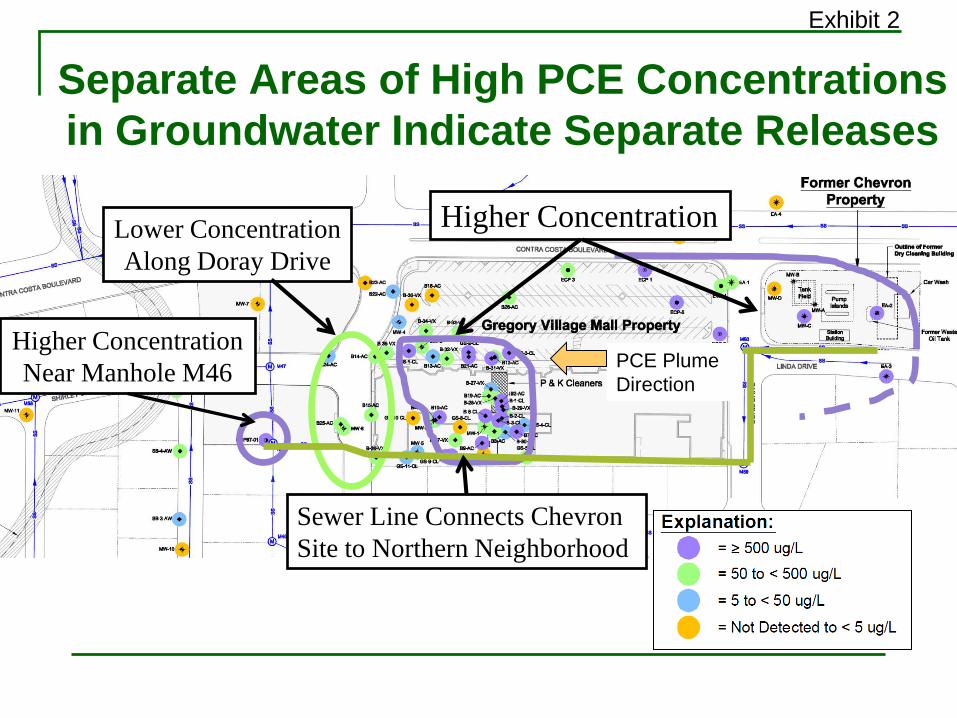
Exhibit 2
Separate Areas of High PCE Concentrations in Groundwater Indicate Separate Releases
Lower Concentration Along Doray Drive
Higher Concentration Near Manhole M46
Higher Concentration
PCE Plume Direction
Sewer Line Connects Chevron Site to Northern Neighborhood

TABLE 2
SOIL ANALYTICAL DATACHEVRON SERVICE STATION 968171705 CONTRA COSTA BOULEVARD
PLEASANT HILL, CALIFORNIA
Page 4 of 19
HYDROCARBONS PAHS
Location Date Depth TP
H-G
RO
B T E m&
p-X
ylen
es
o-X
ylen
e
MT
BE
by
SW82
60
TB
A
DIP
E
ET
BE
TA
ME
ED
B
1,1-
DC
E
1,2-
DC
A
CH
B
CF
C-1
,2-D
CE
PC
E
T-1
,2-D
CE
TC
E
VC
Nap
htha
lene
Units ft mg/kg mg/kg mg/kg mg/kg mg/kg mg/kg mg/kg mg/kg mg/kg mg/kg mg/kg mg/kg mg/kg mg/kg mg/kg mg/kg mg/kg mg/kg mg/kg mg/kg mg/kg mg/kg
PRIMARY VOCS ADDITIONAL VOCS
CPT-13 12/20/2011 9.5 <1 <0.0005 <0.001 <0.001 <0.001 <0.001 0.0005 <0.020 <0.001 <0.001 <0.001 <0.001 <0.001 <0.001 <0.001 <0.001 0.18 0.34 0.009 0.21 <0.001 <0.001
CPT-13 12/20/2011 20 <1 <0.0005 <0.001 <0.001 <0.001 <0.001 <0.0005 <0.019 <0.001 <0.001 <0.001 <0.001 <0.001 <0.001 <0.001 <0.001 0.004 <0.001 <0.001 0.002 <0.001 <0.001
CPT-13 12/20/2011 29.5 <1 <0.0005 <0.0009 <0.0009 <0.0009 <0.0009 <0.0005 <0.019 <0.0009 <0.0009 <0.0009 <0.0009 <0.0009 <0.0009 <0.0009 <0.0009 0.004 0.002 <0.0009 0.002 <0.0009 <0.0009
CPT-14 12/19/2011 10 7.5 <0.024 <0.048 <0.048 <0.048 <0.048 <0.024 <0.96 <0.048 <0.048 <0.048 <0.048 <0.048 <0.048 <0.048 <0.048 0.24 19 <0.048 0.27 <0.048 <0.048
CPT-14 12/19/2011 20 <1 <0.0005 <0.001 <0.001 <0.001 <0.001 <0.0005 <0.019 <0.001 <0.001 <0.001 <0.001 <0.001 <0.001 <0.001 <0.001 0.001 0.014 <0.001 <0.001 <0.001 <0.001
CPT-14 12/19/2011 34.5 6.2 <0.023 <0.047 <0.047 <0.047 <0.047 <0.023 <0.94 <0.047 <0.047 <0.047 <0.047 <0.047 <0.047 <0.047 <0.047 <0.047 20 <0.047 0.085 <0.047 <0.047
CPT-15 12/16/2011 10 44 <0.025 <0.050 <0.050 <0.050 <0.050 <0.025 <0.99 <0.050 <0.050 <0.050 <0.050 <0.050 <0.050 <0.050 <0.050 <0.050 <0.050 <0.050 <0.050 <0.050 0.090
CPT-15 12/16/2011 19.5 <10 <0.0005 <0.001 <0.001 <0.001 <0.001 <0.0005 <0.020 <0.001 <0.001 <0.001 <0.001 <0.001 <0.001 <0.001 <0.001 <0.001 <0.001 <0.001 <0.001 <0.001 <0.001
CPT-15 12/16/2011 34.5 <1 <0.0005 <0.001 <0.001 <0.001 <0.001 <0.0005 <0.020 <0.001 <0.001 <0.001 <0.001 <0.001 <0.001 <0.001 <0.001 0.002 0.009 <0.001 0.004 <0.001 <0.001
CPT-16 12/19/2011 12 390 0.23 <0.047 0.39 <0.047 <0.047 <0.024 <0.95 <0.047 <0.047 <0.047 <0.047 <0.047 <0.047 <0.047 <0.047 <0.047 0.46 <0.047 <0.047 <0.047 4.2
CPT-16 12/19/2011 20.5 <1 0.001 <0.0009 <0.0009 <0.0009 <0.0009 <0.0005 <0.019 <0.0009 <0.0009 <0.0009 <0.0009 <0.0009 <0.0009 <0.0009 <0.0009 <0.0009 0.069 <0.0009 0.005 <0.0009 <0.0009
CPT-16 12/19/2011 34.5 <0.9 <0.0005 <0.001 <0.001 <0.001 <0.001 <0.0005 <0.019 <0.001 <0.001 <0.001 <0.001 <0.001 <0.001 <0.001 <0.001 0.001 0.15 <0.001 0.042 <0.001 <0.001
CRA 311741 (4)

TABLE 4
SOIL VAPOR ANALYTICAL DATACHEVRON SERVICE STATION 968171705 CONTRA COSTA BOULEVARD
PLEASANT HILL, CALIFORNIA
Page 1 of 4
HYDROCARBONS
Location Date TP
H-G
RO
B T E m&
p-X
ylen
es
o-X
ylen
e
MT
BE
ED
B
1,1-
DC
E
1,2-
DC
A
CH
B
CF
C-1
,2-D
CE
PC
E
T-1
,2-D
CE
TC
E
VC
Nap
htha
lene
Eth
anol
1,1,
1-T
rich
loro
etha
ne
1,1,
2,2-
Tet
rach
loro
etha
ne
Units ug/m3 ug/m3 ug/m3 ug/m3 ug/m3 ug/m3 ug/m3 ug/m3 ug/m3 ug/m3 ug/m3 ug/m3 ug/m3 ug/m3 ug/m3 ug/m3 ug/m3 ug/m3 ug/m3 ug/m3 ug/m3
VP-1 12/13/2011 <420,000 <6,500 <7,700 <8,800 <8,800 <8,800 <7,300 <16,000 <8,100 <8,200 <9,400 <9,900 410,000 2,500,000 19,000 2,100,000 <5,200 <43,000 <15,000 <11,000 <14,000
VP-1-DUP 12/13/2011 <320,000 <5,000 <5,800 <6,700 <6,700 <6,700 <5,600 <12,000 <6,100 <6,300 <7,100 <7,600 350,000 2,200,000 10,000 1,900,000 <4,000 <32,000 <12,000 <8,400 <11,000
VP-2_5 12/13/2011 23,000 <2.7 7.0 <3.7 6.7 14 <3.1 <6.6 <3.4 <3.5 7.2 22 <3.4 <5.8 <3.4 <4.6 <2.2 <18 <6.5 <4.7 <5.9
VP-2_7.5 12/13/2011 20,000 4.9 33 4.0 5.9 24 <2.9 <6.2 <3.2 <3.2 25 31 <3.2 21 <3.2 16 <2.0 <17 <6.1 <4.4 <5.5
VP-3_5 12/13/2011 <1,200 <19 <23 <26 <26 <26 <22 <47 <24 <25 <28 <30 <24 14,000 <24 850 <16 <130 <46 <33 <42
VP-3_7.5 12/13/2011 <4,200 <66 <78 <89 <89 <89 <74 <160 <82 <83 <95 <100 <82 53,000 <82 2,200 <53 <430 <160 <110 <140
PRIMARY VOCS VOCS
CRA 311741 (4)

Note: Except at the Chevron compliance point (existing well EA-5), the color dots are one time grab sample locations or wells that have been destroyed by Chevron.
Exhibit 4
Chevron Compliance Point and Only Well is NOT in the Chevron Plume
Former Chevron Property
EA-5 (5/25/10) PCE 3 TCE 12
C-DCE 5 T-DCE 1
VC <1 MTBE 1
Chevron compliance point


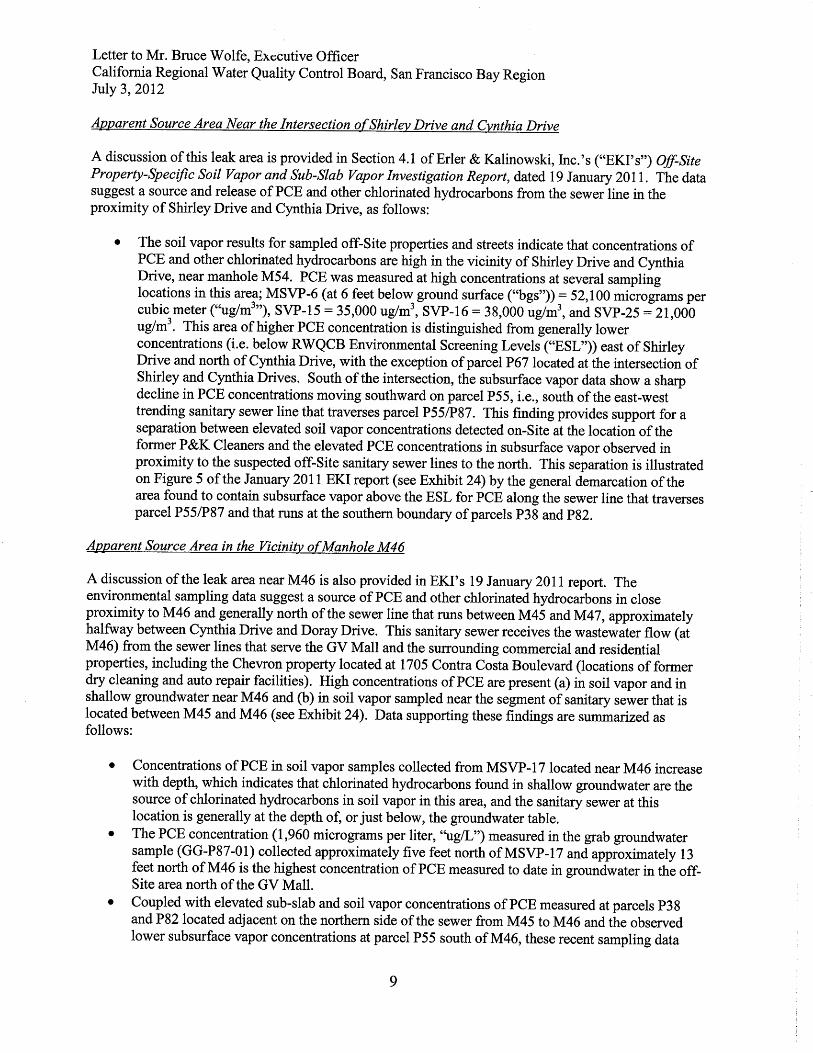

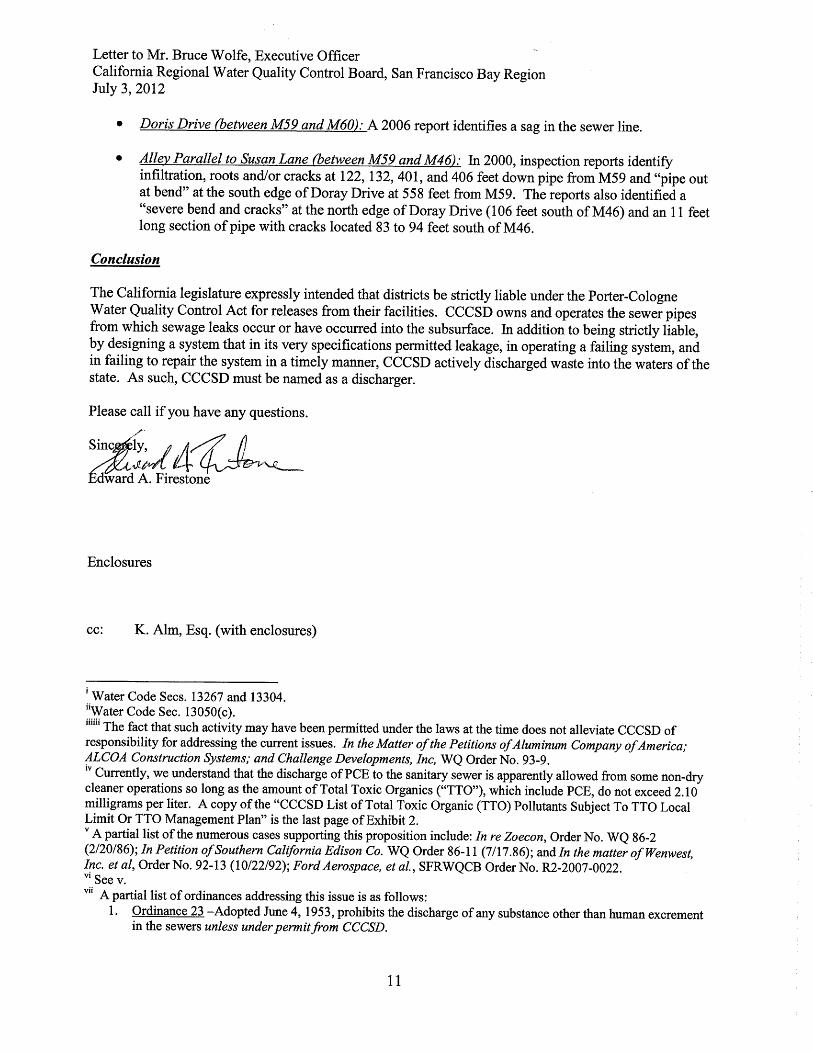


Exhibit 6
CCCSD’s Sanitary Sewer is Installed Near or Below the Water Table
Northern Off-Site Residential Area
Gregory Village Mall Property
Doray Dr. Cynthia Dr. Doris Dr.
coarser-grained finer-grained
A (North)
A’ (South)
Former Chevron Property
Luella Dr.
General Direction of Groundwater Flow
MH46
Blue lines are the water table range
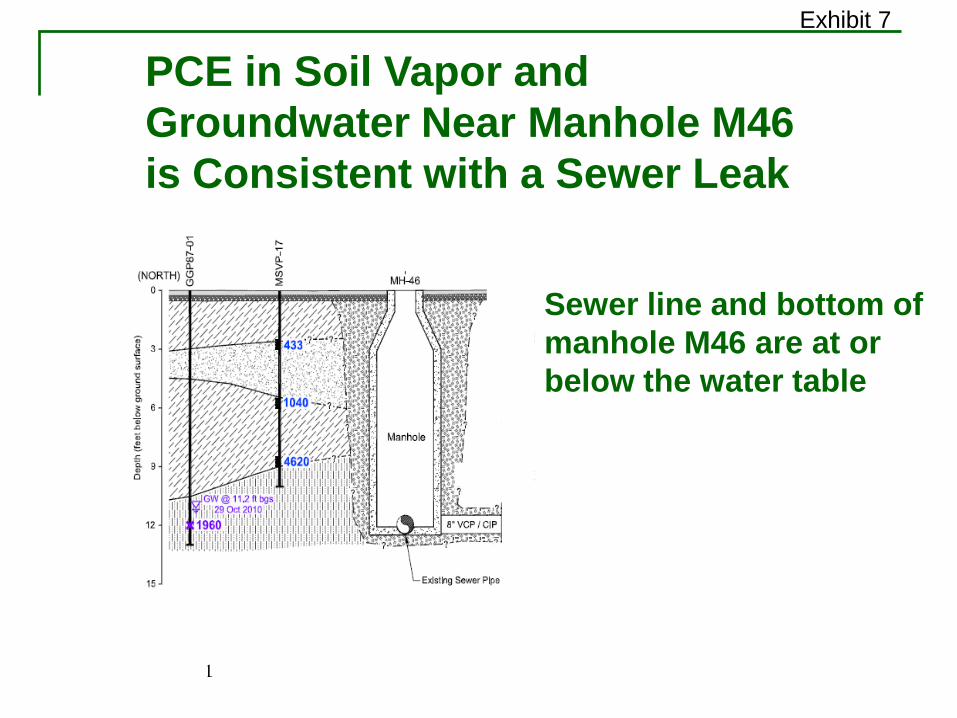
1 17 February 2011
Approx 100 ft Ssss Sewer line and bottom of manhole M46 are at or below the water table
PCE in Soil Vapor and Groundwater Near Manhole M46 is Consistent with a Sewer Leak
Exhibit 7

Exhibit 8 Separate Areas of High PCE Concentrations in
Soil Vapor Indicate Separate Releases
Higher Concentrations
Lower Concentrations
Higher Concentrations
Sewer Line Connects Chevron Site to Northern Neighborhood Locations of MSVP-14,
MSVP-15, MSVP-16 and SVP-26 on Exhibit 9

Exhibit 9
CVOC Concentrations In Soil Vapor are Highest Near the Sewer
Cynthia Dr. SVP-26
17 February 2011
Highest CVOC Concentrations are Near the Sewer
MSVP-14 MSVP-15 MSVP-16
CVOC Concentration Decreases with
Distance from Sewer Sewer

Exhibit 10
17 February 2011
PCE in Groundwater in Linda Drive Cross-Gradient from Chevron Site Indicative of a Sewer Leak
Background image is from Report of Investigation, Soil Vapor Contaminant Assessment, Chevron SS 9-6817, 1705 Contra Costa Boulevard, Pleasant Hill, California, prepared for Chevron U.S.A, Inc., by EA Engineering, Science, and Technology, Inc., dated 9 August 1989.
Gregory Village Mall Property
CONTRA COSTA BLVD.
LINDA DRIVE
EA-2 Max. PCE: 4,000 ug/L
Msewer lateral?
EA-3 Max. PCE: 5,000 ug/L
MW-C Max. PCE: 1,800 ug/L