ee overview - 22nd sept 2014 final (3) -...
TRANSCRIPT

CEEOverview, Context & Key Trends09/23/2014

External Presentation: OutlineOutline: Outline
Review
« What’s happened/changed since last year?
« Investment context – if you had spent €500,000 in CEE…..
Looking Ahead: Driving Factors
« Macro-Econ & Market Summary
« Capital Value Indices – room for growth?
« Longer-term: structural shifts - logistic bananas, e-tailing, outsourcing, quality offices

September 2013: Summary
3
« Russia/Ukraine situation…..has changed things.
« Outside of the UK, Eurozone growth is ‘very patchy’
Bank finance conditions gradually improving, slowly spreading to the periphery
Lack of capital market depth – dependence on international investment
Office market trends better than headlines suggest – rents stabilised + growth capacity
Some pockets of retail yet to be tapped into, but challenging for non-dominant centres
Industrial/logistics market has very strong growth potential, esp in CE4 core and Russia
Long-term investment horizon very positive
Short-mid term also positive: capital values below peak/par, compared to Germany
Perception of non-core markets an ongoing concern – some justified, some not.
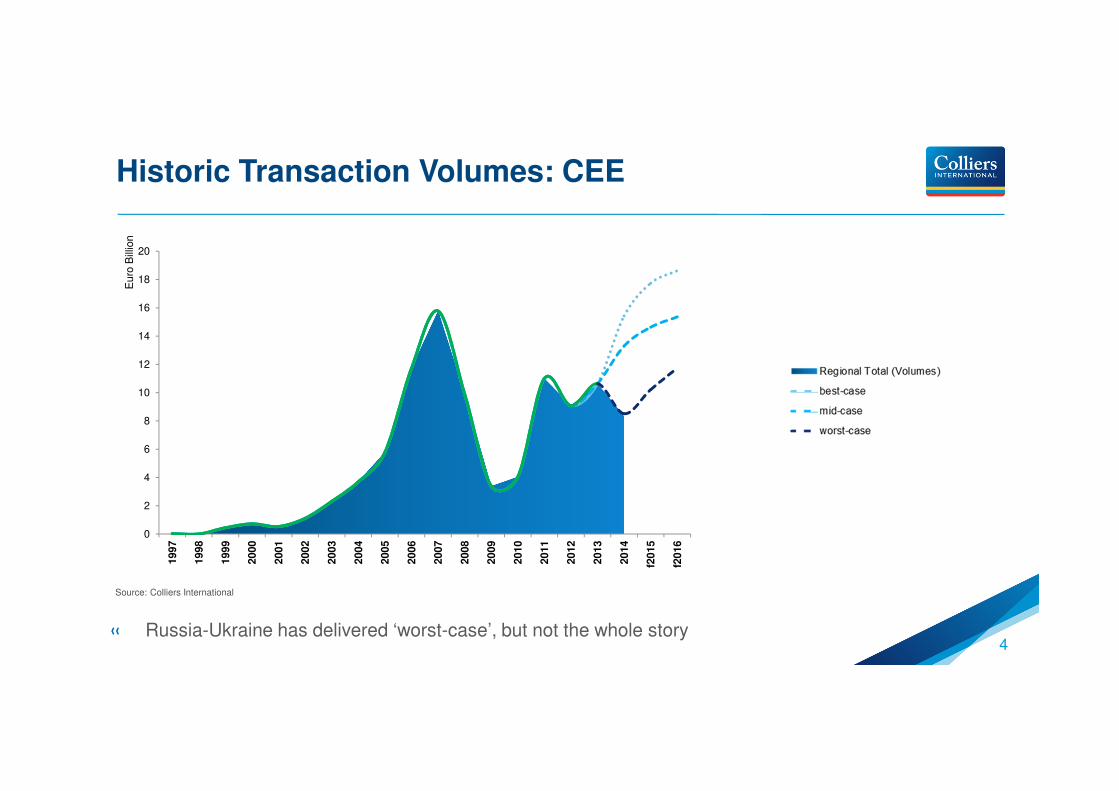
Historic Transaction Volumes: CEE
4
0
2
4
6
8
10
12
14
16
18
20
1997
1998
1999
2000
2001
2002
2003
2004
2005
2006
2007
2008
2009
2010
2011
2012
2013
2014
f2015
f2016
Euro
Bill
ion
« Russia-Ukraine has delivered ‘worst-case’, but not the whole story
Source: Colliers International
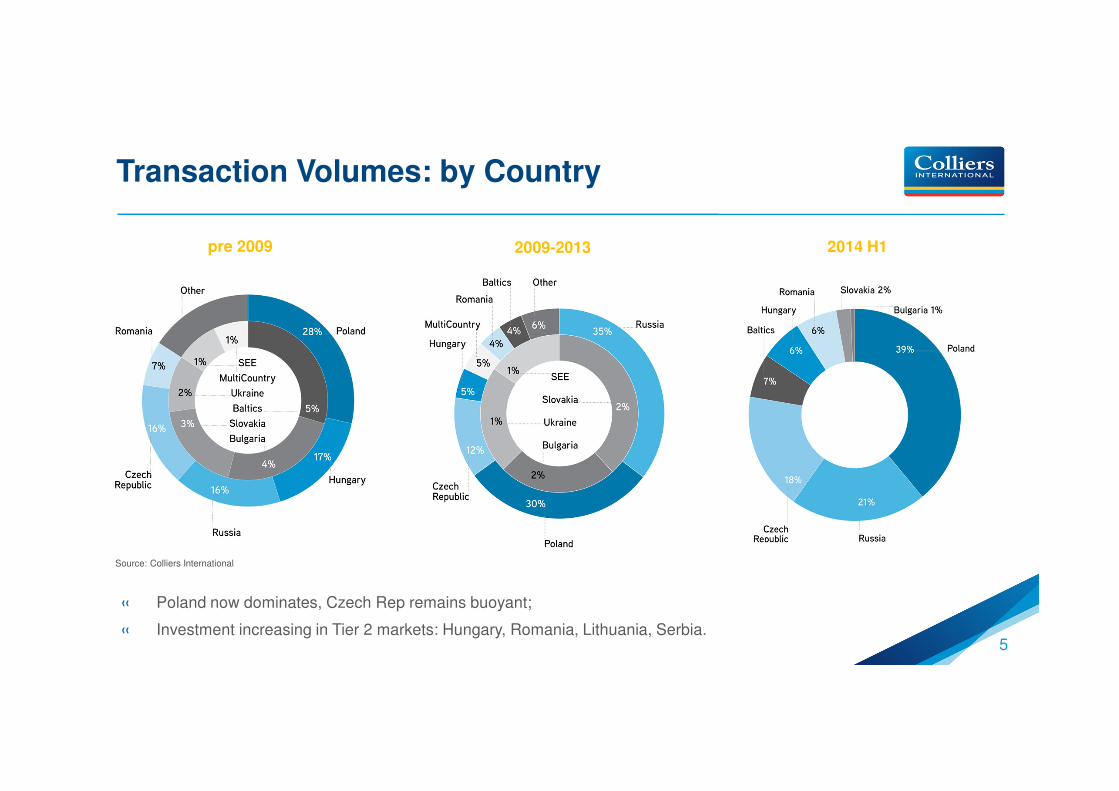
Transaction Volumes: by Country
5
« Poland now dominates, Czech Rep remains buoyant;
« Investment increasing in Tier 2 markets: Hungary, Romania, Lithuania, Serbia.
2014 H1pre 2009 2009-2013
Source: Colliers International
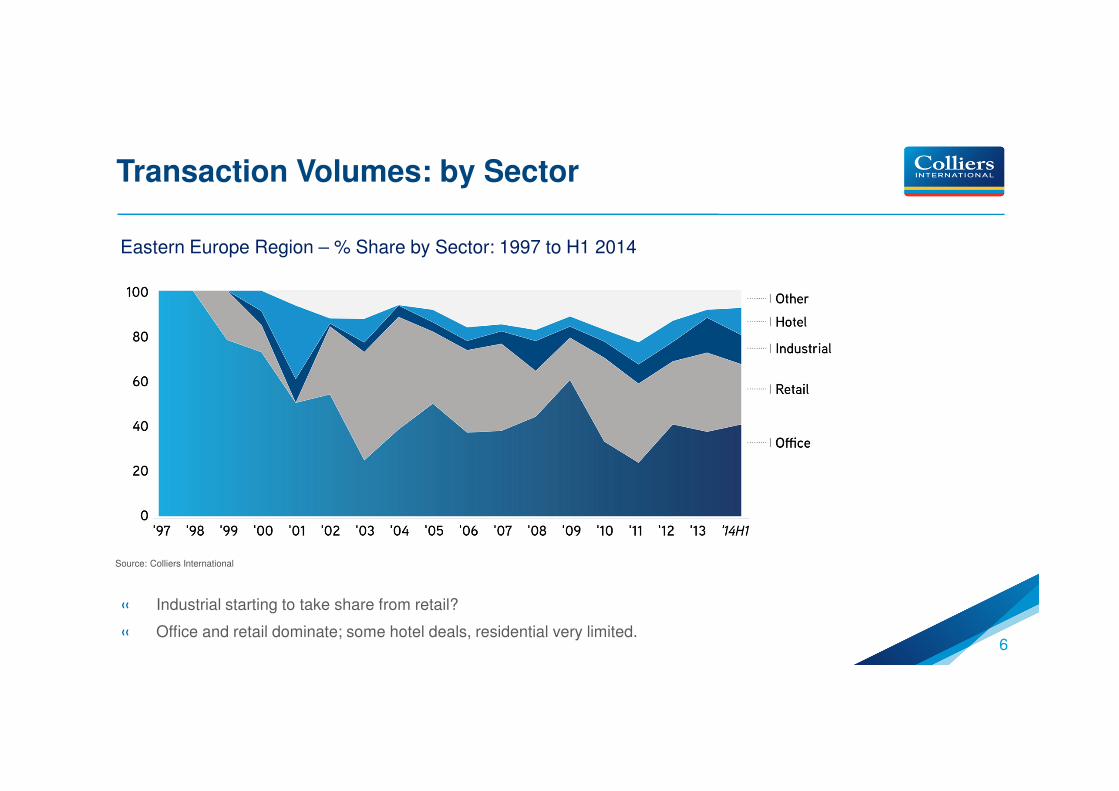
Transaction Volumes: by Sector
6
« Industrial starting to take share from retail?
« Office and retail dominate; some hotel deals, residential very limited.
Eastern Europe Region – % Share by Sector: 1997 to H1 2014
Source: Colliers International
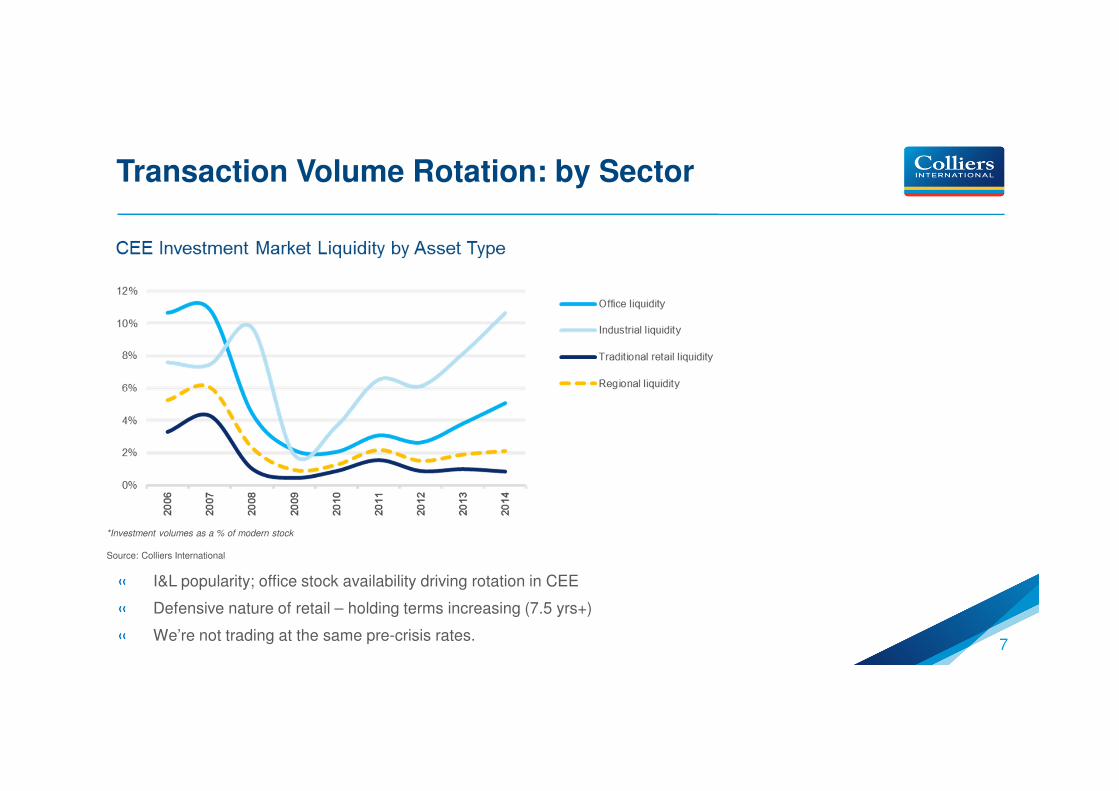
Transaction Volume Rotation: by Sector
7
« I&L popularity; office stock availability driving rotation in CEE
« Defensive nature of retail – holding terms increasing (7.5 yrs+)
« We’re not trading at the same pre-crisis rates.
*Investment volumes as a % of modern stock
Source: Colliers International
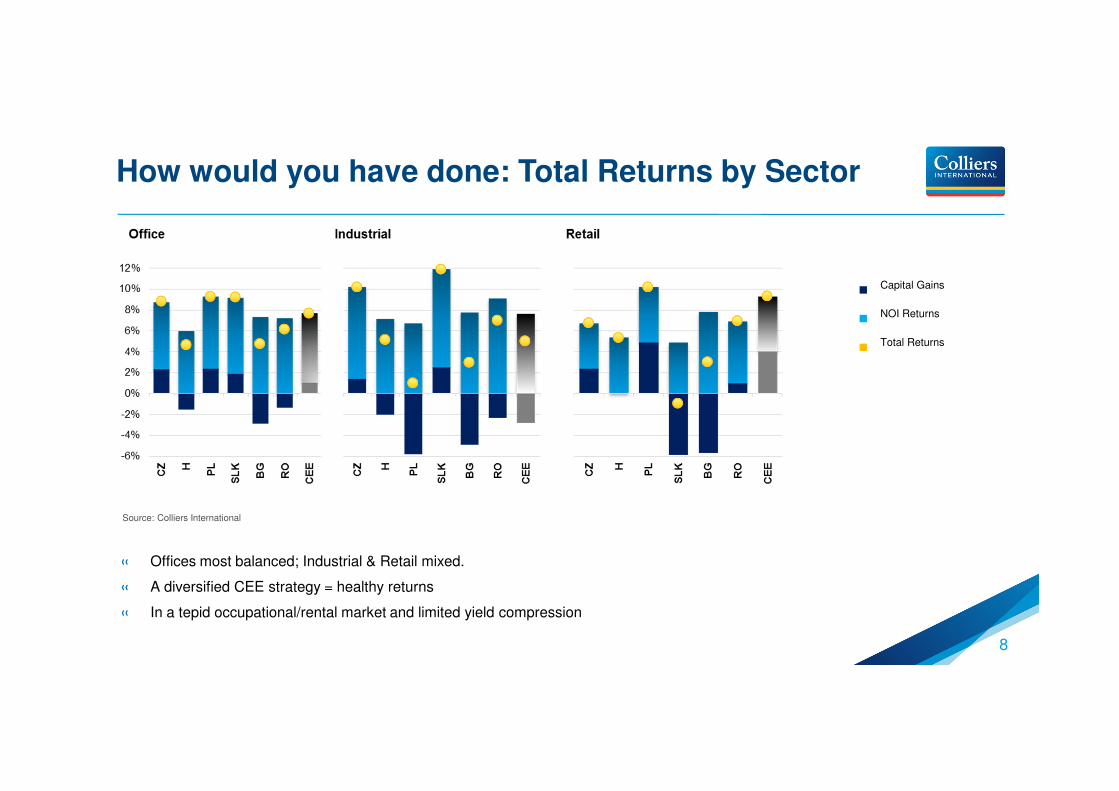
How would you have done: Total Returns by Sector
8
« Offices most balanced; Industrial & Retail mixed.
« A diversified CEE strategy = healthy returns
« In a tepid occupational/rental market and limited yield compression
■Capital Gains
■NOI Returns
■Total Returns
Source: Colliers International

How would you have done: by Country?
9
■ Capital Gains
■ NOI Returns
■ Total Returns
« Poland would have been the best country, retail
the best sector
« Czech the best risk-adjusted returns, vs govnt.
Bonds
« Romania, Slovakia and Hungary, followed by
Bulgaria
« CEE weighted allocation (oriented to core) =
equally positive
■ Country 10 year bonds
■ CRE Premia
-6%
-4%
-2%
0%
2%
4%
6%
8%
10%
12%
-6%
-4%
-2%
0%
2%
4%
6%
8%
10%
12%
PL
CE
E
CZ
RO
SL
K
H BG
Source: Colliers International

-15%
-10%
-5%
0%
5%
10%
15%
CE
E
Germ
an
y
Ho
llan
d
Sp
ain
Med
ian
Office
CE
E
Germ
an
y
Ho
llan
d
Sp
ain
Med
ian
Industrial
CE
E
Germ
an
y
Ho
llan
d
Sp
ain
Med
ian
Traditional Retail
How would you have done: CEE vs Europe?
10
« CEE matches Germany, Holland and Spain
« Office & retail best performing sectors.
« CEE industrial NOI comparable with other markets.
■Capital Gains
■NOI Returns
■Total Returns
Source: Colliers International / IPD
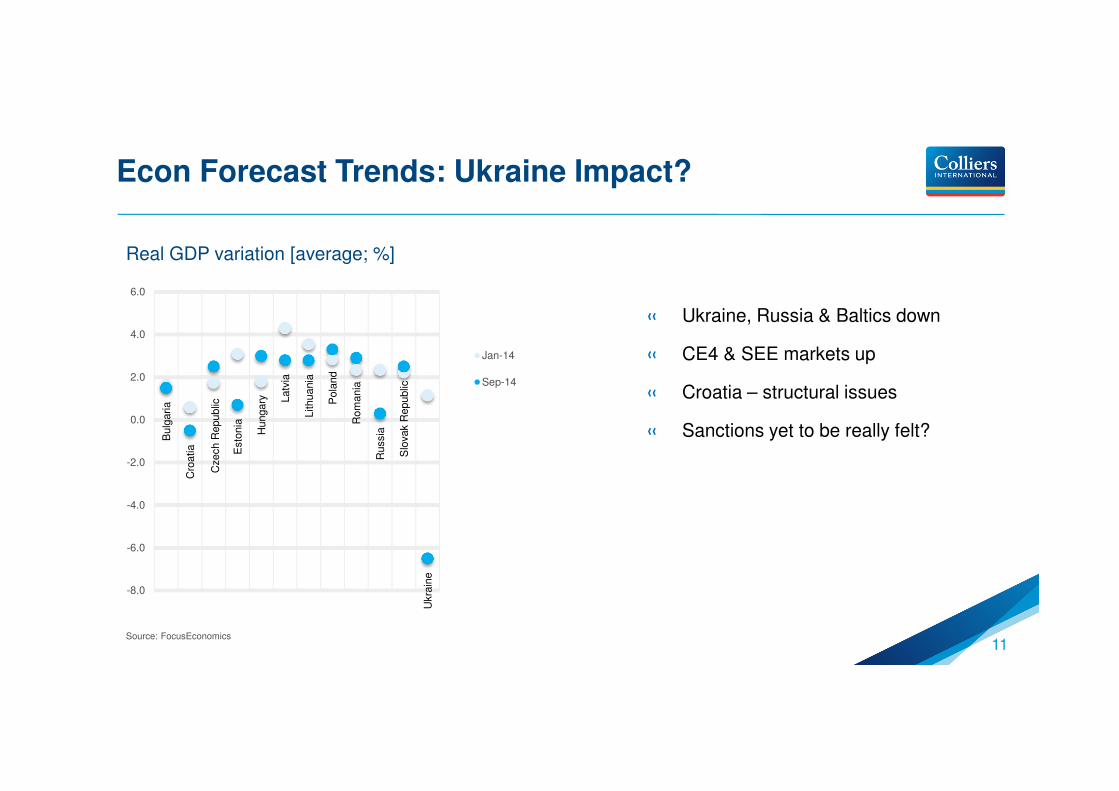
Econ Forecast Trends: Ukraine Impact?
11
« Ukraine, Russia & Baltics down
« CE4 & SEE markets up
« Croatia – structural issues
« Sanctions yet to be really felt?
Source: FocusEconomics
Bulg
aria
Cro
atia
Czech R
epublic
Esto
nia
Hungary L
atv
ia
Lithuania
Pola
nd
Rom
ania
Russia
Slo
vak R
epublic
Ukra
ine
-8.0
-6.0
-4.0
-2.0
0.0
2.0
4.0
6.0
Real GDP variation [average; %]
Jan-14
Sep-14

Country Summary: H1 2013 v H1 2014
12
H1 2013 H1 2014
Poor Neutral Good V. Good
• • • •

Market Summary
13
« Market activity likely to see yields compress
« Investment volumes likely to increase in 2014 and 2015
Russian/Ukraine impact localised to date – uncertainty a problem
Development/repositioning is needed – modernisation & investment flows
Clear increase in CRE investment demand elsewhere in the region
Fresh signs of economic (and political) recovery in CE4 and SEE
Investment driven by capital markets more than CRE fundamentals?
Prices/markets remain attractive relative to other ‘Eurozone Tier 2 markets’
Rents have declined/been flat post-crisis, still ‘buying off the bottom’