effect of aluminum on expansivity of mat&tiat · una npsarchive 1960 geiger,e....
TRANSCRIPT

una
NPS ARCHIVE1960GEIGER, E.
THE EFFECT OF ALUMINUM JC,,,,
ON THE CUBIC EXPANSIVITY OF >
COMPOSITE PLASTIC MAT&tiAt:
EUGENE DALE SEI&ER

LIBRARY
US *WiVAt POSTGRADUATE SCHOOLMONTEREY, CALIFORNIA


UNITED STATESNAVAL POSTGRADUATE SCHOOL
THESIS
THE EFFECT OF ALUMINUM ADDITIVE
ON THE CUBIC EXPANSIVITY
OF A COMPOSITE PLASTIC MATERIAL
K « -).<• « #
Eugene Dale Geiger
Lieutenant, U. S. Navy
12ND P2238 (1-59]m§

I
ON THE CUBIC EXPANSIVITY
OSITE PLASTIC MATE1
by
Eugene Dale GeigerII
Lieutenant, United States Navy
1
1! in partial fulfillment of
retirements for the degree of
MASTER OF SCI'
INI 5TRY
Unite I States Naval Postgraduate SchoolMonterey, California
I960

JO /
l
Thesis

22Dz < c?
I* 5
/b t> <tii: SJ 8
THE CUBIC
-
-
|
•
TJC ;
by
Le Geiger
This work is accepted as fulfilling
the thesis requirements for the degree of
FASTER OF SCIENCE
IN
CHEMISTRY
froiri the
United States Naval Postgraduate School


ABSTRACT
The need for a correlation between the amount of a substance
added to a composite plastic material and its effect on the
cubical coefficient of thermal expansion, or cubit expansivity,
of the composite mixture is discussed, experimental values for
the cubic expansivities of several composite plastics made from
a thermoplastic resin, an inert salt filler, and various per-
centages of aluminum are reported. Four hypothetical correla-
tions are tested, two of which are reported to give calculated
values within 1% of those observed. Apparatus and procedures
for obtaining these results are also described in detail
„
The writer wishes to express his appreciation for the
assistance and encouragement given him in this investigation by
Professor Kichard A. Keinhardt of the U. 5. wavai h'ostgraduate
Dchocl and by IvJrs. Mary M. Williams of the Research Department,
u. £>. Naval Ordnance Test Station, china Lake, California. The
writer wishes to express his appreciation for the loving
patience and assistance given him by his wife, /inn, throughout
this investigation and in the preparation of this work.
u


E OF C(
Section. Til
1. Introduction 1
2 . Theory 3
3 . Apparatus
1|. Preparation of Samples 13
5. Treatment of Data lit
6. Results 23
7. Discussion of Results 26
8
.
Bibliography 28
Appendix I - Casting and Conditioning Procedure 30
Appendix II - Operating Instructions 32
in

LIST OF ILLUSTRATIONS
Figure Page
1
.
Dilatometer 7
2. Dilatometer Assembly 8
3. Variation of Capillary Cross- sectionalArea vs. Distance from Capillary Index 11
h . Fxpansion vs. Temperature for TypicalTest Samples 21
IV


LIST OF TABLES
Table Pago
1
.
Run Data for 100^ resin sample 16
2. Run Data for $0% resin and <0% K2S0j sanple 17
3. Run Data for 10.0$ aluminum sample Lfi
li. Run Data for 11.1$ aluminum sample 19
3'. Run Data for 20.0$ aluminum sample 20


TABLE OF STFiBOLS
Symbols:
a Cubical expansivity, cm-ycrri3- C
a (rnix) Cubical expansivity of a mixture
b An expansivity parameter of a mixture componentdependent on its bulk compression modulus and its
density
c Linear expansivity, cm/cm-°C
n Weight % of a component in a mixture
T Temperature in degrees Centigrade, °C
V Volume , citk
V Initial volume of specimen bulb
AT Temperature difference
AV Net volume change which includes the combinedexpansions of mercury, sample and glassware
Subscripts:
X% x weight percent of aluminum in the sample
g glassware
m mercury
s sample
VI


1. Introduction
in the plastics industry some years ago, great difficulty was
obtained in attempting to cement a panel of an aluminum alloy to a
phenolic laminate. The phenolic plastic expanded just about twice
as much as the aluminum did. This difference was enough to cause
the panels to fall off by themselves almost universally when heated
and cooled over a significant temperature range. However, by
judicious choice of the amounts of filler to be added to the
phenolic, the expansion of the phenolic was reduced in half almost
to match that cf aluminum. The aluminum panel then adhered con-
pletelj', and it could not be removed without tearing the metal, or
rupturing the phenolic core \1 j.
Propellants and explosives have physical characteristics very
similar to those of plastics. Indeed some solid propel! ants are
plastics themselves, such as polyurethanes, polyesters and otner
composite propellants. The coefficient of thermal expansion,
hereafter referred to as the expansivity, of a given propellant
could be as much as twenty times as great as that of its container.
Consider a 30-foot long rocket chamber made of mild steel. Over a
temperature range of only 25 °C Ui5' °Fj, the metal chamber would
change only 0.1 inch in length whereas the propellant inside it
would change more than 1.5 inches. If allowance were not made
for this large difference in expansion or contraction, then most
certainly large thermal strains would be caused within the propellant
grain which could cause mechanical failure of the grain and a
change in the geometrical configuration of the grain, either one
1

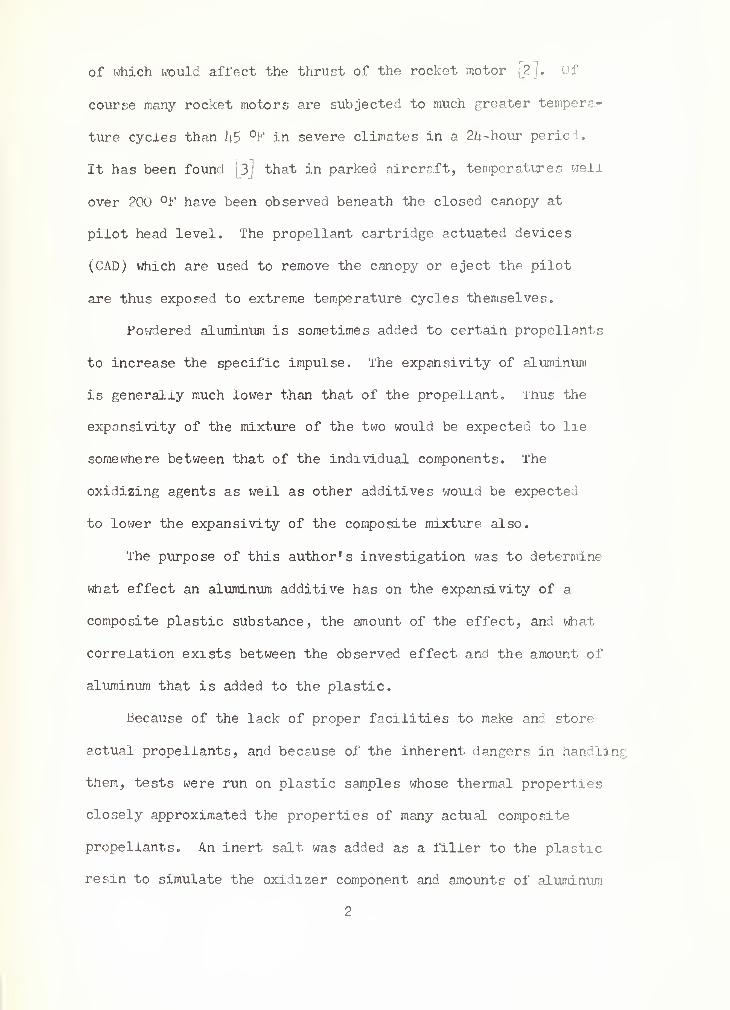
of which would afl'ect the thrust of the rocket motor {?]. Of
course many rocket motors are subjected to much greater tempera-
ture cycles than kS °F in severe climates in a 2Li-hour period
.
It has been found[_3J
that in parked aircraft, temperatures well
over 200 °F have been observed beneath the closed canopy at
pilot head level. The propellant cartridge actuated devices
(CAD) which are used to remove the canopy or eject the pilot
are thus exposed to extreme temperature cycles themselves.
Powdered aluminum is sometimes added to certain propellants
to increase the specific impulse. The expansivity of aluminum
is generally much lower than that of the propellant. Thus the
expansivity of the mixture of the two would be expected to lie
somewhere between that of the individual components. The
oxidizing agents as well as other additives would be expected
to lower the expansivity of the composite mixture also.
The purpose of this author's investigation was to determine
what effect an aluminum additive has on the expansivity of a
composite plastic substance, the amount of the effect, and what
correlation exists between the observed effect and the amount of
aluminum that is added to the plastic.
Because of the lack of proper facilities to make and store
actual propellants, and because of the inherent dangers in handling
them, tests were run on plastic samples whose thermal properties
closely approximated the properties of many actual composite
propellants. An inert salt was added as a filler to the plastic
resin to simulate the oxidizer component and amounts of aluminum
2


up to 20X> by weight were added to different samples as the
variable
.
2. Theory
The linear coefficient of thermal expansion, also referred to
as linear expansivity and designated by the letter "c", is the
ratio of the change in length per degree to the length measured
at the initial temperature. Thus c has the dimensions of
inch/inch-degree or cm/cm-degree. The linear expansivity is small
as shown here by a few examples \h}'
Material £
glass and ceramics 0.1 to 1.0x10⁻⁵ cm/cm°C
steel 1.2
brass 1.9
aluminum 2. a
organic thermoset plastics 2-5
wood:parallel to grain 0.2-0.6across the grain 2-6
organic thermoplastics 6-20
The final length (1^) of a steel rod initially of the lengtn
U ) 10.0000 cm long and raised 10°c in temperature would be,
lt- 1 U + CAT)
lt s U0) [ 1 t (1.2 x io-5)(io)J
= 10.0012 cm
The cubical coefficient of thermal expansion, or cubic expansi-
vity, a, is the ratio of the increase in volume per degree to the
3


original volume. For isotropic solid materials the cubic expansi-
vity equals three times the linear expansivity.
a = 3c
In anisotropic solid materials this is not the case, for the
material may expand different amounts in the three directions -
length, breadth, and width. As shown in the table above for woo1
.,
as an example, the expansivity in width or breadth is 10 times the
expansivity in length. An empirical equation for the cubic
expansivity might be,
a = c (.parallel; + 2 c (perpendicular;.
Very little is known about the relation between expansivity
and chemical composition15
J . ^ven less appears to be known
about the relation between expansivity and physical composition
in mixtures.
In the plastic cement field it has been shown [6 J that for
cements, the cubic expansivity, alm^x) j is related to the co-
efficients of the individual components ( a., an, . . .;, the
weight percent of each component ( n-., n2 , . . .; and a factor
( bj_, b 2 , . . .; which is a characteristic of each materials
a^ n±x) s ax nx bx 4 a2 n2 b2 + ..... .
nl ^1 * n21q2 + ••••••
The factor "b" for a material is proportional to the product of its
bulk compression modulus of elasticity, Mg, and its specific
volume, v,
b oc Ma v
or, since v = 1 = \
density,
b oc _S or b - (proportionality constant; ^b/O
h


The bulk modulus is known exactly for only a few materials%
however, the factor b may be regarded as an empirical constant
characteristic of each material. Thus in a two-component mixture,
with the factor b-> of one component known, the factor b^ of the
remaining component can be determined empirically. The empirically
obtained b^> and the known b-j_ can then be used in calculations
involving other mixtures.
The only explanation of why the factor b is based on tne bulk
compression modulus and the density of a component is an intuitive
one. Apparently adjoining particles of different expansivities in
a uniform mixture exert pressures on eacn other as they thermally
expand. Since the particles of one component may be more easily
compressed than particles of other components, they are not
allowed to contribute as much to the overall expansivity of tne
mixture as they would if all components had the same compressibility*
3. Apparatus
Various methods of determining the expansivity of materials were
considered, some of which are described elsewhere [5> 7> #, 9? and
10J
. A considerable amount of work was actually done by the author
on the linear expansivity of several different propellants and
explosives at the Naval Ordnance Test Station, China Lake, California
during a six-week tour of duty there in June -July 1959. In the
author's opinion, the apparatus used there b I was more accurate ana
much more convenient to use than the apparatus described in ASTM:
Test D 86i;-5^I 9
J
. The results obtained were assigned a security
r

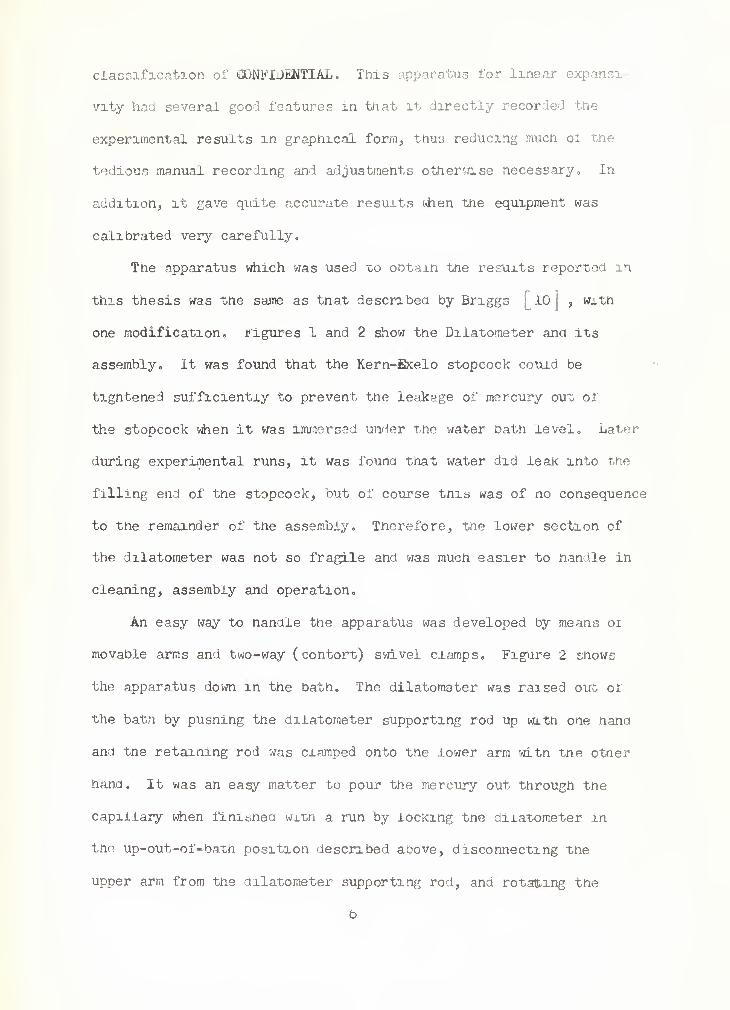
classification of CONFIDENTIAL. This apparatus for linear expansi-
vity had several good features in that it directly recorded the
experimental results in graphical form, thus reducing much or the
tedious manual recording and adjustments otherwise necessary. In
addition, it gave quite accurate results when the equipment was
calibrated very carefully.
The apparatus which was used to obtain the results reported in
this thesis was the same as that described by Briggs [lo] , with
one modification, .figures 1 and 2 show the Dilatometer ana its
assembly. It was found that the Kern-fixelo stopcock could be
tightened sufficiently to prevent the leakage of mercury out of
the stopcock when it was immersed under the water bath level. Later
during experimental runs, it was found that water did leak into the
filling end of the stopcock, but of course this was of no consequence
to tne remainder of the assembly. Therefore, the lower section of
the dilatometer was not so fragile and was much easier to handle in
cleaning, assembly and operation.
An easy way to nandie the apparatus was developed by means 01
movable arms and two-way (contort) swivel clamps. Figure 2 shows
the apparatus down in the bath. The dilatometer was raised out of
the bath by pusning the dilatometer supporting rod up with one nana
and tne retaining rod was ciamped onto the lower arm with the otner
hand. It was an easy matter to pour the mercury out through the
capillary when finished witn a run by locking tne dilatometer in
the up-out-of-bath position described above, disconnecting the
upper arm from the dilatometer supporting rod, and rotating the
b


<a
Capillary Index
Bulb Indexand Bath Level
->-.
Pushed-in "Dimples"to prevent theSample fromblocking theCapillary
Pinchclamp
Rubber Hose Section
Kern-Tixelo Stopcock
— -IX
! f'T'J 'I . DILATOMETER

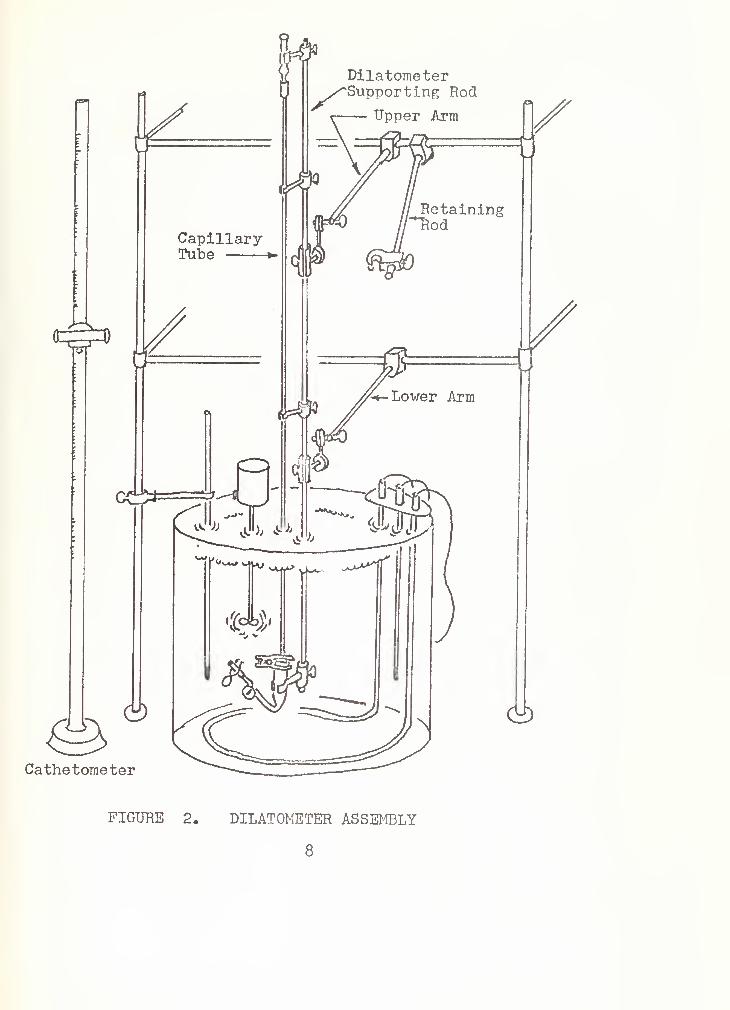
Cathetometer
FIGURE 2. DILATOMETER ASSEMBLY
8


dilatometer supporting rod about 133 degrees to the rignt or left.
The procedure i'or removing the mercury is described in greater
detail in Appendix II. During all these manipulations, the fragile
glass dilatometer was clamped firmly to the supporting rod thereby
reducing the chances for breakage.
The two sections of tne sample bulb which were joined by a
spherical ball and socket ground glass joint, were clamped together
with the metal c-clamp commonly used with this type of joint, and
in addition enough DeKhotinsky cement was applied to the joint to
insure a tight and immovable fit. The cement was easily applied by
slightly warming the clamped joint witn a bunsen burner flame, ana
then applying the warmed cement to the outside of the joint witn a
heated spatula. This was done in two steps by applying tne cement
to one-naif of tne joint, allowing it to cool and narden, then
rotating the clamp l8o° around the joint and applying cement, to the
remainder of tne joint. The cement was easily removed by warming
it with a flame, picking off the majority of the cement with a
spatula. Further neatmg allowed the two sections to be pulled
apart easily. The cement remaining on the two sections was then
cosily removed by scrubbing it with metnanol.
Three parameters were determined for tnis apparatus: the
volume of the sample bulb (V" ), the volume of the capillary from
the capillary index to any point along its length (AV), ana the
effect of the volume of tne glassware (V_) and its cubic
expansivity (a_)
.
The volume of the bulb was determined by joining and sealing
the two empty bulb sections, filling the system to the capillary
o


index with mercury, bringing it to a constant temperature, removing
the mercury, weighing it on a trip-balance, and. tnen dividing the
weight by the density of mercury., This procedure was repeated until
the bulb sections could always be assembled to give reproducible
results.
The cross-sectional area oi tne capillary was founa to be
critical in regard to the final results. The cross-sectional area
of the capillary tube was determined precisely by the method described
by Briggs in his Appendix II [_10J . It was found tnat tne cross-
sectional area of the capillary varied from a minimum value of
3.U55 x 10""3 cm^ at 30.675 cm from tne index to a maximum value or
3.573 x 10⁻³ cm2 at 5U.y?0 cm from the index. (See Fig. 3). Tne
volume of the capillary at any location from tne capillary index
was determined by integrating (using the trapezoidal rule) under
the curve of cross-sectional area plotted versus distance from tne
capillary index. These data were tabulated for use during a run
as described in Section 5 under Treatment of Data.
The e fleet ol the volume of glassware (V~) and its cubic
expansivity (a„) was determined empirically for tne apparatus.
The volume of glassware was assumed to be equal to that of tne
sample ouib, i.e. Vg
a V [l3J
. The linear expansivity ol pyrex
was found in the literature to be quoted as 3.25 x 10~° /°Cj but
this value is dependent on the particular manulacturer ana was found
to change alter fabrication as reported by Briggs floL In addition,
the dimpled sections, joint ana filling connection with the stopcock
had some effect on the overall expansivity of tne glass. Thus tne
1.0


cubic expansivity could be assumed to be of the same magnitude as
three times the linear expansivity, or about 1.0 x 10"*',
/CC, The
actual value for the expansivity of the glassware was found to be
1.?1|6 x 10"V°C This was determined by conducting a calibration
operation using mercury alone in the system and the known cubic
expansivity of mercury.
Although not an integral part of the apparatus, the thermometer
used to determine the temperature and temperature changes in the
bath had to be calibrated. Five Beckmann thermometers were cali-
brated over the temperature range 2£°-50 C by comparing them with
a thermometer which had been checked by the National Bureau of
Standards. During the period of investigation it was found that
the Beckmam thermometers were not as precise as originally believed,
and cumulative errors as great as 0.1°C were detected over a 25>°C
temperature range. These errors were no doubt due to thermometer
lag, stem corrections and/or temporary bulb volume changes.
Consequently the standardized thermometer was used for all runs
and the Beckmann thermometers were used as a good check on the
constancy of the bath temperature. By using the cathetometer, the
temperature could be determined correctly to 0.01 of a degree.
The temperature of the water bath was regulated by a Frecision
Micro-Set Differential Range Thermoregulator manufactured by the
Precision Scientific Company. It was designed to have a sensiti-
vity of I0.005°F and it was found to control the bath temperature
within 0»01°C very easily. About 2.2 collar turns were found to be
equivalent to a change of 1°C.
12

Determination of the location of the capillary index, move
of the mercury meniscus and the temperature reading was accomplished
with a precision cathetometer , accurate to *0.00$ centimeters.
Operating instructions for using this apparatus are given in
Appendix II
.
h . Preparation of Sample
It was desired to have plastic samples that had expansivity
characteristics similar to those of composite propellants, yet
not be hazardous to handle. It was also desired that the expansi-
vity of the plastic, be relatively large so that the effects of
additives would be readily apparent.
The resin had to be one that was fairly stable, easy to poly-
merize and cure, and castable. A mixed polyester resin was obtained
through the courtesy of Mrs. Mary M. Williams, Code £052, NOTS,
China Lake, California. This resin consisted of 55$ Vibrin 121 and
l\S% Selectron 5119 with a cobalt naphthenate accelerator added to
it. This resin was stable at room temperature for about 30 days
when new, but at iiO°F was stable for six months to a year, In order
to simulate the effect of a propellant oxidizer, an inert salt,
I^SO^, was mixed with the resin. Finally, powdered aluminum was
added in various amounts to different samples.
The samples were made by the very simple procedure of pouring
the resin-additive mixture into six-inch test tubes. Then the
plastic polymerized in the tubes upon the addition of the catalyst.
The test tubes were selected so that their inner diameter was a
13


little less than that of the apparatus bulb section in order that
the samples would have room for expansion during the run. The
casting procedure ttfiich was used is described in Appendix I.
One resin-sulfate-aluminum sample was sectioned in several
pieces and examined with a magnifying glass for evidences of
entrapped air bubbles or pockets, but none were apparent. The
sample appeared to be a uniform mixture throughout its length
as well as across its diameter . Evidently the sample de-gassed
itself in the polymerization process.
It was necessary to condition the samples in order to exclude
(or at least minimize) changes of sample volume which might have
been caused by changes in moisture content, post-curing, loss of
plasticizer or solvents, release of stresses and other factors.
The conditioning method which was used is described in Appendix I
and was based on methods reported elsewhere i 11 J ,
$. Treatment of Data
The raw data which were recorded for every sample during a run
were the location of the capillary index, the location of the
mercury meniscus, and the exact temperature for every change in
temperature. Before the data were recorded, the dilatometer,
mercury and sample were allowed to remain at the temperature long
enough for equilibrium to be reached. For a 1°C temperature change
sometimes as little as 15 minutes was sufficient, however over an
hour was sometimes required at temperatures near 50°C„ Correspond-
ing to every temperature increment was a capillary length increment,
Al. The net volume change, AV, (the expansion of the mercury,
III


glassware and sample) was found by entering the table made up for
this purpose as described in Section 3. Tables 1 through 5 show
the data which were obtained from runs conducted on five different
samples. The composition of each sample is noted in weight
percentages. In these tables, Al is the distance (in centimeters)
from the capillary index to the mercury meniscus in the capillary
tube of the dilatometer at the corresponding temperature. A? is
the volume (in cubic centimeters x 10 ) of the capillary occupied
by the corresponding Al. T is the temperature in degrees
centigrade, °C. As a run was in progress, AV vs. T was plotted
and any irregularities were immediately detected. (See Fig k) «
No real conclusions could be drawn from the comparison of the
curves shown in this figure because each sample had a different
initial volume.
The calculation of the cubic expansivity was based on the
following assumptions and calculations?
av;^rz -TT) vat
In this dilatometer, the volume change was a combination of a rise
of mercury in the capillary due to the expansion of mercury and the
sample and a drop in the mercury level due to the expansion of the
glass bulb and tubing <, Consequently,
a,'V-AT - AV + a.Vc-AT - a,^\/^AT» r
- a, .^k + a*, ii
15


Table I
Sample composition: 100$ resin, 0% I^SOl, 0% aluminum
weight? 114.0226 gms
volumes 11.71 cm-*
density: 1.197 gms/cirP
A 1 AV T
0.0 0.0 25.0
2,160 75-572 26 oO
U.335 151.678 27.0
6.500 227.61*2 28,0
8,675 30U.105 29.0
21,1*00 752.129 35.0
23.680 832.108 36.0
25.975 912.355 37 eO
28.290 992.927 38.0
UU.6U0 I56ii.007 U5o0
ii7.0U5 16U9.520 U6.0
U9.360 1732.003 U7.0
16


Table 2
Sample composition: 50$ resin, %0% l^SO^, 0% aluminutm
weight t 21.2352 gms
volume; 13.03 cm^
density? 1.630 gms/cm3
A 1 Zl V T
0.0 25.0
56.335 26,0
11U.053 27.0
67U.750 36.0
738.079 37.0
801.270 38.0
1376.978 U7.0
lUl*Oo2U2 U8.0
150U.650 h9.0
0.0
1.610
3.260
19 • 200
21.000
22.800
39.3UO
Ui.iUo
1*2.965
17

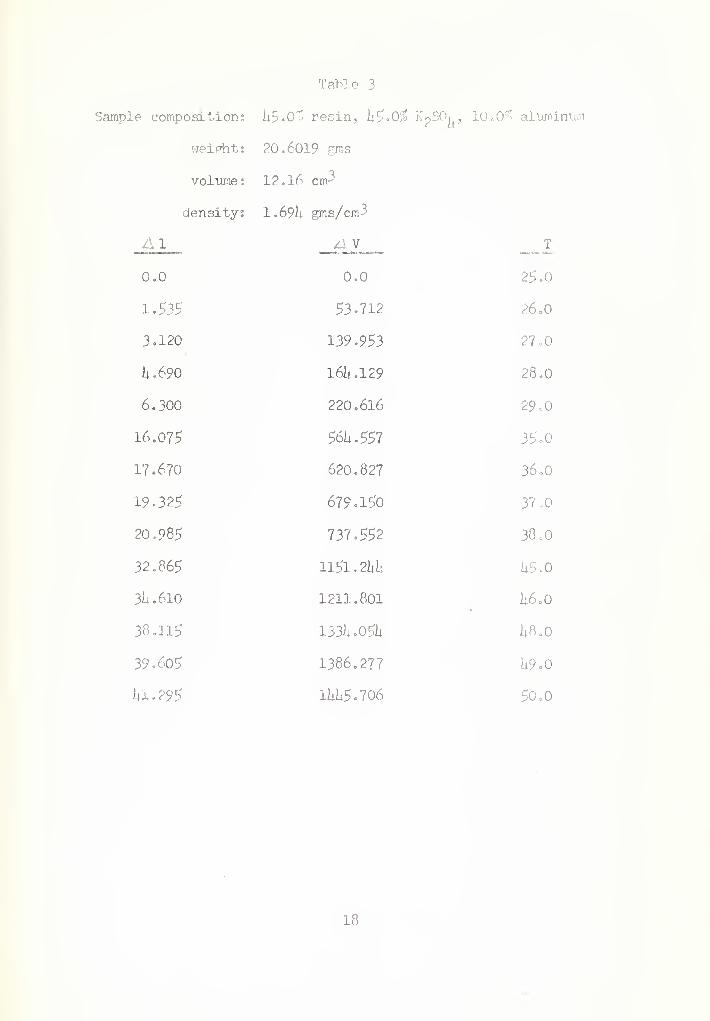
Table 3
Sample compositions; U5.0^ resin, U5.0$ K^SO. , 10.0$ aluminum
weight: 20.6019 ™s
volume: 12.16 cnP
density; 1 . 69U gms/cm3
_ 1_ _A V
0.0 0.0 25 .0
1.533' 53.712 26oO
3.120 139.953 27.0
U.690 161i.129 28.0
6,300 220.616 29=0
16.075 56li.557 35^0
17.670 620.827 36.0
19.325 679.150 37.0
20.985 737.552 38.0
32.865 1151. 2U:- U5.0
3U.610 1211.801 h6.0
38.115 133li.05U U8.0
39.605 1386.277 ii9.0
ill. 295 1UU5.706 50 oO
18


Table h
sample composition: Ui.IjS# resin, UU.li5$ K2S0
U'11 ' 1^ aluminum
weight: 21.7261 gms
volume: 12.82 cm-3
density: 1.695 gms/cm^
/:, 1 zjl V JT__
0.0 0.0 25.0
1,1-95 52.313 26c0
3.0U5 106.528 27.0
17.755 623.826 36,0
19.380 681.087 37.0
20,990 737.727 38.0
36,705 128U.778 1*7.0
38.230 1338.082 aa.o
39.980 1399.U36 U9.0
15


Table 5
Sample composition: 1x0.0% resin, UO.O;^ K^SOk, 20. 0V.\ aluminum
weight: 21.6066 gms
volume: 12.38 cm-'
density: 1.71*5 gms/cm3
A 1 ZiV T
0.0 0.0 2^.0
1.390 IiS.oitO 26.0
2.795 97.783 27.0
U.280 Ui9.76it 28.0
5.695 199.376 29.0
11.825 520.1i83 35.0
I6.!i00 576. 02U 36.0
17.920 629. 6U6 37 .0
19.1465 68J4.079 38.0
32.275 1130.819 1*6.0
33.895 1186.961 U7.0
35.1i85 12il2.2U3 U8.0
37.120 1299.267 U9.0
20


Substituting V - V>„ +" V j
And assuming I 12
Then
my
_ _^L _ & (a -CLjW <a
The values for VQ and a„ were constants for all experimental runs
and were empirically determined for this apparatus to bes
Vc 20.08 cm?
a9
= L2f6 + to ^yirj-^c
The expansivity of mercury is J 12 /
Substituting these constants in the equation for as ,
Av7
2 O. OS/ v ->
Q, <v. -».,-i\ = ~,—— ~~ —1— (18.1^4 -i.24tV*o + f8.i<l4A7C~
V<v~> = ^-(^ -*'*>'•
5
The values for 3 V and ^ T were obtained from the data recorded
during the run. The value for V_ was obtained in the manner
described in the step-by-step operating procedure given in
Appendix II
.
22


6. Results
Data were obtained on five samples of different composite
The cubic expansivity was calculated with the greatest possible
precision in order to be able to reach some valid conclusions
comparing the results of the individual tests to determine the
effect of varying the amount of aluminum in each sample.
All samples were made of the same mixed resin, and all of
the composite plastics contained equal parts (by weight) of
resin and inert salt (l^SO^). The percentages given for the
samples containing .aluminum are weight % of aluminum, and the
remainder of the samples are resin and salt. The observed values
(except for 100'C aluminum) were:
Cubic expansivity/°n
= 56.36 x l<r£
= U0.19 x 10~^
v, = 37.77 x 10-SJ/0
.1% = 37.13 x 10"^
a20.0^ ~ 3k .Wi x 10~5
= 6.825 x 10⁻⁵
The first method used to determine the effect of aluminum
additives was by the equation
a(mix) = ai ni bl + a2 n
2b2
nl b
l * n2 b2
Neither the bulk compression modulus of elasticity, I"%, of the resin
or of the resin-salt mixture was known, nor could they be determined
23
10C$ Resin ar
Resin and salt ars
10.0't Aluminum a10.0
11.1$ Aluminum all.l
20.0;£ Aluminum a20.0 :
100:^ Aluminum [s] aAl


conveniently. It has been reported p jthat
K = -^where K • compressibility = _i
MB
ti = Poisson's ratio
E * Young's Modulus of Elasticity
and that at room temperature,
' AJL *"' «r /-C^n
Then by b = (proportionality constant) iL , and assuming that
the proportionality constant is equal to one,
/ = — - ——^ r a:— r ^ k&3w<; 4«'-^/.
The equation for s./>\ was solved to determine empirically
the factor brs for the resin and salt mixture (treated together
as one component) using the observed value of a( • \ for the 11
aluminum samples
(This value for b^. would indicate that E„_ would have to equalJo l S
about 7.6x10 psi. This is about the same magnitude of values
reported for some similar mineral-filled plastics.) Using this
empirical value obtained for b , the predicted values of the cubic
expansivity for the 10.0$ and 20.0$ aluminum samples were calculated
to be;
a10.0? Al(calc) = 37.toO-5/°C
2li

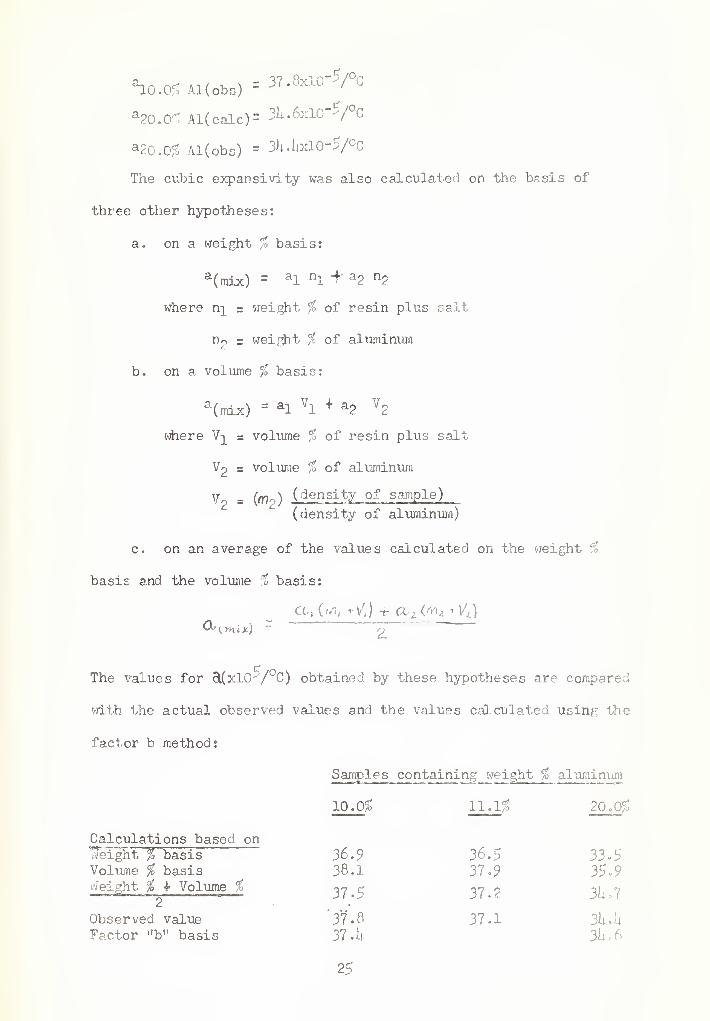
a10.0^ Al(obs)
=37.8xlO^/ C
a20.0^ Al(calc)= 3U.6xlO--A
a2o.O$2 Al(obs) = 3U.bclO-^/°G
The cubic expansivity was also calculated on the basis of
three other hypotheses:
a. on a weight % basis:
a (mix) = al nl + a2 n2
where n^ = weight % of resin plus salt
n = weight % of aluminum
b. on a volume % basis:
a(mix) = al
Vl + a2
V2
where V^ = volume % of resin plus salt
V? s volurae % of aluminum
V2 = (m
2)(density of sample)
(density of aluminum)
c. on an average of the values calculated on the weight %
basis and the volume % basis:
a t(r/i, +Vt ) f a, 4 ('"zj VL )
The values for c\(xlO')
/ C) obtained by these hypotheses are compared
with the actual observed values and the values calculated using the
factor b method:
Samples containing weight % aluminum
10. Og 11. l£ 20,0?
Calculations based onWeight % basis 36.9 36.5 33 .
5
Volujue % basis 38.1 37-9 3$°9Weight % i Volume % 37 ^ 37 2 3L. 7
Observed value 37.8 37.1 3h*hFactor "b" basis 37 -U 3U.6
2<


7. Discussion of Results
The results were determined from data on only one run on each
sample. Consequently the validity of any conclusions drawn from
these results would depend on the reproducibility of results which
would be obtained with the apparatus and upon the variations to
be expected between individual samples of the same composition and
past history.
Despite the small number of samples used, it was found that
aluminum additives, even in small amounts, lower the expansivity
of a composite plastic by a significant degree. It was also
found that the expansivity of the composite mixture can be pre-
dicted with an error of about 1% by the correlation
_ a^ n^ b-j_ + a2 n2 b2 +l
(mix)n^ ^ + n
2b^ +
where the factor b is proportional to the product of the bulk
compression modulus of a component and its specific volume, and
n is the weight percent of the component.
It was also found that predictions based on the relationship
a(mix) = al nl + a2 n
2
gave consistently low results, and that predictions based on the
relationship
a(mix) = al Vl + a
2V2
where V is the volume percent of the individual component, gave
consistently high results.
Furthermore it was found that predictions based on the
relationship
a(mix) = a
.
(nl f Vl> + a2(n
2 + V2)
2
2h


agreed almost exactly with predictions based on the method using
factor b. No justification for this observation has been found
in theoretical analysis.
It is believed by the author that the two correlations which
were found to give fairly accurate predicted expansivities of
mixtures may open a new approach to the consideration of additives
to plastics and composite propellants. More research is definitely
indicated in this field with the same mixtures to obtain a measure
of the reproducibility of results as well as with mixtures of a
larger number of components.
27

BIBLIOGRAPHY
1. Gilbert F. Kinney, "Engineering Properties and Applications
of Plastics", John Wiley & Sons, Inc., New York, N.Y., 1957.
2. Jean A. Vandenkerckhove , ARS Journal , 29, U83-li91, (1959).
3. M. Visnov, ARS Journal , 29, 500-505, (1959).
U. Alois X. Schmidt and Charles A. Marlies, "Principles of High-
Polymer Theory and Practice", McGraw-Hill Book Company, Inc„
,
New York, N.Y., 19U8.
5. J. R. Partington, "An Advanced Treatise on Physical Chemistry",
Vol. Ill, The Properties of Solids, Longmans, Green and Co.,
London, New York and Toronto, 1952.
6. Gilbert F. Kinney, classroom notes, U. S. Naval Postgraduate
School, Monterey, California.
7. Arnold Weissberger, "Physical Methods of Organic Chemistry",
Volume I, Part One, 2nd Edition, Interscience Publishers,
Inc., New York, 19U9-
8. Donald W. Moore and Eli Besser, "A Recording Thermal Extenso-
meter for Plastic Materials", NOTS 1516, NAVORD Report 5291
dated 6 September 1956 (CONFIDENTIAL)
.
9. American Society for Testing Materials, "Standard Method of
Test for Coefficient of Cubical Thermal Expansion of Plastics",
ASTM: D861|-52
10. Winston D. Briggs, "A Dilatometer for Determining the Cubical
Thermal Expansion of Solids and Applicable for High Explosives
and Propellants", M.S. Thesis, United States Naval Postgraduate
School, Monterey, California, 1959.
28


11. American Society for Testing Materials, "Standard Methods of
Conditioning Plastics and Electrical Insulating Materials
for Testing", ASTM D618-58.
12. National Research Council, "International Critical Tables'*
,
Volume II, pp U57-h58, McGraw-Hill Book Co., Inc., New York
and London, 1927.
13. Kimble Glass Division of Owens-Illinois Glass Company,
"The Care and Handling of Glass Volumetric Apparatus",
publication TK - 33 - $lh - M25, 1951.
2o


APPENDIX I
CASTING AND CONDITIONING PROCEDURE
The step-by-step procedure which was found to be most
satisfactory for casting and conditioning the samples is as
follows:
1. Heat a sufficient quantity of '^SOk and aluminum powder
at 100°C for about 2u hours to remove moisture.
2. Clean and dry all test tubes, beakers and stirring rods
thoroughly. Label each beaker and test tube to show what they
are to contain.
3. Pour out enough resin in a large beaker to make the
samples and return the remainder immediately to cold storage.
Allow as little moisture as possible to condense inside the
cold container.
li. Weigh the desired amounts of i^SOi and aluminum powder
into the individual beakers, grind them together with the glass
stirring rod to remove all lumps, and thoroughly mix them to
give as uniform a mixture as possible.
5. With the beaker containing the I'^SOk and aluminum powder
on the trip balance, slowly add the desired amount of resin with
stirring until the correct weight of resin has been added. Insure
that all of the powder and aluminum is wetted by the resin.
6. As soon as all the different samples are thoroughly mixed,
the casting procedure is completed on an individual basis. About
30 drops of methyl ethyl ketone peroxide catalyst are added to the
resin-sulfate-aluminum mixture in the beaker and thoroughly stirred,
30


As soon as the mixture becomes noticeably viscous (after about five
minutes) it is poured into the six-inch test tube. The resin then
gells solid within a few minutes.
7
.
Treat each remaining mixture in turn as stated above
„
8. Allow the samples to cure in their test tubes at room
temperature for about 15 hours.
9. Remove the samples from the test tubes by gently tapping
the inverted test tubes and let the sample slide out, or crack the
glass gently and remove the broken glass carefully so as not to
scratch or break the sample
.
10. Mark or label the samples in some manner and allow them
to remain in an oven at 5>0°C to cure for approximately one weeko
11. Remove the samples from the oven, cut them (on a bandsaw)
to the desired length to just fit inside the bulb sections of the
apparatus, scrub them quickly with soapy water and rinse them with
distilled water. Wipe the samples dry with lintless Kim-Wipes and
put them into a 100°C oven for one-half hour, and then leave them
in a 50°C oven for at least another week as a final curing and
conditioning period
.
12. At the end of the conditioning period place the samples
in a dessicator until needed for a test.
31


APPENDIX II
OPERATING INSTRUCT*
The method of obtaining the cubic expansivity by dilatometric
technique was not a fast one. Hours of preparation (none times
clays in advance) had to be done before commencing a run, For the
runs covering the temperature range of 25°-50°C, as little as six
hours or as much as ll; hours were required , depending on how
accurately the temperature was controlled and how quickly the
system reached equilibrium at the various temperatures.
Cleanliness of the apparatus, cleanliness of the mercury and
samples, proper conditioning of the samples, and tight-fitting
joints and stopcock were found to be major items affecting the
accuracy and reproducibility of the results obtained.
The glassware was cleaned very carefully by washing it with
sulfuric acid-sodium dichromate cleaning solution, rinsing it
with tap water followed by several rinsings with distilled water,
and drying it. The long capillary section was dried after
final rinse by inverting the tube in an upright position
applying a strong vacuum to the capillary end , By the procedure
of draining and evaporation the tube was left clean and dry in
about one hour. The short bulb section was easily dried after
final rinsing by placing it in an oven at about 100°C for a
short time. After drying, the glassware was closed off from the
atmosphere when not in use.
The cleanliness of the mercury was assured as much as possible
by using triply-distilled mercury and filtering it through filter
J2

paper with a pin-hole in it just prior to filling the dilatometer.
The separatory funnel which contained the mercury and the short
section of rubber tubing which joined the separation funnel to
the dilatometer were cleaned carefully also. The samples were
cleaned after they had cured at 50°C for one week by scrubbing
them quickly with soapy water, drying immediately in an oven,
curing again at 5>0°C for at least one more week, then storing in
a dessicator when not in use. The samples were handled with lint-
free tissue paper after the final curing.
The method which was used to condition the samples and the
procedure for obtaining a tight-fitting joint is described in
Sections 3 and h and Appendix I.
In general, the step-by-step procedure which was found to
give the most satisfactory results is as follows
s
"* 1. Clean and dry the glassware, mercury and sample.
2. Clamp the lower bulb section in position above the water
bath of the apparatus.
3. Insert the sample in the bulb. Fit the upper bulb section
with the capillary tube to the lower bulb section and clamp in
position on the apparatus.
li. Close the Kern-Excelo stopcock. Apply vacuum at the
upper end of the capillary tube.
5. Clamp the joint together and seal with De Khotinsky cement,
6. Attach the mercury reservoir to the filling connection and
apply vacuum to the dilatometer up to the reservoir stopcock
.
3)


7. Fill the dilatometer with mercury to a position 30 to
lj.0 cm above the capillary index. Gentle tapping of the bulb as
the mercury is poured in insures no trapping of air bubbles
around the sample or joint.
8. Secure the vacuum and remove the vacuum hose from the
top end of the capillary. Replace it with a drying tube.
9. Close the Kern-Excelo stopcock and then close the
mercury reservoir stopcock leaving some mercury still in the
filling connection. Then remove the mercury reservoir from the
rubber connection and place aside.
10. Close the end of the short rubber hose on the filling
connection with a pinch-clamp and manipulate the Kern-Excelo
stopcock to allow the mercury in the capillary to fall to a
position between the bulb index and the capillary index.
11. ImmerS3 the dilatometer in the water bath (at 25>°C) to
the bulb index, and allow the mercury to seek its own level.
12. Observe the mercury meniscus with the cathetometer
until there is no appreciable movement in a period of ten minutes
.
This means that the whole system, glass, mercury and sample,
nearly reaches equilibrium at 25>°C.
13- Adjust the mercury level so that it is fairly close to
the capillary index by compressing the short rubber hose and
manipulating the Kern-Excelo stopcock.
1)4. Repeat steps (12) and (13) as necessary until the entire
system reaches equilibrium with the mercury meniscus located near
the capillary index. This condition is met when the meniscus does
3).

not move more than 0.005 cm in a period of 15 minutes. It requires
from one to two hears to accomplish steps (12) through (lb)
.
l£. Record the position of the capillary index and the
mercury meniscus at 2^°C and at convenient intervals up to 50°C
as the temperature control is adjusted. By recording the capillary
index location each time the meniscus level is recorded, no read-
ings are invalidated if the dilatometer is subsequently mover! or
jarred through accident or design during the progress of a run.
It requires about 20 minutes per 1°C temperature change for the
system to come to equilibrium.
l£>. Upon completion of the run, raise the dilatometer out of
the water bath and remove the excess mercury which has been left
in the filling connection with a suction device.
17. Detach one of the movable arms of the assembly from the
dilatometer and rotate the dilatometer on the remaining 2-way
swivel arm until the capillary end is about 30° below horizontal
.
18. Place a small side-arm filter suction flask with a one-
hole stopper over the end of the capillary. Open the Kern-Exce? o
stopcock and apply suction to the suction flask. The mercury is
thus drained from the bulb and capillary into the suction flask.
By tapping the dilatometer gently during this procedure all, or
nearly all, of the mercury is removed from it.
19. Remove the suction flask containing the mercury and
rotate the dilatometer to an upright position and fix in place.
Warm the De Khotinsky cement slightly and scrape the cement off
the joint. The joint is then, easily broken.
35


20. Remove the sample from the bulb and weigh it in order
to determine its density later.
21. Add any mercury left in the bulb to the mercury in the
filter suction flask. Obtain the weight of the mercury by sub-
tracting the weight of the bottle from the weight of the bottle
and mercury. Obtain the volume of mercury, Vm , by dividing the
weight by the density of mercury at 25°C.
22. Obtain the bulb volume, VQ , from previous calibration
data corrected for the mercury meniscus location with respect to
the bulb index or capillary index. (For this apparatus,
VQ s 20.08 cm3, the bulb index is U.520 cm below the capillary
index, and the volume of the capillary from the bulb index to
the capillary is 0.01£9 citk. Thus, as long as the mercury meniscus
is located at 25°C somewhere between the bulb index and the
capillary index, the volume can be assumed to be 20.1 cm3 with
only about 0.2$ error.)
23. Determine the sample volume, Vg , by subtracting V
from V, and obtain the density of the sample by dividing Vs
by the weight of the sample
.
36


thesG2595
The effect of aluminum additive on the c
3 2768 002 02560 3
DUDLEY KNOX LIBRARY