effect of breakwaters on wave energy dissipation...
TRANSCRIPT

International Water Technology Journal Vol. 2 – No. 4, Dec. 2012
268
EFFECT OF BREAKWATERS ON WAVE ENERGY DISSIPATION
(CASE STUDY: RAS EL-BAR BEACH, EGYPT)
Zidan, A. R., Rageh, O. S., Sarhan, Th. E., and Esmail, M.
Faculty of Engineering, Mansoura University, Egypt.
E-mail: [email protected]
ABSTRACT
The northern Egyptian coasts are subjected to many changes in shoreline balance due to waves and
coastal currents. To protect and develop these coasts, many types of coastal protection structures have
been used. This research demonstrates the effect of different systems of coastal protection structures
on wave energy dissipation. By using the CGWAVE numerical model, the effect of each one and
interaction between these structures on wave height could be studied. This model was used to simulate
the wave propagation along Ras EL- Bar beach with different coastal structures such as groins,
detached breakwaters, seawalls, shore-connected breakwaters and submerged breakwaters. By
applying the numerical wave modeling on natural bed bathymetric at this area, the results show that,
the effects of every system alone and interaction between these systems on wave energy by applying
numerical wave modeling to the natural bed bathymetric of this area, the results show the effects of
each system alone and the interaction between these systems in terms of dissipation of wave energy.
The results of this model could be used as a guide in designing similar works in the future.
Keywords: Waves, Breakwater, Groins, Energy Dissipation, Coastal, Ras EL-Bar.
1. INTRODUCTION
Waves and currents attack the coastal beaches along the northern coast of Egypt. The erosion takes
place in several regions and accretion occurs in some other places along the coastal areas. Many areas
subjected to aggressive wave current interaction condition after construction of the High Aswan Dam
along the Nile River. Damietta branch estuary is focused on this study. The sea side resort of Ras EL-
Bar has been built by the sediment carried by the Damietta branch, but it was subjected to erosion after
construction of the High Aswan Dam.
In many previous research works, the effect of coastal protection systems has been investigated
through experimental and numerical simulation models. The performance effect and efficiency of each
type has been investigated. In this research, the effect of different types of breakwaters on wave
energy dissipation was investigated through a numerical simulation. The considered systems are
groins, detached breakwaters, seawalls, submerged breakwaters and shore-connected breakwaters. The
effects of interface between these systems were discussed and evaluated, related to the purpose of
construction.
2. LITERATURE REVIEW Berkhoff (1972) derived a two-dimensional differential equation which describes the phenomenon of
combined refraction-diffraction of simple harmonic waves, applying Airy wave theory and assuming
conservation of the wave energy flux. Berkhoff et al. (1982) applied the numerical methods by using

International Water Technology Journal Vol. 2 – No. 4, Dec. 2012
269
three models indicated as the refraction model, the parabolic refraction-diffraction model and the full
refraction diffraction model to study short wave propagation in the horizontal plane.
Li and Anatasiou (1992) used the multigrid method to solve very efficiently the form of the mild
slope equation for water wave propagation over large areas in the presence of current, taking into
account the combined effects of shoaling, refraction, diffraction and wave breaking.
Zhao et al. (2001) developed a technique for including the effects of dissipation due to wave
breaking in two-dimensional elliptic models based on the mild-slope wave equation. Bellotti and
Brocchini (2001) briefly analyzed some characteristics of waves in very shallow water near the
shoreline as higher-order boussinesq-type equations. Bender and Dean (2003) studied wave
transformation by bathymetric changes and resulting shoreline impact, using three case studies. Junj
and Suh (2008) derived an analytical solution to extend mild slope equation for long wave propagation
over an axi-symmetric pit where the water depth decreases.
3. PROBLEM DEFINITION
The sea side resort of Ras EL-Bar has been built by the sediment carried by the Nile River Damietta
branch. Over the last century, the reduction of the flooding by the Nile has reduced the supply of the
sediments and the uncompensated excessive power of the sea has caused large-scale erosion of the
promontory which has been reduced by 2.0 km. The 200m long jetty was built at the extremity of the
promontory in an attempt to control erosion.
Erosion continued west of the jetty and 400 m long seawall was added in 1965. Both of these
structures were subjected to erosion and their bases were recently protected by rip-rap and dolos.
Erosion still occurred to the west and three groins were built in 1972 (Mobarek, 1972), the first at the
end of the seawall. The beach continued to recede and in 1980, a 350 m long rip-rap shore protection
was installed between groins land. Erosion is still occurring along the beaches to the west. Delft
(1987) studies recommended the construction of eight detached breakwaters and the nourishment
process was added to accelerate the accretion process composing the salient.
Fig. 1: Ras El-Bar Bay, 2010 (Satellite Image)
Fig. 1 shows a satellite image of Ras El-Bar Bay in the year 2010.
Shore Protection Authority, (S.P.A) recorded numerous dangers of seawall along the area between
the jetty and the groin system. In 2004, S.P.A completed the submerged detached breakwater
Detached
B.W.
Submerged
B.W.

International Water Technology Journal Vol. 2 – No. 4, Dec. 2012
270
construction in the specified area as shown in Fig. (2). A new system was proposed and performed
between the left and middle groin. The new system composed of submerged offshore breakwater.
In 2007 Sarhan designed two shore connected breakwaters to reduce the effect of wave energy inside
the breaking zone, in Ras EL-Bar Bay.
489000
( Dameitta
Branch )Nile River
5.0
487500
6.0
487000
488000
7.0
488500
W
329
500
330
000
330
500
331
000
331
500
332
000
332
500
2.03.0
4.0
Shoreline
5.0
MEDITERRANEAN SEAE
S
N
7.0
4.0
6.0
8.0
Shoreline
2.0
3.0
7.0
6.0
3.0
2.0
5.0
4.0
( E
aste
rn J
etty
)
Ras EL-Bar Bay
Fig. 2: Ras EL-Bar Beach (2007)
4. FIELD DATA COLLECTION
The wave, current, tide, and beach slope are important parameters for the assessment of nautical and
shore protection study.
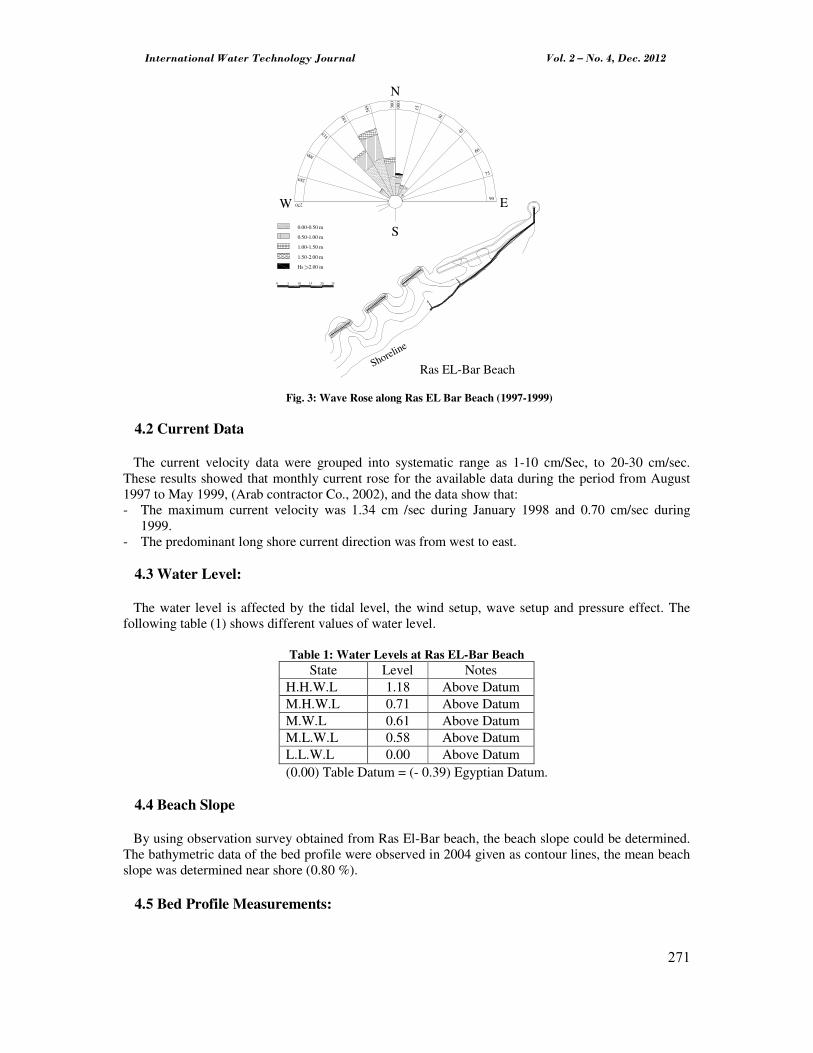
4.1 Offshore Wave Data
A continuous record of the waves was obtained by using S4DW (Arab contractor Co., 2002). The
directional wave spectrums were recorded every 20 minutes for four hours in water depth of 12 m.
The results are given in wave rose, Fig. (3), covering the period from august 1997 to may 1999.
From this figure, the following interpretations can be deduced.
- The predominant wave direction is confined in the sector between North West and north
directions.
- The winter season is characterized by the high waves coming from the north.
- The maximum wave height reaches 4.25 m during January 1998 and 3.10 during February 1999.
- The peak wave period reaches 13 seconds and the average significant wave period ranges from 6 to
7 seconds.
International Water Technology Journal Vol. 2 – No. 4, Dec. 2012
271
N
EW
S
36
0
00
0
34
5
330
315
300
285
270
90
75
60
45
30
15
0.00-0.50 m
0.50-1.00 m
1.00-1.50 m
1.50-2.00 m
Hs 2.00 m
0 5 10 15 20 25
Shoreline
Ras EL-Bar Beach
Fig. 3: Wave Rose along Ras EL Bar Beach (1997-1999)
4.2 Current Data
The current velocity data were grouped into systematic range as 1-10 cm/Sec, to 20-30 cm/sec.
These results showed that monthly current rose for the available data during the period from August
1997 to May 1999, (Arab contractor Co., 2002), and the data show that:
- The maximum current velocity was 1.34 cm /sec during January 1998 and 0.70 cm/sec during
1999.
- The predominant long shore current direction was from west to east.
4.3 Water Level:
The water level is affected by the tidal level, the wind setup, wave setup and pressure effect. The
following table (1) shows different values of water level.
Table 1: Water Levels at Ras EL-Bar Beach
State Level Notes
H.H.W.L 1.18 Above Datum
M.H.W.L 0.71 Above Datum
M.W.L 0.61 Above Datum
M.L.W.L 0.58 Above Datum
L.L.W.L 0.00 Above Datum
(0.00) Table Datum = (- 0.39) Egyptian Datum.
4.4 Beach Slope
By using observation survey obtained from Ras El-Bar beach, the beach slope could be determined.
The bathymetric data of the bed profile were observed in 2004 given as contour lines, the mean beach
slope was determined near shore (0.80 %).
4.5 Bed Profile Measurements:

International Water Technology Journal Vol. 2 – No. 4, Dec. 2012
272
This study depends on the monitoring of bed bathymetry of Ras EL-Bar beach along periods 1969,
1987, 2004, 2007, 2008 and 2010. The bed profile was recorded in 1969 to construct three groins
perpendicular to the beach, Fig. (4) (Mobarek, 1972). Delft hydraulics (1987) measured the bed
bathymetric in year1989 to construct a new system of the detached breakwaters, parallel to the
shoreline, Fig. (5).
Fig. 4: Bathymetric Survey along Ras EL-Bar Coastal Area, 1972
Fig. 5: Bathymetric Survey along Ras EL-Bar Coastal Area, 1989
In 2004, bed bathymetry, Fig. (6), was used for construction of semi-submerged detached
breakwater as an extension of the detached breakwater which was constructed in 1990 along the beach
of Ras El-Bar. The bathymetric changes and bed profiles between the second and third groins were
collected by Sarhan (2007), Fig. (7). Monitoring of the same area during the years 2008, 2009 and
2010 were measured by the fourth author, Fig. (8).

International Water Technology Journal Vol. 2 – No. 4, Dec. 2012
273
Fig. 6: Bathymetric Survey along Ras EL-Bar Coastal Area, 2004
Fig. 7: Bathymetric Survey along Ras EL-Bar Coastal Area, 2007

International Water Technology Journal Vol. 2 – No. 4, Dec. 2012
274
Fig. 8: Bathymetric Survey along Ras EL-Bar Coastal Area, 2008
Figs. (9) Through (13) give the bed profiles for years, 2004, 2007 and 2008 for sections under study
which are used as input data for the numerical model.
Fig. 9: Bed Profile at sec (1)
Fig. 10: Bed Profile at sec (2)
Fig. 11: Bed Profile at sec (3)

International Water Technology Journal Vol. 2 – No. 4, Dec. 2012
275
Fig. 12: Bed Profile at sec (4)
Fig. 13: Bed Profile at sec (5)
5. NUMERICAL SEMULATION
The wave model, CGWAVE, (Demirbilek and Panchang, 1998) used in this research, was designed
to simulate the wave propagation and wave height around coastal structures. The input data are bed
profile, wave direction, wave period and wave height. The model simulates the combined effects of
wave refraction-diffraction included in the basic mild-slope equation, it also includes the effects of bed
friction on wave height, breaking and nonlinear amplitude dispersion.
The classical super element methods as well as a new parabolic approximation method developed
recently are used to treat the open boundary conditions. An iterative procedure (conjugate gradient
method) is introduced and modifications are used to solve the discredited equations, thus enabling the
modeler to deal with large domain problems.
5.1 Governing Equation and Boundary Conditions
The solution of the two-dimensional elliptic mild-slope wave equation is a well-accepted method for
modeling surface gravity waves in coastal areas. This equation may be written as:
(1)
Where φ (x, y) = complex surface elevation function, from which the wave height can be estimated;
σ = wave frequency under consideration; C(x, y) = phase velocity = σ/k; Cg(x, y) = group velocity = ∂σ
/∂k; and k(x, y) = wave number (=2π/ L), related to the local depth d(x, y) through the dispersion
relation.
σ2 = gk tanh (kd) (2)
The mild-slope equation can be modified to include the effects of frictional dissipation and wave
breaking as follows:
(3)
( ) 02 =+∇⋅∇ φσφC
CCC
g
g
( ) 02
=
+++∇⋅∇ φσγσωσφ g
g
g iCiC
CCC

International Water Technology Journal Vol. 2 – No. 4, Dec. 2012
276
Where ω is a friction factor and γ is a wave breaking parameter. The following form of the damping
factor (w) in the wave model has been used:
(4)
Where α = H/2 is the wave amplitude and fr is a friction coefficient to be provided by the user. The
coefficient fr depends on the Reynolds number and the bottom roughness. Typically, values for fr are in
the same range as for Manning’s coefficient ‘n’. For the wave breaking parameter γ, the following
formulation has been used (Demirbilek and Panchang, 1998):
(5)
Where, χ and Γ are empirical constants. Nonlinear wave may be simulated by using
the nonlinear dispersion relation in place of Equation (2) was
(6)
Where:
6. RESULTS AND DISCUSSION
Figs. (14) Through (17) show a sample of output of CGWAVE model for wave steepness (λ=0.027).
Fig. 14: Wave Propagation in 1972, (λ=0.027) Fig. 16: Wave Propagation in 2007, (λ=0.027)
( )
+
=
kdkdkd
akf
k
nw r
sinh2sinh23
22 2
π
σ
Γ−=
2
22
41
a
d
d
χγ
( )[ ] { }2
5
1
22 tanhtanh1 kaFkdkdFkagk ++=σ
( ) ( )( )
( )
=
−=
kd
kdF
kd
kdkdF
sinh
sinh8
tanh24cosh
2
4
2
1

International Water Technology Journal Vol. 2 – No. 4, Dec. 2012
277
Fig. 15: Wave Propagation in 2004, (λ=0.027) Fig. 17: Wave Propagation in 2008, (λ=0.027)
The interaction between the different multi-systems breakwaters were investigated through a
numerical simulation and field data measurements. The effect of each breakwater on wave energy
dissipation was studied taking into consideration the sequence of construction and the natural
bathymetry along Ras EL-Bar coastal area since 1969 to 2010. The wave characteristics were
classified into four cases as indicated in table (2). The bed profile data along Ras EL-Bar coastal area
were surveyed before and after the construction of the coastal structure.
Table 2: Different Cases of Wave Data
Case Ho (m) T (sec) λ
Case (1) 6.00 12.0 0.027
Case (2) 4.50 10.0 0.029
Case (3) 3.00 8.0 0.030
Case (4) 2.00 6.0 0.035
Four wave directions, -60O, -30O, N and +30O were considered during the study. The direction -30O
was used and clarified in this paper. The area which was considered in this study is 340 m offshore
which behind all systems of protection and effected by it.
6.1 Bed Profile along Ras EL-Bar beach From the recorded bathymetric survey in 1969, 1989, 2004, 2007, 2008 and 2010the bed profiles
were grouped according to the periods
- From 1969 to 1972, before groin system construction.
- After the groin construction (1972)
- (1989) before the detached breakwater construction
- (2004) after the construction of submerged detached breakwater
- (2007) before the construction of Ras EL-Bar Bay
- (2008) and (2010) after construction of Ras EL-Bar Bay
The wave energy dissipation was calculated using the wave model for two cases, before and after the
construction of each structure.

International Water Technology Journal Vol. 2 – No. 4, Dec. 2012
278
Ras EL-Bar Bay project could be considered as an example of a model to represent the interaction
between different multi-systems of breakwater on wave energy dissipation. The total energy of waves
(ET) is given by (MuirWood, 1968):
ET = (1/8) γLH2 (7)
In which γ is sea water specific weight, L is water length and H is wave height.
The relative wave energy dissipation could be represented by RL:
RL = (Hb2-Ha
2)/Hb2 (8)
Which Hb is wave height before the constructed breakwater and Ha is wave height after breakwater
construction. This relative energy dissipation is based on constant wave length before and after the
construction of breakwaters.
The wave power, (P) is given by the following equation (Coastal Engineering Research Center, 2008):
P = (1/8) Cg γH2 (9)
In which Cg is group celerity of waves which is equal to 1/2 C for deep water and equal to C for
shallow water, where C is the single wave celerity.
Equation, (8) could be used to give relative loss in power keeping in mind that the group celerity of
waves is the same.
It was found from the statistical analysis which gives the best determination coefficient (R2) that the
relationship between the relative energy dissipation (RL) and the offshore distance (X) is an
exponential equation
6.2 Effect of Groin System
From the results, it is concluded that the construction of the groin system has minimum effect on
wave energy dissipation, Fig. (13), especially for normal or nearly normal incident wave direction to
the shoreline. So, the long-shore current has the major effect.
6.3 Effect of Seawall
The wave force attacks the beach between groins, so that the construction of the seawall was
necessary to protect the beach. Seawall dissipates wave energy according to its position and protects
the shoreline from erosion. But the erosion takes place at the toe of the seawall as a side effect of
breaking waves on the seawall. The bed profile between the groins changes to be steeper and
encourage a higher wave to attack the seawall.
6.4 Effect of Detached Breakwaters
Detached breakwaters were having significant effects on wave energy dissipation which strike
normally on the beach. The wave height behind the gap is higher than its value behind the breakwater.
After constructing the detached breakwater in 1992 the relative wave energy dissipation reaches to
65% in the shadow zone behind the breakwater. Wave direction was modified at breaker zone between
detached breakwater and the beach. The results in decreasing the wave energy and its direction
modified the coastal currents was generated which formed salient, And protected the coastal area. Fig
(18) shows the effects of detached breakwater on wave energy dissipation before (1989) and after
detaching breakwaters.

International Water Technology Journal Vol. 2 – No. 4, Dec. 2012
279
Fig. 18: Relative Wave Energy Dissipation (RL) versus Offshore Distance (X) (Detached Breakwater)
6.5 Effects of Submerged Breakwater
By construction of submerged breakwater eastern the Bay the wave energy dissipation reaches to
30% behind it. The beach rear submerged breakwater protected by seawall so that it has no effects on
the shoreline in this area. Fig (19) shows effects of submerged breakwater on wave energy dissipation.
Fig. 19: Relative Wave Energy Dissipation (RL) versus Offshore Distance (X) (Submerged Breakwater)
6.6 Effect of Groins and Seawall
It is very important to use seawall with groins at this beach to dissipate the wave force which attacks
the beach at normal direction, Fig. (15).
6.7 Effect of Groins, Seawall and Detached Breakwaters
Constructed of groins, seawall and detached breakwaters together have a significant effect on wave
energy dissipation of waves attacking from any direction, Fig. (15).
6.8 Effect of Groins, Shore Connected Breakwaters and Detached Breakwaters
The effects of interaction between multi-system breakwaters which consist of groins, shore-
connected breakwaters and detached breakwaters on wave energy dissipation are given in Figs (16,
17).
The wave energy dissipation reaches to 60%, this high value due to the interaction effects between
detached breakwater and shore-connected breakwater. Figs (20, 21) show the wave energy dissipation
in 2007 and 2008. Figs (22, 23) show that the wave energy dissipation increased after constructed Ras
EL-Bar Bay. It increased from 55% in 2007 to70% in 2008 relative to 2004.

International Water Technology Journal Vol. 2 – No. 4, Dec. 2012
280
Fig. 20: Relative Wave Energy Dissipation(RL) versus Offshore Distance (X) (Shore-connected Breakwater, 2007)
Fig. 21: Relative Wave Energy Dissipation(RL) versus Offshore Distance (X) (Shore-connected Breakwater, 2008)
Fig. 22: Relative Wave Energy Dissipation(RL) versus Offshore Distance (X)(Shore-connected Breakwater, λ=0.027)
Fig. 23: Relative Wave Energy Dissipation(RL) versus Offshore Distance (X)(Shore-connected Breakwater, λ=0.035)
Table (3) shows the formulae and R2 for every type of breakwaters.

International Water Technology Journal Vol. 2 – No. 4, Dec. 2012
281
Table 3: Statistical Formulae and R2 for Breakwaters under Study:
Type of BW λ Equ. R2
Detached
BW
0.027 RL=0.66e-0.04X 0.59
0.035 RL=0.67e-0.03X
0.63
Submerged
BW
0.027 RL=0.44e-0.17X
0.77
0.035 RL=0.40e-0.09X
0.83
Shoreconnected
BW
0.027 RL=0.65e-0.10X
0.84
0.035 RL=0.73e-0.05X
0.83
CONCLUSIONS After modeling the wave field, it could be concluded that:
- Groins have no significant effect on wave energy dissipation for approximate normally incident
wave. Their effect depends on long-shore sediment transport and currents.
- Seawall is very important to dissipate the wave energy, so it has main roles to keep the shoreline
without any changes.
- Detached breakwaters have a significant effect on wave energy dissipation and development of
salient along these beaches.
- In case of seawall existence, the submerged breakwater could be used to reduce the incident wave
energy and consequently minimize the coast of construction.
- The shore connected breakwater could be used with another protection system in accelerating the
rate of sediment deposition and shoreline development.
- For increasing value of wave steepness, relative wave energy dissipation increases.
- Detached breakwater and shoreconnected breakwater give higher value of relative wave energy
dissipation.
- The relationship between the relative energy dissipation and offshore distance has been found to be
an exponential relationship.
- From this research, the interaction between different types of shore protection system is clarified and
alternatives will be valuable in deciding the most efficient systems according to the field and natural
conditions.
REFERENCES:
[1]. Arab Contractor Co. (2002). “Dredging Works”. Damietta Port Authority, Egypt.
[2]. Bellotti, G. and Brocchini, M. (2002). “On Boussinesq-Type Equations Near The Shoreline: A
Note of Caution”. Ocean Engineering, Vol. 29, pp 1569-1575.
[3]. Bender, C.J. and Dean, R.G. (2003). “Wave Field Modification by Bathymetric Anomalies
and Resulting Shoreline Changes: A Review with Recent Results”. Coastal Engineering, Vol.
49, pp 125-153.
[4]. Berkhoff, J.C.W. (1972). “Computation of Combined Refraction-Diffraction”. 13th Coastal
Engineering Conf., Vol. 2, pp 471-489.
[5]. Berkhoff, J.C.W., Booy, N., and Radder, A.C. (1982). “Verification of Numerical Wave
Propagation Models for Simple Harmonic Linear Water Waves”. Coastal Engineering, Vol. 6,
pp 255-279.

International Water Technology Journal Vol. 2 – No. 4, Dec. 2012
282
[6]. Coastal Engineering Research Center (2008). “Coastal Engineering Manual”. Department of
the Army US Army Corps of Engineers, Washington.
[7]. Delft Hydraulics (1987). “Ras EL-Bar Shore Protection, Feasibility Study on a Detached
Breakwater System as Coastal Defence Measure”. Shore Protection Authority, Egypt.
[8]. Demirbilek, Z. and Panchang, V. (1998). “CGWAVE: A Coastal Surface Water Wave Model
of the Mild Slope Equation,” Technical Report CHL-98-26, U.S. Army Engineer Waterways
Experiment Station, Vicksburg, MS.
[9]. Jung, T.H. and Suh, K.D. (2008). “An Analytical Solution to the Extended Mild-Slope
Equation for Long Waves Propagation Over an Axi-Symmetric Pit”. Wave Motion, Vol. 45,
pp 835-845.
[10].Li, B. and Anastasiou, K. (1992). “Efficient Elliptic Solvers for The Mild-Slope Equation
Using The Multigrid Technique”. Coastal Engineering, Vol. 16, pp 245-266.
[11].Mobarek, I.E. (1972). “The Nile Delta Coastal Protection Project”. 13th Coastal Engineering
Conf., Vol. 2, pp 1409-1426.
[12].MuirWood, A.M. (1968). “Coastal Hydraulics”. Macmillan and Co, LTD, London.
[13].Sarhan, Th. (2007). “Design of Ras EL-Bar Bay”. Shore Protection Authority.
[14].Zhao, L., Vijay, Panchang, Chen, W., Demirbilek, Z. and Chhabbra, N. (2001). “Simulation
of Wave Breaking Effects in Two-Dimensional Elliptic Harbor Wave Models”. Coastal
Engineering, Vol. 42, pp 359-373.
NOTATION & ABBREVIATIONS:
NOTATION:
The following symbols are used in this paper
a = wave amplitude.
C = phase velocity.
Cg = group velocity.
d = water depth.
ET = total wave energy dissipation.
g = gravitational acceleration.
H = wave height.
Ha = wave height after construction.
Hb = wave height before construction.
ƒr = friction coefficient.
k = wave number.
L = wave length.
n = Manning coefficient.
P = water power.
RL = relative wave energy dissipation.
R2 = determination coefficient.
w = damping factor.

International Water Technology Journal Vol. 2 – No. 4, Dec. 2012
283
X = offshore distance (m).
Greek Letters:
Γ = empirical constant.
γ = breaking Index.
λ = wave steepness.
σ = wave frequency.
ϕ = surface elevation function.
χ = constant.
ω = friction factor.
ABBREVIATIONS:
BW = BreakWater.
H.H.W.L = Highest High Water Level.
L.L.W.L =Lowest Low Water Level.
M.H.W.L = Mean High Water Level.
M.L.W.L = Mean Low Water Level.
M. W.L = Mean Water Level.