effect of carbon in brake friction materials on friction...
TRANSCRIPT

Journal of Engineering Science, Vol. 14, 47–59, 2018
© Penerbit Universiti Sains Malaysia, 2018. This work is licensed under the terms of the Creative Commons Attribution (CC BY) (http://creativecommons.org/licenses/by/4.0/).
Effect of Carbon in Brake Friction Materials on Friction Characteristics
Talib Ria Jaafar1*, Aznifa Mahyam Zaharudin1, Arif Pahmi1, Ramlan Kasiran2 and Eliasidi Abu Othman3
1Faculty of Mechanical Engineering, UiTM Cawangan Pulau Pinang, 13500 Permatang Pauh, Pulau Pinang, Malaysia
2Fakulti Kejuruteraan Mekanikal, Universiti Teknologi MARA, 40000 Shah Alam, Selangor, Malaysia
3Advanced Materials Research Centre, SIRIM Berhad, 34 Jalan Hi-Tech 2/3, Kulim Hi-Tech Park, 09000 Kulim, Kedah, Malaysia
*Corresponding author: [email protected]
Published online: 15 April 2018To cite this article: Talib Ria Jaafar, Aznifa Mahyam Zaharudin, Arif Pahmi, Ramlan Kasiran and Eliasidi Abu Othman. (2018). Effect of carbon in brake friction materials on friction characteristics. Journal of Engineering Science, 14: 47–59, https://doi.org/10.21315/jes2018.14.4.To link to this article: https://doi.org/10.21315/jes2018.14.4
Abstract: Brake friction materials composed of eight to 20 ingredients in the formulation. Each ingredient has its own function in producing the stable coefficient of friction (COF) and acceptable wear rate. The goal of this work is to study the effect of different carbon volume percentage (vol. %) on the friction characteristics. Three samples were prepared through powder metalurgy process by varying the carbon vol. %. Each sample was subjected to specific gravity, porosity, hardness, chase friction and brake inertia dynamometer tests in accordance with international test procedures. All the entire three samples are sensitive to speed and temperature. COF increased in the early stage of braking. Upon reaching the degradation temperature of polymeric materials, the COF decreased gradually with increasing speed and temperature. The pad thickness loss and rotor roughness decreased with increasing vol. % of carbon in the formulation. Sample B is the best formulation based on the friction characteristics and pad thickness loss. Formulation of sample C is rejected due to lower COF even though has the lowest pad thickness loss. Sample A and sample B will be further analysed and evaluated on-road and reliability performance before can be commercialised and used on the road.
Keywords: Brake friction materials, carbon, COF, speed, temperature sensitivity

Carbon in Brake Friction Materials 48
1. INTRODUCTION
The braking system is one of the active safety systems in the motor vehicles. If the brake fail, the result can be disastrous to the vehicle as well as to the users. Brake performance depends on the operating variables, mating members, environment, material characteristics, surface geometry, microstructure, design, type and mechanical properties. Brake friction materials for automotive applications can be categorised into three groups: asbestos, non-asbestos organic (NAO) and semi-metallic. Asbestos based brake friction has been banned by most advanced countries. Asbestos is hazardous to human health which can cause lung cancer, mesothelioma and asbestosis. There is no single material which can replace asbestos properties such wear resistance, strength, rigidity, heat stability and integrity. Non-asbestos friction materials use a blend of different fibres such as aramid, ceramic and glass as replacement for asbestos. Whereas, semi-metallic materials use steel wools and porous iron powder as the main constituent and composed of by 60% steel by weight in the composition. A semi-metallic brake pad is capable to provide stable friction coefficient at higher temperature, low wear, less squeal, dissipate heat to the surrounding, and higher energy absorption.
Friction materials composed of four main constituents: reinforce fibre, binder, friction modifier and fillers.1 The fibre is used to provide the necessary rigidity, strength, integrity and thermal stability at high temperatures. Resins act as a binder and hold the compositions together. Too much resin leads to thermal instability which may reduce the coefficient of friction. If it is too low, it results in less binding of the ingredients which may increase the wear rate and produce non-uniform dispersion of the ingredients in the composition. Different types of resin will affect the COF and wear characteristics of brake friction materials.2–5 The weight percentage of phenolic would influence the hardness, specific gravity and tribological characteristics of semi-metallic brake friction materials.6 Reinforce fibre is responsible for providing the strength, and rigidity. Ho et al. concluded that addition of reinforce fibre improves the COF and reduces wear rate of the friction material formulation.7
Friction modifiers are added into the formulation for purpose of lowering or increasing the friction levels such as metal powders and graphite, and for cleaning of the counter friction surface such brass, zinc and SiO2. Whereas fillers such as clay and calcium carbonate are used to fill up the space and to reduce the overall cost due to low cost minerals. Graphite is able to generate a solid lubricant layer on opposing mating surface, thus stabilise COF during braking over given ranges of temperature. Too much carbon in the composition will reduce the bonding between carbon and phenolic resins, leading to a low shearing strength which could result higher wear rate.8
Journal of Engineering Science, Vol. 14, 47–59, 2018 49
Wear is more complicated than friction because it involves: plastic deformation plus localised fracture event,9 chemical changes10 and microstructural changes11. The wear process in dry sliding contacts could be summarised as follows: (1) particle detachment from the contact material surface due to formation of plastic deformation, (2) material transfers to the opposite mating surface12, (3) elimination of wear fragments from the interfacial contact zone as the wear debris.13 Wear rate of brake friction material increases linearly until the degradation temperature of 230°C and thereafter increase exponentially as observed elsewhere.9,13,14
Kinetic energy is converted into thermal energy during braking process. The brake pads and brake disc absorbs the accumulated heat which lead high surface temperatures of the brake materials and the brake disc. Braking can cause a temperature to increase up to 500°C.15 The polymeric materials start to degrade at the temperature of 230°C and the degree of degradation increases with temperature within the range of 269°C–400°C.14 The degradation of the polymer materials cause brake fade phenomena where the coefficient of friction reduced with increasing surface temperature.16 The high temperature decreases the yield strength and leads to changes in the wear mechanism and the real contact configuration.17 These phenomena could increase the wear rate of the brake friction materials. This study was focused on the effect of different vol. % of carbon the composition on the physical, mechanical, tribological properties and braking performance. The effects of different vol. % of carbon on the pressure, surface temperature and speed sensitiveness behaviour during braking process will be also discussed in this paper.
2. EXPERIMENTAL
Three brake pads were prepared through powder metallurgy process by varying the volume percentage (vol. %) of the carbon in the composition. The sample were marked as A, B and C, where sample B was set as the base formulation which composed of 14 vol. % of carbon in the composition. The carbon vol. % in sample A was decreased by 50% while that in C was increased by 50% as compared with the base formulation sample B. The composition of the other ingredients in sample A and C were proportionally increased and decreased, respectively according to the base formulation. The elemental compositions of the developed samples are listed in Table 1. The ingredients were mixed in a mixer for 10 min, followed by warm compacting under a pressure of 150 kg/cm2 at a temperature of 190°C in a mold for a Proton Waja passenger car. The compacted brake pads were post-baked at a temperature of 180°C for 4 h. The samples of 25 × 25 × 6 mm were prepared for specific density, porosity and hardness tests. The brake pads for passenger car model Proton Waja 1.6 were prepared for brake inertia dynamometer test. Each
Carbon in Brake Friction Materials 50
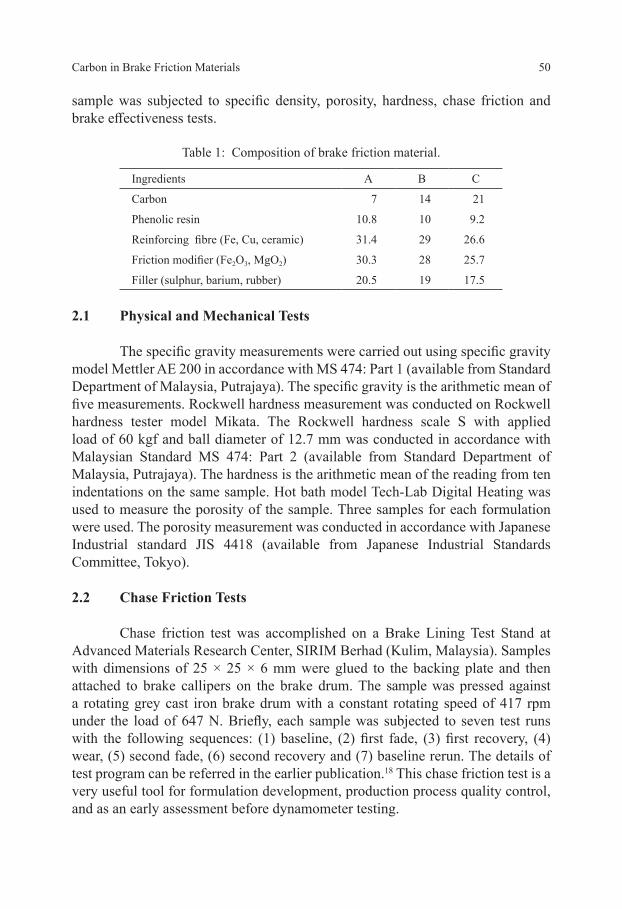
sample was subjected to specific density, porosity, hardness, chase friction and brake effectiveness tests.
Table 1: Composition of brake friction material.
Ingredients A B C
Carbon 7 14 21
Phenolic resin 10.8 10 9.2
Reinforcing fibre (Fe, Cu, ceramic) 31.4 29 26.6
Friction modifier (Fe2O3, MgO2) 30.3 28 25.7
Filler (sulphur, barium, rubber) 20.5 19 17.5
2.1 Physical and Mechanical Tests
The specific gravity measurements were carried out using specific gravity model Mettler AE 200 in accordance with MS 474: Part 1 (available from Standard Department of Malaysia, Putrajaya). The specific gravity is the arithmetic mean of five measurements. Rockwell hardness measurement was conducted on Rockwell hardness tester model Mikata. The Rockwell hardness scale S with applied load of 60 kgf and ball diameter of 12.7 mm was conducted in accordance with Malaysian Standard MS 474: Part 2 (available from Standard Department of Malaysia, Putrajaya). The hardness is the arithmetic mean of the reading from ten indentations on the same sample. Hot bath model Tech-Lab Digital Heating was used to measure the porosity of the sample. Three samples for each formulation were used. The porosity measurement was conducted in accordance with Japanese Industrial standard JIS 4418 (available from Japanese Industrial Standards Committee, Tokyo).
2.2 Chase Friction Tests
Chase friction test was accomplished on a Brake Lining Test Stand at Advanced Materials Research Center, SIRIM Berhad (Kulim, Malaysia). Samples with dimensions of 25 × 25 × 6 mm were glued to the backing plate and then attached to brake callipers on the brake drum. The sample was pressed against a rotating grey cast iron brake drum with a constant rotating speed of 417 rpm under the load of 647 N. Briefly, each sample was subjected to seven test runs with the following sequences: (1) baseline, (2) first fade, (3) first recovery, (4) wear, (5) second fade, (6) second recovery and (7) baseline rerun. The details of test program can be referred in the earlier publication.18 This chase friction test is a very useful tool for formulation development, production process quality control, and as an early assessment before dynamometer testing.

Journal of Engineering Science, Vol. 14, 47–59, 2018 51
2.3 Brake Inertia Dynamometer Test
The dynamometer tests were carried out using a brake inertia dynamometer which simulated the front axle brake system of Proton Waja 1.6. Table 2 shows the vehicle specifications. The dynamometer tests were conducted in accordance with Society of Automotive Engineers SAE J2522 Dynamometer Global Brake Effectiveness test procedures (available form SAE, 400 Commonwealth Dr, Warrendale, PA 15096, USA). Prior to testing, the sample was subjected to 200 conditioning stops before the beginning of performance measurement. Then, the samples were subjected to characteristic, speed-sensitive drags, fade and recovery tests. Each sample was conducted on a new brake rotor. The dynamometer global brake effectiveness tests were conducted at Greening Testing Laboratories Inc. (Detroit, Michigan) using single-end full-scale inertia brake dynamometer. Brake inertia dynamometer test sequences are shown in Appendix A.
Table 2: Test specifications.
Item Specifications
Vehicle system simulated : Proton Waja 1.6 front
Brake configuration : Disc brake
Piston diameter : 54 mm
Rotor diameter × thickness : 236 × 18 mm
Rotor mass : 3.7 kg
Rotor effective radius : 95.88 mm
Axle load : 830 kg
Test inertia : 34.7 kg·m²
Simulated wheel load : 390 kg
Rolling radius : 287.02 mm
Wheel rotation : Right hand
3. RESULTS AND DISCUSSION
3.1 Physical and Mechanical Properties
Physical and mechanical test results are shown in Table 3 and Figure 1. The specific gravity decreased with increasing carbon vol. % in the composition. This phenomenon was due to higher vol. % of carbon the lighter will be the weight of the sample, thus the lower will be the specific gravity. The porosity for all the samples is comparable to each other. This result indicated that the samples are

Carbon in Brake Friction Materials 52
homogeneously mixed. Results of hardness show a decrease of hardness value as increased of carbon vol. % in the composition. Hardness of carbon material is the lowest as compared to the ingredient, thus increased of carbon vol. % in the composition will definitely decreases the hardness of the developed samples. However, there is not much different in porosity readings when the vol. % of carbon were varied due to submicron size of the carbon employed in this study.
Figure 1: Effect of carbon vol. % on specific gravity and hardness.
Table 3: Physical and mechanical test results.
Sample Specific gravity Porosity (%) Hardness (HRS)
A 2.49 15.68 88.53
B 2.31 15.48 73.30
C 1.96 15.61 62.13
3.2 Chase Friction Results
Figure 2 shows that the COF of all samples increases in the early stage of braking process and thereafter decreases after reaching maximum value during second fade run. COF of all developed samples increases with increasing temperature and thereafter decreases after reaching the maximum value. In early stage of braking, the COF increases due the plowing of harder asperities on the real contact area into the sample and enlargement of the contact area.19 After reaching a maximum value, COF decreased with increasing surface temperature due to the phenomena of (1) the degradation of the organic materials,14 (2) shearing of the peak asperities and transition of wear mechanism13 and (3) formation of friction film.20 The first fade result is not discussed because the temperature generated during this braking operation is below 550°F (288°C).

Journal of Engineering Science, Vol. 14, 47–59, 2018 53
Figure 2 shows that sample B which composed of 14 vol. % of carbon exhibited the most stable COF. Sample A and C produced higher COF compared to sample B in the early stage of braking; however had lower COF as the drum temperature increased. Sample C had the COF drastically reduced from 0.33 to 0.21 which could result in longer braking distance. This could cause an accident or the driver needs to apply extra load at the foot pedal to overcome this to situation. Sample C had the highest carbon vol. % in the formulation which in turn generate a solid lubricant layer between the two sliding surfaces, thus reduce the COF.
Figure 2: Effect of carbon vol. % on COF during second fade cycle.
Figure 3 shows the COF behaviours during second recovery cycle. COF of sample B return to their original friction level after cooling which indicates this sample had a good ingredients formulation. It could be noticed COF of sample A and C are not fully recovered to their original positions after cooling. Chase friction test is used for the screening the formulation before deciding could be sent for brake inertia dynamometer test. Based on second fade and recovery results, sample B exhibited the best COF characteristics. However, all the three samples complied with the requirement of Automotive Manufacturer Equipment Companies Agency (AMECA) where the minimum coefficient of friction shall be more than 0.15. Thus, the brake pads for passenger car model Proton Waja 1.6 for the three formulations were prepared for brake inertia dynamometer tests.
3.3 Brake Inertia Dynamometer Test Results
Figure 4 shows that sample A is less sensitive with speed as compared with sample B and C. The COF of the three samples demonstrated the same characteristics where COF slightly increased when the initial raking speed increased to 80–40 km/h, and thereafter decreases with increasing speed. As the

Carbon in Brake Friction Materials 54
braking speed increases, the amount of energy generated and absorbed by the brake components is also increased when brake is applied at higher speed which subsequently increased surface temperature of the brake pads. This phenomenon resulted brake fade where COF decreases with increasing of surface temperature. When the initial braking speed further increased, the other polymeric materials were also decomposed resulting further reduced the bonding among the ingredients. This phenomenon generated three-body rolling contact of wear particles, thus further reduced COF.21 Sample B was found to be the most stable COF whereas sample C produced the lowest COF. Sample C composed of the highest carbon which generate solid lubrication layer and the lowest phenolic resin vol. % which results less resistance to sliding, thus resulting the lowest COF.
Figure 3: COF on second recovery cycle.
Figure 4: COF behaviour with operating speed.

Journal of Engineering Science, Vol. 14, 47–59, 2018 55
The entire three samples with different carbon vol. % show the same COF trends with increasing of surface temperature. It was observed that the COF was increased with increasing temperature in the early stage of braking as shown Figure 5. Subsequently, the COF then decreased when the surface temperature has reached the degradation temperature of 230°C as observed elsewhere.13,14,16 This phenomenon is due to the harder asperities on the brake disc being ploughed into the wear surfaces.19 High surface temperature causes the polymeric materials (phenolic resin, rubber, friction dust) to degrade and the degree of degradation increases with increasing wear surface temperature.14 These phenomena cause the mechanical integrity of formulation become progressively weaker, and thus reducing the COF as the surface temperature increases. Transition of wear mechanism from abrasion to adhesion, shearing of the peak asperities and formation of friction film could also be the reasons.11 Sample C which composed of the highest vol. % of carbon has the lowest COF due to generation of solid lubrication layer between the mating surfaces as the surface temperature increases. Sample A had lowest vol. % of carbon, thus reduces the lubricating effect on the sliding surfaces, thus has higher COF as compared with sample B and C. Sample A has the highest vol. % of reinforcing fiber and friction modifier which increased the sliding resistance between the mating surfaces.
Figure 5: COF behaviours with surface temperature.
3.4 Thickness Loss
Figure 6 shows that the brake pad thickness loss and surface roughness of rotor decreased with increasing vol. % of carbon. Sample C which composed of 21 vol. % carbon has the lowest pad thickness loss and rotor surface roughness. The carbon material in the formulation generates and covers the mating surfaces

Carbon in Brake Friction Materials 56
with solid lubrication layer, thus reduces resistance to sliding and removal of wear particles. Analyses on the brake inertia dynamometer test results, it could be postulated that sample A has the highest COF. Sample A composed the highest volume percentage of iron oxide and magnesium oxide in the formulation which causes the rotor surface becomes rougher. Rougher surface of rotor results in the hard asperities would plough into the brake friction materials producing more wear particles. This phenomenon results an increase of pad thickness loss.
Figure 6: Effect of vol. % of carbon on brake pad thickness loss and surface roughness.
4. CONCLUSIONS
Three samples have been developed through powder metallurgy process by varying the vol. % of carbon in the formulation. The samples subjected to chase friction and brake inertia dynamometer tests. The chase friction tests using a sample size of 25 × 25 × 6 mm was used to screen the formulation during the formulation development. A working prototype brake pad for Proton Waja passenger car was fabricated using formulations that complied with AMECA requirements was subjected to brake inertia dynamometer tests. The selection of the best formulation was determined based on the brake inertia dynamometer test results. Test results show that COF sample C is sensitive to speed and temperature and has the lowest COF due to high vol. % of carbon in the formulation. Lower COF result in longer braking distance and require more applied pedal load for getting shorter braking distance. Sample A and sample B are less sensitive to speed and temperature. Sample B is selected as the best formulation on the basis that it has much lower pad thickness loss as compared with sample A. However, sample A and sample B will be subjected to on-road performance and reliability test to evaluate and validate the formulation under its real life application conditions.

Journal of Engineering Science, Vol. 14, 47–59, 2018 57
The entire three samples illustrate the same trend of friction characteristics with increasing speed and temperature. COF increases with increasing speed and temperature in the early stage of braking and subsequently decreases when the surface temperature has reached the degradation temperature of polymeric materials at 230°C. Increase in COF is due abrasion wear mechanism and enlargement of the contact area. COF begin to decrease at 230°C owning to degradation of phenolic resin, shearing of the peak asperities and formation of lubrication friction film.
5. ACKNOWLEDGEMENTS
This research was supported by Ministry of Science, Technology and Innovation, Malaysia (MOSTI) with Science Fund Grant No. 06-01-01-SF0809. The author would like to thank Universiti Teknologi MARA and SIRIM Berhad for providing research and characterisation facilities.
6. REFERENCES
1. Chan, D. & Stachowiak, G. W. (2004). Review of automotive brake friction materials. Proc. Inst. Mech. Eng., Part D, 218(9), 953–966, https://doi.org/10.1243/0954407041856773.
2. Kim, Y. C. et al. (2008). The effect of phenolic resin, potassium titanate, and CNSL on the tribological properties of brake friction materials. Wear, 264(3–4), 204–210, https://doi.org/10.1016/j.wear.2007.03.004.
3. Cai, P. et al. (2015). Effect of resins on thermal, mechanical and tribological properties of friction materials. Tribol. Int., 87, 1–10, https://doi.org/10.1016/j.triboint.2015.02.007.
4. Bijwe, J., Majumdar, N. & Satapathy, B. K. (2005). Influence of modified phenolic resins on the fade and recovery behavior of friction materials. Wear, 259(7–12), 1068–1078, https://doi.org/10.1016/j.wear.2005.01.011.
5. Cho, M. H. et al. (2005). Effects of ingredients on tribological characteristics of a brake lining: An experimental case study. Wear, 258(11–12), 1682–1687, https://doi.org/10.1016/j.wear.2004.11.021.
6. Zaharudin, A. M., Berhan, M. N. & Talib, R. J. (2011). The effect of phenolic resin, rubber, calcium carbonate and graphite on tribological characteristic of semi-metallic brake. AIP Conference Proceeding, 1400(1), 74–279, https://doi.org/10.1063/1.3663127.
7. Ho, S. C., Lin, J. H. C. & Ju, C. P. (2005). Effect of fiber addition on mechanical and tribological properties of a copper/phenolic-based friction material. Wear, 258(5–6), 861–869, https://doi.org/10.1016/j.wear.2004.09.050.

Carbon in Brake Friction Materials 58
8. Komori, T., Miyake, S. & Senoo, Y. (1990). Brake friction, material. US Pat. 4954536, United States Patent and Trademark Office.
9. Rigney, D. A. (1997). Comments on sliding of metals. Tribol. Int., 30(5), 361–367, https://doi.org/10.1016/S0924-0136(03)00769-6.
10. Jacko, M. G. (1977). Physical and chemical changes of organic disc pad. In Glaeser, W. A. et al. (eds.), Wear of materials. New York: American Society of Mechanical Engineers, 541–546
11. Talib, R. J., Muchtar, A. & Azhari, C. H. (2003). Microstructural characteristics on the surface and subsurface of semi-metallic automotive friction materials during braking process. J. Mater. Process. Technol., 140(1–3), 694–699, https://doi.org/10.1016/S0924-0136(03)00769-6.
12. Chen, L. H. & Rigney, D. A. (1985). Transfer during unlubricated sliding of selected metal systems. Wear, 105(1), 47–61, https://doi.org/10.1016/0043-1648(85)90005-5.
13. Talib, R. J. (1996). Kajian mekanisme haus pad brek. MSc diss., Universiti Kebangsaan Malaysia.
14. Zhigao, X. & Xiaofei, L. (1991). A research for the friction and wear properties of a metal-fiber-reinforced composite material. In Wu, B. (ed.), Mechanical properties materials design: International Symposia Proceedings 1991. Amsterdam: Elsevier Science Publisher, 611–615.
15. Cueva, G. et al. (2003). Wear resistance of cast irons used in brake disc rotors. Wear, 255(7–12), 1256–1260, https://doi.org/10.1016/S0043-1648(03)00146-7.
16. Rhee, S. K. (1971). Wear of material: Reinforced phenolic resins. Wear, 18(6), 471–477, https://doi.org/10.1016/0043-1648(71)90171-2.
17. So, H. (1996). Characteristics of wear results tested by pin-on disc at moderate to high speeds. Tribol. Int., 29(5), 415–423, https://doi.org/10.1016/0301-679X(95)00097-N.
18. Talib, R. J. et al. (2016). On-road braking performances of semi-metallics brake friction materials developed through powder metallurgy process. J. Eng. Sci., 12, 27–41.
19. Tanaka, K., Ueda, S. & Noguchi, N. (1973). Fundamental studies on the brake friction of resin-based friction materials. Wear, 23(3), 349–365, https://doi.org/10.1016/0043-1648(73)90022-7.
20. Talib, R. J. et al. (2007). The performance of semi-metallic friction material for passenger cars. J. Teknol., 46(A), 53–72, https://doi.org/ 10.11113/jt.v46.282.
21. Denape, J. (2014). Third body concept and wear particle behavior in dry friction sliding conditions. Tribological Aspects in Modern Aircraft Industry, 640, 1–12.

Journal of Engineering Science, Vol. 14, 47–59, 2018 59
Appendix
Brake inertia dynamometer test procedures.
Bil. Snub Cycle Speed (km/h) Pressure (kPa) Initial temp.
(°C)Final temp.
(°C)
1. Green μ 30 1 80 to 30 3,000 < 100 Open
2. Burnish 32 6 80 to 30 Varying pressure < 100 Open
3. Characteristic 1 6 1 80 to 30 3,000 < 100 Open
4. Speed/press sensitivity
88888
11111
40 to 580 to 40120 to 80160 to 130200 to 170
Increasing pressure 1,000 to 8,000
< 100 Open
5. Characteristic 2 6 1 80 to 30 3,000 < 100 Open
6. Cold 1 1 40 to 5 3,000 < 40 Open
7. Motorway application 11
11
100 to 50.9 Vmax to 0.5 Vmax
0.6 g < 50 Open
8. Characteristic 3 18 1 80 to 30 3,000 < 100 Open
9. Fade 1 15 1 100 to 5 16,0000.4 g
< 100< 550
–
10. Recovery 1 18 1 80 to 30 3,000 < 100 Open
11. Temperature/presssensitivity 100/80°C
8 1 80 to 30 Increasing pressure 1,000 to 8,000
< 100 Open
12. Temperature/press sensitivity (500/300°C)
9 1 80 to 30 3,000 < 100 550
Pressure line (500/300°C)
8 1 80 to 30 Increasing pressure 1,000 to 8,000
< 550 Open
13. Recovery 2 18 1 80 to 30 3,000 < 100 Open
14. Fade 2 15 1 100 to 5 16,0000.4 g
< 100< 550
–
15. Recovery 3 18 1 80 to 30 3,000 < 100 Open