effect of carbon nano and microfibers on the mechanical properties...
TRANSCRIPT

EFFECT OF CARBON NANO AND MICROFIBERS ON THE MECHANICAL
PROPERTIES AND DURABILITY OF CEMENT PASTES
By
Chantal K. Ince
Thesis
Submitted to the Faculty of the
Graduate School of Vanderbilt University
In partial fulfillment of the requirements
for the degree of
MASTER OF SCIENCE
in
Environmental Engineering
December, 2008
Nashville, Tennessee
Approved:
Dr Florence Sanchez
Dr Andrew Garrabrants

ii
TABLE OF CONTENTS
Page
LIST OF TABLES .......................................................................................................................... iv
LIST OF FIGURES ......................................................................................................................... v
LIST OF ABBREVIATIONS ........................................................................................................ vii
Chapter
1. INTRODUCTION ....................................................................................................................... 1
2. BACKGROUND ......................................................................................................................... 3
3. OBJECTIVES ............................................................................................................................ 14
4. EXPERIMENTAL APPROACH ............................................................................................... 15
5. MATERIALS AND METHODS ............................................................................................... 17
Specimen Preparation .................................................................................................................... 17
Carbon Nanofibers (CNF) .......................................................................................................... 17
Carbon Microfibers (CF) ........................................................................................................... 17
Cement Paste Types ................................................................................................................... 18
Cement Paste Preparation .......................................................................................................... 19
Mechanical Tests ........................................................................................................................... 21
Compressive Strength ................................................................................................................ 21
Splitting Tensile Strength .......................................................................................................... 22
Water Absorption Capacity and Water Porosity ............................................................................ 24
Leaching in DI Water ..................................................................................................................... 25
Accelerated Decalcification Using Ammonium Nitrate (NH4NO3) Solution ................................ 26
Analytical Method (ICP-MS) ........................................................................................................ 28
6. RESULTS AND DISCUSSION ................................................................................................ 30

iii
Mechanical Properties .................................................................................................................... 30
Effect of CNF Loading .............................................................................................................. 30
Effect of Fiber Type (CNF vs. CF) ............................................................................................ 37
Durability ....................................................................................................................................... 42
Water Absorption Capacity and Water Porosity ........................................................................ 43
Kinetics of degradation through leaching .................................................................................. 45
Accelerated Decalcification using NH4NO3 solution ................................................................. 47
Effect of Decalcification on the Mechanical Properties ................................................................ 51
7. CONCLUSIONS ....................................................................................................................... 64
8. FURTHER WORK .................................................................................................................... 65
Appendix ........................................................................................................................................ 66
Compressive Strength Data ........................................................................................................ 66
Splitting Tensile Strength Data .................................................................................................. 77
Leaching with DI Water Data .................................................................................................... 85
REFERENCES .............................................................................................................................. 95

iv
LIST OF TABLES
Table Page
Table 2.1 Typical Chemical Composition of Type I Portland Cement (Cemex, 2008) ................... 4
Table 2.2 Composition and Physical Properties of Silica Fume ...................................................... 9
Table 5.1 Nomenclature of Specimen Types ................................................................................. 19
Table 5.2 Mix Design .................................................................................................................... 20
Table 5.3 MDL and ML of Elements Analyzed by ICP-MS ......................................................... 29
Table 6.1 Effect of CNF loading on the slope of the compressive load displacement curves of PC
and SF pastes prior to failure ................................................................................................. 36
Table 6.2 Effect of fiber type (CNF vs CF) on the slope of the compressive load displacement
curves of PC and SF pastes prior to failure ............................................................................ 42
Table 6.3 Water Porosity ............................................................................................................... 43
Table 6.4 Average % mass loss of the PC and SF cement specimens after NH4NO3 degradation
for 95 days ............................................................................................................................ 50
Table 6.5 Effect of NH4NO3 degradation on the slope of the compressive load displacement
curves of PC pastes prior to failure ........................................................................................ 61
Table 6.6 Effects of NH4NO3 degradation on the slope of the compressive load displacement
curves of SF pastes prior to failure ........................................................................................ 63

v
LIST OF FIGURES
Figure Page
Figure 2.1 (a) and (c) Atomic models of stacked cup and herringbone carbon nanofibers, (b) and
(d) their respective TEM simulated images for atomic model (Kim, 2005) .......................... 11
Figure 5.1 Photograph of compressive strength testing of a specimen .......................................... 22
Figure 5.2 photograph of splitting tensile strength testing of a specimen ..................................... 23
Figure 5.3 Set up for decalcification and DI leaching experiments ............................................... 27
Figure 5.4 Photograph of specimen decalcified by NH4NO3 for 95 days showing the thickness of
the degraded region. ............................................................................................................... 28
Figure 6.1 Effect of CNF loading on the compressive strength of PC pastes at 28 days ............... 31
Figure 6.2 Effect of CNF loading on the compressive strength of SF pastes at 28 days ............... 32
Figure 6.3 Effect of CNF loading on the splitting tensile strength of PC pastes at 28 days .......... 33
Figure 6.4 Effect of CNF loading on the splitting tensile strength of SF pastes at 28 days.......... 34
Figure 6.6 Effect of fiber type (CNF vs. CF) on the compressive strength of A) PC pastes, and B)
SF pastes ................................................................................................................................ 38
Figure 6.7 Effects of fiber type (CNF vs. CF) on the splitting tensile strength of A) PC pastes, and
B) SF pastes ........................................................................................................................... 40
Figure 6.9 Effect of CNF loading on the water absorption capacities of: A) PC pastes at
w/c=0.325, B) PC pastes at w/c=0.435, C) SF pastes at w/c=0.365, and D) SF pastes at
w/c=0.45. ............................................................................................................................... 44
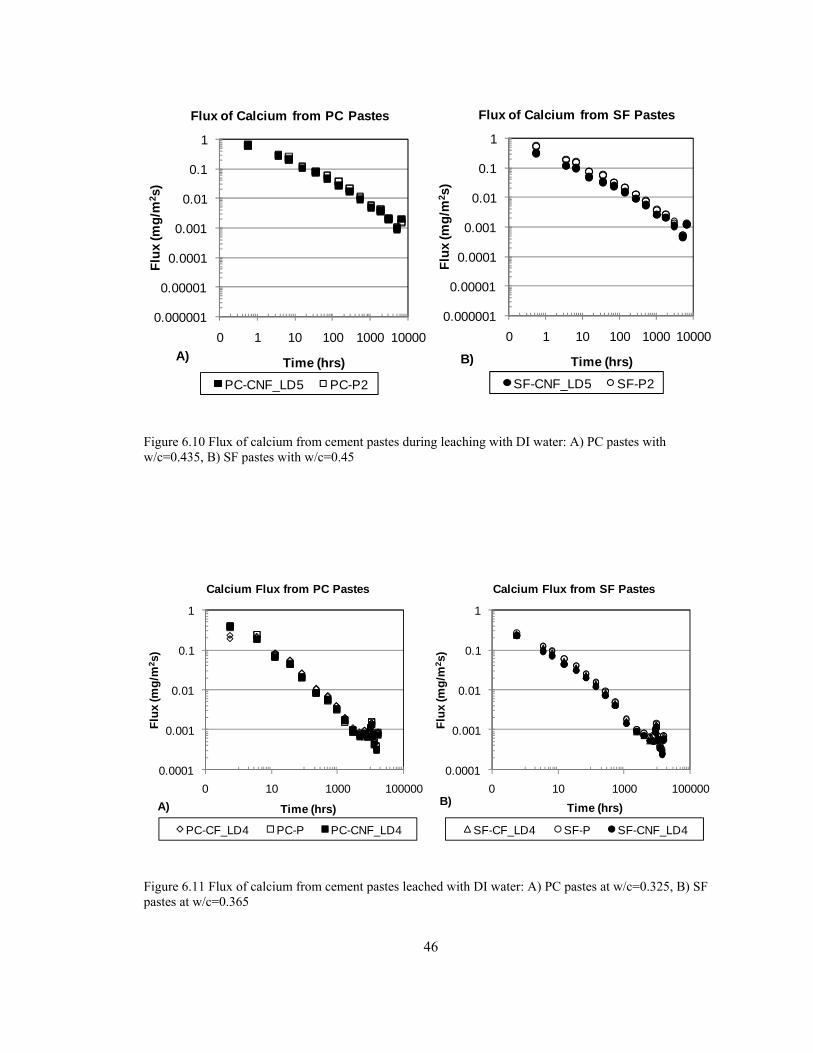
Figure 6.10 Flux of calcium from cement pastes during leaching with DI water: A) PC pastes
with w/c=0.435, B) SF pastes with w/c=0.45 ........................................................................ 46
Figure 6.11 Flux of calcium from cement pastes leached with DI water: A) PC pastes at
w/c=0.325, B) SF pastes at w/c=0.365 .................................................................................. 46

vi
Figure 6.12 Percent mass loss of cement pastes as a function of time during decalcification with
NH4NO3 solution A) PC pastes at w/c=0.325 B) SF pastes at w/c=0.365 ........................... 48
Figure 6.13 Percent mass loss of cement pastes as a function of time during decalcification with
NH4NO3 solution A) PC pastes at w/c=0.435 B) SF pastes at w/c=0.45 ............................. 49
Figure 6.14 Compressive strength of NH4NO3 degraded PC pastes ............................................ 51
Figure 6.15 Effect of CNF on the NH4NO3 degradation of PC pastes: A) 0.5 wt% CNF, B) 2 wt%
CNF ........................................................................................................................................ 53
Figure 6.16 Effect of 0.5 wt % CF reinforcement on the compressive strength of decalcified PC
pastes ...................................................................................................................................... 54
Figure 6.17 Compressive strengths of NH4NO3 degraded SF pastes ............................................. 55
Figure 6.18 Effect of fiber reinforcement on the compressive strength of NH4NO3 degraded SF
pastes 95 day exposure: A) 0.5 wt% CNF, B) 2 wt% CNF ................................................... 57
Figure 6.19 Effects of 0.5 wt % CF reinforcement on the compressive strength of NH4NO3
degraded SF pastes 95 day exposure ..................................................................................... 58
Figure 6.20 Effects of 95 day exposure to NH4NO3 on the compressive load displacement curves
of PC pastes ........................................................................................................................... 60
Figure 6.21 Effect of NH4NO3 degradation on the load displacement curves SF pastes. .............. 62

vii
LIST OF ABBREVIATIONS
ACI- American Concrete Institute
AN- Ammonium Nitrate
ASTM- American Society for Testing and Materials
CF- Carbon Microfibers
CH- Calcium Hydroxide
CNF- Carbon Nanofibers
C3A- Tricalcium Aluminate
C2S- Dicalcium Silicate
C3S- Tricalcium Silicate
CNT- Carbon Nanotubes
C-S-H- Calcium Silicate Hydrate
DI- Deionized
ICP-MS- Inductively Coupled Mass Spectrometer
PAN- Polyacrylonitrile
ML- Minimum limit
MDL- Method detection limit

viii
MWNT- Multi-walled nanotubes
SWNT- Single-walled nanotubes
w/c- Water to cement ratio
wt%- percent by mass of cement

1
CHAPTER I
1. INTRODUCTION
As one of the most popular materials used in the world’s infrastructure it is important that cement
displays exceptional strength and durability because its failure results in high financial costs and
the potential loss of millions of lives. To this end several efforts to improve its properties have
been and continue to be studied and implemented. The use of fiber reinforcements is one such
means (Brandt, 2008); the types of reinforcements currently used include steel, glass (Proctor,
1990), cellulose (Bilba et al., 2003) and carbon fibers (Shigeyuki et al., 1986; Katz et al., 1994;
Ali et al., 1972; Chen et al., 2004). The fibers are used individually or in combination.
The properties of carbon microfibers (CF) such as their size, thermal stability, high strength,
elastic modulus, and apparent chemical inertness make them an especially attractive option. In
fact CF reinforced cement based materials have been shown to have improved tensile and
flexural properties, low drying shrinkage, high specific heat, low thermal conductivity, high
electrical conductivity, high corrosion resistance and weak thermoelectric behavior (Chung,
2000). Technological advancements have led to the development of carbon fibers with better
properties than the CF; these fibers are referred to as carbon nanofibers (CNF) because of their
nanoscale dimensions. CNF are smaller in size, have higher strengths and elastic moduli and
therefore show promise as a reinforcement material in cement. Studies on the use of CNF as
reinforcement in cement are however limited; work has however been done utilizing carbon
nanotubes and has shown mixed results (Markar et al., 2005; Li et al., 2005).

2
This work studies the effects of CNF loading on the mechanical strengths (compressive and
splitting tensile strengths) and durability of cement paste with respect to decalcification; in
addition it compares the effects of CNF to those of CF on these properties. The results presented
here are part of an overall research program on the long term performance and durability of
CNF/CF reinforced cement based materials.
Chapter 2 provides a literature review of cement based materials, CNF and CF. Information is
provided on the chemistry, mechanical properties and durability of cement based materials, and
the properties of pozzolanic additives, CNF and CF and their effects on cement based materials.
Chapter 4 presents the experimental approach and chapter 5 describes the methods and materials
used to assess the properties of different cement pastes. Results and discussion are provided in
chapter 6. Chapter 7 presents the conclusions from this study and chapter 8 provides some
recommendations for future work.

3
CHAPTER II
2. BACKGROUND
This section provides background information on cement based materials, including their
chemistry, mechanical properties and durability. In addition information is provided on the
pozzolanic additives, CNF and CF and their effects on the mechanical properties and durability of
cement pastes.

4
Portland Cement
The typical chemical composition of type I Portland cement is provided in table 2.1.
Table 2.1 Typical Chemical Composition of Type I Portland Cement (Cemex, 2008)
Component Composition (%)
Silicon Dioxide (SiO2) 19.4
Aluminum Oxide (AL2O3) 5.3
Ferric Oxide (Fe2O3) 3.6
Calcium Oxide (CaO) 63.0
Magnesium oxide (MgO) 2.7
Sulfur Trioxide (SO3) 3.0
Loss on Ignition (LOI) 1.5
Insoluble Residue 0.42
Alkalies (Na2O equivalent) 0.48
Tricalcium Silicate (C3S) 60
Dicalcium Silicate (C2S) 10
Tricalcium Aluminate (C3A) 8
Tertracalcium Aluminoferrite (C4AF) 11

5
Portland Cement Hydration Reactions
The hardening of cement paste is due to hydration. The conditions of this hydration play an
integral role in the physical and chemical properties of the hardened paste.
Upon hydration, calcium silicates (C2S and C3S) undergo hydrolysis producing calcium
hydroxide (CH) and calcium silicate hydrates (C-S-H) (E1 and E2). The chemical composition of
the C-S-H varies with the hydration conditions and the age of the cement paste (Soroka, 1979).
2(3CaO.SiO2) + 6H2O 3CaO.2SiO2.3H2O + 3Ca(OH)2 (E1)
2(2CaO.SiO2) + 4H2O 3CaO.2SiO2.3H2O + Ca(OH)2 (E2)
In the presence of gypsum, the hydration of tricalcium aluminate (C3A) produces needle like
crystals of a high sulfate calcium sulfoaluminate called ettringite. This ettringite continues to
form until all the sulfate ions have been removed at which point further hydration of C3A results
in the conversion of the ettringite into a low sulfate sulfoaluminate referred to as monosulfate
(Soroka, 1979).
Initially the ferrite reacts with gypsum and calcium hydroxide to produce needle like crystals of a
solid solution consisting of high sulfate sulfoaluminate and sulfoferrite which upon removal of all
the sulfate ions convert to a low sulfate alumino-ferrite solid solution in which sulfate ions are
replaced by hydroxide ions (E3) (Soroka, 1979).
4CaO.Al2O3.Fe2O3 + CaSO4.2H2O + CH 3CaO(Al2O3,Fe2O3).3CaSO4.aq (E3)
Several factors influence the rate of hydration of cement: age, cement composition, cement
fineness, water to cement (w/c) ratio, temperature and the use of admixtures. The rate of
hydration of the varying cement constituents differs, tricalcium aluminate hydrates fastest
followed by tricalcium silicate and dicalcium silicate (Lea,1935). The hydration rate of cement

6
increases with its fineness. The rate of hydration and the ultimate degree of hydration decrease
with decreasing w/c ratio. The rate of hydration increases with temperature up to 100ºC however
the ultimate degree of hydration is not affected by temperature. Different admixtures can be used
to retard or accelerate the hydration process as necessary, one such admixture is gypsum which
acts as a retarder.
The structure of hardened cement paste is highly heterogeneous consisting mainly of amorphous
C-S-H gel (ca. 70% by mass), CH crystals (ca. 20% by mass), unhydrated cement grains and
voids containing either water or air (Birchall et al., 1978).
Mechanical Properties
The setting and hardening of cement pastes is brought about by the formation of C-S-H gel,
which fills the space between cement grains.
Porosity is one important factor determining the strength of cement paste. Increased porosity
leads to a decrease in the strength of cement paste. Porosity is determined by the w/c ratio and the
degree of hydration. Several experimental methods have been employed in measuring the
porosity of cement pastes, including water saturation method (Kim et al., 2002), water
evaporation (Carde et al., 1999) method, mercury intrusion porosimetry (Care, 2008), and
nitrogen adsorption (Juenger et al., 2001).
Typically the strengths of cement based materials are determined by measuring their
compressive (Shigeyuki et al., 1986), splitting tensile, (Houssam et al.,1994), and flexural
strengths (Houssam et al., 1994).
Durability
The durability of a cement paste can be described as its ability to resist chemical attack. This
chemical attack can result in dissolution and leaching or chemical transformations. Porosity is a

7
major factor influencing the ability of a cement paste to resist chemical attack. The larger the
porosity of the paste the more it allows the chemical attack agent to penetrate and degrade the
paste. The intensity of the attack is also influenced by the specific chemical agent.
Cementitious materials are subjected to several forms of chemical attack in the environment. The
main forms of environmental chemical attack are dissolution and leaching in water, acid attack,
sulfate attack, and sea water attack. In the case of dissolution and leaching in water, CH present in
the cement paste dissolves into the water forming an alkaline solution, this alkaline solution
dissolves calcium hydrates present in the paste (Soroka, 1979). This process continues with time
until all the CH is leached out as long as a continuous supply of fresh water is still available. Acid
attack also dissolves cement paste. The naturally occurring acids which typically attack
cementitious materials are carbonic, humic, and sulfuric acids. During acid attack, the acid reacts
with the calcium hydrates to form salts. During sulfate attack the sulfates react with hydrated
calcium aluminate to form ettringite resulting in an increase in volume and cracking of the
cementitious matrix. In addition some sulfates react with CH to form gypsum (Baghabra Al-
Amoudi, 2002). The intensity of the sulfate attack is affected by the cement type, the sulfate type,
the sulfate concentration, and the quality of the cementitious material. Some of the salts present in
sea water contribute to the chemical attack of cementitious materials. The magnesium chloride
present in sea water reacts with CH to produce Mg(OH)2 and CaCl2. The sulfates present in sea
water also contribute to sulfate attack of cementitious materials (Soroka, 1979).
Most of the environmental chemical attacks on cement result in the leaching of the calcium from
the cement paste.
Leaching studies are therefore a good indicator of the durability of cement paste (Carde et al,
1997) and help to characterize the kinetics involved in the degradation of the material.

8
Pozzolanic Additives and Reinforcements
Pozzolanic Additives and Silica fume
Pozzolans are very common additives to cement pastes because they improve the strength and
durability of cement. The American Concrete Institute (ACI) defines a pozzolan as a siliceous or
siliceous and aluminous material which in itself possesses little or no cementitious value but will,
in finely divided form and in the presence of moisture react with calcium hydroxide to form
compounds possessing cementitious properties (ACI Committe 116R, 1997). Silica fume is a
highly reactive pozzolans used in making high strength concrete; it reacts with calcium hydroxide
to produce a C-S-H gel, thereby increasing the C-S-H content of the cement paste. This increase
in C-S-H gel leads to a decrease in the paste porosity (Feldman et al., 1985). There are several
other popular pozzolans including fly ash, natural Pozzolans, and ground granulated blast furnace
slag (Kulaa et al., 2001). These Pozzolans are used either individually or in combination.
Silica fume also known as microsilica or fumed silica are small spherical produced as a byproduct
of the reduction of high purity quartz and coke in an electric arc furnace to produce silicon metal
or ferrosilicon alloys (Silica Fume Association, 2008). The small size high surface area and high
SiO2 content makes silica fume a pozzolan when combined with Portland cement (Silica Fume
Association, 2008). Table 2.2 lists the composition and some of the physical properties of silica
fume (Jiuzhou Silicon Industries Ltd, 2008).

9
Table 2.2 Composition and Physical Properties of Silica Fume
Component Composition (%)
SiO2 94.7
Al2O3 0.15
Fe2O3 0.096
CaO 0.088
MgO 0.15
K2O 0.91
Na2O 0.16
Total Sulfur 0.50
Total Carbon 1.38
Ignition Loss 2.35
Water 0.75
Surface Area Approx. 20000m2/kg
Density Approx. 200kg/m3 (undensified) Approx. 400-600 kg/m3 (densified)
Carbon Microfibers
Carbon microfibers (CF) are manufactured from pitch fibers or polymer fibers e.g.
polyacrylonitrile (PAN), in either a continuous or short form. CF made from pitch are more
graphitizable than those made from polymers and therefore have higher thermal conductivities
and lower electrical resistivity. CF made from polymers are more widely used because they are
cheaper and have better mechanical properties (Chung, 1994).
The CF are manufactured by the pyrolysis of the pitch or polymer. The PAN fibers are heated
until they are turned into oxidized polyacrylonitrile fibers (OPF). The OPF is carbonized by
heating progressively to higher temperatures in a nitrogen filled chamber. The final carbonization

10
occurs at temperatures greater than 1000ºC in order to establish strength, stiffness, electrical, and
other properties (Toho Tenax America Inc, 2007). In addition, the CF are coated with a polymer
in order to improve their handling characteristics and wettability (Toho Tenax America Inc,
2007).
The properties of CF are determined by their structure which is in turn determined by the
production conditions. The most influencing structural features are the degree of crystallinity, the
interlayer spacing, the crystallite sizes, the preferred orientation of the carbon layers, parallel and
perpendicular to the fiber axis, the transverse and longitudinal radii of curvature of the carbon
layers, the domain structure, and the volume fraction, shape and orientation of microvoids
(Chung, 1994).
Carbon microfibers have been shown to be effective reinforcement in several matrices including
polymers (Patton et al., 2002), metals (Lin et al., 1991), and carbons (Wang, et al., 2009).
Carbon Nanofibers
Carbon nanofibers (CNF) can be broadly defined as tubular structures with the side walls
composed of angled graphitic sheets. These graphitic sheets can be arranged in various
orientations producing nanofibers of various morphologies. These orientations as we will see later
are determined by the conditions under which the carbon nanofibers are grown, the two main
morphologies being the “herringbone (fishbone)” and the “stacked cup” (figure 2.1).

11
Figure 2.1 (a) and (c) Atomic models of stacked cup and herringbone carbon nanofibers, (b) and (d) their respective TEM simulated images for atomic model (Kim, 2005)
Several methods have been employed for the production of CNF. The two main methods used to
produce CNF are (1) the pyrolyzing of fibers spun from an organic precursor and (2) chemical
vapor deposition (CVD). In the earlier, typically fibers are produced by pyrolyzing electrospun
nanofibers from polyacrylonitrile or pitch (Zussman et al., 2005). These CNF typically have
diameters ranging from a few hundred nanometers to several micrometers.
Vapor grown CNF are the most popular CNF used in research because of the ability to produce
them in bulk in a cost effective manner. Vapor grown CNF are produced by decomposing a
hydrocarbon gas in the presence of hydrogen over a metal catalyst. The hydrocarbon gas is fed
into the chamber containing the metal catalyst, which has been activated usually by a sulfur
containing compound, which is maintained at a high temperature (greater than 1100˚C), under
these conditions the nanofibers filaments are grown with a diameter of about 10nm. Growth stops

12
when the catalyst is deactivated. The filaments are then usually thickened by chemical vapor
deposition of carbon.
The growth of the CNF is influenced by many factors including but not limited to the type of
metal catalyst (Chambers et al., 1995; Rodriguez et al., 1995), the hydrogen source gas, the
presence of additives (Kim et al., 1993), reaction temperature and reaction time.
Because of their interesting mechanical, thermal and electrical properties CNF are deemed to
have great potential for composite applications. The tendency of the CNF to form millimeter
sized clumps, however, poses problems in dispersion and therefore difficulties in composite
preparation. One of the key features of CNF, which facilitate their use in composites, is the
presence of many edges that can serve as sites for chemical and physical interactions.
Carbon Microfiber/Nanofiber Reinforced Cement-based Materials
CF have been found to have the following effects on the properties of cement based materials:
increased flexural strength (Houssam at al., 1994), increased tensile strength (Ali et al., 1972),
increased modulus of elasticity (Ali et al., 1972), increased air content (Pu-Woei Chen, 1993),
improved freeze-thaw durability (Chen et al., 1993), decreased drying shrinkage (Chung et al.,
1996), and decreased electrical resistivity (Chen et al, 2004).
In contrast, studies of CNF-cement composites are very limited; only a few studies have been
conducted on carbon nanotubes (CNT)-cement composites and few baseline property
measurements have been reported with mixed results. The incorporation of acid treated CNT into
cement has been found to enhance the flexural and compressive strengths, failure strain and to
decrease the porosity of cement (Li et al., 2005). In addition, CNT have been shown to bridge
cracks and accelerate the hydration of cement (Markar et al., 2005). The structural similarities

13
between CNF and CNT, lower cost of CNF and some of the positive results of CNT-cement
composite studies make the potential of CNF as reinforcements in cement very promising.

14
CHAPTER III
3. OBJECTIVES
This study investigated the effects of carbon nanofiber loadings and carbon fiber type (carbon
nanofibers vs. carbon microfibers) on the mechanical performance and durability with respect to
leaching of cement pastes.
More specifically, the objectives were to assess the cement paste performance and durability
based on the following properties and characteristics: compressive strength, splitting tensile
strength, water absorption capacity/ water porosity, calcium leachability in DI water and mass
loss during accelerated decalcification.

15
CHAPTER IV
4. EXPERIMENTAL APPROACH
This study investigated the effects of carbon fiber type and carbon nanofiber loading on the
mechanical properties (compressive and splitting tensile strengths) and durability with respect to
leaching of cement pastes.
Two different types of cement pastes were used to prepare cylindrical specimens (2x4 in). The
first type of cement paste was Portland cement paste (PC), and the second type of cement paste
was Portland cement with 10 wt% silica fume (SF). SF was added because it is an effective
pozzolans. It reacts with the calcium hydroxide in hydrated cement paste to produce calcium
silicate hydrate gel (C-S-H). The decrease calcium hydroxide and increased C-S-H gel imply a
higher strength and lower porosity (Yajun et al., 2003). Each of the cement pastes were prepared
with two water to cement ratios (w/c) in order to ensure adequate hydration of the cement. The
PC pastes were prepared with a w/c of 0.325 and 0.435 and SF pastes were prepared with w/c of
0.365 and 0.45.
Two types of carbon fibers were used. Carbon microfibers (CF) with diameters of 6 to 7µm and
lengths of 3mm and carbon nanofibers (CNF) with diameters of 100-200 nm and lengths of 30 to
100µm.
Specimens were prepared with different carbon fiber loadings. PC pastes with w/c=0.325 were
prepared with fiber loadings of 0, 0.005, 0.02, 0.05, and 0.5 wt% CNF , and 0.5 wt% CF. PC

16
pastes with w/c=0.435 were prepared with CNF loadings of 0 and 2 wt% CNF. SF pastes with
w/c=0.365 were prepared with fiber loadings of 0, 0.005, 0.02, 0.05, and 0.5 wt% CNF , and 0.5
wt% CF. SF pastes with w/c=0.45 were prepared with CNF loadings of 0 and 2 wt% CNF.
A total of 16 paste types were studied. The mechanical properties were characterized by the
compressive strength, splitting tensile strength, and compressive load displacement curves. The
paste durability was characterized by the mass loss, compressive strength, and splitting tensile
strength losses due to accelerated decalcification, water porosity, and the leachability by DI
water.
PC and SF pastes with fiber loadings of 0, 0.5, and 2wt% were subjected to DI leaching and
accelerated decalcification. The accelerated decalcification was performed by immersing the
pastes in 7M ammonium nitrate solution for ca. 95 days.
The compressive and splitting tensile strength tests were performed on up to 15 replicates of each
paste type at an age of 28 days and the decalcified specimens after they had been immersed in the
ammonium nitrate solution for ca. 95 days.
The water porosities for PC and SF pastes with 5 different CNF loadings; 0, 0.005, 0.02, 0.05,
0.5 and 2 wt% were determined by immersion in DI water. Exposure to DI leaching for up to 3
months was performed on PC and SF pastes with CNF loadings of 0, 0.5, and 2 wt% and CF
loadings of 0.5%.

17
CHAPTER V
5. MATERIALS AND METHODS
This section covers specimen preparation, the specimen mechanical testing, the specimen
decalcification, and characterization methods.
Specimen Preparation
Two carbon fiber types were used in this study: carbon nanofibers (CNF) and carbon microfibers
(CF).
Carbon Nanofibers (CNF)
The CNF used were vapor grown Pyrograf III PR-19 LHT obtained from Applied Sciences Inc.
(Cedarville, OH). The as grown fibers contain chemically vapor deposited carbon which was
graphitized in the subsequent heat treatment at temperatures of up to 3000˚C. The fiber diameters
ranged from 100 to 200nm and the lengths ranged from 30 to 100 µm. Due to the size of the CNF
it is not possible to directly measure many of the properties by conventional methods. The
following properties have been estimated by the manufacturer: tensile strength of 7GPa, a tensile
modulus of 600GPa, a density of 1.95g/cm3, and an electric resistivity of 55µΩ-cm (Applied
Sciences Inc., 2001).
Carbon Microfibers (CF)
The CF used were carbon fibers Product 150 obtained from Toho Tenax America Inc.
(Rockwood, TN). The fiber length was 3mm and the diameter ranged from 6-7µm. The CF were

18
produced using a polyacrylonitrile (PAN) fiber precursor. The precursor was exposed to heated
air to turn it into oxidized PAN fibers, which were carbonized into carbon fibers by exposing
them to progressively higher temperatures in a nitrogen-filled chamber. These fibers were coated
with a polymer to promote fiber handling characteristics, wet out, and bonding (Toho Tenax
America Inc). The CF have been found to have a tensile strength greater than 3450MPa, a tensile
modulus greater than 207GPa, a density of 1.8g/cm3, and an electric resistivity of 1670µΩ-cm
(Toho Tenax America Inc, 2007).
Cement Paste Types
Five loadings of CNF and one loading of CF were investigated in Portland cement pastes with
and without silica fume. Commercial grade type I/II Portland cement and microsilica grade 970 D
densified silica fume obtained from Elkem Materials were used.
Plain Portland cement (PC) pastes were prepared with two water to cement ratios (w/c): 0.325
and 0.435. PC pastes with four CNF loadings; 0.005, 0.02, 0.05, 0.50 wt %, denoted LD1-LD4
and one CF loading 0.50 wt % were prepared with a w/c ratio of 0.325. A PC paste with a CNF
loading, of 2 wt% (LD5) with a w/c of 0.435 was also prepared. The SF pastes contain 10 wt%
silica fume. SF pastes were prepared with two water to cement ratios (w/c): 0.325 and 0.435. SF
pastes with four CNF loadings; 0.005, 0.02, 0.05, 0.50 wt %, denoted LD1-LD4 and one CF
loading 0.50 wt % were prepared with a w/c ratio of 0.365. A SF paste with a CNF loading, of 2
wt% (LD5) with a w/c of 0.45 was also prepared. Baseline pastes of each type containing no
fibers at each w/c; 0.325, 0.365, 0.435, and 0.45 denoted PC-P, SF-P, PC-P2, SF-P2, respectively
were also prepared. The nomenclature of the prepared specimens is summarized in table 5.1.

19
Table 5.1 Nomenclature of Specimen Types
Type of Paste Type of Fiber Fiber Loading (wt %)
PC- Plain Portland Cement P- no fibers LD1 (0.005 wt %)
SF- Silica Fume Portland Cement P2- no fibers LD2 (0.02 wt %)
CNF- carbon nanofibers LD3 (0.05 wt %)
CF- carbon microfibers LD4 (0.50 wt %)
LD5 (2 wt%)
Cement Paste Preparation
The dry materials were placed in the mixing bowl of a Univex SRM 30+ electric mixer and
mixed at low speed for about 6 minutes. The deionized water (DI) was added to the dry mix and it
was mixed at high speed for 6 minutes. The pastes were cast in cylindrical molds of diameter 2”
and length 4”. The molds were covered and allowed to cure for a minimum of 28 days at 100%
relative humidity in a Curamold concrete test cylinder curing box before further use. Several
batches of each mix were prepared as necessary. The mix design is summarized in table 5.2.

20
Table 5.2 Mix Design
Paste Type w/c Specimen Type CNF (wt %) CF (wt %)
PC 0.325 PC-P 0 0
PC-CNF_LD1 0.005 0
PC-CNF_LD2 0.02 0
PC-CNF_LD3 0.05 0
PC-CNF_LD4 0.50 0
PC-CF_LD4 0 0.50
0.435 PC-P2 0 0
PC-CNF_LD5 2 0
SF 0.365 SF-P 0 0
SF-CNF_LD1 0.005 0
SF-CNF_LD2 0.02 0
SF-CNF_LD3 0.05 0
SF-CNF_LD4 0.50 0
SF-CF_LD4 0 0.50
0.45 SF-P2 0 0
SF-CNF_LD5 2 0
21
Mechanical Tests
Two mechanical properties were measured, compressive strength and splitting tensile strength.
All tests were performed using a Super L hydraulic materials testing machine produced by Tinius
Olsen Inc. (Willow Grove, PA). The mechanical properties of all specimen types at an age of 28
days and specimens that had been decalcified by NH4NO3 solution for 95 days were measured.
Compressive Strength
The compressive strength tests were performed according to ASTM C 39 (ASTM International,
2005). Compressive strength tests were performed on up to 15 replicates of each specimen type.
Specimens with an age of 28 days were removed from the curing chamber and demolded just
prior to testing. Decalcified specimens were placed in deionized water after 95 days of
decalcification and removed from the DI just prior to testing. Specimens were tested while they
were in a moist condition. The diameter of each specimen was measured at the top, middle and
bottom of the specimen and averaged. Three length measurements were also taken and averaged.
Each specimen was centered in the testing machine as shown in figure 5.1 and loaded at a
position rate of 0.2 in/min (5.082 mm/min) until a load of 100lbf (0.4448kN) was reached then
loaded at a position rate of 0.012in/min (0.306 mm/min) until failure. The compressive strength
of each specimen was computed by dividing the maximum load to failure by its average cross
sectional area.

22
Figure 5.1 Photograph of compressive strength testing of a specimen
Splitting Tensile Strength
The splitting tensile strength tests were performed according to ASTM C 496-96 (ASTM
International). Splitting tensile strength tests were performed on up to 15 replicates of each
specimen type. 28 day old specimens were removed from the curing chamber and demolded just
prior to testing. Decalcified specimens were placed in DI after 95 days of decalcification and
removed from the DI just prior to testing. Specimens were tested while they were in a moist
condition. The diameter of each specimen was measured at the top, middle and bottom of the
specimen and averaged. Three length measurements were also taken and averaged. Each
specimen was centered in the testing machine as shown in figure 5.2 and loaded at a load rate of
11500lbf/min (51151.8N/min) until a load of 2000lbf (8.896 kN) was reached then loaded at a
position rate such that a load rate of ca. 11500lbf/min (51151.8 N/min) was maintained until

23
failure. The splitting tensile strength of each specimen was computed from the following formula
(E5):
T = (2 x P)/(π x Lx D) (E5)
Where, T = splitting tensile strength, kPa
P = maximum load to failure of specimen, kN
L = average length of specimen, mm
D = average diameter of specimen, mm
Figure 5.2 photograph of splitting tensile strength testing of a specimen

24
Water Absorption Capacity and Water Porosity
The water absorption capacity was determined for PC and SF specimens with CNF loadings of
0.005, 0.02, 0.05, 0.5 and 2% and their corresponding baselines. Two replicates of each specimen
type at a minimum age of 28 days under went water absorption.
The specimens were removed from the curing chamber and demolded. A horizontal slice of about
1 cm thick was cut from the middle of each of the specimens for water absorption to be
performed on. The specimens were dried in an oven at ca. 60ºC and weighed regularly. They
were removed from the oven when their weights reached a constant value to ensure that they were
completely dry. The specimens were then completely immersed in milli q water such that there
was a liquid to surface area ratio of 10cm. The specimens were blotted dry and weighed at
cumulative times of 0.25, 0.50, 0.75, 1.00, 1.30, 2.00, 2.50, 3.50, 5.50, 24.00 and 48.00 hours.
The water absorption capacity method was used to determine the water porosity of the specimens.

25
Leaching in DI Water
DI water leaching was performed on PC and SF specimens with CNF loadings of 0.5 and 2 wt %,
CF loadings of 0.5 wt% and their corresponding baselines. Two replicates of each specimen at a
minimum age of 28 days were used.
The DI leaching was performed according to a modified version of the Mass Transfer Rates in
Monolithic Materials, MT001.1 protocol (Kosson et al., 2002). The specimens were removed
from the curing chamber and demolded just prior to starting the leaching process. The diameters
and lengths of each specimen were measured and recorded. Each specimen was placed in a
separate container on top of a plastic mesh to ensure that the entire surface area was in contact
with the DI water (Figure 5.3). 10mL of DI water was added for every cm2 of specimen surface
area. The leaching solution was exchanged with fresh DI water after each contact period. After
each contact period the pH of the leachate was measured and each specimen was weighed before
being placed in the fresh DI water. In addition, a 125mL sample of the leachate was collected and
vacuum filtered using a 0.45µm pore size membrane and preserved for subsequent chemical
analysis with 2% by volume of the sample of trace metal grade nitric acid (67-70 wt %) obtained
from Fisher Scientific (Fairlawn, NJ). The chemical analysis of the sample leachate was
performed using inductively coupled mass spectrometry (ICP-MS) to determine the
concentrations of the following elements: aluminum, potassium, sodium, calcium, iron, and
silicon.

26
Accelerated Decalcification Using Ammonium Nitrate (NH4NO3) Solution
Pastes were decalcified using NH4NO3 solution. NH4NO3 was chosen as the decalcifying agent
because it increases the calcium solubility. Calcium saturation concentration increases from
0.022mol/L in water to 2.9mol/L in 6M ammonium nitrates solution (Heukamp, Ulm, &
Germaine, 2001). Calcium hydroxide (CH) is leached first followed by calcium silicate hydrate
(C-S-H).
Ca(OH)2 + 2NH4NO3 Ca2+ + 2OH- + 2H+ + 2NH3 + 2NO3- Ca(NO3)2 + 2NH3 (g) + 2H2O (E6)
The effects of decalcification were studied on PC and SF specimens with fiber loadings of 0.5
and 2 wt % and their corresponding baselines. After curing for a minimum of 28 days, nine
replicates of each specimen type were decalcified in a 7M NH4NO3 solution. The specimens were
placed on top of a plastic mesh in a container to ensure that the entire surface area of each
specimen was in contact with the solution (Figure 5.3). The solution was added such that there
was a liquid to surface area ratio of 5cm. The specimens were weighed at regular intervals over a
95 day period, and the pH monitored throughout the decalcification process. At the end of the
degradation period 3 replicates of each specimen type were rinsed with DI water and cut to
remove the ends which are more degraded in order to view the thickness of the degraded region
(Figure 5.4). The other replicates were stored in DI water until further use. The NH4NO3 solution
was renewed for one replicate of each of the specimens with fiber loadings of 0.5 wt % after 70
days.
The effects of accelerated decalcification were demonstrated using compressive strength, splitting
tensile strength, and mass loss.

27
Figure 5.3 Set up for decalcification and DI leaching experiments
Liquid level (DI water or NH4NO3 Solution
Specimen
Plastic mesh

28
Figure 5.4 Photograph of specimen decalcified by NH4NO3 for 95 days showing the thickness of the degraded region.
Analytical Method (ICP-MS)
A Perkin-Elmer ELAN DRC III inductively-coupled mass spectrometer (ICP-MS) was used to
perform chemical analysis of the DI leaching leachate samples.
A 7 point calibration with a blank was performed. The calibration concentrations were 10, 25, 50,
100, 250, and 500µg/L. The correlation coefficients of curve was verified to be at least 0.995. An
initial check standard (ICV) of 50µg/L and an initial check blank of 1% nitric acid were then run.
The analysis of the samples was then performed. Continuous check blank (CCB) and continuous
check verification (CCV) were performed at intervals of 12-20 samples during sample analysis.
Degraded Region
Non-degraded Region

29
The CCB was 1% nitric acid and the CCV was about 50µg/L. A spike analysis per 10-20 samples
was performed. The spike concentration was 500µg/L at 10x dilution. All samples were diluted at
10x. Table 5.3 provides the minimum level (ML) and method detection limit (MDL) for the
elements analyzed.
Table 5.3 MDL and ML of Elements Analyzed by ICP-MS
Element MDL (µg/L) ML (µg/L)
Sodium 0.11 0.20
Potassium 0.19 0.50
Aluminum 0.13 0.20
Silicon 0.19 0.50
Iron 0.16 0.50
Calcium 0.20 0.50
30
CHAPTER VI
6. RESULTS AND DISCUSSION
Mechanical Properties
The effects of CNF loading and fiber type (CNF vs. CF) on the compressive strength, splitting
tensile strength and compressive load displacement curves are discussed in the following
sections.
Effect of CNF Loading
Portland cement pastes (PC pastes) and portland cement pastes with silica fume (SF pastes)
prepared with 6 different CNF loadings (0, 0.005, 0.02, 0.05, 0.5, and 2wt %) were tested.
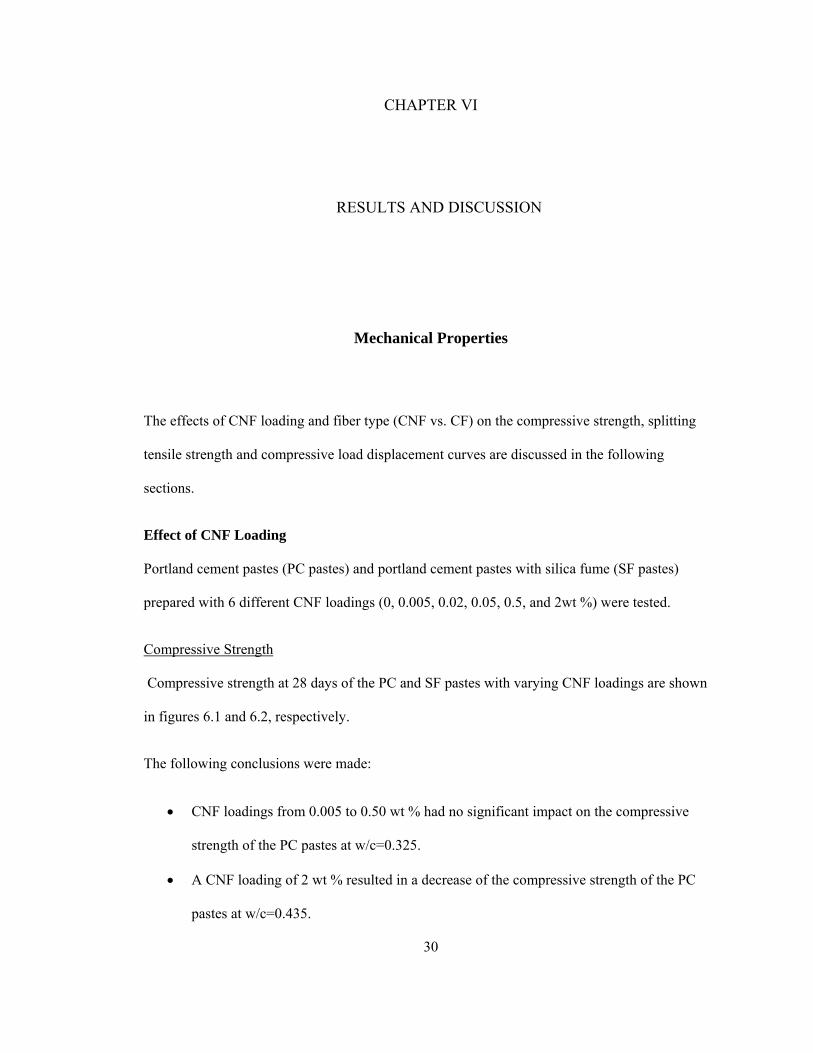
Compressive Strength
Compressive strength at 28 days of the PC and SF pastes with varying CNF loadings are shown
in figures 6.1 and 6.2, respectively.
The following conclusions were made:
• CNF loadings from 0.005 to 0.50 wt % had no significant impact on the compressive
strength of the PC pastes at w/c=0.325.
• A CNF loading of 2 wt % resulted in a decrease of the compressive strength of the PC
pastes at w/c=0.435.

31
• CNF loadings up to 2 wt % had no significant impact on the compressive strength of the
SF pastes.
• The CNF loading had no apparent effect on the variability of the compressive strength
within each specimen type for both pastes.
0
10
20
30
40
50
60
0 0.005 0.02 0.05 0.5 0 2
Com
pres
sive
Stre
ngth
(M
Pa)
CNF Loading (wt %)
minimum
median
maximum
Outliers
P LD1 LD2 LD3 LD4 P2 LD5
w/c =0.325 w/c=0.435
---75th
---25th
---max
---min
PC Pastes PC Pastes
Figure 6.1 Effect of CNF loading on the compressive strength of PC pastes at 28 days
.

32
0
10
20
30
40
50
60
0 0.005 0.02 0.05 0.5 0 2
Com
pres
sive
Str
engt
h (M
Pa)
CNF Loading (wt %)
minimum
median
maximum
Outliers
P LD1 LD2 LD3 LD4 P2 LD5
w/c=0.365 w/c=0.45
---75th
---25th
---max
---min
SF Pastes SF Pastes
Figure 6.2 Effect of CNF loading on the compressive strength of SF pastes at 28 days
Splitting Tensile Strength
Splitting tensile strength at 28 days of the PC and SF pastes with varying CNF loadings are
shown in figure 6.3 and 6.4 respectively:
The following conclusions were made:
• CNF loading of up to 2 wt % had no significant impact on the splitting tensile strength of
the PC and SF pastes.
• CNF loading had no significant effect on the variability of the splitting tensile strength
within each specimen type for both pastes.

33
0
1
2
3
4
5
6
0 0.005 0.02 0.05 0.5 0 2
Split
ting
Tens
ile S
treng
th (M
Pa)
CNF Loading (wt %)
minimum
median
maximum
P LD1 LD2 LD3 LD4 P2 LD5
w/c=0.325 w/c=0.435
---75th
---25th
---max
---min
PC Pastes PC Pastes
Figure 6.3 Effect of CNF loading on the splitting tensile strength of PC pastes at 28 days

34
0
1
2
3
4
5
6
0 0.005 0.02 0.05 0.5 0 2
Split
ting
Tens
ile S
treng
th (M
Pa)
CNF Loading (wt %)
minimum
median
maximum
P LD1 LD2 LD3 LD4 P2 LD5
w/c=0.365 w/c=0.45
--------75th
----25th
---min
---max
SF Pastes SF Pastes
Figure 6.4 Effect of CNF loading on the splitting tensile strength of SF pastes at 28 days

35
Compressive Load Displacement Curves
The load displacement curves for compressive strength tests of PC and SF pastes with various
CNF loadings are shown in figure 6.5. The slopes of the curves prior to failure were studied and
listed in table 6.1.
0102030405060
0 1 2 3 4 5Displacement (mm)
Load
(MPa
)
w/c=0.325
0.05% CNF0.5% CNF
0.02% CNF
0.005% CNF 0% CNF
A)
PC Paste
0
10
20
30
40
50
60
0 1 2 3 4 5
Displacement (mm)
Load
(MP
a)
w/c=0.435
0% CNF
2% CNF
B)
PC Paste
0
10
20
30
40
50
60
0 1 2 3 4 5
Displacement (mm)
Load
(MP
a)
w/c=0.365
0% CNF 0.005% CNF
0.02% CNF0.5% CNF0.05% CNF
C)
SF Paste
0
10
20
30
40
50
60
0 1 2 3 4 5
Displacement (mm)
Load
(MPa
)
w/c=0.45
2% CNF
0% CNF
D)
SF Paste
Figure 6.5 Effect of CNF loading on the compressive load displacement curves of PC and SF pastes A) PC pastes at w/c=0.325, B) PC pastes at w/c=0.435, C) SF pastes at w/c=0.365, and D) SF pastes at w/c=0.45

36
Table 6.1 Effect of CNF loading on the slope of the compressive load displacement curves of PC and SF pastes prior to failure
Slope (MPa/mm)
Paste Type
w/c CNF (wt%)
Mean Standard Deviation
Minimum Median Maximum
PC 0.325 0 27.4 9.6 12.2 23.4 40.6 0.005 32.2 4.9 27.3 30.8 40.0 0.02 30.2 1.9 27.7 30.9 32.3 0.05 35.9 3.8 32.8 35.2 42.4 0.50 34.1 4.8 25.8 33.9 39.6
0.435 0 32.4 10.1 17.0 31.4 47.9 2 19.0 3.5 13.3 17.8 25.2
SF 0.365 0 19.2 7.1 7.7 17.6 31.0 0.005 21.8 2.2 19.4 22.2 24.8 0.02 23.9 3.6 18.1 24.2 27.6 0.05 24.1 3.6 19.0 24.7 28.9 0.50 29.0 6.6 17.0 32.9 35.1
0.45 0 28.0 3.7 21.7 28.5 33.4 2 29.0 4.3 21.0 31.3 32.8
The following conclusions were drawn based on these results:
• For the PC pastes, CNF loadings up to 0.5 wt % had no significant impact on the slopes
of the compressive load displacement curves, which indicated that low CNF loading had
no significant impact on the ductility of the pastes. In contrast, for the 2 wt % CNF
loading a decrease in the slope was observed indicating an increase in the ductility.
• No effect of CNF loading on the load-displacement curves could be observed for the SF
pastes.
Conclusions
CNF loadings up to 0.5 wt % had no significant effect on the compressive strength of the PC
pastes. In contrast CNF loading of 2 wt % resulted in a decrease in the compressive strength of

37
the PC pastes. CNF loadings up to 2 wt % had no significant effect on the compressive strength
of the SF pastes. No effect of CNF loading could be observed on the splitting tensile strength of
both PC and SF pastes. A CNF loading of 2 wt % modified the deformation characteristics of the
PC paste for the sample tested.
Effect of Fiber Type (CNF vs. CF)
In order to determine the effect of fiber type (CNF vs. CF) on the mechanical properties of PC
and SF pastes two types of PC and SF pastes were prepared, one with 0.5 wt% CNF and the other
with 0.5 wt % CF. The effect of fiber type on the compressive strengths, splitting tensile
strengths, and compressive load displacement curves was evaluated.
Compressive Strength
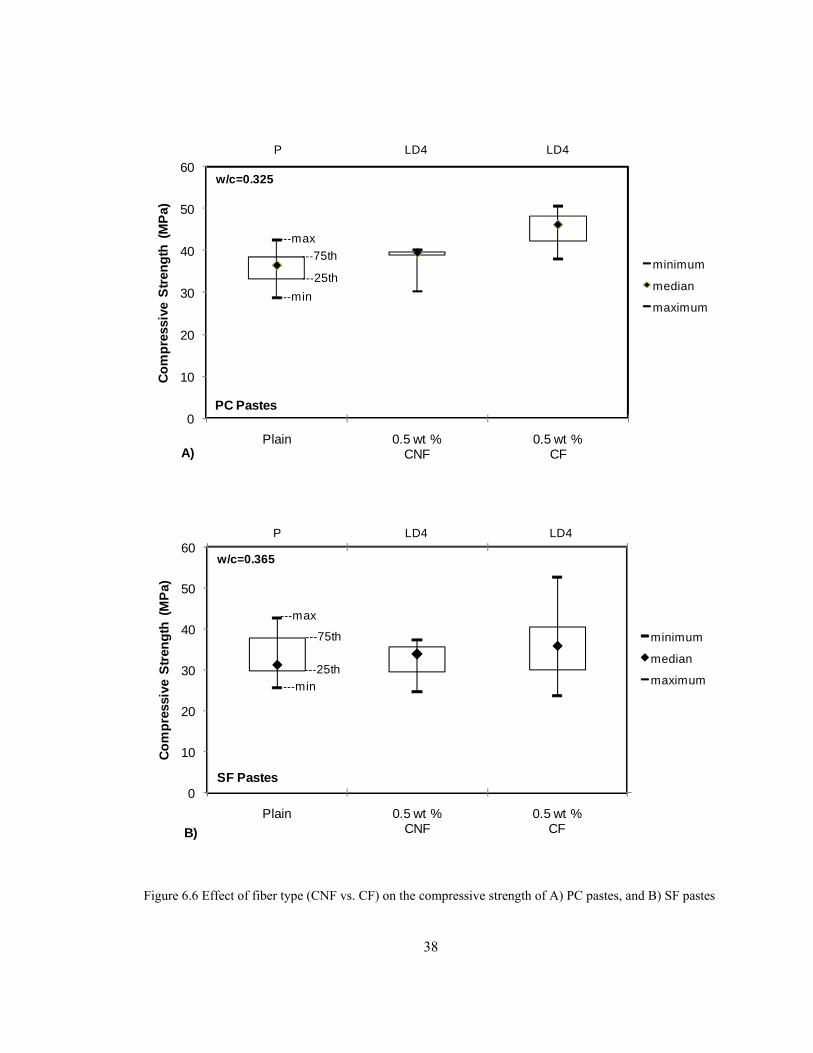
Figure 6.6 (A) shows the results of compressive strength tests on 3 types of PC pastes: PC pastes
with no fibers, PC pastes reinforced with 0.5 wt % CNF and PC pastes reinforced with 0.5 wt %
CF. Figure 6.6 (B) shows the results of compressive strength tests on 3 types of SF pastes: SF
pastes with no fibers, SF pastes reinforced with 0.5 wt % CNF and SF pastes reinforced with 0.5
wt % CF.
38
0
10
20
30
40
50
60
Plain 0.5 wt %CNF
0.5 wt % CF
Com
pres
sive
Stre
ngth
(M
Pa)
minimum
median
maximum
P LD4 LD4
w/c=0.325
---25th
---75th---max
---min
PC Pastes
A)
0
10
20
30
40
50
60
Plain 0.5 wt %CNF
0.5 wt % CF
Com
pres
sive
Str
engt
h (M
Pa)
minimum
median
maximum
P LD4 LD4
w/c=0.365
---75th
---25th
---max
---min
SF Pastes
B)
Figure 6.6 Effect of fiber type (CNF vs. CF) on the compressive strength of A) PC pastes, and B) SF pastes

39
The following conclusions were made:
• 0.5 wt% CNF addition had no significant effect on the compressive strength of the PC
and SF pastes.
• In contrast, 0.5 wt% CF loading resulted in a 21% increase in the median compressive
strength of the PC paste.
Splitting Tensile Strength
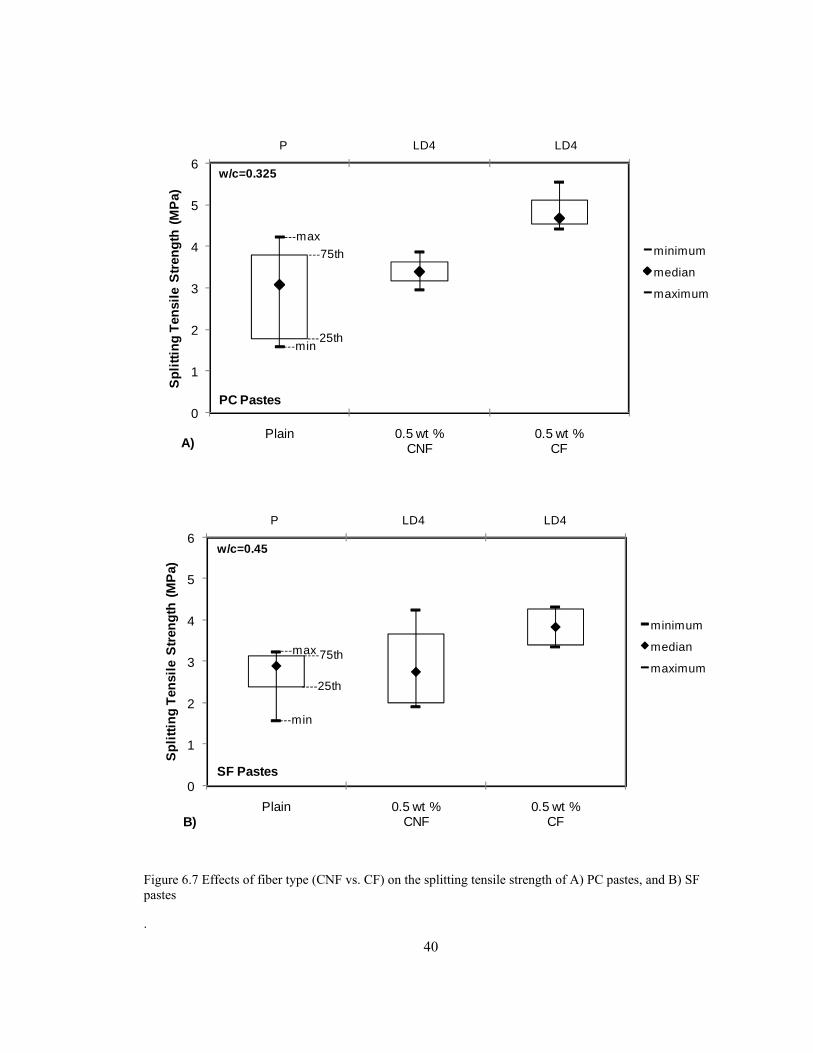
Figure 6.7 (a) shows the results of splitting tensile strength tests on 3 types of PC pastes; PC
pastes with no fibers, PC pastes reinforced with 0.5 wt % CNF, and PC pastes reinforced with 0.5
wt % CF. Figure 6.7 (b) shows the results of splitting tensile strength tests on 3 types of SF
pastes; SF pastes with no fibers, SF pastes reinforced with 0.5 wt % CNF, and SF pastes
reinforced with 0.5 wt % CF.
.
40
0
1
2
3
4
5
6
Plain 0.5 wt %CNF
0.5 wt % CF
Spl
ittin
g Te
nsile
Stre
ngth
(MPa
)
minimum
median
maximum
P LD4 LD4
w/c=0.325
---25th
---max
---min
---75th
PC Pastes
A)
0
1
2
3
4
5
6
Plain 0.5 wt %CNF
0.5 wt % CF
Split
ting
Tens
ile S
tren
gth
(MP
a)
minimum
median
maximum
P LD4 LD4
----75th
----25th
w/c=0.45
---max
---min
SF Pastes
B)
Figure 6.7 Effects of fiber type (CNF vs. CF) on the splitting tensile strength of A) PC pastes, and B) SF pastes
.

41
0
10
20
30
40
50
60
0 1 2 3 4 5
Displacement (mm)
Load
(MP
a)
w/c=0.365
0.5% CF0.5% CNF
Plain CNF/CF
B)
SF Pastes
0
10
20
30
40
50
60
0 1 2 3 4 5
Displacement (mm)
Load
(MP
a)
w/c=0.325
0.5% CF0.5% CNF
Plain
A)
PC Pastes
The following conclusions were drawn based on the results shown in figure 6.7:
• Addition of 0.5 wt% CNF had no significant effect on the splitting tensile strength of
both PC and SF pastes.
• In contrast, addition of 0.5 wt % CF yielded a 52% increase in the median splitting tensile
strength of PC paste and a 32% increase in the median splitting tensile strength of SF
paste.
Compressive Load Displacement Curves
Figure 6.8 (A) shows the compressive load displacement curves of PC pastes with no fibers, PC
pastes reinforced with 0.5 wt % CNF and PC pastes reinforced with 0.5 wt % CF. Figure 6.8 (B)
shows the compressive load displacement curves of SF pastes with no fibers, SF pastes reinforced
with 0.5 wt % CNF and SF pastes reinforced with 0.5 wt % CF. The slopes prior to failure of the
curves are listed in tables 6.2.
Figure 6.8 Effect of fiber type (CNF vs. CF) on the load displacement curves of: a) PC pastes and b) SF pastes.
Figure 6.8 Effect of fiber type (CNF vs. CF) on the load displacement curves of: A) PC pastes and B) SF pastes.

42
Table 6.2 Effect of fiber type (CNF vs CF) on the slope of the compressive load displacement curves of PC and SF pastes prior to failure
Slope (MPa/mm) Paste Type w/c Fiber
Type
Fiber Loading (wt%)
Mean Standard Deviation Minimum Median Maximum
PC 0.325 0 27.4 9.6 12.2 23.4 40.6 CNF 0.50 34.1 4.8 25.8 33.9 39.6 CF 0.50 23.5 6.3 15.0 22.9 35.2
SF 0.365 0 19.2 7.1 7.7 17.6 31.0 CNF 0.50 29.0 6.6 17.0 32.9 35.1 CF 0.50 24.6 7.9 16.6 20.1 37.3
The following conclusions were drawn:
• Addition of with 0.5 wt % CNF and 0.5 wt % CF had no significant effect on the slopes
of the compressive load displacement curves of both PC and SF pastes.
Conclusions
A CF loading of 0.5 wt % yielded a 21% increase in the compressive strengths of PC pastes and
increases in the splitting tensile strengths of PC and SF pastes of 52% and 32% respectively. In
contrast, a CNF loading of 0.5 wt % had no significant effect on the compressive and splitting
tensile strengths of PC and SF pastes. Neither a CNF loading of 0.5 wt % nor a CF loading of 0.5
wt % had a significant effect on the slopes of the compressive load displacement curves of PC
and SF pastes.
.
Durability
The durability of PC and SF pastes with CNF and CF loadings of 0.5 and 2 wt % and their
corresponding baselines was studied by analyzing their leaching kinetics in DI water and the

43
effects of accelerated decalcification by a 7M NH4NO3 solution on their mass loss, their water
absorption capacities, and their compressive strengths.
Water Absorption Capacity and Water Porosity
The results of water absorption tests on PC and SF pastes reinforced with various CNF loadings
are shown in figure 6.11. The water porosity at 48 hours of PC and SF pastes reinforced with
CNF are shown in table 6.3.
The results of the water absorption tests confirmed the known fact that an increase in the water to
cement ratio yields an increase in the porosity of cement pastes (Lea, 1937). Water absorption
tests found that CNF loadings up to 0.5 wt % had no significant effect on the water porosity at 48
hours of the PC and SF pastes. A decrease in the water porosity at 48 hours of the PC and SF
pastes occurred for the higher CNF loading of 2 wt %.
Table 6.3 Water Porosity
Paste Type w/c CNF (wt %)
Average Water
Porosity (%)
Standard Deviation
PC 0.325 0 25.6 0.6 0.005 23.3 1.2 0.02 22.9 0.1 0.05 24.0 0.2 0.50 23.1 0
0.435 0 31.1 0.1 2 27.6 0.5
SF 0.365 0 22.1 0.1 0.005 25.6 0.1 0.02 24.9 0.6 0.05 25.0 0.2 0.50 24.0 0.1
0.45 0 30.6 0.2 2 28.5 0.3

44
0
0.1
0.2
0.3
0.4
0 20 40 60
cm3
Wat
er/c
m3
Spe
cim
en
Cumulative Time (hr)
PC-P A,BPC-CNF_LD1 A,BPC-CNF_LD2 A,BPC-CNF_LD3 A,BPC-CNF_LD4 A,B
A)
0
0.1
0.2
0.3
0.4
0 20 40 60
cm3
Wat
er/c
m3
Spec
imen
Cumulative Time (hr)
PC-P2 A,B PC-CNF_LD5 A,B
B)
0
0.1
0.2
0.3
0.4
0 20 40 60
cm3
Wat
er/c
m3
Spe
cim
en
Cumulative Time (hr)
SF-P A,BSF-CNF_LD1 A,BSF-CNF_LD2 A,BSF-CNF_LD3 A,BSF-CNF_LD4 A,B
C)
0
0.1
0.2
0.3
0.4
0 20 40 60
cm3
Wat
er/c
m3
Spec
imen
Cumulative Time (hr)
SF-P2 A,B SF-CNF_LD5 A,B
D)
Figure 6.9 Effect of CNF loading on the water absorption capacities of: A) PC pastes at w/c=0.325, B) PC pastes at w/c=0.435, C) SF pastes at w/c=0.365, and D) SF pastes at w/c=0.45.

45
The following conclusions were drawn:
• CNF loadings from 0.005 to 0.5 wt % had no significant effect on the water porosity of
PC paste at w/c=0.325.
• A CNF loading of 2 wt % yielded a decrease of about 12% in the water porosity of PC
paste at w/c=0.435.
• CNF loadings from 0.005 to 0.5 wt % had no significant effect on the water porosity of
SF paste at w/c=0.365.
• A CNF loading of 2 wt % yielded a decrease of about 7% in the water porosity of SF
paste at w/c=0.365.
Kinetics of degradation through leaching
The effects of DI leaching on the release flux of calcium from PC and SF pastes reinforced with
0.5 wt % and 2 wt% CNF and 0.5 wt% CF are shown in figure 6.10 and 6.11, respectively. The
following conclusions were drawn:
• A CNF loading of 0.5 wt% and a CF loading of 0.5 wt% had no significant effect on the
flux of calcium from the PC and SF pastes.
• A CNF loading of 2 wt% had no significant effect on the flux of calcium for the PC paste
with w/c=0.435.
• 2 wt% CNF loading slightly decreased the release flux of calcium for the SF paste with
w/c=0.45
46
0.000001
0.00001
0.0001
0.001
0.01
0.1
1
0 1 10 100 1000 10000
Flux
(mg/
m2 s
)
Time (hrs)
Flux of Calcium from PC Pastes
PC-CNF_LD5 PC-P2
A)
0.000001
0.00001
0.0001
0.001
0.01
0.1
1
0 1 10 100 1000 10000
Flux
(mg/
m2 s
)
Time (hrs)
Flux of Calcium from SF Pastes
SF-CNF_LD5 SF-P2
B)
Figure 6.10 Flux of calcium from cement pastes during leaching with DI water: A) PC pastes with w/c=0.435, B) SF pastes with w/c=0.45
0.0001
0.001
0.01
0.1
1
0 10 1000 100000
Flux
(mg/
m2 s
)
Time (hrs)
Calcium Flux from PC Pastes
PC-CF_LD4 PC-P PC-CNF_LD4
A)
0.0001
0.001
0.01
0.1
1
0 10 1000 100000
Flux
(mg/
m2 s
)
Time (hrs)
Calcium Flux from SF Pastes
SF-CF_LD4 SF-P SF-CNF_LD4
B)
Figure 6.11 Flux of calcium from cement pastes leached with DI water: A) PC pastes at w/c=0.325, B) SF pastes at w/c=0.365

47
Accelerated Decalcification using NH4NO3 solution
Mass Loss as a function of time
The percent mass loss with time due to decalcification with NH4NO3 is shown in figure 6.11 for
PC pastes with no fibers, and PC pastes reinforced with 0.5 wt% CNF and PC pastes reinforced
with 0.5 wt% CF (figure 6.11 A) and SF pastes with no fibers, SF pastes reinforced with 0.5 wt%
CNF and SF pastes reinforced with 0.5 wt% CF (figure 6.11 B). The following conclusions were
drawn:
• After 95 days of decalcification there was no significant difference in mass loss between
PC pastes reinforced with 0.5 wt% CNF, CF, and the PC pastes with no fibers.
• After 95 days of decalcification the % mass loss of SF pastes reinforced with 0.5 wt%
CNF was 9% lower than that of the SF pastes with no fibers at w/c=0.365.

48
0123456789
10
0 50 100
Mas
s Lo
ss (%
)
Time (days)
% Mass Loss With Time
PC-P PC-CNF_LD4PC-CF_LD4
A)
w/c=0.325
0123456789
10
0 50 100
Mas
s Lo
ss (%
)
Time (days)
% Mass Loss With Time
SF-P SF-CNF_LD4 SF-CF_LD4
B)
w/c=0.365
Figure 6.12 Percent mass loss of cement pastes as a function of time during decalcification with NH4NO3 solution a) PC pastes at w/c=0.325 b) SF pastes at w/c=0.365
The percent mass loss with time due to decalcification with NH4NO3 for PC pastes with no fibers
and PC pastes reinforced with 2 wt% CNF are shown in figure 6.13 A and SF pastes with no
fibers and SF pastes reinforced with 2 wt% CNF are shown in figure 6.13 B. The following
conclusions were drawn based on these results:
• After 95 days of decalcification the % mass loss of PC pastes reinforced with 2 wt% CNF
was 23% lower than that of the PC pastes with no fibers at w/c=0.435.
• After 95 days of decalcification the % mass loss of SF pastes reinforced with 2 wt% CNF
was 20% lower than that of the PC pastes with no fibers at w/c=0.45.

49
0123456789
10
0 50 100
Loss
of M
ass
(%)
Time (days)
% Mass Loss with Time
PC-P2 PC-CNF_LD5
A)
w/c=0.435
0123456789
10
0 50 100
Loss
of M
ass
(%)
Time (days)
% Mass Loss with Time
SF-P2 SF-CNF_LD5
B)
w/c=0.45
Figure 6.13 Percent mass loss of cement pastes as a function of time during decalcification with NH4NO3 solution a) PC pastes at w/c=0.435 b) SF pastes at w/c=0.45

50
The average % mass loss of the PC and SF pastes cement specimens after NH4NO3 degradation
for 95 days are shown in table 6.5.
Table 6.4 Average % mass loss of the PC and SF cement specimens after NH4NO3 degradation for 95 days
Paste Type Average % Mass Loss Standard Deviation
PC-P 8.7 0.17
PC-CNF_LD4 8.2 0.11
PC-CF_LD4 8.2 0.14
PC-P2 9.3 0.53
PC-CNF_LD5 7.2 0.11
SF-P 6.9 0.20
SF-CNF_LD4 6.3 0.15
SF-CF_LD4 6.8 0.13
SF-P2 6.1 0.13
SF-CNF_LD5 4.9 0.12
Conclusions
There was no significant difference in the % mass loss after 95 days of decalcification of PC and
SF pastes reinforced with 0.5 wt% CNF or CF and PC and SF pastes with no fibers. In contrast,
the mass loss in PC and SF pastes reinforced with 2 wt% CNF there was 23% and 20% less mass
loss respectively than pastes with no fibers.
51
Effect of Decalcification on the Mechanical Properties
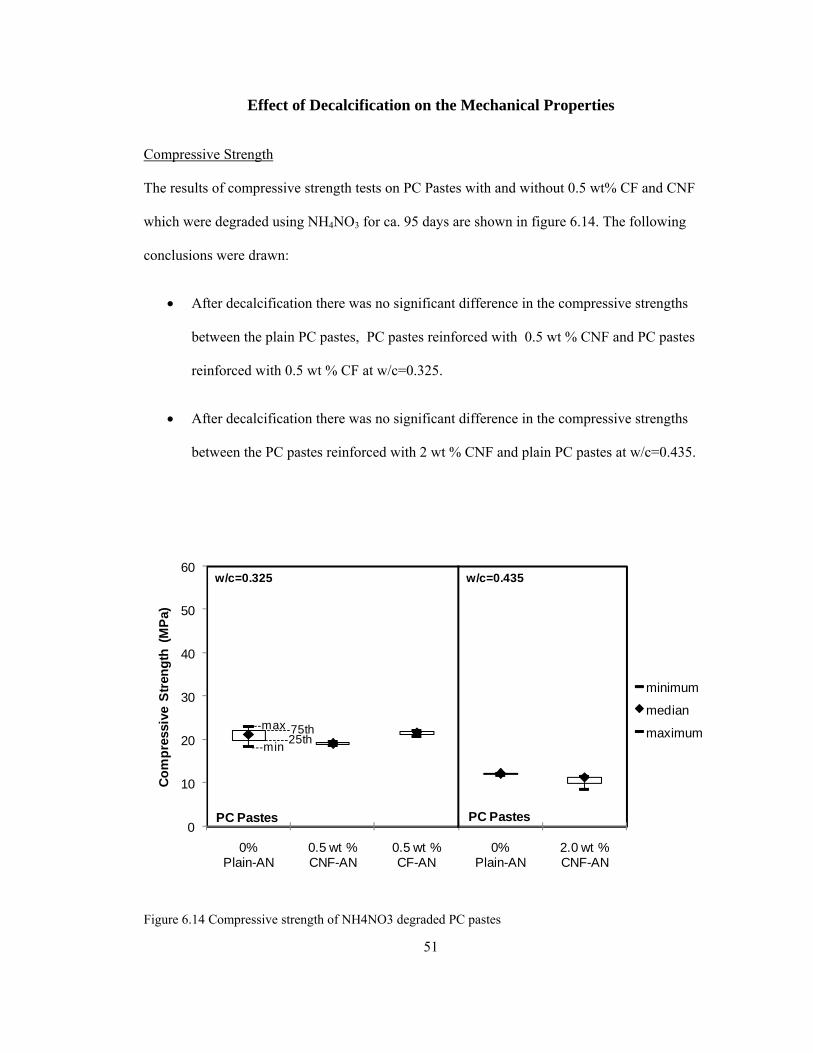
Compressive Strength
The results of compressive strength tests on PC Pastes with and without 0.5 wt% CF and CNF
which were degraded using NH4NO3 for ca. 95 days are shown in figure 6.14. The following
conclusions were drawn:
• After decalcification there was no significant difference in the compressive strengths
between the plain PC pastes, PC pastes reinforced with 0.5 wt % CNF and PC pastes
reinforced with 0.5 wt % CF at w/c=0.325.
• After decalcification there was no significant difference in the compressive strengths
between the PC pastes reinforced with 2 wt % CNF and plain PC pastes at w/c=0.435.
0
10
20
30
40
50
60
0%Plain-AN
0.5 wt %CNF-AN
0.5 wt % CF-AN
0%Plain-AN
2.0 wt %CNF-AN
Com
pres
sive
Str
engt
h (M
Pa)
minimum
median
maximum
w/c=0.325 w/c=0.435
---max------75th------25th
---min
PC Pastes PC Pastes
Figure 6.14 Compressive strength of NH4NO3 degraded PC pastes

52
Figure 6.15A shows the results of compressive strength tests on two types of PC pastes at
w/c=0.325: PC paste with no fibers and PC paste with 0.5 wt % CNF. Figure 6.13B shows the
results of compressive strength tests on two types of PC pastes at w/c=0.435: PC paste with no
fibers and PC paste with 2 wt % CNF. The pastes were tested after curing for 28 days and after
accelerated decalcification for ca. 95 days. The following conclusions were drawn:
• Exposure to NH4NO3 for ca. 95 days yielded a 51% decrease in the median compressive
strengths of the PC pastes reinforced with 0.5 wt % CNF and a 42% decrease in the
median compressive strength of PC pastes with no fibers.
• Exposure to NH4NO3 yielded a 62% decrease in the median compressive strength of the
plain PC pastes while a 48% decrease for PC pastes reinforced with 2 wt% CNF.

53
0
10
20
30
40
50
60
0%Plain
0%Plain-AN
2.0 wt %CNF
2.0 wt %CNF-AN
Com
pres
sive
Stre
ngth
(M
Pa)
minimum
median
maximum
w/c=0.435 w/c=0.435
---max
---75th
---25th
---min
PC Pastes PC Pastes
B)
0
10
20
30
40
50
60
0%Plain
0%Plain-AN
0.5 wt %CNF
0.5 wt %CNF-AN
Com
pres
sive
Str
engt
h (M
Pa)
minimum
median
maximum
outlier
w/c=0.325 w/c=0.325
---max---75th
---25th---min
PC Pastes PC Pastes
A)
Figure 6.15 Effect of CNF on the NH4NO3 degradation of PC pastes: A) 0.5 wt% CNF, B) 2 wt% CNF

54
Figure 6.16 shows the results of compressive strength on two types of PC pastes at w/c=0.325;
PC paste with no fibers and PC paste with 0.5 wt % CF. The pastes were tested after curing for
about 28 days and after exposure to NH4NO3 for 95 days. The following conclusions were drawn:
• Decalcification yielded a 53% decrease in the median compressive strength of PC paste
reinforced with 0.5 wt % CF at w/c=0.325.
0
10
20
30
40
50
60
Plain Plain-AN 0.5 wt %CF
0.5 wt %CF-AN
Com
pres
sive
Str
engt
h (M
Pa)
minimum
median
maximum
w/c=0.325 w/c=0.325
---max---75th
---25th
---min
PC Pastes PC Pastes
Figure 6.16 Effect of 0.5 wt % CF reinforcement on the compressive strength of decalcified PC pastes
The results of compressive strength tests on SF cement pastes, which were decalcified using
NH4NO3 for 95 days are shown in figure 6.17. The following conclusions were drawn:

55
• After decalcification there was no significant difference in the compressive strengths of
plain SF pastes, SF pastes reinforced with 0.5 wt % CNF and SF pastes reinforced with
0.5 wt % CF at w/c=0.365.
• After decalcification there was no significant difference in the compressive strengths of
SF pastes reinforced with 2 wt % CNF and plain SF pastes at w/c=0.45.
0
10
20
30
40
50
60
0%Plain-AN
0.5 wt %CNF-AN
0.5 wt % CF-AN
0%Plain-AN
2.0 wt %CNF-AN
Com
pres
sive
Str
engt
h (M
Pa)
minimum
median
maximum
w/c=0.365 w/c=0.45
---max------75th------25th
---min
SF Pastes SF Pastes
Figure 6.17 Compressive strengths of NH4NO3 degraded SF pastes
Figure 6.18(A) shows the results of compressive strength tests on two types of SF pastes at
w/c=0.325: SF paste with no fibers and SF paste with 0.5 wt % CNF. Figure 6.18(B) shows the
results of compressive strength tests on two types of SF pastes at w/c=0.435: SF paste with no

56
fibers and SF paste with 2 wt % CNF. The pastes were tested after curing for a minimum of 28
days and after exposure to NH4NO3 for 95 days. The following conclusions were drawn:
• Decalcification yielded a 18% decrease in the median compressive strengths of the plain
SF pastes with at w/c=0.365.
• Decalcification yielded a 40% decrease in the median compressive strengths of plain SF
pastes at w/c=0.45.
• Decalcification yielded a 48% decrease in the median compressive strengths of SF pastes
reinforced with 2 wt % CNF at w/c=0.45.

57
0
10
20
30
40
50
60
0%Plain
0%Plain-AN
0.5 wt %CNF
0.5 wt %CNF-AN
Com
pres
sive
Str
engt
h (M
Pa)
minimum
median
maximum
w/c=0.365 w/c=0.365
---max
---75th
---25th---min
SF Pastes SF Pastes
A)
0
10
20
30
40
50
60
0%Plain
0%Plain-AN
2.0 wt %CNF
2.0 wt %CNF-AN
Com
pres
sive
Str
engt
h (M
Pa)
minimum
median
maximum
w/c=0.45 w/c=0.45
---max
---75th
---25th
---min
SF Pastes SF Pastes
B)
Figure 6.18 Effect of fiber reinforcement on the compressive strength of NH4NO3 degraded SF pastes 95 day exposure: A) 0.5 wt% CNF, B) 2 wt% CNF

58
Figure 6.19 shows the results of compressive strength on two types of SF pastes at w/c=0.365: SF
paste with no fibers and SF paste with 0.5 wt % CF. The pastes were tested after curing for a
minimum of 28 days and after accelerated decalcification for 95 days. The following conclusions
were drawn:
• There was no change in the compressive strengths of SF pastes reinforced with 0.5 wt %
CF and SF pastes with no fibers at w/c=0.365 after decalcification.
0
10
20
30
40
50
60
Plain Plain-AN 0.5 wt %CF
0.5 wt %CF-AN
Com
pres
sive
Stre
ngth
(M
Pa)
minimum
median
maximum
w/c=0.365
---max
---75th
---25th---min
w/c=0.365
SF Pastes SF Pastes
Figure 6.19 Effects of 0.5 wt % CF reinforcement on the compressive strength of NH4NO3 degraded SF pastes 95 day exposure

59
Compressive Load Displacement Curves
Figure 6.26 shows the effect of NH4NO3 degradation on the compressive load displacement
curves of PC pastes. The slopes prior to failure are summarized in tables 6.9 and 6.10,
respectively. The following conclusions were drawn based on these results:
• After decalcification the median slope of the compressive load displacement curves of PC
pastes reinforced with 2 wt % CNF was 30% lower than that of plain PC pastes at
w/c=0.435.
• Decalcification yielded a 44% decrease in the median slope of the compressive load
displacement curves of PC pastes reinforced with 0.5 wt % CNF at w/c=0.325.
• Decalcification yielded a 50% decrease in the median slope of the compressive load
displacement curves of plain PC pastes w/c=0.435.
• Decalcification yielded a 50% decrease in the median slope of the compressive load
displacement curves of PC pastes reinforced with 2 wt % CNF at w/c=0.435.

60
Figure 6.20 Effects of 95 day exposure to NH4NO3 on the compressive load displacement curves of PC pastes
0
10
20
30
40
50
60
0 1 2 3 4 5
Displacement (mm)
Load
(MPa
)
PC-P PC-P-AN
w/c=0.325
P 0% CNF
P-AN 0% CNF
A)
0
10
20
30
40
50
60
0 1 2 3 4 5
Displacement (mm)
Load
(MPa
)
PC-CNF_LD4PC-CNF_LD4-AN
w/c=0.325
0.5 % CNF
0.5%CNF-AN
B)
0
10
20
30
40
50
60
0 1 2 3 4 5
Displacement (mm)
Load
(MPa
)
PC-CF_LD4PC-CF_LD4-AN
w/c=0.325
0.5% CF
0.5% CF-AN
C)
0
10
20
30
40
50
60
0 1 2 3 4 5
Displacement (mm)
Load
(MPa
)
PC-P2 PC-P2-AN
w/c=0.435
P2 0% CNF
P2-AN 0% CNF
D)
0
10
20
30
40
50
60
0 1 2 3 4 5
Displacement (mm)
Load
(MPa
)
PC-CNF_LD5
PC-CNF_LD5-AN
w/c=0.435
2% CNF
2% CNF-AN
E)

61
Table 6.5 Effect of NH4NO3 degradation on the slope of the compressive load displacement curves of PC pastes prior to failure
Slope (MPa/mm) Paste Type w/c Specimen
Type Fiber (wt%) Mean Standard
Deviation Minimum Median Maximum
PC 0.325 PC-P 0 27.4 9.6 12.2 23.4 40.6
PC-P-AN 0 22.3 1.8 20.9 21.8 24.3
PC-
CNF_LD4 0.50 34.1
4.4 25.8 33.9 39.6
PC-CNF_LD4-AN
0.50 20.7 4.8 17.4 19.0 25.7
PC-CF_LD4
0.50 23.5 6.3 15.0 22.9 35.2
PC-CF_LD4-AN
0.50 19.4 0.4 19.2 19.3 19.8
0.435 PC-P2 0 32.4 10.1 17.0 31.4 47.9
PC-P2-AN 0 13.0 0.5 12.6 12.8 13.5
PC-
CNF_LD5 2 19.0
3.5 13.3 17.8 25.2
PC-CNF_LD5-AN
2 8.1 1.9 5.9 9.0 9.4
Figure 6.27 shows the effect of NH4NO3 degradation on the load displacement curves of SF
pastes which are summarized in tables 6.9 and 6.10 respectively. The following conclusions were
drawn based on these results:
• Decalcification had no significant effect on the slopes of the load displacement curves of
plain SF pastes at w/c=0.365. In contrast, decalcification yielded a decrease in the slopes
of SF pastes reinforced with fibers and plain SF pastes at w/c=0.45.

62
0
10
20
30
40
50
60
0 1 2 3 4 5
Displacement (mm)
Load
(MPa
)
SF-P SF-P-AN
P 0%
P-AN 0% CNF
A)
w/c=0.365
0102030405060
0 1 2 3 4 5Displacement (mm)
Load
(MPa
)
SF-CNF_LD4SF-CNF_LD4-AN
w/c=0.365
0.5% CNF
0.5% CNF-AN
B)
0
10
20
30
40
50
60
0 1 2 3 4 5
Displacement (mm)
Load
(MPa
)
SF-CF_LD4 SF-CF_LD4-AN
w/c=0.365
0.5% CF
0.5% CF-AN
C)
0
10
20
30
40
50
60
0 1 2 3 4 5
Displacement (mm)
Load
(MP
a)
SF-P2 SF-P2-AN
w/c=
P2 0%
P2-AN 0%
D)
0
10
20
30
40
50
60
0 1 2 3 4 5
Displacement (mm)
Load
(MP
a)
SF-CNF_LD5 SF-CNF_LD5-AN
w/c=0.45
2% CNF
2% CNF-AN
E)
Figure 6.21 Effect of NH4NO3 degradation on the load displacement curves SF pastes.

63
Table 6.6 Effects of NH4NO3 degradation on the slope of the compressive load displacement curves of SF pastes prior to failure
Slope (MPa/mm)
Paste Type w/c Specimen
Type
CNF (wt %)
MeanStandard Deviation Minimum Median Maximum
SF 0.365 SF-P 0 19.2 7.1 7.7 17.6 31.0
SF-P-AN 0 19.4 4.9 13.9 21.8 22.7
SF-
CNF_LD4 0.50 29.0
6.6 17.0 32.9 35.1
SF-CNF_LD4-AN
0.50 19.6 0.8 18.8 19.7 20.3
SF-
CF_LD4 0.50 24.6
7.9 16.6 20.1 37.3
SF-CF_LD4-AN
0.50 21.3 1.7 19.3 22.3 22.3
0.45 SF-P2 0 28.0 3.7 21.7 28.5 33.4
SF-P2-AN 0 17.9 3.7 15.4 16.2 22.2
SF-
CNF_LD5 2 29.0
4.3 21.0 31.3 32.8
SF-CNF_LD5-AN
2 13.5 3.1 10.8 12.8 16.9

64
CHAPTER VII
7. CONCLUSIONS
CNF loadings up to 2 wt % had no significant effect on the mechanical properties of PC and SF
pastes, except in the case of PC pastes reinforced with 2 wt% CNF where there was a decrease in
the compressive strength. Addition of 0.5 wt% CF impacted the mechanical properties of PC and
SF pastes by increasing their compressive and splitting tensile strengths.
A CNF loading of 0.5 wt% and a CF loading of 0.5 wt% had no significant effect on the mass
loss of the PC paste due to decalcification. The higher CNF loading of 2 wt% seemed to increase
the durability of the PC pastes. This increase in the durability was characterized by a lower water
porosity, a lower mass loss and a lower loss of compressive strength due to exposure to
ammonium nitrate solution.
Due to the heterogeneous nature of cement pastes there is a high level of variability in mechanical
test results. It is therefore necessary to have a large number of replicates (greater than 5) for each
test in order to draw accurate conclusions from the results obtained.

65
CHAPTER VIII
8. FURTHER WORK
A CNF loading of 2 wt% showed the most potential for improving the durability of PC pastes.
This CNF loading was also found to decrease the compressive strength of PC pastes. This lower
compressive strength could possibly be attributed to the presence of large clumps of fibers visible
in the paste. This hypothesis should be investigation by studying the level of fiber dispersion
within the paste and effective means of improving that dispersion.
Additional investigations are also necessary to conclusively determine the effect of CNF loading
on the durability of PC and SF pastes. This investigation should include study of the pastes
microstructure using scanning electron microscopy, and a more detailed look at the porosity and
pore size distribution using mercury intrusion porosimetry and BET porosimetry.

66
Appendix
Compressive Strength Data
Baseline
PC-P; w/c=0.325
Average Height (in)
Average Diameter(in)
Ultimate Strength (lb)
3.8 2.0 15090
3.7 2.0 14660
3.7 2.0 17440
3.8 2.0 12880
3.8 2.0 14010
3.8 2.0 19030
3.8 2.0 16680
3.9 2.0 17610
3.8 2.0 17590
3.8 2.0 13160
3.7 2.0 17000
3.8 2.0 17270
3.8 2.0 15380
3.7 2.0 16320
3.8 2.0 15110

67
PC-P2; w/c=0.435
Average Height (in)
Average Diameter(in)
Ultimate Strength (lb)
3.6 2.0 16080
3.5 2.0 8670
3.4 2.0 18100
3.5 2.0 18450
3.4 2.0 14330
3.7 2.0 14000
3.8 2.0 15160
3.8 2.0 10780
3.7 2.0 13680
3.8 2.0 9270
PC-CNF; w/c=0.325; 0.005 wt% CNF
Average Height (in)
Average Diameter(in)
Ultimate Strength (lb)
3.8 2.0 18120
3.8 2.0 14330
3.8 2.0 17810
3.8 2.0 16610
3.9 2.0 19460
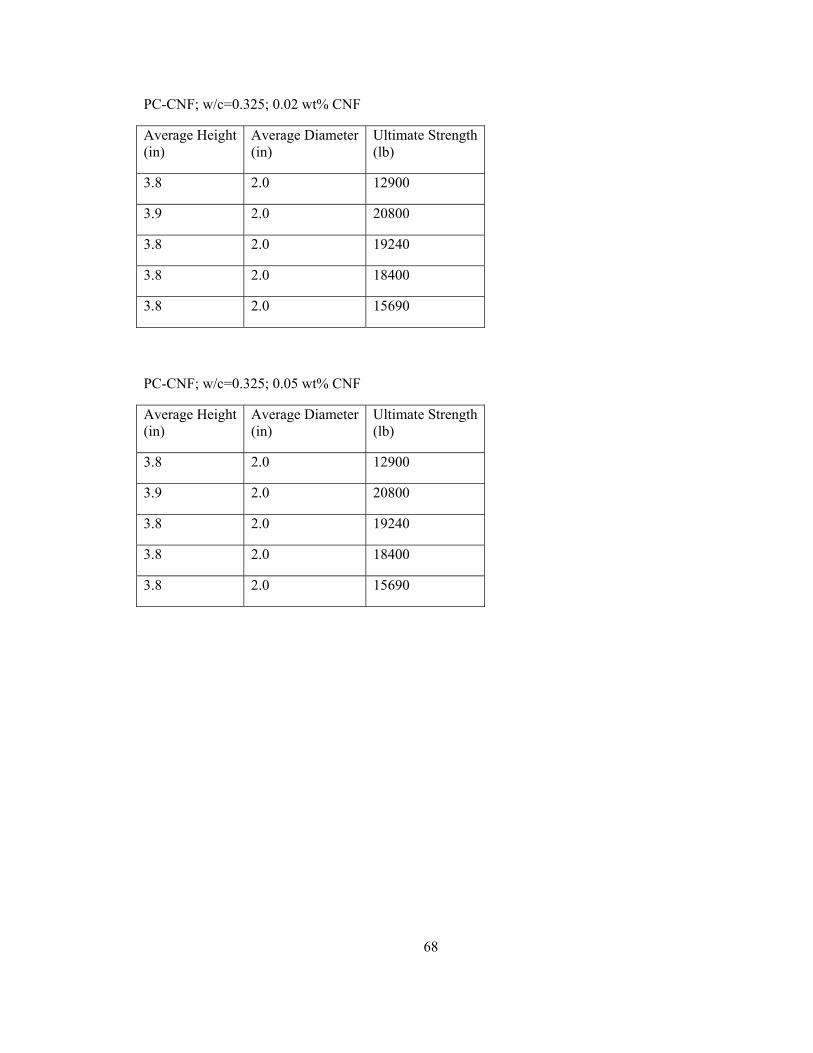
68
PC-CNF; w/c=0.325; 0.02 wt% CNF
Average Height (in)
Average Diameter(in)
Ultimate Strength (lb)
3.8 2.0 12900
3.9 2.0 20800
3.8 2.0 19240
3.8 2.0 18400
3.8 2.0 15690
PC-CNF; w/c=0.325; 0.05 wt% CNF
Average Height (in)
Average Diameter(in)
Ultimate Strength (lb)
3.8 2.0 12900
3.9 2.0 20800
3.8 2.0 19240
3.8 2.0 18400
3.8 2.0 15690

69
PC-CNF; w/c=0.325; 0.5 wt% CNF
Average Height (in)
Average Diameter(in)
Ultimate Strength (lb)
3.7 2.0 18090
3.7 2.0 17690
3.8 2.0 17360
3.8 2.0 17750
4.0 2.0 13550
3.8 2.0 17840
3.9 2.0 5350
3.9 2.0 17740
PC-CNF; w/c=0.435; 2 wt% CNF
Average Height (in)
Average Diameter(in)
Ultimate Strength (lb)
3.8 2.0 9300
3.7 2.0 6780
3.8 2.0 11460
3.8 2.0 9660
3.7 2.0 11830
3.8 2.0 9740
4.0 2.0 8840
3.7 2.0 11600
3.9 2.0 11590
3.9 2.0 8170

70
PC-CF; w/c=0.325; 0.5 wt% CF
Average Height (in)
Average Diameter(in)
Ultimate Strength (lb)
3.7 2.0 22400
3.7 2.0 22800
3.7 2.0 19540
3.9 2.0 21000
3.9 2.0 17760
3.8 2.0 20400
3.8 2.0 16980
3.8 2.0 21500
SF-P; w/c=0.365
Average Height (in)
Average Diameter(in)
Ultimate Strength(lb)
3.7 2.0 18430
3.6 2.0 19140
3.7 2.0 14020
3.8 2.0 16990
4.0 2.0 14550
3.9 2.0 11540
4.0 2.0 14010
3.8 2.0 12760
3.9 2.0 13310

71
SF-P2; w/c=0.45
Average Height (in)
Average Diameter(in)
Ultimate Strength(lb)
3.7 2.0 21400
3.8 2.0 10430
3.8 2.0 16720
3.8 2.0 14510
3.7 2.0 17670
3.8 2.0 14390
3.8 2.0 13410
3.8 2.0 12360
3.8 2.0 15540
3.8 2.0 12330
SF-CNF; w/c=0.365; 0.005 wt% CNF
Average Height (in)
Average Diameter(in)
Ultimate Strength (lb)
3.9 2.0 13760
3.9 2.0 13100
3.9 2.0 15520
3.9 2.0 13490
3.9 2.0 10660

72
SF-CNF; w/c=0.365; 0.02 wt% CNF
Average Height (in)
Average Diameter(in)
Ultimate Strength (lb)
3.9 2.0 16670
3.9 2.0 11660
3.9 2.0 15350
3.9 2.0 17110
3.9 2.0 10090
SF-CNF; w/c=0.365; 0.05 wt% CNF
Average Height (in)
Average Diameter(in)
Ultimate Strength (lb)
3.9 2.0 15850
3.8 2.0 14380
3.9 2.0 13880
3.9 2.0 14670
3.9 2.0 15050

73
SF-CNF; w/c=0.365; 0.5 wt% CNF
Average Height (in)
Average Diameter(in)
Ultimate Strength (lb)
3.7 2.0 12180
3.7 2.0 15950
3.6 2.0 15890
3.8 2.0 16660
3.8 2.0 16170
3.8 2.0 14500
3.9 2.0 11100
3.9 2.0 13670
SF-CNF; w/c=0.45; 2 wt% CNF
Average Height (in)
Average Diameter(in)
Ultimate Strength (lb)
3.7 2.0 13780
3.8 2.0 16610
3.8 2.0 10750
3.8 2.0 12940
3.7 2.0 11830
3.8 2.0 13670
3.8 2.0 15700
3.9 2.0 14170
3.7 2.0 16210
3.9 2.0 8170

74
SF-CF; w/c=0.365; 0.5 wt% CF
Average Height (in)
Average Diameter(in)
Ultimate Strength (lb)
3.7 2.0 19550
3.7 2.0 16440
3.7 2.0 23700
3.7 2.0 18350
3.9 2.0 13360
3.9 2.0 15910
3.9 2.0 17790
3.8 2.0 13490
3.8 2.0 10660
Ammonium Nitrate Solution Degraded Specimens (95 days exposure)
PC-P; w/c=0.325
Average Height (in)
Average Diameter(in)
Ultimate Strength (lb)
3.7 2.0 8280
3.8 2.0 9510
3.8 2.0 10310
PC-P2; w/c=0.435
Average Height (in)
Average Diameter(in)
Ultimate Strength (lb)
3.6 2.0 5330
3.7 2.0 5440
3.7 2.0 5450

75
PC-CNF; w/c=0.325; 0.5 wt% CNF
Average Height (in)
Average Diameter(in)
Ultimate Strength (lb)
3.9 2.0 8570
3.8 2.0 8780
3.9 2.0 8360
PC-CNF; w/c=0.435; 2 wt% CNF
Average Height (in)
Average Diameter(in)
Ultimate Strength (lb)
3.8 2.0 5200
3.7 2.0 3860
3.8 2.0 5080
PC-CF; w/c=0.325; 0.5 wt% CF
Average Height (in)
Average Diameter(in)
Ultimate Strength (lb)
3.8 2.0 9510
3.7 2.0 9750
3.7 2.0 10030
SF-P; w/c=0.365
Average Height (in)
Average Diameter(in)
Ultimate Strength (lb)
3.8 2.0 8790
3.8 2.0 12240
3.7 2.0 11580

76
SF-P2; w/c=0.45
Average Height (in)
Average Diameter(in)
Ultimate Strength (lb)
3.7 2.0 8670
3.8 2.0 7970
3.7 2.0 9530
SF-CNF; w/c=0.365; 0.5 wt% CNF
Average Height (in)
Average Diameter(in)
Ultimate Strength (lb)
3.9 2.0 10800
3.9 2.0 10260
3.8 2.0 10280
SF-CNF; w/c=0.45; 2 wt% CNF
Average Height (in)
Average Diameter(in)
Ultimate Strength (lb)
3.9 2.0 6830
3.9 2.0 7060
4.0 2.0 10240
SF-CF; w/c=0.365; 0.5 wt% CF
Average Height (in)
Average Diameter(in)
Ultimate Strength (lb)
3.8 2.0 13260
3.8 2.0 12350
3.8 2.0 13620

77
Splitting Tensile Strength Data
Baseline
PC-P; w/c=0.325
Average Height (in)
Average Diameter(in)
Ultimate Strength(lb)
4.0 2.0 7200
4.0 2.0 5980
4.0 2.0 6790
4.0 2.0 5230
4.0 2.0 7710
3.8 2.0 3070
3.8 2.0 2930
3.7 2.0 2660
PC-P2; w/c=0.435
Average Height (in)
Average Diameter(in)
Ultimate Strength (lb)
3.8 2.0 3040
3.5 2.0 3720
3.6 2.0 3090
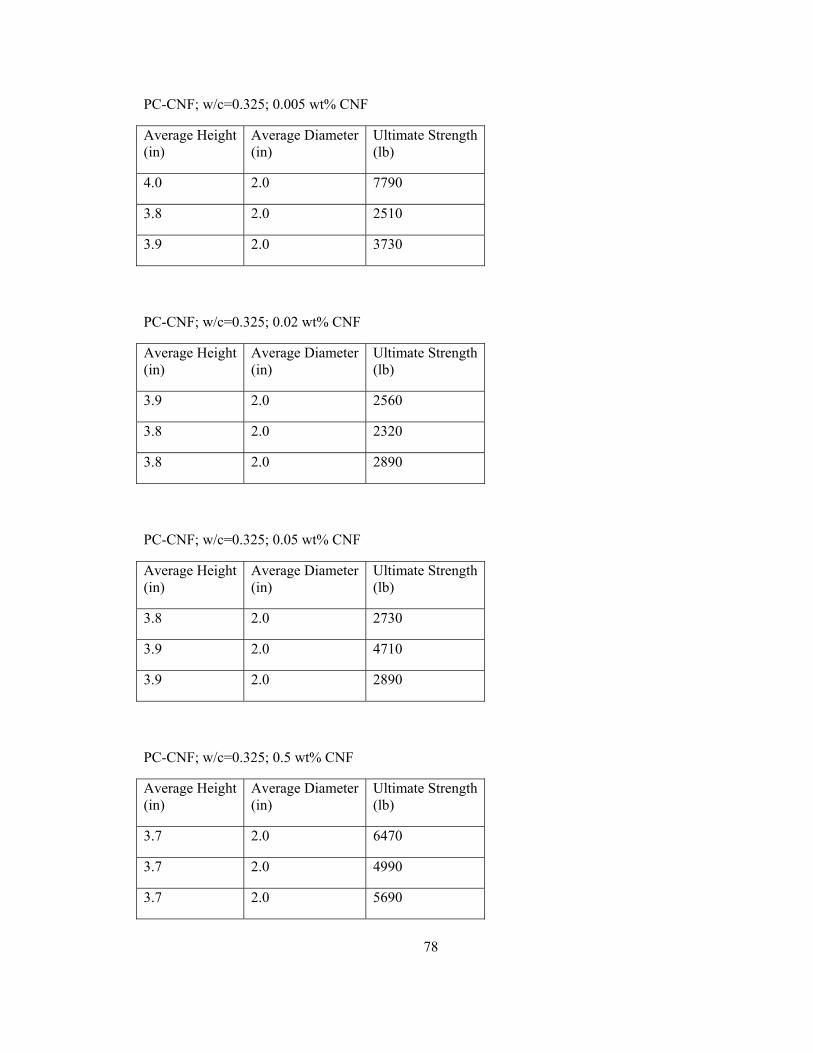
78
PC-CNF; w/c=0.325; 0.005 wt% CNF
Average Height (in)
Average Diameter(in)
Ultimate Strength (lb)
4.0 2.0 7790
3.8 2.0 2510
3.9 2.0 3730
PC-CNF; w/c=0.325; 0.02 wt% CNF
Average Height (in)
Average Diameter(in)
Ultimate Strength (lb)
3.9 2.0 2560
3.8 2.0 2320
3.8 2.0 2890
PC-CNF; w/c=0.325; 0.05 wt% CNF
Average Height (in)
Average Diameter(in)
Ultimate Strength (lb)
3.8 2.0 2730
3.9 2.0 4710
3.9 2.0 2890
PC-CNF; w/c=0.325; 0.5 wt% CNF
Average Height (in)
Average Diameter(in)
Ultimate Strength (lb)
3.7 2.0 6470
3.7 2.0 4990
3.7 2.0 5690
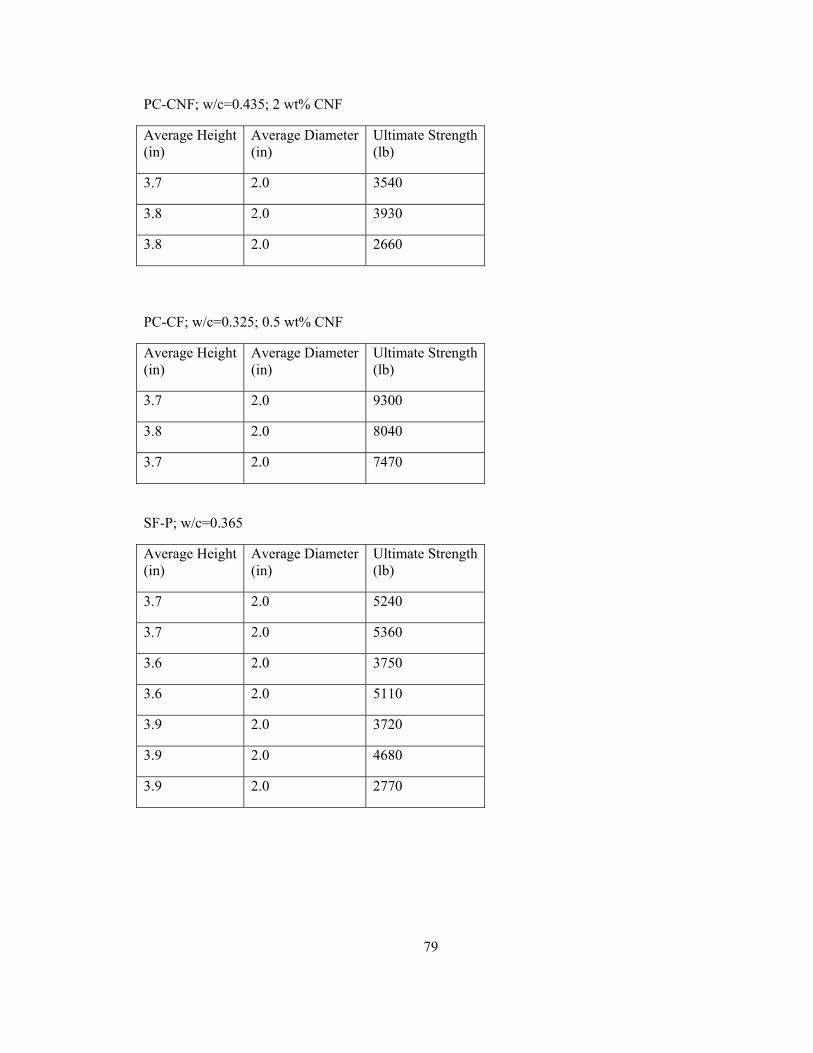
79
PC-CNF; w/c=0.435; 2 wt% CNF
Average Height (in)
Average Diameter(in)
Ultimate Strength (lb)
3.7 2.0 3540
3.8 2.0 3930
3.8 2.0 2660
PC-CF; w/c=0.325; 0.5 wt% CNF
Average Height (in)
Average Diameter(in)
Ultimate Strength (lb)
3.7 2.0 9300
3.8 2.0 8040
3.7 2.0 7470
SF-P; w/c=0.365
Average Height (in)
Average Diameter(in)
Ultimate Strength(lb)
3.7 2.0 5240
3.7 2.0 5360
3.6 2.0 3750
3.6 2.0 5110
3.9 2.0 3720
3.9 2.0 4680
3.9 2.0 2770

80
SF-P2; w/c=0.45
Average Height (in)
Average Diameter(in)
Ultimate Strength (lb)
3.8 2.0 2160
3.8 2.0 3830
3.7 2.0 2170
SF-CNF; w/c=0.365; 0.005 wt% CNF
Average Height (in)
Average Diameter(in)
Ultimate Strength (lb)
3.9 2.0 3380
3.9 2.0 3840
3.9 2.0 4100
SF-CNF; w/c=0.365; 0.02 wt% CNF
Average Height (in)
Average Diameter(in)
Ultimate Strength (lb)
3.9 2.0 5080
3.9 2.0 5060
3.9 2.0 3090
SF-CNF; w/c=0.365; 0.05 wt% CNF
Average Height (in)
Average Diameter(in)
Ultimate Strength (lb)
3.9 2.0 3650
3.8 2.0 3650
3.9 2.0 3460

81
SF-CNF; w/c=0.365; 0.5 wt% CNF
Average Height (in)
Average Diameter(in)
Ultimate Strength (lb)
3.8 2.0 3250
3.8 2.0 3570
3.7 2.0 5850
3.7 2.0 7050
SF-CNF; w/c=0.45; 2 wt% CNF
Average Height (in)
Average Diameter(in)
Ultimate Strength (lb)
3.9 2.0 3750
3.9 2.0 3480
3.9 2.0 3510
SF-CF; w/c=0.365; 0.5 wt% CNF
Average Height (in)
Average Diameter(in)
Ultimate Strength (lb)
3.6 2.0 5640
3.8 2.0 7360
3.6 2.0 5430
3.8 2.0 7240
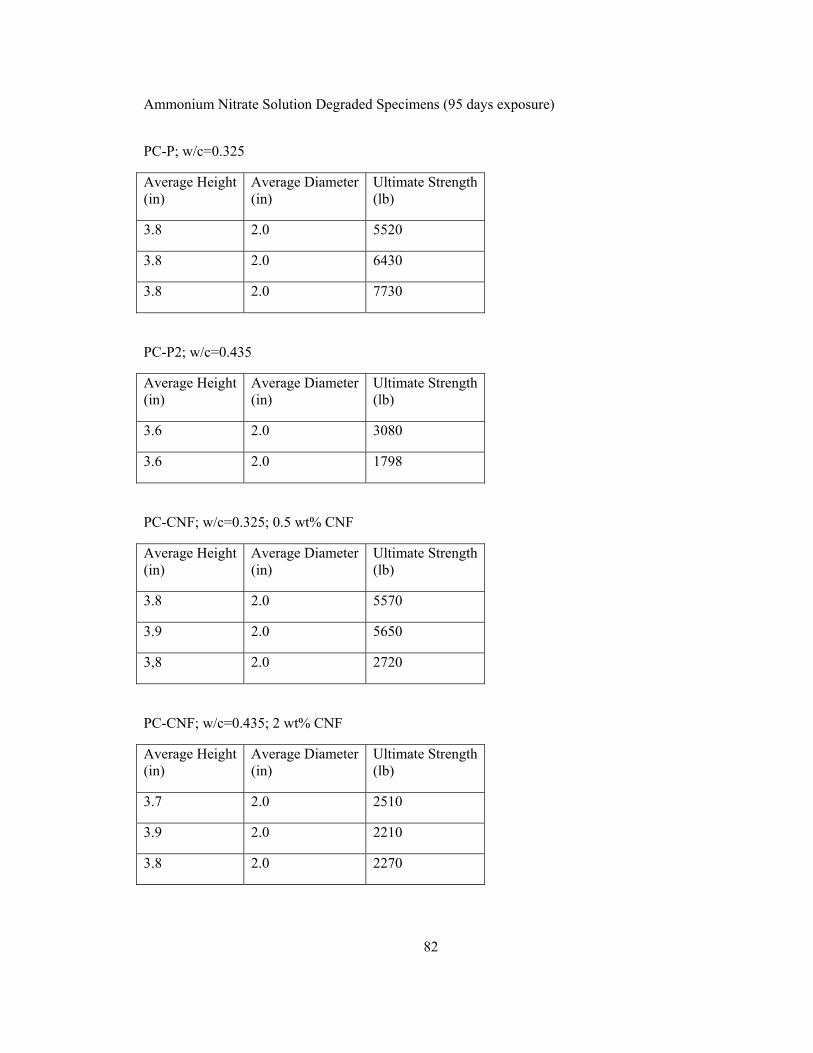
82
Ammonium Nitrate Solution Degraded Specimens (95 days exposure)
PC-P; w/c=0.325
Average Height (in)
Average Diameter(in)
Ultimate Strength (lb)
3.8 2.0 5520
3.8 2.0 6430
3.8 2.0 7730
PC-P2; w/c=0.435
Average Height (in)
Average Diameter(in)
Ultimate Strength (lb)
3.6 2.0 3080
3.6 2.0 1798
PC-CNF; w/c=0.325; 0.5 wt% CNF
Average Height (in)
Average Diameter(in)
Ultimate Strength (lb)
3.8 2.0 5570
3.9 2.0 5650
3,8 2.0 2720
PC-CNF; w/c=0.435; 2 wt% CNF
Average Height (in)
Average Diameter(in)
Ultimate Strength (lb)
3.7 2.0 2510
3.9 2.0 2210
3.8 2.0 2270

83
PC-CF; w/c=0.325; 0.5 wt% CNF
Average Height (in)
Average Diameter(in)
Ultimate Strength (lb)
3.9 2.0 5730
4.0 2.0 5370
3.8 2.0 5940
SF-P; w/c=0.365
Average Height (in)
Average Diameter(in)
Ultimate Strength (lb)
3.9 2.0 3840
3.9 2.0 4150
3.8 2.0 3930
SF-P2; w/c=0.45
Average Height (in)
Average Diameter(in)
Ultimate Strength (lb)
3.8 2.0 2780
3.8 2.0 2590
3.9 2.0 2920
SF-CNF; w/c=0.365; 0.5 wt% CNF
Average Height (in)
Average Diameter(in)
Ultimate Strength (lb)
3.8 2.0 4040
3.8 2.0 3830
3.7 2.0 3870

84
SF-CNF; w/c=0.45; 2 wt% CNF
Average Height (in)
Average Diameter(in)
Ultimate Strength (lb)
3.9 2.0 2590
3.8 2.0 60600
3.9 2.0 3700
SF-CF; w/c=0.325; 0.5 wt% CNF
Average Height (in)
Average Diameter(in)
Ultimate Strength (lb)
3.9 2.0 5230
3.8 2.0 3930
3.9 2.0 4570

85
Leaching with DI Water Data
PC-P; w/c=0.325
Extract # Duration (hrs) A B A B A B A B A B A B A B1 2.18 10.1 10.3 0.706 0.633 12.8 11.7 0.0449 0.0398 0.0956 0.0787 0.118 0.1233 28.7 27.22 3.00 9.8 9.8 0.28 0.286 4.8 5.13 0.091 0.0893 0.196 0.192 0.0892 0.0902 25 24.13 18.57 10.3 10.3 0.795 0.869 14.7 16.3 0.344 0.374 0.972 0.859 0.127 0.117 47.1 474 26.75 10.3 10.2 0.695 0.715 13.1 13.5 0.467 0.444 1.88 1.7 0.133 0.128 42.2 39.55 70.50 10.5 10.4 1.12 1.14 21.1 21.3 0.607 0.646 3.36 3.47 0.195 0.139 47.8 50.26 238.00 11.3 11.4 2.22 2.26 43.6 43.7 1.04 1.06 4.1 3.91 0.228 0.212 66.6 68.57 313.50 11.4 11.4 1.82 1.77 34.7 33.8 1.02 1.03 4.58 4.39 0.189 0.176 56.1 58.68 519.00 11.0 11.0 2.19 2.11 40.8 39.4 1.22 1.19 4.38 4.34 0.181 0.168 56.9 56.29 1019.50 11.1 11.1 2.61 2.59 47.2 46.6 1.44 1.43 3.84 3.65 0.17 0.165 54.2 58.710 1464.00 11.5 11.5 2.88 2.8 50.4 49.8 1.58 1.54 3.65 3.74 0.15 0.1252 50.3 48.111 1848.00 11.0 11.1 2.87 2.79 49.9 49.6 1.57 1.54 3.65 3.77 0.153 0.1207 50.1 48.212 2040.00 11.2 11.3 2.01 1.96 33.4 32.7 1.48 1.43 3.85 3.89 0.132 0.125 45.5 48.813 1680.33 11.5 11.3 1.49 1.48 23.1 23.2 1.21 1.18 4.23 3.95 0.168 0.173 37.6 38.214 1009.17 11.2 11.2 0.799 0.779 12.4 12.4 0.992 0.972 4.53 4.58 0.315 0.345 37.8 38.615 693.50 11.5 11.4 0.751 0.745 11.5 11.1 1.13 1.04 4.25 4.35 0.158 0.162 37.3 37.116 1323.75 11.2 11.2 0.726 0.721 11.1 11.4 1.01 1.15 4.13 4.16 0.154 0.146 33.5 34.617 1796.83 11.1 11.3 0.67 0.662 10.1 10.2 1.01 1.07 3.52 3.46 0.147 0.155 31.4 30.518 2238.92 11.5 11.4 0.58 0.54 10 10.2 1.08 0.98 3.48 3.71 0.102 0.0936 29 29.819 738.50 10.9 10.9 0.405 0.382 5.4 5.77 0.92 0.895 3.74 4.03 0.082 0.0795 21.2 21.5
Concentration (mg/L)pH Sodium Potassium Aluminum Silicon Iron Calcium
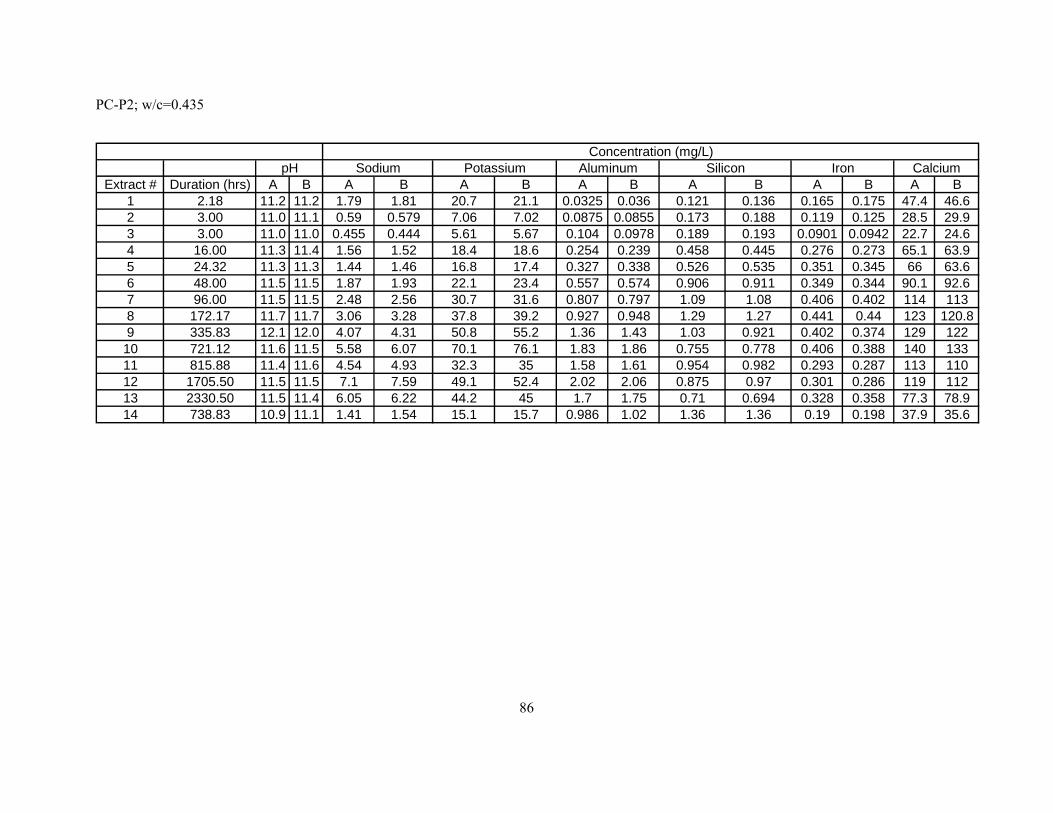
86
PC-P2; w/c=0.435
Extract # Duration (hrs) A B A B A B A B A B A B A B1 2.18 11.2 11.2 1.79 1.81 20.7 21.1 0.0325 0.036 0.121 0.136 0.165 0.175 47.4 46.62 3.00 11.0 11.1 0.59 0.579 7.06 7.02 0.0875 0.0855 0.173 0.188 0.119 0.125 28.5 29.93 3.00 11.0 11.0 0.455 0.444 5.61 5.67 0.104 0.0978 0.189 0.193 0.0901 0.0942 22.7 24.64 16.00 11.3 11.4 1.56 1.52 18.4 18.6 0.254 0.239 0.458 0.445 0.276 0.273 65.1 63.95 24.32 11.3 11.3 1.44 1.46 16.8 17.4 0.327 0.338 0.526 0.535 0.351 0.345 66 63.66 48.00 11.5 11.5 1.87 1.93 22.1 23.4 0.557 0.574 0.906 0.911 0.349 0.344 90.1 92.67 96.00 11.5 11.5 2.48 2.56 30.7 31.6 0.807 0.797 1.09 1.08 0.406 0.402 114 1138 172.17 11.7 11.7 3.06 3.28 37.8 39.2 0.927 0.948 1.29 1.27 0.441 0.44 123 120.89 335.83 12.1 12.0 4.07 4.31 50.8 55.2 1.36 1.43 1.03 0.921 0.402 0.374 129 12210 721.12 11.6 11.5 5.58 6.07 70.1 76.1 1.83 1.86 0.755 0.778 0.406 0.388 140 13311 815.88 11.4 11.6 4.54 4.93 32.3 35 1.58 1.61 0.954 0.982 0.293 0.287 113 11012 1705.50 11.5 11.5 7.1 7.59 49.1 52.4 2.02 2.06 0.875 0.97 0.301 0.286 119 11213 2330.50 11.5 11.4 6.05 6.22 44.2 45 1.7 1.75 0.71 0.694 0.328 0.358 77.3 78.914 738.83 10.9 11.1 1.41 1.54 15.1 15.7 0.986 1.02 1.36 1.36 0.19 0.198 37.9 35.6
Concentration (mg/L)pH Sodium Potassium Aluminum Silicon Iron Calcium

87
PC-CNF_LD4, w/c=0.325; 0.5 wt% CNF
Extract # Duration (hrs) A B A B A B A B A B A B A B1 2.18 10.5 10.4 0.874 0.897 16.6 16.8 0.0338 0.0414 0.000095 0.000095 0.0866 0.0933 28.9 30.22 3.00 9.7 10.1 0.288 0.307 5.23 5.38 0.0677 0.0783 0.0626 0.0797 0.0447 0.0557 18.8 18.93 18.57 10.6 10.5 0.806 0.841 14.9 15.8 0.348 0.366 0.764 0.776 0.219 0.18 41.9 41.94 26.75 10.0 10.0 0.675 0.699 12.7 13.1 0.498 0.502 1.65 1.72 0.149 0.131 39.4 40.15 70.50 10.2 10.2 0.991 1.03 19.3 19.5 0.648 0.645 2.72 2.71 0.175 0.199 48.7 486 238.00 11.4 11.3 1.92 1.97 37.9 38.8 1.06 1.05 3.89 3.81 0.242 0.297 68.8 67.87 313.50 11.3 11.4 1.55 1.62 30.3 31.5 1.03 1.07 4.53 4.47 0.192 0.203 60.4 62.98 519.00 11.0 11.1 1.9 1.99 36.7 38.2 1.18 1.23 4.6 4.58 0.189 0.192 59.2 60.99 1019.50 11.0 11.1 2.38 2.43 44.6 46.1 1.38 1.41 4.17 3.74 0.187 0.186 58 62.310 1464.00 11.5 11.5 2.75 2.78 50.1 51.3 1.45 1.53 4.41 3.93 0.12 0.144 43.1 49.411 1848.00 11.2 11.3 2.75 2.77 49.9 50.5 1.45 1.53 4.37 3.93 0.127 0.132 43.4 4812 2040.00 11.3 11.4 1.91 1.92 33.4 33.8 1.45 1.47 4.06 3.76 0.144 0.181 51 58.813 1680.33 11.2 11.3 1.43 1.41 23.5 23.1 1.51 1.16 3.99 3.79 0.183 0.179 39.6 39.114 1009.17 11.2 11.2 0.75 0.774 12.3 12.4 0.945 0.92 4.38 4.41 0.232 0.227 37.4 38.415 693.50 11.4 11.4 0.697 0.7 11 11 1.14 1.13 4.26 4.14 0.176 0.188 32.5 31.916 1323.75 11.1 11.3 0.692 0.7 11 10.8 1.11 1.1 4.17 4.18 0.159 0.162 32.6 33.717 1796.83 11.1 11.0 0.63 0.64 10.6 10.6 1.04 1.01 4.27 4.23 0.119 0.11 27.2 2618 2238.92 11.1 11.0 0.56 0.57 9 9.6 0.993 1.04 4.21 3.99 0.0835 0.09 23.8 24.919 738.50 10.8 10.9 0.34 0.346 5.32 5.43 0.691 0.722 4.34 4.24 0.0404 0.0466 18.4 19.4
Concentration (mg/L)pH Sodium Potassium Aluminum Silicon Iron Calcium

88
PC-CNF_LD5; w/c=0.435; 2 wt% CNF
Extract # Duration (hrs) A B A B A B A B A B A B A B1 2.18 11.3 11.3 2.34 2.48 28.9 29.5 0.0485 0.0501 0.18 0.172 0.178 0.184 45.9 482 3.00 11.0 11.1 0.775 0.812 9.37 9.51 0.138 0.136 0.176 0.164 0.111 0.121 28 29.43 3.00 10.9 11.0 0.575 0.597 7 7.27 0.135 0.13 0.2 0.204 0.0778 0.0824 20.8 21.74 16.00 11.4 11.4 1.93 2.02 22.7 23.4 0.306 0.298 0.501 0.492 0.388 0.377 58 60.75 24.32 11.4 11.4 1.77 1.83 21.1 21.6 0.395 0.409 0.883 0.992 0.384 0.374 63.4 65.26 48.00 11.5 11.5 2.32 2.41 28.7 29.1 0.565 0.577 1.31 1.29 0.365 0.369 75 77.47 96.00 11.4 11.5 3.16 3.24 39.1 39.8 0.816 0.828 1.49 1.47 0.339 0.346 90.3 92.28 172.17 11.7 11.7 3.9 4.2 48.2 48.5 0.987 0.992 1.61 1.61 0.377 0.381 102 1029 335.83 11.9 11.9 4.8 5.36 61.5 66.1 1.27 1.3 1.3 1.29 0.394 0.418 108 10910 721.12 11.5 11.5 6.53 6.86 82.1 86.9 1.71 1.77 0.967 0.941 0.335 0.336 121 11811 815.88 11.3 11.0 5.24 5.49 37 38.9 1.56 1.58 1.16 1.17 0.27 0.256 104 99.612 1705.50 11.4 11.4 7.9 8.26 53 55.3 2.07 2.11 0.983 1.02 0.326 0.293 120 11113 2330.50 11.4 11.4 7.92 8.25 42 43.3 1.79 1.76 0.819 0.853 0.318 0.299 73.4 70.614 738.83 11.2 11.2 1.58 1.71 12.9 13.8 1.07 1.11 1.53 1.49 0.179 0.2 49.9 51.1
Concentration (mg/L)pH Sodium Potassium Aluminum Silicon Iron Calcium

89
PC-CF_LD4; w/c=0.325; 0.5 wt% CF
Extract # Duration (hrs) A B A B A B A B A B A B A B1 2.18 10.0 10.1 0.44 0.50 8.32 9.81 0.02 0.02 0.00 0.00 0.04 0.02 14.10 17.202 3.00 9.7 9.7 0.29 0.27 4.54 4.86 0.09 0.09 0.09 0.08 0.09 0.07 22.20 21.003 18.57 10.1 10.5 0.75 0.77 13.20 14.10 0.31 0.33 0.74 0.82 0.33 0.26 53.20 51.404 26.75 10.1 10.1 0.63 0.65 11.40 12.20 0.44 0.45 1.56 1.45 0.22 0.21 50.50 50.605 70.50 10.3 10.3 0.95 1.01 17.50 18.40 0.65 0.63 2.80 2.58 0.24 0.25 63.40 63.606 238.00 11.4 11.4 1.84 1.96 33.50 35.90 1.01 1.04 3.60 3.42 0.28 0.28 85.60 89.307 313.50 11.4 11.4 1.52 1.60 27.20 29.30 1.00 1.04 4.25 3.97 0.24 0.24 73.30 77.208 519.00 11.0 10.9 1.88 2.00 33.60 35.90 1.18 1.18 4.22 4.22 0.26 0.26 71.40 71.209 1019.50 11.1 11.1 2.38 2.50 42.10 44.60 1.40 1.41 3.56 4.63 0.22 0.21 70.40 70.6010 1464.00 11.5 11.5 2.77 2.94 47.70 51.70 1.49 1.57 3.94 3.91 0.15 0.15 49.00 56.4011 1848.00 11.1 11.2 2.77 2.93 47.80 51.50 1.48 1.56 3.98 3.99 0.17 0.15 48.60 55.9012 2040.00 11.3 11.3 1.92 2.01 31.70 33.40 1.51 1.52 3.32 3.46 0.21 0.20 68.60 68.0013 1680.33 11.2 11.4 1.44 1.44 23.80 23.40 1.19 1.23 4.32 3.68 0.21 0.21 41.50 42.3014 1009.17 11.2 11.2 0.75 0.78 12.40 12.60 0.98 0.96 4.32 4.40 0.26 0.27 37.70 38.8015 693.50 11.4 11.4 0.72 0.73 11.40 11.50 1.12 1.12 4.12 3.94 0.18 0.20 35.00 35.3016 1323.75 11.2 11.2 0.71 0.70 11.10 11.30 1.10 1.02 4.12 3.17 0.17 0.18 32.80 33.4017 1796.83 11.2 11.2 0.65 0.63 10.10 10.50 1.09 1.14 4.32 4.30 0.16 0.14 30.70 30.6018 2238.92 11.3 11.3 0.56 0.54 10.70 10.80 1.08 1.00 3.91 3.48 0.09 0.10 24.80 25.9019 738.50 10.8 10.9 0.44 0.46 6.00 6.29 0.82 0.86 4.21 3.86 0.07 0.06 21.30 22.20
Concentration (mg/L)pH Sodium Potassium Aluminum Silicon Iron Calcium

90
SF-P; w/c=0.365
Extract # Duration (hrs) A B A B A B A B A B A B A B1 2.18 10.7 10.6 0.0211 0.0231 0.252 0.229 0.0494 0.0484 0.000095 0.000095 0.0469 0.0384 19.5 16.92 3.00 10.3 10.4 0.0217 0.0221 0.103 0.0901 0.0542 0.0578 0.0918 0.0833 0.0263 0.0235 12.3 12.33 3.00 10.3 10.2 0.0246 0.0235 0.0797 0.0679 0.0514 0.0503 0.148 0.138 0.0173 0.0149 9.7 9.314 16.00 10.9 10.9 0.134 0.1519 0.563 0.546 0.224 0.213 1.69 1.62 0.112 0.0833 31.9 31.75 24.32 11.0 11.0 0.14 0.1595 0.77 0.712 0.256 0.259 2.45 2.51 0.0947 0.0802 33 33.16 48.00 11.1 11.1 0.192 0.2 1.63 1.57 0.373 0.393 3.76 3.89 0.112 0.0978 40.3 41.17 96.00 11.2 11.2 0.329 0.341 2.8 2.93 0.54 0.57 5.23 5.13 0.134 0.128 49.1 49.78 181.50 11.9 11.9 0.446 0.473 3.81 4.08 0.699 0.734 6.01 5.84 0.151 0.149 55.9 57.49 361.50 10.8 10.9 0.503 0.535 4.42 4.72 0.81 0.829 6.63 6.48 0.16 0.154 59.3 60.610 1019.50 10.8 10.9 0.786 0.79 6.2 8.24 0.928 0.943 6.28 6.14 0.157 0.162 63 62.611 1464.00 11.3 11.3 0.608 0.654 5.83 6.23 0.779 0.775 7.19 7.17 0.133 0.121 51.5 49.112 1848.00 11.1 11.1 0.616 0.646 5.83 6.2 0.786 0.773 7.23 7.08 0.122 0.116 51.8 49.813 2040.00 10.9 10.9 0.59 0.598 4.05 4.17 0.728 0.664 8.07 8.31 0.115 0.0923 47.6 42.814 1680.33 11.1 11.1 0.36 0.399 3.62 3.96 0.462 0.464 7.1 7.33 0.13 0.136 39.9 41.315 1009.17 11.1 11.1 0.217 0.256 2.1 2.32 0.547 0.53 6.82 6.9 0.247 0.234 35.6 34.716 693.50 11.2 11.3 0.205 0.223 2.1 2.24 0.509 0.495 6.61 6.67 0.159 0.168 33.2 34.317 1323.75 11.0 11.1 0.198 0.188 2.29 2.21 0.486 0.491 6.49 6.9 0.124 0.119 32.4 31.618 1796.83 10.8 10.8 0.202 0.211 2.3 2.26 0.503 0.498 6.21 6.57 0.0911 0.0913 24.1 24.519 2238.92 10.8 10.9 0.206 0.193 2.54 2.62 0.496 0.516 6.21 6.03 0.0729 0.0793 22.5 23.820 738.50 10.6 10.6 0.166 0.171 1.66 1.8 0.434 0.43 6.22 6.15 0.0529 0.0426 17.9 17.1
Concentration (mg/L)pH Sodium Potassium Aluminum Silicon Iron Calcium

91
SF-P2; w/c=0.45
Extract # Duration (hrs) A B A B A B A B A B A B A B1 2.18 11.2 11.2 0.0307 0.0282 9.66E-05 9.66E-05 0.0417 0.0409 0.054 0.0584 0.146 0.135 40.6 402 3.00 10.9 10.9 0.0217 0.0189 9.66E-05 9.66E-05 0.0832 0.0813 0.16 0.1714 0.0779 0.076 19.3 19.13 3.00 10.8 10.8 0.0077 0.00817 9.66E-05 9.66E-05 0.0949 0.0936 0.256 0.263 0.0615 0.0618 15.8 15.94 16.00 11.2 11.2 0.0316 0.0311 0.0674 0.0569 0.252 0.273 0.764 0.792 0.143 0.14 38.9 40.55 24.32 11.3 11.3 0.0624 0.0614 0.254 0.233 0.381 0.378 1.59 1.61 0.213 0.206 46.9 46.76 48.00 11.3 11.4 0.125 0.117 0.674 0.63 0.502 0.518 1.89 1.91 0.246 0.23 52.7 52.17 96.00 11.3 11.3 0.236 0.248 1.52 1.4 0.777 0.762 2.61 2.66 0.25 0.262 67.9 718 172.17 11.5 11.5 0.362 0.38 2.44 2.31 0.916 0.927 2.5 2.53 0.272 0.285 75.1 76.79 335.83 11.7 11.7 0.588 0.583 4.05 3.84 1.25 1.18 2.52 2.29 0.244 0.314 86.4 86.510 721.12 11.4 11.4 0.816 0.894 5.67 5.63 1.39 1.38 2.32 2.33 0.266 0.244 93.3 88.611 815.88 11.3 11.4 0.732 0.755 5.11 5.14 1.16 1.16 2.83 2.74 0.171 0.174 71.4 72.112 1705.50 11.1 11.1 1.09 1.16 7.65 8.1 1.44 1.37 2.56 2.91 0.231 0.203 86.9 75.313 2330.50 11.1 11.0 0.99 1.03 7.29 7.54 0.982 0.993 2.44 2.54 0.162 0.162 40.1 39.714 738.83 11.1 11.0 0.295 0.29 2.5 2.35 0.827 0.775 2.98 3.13 0.147 0.131 32.9 30.6
Concentration (mg/L)pH Sodium Potassium Aluminum Silicon Iron Calcium

92
SF-CNF_LD4; w/c=0.365; 0.5 wt% CNF
Extract # Duration (hrs) A B A B A B A B A B A B A B1 2.18 10.7 10.7 0.0699 0.0612 0.797 0.785 0.058 0.0632 0.000095 0.000095 0.0854 0.0826 17.6 17.32 3.00 10.4 10.4 0.0515 0.0445 0.109 0.0935 0.08 0.0713 0.0811 0.0746 0.048 0.0453 9.91 9.213 3.00 10.3 10.3 0.0282 0.0284 0.0426 0.0371 0.0953 0.0723 0.172 0.163 0.0533 0.0518 7.63 7.184 16.00 10.9 10.8 0.0929 0.0845 0.599 0.53 0.243 0.231 1.59 1.57 0.185 0.109 24.8 24.25 24.32 10.9 10.9 0.13 0.117 1.09 1.04 0.278 0.257 2.8 2.87 0.12 0.104 26.3 25.26 48.00 11.0 11.0 0.264 0.241 2.5 2.23 0.415 0.391 4.31 4.23 0.152 0.141 33.7 33.97 96.00 11.1 11.1 0.394 0.376 3.92 3.38 0.569 0.553 5.46 5.42 0.17 0.158 39.9 41.18 181.50 11.9 11.8 0.476 0.466 4.55 4.45 0.712 0.684 6.2 6.33 0.18 0.185 45.4 46.79 361.50 10.8 10.9 0.501 0.494 4.75 4.68 0.791 0.781 6.72 6.94 0.195 0.244 49.4 51.110 1019.50 10.9 10.9 0.652 0.656 6.36 6.32 0.837 0.815 6.9 7.05 0.205 0.203 51.9 51.311 1464.00 11.4 11.3 0.636 0.634 5.99 5.96 0.743 0.725 7.59 7.65 0.184 0.186 45.7 46.112 1848.00 11.1 11.1 0.628 0.625 5.99 6.01 0.748 0.73 7.52 7.67 0.192 0.182 46.1 46.313 2040.00 11.0 11.1 0.516 0.498 4.92 4.48 0.695 0.637 8.39 8.71 0.147 0.141 37.4 37.314 1680.33 11.1 11.1 0.367 0.361 3.99 3.82 0.448 0.441 7.04 7.08 0.122 0.118 29.4 29.615 1009.17 11.1 11.1 0.239 0.236 2.32 2.3 0.491 0.482 6.7 6.78 0.246 0.233 30.6 31.316 693.50 22.2 11.3 0.24 0.236 2.3 2.27 0.475 0.461 6.81 6.89 0.207 0.197 28.6 27.317 1323.75 10.7 10.7 0.202 0.16 2.21 2.13 0.41 0.395 6.73 6.74 0.106 0.113 26.2 24.418 1796.83 10.6 10.7 0.202 0.197 2.1 2.04 0.387 0.376 6.73 6.72 0.0753 0.0721 22.2 2119 2238.92 10.5 10.5 0.22 0.216 2.68 2.74 0.347 0.372 6.94 6.9 0.0539 0.0596 19.2 18.420 738.50 10.4 10.6 0.162 0.148 1.7 1.52 0.314 0.344 6.79 6.6 0.0288 0.0228 13.8 15
CalciumConcentration (mg/L)
pH Sodium Potassium Aluminum Silicon Iron

93
SF-CNF_LD5; w/c=0.45; 2 wt% CNF
Extract # Duration (hrs) A B A B A B A B A B A B A B1 2.18 11.0 11.0 0.109 0.117 0.724 0.754 0.0933 0.0945 9.30E-05 9.30E-05 0.0988 0.094 24.7 23.62 3.00 10.7 10.7 0.0436 0.038 0.116 0.127 0.0977 0.0994 9.30E-05 9.30E-05 0.0456 0.0482 12.3 12.23 3.00 10.6 10.6 0.0262 0.0214 0.03 0.0265 0.118 0.125 0.0624 0.0579 0.0411 0.045 10.2 9.944 16.00 11.1 11.0 0.08 0.0733 0.482 0.451 0.298 0.294 0.739 0.716 0.0993 0.0909 27.2 275 24.32 11.1 11.0 0.0974 0.0904 0.47 0.44 0.373 0.36 1.03 1.01 0.118 0.125 27.9 27.76 48.00 11.2 11.2 0.181 0.165 1.15 1.094 0.47 0.46 2.19 2.07 0.162 0.159 41.5 40.87 96.00 11.2 11.2 0.318 0.309 2.26 2.1 0.604 0.612 3.11 3.14 0.188 0.198 50.6 50.98 172.17 11.4 11.4 0.429 0.446 3.09 3.13 0.695 0.699 3.51 3.49 0.195 0.201 54.3 54.59 335.83 11.6 11.6 0.663 0.665 5.67 5.63 0.867 0.856 3.95 3.89 0.198 0.179 63.9 63.810 721.12 11.3 11.3 0.798 0.779 5.55 5.6 0.926 0.954 3.91 3.74 0.204 0.18 62.7 68.511 815.88 11.3 11.3 0.67 0.647 4.55 4.63 0.842 0.866 4.07 3.7 0.121 0.133 57.5 59.312 1705.50 10.8 10.8 0.94 0.927 6.78 6.64 0.937 0.999 4.34 3.87 0.152 0.168 59.2 68.713 2330.50 11.0 11.0 0.88 0.94 6.04 6.06 0.757 0.758 3.79 3.65 0.127 0.134 37 36.914 738.83 11.0 11.0 0.278 0.271 2.09 2.02 1.07 1.11 4.52 4.33 0.0979 0.111 30.7 32.5
Concentration (mg/L)pH Sodium Potassium Aluminum Silicon Iron Calcium

94
SF-CF_LD4; w/c=0.365; 0.5 wt% CF
Extract # Duration (hrs) A B A B A B A B A B A B A B1 2.18 10.7 10.7 0.0279 0.0263 0.375 0.317 0.0555 0.0635 0.000095 0.000095 0.0502 0.0308 17.4 18.82 3.00 10.4 10.5 0.0266 0.0264 0.0889 0.0797 0.0601 0.0672 0.152 0.148 0.0229 0.0259 10.8 11.43 3.00 10.2 10.3 0.0209 0.0254 0.05462 0.05605 0.0538 0.061 0.161 0.153 0.015 0.0178 8.1 8.654 16.00 10.9 10.9 0.0857 0.0763 0.421 0.401 0.222 0.247 1.62 1.59 0.0666 0.0583 27.5 28.55 24.32 10.9 10.0 0.0937 0.0838 0.611 0.585 0.265 0.275 2.73 2.77 0.11 0.0935 28.9 29.56 48.00 11.1 11.1 0.184 0.182 1.46 1.46 0.423 0.41 4.29 4.24 0.123 0.1134 37.1 37.57 96.00 11.2 11.1 0.318 0.333 2.81 3.08 0.575 0.603 5.25 5.56 0.121 0.118 44.2 46.28 181.50 11.9 11.9 0.435 0.453 3.85 4.15 0.728 0.749 5.96 6.21 0.148 0.141 50.8 52.79 361.50 10.8 10.8 0.467 0.5 4.29 4.67 0.807 0.832 6.46 6.82 0.149 0.148 53.9 56.310 1019.50 10.9 10.9 0.627 0.639 5.89 6.3 0.879 0.904 6.41 6.71 0.177 0.16 56.4 5611 1464.00 11.3 11.3 0.726 0.746 5.49 5.91 0.739 0.746 7.37 7.9 0.128 0.127 46.6 44.512 1848.00 11.2 11.1 0.726 0.741 5.49 5.99 0.738 0.763 7.38 7.87 0.119 0.114 47 45.413 2040.00 10.9 11.0 0.414 0.435 3.82 4.19 0.6 0.683 8.76 8.93 0.0764 0.064 36.6 43.614 1680.33 11.0 11.0 0.334 0.373 3.47 3.67 0.432 0.445 7.36 7.68 0.123 0.113 30.9 30.715 1009.17 11.1 11.1 0.223 0.258 2.07 2.27 0.486 0.483 7.24 7.27 0.211 0.215 32.4 33.216 693.50 11.1 11.3 0.195 0.191 2.04 2.08 0.468 0.449 7.19 6.93 0.14 0.146 31.9 30.717 1323.75 11.1 11.1 0.188 0.185 2 1.95 0.484 0.476 6.79 6.7 0.114 0.107 29.6 29.118 1796.83 10.6 10.6 0.186 0.187 2.05 2.08 0.475 0.462 6.79 6.83 0.0798 0.0822 22.2 23.819 2238.92 10.8 10.7 0.177 0.16 2.48 2.3 0.478 0.49 6.81 6.74 0.0678 0.0795 22.2 23.720 738.50 10.5 10.7 0.158 0.186 1.72 1.74 0.328 0.33 6.59 6.31 0.0355 0.0432 16.2 18.4
Concentration (mg/L)pH Sodium Potassium Aluminum Silicon Iron Calcium

95
REFERENCES
ACI Committe 116R. (1997). Cement and concrete terminology (ACI 116R). Manual of concrete practice, Part I. Detroit: American Concrete Institute.
Ali, M., Majumdar, A., & Rayment, D. (1972). Carbon Fiber Reinforcement of Cement. Cement and Concrete Research , 2 (2), 201-212.
Applied Sciences Inc. (2001). Pyrograf III. Retrieved March 16, 2008, from Applied Science Inc. Web site: http://www.apsci.com/ppi-pyro3.html
ASTM International, West Conshohocken, PA. (n.d.). ASTM Standard C 33, “Specification for Concrete Aggregates,”. Retrieved from www.ASTM.org
ASTM International, West Conshohocken, PA. (n.d.). ASTM Standard C-150, Standard Specification for Portland Cement . Retrieved from www.astm.org
Baghabra Al-Amoudi, O. S. (2002). Attack on plain and blended cements exposed to aggressive sulfate environments. Cement and Concrete Composites , 24 (3-4), 305-316.
Baston, G. (1976). Steel Fiber Reinforced Concrete. Materials Science and Engineering , 53-58.
Bilba, K., Arsene, M.-A., & Ouensanga, A. (2003). Sugar cane bagasse fibre reinforced cement composites. Part I.Influence of the botanical components of bagasse on the setting of bagasse/cement composite. Cement and Concrete Composites , 25 (1), 91-96.
Birchall J.D., H. A. (1978). On the Hydration of Portland Cement. Proceedings of the Royal Society of London. Series A, Mathematical and Physical Sciences , 360 (1702), 445-453.
Brandt, A. M. (2008). Fibre reinforced cement-based (FRC) composites after over 40 years of development in building and civil engineering. Composite Structures , 86 (1-3).
Cao, J., & Chung, D. D. (2001). Carbon fiber reinforced cement mortar improved by using acrylic dispersion as an admixture. Cement and Concrete Research , 31 (11), 1633-1637.
Carde, C., & Francois, R. (1999). Modelling the loss of strength and porosity increase due to the leaching of cement pastes. Cement and Concrete Composites , 21 (3), 181-188.
Carde, C., & Raoul, F. (1997). Effect of the leaching of calcium hydroxide from cement paste on mechanical and physical properties. Cement and Concrete Research , 27 (4), 539-550.
Care, S. (2008). Effect of temperature on porosity and on chloride diffusion in cement pastes. Construction and Building Materials , 22 (7), 1560–1573.
Cemex. (2008, February 14). Cement Mill test Report for Type I Cement. Wampum, PA, USA.
Chambers, A., Rodriguez, N. M., & K, B. R. (1995). Modification of the Catalytic Behavior of Cobalt by the Addition of Copper. Journal of Physical Chemistry , 99, 10581-10589.

96
Chen, B., Wu, K., & Yao, W. (2004). Conductivity of carbon fiber reinforced cement based composites. Cement and Concrete Research , 26 (4), 291-297.
Chen, P.-W., & Chung, D. (1993). Concrete reinforced with up to 0.2 vol% of short carbon fibres. Composites , 24 (1), 33-52.
Chen, P.-W., & Chung, D. (1996). Low-drying-shrinkage concrete containing carbon fibers. Composites , 27 (3-4), 269-274.
Chung, D. (2000). Cement reinforced with short carbon fibers: a multifunctional material. Composites Part B: Engineering , 31 (6-7), 511-526.
Chung, D. D. (1994). Carbon Fiber Composites. Newton MA: Butterworth-Heinemann.
Donohue, J., & Pittman Jr, C. (2004). Shielding Effectiveness of Vapor Grown Carbon Nanofiber/Vinyl Ester Composites. International Symposium on Electromagnetic Compaitibility 1 , 313-317.
Feldman, R., & Cheng-yi, H. (1985). Properties of Portland Cement-Silica fume pastes II Mechanical Properties. Cement and Concrete Research , 15 (6), 943-952.
Gibson, T., Ragland, W., Rice, B., Silverman, E. M., Hsiao-hu, P., & Strong, K. L. (2005). Formulation and Evaluation of Carbon Nanofiber based Conductive Adhesives. SAMPE .
Heukamp, F., Ulm, F.-J., & Germaine, J. (2001). Mechanical properties of calcium-leached cement pastes Triaxial stress states and the influence of pore pressures. Cement and Concrete Research , 31 (5), 767-774.
Houssam, A. T., El-Korchi, T., & Katz, N. (1994). Strength and reliability of carbon fiber reinforced cement composites. Cement and Concrete Composites , 16 (1), 15-21.
Jiuzhou Silicon Industries Ltd. (n.d.). Composition and Physical Properties. Retrieved november 15, 2008, from http://www.siliconsources.com/silicafume.html
Juenger, M. C., & Jennings, H. M. (2001). The use of nitrogen adsorption to assess the microstructure of cement paste. Cement and Concrete Research , 31 (6), 883-892.
Katz, A., & Bentur, A. (1994). Mechanical Properties and Pore Structure of Carbon Fiber Reinforced Cementitous Composites. Cement and Concrete Research , 24 (2), 214-220.
Kim, J.-K., Han, S. H., & Song, Y. C. (2002). Effect of temperature and aging on the mechanical properties of concrete Part I. Experimental results. Cement and Concrete Research , 32 (7), 1087-1094.
Kim, M., Rodriguez, N., & Baker, R. (1993). The Interplay between sulfur adsorption and carbon deposition on cobalt catalysts. Journal of Catalysis , 143 (2), 449-463.
Kim, Y.-A., Hayashi, T., Naokawa, S., Yanagisawa, T., & Endo, M. (2005). Comparative study of herringbone and stacked-cup carbon nanofibers. Carbon , 43 (14), 3002-3039.
Kosson, D., van der Sloot, H., Sanchez, F., & Garrabrants, A. (2002). An Integrated Framework for Evaluating Leaching in Waste Management and Utilization of Secondary Materials. Environmental Engineering Science , 19 (3), 159-204.

97
Kulaa, I., Olgunb, A., Erdoganb, Y., & V, S. (2001). Effects of colemanite waste, cool bottom ash, and fly ash on the properties of cement. Cement and Concrete Research , 31 (3), 491-494.
Larson, B., Orzal, L., & P., S. (1991). Carbon fibre-cement adhesion in carbon fibre reinforced cement composites. Construction and Building Materials , 21 (3), 83-92.
Lea, F. (1937). The Chemistry of Cement and Concrete. London: Edward Arnold & Co.
Li, G. Y., Wang, P. M., & Zhao, X. (2005). Mechanical Behavior and microstructure of cement composites incorporating surface treated multiwalled carbon nanotubes. Carbon , 43 (6), 1239-1245.
Li, G. Y., Wang, P. M., & Zhao, X. (2007). Pressure-sensitive properties and microstructure of carbon nanotube reinforced cement composites. Cement and Concrete Composites , 29 (5), 377-382.
Li, J., Vergne, M. J., Mowles, E. D., Zhong, W.-H., Hercules, D. M., & Lukehart, C. M. (2005). Surface functionalization and characterization of graphitic carbon nanofibers (GCNFs). Carbon , 43 (14), 2883-2893.
Lin, C., Kao, P., & Yang, F. (1991). Fatigue behaviour of carbon fibre-reinforced aluminium laminates. Composites , 22 (2), 135-141.
Markar, J., Margeson, J., & J, l. (2005). Carbon nanotube/cement composites- early results and potential applications. 3rd international Conference on Construction materials: Performance, Innovations and Structural Implications , 1-10.
Merriam-Webster. (n.d.). Merriam-Webster's Online Dictionary. Retrieved June 16, 2008, from http://www.merriam-webster.com/dictionary/cement
Morgan, P. (2005). Carbon fibers and their composites. Boca Raton, FL: CRC Press.
Patton, R., Pittman Jr, C., Wang, L., Hill, J., & Day, A. (2002). Ablation, mechanical, and thermal conductivity properties of vapor grown carbon fiber/phenolic matrix composites. Composites Part A: Applied Science and Manufacturing , 33 (2), 243-251.
Portland Cement Association. (n.d.). Cement and Concrete Basics. Retrieved June 16, 2008, from Portland Cment Association website: http://www.cement.org/basics/howmade.asp
Proctor, B. (1990). A Review of the theory of GRC. Cement and Concrete Composites , 12 (1), 53-61.
Rodriguez, N. M., Chambers, A., Terry, R., & Baker, K. (1995). Catalytic Engineering of Carbon Nanostructures. Langmuir , 11 (10), 3862-3866.
Shigeyuk, A., Suenaga, T., & Banno, T. (1986). Mechanical Properties of carbon fiber reinforced cement composites. International Journal of Cement Composites and Lightwieght Concrete , 8 (1), 21-38.
Silica Fume Association. (n.d.). General Information: What is silica fume? Retrieved November 15, 2008, from http://www.silicafume.org/general-silicafume.html
Soroka, L. (1979). Portland Cement Paste and Concrete. London: Macmillan Press Ltd.

98
Tibbetts, G. G., & Beetz Jr, C. P. (1986). Mechanical Properties of vapour-gown carbon fibres. Journal of Physics D: Applied Physics , 20, 292-297.
Toho Tenax America Inc. (n.d.). Processes. Retrieved March 16, 2008, from Toho Tenax America Inc. Web site: http://www.tohotenaxamerica.com/process.php
Toho Tenax America Inc. (2007, May 3). TENAX® Water Dispersible Products. Retrieved March 16, 2008, from Toho Tenax America Inc. Website: http://www.tohotenaxamerica.com/products/pls009.pdf
Wang, X., Luo, R. L., Ni, Y., Zhang, R., & Wang, S. (2009). Properties of chopped carbon fiber reinforced carbon foam composites. Materials Letters , 63 (1), 25-27.
Y.-M Chen, J.-M. T. (2002). Ultra high thermal conductivity polymer composites. Carbon , 40 (3), 359-362.
Yajun, J., & Cahyadi, J. H. (2003). Effects of densified silica fume on microstructure and compressive strength of blended cement pastes. Cement and Concrete Research , 33 (10), 1543-1548.
Zhou, J.-H., Sui, Z.-J., Li, P., Chen, D., Dai, Y.-C., & Yuan, W.-K. (2006). Structural characterization of carbon nanofibers formed from different carbon-containing gases. Carbon , 44 (15), 3255–3262.
Zou, G., Zhang, D., Dong, C., Li, H., Xiong, K., Fei, L., et al. (2006). Carbon nanofibers: Synthesis, characterization ,and electrochemical properties. Carbon , 44 (5), 828–832.
Zussman, E., Chen, X., Ding, W., Calabri, L., Dikin, D., Quintana, J., et al. (2005). Mechanical and structural characterization of electrospun PAN-derived carbon nanofibers. Carbon , 43 (10), 2175-2185.