effect of cooperatives working together herd retirements ... of cooperatives... · effect of...
TRANSCRIPT

1
Effect of Cooperatives Working Together
Herd Retirements on the U.S. Dairy Herd Size
Carissa J. McCay
Departmental Honors Thesis
April 2011
Department of Agriculture Economics
Purdue University
West Lafayette, IN

2
Table of Contents
Abstract………………………………………………………………………….……….Page 3
Introduction………………………………………………………………………….…..Page 4
Research Statement………………………………………………………………….…...Page 6
Background……………………………………………………...………………….……Page 7
Literature Review
A Review of some 1980’s Dairy Programs……………………………….…….Page 10
An Economic Analysis of Dairy Herd Dynamics………………………….……Page 13
Conceptual Model of the U.S. Dairy Herd………………………………….…….…….Page 16
Econometric Model……………………………………………………………….…….Page 19
Data…………………………………………………………………………….……….Page 20
Results and Implications……………………………………………………….……….Page 23
Selected Bibliography…………………………………………………………….….…Page 27
Tables and Figures…………………………………………………………….….…….Page 30
3
Effect of Cooperatives Working Together Herd Retirements on the U.S. Dairy Herd Size
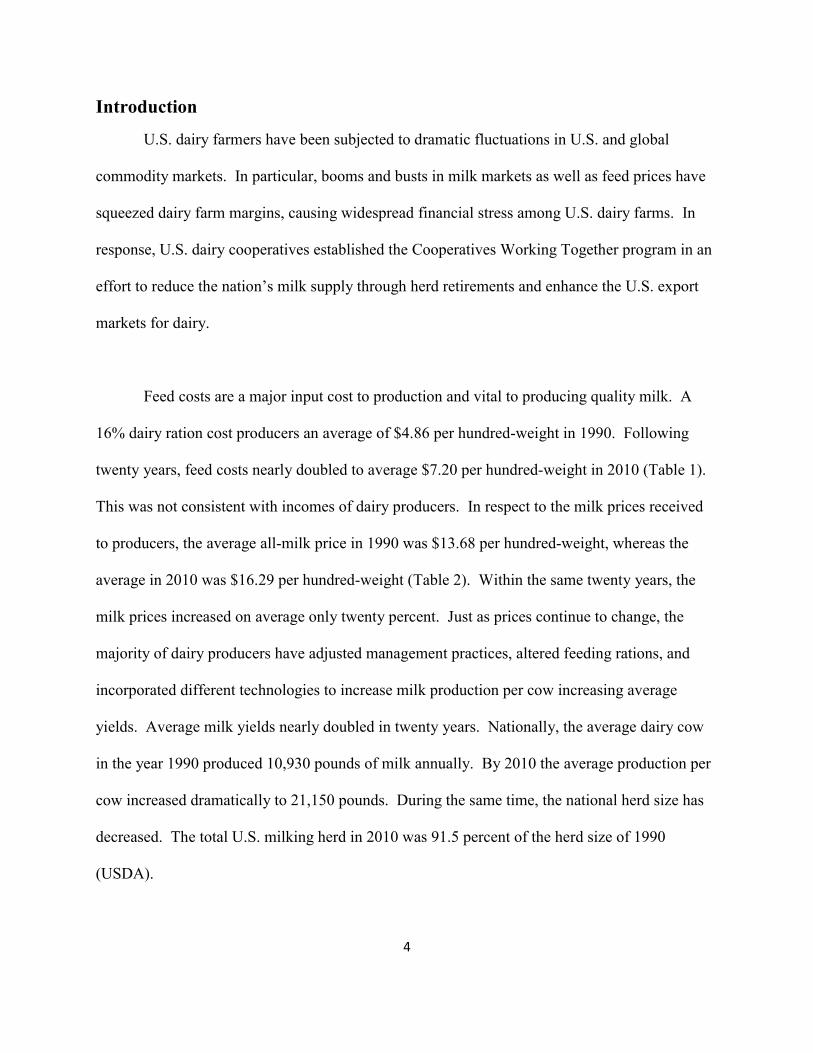
Abstract: Cooperatives Working Together (CWT) was a voluntary dairy herd removal program implemented by U.S. dairy cooperatives from 2003 through 2010 in an effort to reduce the aggregate milk supply and increase the All-Milk price received by dairy producers. Through the program participating cooperatives bought out herds from bidding farmers, who were then required to sell their entire herds to slaughter. Payments were financed by a voluntary check-off. The objective of this research is to model and measure the effects of the CWT herd retirement on the number of cows in the U.S. dairy herd, and thus on aggregate U.S. milk production and on milk prices. We use data on quarterly data on cow numbers, milk yields, and CWT removals, and other economic factors by U.S. region to econometrically estimate the effect of the program on total cow numbers. The estimated model allows for both immediate and cumulative effects of the herd retirement program on milk production. We find that CWT’s herd retirement program has suffered from significant slippage; every 100 cows removed by CWT reduced the U.S. herd by approximately 50 cows in the same quarter. Such slippage reduces the short-term impact of CWT on milk production and milk prices. Moreover we find that the cumulative effect of CWT removals is quite large; every cow removed by CWT causes a long-run reduction in the U.S. herd by approximately 47cows. This effect, while perhaps larger than expected, is consistent with dairy herd dynamics; cow removals reduce breeding stock, which magnifies the total effect over time. Thus, while CWT had a small short-run effect on milk production and prices, its effect was much larger in the long term.
4
Introduction
U.S. dairy farmers have been subjected to dramatic fluctuations in U.S. and global
commodity markets. In particular, booms and busts in milk markets as well as feed prices have
squeezed dairy farm margins, causing widespread financial stress among U.S. dairy farms. In
response, U.S. dairy cooperatives established the Cooperatives Working Together program in an
effort to reduce the nation’s milk supply through herd retirements and enhance the U.S. export
markets for dairy.
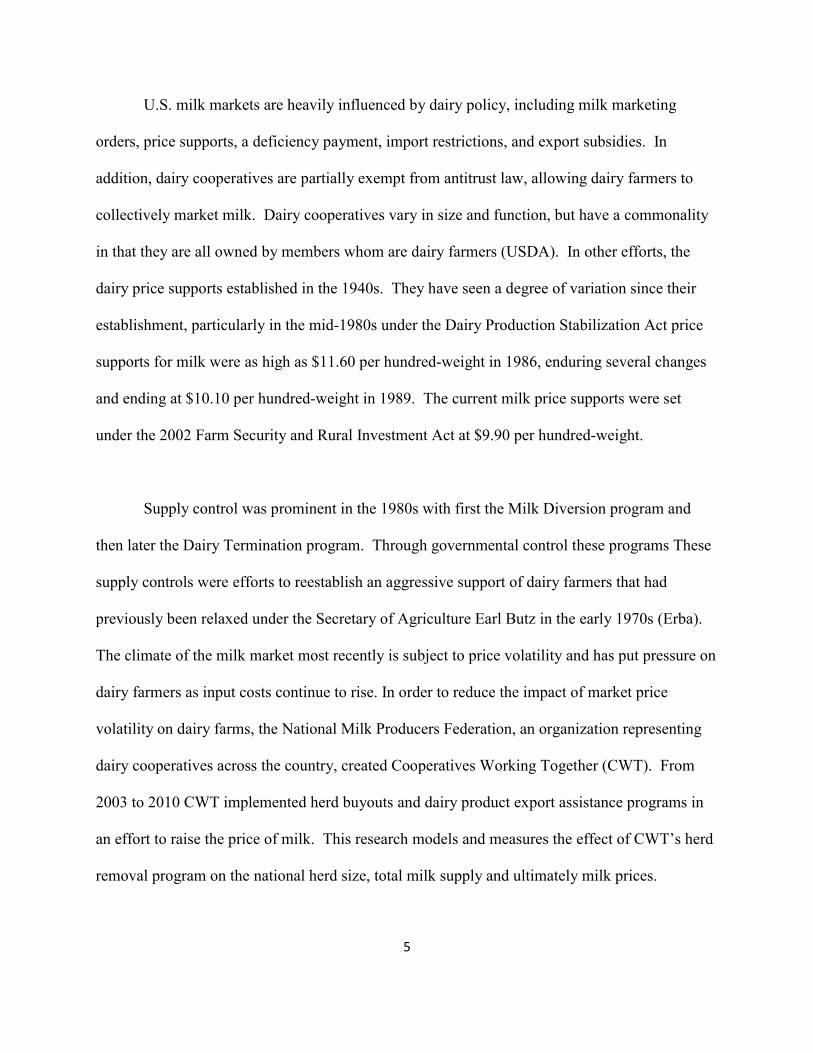
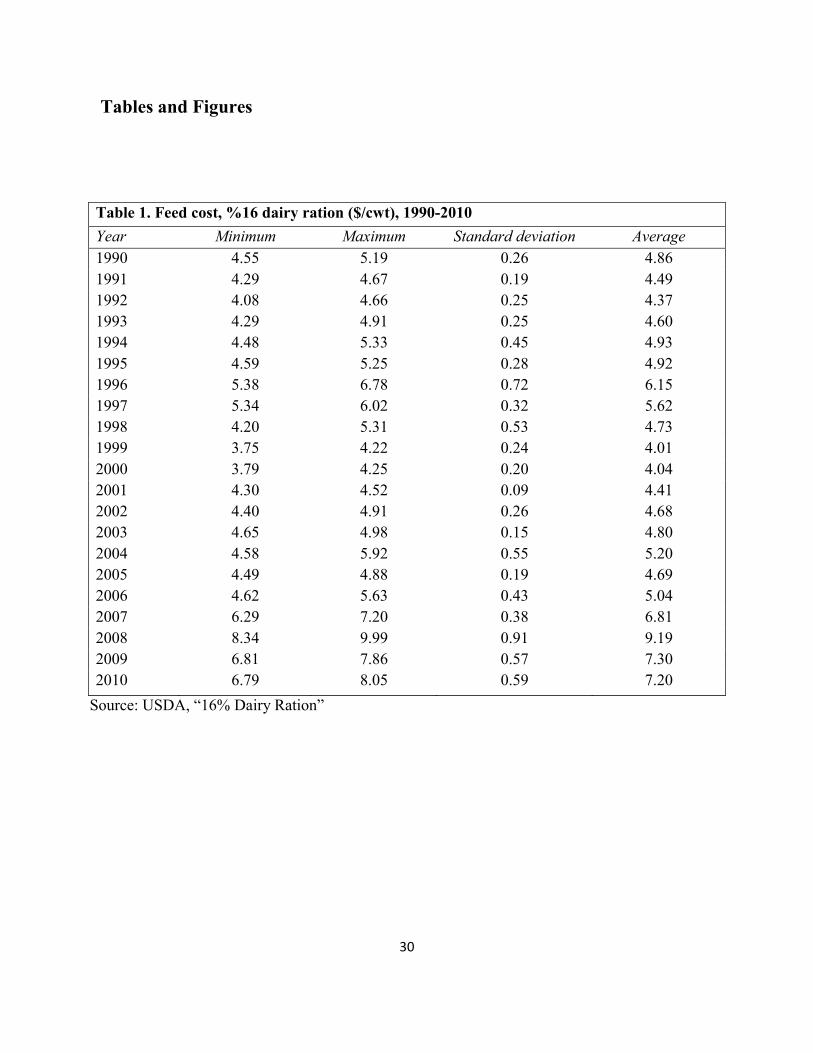
Feed costs are a major input cost to production and vital to producing quality milk. A
16% dairy ration cost producers an average of $4.86 per hundred-weight in 1990. Following
twenty years, feed costs nearly doubled to average $7.20 per hundred-weight in 2010 (Table 1).
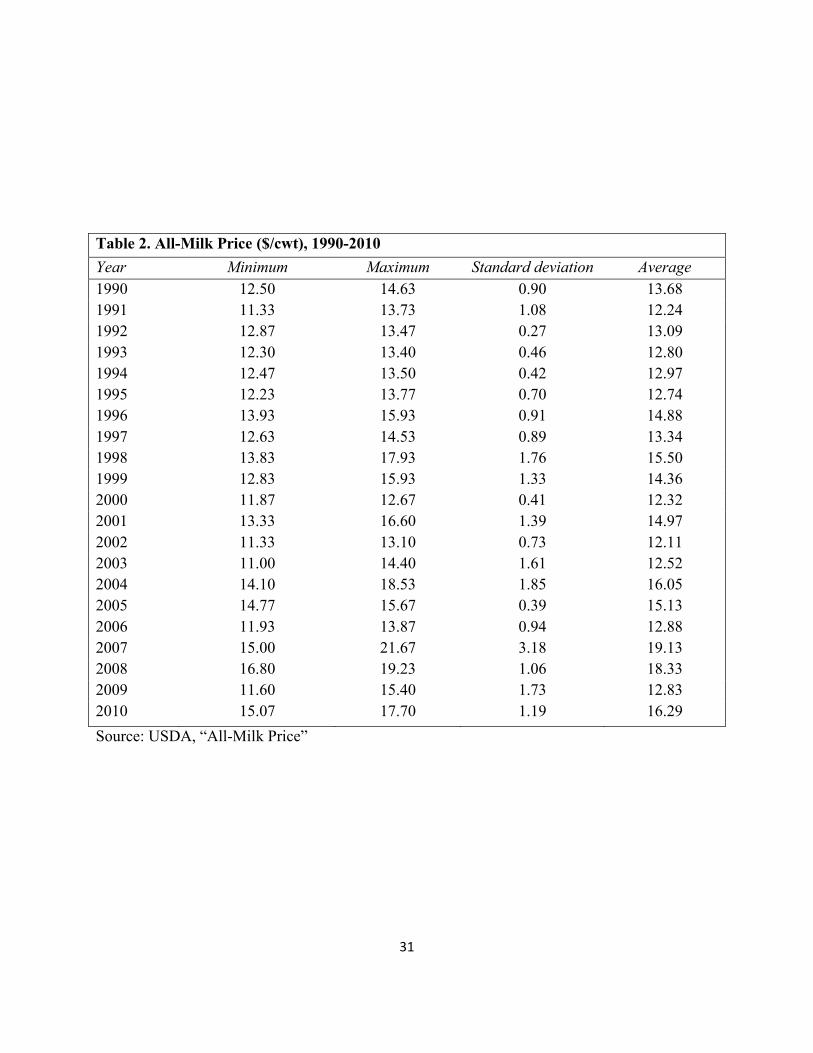
This was not consistent with incomes of dairy producers. In respect to the milk prices received
to producers, the average all-milk price in 1990 was $13.68 per hundred-weight, whereas the
average in 2010 was $16.29 per hundred-weight (Table 2). Within the same twenty years, the
milk prices increased on average only twenty percent. Just as prices continue to change, the
majority of dairy producers have adjusted management practices, altered feeding rations, and
incorporated different technologies to increase milk production per cow increasing average
yields. Average milk yields nearly doubled in twenty years. Nationally, the average dairy cow
in the year 1990 produced 10,930 pounds of milk annually. By 2010 the average production per
cow increased dramatically to 21,150 pounds. During the same time, the national herd size has
decreased. The total U.S. milking herd in 2010 was 91.5 percent of the herd size of 1990
(USDA).
5
U.S. milk markets are heavily influenced by dairy policy, including milk marketing
orders, price supports, a deficiency payment, import restrictions, and export subsidies. In
addition, dairy cooperatives are partially exempt from antitrust law, allowing dairy farmers to
collectively market milk. Dairy cooperatives vary in size and function, but have a commonality
in that they are all owned by members whom are dairy farmers (USDA). In other efforts, the
dairy price supports established in the 1940s. They have seen a degree of variation since their
establishment, particularly in the mid-1980s under the Dairy Production Stabilization Act price
supports for milk were as high as $11.60 per hundred-weight in 1986, enduring several changes
and ending at $10.10 per hundred-weight in 1989. The current milk price supports were set
under the 2002 Farm Security and Rural Investment Act at $9.90 per hundred-weight.
Supply control was prominent in the 1980s with first the Milk Diversion program and
then later the Dairy Termination program. Through governmental control these programs These
supply controls were efforts to reestablish an aggressive support of dairy farmers that had
previously been relaxed under the Secretary of Agriculture Earl Butz in the early 1970s (Erba).
The climate of the milk market most recently is subject to price volatility and has put pressure on
dairy farmers as input costs continue to rise. In order to reduce the impact of market price
volatility on dairy farms, the National Milk Producers Federation, an organization representing
dairy cooperatives across the country, created Cooperatives Working Together (CWT). From
2003 to 2010 CWT implemented herd buyouts and dairy product export assistance programs in
an effort to raise the price of milk. This research models and measures the effect of CWT’s herd
removal program on the national herd size, total milk supply and ultimately milk prices.

6
Research Statement
This thesis focuses on the CWT’s retirement program and its implications for the U.S.
dairy markets through a reduction in number of milking cows. An econometric model is
developed to quantify the direct impact of CWT on the size of the U.S. dairy herd, and model
results are used to estimate the short- and long-term impacts of the herd retirement program on
milk production and milk prices.
7
Background
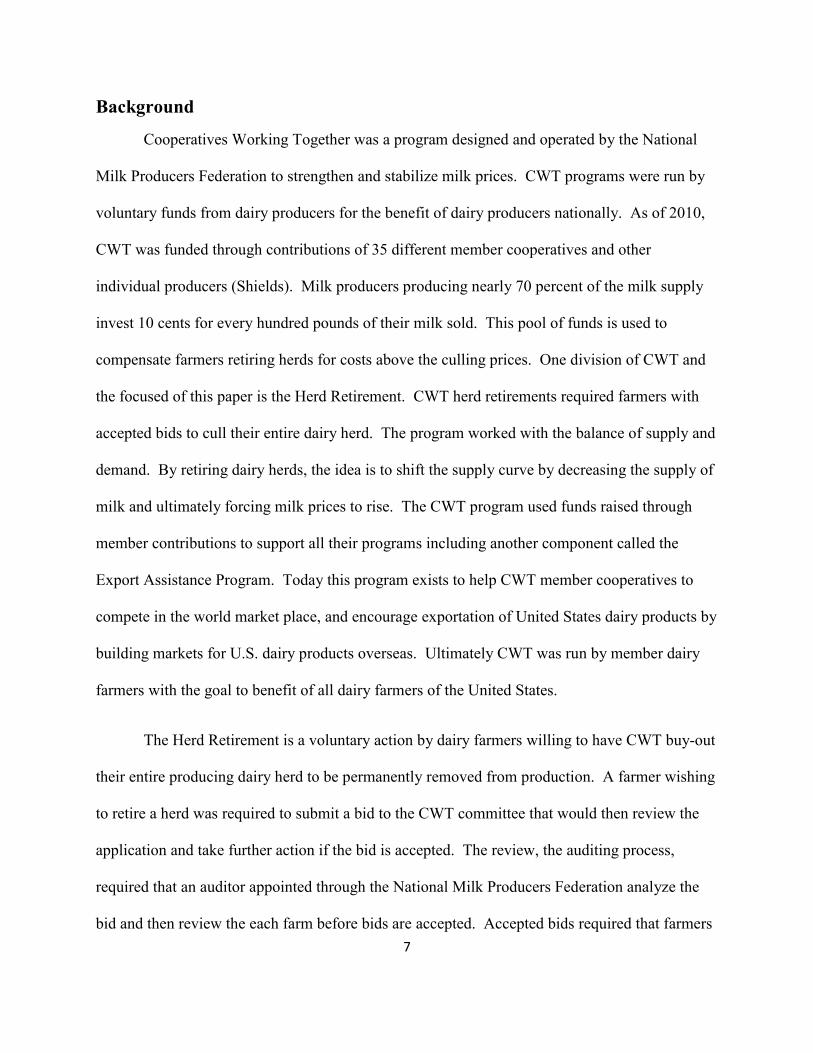
Cooperatives Working Together was a program designed and operated by the National
Milk Producers Federation to strengthen and stabilize milk prices. CWT programs were run by
voluntary funds from dairy producers for the benefit of dairy producers nationally. As of 2010,
CWT was funded through contributions of 35 different member cooperatives and other
individual producers (Shields). Milk producers producing nearly 70 percent of the milk supply
invest 10 cents for every hundred pounds of their milk sold. This pool of funds is used to
compensate farmers retiring herds for costs above the culling prices. One division of CWT and
the focused of this paper is the Herd Retirement. CWT herd retirements required farmers with
accepted bids to cull their entire dairy herd. The program worked with the balance of supply and
demand. By retiring dairy herds, the idea is to shift the supply curve by decreasing the supply of
milk and ultimately forcing milk prices to rise. The CWT program used funds raised through
member contributions to support all their programs including another component called the
Export Assistance Program. Today this program exists to help CWT member cooperatives to
compete in the world market place, and encourage exportation of United States dairy products by
building markets for U.S. dairy products overseas. Ultimately CWT was run by member dairy
farmers with the goal to benefit of all dairy farmers of the United States.
The Herd Retirement is a voluntary action by dairy farmers willing to have CWT buy-out
their entire producing dairy herd to be permanently removed from production. A farmer wishing
to retire a herd was required to submit a bid to the CWT committee that would then review the
application and take further action if the bid is accepted. The review, the auditing process,
required that an auditor appointed through the National Milk Producers Federation analyze the
bid and then review the each farm before bids are accepted. Accepted bids required that farmers
8
retire by selling their entire dairy herd for slaughter and agreeing not to produce, or allow their
farm to be used in any way of producing milk for the duration of five years. Ideally the larger
the cooperative member numbers, the larger the pool from which funds to remove herds can be
drawn, and therefore more herds that were able to be retired. Conceptually, her buyouts reduce
the supply of milk and thus increase the price of milk.
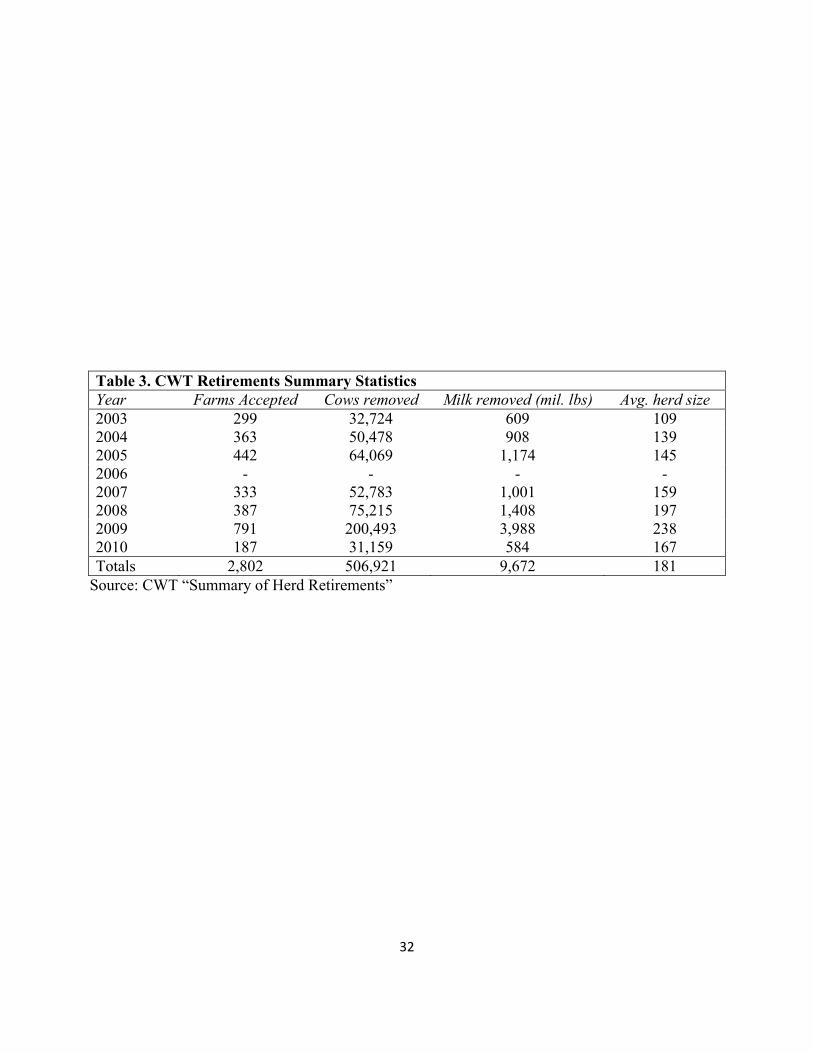
CWT Herd Retirements began in 2003, and with the exception of 2006, retired herds until
its completion in 2010 (Table 3, CWT Summary). Within the programs life and within ten herd
retirements a total of 506,921 cows were removed from production and sent to slaughter. Since
the collective cooperation has started ten herd retirements have taken place. In removing this
number of cows, over 9.67 billion pounds of milk are estimated to have been removed from the
nation’s total milk production (CWT). Cooperatives Working Together organized herd buyouts
according to region. There were five different regions and each varied in its contribution to the
buyout and even in the number of herds retired through the program. The five regions were
Northeastern, Southeastern, Midwestern, Southwestern, and West. The states of the
Northeastern include: Maine, New Hampshire, Vermont, Massachusetts, Rhode Island,
Connecticut, New Jersey, Delaware, Maryland, New York, and Pennsylvania. West Virginia,
North Carolina, South Carolina, Georgia, Florida, Alabama, Mississippi, Louisiana, Arkansas,
Missouri, Kentucky, and Tennessee comprise the states of the Southeastern region. While the
states of the Midwest include: Ohio, Indiana, Illinois, Michigan, Wisconsin, Iowa, Minnesota,
North Dakota, and South Dakota. The forth region of the Southwest includes the states: Texas,
Oklahoma, Kansas, Nebraska, Colorado, New Mexico, and Arizona. The fifth region of the
West includes: Montana, Wyoming, Utah, Nevada, California, Oregon, Washington, and Idaho.

9
In summary, Cooperatives Working Together and the Herd Retirements were programs
established as an attempt at supply control within the dairy market in efforts to increase prices
received to dairy producers. The program was voluntarily funded and required a tax of 10 cents
per every hundred pounds of milk sold by member producers. This pool of funds was used to
monetarily compensate producers who were accepted by the program and chose to removal all
production cows from the farm premise and promising not to milk or use their facilities for
production for at least five years. Through a total of ten herd removals in the span of seven years
CWT was able to retire over 500,000 dairy cows.

10
Literature Review
Cooperatives Working Together Herd Retirement program is not the first supply
management program to be implemented in the United States. In the 1980’s volatility in milk
prices hindered the viability of dairy producers. Two federal programs, the Dairy Termination
(DTP) and Milk Diversion (MDP) programs were implemented during this time in order to
reduce milk supply and raise milk prices. While these policies differ in important ways from the
CWT Herd Retirement program, they were created with similar objectives and may shed some
light on the economic consequences of the CWT program. In this section we review the
literature relevant to these previous programs to obtain a broader understanding of relevant
research and findings.
A Review of Some 1980’s Dairy Programs
Helmberger and Chen (1994) elaborate on the finding of Dixon, Bausell, and Smith
recognizing that the climate of the dairy market in the mid-1980s was a product of increased
price support prices. Previously, from 1966 to 1979 the national milk supply had actually been
decreasing. The percentage increase in the national blend price in 1979 and 1983 rose 2% and
21.6% respectively from increased expenditure in the price supports. Supply management
programs such as the Milk Diversion Program and the Dairy Termination Program were
ultimately a result of mismanagement of the dairy price support program, providing ample
incentive for producers to increase milk supply and resulting in excess capacity. These supply
management programs were an attempt to curb excess capacity.
11
The Milk Diversion Program was created under the Dairy Production Stabilization Act of
1983 (Lee pp. 193). A portion of the Act was a 15-month voluntary milk diversion program
which called for producers to reduce their milk marketing by 5-30% and only sell cattle for
slaughter or to others in the program (Glaser pp. 2-3). Under the provision of this program
producers subscribed to curb milk supply by nearly 7.5 billion pounds of milk. The Milk
Diversion Program was orchestrated through governmental controls, and required a tax of 50
cents per hundred-weight of milk from all producers to fund the program for its duration,
December 1983 to March 1985. This Act also lowered price supports for milk and required a
dairy products promotion. The reasoning behind lowering milk support prices was to decrease
the incentive for farmers to increase milk production. Dixon, Susanto, and Berry concluded that
this program effectively removed milk output in short run only.
In 1986, Congress established the Dairy Termination Program as a provision of the 1985
Food and Security Act and was also designed to reduce milk supply. The program was designed
as a voluntary, government-funded program. Much like the operations of Cooperatives Working
Together, DTP provided cash payments for dairy producers willing to stop producing milk. Also
the abandoned dairy farm facilities must not be used or sold for dairy production. Dairy
Termination program required to quit and cease to produce or use any facilities for milk
production for at least five years. Studies show that producers who chose to participate chose
not to enter back into production even after the retirement period expired (Gale pp. 123). The
DTP was a one-time program that spanned 17 months in length, ending in August 1987 (Dixon,
Susanto, and Berry). The DTP was financed through a compulsory tax of 40 cents per hundred-
weight milk sold of all U.S. milk producers from April 1 to December 31, 1986, and then
12
changing to 25 cents per every hundred-weight of milk sold from January 1 to September 31,
1987 (Glaser pp. 3). Along with the herds that were retired under the DTP program, nearly 11.3
billion pounds of milk were also removed from production reducing the short term milk supply.
Bausell, Belsley, and Smith (1992) analyzed the economic effect of the Milk Diversion
and Dairy Termination programs. The paper analyzes the short and long term effects of each of
the programs. This model also recognized major differences in production regionally and
created variables to account for the different production of different regions. The model,
analyzed through two different equations helped discover that the Milk Diversion Program had a
short-term impact the Dairy Termination Program had a more long-term impact. However,
under the DTP it was found that the five-year ban had little impact as herd size began increasing
to pre-DTP equilibrium levels after the final herd removals. Helmberger and Chen (1994)
recognize that the dairy market is not absent from other factors such as the price support and
ultimately the milk-feed price ratio reflecting the milk margins received to farmers. The study
indicates that the national herd size would have fallen by 2.2% from 1979 to 1983 as a result of
dramatically decreasing milk margins. The milk-feed price ratio fell from $1.41 in 1979 to $1.16
in 1984, a decrease of approximately 18% in a five-year time span. Conclusively, the price
support program increased expenditures raising the blend price to $12.52 after 1984 from the
previously set $10.54. Milk margins would have increased and market indicators would have
spurred the national dairy herd size to increase.
The study by Bausell, Belsley, and Smith also found that the DTP suffered from slippage:
the U.S. dairy herd shrunk by less than the number of cows removed by the program. Slippage
could occur if program participants intended to exit the industry regardless of the programs
13
existence. Therefore the program would not actually be removing any more cattle over net
normal culling. Slippage also exists in the response of nonparticipants potentially culling fewer
cattle than would have previous to the programs operations (Bausell, Belsley, and Smith, 1992).
Slippage has important implications for the economic effects of the program. In particular,
slippage reduced the impact of DTP on aggregate milk production and, thus, on milk prices and
economic welfare of dairy farms.
An Economic Analysis of Dairy Herd Dynamics
The changing dairy herd size and increasing average milk production per cow are the
derivative of the changes in aggregate milk production (Bryant, Outlaw, and Anderson).
According to a study by Chavas and Klemme (1986) the short run supply of milk was found to
have a small elasticity appearing nearly inelastic and ranging from 0.07 and 0.16 (Hammond,
Wipf, Houck, and Chen, Hutton and Helmberger). This varied from the long term response of
milk supply which has been theorized to have an even wider range of elasticities, ranging from
0.14 (Hammond), 2.20 (Dahlgram), and 2.53 (Chen). This variation in the supply responses on
the long and short term reflect the importance of understanding the dairy herd dynamics in
modeling total milking cow numbers.
A dynamic model of the aggregate dairy herd’s size and age structure was developed, and
could constitute for U.S. milk production when combined with an analysis of milk cow
productivity in the study of Chavas and Klemme (1986). Previous studies have shown that the
dynamics of the dairy herd plays an essential role in the aggregate milk production and
ultimately milk prices. The model includes several variables such as the lagged female portion

14
of the dairy herd, 50% of all live calves to be born as heifers, the number of two-year old
replacement dairy heifers, while assuming a 12-month calving interval, culling or retention rates.
The retention rate or culling portion is a multi-faceted reflection of the economic situation,
including the milk prices, feed prices, slaughter prices, and even the cows’ productivity in
respective life and production stages. One statement in the literature explains that increasing
milk prices have a negative effect of slaughter rates in the short-run and increase the future herd
size. Meanwhile sustained feed cost increases have negative affects of heifer numbers and
producing cow numbers. The model also incorporates increasing milk productivity per cow
accrediting it to genetic improvements and management decisions made to replace older
producing cows with younger more productive dairy cows. Congruently lower feed prices lower
culling rates, increase feed demand and also milk production per cow. Conclusively, the milk
price, feed price, animals’ age, and slaughter prices all affect the real value of producing dairy
cattle.
The variables of the model relative to the conditions of the 1980’s dairy climate indicate
the economic situation gave dairy producers incentive to increase milk production by about 4%
per year. Of this increase, 1.8% is contributed to by increased productivity while the larger 2.2%
is accredited to an increased herd size. This situation is relative to the increasing milk-feed ratio,
reaching its highest value in 1982 (Chavas and Klemme). It was largely believed that this
increasing milk production was unmatched by milk demand and artificial created under an
inflated, un-equilibrium milk market and increased milk price supports. Relevantly, in the
research of Brynat, Outlaw, and Anderson (2007) found that the long-run equilibrium demand
15
and herd size was halfway achieved in 10.5 years in response to a sustained change in a supply
determinant of the Milk Income Loss Contract policy analysis.
Short-run adjustments in milk production are a product of increasing productivity per
cow, while the long term impact on milk supply is relevant to the changing size of the producing
dairy herd. The research of Chavas and Klemme concludes that the economic indicators have
strong effects on dairy herd dynamics. For example dairy farmers react strongly to market prices
through management decisions that affect the size and productivity of their individual dairy
herds and collectively the entire U.S. dairy herd. The long-run effects of policies in the 1980s
that encouraged an expansion of the dairy herd had a costly impact and a difficult fix. Reducing
the herd size to previous numbers is difficult and would be costly to producers because of the
compounding nature of the dairy cow population. Congruently, a study of the economic analysis
of dairy herd dynamics as impacted by the MILC program found similar results, the long-run
milk supply responses were substantially larger that the short-run responses (Bryant, Outlaw, and
Anderson).
16
Conceptual Model of the U.S. Dairy Herd
The number of cows in the U.S. dairy herd is the result of herd management decisions
made by farmers in response to economic conditions, as well as biological factors related to a
dairy cow’s production life and genetics. Determinately the conceptual model requires total cow
numbers to be some function of several key factors including the number of that milked in the
last quarter, the number of cows slaughtered or removed through CWT actions within the same
time period, expenses of last quarter and congruently incomes of last quarter, as well the costs
and benefits of policy implications on dairy producers.
The economical conditions surrounding dairy production and effecting major costs and
benefits to dairy farmers have a major impact on producers’ decisions to produce milk. The
incomes from milk production are an overarching variable that directly or indirectly impact
production decisions made for dairy operations. The costs associated with dairy businesses also
have a large impact on production decisions producers must make. Feed costs are a major input
cost and vital to milk production. Utilizing adequate nutrition the livestock daily diet is essential
to produce both quality and quantified amounts of milk which in turn impact incomes of
producers. For the purpose of this model, we expect that as feed costs increase total cow
numbers decrease in response. Congruently, as incomes from milk increase we hypothesize that
total cow numbers would increase in response. The motivation of this study is central to the
more recent economic condition characterized by price volatilities in both feed costs and milk
prices.
In our estimated equation time series data and lagged variables are used as we expect
each animal to live multiple periods. This aspect introduces positive serial correlation in the data
17
and results which in consistent with our knowledge of dairy cow biology. Modeling the effects
of CWT herd removals is prominent in the long-run estimations as we assume each cow to
produce a heifer calf at every other calving, and each calf’s eventual production two years later
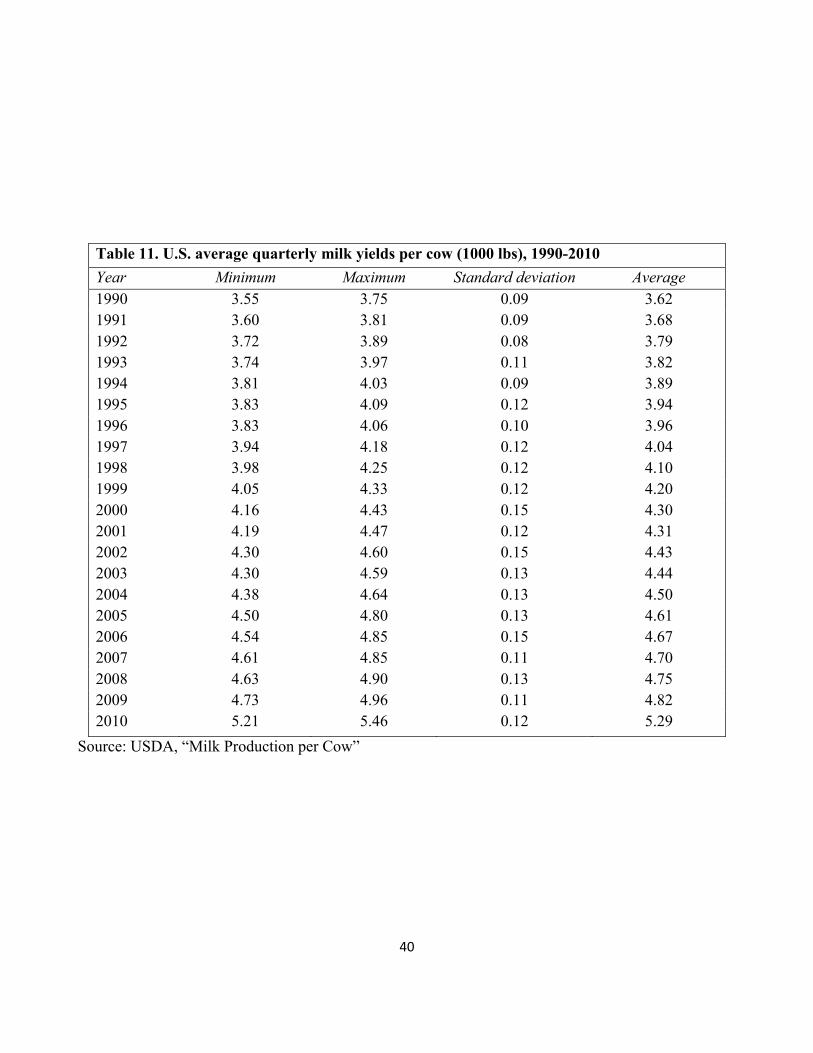
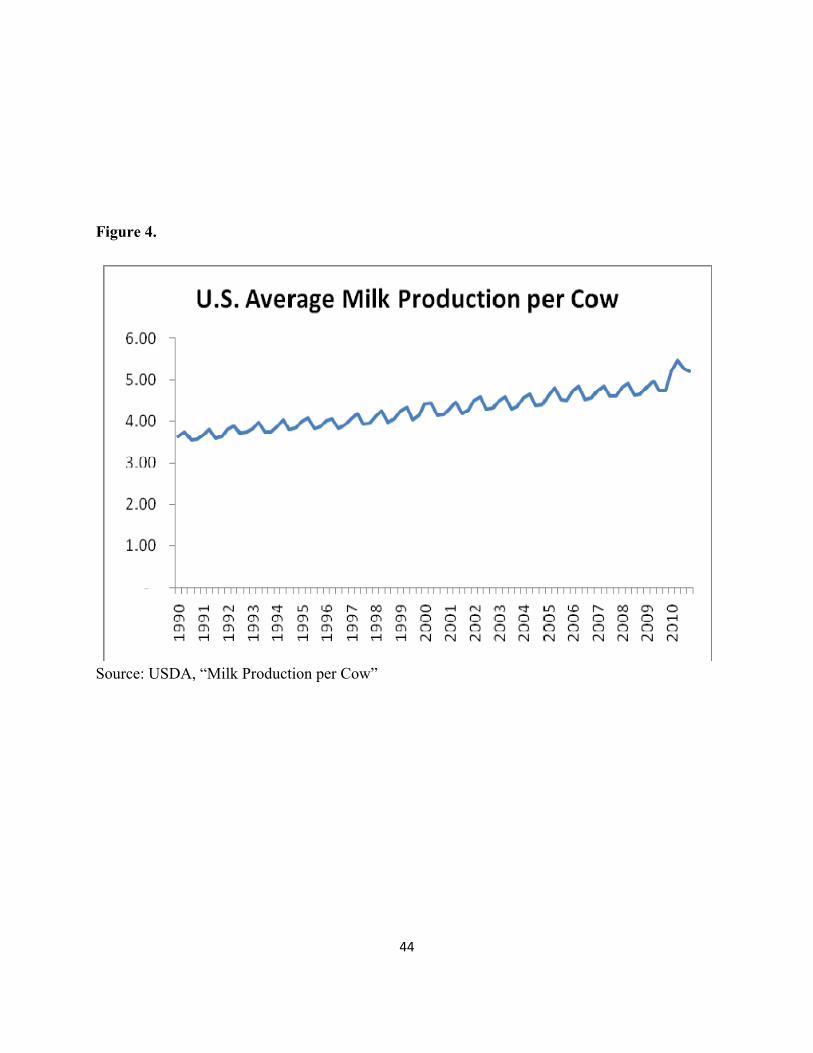
at her first calving and the start of her lactating life. Furthermore milk yields progressively
increase as feeding practices adjust to accommodate the evolving genetics of the national dairy
herd (Figure 4). The implications of increasing production per cow additionally compound the
impact of each CWT herd retirement on the future herd size and total production. Removing
cows within this quarter also removes her heifer calf to be born two lactations in the future and
her potentially greater production after her first calving. We can presume that each generation
will continue to increase milk yields. In 1990 the average cow produced 3,620 pounds per
quarter year, this has increased dramatically by an average of 1,660 pounds of milk per cow in
the span of twenty years for in 2010 the average cow in the U.S. was producing 5,290 pounds per
quarter (Table 11). This increase is significant in understanding the balance between the milk
supply and relatively consistent demand for milk. Therefore we hypothesize that the biological
factors such as increasing milk production per cow have potential to increase the total supply of
milk which could have a negative effect on the total number of cows producing nationally all in
reflection of creating the balance between milk supplied and demanded.
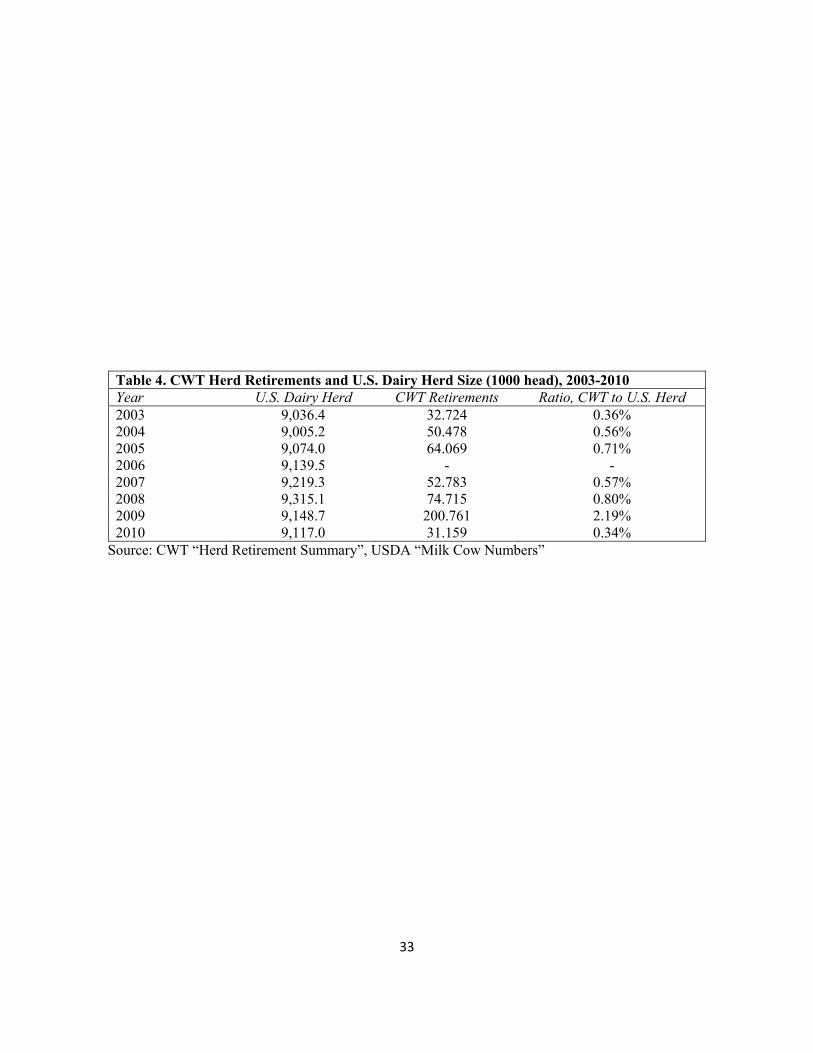
The research model attempts to quantify the effects of CWT herd removals on the short-
run and long term national dairy herd size. CWT’s Herd Retirement efforts in supply control we
expect to decrease total numbers of cows. The number of cows removed through herd
retirements was small, representing approximately two percent of the national herd size in its
largest retirement of 2009 (Table 4). Building on previously stated hypotheses we expect that
these removals, although small in comparison to the larger total number or producing cows in the
18
U.S. have a compounding effect. Therefore the immediate short-run impact of CWT removals
will be small on total herd size, total milk supply, and the price received to dairy producers.
However, the cumulative effects of removing one cow within a given quarter accumulate to have
a larger impact in the long term national herd size.
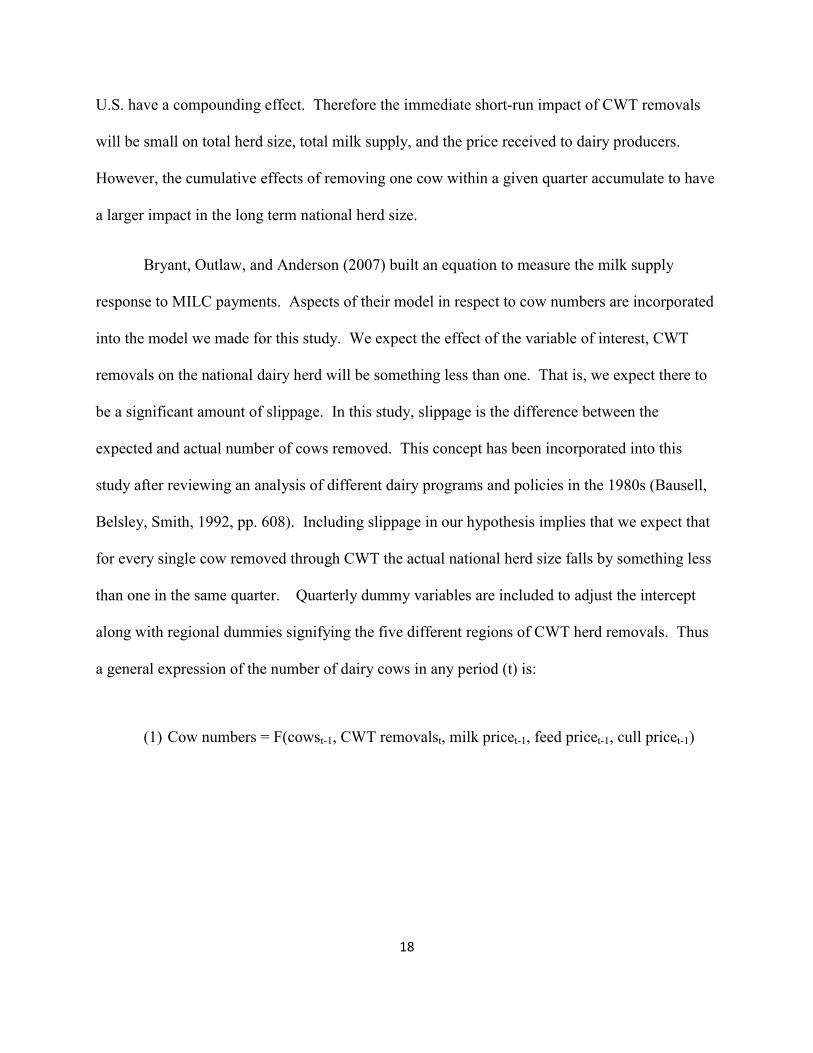
Bryant, Outlaw, and Anderson (2007) built an equation to measure the milk supply
response to MILC payments. Aspects of their model in respect to cow numbers are incorporated
into the model we made for this study. We expect the effect of the variable of interest, CWT
removals on the national dairy herd will be something less than one. That is, we expect there to
be a significant amount of slippage. In this study, slippage is the difference between the
expected and actual number of cows removed. This concept has been incorporated into this
study after reviewing an analysis of different dairy programs and policies in the 1980s (Bausell,
Belsley, Smith, 1992, pp. 608). Including slippage in our hypothesis implies that we expect that
for every single cow removed through CWT the actual national herd size falls by something less
than one in the same quarter. Quarterly dummy variables are included to adjust the intercept
along with regional dummies signifying the five different regions of CWT herd removals. Thus
a general expression of the number of dairy cows in any period (t) is:
(1) Cow numbers = F(cowst-1, CWT removalst, milk pricet-1, feed pricet-1, cull pricet-1)
19
Econometric Model
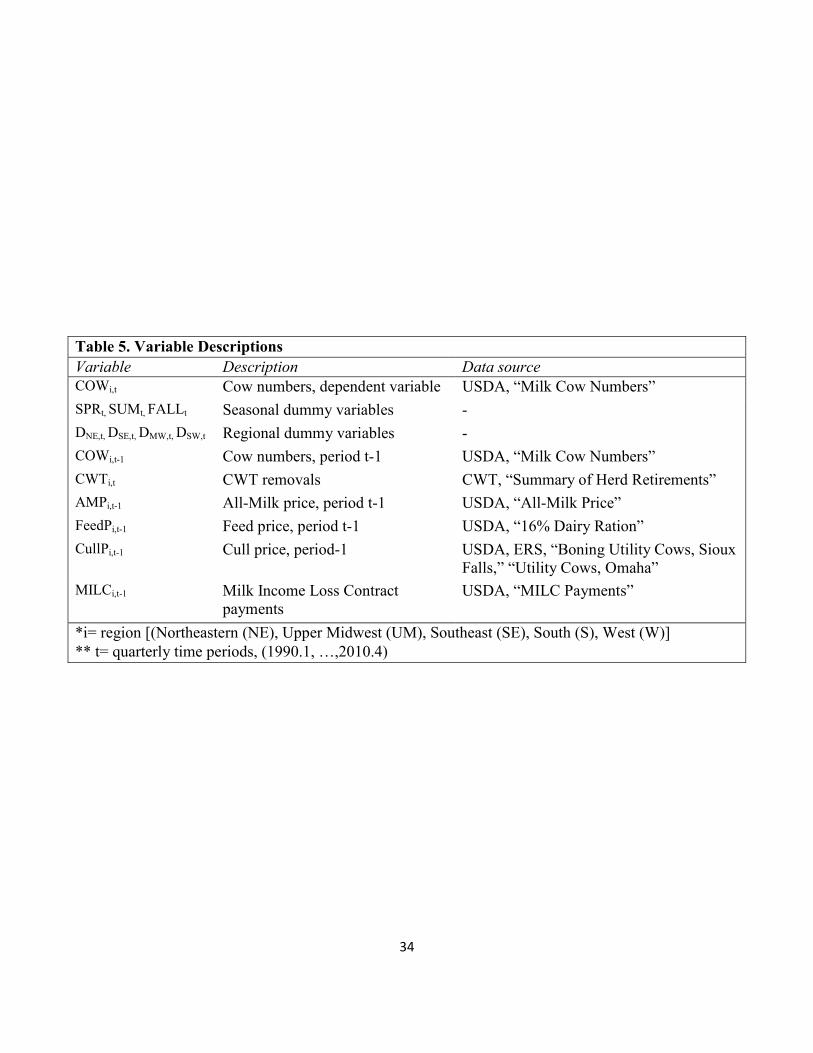
Building on the conceptual model, we specify an empirical model to test our hypotheses
on cow numbers. We posit the following econometric model (Table 5, Variable descriptions):
(1) COWi,t = β0 + βSPRSPRt + βSUMSUMt + βFALLFALLt + βNEDNE,t + βSEDSE,t + βMWDMW,t + βSWDSW,t
+ βlagcowCOWi,t-1 + βCWTCWTi,t + βAMPAMPi,t-1 + βfeedFeedPi,t-1 + βcullCullPi,t-1 + βMILCMILCi,t-1 + εi,t
Based on our previous discussion of slippage, we use the econometric model in (1) to test the
hypothesis that there is no slippage in cow numbers with the use of CWT removals. Specifically
we test:
Ho: βCWT = 1 HA: βCWT < 1
Our null hypothesis representing everything we do not expect is stated that for every one
cow that CWT removes, the national herd size would fall by one cow. The alternative
hypothesis implies slippage. That is for every cow that CWT removes its actual effect as seen in
the following quarter is less than one. This is consistent with our hypothesis that slippage does
exist.
20
Data
Quarterly data is used to account for the seasonal nature of milk production. We also use
data starting in 1990 and spanning until 2010. CWT’s herd retirements existed from 2003 to
2010, and occurred in only ten quarters of the duration of time. Data was also recorded by
region. In this study all price information was identical amongst regions, while reported cow
numbers and CWT removals varied between all the different regions. This research aims to find
the effect that CWT removals have on the number of cow milking nationally. In creating an
econometric model, we used cow numbers (COWi,t) as the dependent variable upon which all
other variables were regressed. The number of milking cows was collected quarterly from 1990
to 2010. The total number of dairy cows producing has decreased on average since 1990 (Figure
2). Ending 2010 there were 9.96 million less milking cows that had been producing in 1990.
This is an 8.5% difference in herd size seen in twenty years.
Seasonality was also incorporated into the model through the use of quarterly dummy
variables. Amongst the data are three dummy variables to account for spring (SPRt), summer
(SUMt), and fall (FALLt). CWT removals and cow numbers varied amongst the regions.
Therefore regional dummy variables have been added to the equation to adjust the intercept for
the different regions. Five regions are included in the CWT model and listed previously include
the Northeast, Southeast, Midwest, Southwest, and West. We chose to divide the nation into
these sections based on the regional removals that were set by CWT. Dummy variables in the
model were incorporated to include the Northeast (NEt), the Southeast (SEt), the Midwest
(MWt), and the Southwest (SWt). Collectively these seasonal and regional dummy variables
work together to create the intercept of the model.
21
According to our results, account for 98.9% of the variation from quarter to quarter are
the number of cows lagged (COWi,t-1). We would expect lagged cow numbers to closely follow
the trend in cow numbers. Lagged cow numbers are lagged just one period, or one quarter of a
year. This is done to be consistent and reflect the seasonality of milk production. This also
introduces a time series characteristic of the data used in this model. We included this variable
because the biology of a cow inclines her to multiple consecutive time periods within this model.
Central to this study was the CWT variable which represented our variable of interest. It
was regressed on the number of cows to find its effect and to discover how well it explained the
degree of variation in the number of milking cows changing from quarter to quarter. As stated
earlier and evident in the graph below, CWT removals varied amongst different periods and from
region to region depending on the number of bids accepted. CWT herd retirements were largest
in 2009 removing over 200,000 milking cows from production, and absent in 2006 when no herd
retirements existed. The graph below shows the number of milking cows in the U.S., the
number of cows removed through CWT in the years 2003 to 2010, and also the ratio of CWT
removals on total milking cow numbers (Table 4, CWT of milking cows). The CWT removals
range from 0.34% in 2010 to 2.19% in 2009 of the total U.S. milking herd. CWT herd
retirements effect on the total number of cows milking in the U.S. is actually significantly
smaller due to a large amount of slippage.

22
Several variables have also been included in the model to account for average prices
either paid or received by dairy producers. In this model, the data in this section does not vary
amongst the different regions. Included in the model are feed prices (FeedPi,t-1), cull cow prices
(CullPi,t-1), the all-milk price (AMPi,t-1), and MILC (MILCi,t-1) payments made to dairy
producers. The feed prices represent a cost to dairy producers, whereas the all-milk price, MILC
payments, and cutter prices represent income for dairy producers. These factors represent the
core of economics as farmers see it, in terms of costs and benefits. Each variable is also lagged
in this equation because the effects they have on total cow numbers will be seen in the following
quarter. We expect each of these variables to be significant in the choices that producers must
make to cull or keep producing cattle. We would expect as the benefits increase total cow
numbers decrease at a lesser rate. We expect the reciprocal to be true of costs. As costs
increase, the number of cows could be expected to decline at a faster rate. All-milk price, MILC
payments, and cull prices all increase incomes received to dairy farmers. As previously graphed,
all-milk price is seeing more dramatic high and low swings in most recent years.
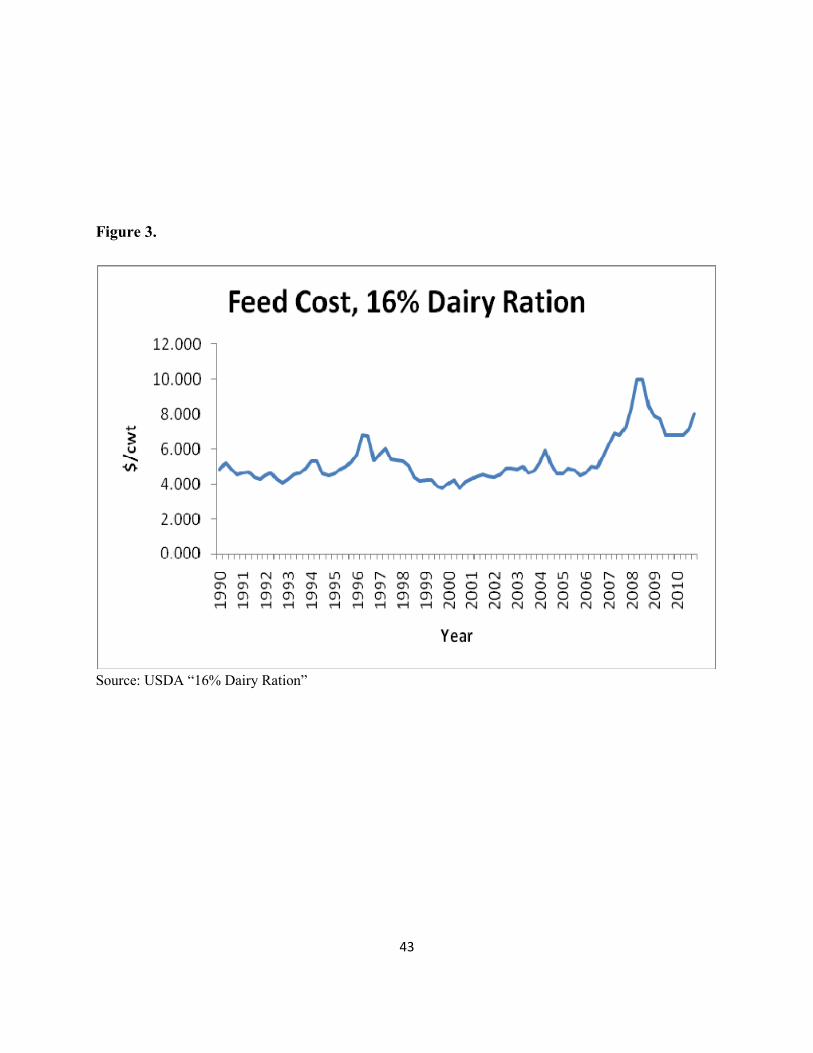
Dairy farmers have not only seen a volatile milk price, but have also been experiencing
steadily increasing expenses. Feed prices (FeedPi,t-1) which serve as a major cost to dairy
producers have also become typified by the extreme high and dramatic drops (Figure 3). None
the less, the dairy ration and its components are essential to milk production. For the purpose of
this study a 16% (protein) dairy ration was used to account for the feed price (USDA). The feed
price associated is lagged because we expect that feed prices in this quarter will affect the milk
production of next quarter. The figure below provides a visual of the trend in feed prices typical
of a 16% dairy ration from quarterly, 1990 to 2010.
23
Results and Implications
Parameter estimates and their associated p-values are found through a regression analysis
(Table 6). We find that most coefficient estimates are as we would expect them. Lagged feed
prices and also CWT removals have a negative effect on herd size. All-Milk prices and MILC
payments both have a positive effect on total cow numbers as we would expect. Further, we find
strong serial correlation in cow numbers, as expected. The coefficient on cull cow prices are is
the only parameter we estimated with an unexpected sign; we would higher cull prices to
encourage herd reductions and therefore have a negative effect of total the total herd size. But
this estimate is statistically indistinguishable from zero at the 5% significance level. All other
variables are significant at the 5% level.
With regards to CWT, the estimated CWT coefficient is -0.491 with a p-value of 0.000.
We reject the null hypothesis, H0: β = 1. This estimated is consistent with a significant degree of
slippage in the CWT her retirement program. For every 100 cows removed through CWT in a
quarter we estimate that the national herd size decreases by approximately 49 cows in the same
quarter. Our estimate is consistent with Bausell, Belsey, and Smith who found a 10% associated
with the airy herd retirement of 1986.
The small immediate effect of CWT on national herd size suggests a significant amount
of slippage in the short-run. As discussed above, slippage may result from supply response to
favorable changes or anticipation of favorable changes in prices and market conditions. For
example, Erba and Novakovic (1995) found that producers under the Milk Diversion program
felt no need to continue at reduced production levels and immediately increased production at or
24
higher than previous production levels. Slippage could also be a result of removing cows that
would have been culled even in the absence of the CWT herd retirement program.
The estimated slippage rate significantly reduces the effect of the program on the size of
the U.S. dairy herd, and thus on milk production and milk prices. For example, in the most
active round of herd retirements (second quarter 2009) CWT bought out 101,040 cows.
However, due to slippage we calculate the actual net reduction in the total U.S. herd size in the
immediate quarter was approximately 49,600 cows.
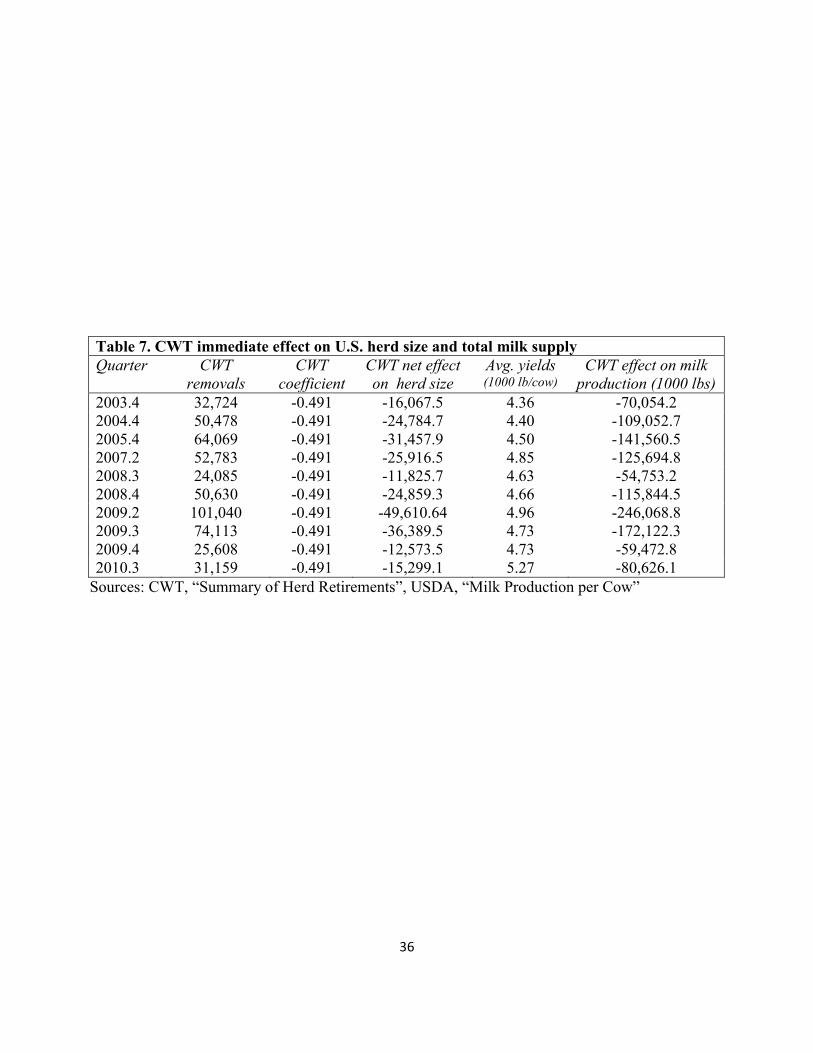
Slippage similarly reduces CWT’s impact on aggregate milk production. I use average
yields to calculate the short-run impact on U.S. milk production (Table 7). Because the dairy
herd shrinks by only 49% of CWT removals, CWT reduces milk production by only 49% of the
production of retired cows. Slippage also dilutes the impact of CWT on aggregate milk prices.
In table 8 we report the price impact for a range of plausible values for the elasticity of demand
for milk. The percent changes in price vary with the range of elasticity from 0.7% (for demand
elasticity of -0.8) to 5.4% (for demand elasticity of -0.1. Within the quarter of heavy retirements,
in the second quarter of 2009 we apply the range of price elasticity to the price received to dairy
producers, $11.60/cwt, to find that CWT removals potentially raised All-Milk price by between
$0.08/cwt and $0.62/cwt in the same quarter (Table 9).
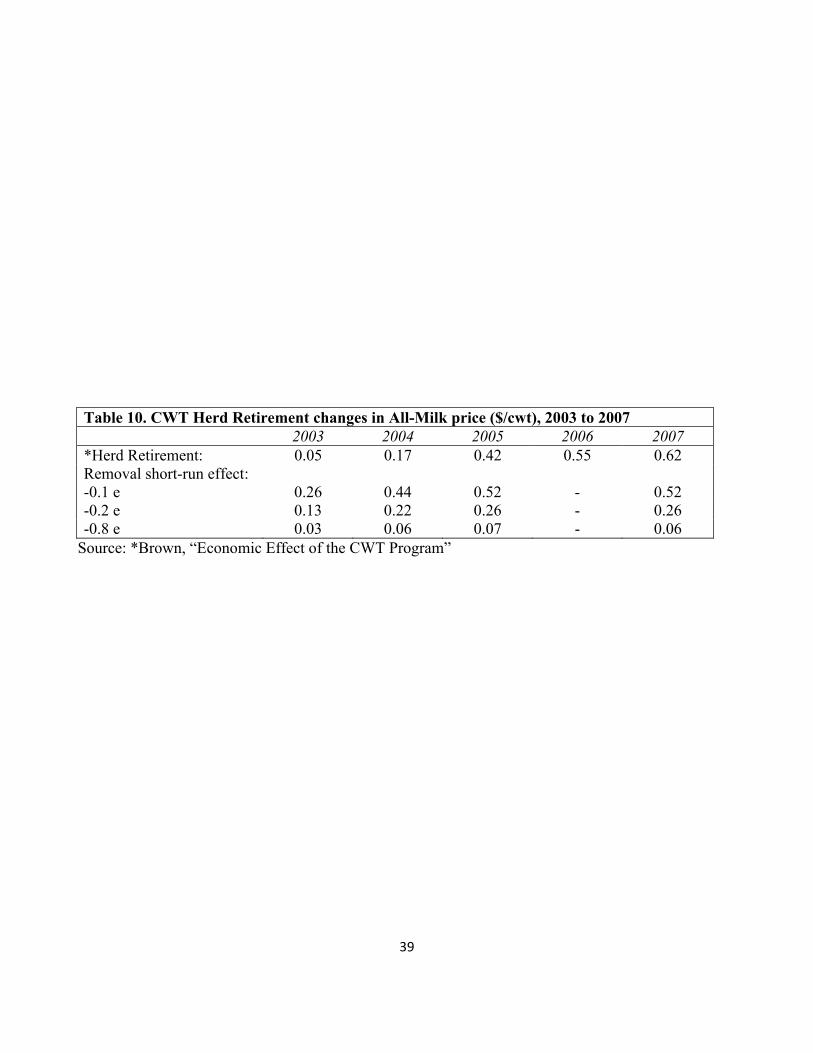
Previous studies by Brown analyze the effects of CWT’s Herd Retirements on All-Milk
prices received by dairy producers between 2003 and 2007. These results by Brown are
published and represent the CWT’s claimed impact on milk prices (Table 10). The econometric
model used in published results of the CWT impact makes several assumptions in regards to
CWT’s Herd Retirement, including: incorporates eight herd retirements, explicit accounting of
CWT cows removed and the loss of their future heifer calves, supply response from higher
25
prices, and as well bred heifers removed through retirements are included (Brown). In our
research we calculate the short-run impact of CWT’s actual ten herd removals on returns made to
producers’ investments and find that Brown’s calculated effect on milk prices fall within the
range of results we expect given plausible price elasticities of milk. For example, in the first
year of removals, 2003 which we assume is devoid of compounding effects of CWT removals,
we find that within a price elasticity range -0.1 to -0.8 we find that CWT’s impact of prices
received to dairy farmers falls between $0.26/cwt and $0.03/cwt. Brown’s analysis of CWT’s
impact also shows the cumulative effects as each herd retirement adds to the impact on the dairy
market from periods previous. We hypothesize that the effect of removing one cow today
accumulates over time and heifers unborn to removed cows this period will be absent from
production in future periods and as will the heifers of the offspring of the initially removed cow,
and so on. The effect of removing one cow today grows and compounds with each consecutive
quarter and accelerates with every herd removal. However, where we assume CWT removals
compound over time, Brown calculates that the impact of each removal diminishes with each
passing period.
While the short-run impact of CWT is small. Our study also finds that the long-run effect
of removing 100 cows through CWT in this quarter reduces the national herd size by nearly 47
cows in the future. The research question resonates in whether the associated price
responsiveness is sufficient enough to exceed the initial investment if producers and effective
enough to compensate in a timely manner. Particularly the previous study of supply controls
such as in the analysis of some 1980’s dairy programs, Bausell, Belsey, and Smith found similar
slow responses in cow numbers. Supply control programs also failed to be as efficient as
26
lowering support prices in achieving substantial reductions in herd sizes (Bausell, Belsey, and
Smith).
The long lasting effect though can be explained by compounding factors, such as dairy
herd dynamics that prove removing one producing cow today is magnified over time. Our
results suggest that the CWT herd buyouts may be an imperfect tool for managing short-run
price volatility in dairy markets. Further, these CWT reductions continue to influence the total
U.S. herd size and total milk production in the future when reduced cow numbers may not be
desirable. Overall CWT had a small short-run impact on the total number of milking cows and
the total domestic milk production while its long term effect was much larger.
27
Selected Bibliography
Chen, D., R. Courtney, and A. Schmitz, “A Polynomial Lag Formulation of Milk Production Response,” American Journal of Agricultural Economics, 54(1972): 77-83.
CWT, “Dairy Farmers Turning Dimes into Dollars 2008,” Internet site: http://www.cwt.coop/ (Accessed January 20, 2009)
CWT, “Summary of Herd Retirements,” Internet site: http://www.cwt.coop/sites/default/files/pdf/past-herd-retirements-110810.pdf (Accessed January 20, 2011)
Bausell, Charles W., Belsey, David A., Smith, Scott L. “An Analysis of 1980s Dairy Programs and Some Policy Implications,” American Agricultural Economics Association, (August 1992): 605-616.
Bozic, Marin, Gould, Brian W. “The Dynamics of the U.S. Milk Supply: Implications for Changes in U.S. Dairy Policy,” University of Wisconsin-Madison Department of Agricultural & Applied Economics, Staff Paper Series, (July 2009): 1-10.
Brown, Scott, “The Economic Effect of the CWT Program,” CWT slides, (November 2009), (Accessed April 28, 2011)
Bryant, Henry L., Outlaw, Joe L., Anderson, David. “Aggregate Milk Supply Response to the Milk Income Loss Contract Program,” Journal of Agribusiness, 25,2 (Fall 2007): 133-146.
Chavas, Jean-Paul, Klemme, Richard M. “Aggregate Milk Supply Response and Investment Behavior on U.S. Dairy Farms,” American Agricultural Economics Association, (February 1986): 55-67.
Dahlgran, R. A., “A Synthesis of Microeconomic Duality Theory and Distribution Lag Modeling with Implications for the U.S. Dairy Policy,” N orth Central Journal of Agricultural Economics 7(1985): 132-144.
Dixon, Bruce L., Susanto, Dwi, Berry, Calvin R., "Supply Impact of the Milk Diversion and Dairy Termination Programs," American Agriculture Economics Association, (1991): 633-640.
Gale Jr., Frederick H. “Econometric Analysis of Farmer Participation in the Dairy Termination Program in North Carolina and Virginia,” Southern Journal of Agriculture Economics, (July 1990): 123-132.
Glaser, Lawrene K. "Provisions of the Food Security Act of 1985," American Journal of Agriculture Economics, 1-6.
Hammond, J.W., “Regional Milk Supply Analysis,” Department of Agriculture and Applied Economics Staff Paper pp. 12-74, University of Minnesota, (July 1974).
Hutton, P., and P. Helmberger, Aggregative Analysis of U.S. Dairy Policy, Res. Div. College of Agricultural and Life Sciences, University of Wisconsin, (1982).
28
Erba, Eric M., Novakovic, Andrew M., “The Evolution of Milk Pricing and Government Intervention in Dairy Markets,” Cornell Dairy Markets and Policy, (February 1995): 1-16.
Jesse, Edward V., “Dairy Policy in the Next Farm Bill: An Early Assessment,” Marketing and Policy Briefing Paper, (March 2005): 1-13.
Kessel, Reuben, “Economic Effects of Federal Regulation of Milk Markets,” Journal of Law and Economics, Vol. 10 (October, 1967): 51-78.
LaFrance, Jeffery T., de Gorter, Harry. “Regulation in a Dynamic Market: The U.S. Dairy Industry,” American Agricultural Economics Association, (November 1985): 821-832.
Lee, David R., Boisvert, Richard N., "Factors Affecting Participation in the Milk Diversion Program in the U.S. and New York," N ational Journal of Agricultural and Resource Economics, (October 1985): 193-202.
Shields, Dennis A., “Previewing Dairy Policy Options for the Next Farm Bill,” Congressional Research Service Report for Congress, (December 2010): 1-20.
USDA, Agricultural Marketing Service, “Qualification of Milk Marketing Cooperative Associations,” (March 7, 2008): Internet site: http://www.ams.usda.gov/ (Accessed February 10, 2009)
USDA, Economic Research Service, “Boning Utility Cows, Sioux Falls,” Agricultural Outlook, (Jan./Feb. 1990- December 1990, June 1991-Jan./Feb. 2011): Internet archives: http://www.ers.usda.gov/publications/ldp/
USDA, Economic Research Service, “Utility Cows, Omaha,” Agricultural Outlook, (Jan./Feb. 1991-May 1991): Internet archives: http://www.ers.usda.gov/publications/ldp/
USDA, National Agricultural Statistics Service, “16% Dairy Ration,” Retrieved from Gould, Brain UW Madison Internet site: http://future.aae.wisc.edu/data/monthly_values/by_area/3001?area=US&tab=costs&grid=true (Accessed March 30, 2011)
USDA, National Agricultural Statistics Service, “All-Milk Price,” Retrieved from Gould, Brian, UW Madison Internet site http://future.aae.wisc.edu/data/monthly_values/by_area/10?area=US&tab=prices&grid=true (Accessed March 31, 2011)
USDA, National Agricultural Statistics Service, “Milk Cow Numbers,” Retrieved from Gould, Brian, UW Madison Internet site: http://future.aae.wisc.edu/data/monthly_values/by_area/97?area=US&tab=production&grid=true (Accessed March 29, 2011)
USDA, National Agricultural Statistics Service, “Milk Production per Cow,” Retrieved from Gould, Brian, UW Madison Internet site: http://future.aae.wisc.edu/data/monthly_values/by_area/98?area=US&tab=production&grid=true (Accessed March 30, 2011)
29
USDA, National Agricultural Statistics Service, “MILC Payments,” Retrieved from Gould, Brian, UW Madison Internet site: http://future.aae.wisc.edu/data/monthly_values/by_area/2344?area=US&tab=prices&grid=true (Accessed March 28, 2011)
USDA, National Agricultural Statistics Service, “Monthly Milk Production,” Retrieved from Gould, Brian, UW Madison Internet site: http://future.aae.wisc.edu/data/monthly_values/by_area/99?area=US&tab=production&grid=true (Accessed December 15, 2010)
USDA, Rural Development, “Cooperatives in the Dairy Industry,” Cooperative Information Report1 Section 16, (September 2005): 3-17.
Wipf, L. and J.P. Houck, “Milk Supply Response in the United States- An Aggressive Analysis,” Agricultural Economics Rep. No. 532, University of Minnesota, (July 1967).
30
Tables and Figures
Table 1. Feed cost, %16 dairy ration ($/cwt), 1990-2010
Year Minimum Maximum Standard deviation Average 1990 4.55 5.19 0.26 4.86 1991 4.29 4.67 0.19 4.49 1992 4.08 4.66 0.25 4.37 1993 4.29 4.91 0.25 4.60 1994 4.48 5.33 0.45 4.93 1995 4.59 5.25 0.28 4.92 1996 5.38 6.78 0.72 6.15 1997 5.34 6.02 0.32 5.62 1998 4.20 5.31 0.53 4.73 1999 3.75 4.22 0.24 4.01 2000 3.79 4.25 0.20 4.04 2001 4.30 4.52 0.09 4.41 2002 4.40 4.91 0.26 4.68 2003 4.65 4.98 0.15 4.80 2004 4.58 5.92 0.55 5.20 2005 4.49 4.88 0.19 4.69 2006 4.62 5.63 0.43 5.04 2007 6.29 7.20 0.38 6.81 2008 8.34 9.99 0.91 9.19 2009 6.81 7.86 0.57 7.30 2010 6.79 8.05 0.59 7.20
Source: USDA, “16% Dairy Ration”
31
Table 2. All-Milk Price ($/cwt), 1990-2010
Year Minimum Maximum Standard deviation Average 1990 12.50 14.63 0.90 13.68 1991 11.33 13.73 1.08 12.24 1992 12.87 13.47 0.27 13.09 1993 12.30 13.40 0.46 12.80 1994 12.47 13.50 0.42 12.97 1995 12.23 13.77 0.70 12.74 1996 13.93 15.93 0.91 14.88 1997 12.63 14.53 0.89 13.34 1998 13.83 17.93 1.76 15.50 1999 12.83 15.93 1.33 14.36 2000 11.87 12.67 0.41 12.32 2001 13.33 16.60 1.39 14.97 2002 11.33 13.10 0.73 12.11 2003 11.00 14.40 1.61 12.52 2004 14.10 18.53 1.85 16.05 2005 14.77 15.67 0.39 15.13 2006 11.93 13.87 0.94 12.88 2007 15.00 21.67 3.18 19.13 2008 16.80 19.23 1.06 18.33 2009 11.60 15.40 1.73 12.83 2010 15.07 17.70 1.19 16.29
Source: USDA, “All-Milk Price”
32
Table 3. CWT Retirements Summary Statistics Year Farms Accepted Cows removed Milk removed (mil. lbs) Avg. herd size 2003 299 32,724 609 109 2004 363 50,478 908 139 2005 442 64,069 1,174 145 2006 - - - - 2007 333 52,783 1,001 159 2008 387 75,215 1,408 197 2009 791 200,493 3,988 238 2010 187 31,159 584 167 Totals 2,802 506,921 9,672 181
Source: CWT “Summary of Herd Retirements”
33
Table 4. CWT Herd Retirements and U.S. Dairy Herd Size (1000 head), 2003-2010 Year U.S. Dairy Herd CWT Retirements Ratio, CWT to U.S. Herd 2003 9,036.4 32.724 0.36% 2004 9,005.2 50.478 0.56% 2005 9,074.0 64.069 0.71% 2006 9,139.5 - - 2007 9,219.3 52.783 0.57% 2008 9,315.1 74.715 0.80% 2009 9,148.7 200.761 2.19% 2010 9,117.0 31.159 0.34%
Source: CWT “Herd Retirement Summary”, USDA “Milk Cow Numbers”
34
Table 5. Variable Descriptions Variable Description Data source COWi,t Cow numbers, dependent variable USDA, “Milk Cow Numbers”
SPRt, SUMt, FALLt Seasonal dummy variables -
DNE,t, DSE,t, DMW,t, DSW,t Regional dummy variables -
COWi,t-1 Cow numbers, period t-1 USDA, “Milk Cow Numbers”
CWTi,t CWT removals CWT, “Summary of Herd Retirements” AMPi,t-1 All-Milk price, period t-1 USDA, “All-Milk Price”
FeedPi,t-1 Feed price, period t-1 USDA, “16% Dairy Ration”
CullPi,t-1 Cull price, period-1 USDA, ERS, “Boning Utility Cows, Sioux Falls,” “Utility Cows, Omaha”
MILCi,t-1 Milk Income Loss Contract payments
USDA, “MILC Payments”
*i= region [(Northeastern (NE), Upper Midwest (UM), Southeast (SE), South (S), West (W)] ** t= quarterly time periods, (1990.1, …,2010.4)

35
Table 6. OLS Estimates of the U.S. Cow N umbers Equation Variable Coefficient Estimate P-value Intercept 11.730 0.063 SPRt -1.802 0.218 SUMt 3.733 0.007 FALLt 1.480 0.296 DNEt -26.694 0.000 DSEt -37.554 0.000 DMWt -17.297 0.000 DSWt -22.307 0.000 COWi,t-1 0.989 0.000 CWTi,t -.491 0.000 AMPi,t-1 1.936 0.000 FeedPi,t-1 -1.368 0.009 CullPi,t-1 0.123 0.086 MILCi,t-1 2.288 0.046 R2 0.999
36
Table 7. CWT immediate effect on U.S. herd size and total milk supply Quarter CWT
removals CWT
coefficient CWT net effect on herd size
Avg. yields (1000 lb/cow)
CWT effect on milk production (1000 lbs)
2003.4 32,724 -0.491 -16,067.5 4.36 -70,054.2 2004.4 50,478 -0.491 -24,784.7 4.40 -109,052.7 2005.4 64,069 -0.491 -31,457.9 4.50 -141,560.5 2007.2 52,783 -0.491 -25,916.5 4.85 -125,694.8 2008.3 24,085 -0.491 -11,825.7 4.63 -54,753.2 2008.4 50,630 -0.491 -24,859.3 4.66 -115,844.5 2009.2 101,040 -0.491 -49,610.64 4.96 -246,068.8 2009.3 74,113 -0.491 -36,389.5 4.73 -172,122.3 2009.4 25,608 -0.491 -12,573.5 4.73 -59,472.8 2010.3 31,159 -0.491 -15,299.1 5.27 -80,626.1
Sources: CWT, “Summary of Herd Retirements”, USDA, “Milk Production per Cow”

37
Table 8. Supply changes and price responses with respective elasticities for milk Quarter %ϪQ %ϪP (-0.1 e) %ϪP (-0.2 e) %ϪP (-0.8 e) 2003.4 -0.0017 0.018 0.009 0.002 2004.4 -0.0028 0.028 0.014 0.003 2005.4 -0.0035 0.035 0.017 0.004 2007.2 -0.0028 0.028 0.014 0.004 2008.3 -0.0013 0.013 0.006 0.002 2008.4 -0.0027 0.027 0.013 0.003 2009.2 -0.0053 0.054 0.027 0.007 2009.3 -0.0040 0.040 0.020 0.005 2009.4 -0.0014 0.014 0.007 0.002 2010.3 -0.0017 0.017 0.008 0.002

38
Table 9. CWT Herd Retirement short-run return on All-Milk Price given different price elasticities for milk, ($/cwt), 2003 to 2010 Quarter -0.1 -0.2 -0.8 2003.4 0.26 0.13 0.03 2004.4 0.44 0.22 0.06 2005.4 0.52 0.26 0.07 2007.2 0.52 0.26 0.07 2008.3 0.24 0.12 0.03 2008.4 0.45 0.22 0.06 2009.2 0.62 0.31 0.08 2009.3 0.48 0.24 0.06 2009.4 0.21 0.11 0.03 2010.3 0.28 0.14 0.04
39
Table 10. CWT Herd Retirement changes in All-Milk price ($/cwt), 2003 to 2007 2003 2004 2005 2006 2007 *Herd Retirement: 0.05 0.17 0.42 0.55 0.62 Removal short-run effect: -0.1 e 0.26 0.44 0.52 - 0.52 -0.2 e 0.13 0.22 0.26 - 0.26 -0.8 e 0.03 0.06 0.07 - 0.06
Source: *Brown, “Economic Effect of the CWT Program”
40
Table 11. U.S. average quarterly milk yields per cow (1000 lbs), 1990-2010
Year Minimum Maximum Standard deviation Average 1990 3.55 3.75 0.09 3.62 1991 3.60 3.81 0.09 3.68 1992 3.72 3.89 0.08 3.79 1993 3.74 3.97 0.11 3.82 1994 3.81 4.03 0.09 3.89 1995 3.83 4.09 0.12 3.94 1996 3.83 4.06 0.10 3.96 1997 3.94 4.18 0.12 4.04 1998 3.98 4.25 0.12 4.10 1999 4.05 4.33 0.12 4.20 2000 4.16 4.43 0.15 4.30 2001 4.19 4.47 0.12 4.31 2002 4.30 4.60 0.15 4.43 2003 4.30 4.59 0.13 4.44 2004 4.38 4.64 0.13 4.50 2005 4.50 4.80 0.13 4.61 2006 4.54 4.85 0.15 4.67 2007 4.61 4.85 0.11 4.70 2008 4.63 4.90 0.13 4.75 2009 4.73 4.96 0.11 4.82 2010 5.21 5.46 0.12 5.29
Source: USDA, “Milk Production per Cow”

41
Figure 1.
Source: USDA “All Milk Price”

42
Figure 2.
Source: USDA “Milk Cow Numbers”
43
Figure 3.
Source: USDA “16% Dairy Ration”
44
Figure 4.
Source: USDA, “Milk Production per Cow”