effect of gypsum on atterberg limits and …ethesis.nitrkl.ac.in/6718/1/shukla_btech_rp_2015.pdf ·...
TRANSCRIPT
i
EFFECT OF GYPSUM ON ATTERBERG LIMITS AND COMPACTION
CHARACTERISTICS OF SOIL
A thesis submitted in partial fulfilment of requirements
For the degree of
BACHELOR OF TECHNOLOGY
IN
CIVIL ENGINEERING
By
Ambuj Shukla
Under guidance of
Dr. R Bag
DEPARMENT OF CIVIL ENGINEERING
NATIONAL INSTITUTE OF TECHNOLOGY
ROURKELA-769008
ii
Abstract:
There are several places in the world particularly middle East Asia and Africa has problem of
gypsum contaminated soil known as gypsiferous soil. Gypsiferous soils cover approximately
100 million hectors in the world. Gypsum not only dissolve in presence of water it also changes
geotechnical properties of soil. In the current study effect of gypsum on Atterberg limits and
compaction character tics of soil was studied. Different percentage of gypsum was added with
a soil from Rourkela to simulate the conditions of Gypsiferous soil. Laboratory test were
conducted to determine effect of gupsum content on liquid limit, plastic limit and compaction
characteristics of soil. It was noted that with increase in gypsum content liquid limit and plastic
limit of soil decreased. The Maximum Dry Density (MDD) was noted to decrease continuously
on increasing gypsum content. Although, some deviation were noted, in general a trend of
increasing Optimum Moisture Content (OMC) was noted with increase in gypsum content.
iii
CERTIFICATE
This is to certify that project entitled “Effect of gypsum on Atterberg limits and compaction
characteristics of soil” submitted by Ambuj Shukla in partial fulfilment of the requirements
for the award of Bachelor of Technology Degree in Civil Engineering at National Institute
of Technology, Rourkela is an authentic work carried out by him under my personal
supervision and guidance. To the best of my insight the matter exemplified in this project thesis
has not been submitted in any College/Institute for granting degree or recognition.
Dr R Bag
Department of Civil Engineering
National Institute of Technology
Rourkela-769008
iv
ACKNOWLEDGEMENT
First and foremost, I take this chance to express my most profound feeling of appreciation to
the Project guide Dr. R Bag for his able guidance, inspiration amid the project work.
I would like to thank National Institute of Technology, Rourkela for giving me the opportunity
to utilize their resources and work in such challenging environment.
I would also like to extend my gratitude to Prof. Shishir Kumar Sahu, Head of the Department
of Civil Engineering, who has always encouraged and supported my work.
I take this chance to express appreciation to the majority of the Department faculties for their
help and backing. I additionally put on record, my feeling of appreciation to everyone, who
directly or indirectly, have lent their hand in this work.
AMBUJ SHUKLA

1
Contents
Page number
1. INTRODUCTION 2
2. LITERATURE REVIEW 3
3. MATERIAL AND METHODS 5
4. RESULT AND ANALYSIS 7
5. CONCLUSION 14
6. REFERENCES 15
List of Tables and Figure
Table 3.1. Properties of soil used in this study
Table 4.1. Variation of liquid limit and plastic limit due to increase in gypsum content
Table 4.2 Variation of OMC and MDD with various percentage of gypsum content.
Figure 4.1. Change in liquid limit and plastic limit with increase in gypsum content
Figure 4.2. The compaction curve without adding gypsum
Figure 4.3. The compaction curve for 0.5% gypsum by weight.
Figure 4.4. The compaction curve for 1% gypsum by weight.
Figure 4.5. Compaction curve for 5% gypsum by weight.
Figure 4.6.The Compaction curve for 10% gypsum by weight.
Figure 4.7. Change in optimum moisture content (OMC) with increase in gypsum content.
Figure 4.7. Change in Maximum Dry Density (MDD) with increase in gypsum content.
2
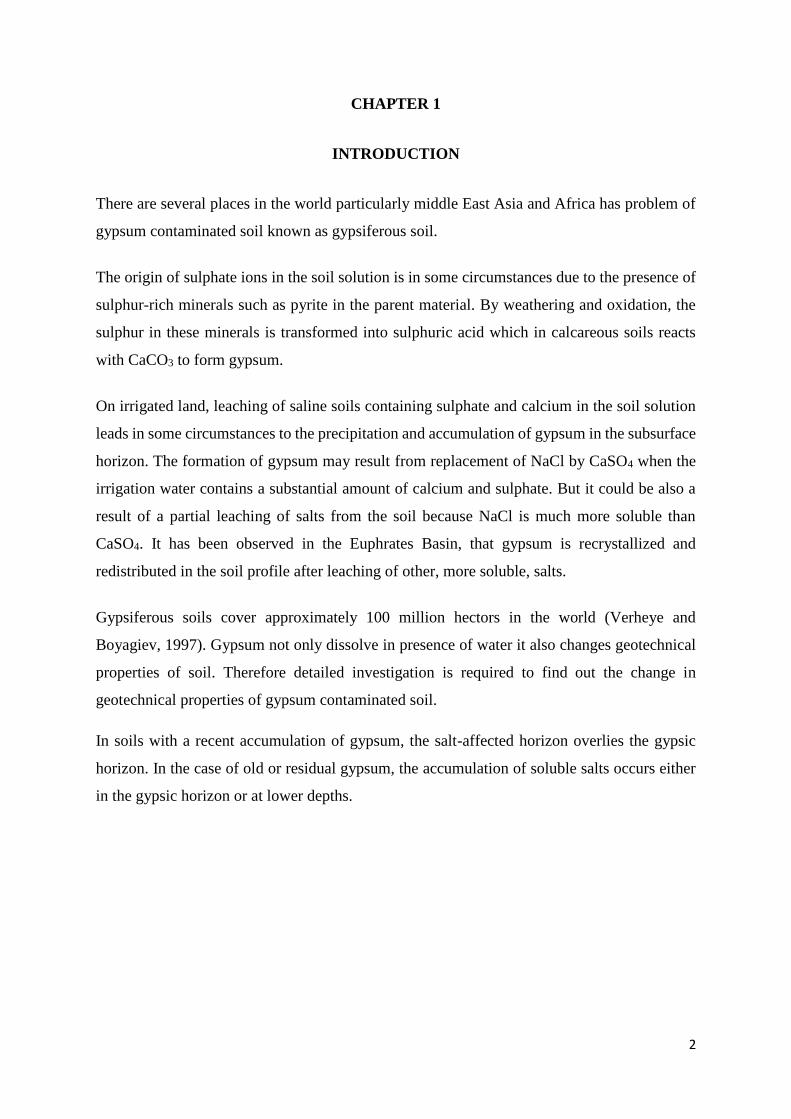
CHAPTER 1
INTRODUCTION
There are several places in the world particularly middle East Asia and Africa has problem of
gypsum contaminated soil known as gypsiferous soil.
The origin of sulphate ions in the soil solution is in some circumstances due to the presence of
sulphur-rich minerals such as pyrite in the parent material. By weathering and oxidation, the
sulphur in these minerals is transformed into sulphuric acid which in calcareous soils reacts
with CaCO3 to form gypsum.
On irrigated land, leaching of saline soils containing sulphate and calcium in the soil solution
leads in some circumstances to the precipitation and accumulation of gypsum in the subsurface
horizon. The formation of gypsum may result from replacement of NaCl by CaSO4 when the
irrigation water contains a substantial amount of calcium and sulphate. But it could be also a
result of a partial leaching of salts from the soil because NaCl is much more soluble than
CaSO4. It has been observed in the Euphrates Basin, that gypsum is recrystallized and
redistributed in the soil profile after leaching of other, more soluble, salts.
Gypsiferous soils cover approximately 100 million hectors in the world (Verheye and
Boyagiev, 1997). Gypsum not only dissolve in presence of water it also changes geotechnical
properties of soil. Therefore detailed investigation is required to find out the change in
geotechnical properties of gypsum contaminated soil.
In soils with a recent accumulation of gypsum, the salt-affected horizon overlies the gypsic
horizon. In the case of old or residual gypsum, the accumulation of soluble salts occurs either
in the gypsic horizon or at lower depths.
3
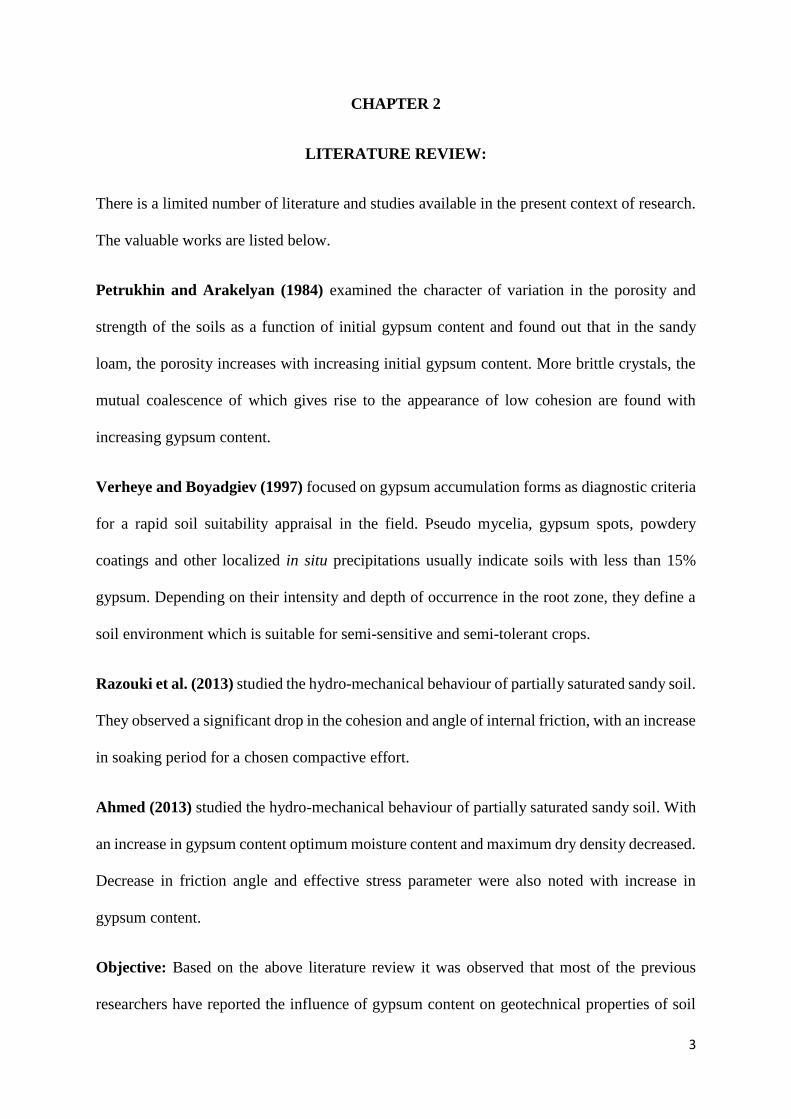
CHAPTER 2
LITERATURE REVIEW:
There is a limited number of literature and studies available in the present context of research.
The valuable works are listed below.
Petrukhin and Arakelyan (1984) examined the character of variation in the porosity and
strength of the soils as a function of initial gypsum content and found out that in the sandy
loam, the porosity increases with increasing initial gypsum content. More brittle crystals, the
mutual coalescence of which gives rise to the appearance of low cohesion are found with
increasing gypsum content.
Verheye and Boyadgiev (1997) focused on gypsum accumulation forms as diagnostic criteria
for a rapid soil suitability appraisal in the field. Pseudo mycelia, gypsum spots, powdery
coatings and other localized in situ precipitations usually indicate soils with less than 15%
gypsum. Depending on their intensity and depth of occurrence in the root zone, they define a
soil environment which is suitable for semi-sensitive and semi-tolerant crops.
Razouki et al. (2013) studied the hydro-mechanical behaviour of partially saturated sandy soil.
They observed a significant drop in the cohesion and angle of internal friction, with an increase
in soaking period for a chosen compactive effort.
Ahmed (2013) studied the hydro-mechanical behaviour of partially saturated sandy soil. With
an increase in gypsum content optimum moisture content and maximum dry density decreased.
Decrease in friction angle and effective stress parameter were also noted with increase in
gypsum content.
Objective: Based on the above literature review it was observed that most of the previous
researchers have reported the influence of gypsum content on geotechnical properties of soil

4
using soil from Middle East region. There is no work reported on Indian soil showing the effect
of gypsum content on geotechnical properties of soil. Therefore, main objective of the current
study was to study effect of gypsum content on Liquid limit, plastic limit and compaction
characteristics of a low plastic soil from Rourkela.
5
CHAPTER 3
MATERIAL AND METHODS
Low plastic soil from Rourkela was used to for this study. Liquid limit, plastic limit and
specific gravity tests were carried out using distilled water following Indian Standard (IS)
method.
Atterberg Limits –Liquid limit and Plastic limit tests
Atterberg limits are defined as the water content corresponding to different behaviour
conditions of fine-grained soil (silts and clays). The four states of consistency in Atterberg
limits are liquid, plastic, semisolid and solid. The dividing line between liquid and plastic states
is the liquid limit; the dividing line between plastic and semisolid states is the shrinkage limit.
If a soil in the liquid state is gradually dried out, it wills past through the liquid limit, plastic
state, plastic limit, semisolid state and shrinkage limit and reach the solid stage. The liquid,
plastic and shrinkage limits are therefore quantified in terms of the water content at which a
soil changes from the liquid to the plastic state. The difference between the liquid limit and
plastic limit is the plasticity index. Because the liquid limit and plastic limit are the two most
commonly used Atterberg limits, the following discussion is limited to the test procedures and
calculation for these two laboratory tests.
The liquid limit is that moisture content at which a soil changes from the liquid state to
the plastic state. It along with the plastic limit provides a means of soil classification as well as
being useful in determining other soil properties.
Plastic limit is the dividing line between the plastic and semisolid states. From a
physical standpoint, it is the water content at which the soil will begin to crumble when rolled
in small threads. In the current study liquid limit of soil was determined by Casargrande
apparatus.

6
SPECIFIC GRAVITY TEST
Specific gravity of soil solids was determined using a pycnometer. Specific gravity is the ratio
of the mass of unit volume of soil at a stated temperature to the mass of the same volume of
gas-free distilled water at a stated temperature. Indian Standard (IS) test procedure was
followed to determine the Specific Gravity of Soil Solids by Water Pycnometer. The specific
gravity of a soil is used in the phase relationship of air, water, and solids in a given volume of
the soil.
The results obtained by conducting above tests on low plastic soil from Rourkela are presented
in Table 3.1
Table 3.1: Properties of soil used in this study
Properties value
Liquid limit (%) 30
Plastic limit (%) 16.5
Specific gravity 2.73
STANDARD PROCTOR COMPACTION TEST
For construction of highways, airports, and other structures, it is often necessary to compact
soil to improve its strength. Proctor (1933) developed a laboratory compaction test procedure
to determine the maximum dry unit weight of compaction of soils, which can be used for
specification of field compaction. This test is referred to as the Standard Proctor Compaction
Test. In the current study standard Proctor compaction test was carried out for various % of
gypsum content. The proctor mould diameter is 10 cm and height 11.7 cm. The inner volume
is 945 cm3. Weight of hammer is 2.5 kg and the height of fall of the hammer is 30 cm.
7
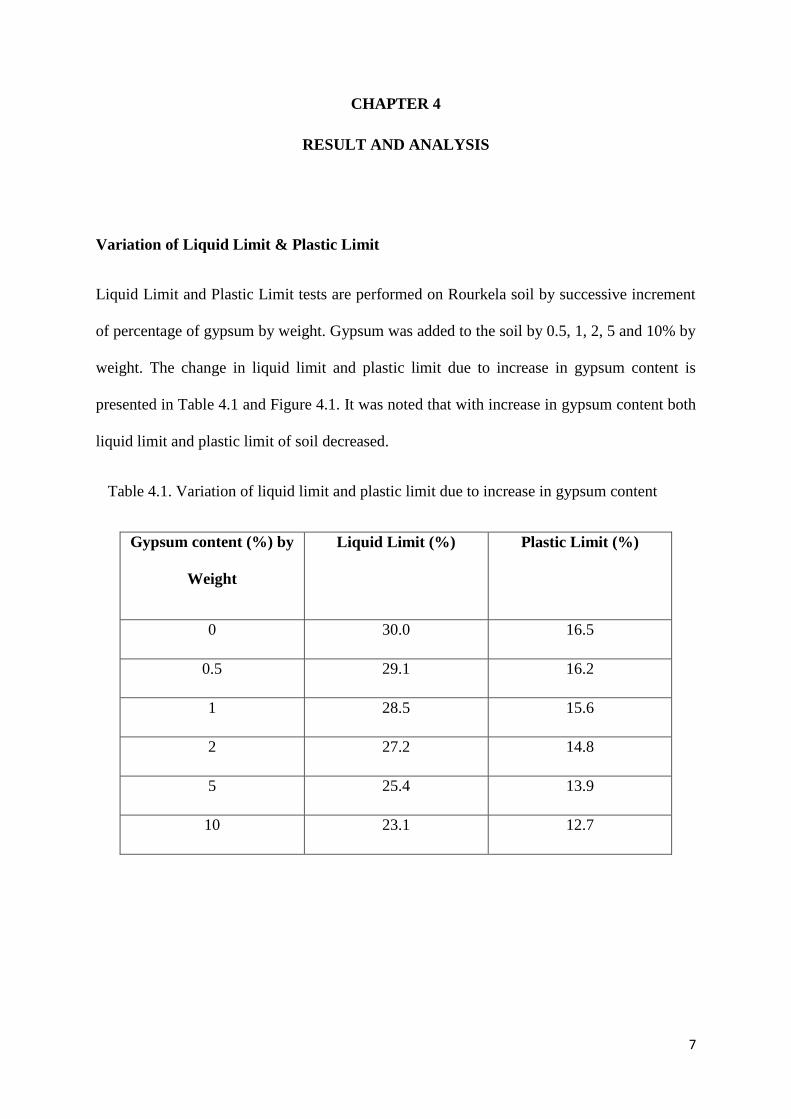
CHAPTER 4
RESULT AND ANALYSIS
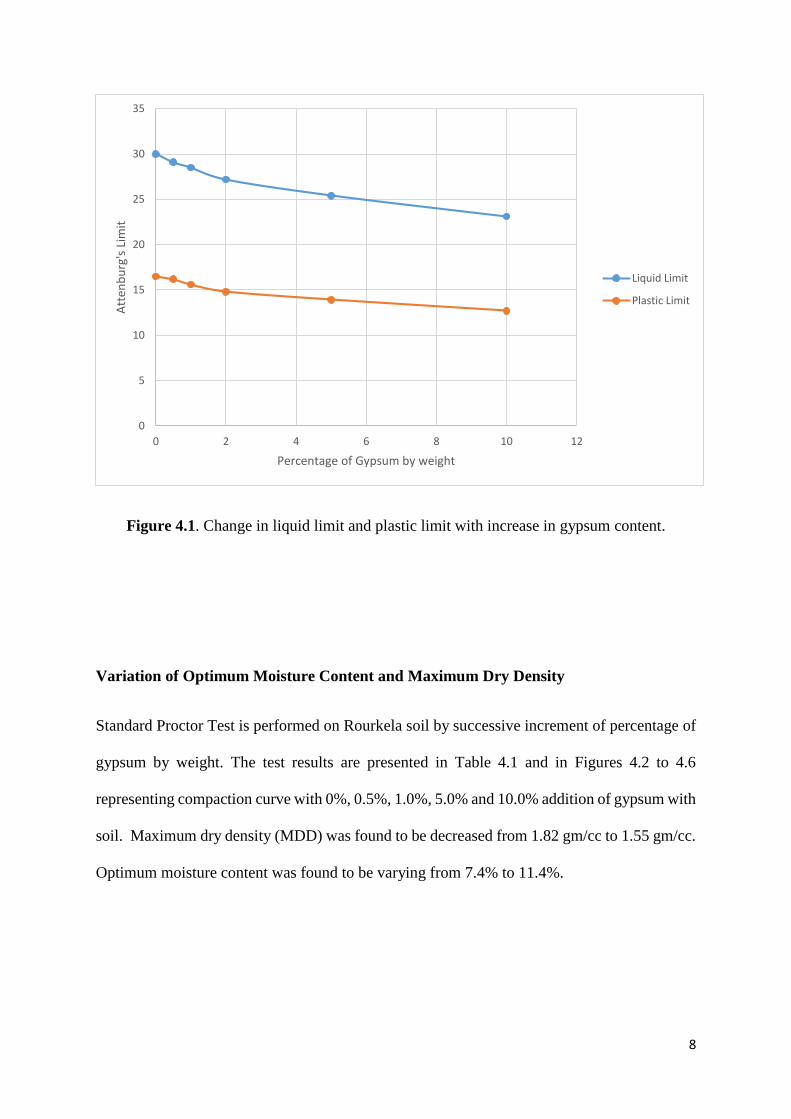
Variation of Liquid Limit & Plastic Limit
Liquid Limit and Plastic Limit tests are performed on Rourkela soil by successive increment
of percentage of gypsum by weight. Gypsum was added to the soil by 0.5, 1, 2, 5 and 10% by
weight. The change in liquid limit and plastic limit due to increase in gypsum content is
presented in Table 4.1 and Figure 4.1. It was noted that with increase in gypsum content both
liquid limit and plastic limit of soil decreased.
Table 4.1. Variation of liquid limit and plastic limit due to increase in gypsum content
Gypsum content (%) by
Weight
Liquid Limit (%) Plastic Limit (%)
0 30.0 16.5
0.5 29.1 16.2
1 28.5 15.6
2 27.2 14.8
5 25.4 13.9
10 23.1 12.7
8
Figure 4.1. Change in liquid limit and plastic limit with increase in gypsum content.
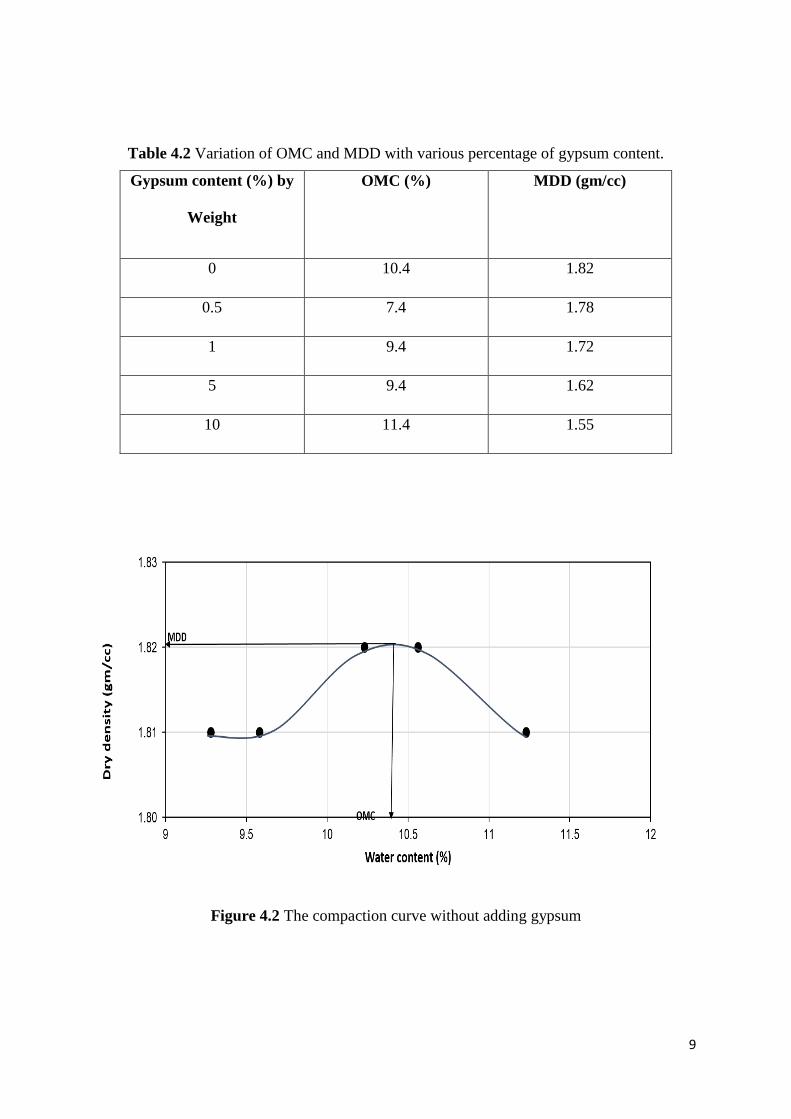
Variation of Optimum Moisture Content and Maximum Dry Density
Standard Proctor Test is performed on Rourkela soil by successive increment of percentage of
gypsum by weight. The test results are presented in Table 4.1 and in Figures 4.2 to 4.6
representing compaction curve with 0%, 0.5%, 1.0%, 5.0% and 10.0% addition of gypsum with
soil. Maximum dry density (MDD) was found to be decreased from 1.82 gm/cc to 1.55 gm/cc.
Optimum moisture content was found to be varying from 7.4% to 11.4%.
0
5
10
15
20
25
30
35
0 2 4 6 8 10 12
Att
enb
urg
's L
imit
Percentage of Gypsum by weight
Liquid Limit
Plastic Limit
9
Table 4.2 Variation of OMC and MDD with various percentage of gypsum content.
Gypsum content (%) by
Weight
OMC (%) MDD (gm/cc)
0 10.4 1.82
0.5 7.4 1.78
1 9.4 1.72
5 9.4 1.62
10 11.4 1.55
Figure 4.2 The compaction curve without adding gypsum
10
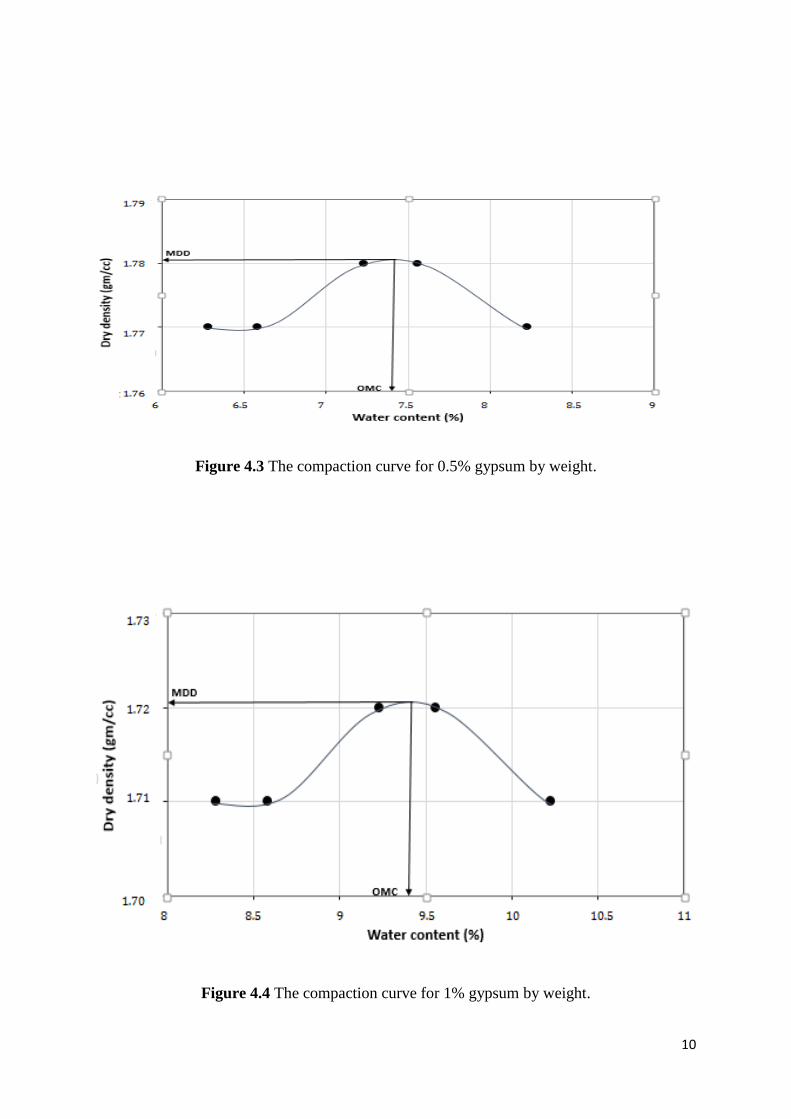
Figure 4.3 The compaction curve for 0.5% gypsum by weight.
Figure 4.4 The compaction curve for 1% gypsum by weight.
11
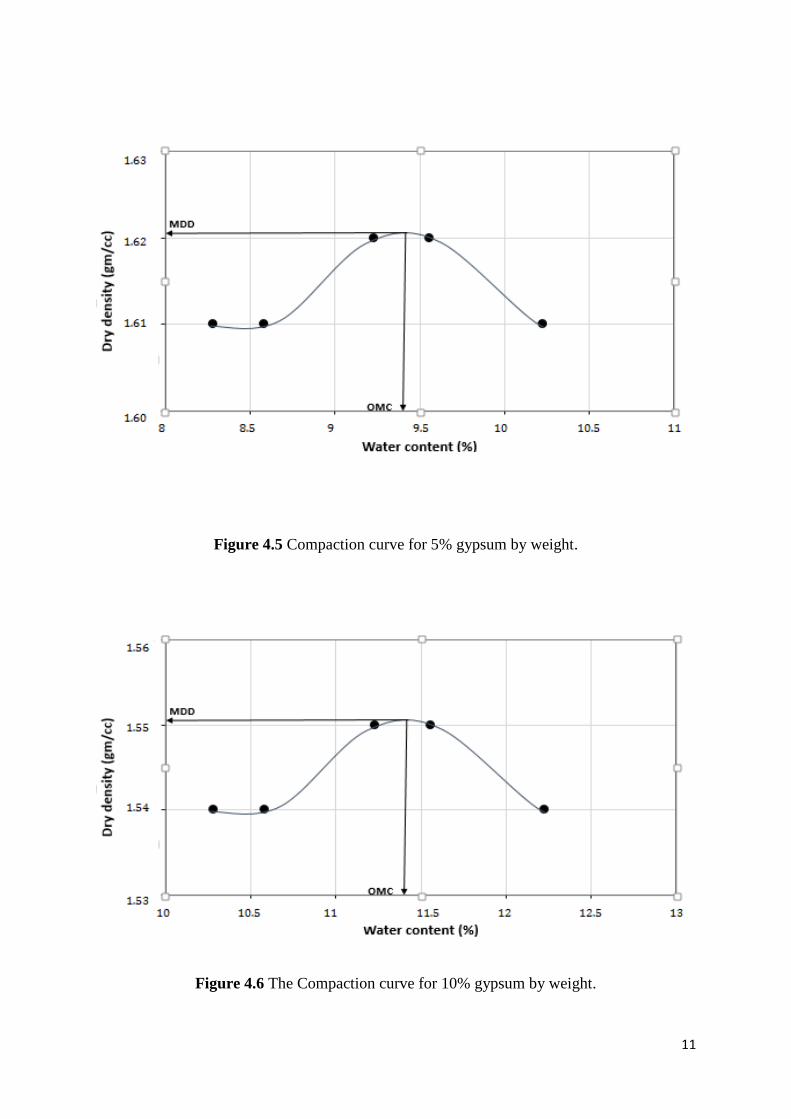
Figure 4.5 Compaction curve for 5% gypsum by weight.
Figure 4.6 The Compaction curve for 10% gypsum by weight.
12
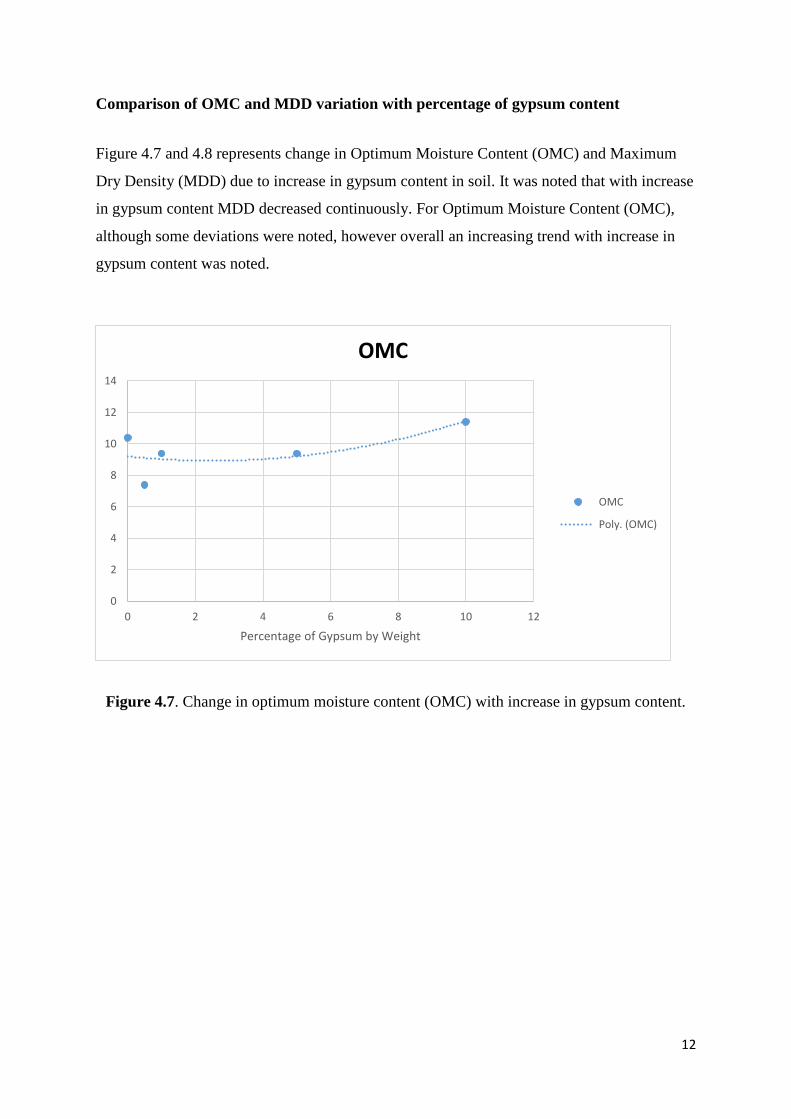
Comparison of OMC and MDD variation with percentage of gypsum content
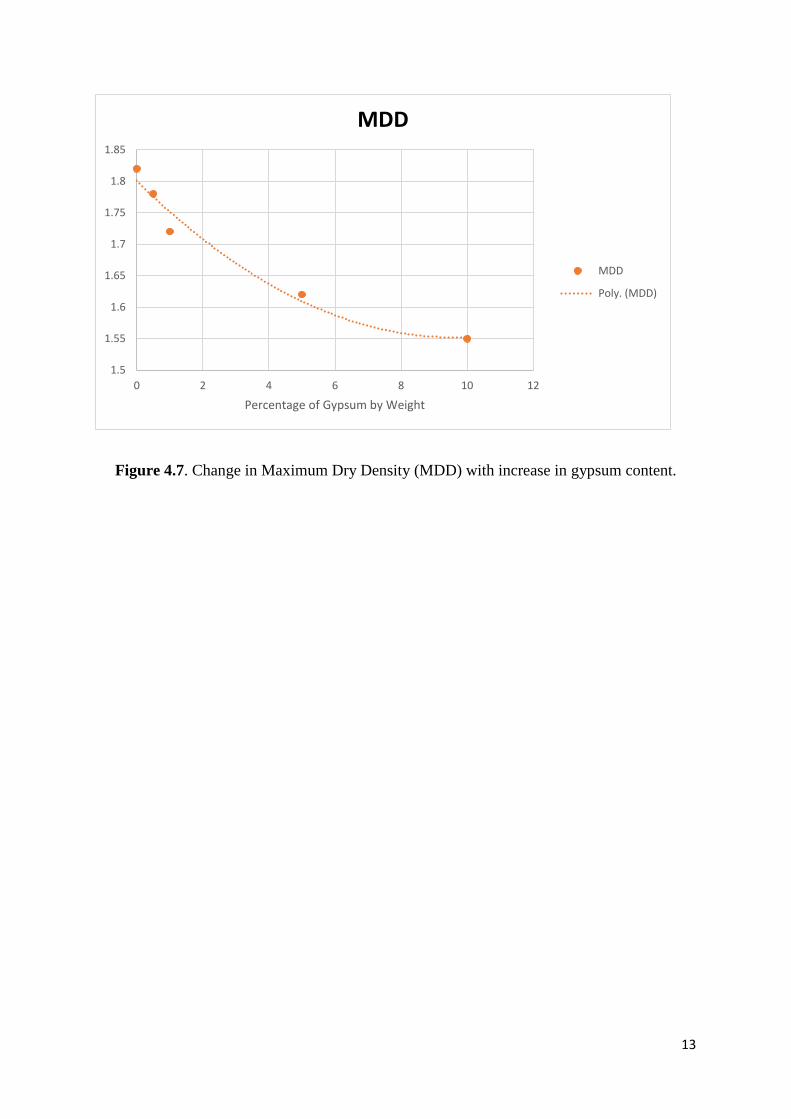
Figure 4.7 and 4.8 represents change in Optimum Moisture Content (OMC) and Maximum
Dry Density (MDD) due to increase in gypsum content in soil. It was noted that with increase
in gypsum content MDD decreased continuously. For Optimum Moisture Content (OMC),
although some deviations were noted, however overall an increasing trend with increase in
gypsum content was noted.
Figure 4.7. Change in optimum moisture content (OMC) with increase in gypsum content.
0
2
4
6
8
10
12
14
0 2 4 6 8 10 12
Percentage of Gypsum by Weight
OMC
OMC
Poly. (OMC)
13
Figure 4.7. Change in Maximum Dry Density (MDD) with increase in gypsum content.
1.5
1.55
1.6
1.65
1.7
1.75
1.8
1.85
0 2 4 6 8 10 12
Percentage of Gypsum by Weight
MDD
MDD
Poly. (MDD)
14
CHAPTER 5
CONCLUSIONS
Based on the laboratory tests carried out on a low plastic soil from Rourkela, the following
conclusions can be drawn.
The Liquid limit and plastic limit of soil was found to decrease with increase in the
percentage of gypsum content.
The Maximum Dry Density (MDD) was noted to decrease continuously on increasing
gypsum content.
Although, some deviation were noted, in general a trend of increasing Optimum
Moisture Content (OMC) was noted with increase in gypsum content.
15
REFERENCES:
Ahmed, K.I., (2013), Effect of gypsum on the hydro-mechanical characteristics of partially
saturated sandy soil, PhD thesis, Cardiff University.
Bjerrum, L., (1997), Engineering Geology of Norwegian Normally Consolidated Marine
Clay as Related to Settlement of Building, Geotechnique, 17, 81–118.
IS 2720 (Part- 5), (1985), Method of test for soil, determination of liquid limit and plastic
limit, Indian Standards Institution, New Delhi.
Murthy, V.N.S., (1993), Principles of soil mechanics and foundation engineering, 5th
Edition, UBS publishes distributors Pvt Ltd., New Delhi.
Petrukhin, V.P. and Arakelyan, E.A (1984), Strength of gypsum clay soils and its variation,
Journal of soils and sediment, 21(6), 264-268.
Razouki, S.S., Kuttah, D.K., Al-Damluji, O.A. and Nashat, I. H., (2007), Strength erosion
of a fine-grained gypsiferous soil during soaking, The Arabian journal for Science
and Engineering, 32, 147-152.
Torrance, J. K., (1974), Laboratory Investigation of the Effect of Leaching on the
Compressibility and Shear Strength of Norwegian Marine Clay, Geotechnique, 24,
155–173.
Verheye, W.H and BoyadgievT.G. (1997), Evaluating the land use potential of gypsiferous
soils, Journal of soils and sediment, 13(2), 97–103.