effect of input credit scheme on ... - university of ghana
TRANSCRIPT
EFFECT OF INPUT CREDIT SCHEME ON PRODUCTIVITY OF
SMALLHOLDER COCOA FARMERS IN THE AMENFI WEST AND PRESTEA-
HUNI VALLEY DISTRICTS OF THE WESTERN REGION:
A CASE STUDY OF OPPORTUNITY INTERNATIONAL
BY
RAMLA BAABA KEELSON
THIS THESIS IS SUBMITTED TO THE UNIVERSITY OF GHANA, LEGON, IN
PARTIAL FULFILMENT OF THE REQUIREMENT FOR THE AWARD OF
MPHIL AGRIBUSINESS DEGREE
DEPARTMENT OF AGRICULTURAL ECONOMICS AND AGRIBUSINESS
COLLEGE OF BASIC AND APPLIED SCIENCES
UNIVERSITY OF GHANA, LEGON
July, 2017

i
DECLARATION
I, Ramla Baaba Keelson, author of this Thesis, “EFFECT OF INPUT CREDIT SCHEME
ON PRODUCTIVITY OF SMALLHOLDER COCOA FARMERS IN THE AMENFI
WEST AND PRESTEA-HUNI VALLEY DISTRICTS OF THE WESTERN REGION:
A CASE STUDY OF OPPORTUNITY INTERNATIONAL”, do hereby declare that the
work presented, with the exception of various forms of literature consulted which have
duly been acknowledged, was entirely done by me in the Department of Agricultural
Economics and Agribusiness, University of Ghana, Legon under the supervision of senior
members of the department. This work has never been presented either in whole or in part
for any other degree in this University or elsewhere.
…………………………………………..
Ramla Baaba Keelson
(Student)
This thesis has been presented for examination with our approval as supervisors
……………………… …………………………
Mr. D.P.K. Amegashie Dr. Henry Anim-Somuah
(Principal Supervisor) (Co-Supervisor)

ii
DEDICATION
This thesis is dedicated to Madam Mary Otuwah Biney (mother) for sponsoring my
master‟s programme and to Mrs. Comfort Afariwa Annan (Late) for contributing
positively in my life.

iii
ACKNOWLEDGEMENT
My utmost gratitude goes to Almighty Allah for the gift of life, grace, knowledge and
protection and for seeing me through this research.
My sincere appreciation goes to my supervisors, Mr. D.P.K. Amegashie and Dr. Henry
Anim-Somuah and senior members of the department for the knowledge and time spent
in supervising my work and for the constructive suggestions and corrections.
Next, I want to say thank you to A.G Leventis Foundation Fellowship Scheme for
funding this thesis.
I extend my sincere appreciation to the management and staff of Opportunity
International, particularly Mr. Francis Danso (Agricultural officer in-charge of Bogoso
branch), Mr. Laryea (National Agricultural Officer) and Madam Mary Awadzi
(Marketing manager, Head Office) for granting me the assistance I needed to undertake
this research.
To my mother (Mary Otuwah Biney) and father (Benyameen Haneef Keelson) and to my
three siblings, I am so grateful for the encouragement and prayers. My warmest gratitude
also goes out to all the respondents, enumerators, my course mates, particularly George
Agana Akuriba as well as all those who assisted me in obtaining valuable data for the
study.
I say may God richly bless you all.

iv
ABSTRACT
Opportunity International, a private financial institution has made efforts to support cocoa
farmers in Ghana through the establishment of input credit scheme with the aim of
enhancing access to inputs to improve productivity of farmers. The primary objective of
the study is to determine whether access to inputs improves productivity of smallholder
cocoa farmers in the stated districts of the Western Region of Ghana. Purposive sampling
was used to select two districts from the region, as well as the communities of interest
within the selected districts. Three communities in the Amenfi West and two
communities in the Prestea-Huni Valley districts were selected due to the level of
participation of farmers in the scheme. A total of 88 participants and 169 non-participants
across the communities were selected randomly for the study from the five communities.
Factors influencing farmers‟ participation in the scheme were assessed using a Probit
regression model. The PSM method was used to determine the effect of access to credit
on productivity of smallholder cocoa farmers. A three-point likert scale was used to
identify the severity of constraints faced by participant and non-participant farmers and
constraints ranked based on weighted means. Results from the Probit regression indicated
farm size, awareness of financial institution, membership of FBO, access to extension
agent, location of farmer, timeliness of input supplied, adequacy of loan amount and age
as significant factors that influenced participation in the scheme in the study area.
Estimation from the PSM revealed the intervention has a positive and significant effect
on productivity of participant farmers with participation in the intervention increasing the
outputs of participants by 449.9kg/ha compared to non-participants. The fertilizer and
agrochemical use were also increased by 84.31kg/ha and 9.95litres/ha, respectively.
Respondents identified common constraints faced with the most pressing including poor
producer prices and unfavourable weather conditions. It was concluded that the
intervention improved the output, fertilizer use and agrochemical use of participant
farmers. The study recommends, among others that government provides incentives to
help support private credit schemes for cocoa production.

v
TABLE OF CONTENT
DECLARATION................................................................................................................ i
DEDICATION................................................................................................................... ii
ACKNOWLEDGEMENT ............................................................................................... iii
ABSTRACT ...................................................................................................................... iv
LIST OF TABLES ......................................................................................................... viii
LIST OF APPENDICES .................................................................................................. x
ACRONYMS .................................................................................................................... xi
CHAPTER ONE: INTRODUCTION ............................................................................. 1
1.1 Background ............................................................................................................... 1
1.2 Problem Statement .................................................................................................... 5
1.3 Objectives of the Study ............................................................................................. 8
1.4 Conceptual Framework ............................................................................................. 8
1.5 Relevance of Study.................................................................................................. 11
1.6 Scope and Limitations ............................................................................................. 11
1.7 Organization of the Report ...................................................................................... 12
CHAPTER TWO: LITERATURE REVIEW .............................................................. 13
2.1 The Cocoa Industry in Ghana.................................................................................. 13
2.2 Structure of Credit Market in Ghana ....................................................................... 14
2.2.1 Credit Schemes for Cocoa Farmers in Ghana .................................................. 15
2.3 Agricultural Productivity: Definition, Concepts and Measurements ...................... 17
2.4 Empirical Studies on Access to Agricultural Interventions on Productivity .......... 18

vi
2.5 Effect of Agricultural interventions on Productivity of Farmers ............................ 21
2.6 Factors Influencing Participation in Agricultural Interventions ............................. 24
2.7 Challenges Associated with Participation in Agricultural Interventions ................ 30
CHAPTER THREE: METHODOLOGY ..................................................................... 33
3.1 Introduction ............................................................................................................. 33
3.2 Research design ....................................................................................................... 33
3.3 Method of Analysis ................................................................................................. 33
3.3.1 Assessing factors influencing participation in input credit scheme ................. 33
3.3.2 Determination of the Effect of Input Credit Scheme on Productivity………...36
3.3.3 Identification and Ranking of Constraints Faced by Cocoa Farmers ............... 44
3.4 Data Collection ........................................................................................................ 45
3.4.1 Types and Sources of Data ............................................................................... 45
3.4.2 Sampling Size and Sampling technique ........................................................... 46
3.4.3 Survey Instruments ........................................................................................... 47
3.5 The Study Area........................................................................................................ 47
3.6 Theoretical Framework ........................................................................................... 50
3.7 Analytical framework .............................................................................................. 52
CHAPTER FOUR: RESULTS AND DISCUSSIONS ................................................. 55
4.1 Introduction ............................................................................................................. 56
4.2 Distribution of Respondents .................................................................................... 56
4.3 Socio-demographic Characteristics of Respondents ............................................... 57
4.4 Production Characteristics of Respondents ............................................................. 59
4.5. Institutional Factors of Respondents ...................................................................... 61
4.6 Means by which Cocoa Farmers heard of the Scheme ........................................... 62
4.6.1 Criteria for Selecting Farmers to Participate in Input Credit Scheme .............. 63
4.7 Productivity Levels of Farmers ........................................................................... 63

vii
4.8 Factors Influencing Participation in Input Credit Scheme ...................................... 64
4.9 Propensity Score Matching Analysis of the Effect of Input Credit Scheme on
Productivity of Smallholder Cocoa Farmers ................................................................. 68
4.9.1 PSM Results of Effect of Input Credit Scheme on Productivity ...................... 69
4.10 Identification and Ranking of Constraints faced by Farmers ................................ 72
CHAPTER FIVE: SUMMARY, CONCLUSIONS AND
RECOMMENDATIONS ................................................................................................ 77
5.1 Introduction ............................................................................................................. 77
5.2 Summary of the Study ............................................................................................. 77
5.3 Conclusions of the Study......................................................................................... 79
5.4 Policy Recommendations ........................................................................................ 80
REFERENCES ................................................................................................................ 83

viii
LIST OF TABLES
Table 3.1 Explanatory variables used in Probit Regression Model…………………………..35
Table 3.3 Constraints faced by participants and non-participants of input credit scheme .......... 45
Table 4.1: Distribution of Respondents....................................................................................... 56
Table 4.2: Distribution of some Socio-demographic Characteristics of Farmers ....................... 58
Table 4.3 Production variables of respondents ........................................................................... 60
Table 4.4 Institutional factors of respondents ............................................................................. 61
Table 4.5 Productivity Levels of Farmers ................................................................................... 64
Table 4.6 Probit Regression Results of Factors Influencing Participation in Input Credit
Scheme ................................................................................................................................. 65
Table 4.7 PSM results of Input Credit Scheme on Productivity ................................................. 70
Table 4.9 Ranked Constraints by Participants and Non-participants of Input Credit Scheme ... 73

ix
LIST OF FIGURES
Figure 1.1: Conceptual framework .............................................................................................. 10
Figure 3.1: Map of Western Region Showing Sampled Districts ............................................... 50
Figure 4.1: Means by which farmers heard of the scheme .......................................................... 62
Figure 4.2 Distribution of Propensity Scores Graph Before and After Matching for Overall
Model ................................................................................................................................... 72

x
LIST OF APPENDICES
APPENDIX I Probit regression Results using STATA 14 ....................................................... 87
APPENDIX II Result of Covariate Balancing Before and After Matching ................................ 88
APPENDIX III Questionnaire ............................................................................................... 90

xi
ACRONYMS
ATE: Average Treatment Effect
ATT: Average Treatment on the Treated
ATU: Average Treatment on the Untreated
COCOBOD: Ghana Cocoa Board
PSM: Propensity Score Matching
FBO: Farmer Based Organization
GDP: Gross Domestic Product
CODAPEC: Cocoa Diseases and Pests Control
LBC: Licensed Buying Company
CSAE: Centre for the Study of African Economies
SACCO: Savings and Credit Cooperative
Kg: Kilogram
Ha: Hectare
NNM: Nearest Neighbour Matching
1
CHAPTER ONE
INTRODUCTION
1.1 Background
The agricultural sector in most developing economies contributes significantly to
economic growth and development. About 80 percent of farmers engaged in agricultural
activities in sub Saharan Africa operate on smallholdings measuring less than 2 hectares
with such farms contributing nearly 80 percent of food produced in the world
(Busschaert, 2014) with an estimated $450 billion funds demanded by smallholder
farmers worldwide to improve productivity (Carroll et al. 2012). These smallholder
farmers are faced with common challenges consisting of low output, poor produce
quality, limited access to finance, loan repayment default, among others.
In Ghana, the sector contributes immensely to employment especially in the rural areas,
providing sources of income, contributing to the country‟s Gross Domestic Product
(GDP) and foreign exchange earnings through the exportation of commodities such as
coffee, oil palm and cocoa. Cocoa is the main export crop and contributes more than 9
percent to the total Gross Domestic Product (GDP) and 30% of total export earnings
(Quarmine et al. 2012) with a total cocoa production export of 896,220 tonnes in
2013/2014 production season (COCOBOD, 2014). Major producers of cocoa in the world
are Cote D‟ivoire, Ghana and Indonesia with Ghana being the second largest exporter
after Cote D‟ivoire.
In Ghana, about 6.3 million people representing about 30% of the total population are
employed by the cocoa sector (Gockowski et al. 2013). Cocoa production in the country

2
occurs in six regions with over 90% of cocoa grown by smallholder farmers. The
Western region produces the highest quantity of cocoa contributing to over 50% of the
country‟s total cocoa output followed by Ashanti, Eastern and Brong Ahafo regions.
COCOBOD provides support to cocoa farmers through the purchase and distribution of
improved seedlings, fertilizers and agrochemicals at free or subsidized rates. Successive
governments through COCOBOD have implemented programmes in a bid to improve the
productivity of cocoa farmers in the country. Some programmes undertaken by
COCOBOD include CODAPEC and Hi-Tech programme. The CODAPEC programme is
aimed at controlling diseases and pests of cocoa in growing areas with the Hi-Tech
programme involving the distribution of fertilizers and other agrochemicals at subsidized
rates to cocoa farmers.
Even though the agricultural sector contributes significantly to the country‟s economy,
the sector is faced with the lack of interest by most financial institutions in investing or
allocating funds to the development of the sector due to the perceived high risky nature of
agriculture, failure of farmers to pay back loans, among others (AGRIFIN, 2012).
Baffoe et al. (2014) indicate that the lack or limited access to credit by farmers
particularly small-scale farmers has resulted in low productivity as farmers are unable to
purchase the appropriate inputs for production and has thus reflected in their low income
levels. Girabi & Mwakaje (2013) in their study found that farmers are able to improve
their agricultural production through access to credit by enabling farmers to purchase the
necessary inputs such as seeds, fertilizers, and equipment. To combat this challenge, there
is the need to improve productivity of smallholder farmers‟ through adequate investment
in the agricultural sector to ensure the growth of the economy. Awunyo-Vitor (2012)

3
argues that government in playing their role in improving the agricultural sector ensures
credit programmes are developed to make available sources of funds to smallholder
farmers to increase productivity and enhance food security through the development of
policies to promote easy access to financial services by farmers.
The participation of the private sector is essential to the development of the sector
through the provision of portfolio of financial services to actors in the agricultural sector.
The emergence of microfinance over the years has been increasingly patronized by
people particularly farmers both in the rural and peri-urban centers. The existence of
microfinance in the agricultural sector has the tendency of improving outputs of farmers
by making available access to credit. This statement is supported by Miller (2011) who
believes that the incorporation of microfinance in farm production has the potential to
increase output of farmers and improve on their living standards. Again, Miller (2011)
indicates that for microfinance to succeed in making credit available to farmers there is
the need to approach agricultural microfinance in a different way in order to overcome
the challenges in providing agricultural credit. Some financial institutions have made
efforts in overcoming the challenges faced in lending to smallholder farmers and one
notable institution is Opportunity International.
Opportunity International Limited is a leading savings and loans institution in Ghana
which is at the forefront of delivering transformational financial services to help
transform the lives of their clients. It was licensed by the Bank of Ghana in the year 2004
and has been in operation since then. The main focus of the institution is to provide
financial services to the poor and those who are excluded from the mainstream banking.
Opportunity International provides credit to micro, small and medium size businesses that
4
are viewed as the backbone of most developing countries. The company in diversifying
its credit portfolio has incorporated the needs of small holder farmers, agro businesses
and entrepreneurs in the agro value chain with the aim of improving the lives of
Ghanaian farmers through high yields and thus high incomes. As part of the financial
services to farmers, the company provides credit to farmers in kind through the provision
of farm inputs (such as fertilizers and agrochemicals) rather than cash. Providing such
assets to farmers ensure that the inputs are utilized for the intended purpose and
overcome the challenge of limited access to basic farm inputs for production.
Operations of Input Credit Scheme
As one of the financial services to smallholder farmers, Opportunity International has
established an input credit scheme which seeks to provide farm inputs in kind to farmers
in various areas of crop and animal production. The scheme supports to farmers
(particularly cocoa farmers) through the provision of inputs including fertilizers,
agrochemicals, protective clothing and spraying machines. Fertilizers in both liquid and
granular forms are distributed to cocoa farmers. Other agrochemicals distributed are
weedicides, pesticides and fungicides which are mainly in liquid form. Some protective
clothing provided is gloves, overall jacket, boots, nose marks and goggles with small
sprayers as well as mist blower machines provided by the scheme. To be part of the
scheme, a farmer must belong to an FBO within the community. The group serves as
security for the credit inputs. Members of the group request for the type and quantities of
inputs needed based on recommended product brands by COCOBOD. Farm inputs are
mostly requested in the early part of the year (usually between January to March) and
delivery done between March and April or earlier depending on when requests are
5
placed. Distribution of inputs is done at specific places within the various communities
according to the request made by individual members of the group.
Payments of the credit inputs are made during the major harvesting period which occurs
between September and December allowing for flexibility of payment. Farmers have four
months to make payments of the loan. The credit amount consists of the cost of inputs,
interest on input cost, distribution cost and a 1% insurance for participant farmers of the
scheme. The agricultural staff of the financial institution is responsible for the collection
of payment of credit amount by beneficiaries of the scheme in the various communities.
1.2 Problem Statement
Ghana‟s cocoa sector contributes greatly to the development of the economy through the
provision of employment and foreign exchange earnings with the sector partly
responsible for poverty reduction in the country particularly among rural people (Vigneri
& Santos, 2007 cited in Peprah, 2015). The total production of cocoa in Ghana is mainly
contributed by about 90% of smallholder farmers in the country by providing the world
with quality cocoa beans. Although cocoa is recognized as the major cash crop and the
most important export crop, the sector is chalked with some challenges.
Ghana in about sixty-six years ago had occupied the first position as the highest exporter
of cocoa beans in the world until it moved to the second position due to challenges
including pests and diseases attack, deteriorating soil quality, unfavorable producer prices
among others which resulted in low production of cocoa beans (Anim-Kwapong &
Frimpong, 2005).
6
Ghana‟s cocoa yields have remained low over the past years compared to other major
producing countries such as Cote d‟ivoire and Indonesia. Dormon et al.(2007) estimated
Ghana‟s cocoa yields at approximately 360kg/ha compared to 800kg/ha in Cote d‟ivoire
and 1800kg/ha in Malaysia. The low yields have been attributed to the poor control of
pests by farmers among others. Subsequent studies by CSAE (2009) indicate that
majority of cocoa farmers in the country obtain low yields on an average of 2 ha of
cultivated land due to the limited use of fertilizers and pesticides. Ghana and its
neighboring country Cote d‟ivoire cultivate almost the same farm size of about 1.7
million hectares but the production levels differ. While Cote d‟ivoire produces about 1.6
million metric tonnes per annum, Ghana produced a little over 700,000 metric tonnes
during its 2014/2015 production season (Adjei-Frimpong, 2016). Anang (2015) also
attributed the low yields of cocoa farmers to bad weather, outbreak of diseases and aging
cocoa tress.
Successive governments in collaboration with COCOBOD have made significant
investments in the cocoa sector in a bid to improve productivity of the farmers. Areas of
investments include the free mass spraying of cocoa trees to control diseases and pests
attack; distribution of fertilizers at subsidized rates; extensive involvement of extension
agents to train farmers among others. These interventions in input supply and the
effective implementation of policies resulted in achieving the target of one million metric
tonnes of cocoa in the 2010/2011 crop season. But interventions made by successive
governments have not achieved much in recent times.
The challenge of improper distribution of farm inputs such as fertilizers and pesticides
from government or the LBCs to the farmers has resulted in limited access to these inputs

7
for use. This indicates that there are gaps in the provision of inputs. This claim is
supported by complaints made by cocoa farmers in the Ellembelle district of the Western
region where a number of the farmers do not get access to these farm inputs for use
(cocobod.gh, 2014). Further claims made by Adjei-Frimpong (2016) shows that the
CODAPEC and Hi-Tech programme have not fully been scaled up in parts of cocoa
growing areas as farmers complained of lack of access to fertilizers and the free mass
spraying.
The private sector has emerged to compliment the efforts of government interventions as
government interventions have not yielded much. Private sector assistance includes
promoting access to credit to farmers to enhance availability of inputs for use.
Smallholder cocoa farmers just like any other farmer are challenged or constrained in
accessing inputs thus affecting their level of production and incomes. The challenges in
the provision of inputs have drawn the attention of some private organizations in a bid to
assist farmers with the needed inputs for use to improve productivity and thus resulted in
smallholder farmers participating in credit or agricultural interventions to help increase
access to farm inputs to enhance productivity. Such notable institution is Opportunity
International, which provides farm inputs to smallholder cocoa farmers through input
credit rather than cash credit. This intervention ensures the effective use of inputs and
eliminates the diversion of credit to other uses other than its intended purpose. The study
then seeks to assess whether or not the input credit provided has yielded any successes by
improving on productivity of smallholder cocoa farmers in the Amenfi West and Prestea-
Huni Valley districts. The foregoing concerns give rise to the following research
questions:
8
1. What factors influence participation in input credit scheme?
2. What is the effect of input credit scheme on productivity of participant farmers?
3. What constraints are faced by participant and non-participants in the study area?
1.3 Objectives of the Study
The main objective of the study is to assess the effect of Opportunity International‟s Input
Credit Scheme on productivity of smallholder cocoa farmers in the Amenfi West and
Prestea-Huni Valley districts of the Western region. This objective was addressed using
the following specific objectives:
1. To assess the factors influencing participation in Opportunity International‟s input
credit scheme
2. To determine the effect of the input credit scheme on productivity of participant
farmers
3. To identify and rank constraints faced by participant and non-participant farmers
1.4 Conceptual Framework
The cocoa sector contributes significantly to the economic growth and development of
the country. The sector is dominated by smallholder farmers who supply about 90 percent
of the country‟s total cocoa output indicating the significance of the contribution of
smallholder farmers. The production of cocoa in Ghana has remained low as farmers
operate on low levels of productivity as compared to other countries such as Cote
D‟ivoire and Indonesia. The low levels of productivity have been attributed to a number

9
of challenges. Major sources of these challenges are the declining soil fertility of cocoa
farms, diseases and pests attack and poor farm management practices. Other major
sources are limited use of farm inputs, limited access to credit and inadequate
infrastructure.
In a bid to enhance productivity, Opportunity International instituted an input credit
scheme to increase farmers‟ access to farm inputs in selected cocoa growing areas in the
country. This has enhanced the availability of credit to the farmers as access to credit has
significant means of improving the productivity of smallholder farmers. When farmers
are able to access credit, they tend to purchase the needed farm inputs for use such as
fertilizers, pesticides, and improved planting materials to enhance productivity. The
conceptual framework on the effect of input credit on productivity of farmers is
illustrated in Figure 1.1. Smallholder cocoa farmers are the main beneficiaries of the
credit scheme and these farmers are characterized by low yields due to low input use and
other factors. Participation in input credit scheme is a decision a cocoa farmer makes as
he decides to be a member of the scheme or not. The participation in the scheme was
thus dependent on the farmer‟s own observable characteristics.
Participants benefitted from the scheme by first accessing funds on credit from
Opportunity International, obtaining credit in kind to avoid the diversion of funds,
delivery of farm inputs to the door-step of beneficiary farmers, pre-application training
(fertilizer and agrochemical application) by extension agents and the supervision on
farms to ensure efficient use of farm inputs. It is expected that farmers who access input
credit will be able to improve their levels of production as compared to those who do not
access credit at all or access cash credit. The assumption underlying this study is that,

10
participants of the scheme will have more access to farm inputs for use on their farms and
enjoy extension services and are therefore expected to enhance their productivity ceteris
paribus than farmers who do not benefit from similar intervention. The study tends to
determine the effect of input credit scheme on productivity of participants and non-
participants.
Figure 1.1 Conceptual Framework for Input Credit on Productivity of Farmers
Source: Adopted from Girabi & Mwakaje (2013)
Smallholder Cocoa Farmer
Limited use of farm inputs:
fertilizers, pesticides, etc
Opportunity International
Input Credit Scheme
1. Provision of input credit
2. Distribution of farm inputs
3. Contact with extension
agents
4. Provision of pre-application
training
Low yields
Farmer decides to participate
Non-participants Participants
Results
1. Increase in farm inputs use
2. Easy access to farm inputs
3. Access to extension agents
4. Knowledge on agrochemical
application
Results
1. Limited farm input use
2. Limited access to
extension agent
Effect
High cocoa yields
Effect Low cocoa yields

11
1.5 Relevance of Study
Interventions that are aimed at improving crop productivity of farmers are targeted to
increase yields which further results in increases in income, enhancing food security and
reducing poverty. This has prompted the need to assess the effect of input credit scheme
on productivity of cocoa farmers in the two districts which are cocoa growing areas that
produce the highest cocoa beans in the Western region. The study will make available
information on whether or not the credit intervention has been viable by improving the
yields of cocoa farmers participating in the scheme. The study will provide information
on whether or not the intervention has been beneficial to farmers.
The outcome of the research will assist Opportunity International to determine the extent
to which the scheme has achieved its expected objective thus serving as evidence for the
continuation or termination of the scheme or for further replication or otherwise of
similar credit intervention by other financial institutions or private enterprises. Again,
knowledge of factors influencing participation in the scheme and identification of
constraints will serve as a guide to officials of private enterprises, researchers and other
implementers to tailor similar credit interventions to meet the needs of cocoa farmers to
enhance productivity.
Finally, the study will contribute to the body of knowledge on the effect of input credit on
productivity of cocoa farmers.
1.6 Scope and Limitations
The study focused on two districts out of the ten districts where the input credit scheme
has been implemented. This narrows the scope of the study and limits the generalizability
12
of the findings. The researcher‟s inability to cover all the ten districts was as a result of
time and monetary constraints.
1.7 Organization of the Report
This report is presented in five chapters. Chapter Two reviews related literature on the
study and consist of the key areas in the study, empirical studies and continues with
factors influencing participation in agricultural interventions, effect of agricultural
interventions on productivity of farmers and concludes with the constraints associated
with participation in agricultural intervention. Chapter Three presents the methodology
and begins with the methods used to achieve each objective of the study, methods of data
collection and follows with the study area and ends with discussion of the theoretical and
analytical frameworks. Analysis and discussion of the results are presented in Chapter
Four. Chapter Five presents the summary, conclusions and recommendations of the
study.
13
CHAPTER TWO
LITERATURE REVIEW
2.1 The Cocoa Industry in Ghana
Ghana commenced the commercial growing of cocoa in 1879 with the first shipment of
cocoa to Hamburg in Germany in January 1893 (Asuming-Bempong et al. 2006). Cocoa
has since then remained the major export crop of the country and one of the leading
export countries in the world. COCOBOD was established by government in 1947 to be
responsible for the development of the cocoa sector. The board was responsible for
purchasing, marketing and exporting cocoa produced in the country, as well as establish
or encourage the establishment of industrial processing factories for converting cocoa and
other cocoa waste into useful cocoa products and finally to regulate cocoa marketing and
export. Currently cocoa is produced in six major areas in the country namely: Western,
Ashanti, Eastern, Brong-Ahafo, Volta and Central regions. Major cocoa producer
countries are Cote d‟ivoire, Ghana, Indonesia, Nigeria, Cameroun, Brazil, Ecuador and
Malaysia with these countries representing 90 percent of the total production in the
world.
The production of cocoa in the country over the past years has been affected by a number
of challenges which has resulted in reduced farmer output. Major challenges faced
include the prevalence of diseases and pests; decline in soil fertility; unfavorable
producer prices; poor weather conditions among others. One of the prevalent causes of
low production has been attributed to the presence of diseases and pests such as black
pod disease and mirids/capsids. Crop losses were estimated at between 25-35% resulting

14
from mirid attacks alone and this was due to the low use of pesticides (Osei-Boadu,
2014).
2.2 Structure of Credit Market in Ghana
The financial sector in Ghana comprises of the formal, semi-formal and the informal
sectors with their operations guided by legal regulations (Aryeetey, 2008). The formal
sector consists of the bank and other specialized non-bank financial institutions in the
country. The formal banks are mainly made up of the commercial, universal and
development banks. The target clients of these financial institutions are the large
businesses as well as the government. These institutions are licensed by the Central Bank
and operate under its regulations. The specialized non-bank financial institutions (NBFIs)
also licensed by the Bank of Ghana serve a large range of rural people and businesses,
and other small and medium enterprises. The NBFIs consist of rural banks, savings and
loans companies and micro finance banks. In the semi-formal sector, institutions are
legally registered but not licensed by the central bank as a financial institution and they
include credit unions, savings and credit co-operatives and microfinance non-
governmental organizations (Aryeetey, 2008). The institution draws clients in micro
enterprises and other marginalized people. The informal sector serves marginalized and
self-employed people and is made up of savings collectors; savings and credit
associations; „susu‟ groups; traders, agricultural processors and input distributors; money
lenders; friends and relatives. Institutions in this sector are not legally registered but may
belong to a registered institution.
15
According to Owusu-Antwi & Antwi (2010) the country‟s formal financial sector is
unable to meet the growing demands of borrowers and as a result, borrowers turn to
informal sources of credit. To ensure the efficiency in the financial sector, there is the
need for the formal and informal financial sectors to integrate to improve adequate flow
of credit.
2.2.1 Credit Schemes for Cocoa Farmers in Ghana
A number of challenges have been faced by Ghana‟s cocoa sector with successive
governments making efforts in arresting such challenges. Governments in collaboration
with COCOBOD instituted a number of policy interventions to address challenges faced
in the cocoa sector. Two major interventions made by COCOBOD were aimed at
improving the production of the cocoa industry through the institution of input schemes.
These schemes include the Cocoa Disease and Pest Control Program (CODAPEC) and
the High Technology Programme (Hi-Tech).
Cocoa Disease and Pest Control Program (CODAPEC)
The CODAPEC Programme commonly referred to as “Mass Spraying” was initiated
during the 2001/2 cocoa season to assist cocoa farmers in the control of Capsid/Mirid and
the Black pod disease. The programme was instituted due to the crop losses the country
experienced during the 1990‟s where losses incurred due to mirid disease accounting for
25-35 percent loss per annum (Osei Boadu, 2014). The programme also provided training
to farmers and other technical personnel on how to control pests and diseases (Adjinah &
Opoku, 2010). The training involved educating farmers on the dosages of various
pesticides, the use of protective clothing, techniques for applying and handling pesticides
among others.

16
The CODAPEC programme is rooted in all seventy-two cocoa growing districts, with
thirty-five (35) districts sprayed against the Mirid/Capsid disease, twenty-one (21)
districts sprayed against Black pod disease and sixteen(16) districts benefiting from the
spraying of both Mirid/Capsid and Black pod diseases in the country during previous
years (Oduro & Omane-Adjepong, 2012). The programme for controlling black pod
covers all the districts in the Volta, Brong Ahafo and some parts of the Eastern, Ashanti
and Western regions while the control of Mirids covers the Eastern, Central and parts of
Western and Ashanti regions (Adjinah & Opoku, 2010). Spraying is done by groups at
each unit center with farms sprayed thrice between June and October for black pods and
twice between August and December in the case of Mirid disease. The farmers are solely
responsible for undertaking the necessary cultural practices, providing source of water for
spraying as well as monitoring gang spraying on farms.
According to the annual report of COCOBOD (2014), the CODAPEC programme still
operated and a total of 126,523 cartons of fungicides and 94,511 cartons of insecticides
were distributed for spraying on cocoa farms.
Hi-Technology Programme (Hi-Tech)
The fertilizer application programme mainly called “Hi-Tech” programme was
introduced in the 2002/03 crop season. This programme was to address the problem of
low productivity due to the decline in soil fertility of cocoa farms resulting from the
continuous harvesting of cocoa pods. This was to urge cocoa farmers to boost the
application of fertilizers on their farms to help improve their productivity. These
fertilizers were supplied on credit to beneficiary farmers at the beginning of the
production period and payments were made during the harvesting season in installments

17
(Mmye, 2007). Figures from annual report of COCOBOD indicate that under the
2013/14 cocoa season, a total of 1,578,970 bags of inorganic granular and 219,869 bags
of elite organic fertilizers were distributed to farmers within the cocoa growing areas.
Again, a total of 59,959 cartons of lithovit and 68,345 cartons of Sidalco liquid fertilizers
were also distributed.
2.3 Agricultural Productivity: Definition, Concepts and Measurements
OECD (2001) defines productivity as the measure of quantities of output produced from
quantities of input use. Similar definition is also given by CSLS (2003). Productivity is
generally referred to as the ratio of a volume of output measured to a volume of input use
(OECD, 2001) and conventionally means the ratio of output to input. Agricultural
productivity is defined as the proportion of total farm outputs to total inputs used in the
production of agricultural goods. To increase agricultural production, there is the need to
increase the quantity and quality of input use such as mechanization, fertilizer use,
agrochemical use, improved planting varieties and reliable source of water.
OECD (2001) indicates different types of productivity measures and the measure depends
on the purpose of the productivity measurement and to some extent the available data at
hand. In broad terms, productivity is measured as single factor productivity (also referred
as partial factor productivity) and multifactor productivity measure (or total factor
productivity). Single factor productivity measures output to a single measure of input
with examples of such measures being labour productivity which is the ration of output to
labour input. Land productivity an example of single factor productivity involves the
ratio of output to land input. Single factor productivity is mostly used in literature for its

18
easy computation and reading as indicated by OECD (2001). Although it has its
advantages, its major drawback is that the measure does not measure the joint influence
of a number of factors used.
Multifactor productivity involves the measurement of output to a collection of inputs
(OECD, 2001). This measure is mostly used on industry-level to analyze changes in the
industry. This measure is appropriate for measuring technical change by industry when
intermediate inputs used in production are fully known. Its disadvantage is that the
measure requires significant and timely data for analysis and is mostly done on regional
or national level. This measure is not widely used as a measure of productivity but mainly
employed in studies involved in macro level analysis.
2.4 Empirical Studies on Access to Agricultural Interventions on Productivity
Empirical studies on agricultural productivity can be measured on three levels, macro;
meso and micro levels. Micro studies help to compare data at different groups at a
particular period and usually involves the use of cross-sectional data. Meso studies uses
data on a national level for analysis while macro studies uses time series data for analysis.
Analysis of the effect or impact of agricultural interventions has been analyzed using the
Propensity Score Matching (PSM) which has been adopted by many researchers. The
PSM is an approach used to determine the causal treatment effect of an intervention on
the outcomes of the treatment group. It analysis involves the use of two groups, the
treatment and control group to determine the effect of an intervention on the treatment
group by using a control group to determine what would have been the outcome of the
treated group if the intervention did not exist. A binary regression is used to estimate

19
propensity scores which match some observable characteristics that are similar to both
the treatment and control groups. Some studies argue that there is no particular advantage
between the use of a probit or logit model in estimating p-scores as they commonly yield
similar results even though the logit distribution has more density mass in bounds
(Caliendo & Kopeinig 2008). Wainaina et al. (2012) employed the logit model arguing
that the parameter estimates are consistent with the assumption that the error term has a
logistic distribution. The logit model was used to assess the probability of farmers‟
participation in contract farming as a result of the dependent variable being dichotomous.
The Propensity Score Matching was further used to assess the effect of farmers‟
participation in contract farming on incomes. The result of the study indicated
participation in contract farming by farmers has a positive effect on net revenues. Owusu
& Frimpong (2014) also employed propensity score matching to determine the impact of
cocoa agroforests on yield and incomes of households. Propensity scores were obtained
using a logit regression and a matching algorithm using the Nearest Neighbour Matching.
The study concluded that the adoption of cocoa agroforest helped farm households to
increase yields of cocoa resulting in an increase in incomes of households. Other authors
Owusu et al. (2011); Adebayo & Olagunju (2015); Davis et al. (2009) also used logit
regression model to estimate the propensity scores.
Awotide et al. (2015) in their study impact of access to credit on agricultural productivity
identified access to credit by farmers results in a significant positive effect on
productivity of cassava farmers. Frimpong & Owusu (2014) studied impact of cocoa
agroforests on yields and household income using cross-sectional data and empirical
results showed that the adoption of cocoa agroforests positively impact on yield and

20
incomes of households. Elias et al. (2013) in the study to evaluate the effect of
agricultural extension program participation on farm productivity found a positive
relationship between access to extension program and farm productivity and employed
the Heckman Treatment Effect Model and Propensity Score Matching. The PSM analysis
indicated there was a positive impact of participation in extension programme on
productivity. Adebayo & Olagunju (2015) also employed the PSM analysis and
established that farmers‟ involvement in agricultural research interventions has a
significant impact on rural incomes and productivity. Davis & Mekonnen (2012) also
indicate participation in farmer field schools has a significantly positive effect on
production and incomes among women in East Africa and employed the PSM analysis to
determine the average treatment effect. Similar studies by Agyekum, A.P. (2015) on
input credit scheme effects on the adoption of cocoa production technologies and
productivity of smallholder cocoa farmers in Ghana identified major determinants of
productivity levels in two regions among cocoa abrabopa farmers using the Cobb-
Douglas production function. The studies revealed that fungicide application positively
influenced productivity levels of farmers. Other determinants were household size,
experience of the farmer and regional dummies. The study also revealed fertilizer and
insecticide application as not statistically significant determinants of productivity levels
of cocoa farmers.
A study by Ofosu (2009) on the effect of Darlings Human Development Foundation
(DHDF) Microcredit on female cassava farmers‟ output found that effect of microcredit
loan on the output of female cassava farmers was statistically significant at the Agona
East district for the 2008 output season. The study assessed the effect using OLS for the

21
analysis and found the effect of microcredit loan on output, land and hired labour. Result
showed that the effect of microcredit on land size was significant at 5 percent. Again, the
effect of microcredit loan on hired labour was not significant even though it was positive
at 10 percent. The study further revealed that the effect of hired labour on the farmers‟
output was not significant although it was positive.
A study Agyekum, A.F. (2013) assessed the effect of MiDA intervention on productivity
of maize farmers in the Afram Basin of Ghana found out that the intervention improved
the productivity of participant maize farmers in the district as compared to the
productivity of non-participant maize farmers. The study assessed the effect of the
intervention using the PSM with the results revealing that the intervention had a positive
and significant effect on the productivity of participant farmers as their yields were
increased by 0.6680 Mt/ha.
2.5 Effect of Agricultural interventions on Productivity of Farmers
The agricultural sector in most developing countries is characterized mainly by
smallholder farmers whose output contributes immensely to the availability of food and
source of raw material for industrial production. This indicates the significance of the
sector in promoting economic development especially in sub Saharan Africa.
Improvement in agricultural productivity contributes to increasing rural incomes and
reducing poverty. The sector of most developing economies are faced with the challenge
of low productivity with notable challenge been the lack of access to credit with an
estimated 2.5 billion people lacking access to credit worldwide (Baffoe et al. 2014 ).
When farmers particularly smallholder farmers are able to access credit, they tend to

22
improve on their levels of production. Baffoe et al. (2014) in their study, found a positive
correlation between rural credit and agricultural productivity. The results showed
majority of the sampled household representing 37% did not have access to credit.
Borrowers of credit accessed credit from formal, semi-formal and informal sources with
majority of borrowers obtaining credit from formal sources such as rural banks,
commercial banks. It was also indicated that through access to credit, smallholder
farmers increased their ability to obtain the needed farm inputs for use. Farmers can
easily purchase basic variable inputs such as fertilizers, improved seeds, and
agrochemicals and also support other off-farm activities. Through access to credit,
farmers are able to reduce the challenge of obtaining farm inputs as well as addressing
other household cash constraints. The study further showed a positive relationship
between access to credit and yields of crop farmers where borrowed households had an
impact on yields as compared to non-borrowers. Girabi & Mwakaje (2013) in their study
indicate farmers who access credit tend to increase the use of farm inputs resulting in
higher productivity as compared to farmers who do not access credit. They opine that,
farmers who access credit tend to invest the money in the purchase of much needed
inputs such as seeds, fertilizers among others to improve farm production. Farmers who
lack access to credit tend to generate low profits from their farm activities as they are
unable to invest enough in obtaining farm inputs for production. Fletschner et al. (2010)
indicate farmers constraints to credit negatively affect the generation of farm profits.
Ashaolu et al. (2011) argue that through access to credit farmers can easily adopt
innovative forms of production technologies that subsequently results in improving the
productivity of such farmers.

23
Agricultural productivity is seen as a means of reducing poverty and increasing the
standard of living of farmers particularly rural farmers in most developing countries
(Awotide et al. 2015) as it contributes to higher farm incomes, ensuring food security
and providing raw materials for industrial use. Several agricultural programmes have
been implemented by both government and other private sector participants in a bid to
improving the agricultural sector of most developing economies. Several studies
evaluated the impact of agricultural programmes on productivity and incomes of farmers.
A study by Kudi et al. (2009) also accessed the impact of UNDP micro-finance
programme on farmers‟ income. Results indicated that the UNDP micro-finance
programme has a positive effect on incomes of participant farmers. Majority of
participant farmers indicated that there was minimal improvement in the incomes before
participation in the intervention and was represented by 82% of the total respondents.
Farmers who participated in the programme indicated that their incomes increased after
participation. Owusu & Frimpong (2014) also found a positive correlation between the
adoption of cocoa agroforests and yield and household income. Results showed that the
average treatment effect of adoption of low shade increased household income by
GH₵63.96 and with a yield increase by 14.48kg/ha. The impact of medium and high
shade also showed positive impact on yield and household incomes. Research conducted
by Adebayo & Olagunju (2015) on whether or not agricultural innovation has an impact
on improved livelihood and productivity outcomes among smallholder farmers in rural
Nigeria reveals that the programme has a significant impact on a number of aspects of
livelihood of farmers who produced yam, maize and cassava. Aspect of livelihood such
as welfare, income, productivity and fertilizer use were included in the study.

24
Productivity and welfare outcomes showed a strong positive impact on farmers who
participated in the programme with income and fertilizer use having a less positive
impact on farmers. Awotide et al. (2015) also concluded farmers who obtain credit have
higher productivity levels than farmers who did not obtain credit. Other studies by Davis
& Mekonnen (2012); Girabi & Mwakaje (2013); Elias et al. (2013); Baffoe et al.(2014)
also assessed the effect of agricultural intervention on agricultural productivity or
incomes of farmers in Ghana as well as other African countries.
2.6 Factors Influencing Participation in Agricultural Interventions
The country‟s agricultural sector is seen as the backbone of the economy and has been
named as been responsible for the achievement of the first millennium development goal
of reducing the number of people suffering from hunger (Etwire et al. 2013). The sector
is significant in its contribution to GDP, provision of employment and foreign exchange
earnings. Numerous interventions have been implemented in the agricultural sector over
the past years with others still being implemented in various parts of the country. It is
indicated that the agricultural sector has a direct link to the livelihoods, poverty,
technology awareness, adoption, malnutrition and environment (Ashley & Maxwell,
2001) with this direct link resulting in improving the agricultural sector particularly
through the promotion of agricultural programmes or projects. In achieving this, there is
the need to identify factors which influence farmer‟s participation in agricultural
programmes. According to Nxumalo & Oladede (2013), participation refers to
individuals or groups taking part in any development process with the purpose of
obtaining self-sufficiency and to improve their standard of living. In Ghana, production
of crops is largely rain-fed with limited use of improved technologies such as modernized
25
machines and equipment, use of improved planting materials, fertilizer and agrochemical
application, good agricultural practices thus resulting in low productivity of farmers. This
has resulted in farmers participating in agricultural projects with the aim of improving
their productivity and living standards. Botlhoko & Oladele (2013) indicate that there is
the need to provide a more demand-based and sustainable services to actors of
agricultural sector by considering the perceptions, knowledge, diversity and resources of
these actors.
Etwire et al. (2013) in their study of assessing factors influencing farmer‟s participation
in agricultural projects identified some factors influencing participation in Agricultural
Value Chain Mentorship Project (AVCMP) in the Northern region of Ghana. The
location of a farmer was anticipated to have a positive or negative influence on whether
or not a farmer decides to participate in the project. The age of the farmer was predicted
to influence participation indicating that a younger farmer is more likely to participate as
they are risk lovers and are attracted to innovation while an older farmer may decline
from participating as he or she may already be exposed to the benefits of existed projects
or may be resource constrained to participate in a project. The gender of a farmer was
expected to have a negative or positive relationship with decision to participate in
projects. Males have the tendency of participating as they are usually decision makers
and therefore can easily decide to participate. Also, women are likely to participate as
they are mostly socially networked and as such may have links with providers of
agricultural projects.
The marital status of a farmer was expected to influence participation in agricultural
projects as a married person may access information from a spouse about an existing
26
project as compared to one who is unmarried. On another hand, a married farmer who is
conscious of the welfare of his household is likely to participate in projects. Farmer‟s
level of education was expected to positively influence participation as he or she is able
to access information and related benefits of available agricultural projects with a more
educated person expected to apply the knowledge acquired in school in his farming
activities. A farmer‟s ability to access credit was expected to positively influence
participation in agricultural project as these projects mostly provide credit to farmers. A
large household size of a farmer was predicted to positively influence participation as
each member could relay information about an existing project to other members. Access
to extension services was expected to positively affect a farmer‟s participation in
agricultural projects as most project providers gain access to participants through
extension agents so once a farmer has contact with an extension agent, the higher the
farmer‟ likelihood to be part of a project. The size of a farmer‟s farm was expected to
have a positive relationship with participation in agricultural projects. A farmer with a
larger farm size was likely to participate as he has the ability to access more farm inputs
for use on his farm.
The study found out that the number of years in school, access to production credit and
agricultural extension service were significant factors that positively influenced the
participation of farmers in agricultural projects in the Northern region. It was indicated
that farmers who have access to credit are likely to participate in an agricultural project
by 15 percent. The results also showed farmers who access agricultural extension
services are about 14 percent more likely to participate in agricultural projects. Finally, a

27
farmer who stays in school for one more year results in a less likelihood of the farmer
participating in an agricultural projects by about 2 percent.
Results from a study by Baffoe et al. (2014) identified age, education and size of
household as factors that positively affect access to credit by borrowers. Borrowers of
credit had large households, were more educated and were younger as compared to non-
borrowers. Age was found to positively relate with access to credit as young farmers
were risk takers compared to older farmers. Also farmers with higher education were
likely to read and understand processes involved in acquiring credit and so were willing
to borrow.
Another study by Mpiira et al. (2013) on the factors influencing household participation
in savings and credit cooperative (SACCO) programmes in Uganda assessed the socio-
demographic characteristics that may affect participation in SACCO programmes.
Characteristics of participants identified in the study were age of household head, age of
household spouse, level of education of household head, total working experience of
household head, total experience of spouse, experience of household head at current job,
spouse‟s experience at current job. Other variables included in the probit model are
distance to district capital, number of visits to town, total number of dependents, total
household income, informal loan size received and household assets. Variables that were
significant in the study were total working experience of household head; spouse‟s total
experience; spouse‟s experience at current job. Other variables were distant to district;
number of visits to districts and total household income.

28
Botlhoko & Oladele (2013) in their study assessed factors that influence the participation
of farmers in agricultural projects in Ngaka Modiri Molema district in South Africa by
identifying variables that affect participation. Variables used in the probit model were age
of the farmers, gender, level of education, household size, household head and number of
dependents. Other variables used in the model are farm size, farming experience, source
of information, source of income, effectiveness of rural development programme,
attitudes towards agricultural programmes and constraints faced in participation. The
results from the model indicated that four variables significantly influenced participation
in agricultural programmes: household size; effectiveness of rural development
programme; effectiveness of LRAD and constraints to participation in agricultural
projects. It was expected that household size, effectiveness of rural development
programme and effectiveness of LRAD positively affect participation in agricultural
projects and constraints negatively affecting participation. From the study, 97 percent of
farmers were willing to participate in agricultural projects.
Similar studies by Farid et al. (2009) also assessed the nature and extent of rural women
participating in agricultural and non-agricultural activities in Bangladesh by looking at
the socio-economic characteristics of rural women. Age, education, family size,
household income, ownership of land, amount of indebtedness and wage rate were
variables expected to influence participation in agricultural and non-agricultural activities
by women. Analysis from the study indicated that age, amount of indebtedness, level of
education, ownership of land and family size were variables that significantly affected
participation in agricultural and non-agricultural activities with level of education and
ownership of land negatively influencing participation and other variables positively

29
influencing participation. Wage rate and household income were identified as variables
which did not affect participation.
Another study by Ayamga et al. (2006) also assessed factors that influence a farmer‟s
decision to participate in micro-credit programmes in the Northern region of Ghana.
Socio-economic characteristics of individuals were identified to influence participation in
micro-credit programmes as used in similar studies by Farid et al. (2009); Etwire et al.
(2013); Botlhoko & Oladele (2013); Mpiira et al. (2013). Variables identified to
influence participation were age, level of education, gender and non-farm income. Other
variables were household size, value of farm output, number of micro-credit institutions
available and distance between borrowers and micro-credit institutions. The results of the
study showed that six variables significantly influenced individual‟s participation in
micro-credit programmes.
Level of education and distance between borrower and micro-credit institution showed a
negative relationship with participation in micro-credit programmes. It was expected that
an individual who has a higher education may be gaining just enough to meet his
expenses so will not be interested in borrowing from a micro-credit institution. Also, the
shorter the distance from the micro-credit institution, the higher the likelihood of an
individual to participate in micro-credit programmes thus indicating a negative
relationship with participation in micro-credit programmes. Age, value of farm output,
non-farm income and number of micro-credit institutions positively influenced
participation in micro-credit programmes.

30
Similar studies by Danso-Abbeam et al. (2016) indicated common socio-economic
attributes influencing probability of farmers accessing agricultural credit. Nxumalo &
Oladele (2013) in their study identified factors influence participation in agricultural
programme by farmers in Zululand district also identified similar socio-economic
attributes. Anang et al. (2015) also identified common factors that influence smallholder
farmers‟ access to agricultural microcredit in Northern Ghana.
2.7 Challenges Associated with Participation in Agricultural Interventions
Kudi et al. (2009) in their study identified some problems faced by beneficiaries of
UNDP microfinance programme in Kaduna State. Respondents of the study indicated that
the farm credit provided to them were below what was needed. Also respondents
indicated that there was so much time spent to secure the needed farm inputs for use.
Beneficiaries of the programme responded that equity capital contribution from them was
too high.
A study by Ayegba & Ikani (2013) identified some challenges faced by individuals in
accessing agricultural credit from formal and informal financial sources. In accessing
credit from formal financial sources, majority of respondents agreed that credit applied
for took longer time for approval by credit providers as this resulted in receiving loans
way after planting seasons have passed. This made recipients not use the loan for the
intended purpose for which it was obtained. Other respondents agreed that most
financial sources required a form of collateral before credit was obtained. Another
challenge faced was the short repayment period of agricultural credit by financial
sources. Other challenges identified were the high interest rate on loans; request for a

31
guarantor of loan; bureaucratic processes involved in accessing credit; lack of financial
institutions in the locality and the lack of awareness by respondents on availability of
credit.
Similar challenges in accessing agricultural credit from informal financial sources were
identified by respondents with majority of respondents naming high interest rate as the
major challenge facing them. Another pressing challenge identified was inadequate funds
provided to farmers by financial sources. Availability of guarantor for loan acquisition
and borrowing history of farmers were not left out.
Similar study by Mpiira et al. (2013) also identified problems experienced by participants
of Savings and Credit Cooperative (SACCO) programmes in Uganda. Majority of
respondents indicated high interest rate as the major problem faced in the programme
with an annual interest rate of 36 percent which participants deemed as higher compared
to interest rates by other financial institutions. Short payback period for loans was
considered a problem by participants as this increased the level of defaults among
participants of the SACCO programmes. The study also indicated the processing of loans
taken too much time. This resulted in loans coming in at a time which were not
applicable for the rightful purpose. Another major problem faced was the inadequate
amount of loan provided to participants of the programme as this resulted in farmers not
obtaining enough to support agricultural activities. Participants who applied for credit
were faced with loan rationing resulting in total rationing out of the programme or the
quantity of loans rationed.

32
The SACCO programmes also exposed participants to other problems which included
delayed payments of funds; loan schemes not been flexible; lack of moratorium for
borrowers; poor services to participants and the lack of agricultural loan packages for
farmers.
Summary of literature review
Key findings from reviewed literature on the effect of input credit programmes or
schemes on productivity of farmers mainly result in positive effect where researchers
have indicated that when farmers participate in credit programmes, they are able to obtain
credit for use by purchasing the needed farm inputs to increase their productivity.
On factors influencing participation in input credit scheme, socio-demographic factors
such as age, gender, farming experience, off-farm sources of income household size
membership of FBO access to extension agent and awareness of existing lending
institution have significant influence on participation in input credit schemes. Models
mainly used for analyzing factors influencing participation in credit schemes are the logit
and probit regression models.
Finally, constraints faced by beneficiaries of credit schemes or programmes are identified
as loan rationing, loan approval taken longer time, requirement of collateral for credit,
high interest rate on loans as well as bureaucratic nature of loan acquisition among
others.

33
CHAPTER THREE
METHODOLOGY
3.1 Introduction
The methodology employed in the research is presented in this section. It describes the
methods used in achieving the objectives of the study and it is outlined in the following
sub-sections: research design, methods of analysis, data collection approach, study area,
theoretical and analytical frameworks.
3.2 Research design
The research adopted the case study approach. The use of the case study design helps to
make in-depth analysis of a single case. Case study as a form of observational study
involves analyzing data collected from a population in a specific place at a specific time.
A cross-sectional data was used in the analysis. The case comprised of participants of
input credit scheme in the study area.
3.3 Method of Analysis
3.3.1 Assessing factors influencing participation in Opportunity International’s
Input Credit Scheme
Given the objective, it is assumed that smallholder cocoa farmers choose between
participating and not participating in the input credit scheme. The respondents are divided
into two groups; participant group and non-participant group in the input credit scheme.
The latent variable yi is the utility index and is defined as the utility a farmer enjoys for
participating in the input credit scheme. This is represented as;
Yi = βX+ ε. (3.1)

34
Where i stand for individual farmers, β is the coefficient of the independent variables, X
represents the independent variables and ε is the random disturbance and assumed to
follow normal distribution. The observed dependent variable is determined by whether
exceeds a threshold value and represented as:
{
The Probit regression model was used to determine the factors that influence
participation in input credit scheme. The Probit model of participation is empirically
represented as:
Yik = β0 + β1X1ik + βX2ik + ……+ εik (3.2)
where Yik is a binary variable representing a smallholder cocoa farmer i in community k
who participates in input credit scheme or not, X1……Xn are the vector of explanatory
variables that may affect a farmer‟s probability of participating in the scheme and εik is
the normal distributed random error term.
The empirical model for participation in input credit scheme is specified as:
Pr(Y=1|x) = β0 +β1Age +β2Gen +β3NuYrSh +β4FmExp +β5OffInc + β6HhSiz + β7FmSiz
+ β8FBO + β9Awlend +β10ExtSer + β11Loc +β12 TiInp +β13 FlxPy +β14 Age2 + β15 AdqLn
+ ε (3.3)
35
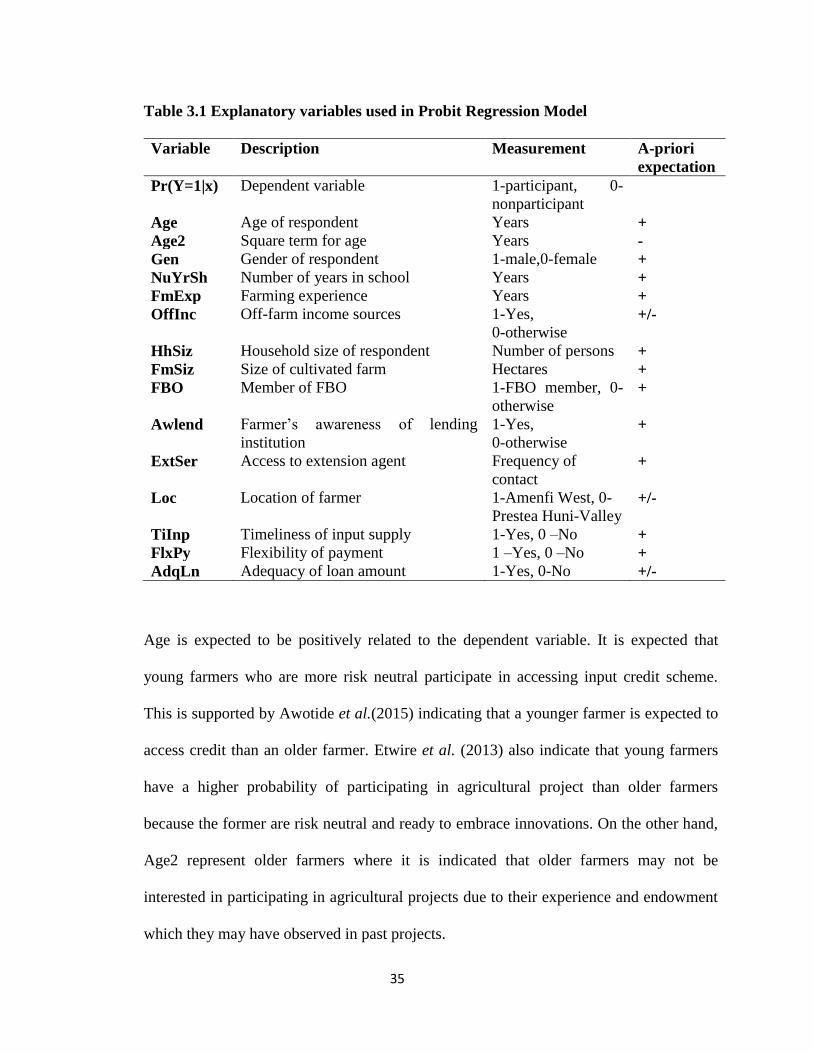
Table 3.1 Explanatory variables used in Probit Regression Model
Variable Description Measurement A-priori
expectation
Pr(Y=1|x) Dependent variable 1-participant, 0-
nonparticipant
Age Age of respondent Years +
Age2 Square term for age Years -
Gen Gender of respondent 1-male,0-female +
NuYrSh Number of years in school Years +
FmExp Farming experience Years +
OffInc Off-farm income sources 1-Yes,
0-otherwise +/-
HhSiz Household size of respondent Number of persons +
FmSiz Size of cultivated farm Hectares +
FBO Member of FBO 1-FBO member, 0-
otherwise +
Awlend Farmer‟s awareness of lending
institution
1-Yes,
0-otherwise +
ExtSer Access to extension agent Frequency of
contact +
Loc Location of farmer 1-Amenfi West, 0-
Prestea Huni-Valley +/-
TiInp Timeliness of input supply 1-Yes, 0 –No +
FlxPy Flexibility of payment 1 –Yes, 0 –No +
AdqLn Adequacy of loan amount 1-Yes, 0-No +/-
Age is expected to be positively related to the dependent variable. It is expected that
young farmers who are more risk neutral participate in accessing input credit scheme.
This is supported by Awotide et al.(2015) indicating that a younger farmer is expected to
access credit than an older farmer. Etwire et al. (2013) also indicate that young farmers
have a higher probability of participating in agricultural project than older farmers
because the former are risk neutral and ready to embrace innovations. On the other hand,
Age2 represent older farmers where it is indicated that older farmers may not be
interested in participating in agricultural projects due to their experience and endowment
which they may have observed in past projects.

36
The gender of the farmer is expected to positively influence participation in accessing
credit. The variable is a dummy and presented as 1 if respondent is male and 0 otherwise.
According to Awotide et al. (2015) males have access to credit more than females
because of their role as household heads. Motsoari et al. (2015) and Botlhoko & Oladele
(2013) also observed that male farmers have a higher probability of participating in credit
programmes than their female counterparts.
The number of years a farmer spent in school is expected to positively influence
participation in agricultural activities. Ayamga et al. (2006) expected that the level of
education of farmers positively influenced access to credit since more educated farmers
are seen as knowledgeable and are able to keep good records of activities which serves as
a basis for accessing credit. Other studies from Etwire et al. (2013) and Farid et al.(2009)
predicted that the level of education positively influence participation in agricultural
projects since educated farmers are able to put into practice the knowledge obtained in
school in their agricultural activities.
Farming experience which is measured as the number of years the farmer is engaged in
farming is expected to positively influence a farmer‟s ability to engage in agricultural
activities. Highly experienced farmers tend to have adequate knowledge of their farming
activities and are able to make efficient use of farm inputs and engage in good farm
management practices to improve yields. Iddrisu (2015) in his study also expected the
experience of a farmer to positively influence participation in input credit project
A farmer‟s engagement in off-farm activities fetching other sources of income help to
increase the risk bearing capacity of the farmer. This variable is expected to have a

37
positive relationship with the dependent variable. This is supported by Ayamga et al.
(2006) and Iddrisu (2015) indicating that a farmer‟s engagement in other off-farm
activities increases their participation in agricultural activities.
Alternatively, a farmer who engages in other off-farm activities is likely not to participate
in any credit programme as the farmer may have little time to participate.
A large household size tends to be cash constrained as they incur high expenditure on
food and other household items. This increases the likelihood of the household to access
credit. Thus it is expected that a large household size will positively influence the
participation in credit programmes (Ayamga et al. 2006). Etwire et al. (2013) and Farid
et al. (2009) also expected household size to be positively related to participation in
agricultural projects.
Farm size is predicted to positively influence participation in credit programmes as it
helps a farmer to get access to farm inputs to improve farm output. Motsoari et al. (2015)
indicated a likely positive relationship between farm size and farmer‟s ability to access
credit. Etwire et al. (2013) also expected farm size to be positively related to participation
in agricultural projects as a larger farm size requires more access to inputs and
technology. Opoku-Mensah & Agbekpornu (2015) also expected firm size and access to
credit to be positively related.
Members belonging to a farmer based organization are able to access credit programmes
through the participation of other members. The group serves as a form of collateral for
accessing such credit facilities and through combined efforts members reduce their risk of
default. It is expected that belonging to an FBO increases the likelihood of a farmer to

38
participate in credit programmes. Opoku-Mensah & Agbekpornu (2015) expected a
positive relationship between an agricultural firm being a member of a business
organization and access to credit.
Farmer‟s awareness of lending institution in the area increases the farmer‟s access to
credit and is expected to have a positive relationship (Motsoari et al. 2015). When a
farmer is aware of the existence of a credit programme or an agricultural project, he is
more likely to participate in such programmes.
A farmer‟s access to extension services is expected to be positively related to
participation in agricultural programmes since such programmes identify farmers through
extension agents. In this case farmers have greater chance of being included as they are
well informed about such programmes. Etwire et al. (2013) expected farmer‟s contact
with extension services to be positively related to participation in agricultural projects.
The location in which the farmers is located is expected to either influence participation
positively or negatively. When a farmer is further away from the financial institution it is
located, the farmer may not be interested in participating in the scheme. Also the
timeliness of input distributed positively influences farmers participation in agricultural
programmes. Once inputs needed by farmers are provided on time particularly at the right
season period, it enables the farmer to use such inputs at the right time for increase
production.
Payment schedule of loan amount also influences the participation of farmer in
agricultural programmes. When payment schedules are flexible for the farmer, he tends to
be interested in participating as he or she can get enough time to pay back the loan. On

39
the other hand, when farmers who borrow money do not have enough time period to pay
back loan, it becomes a burden on them and therefore default payment of loan. Lastly, the
amount of money a farmer is able to obtain as loan can either positively or negatively
affect participation in agricultural projects. When a farmer is not completely rationed out
of a loan application, he may not obtain the full amount requested to purchase the needed
farm inputs for use since the loan amount is not adequate enough for use.
3.3.2 Determination of the Effect of Input Credit Scheme on Productivity
The propensity score matching technique was used to assess the effect of input credit
scheme on productivity of smallholder cocoa farmers. The PSM is an approach used to
estimate the causal treatment effects by looking at the difference between the outcome of
participants of an intervention with and without treatment (Caliendo & Kopeinig, 2008).
The PSM addresses the problem of selection bias as participation in a programme or
intervention is non-random and farmers self-select themselves to be part based on some
expectation and observable characteristics. The method uses information from non-
participants (known as control group) to estimate the outcome of participants (that is
treatment group) in the absence of the intervention. In estimating the effect, PSM tends to
compare the average outcomes of participants and non-participants of an intervention and
this is done by matching the average outcomes of participants and non-participants using
propensity scores (p-score)
In using this method, the initial step is to estimate the propensity scores. This is estimated
using either a probit or logit model due to the treatment being dichotomous (that is 1 for
participants and 0 for non-participants). The model employed is the Probit regression

40
model as this is selected to achieve objective one of the study. The empirical Probit
regression model is stated as:
Pr (Y=1│x) = β0 + βiZi (3.4)
Where:
Pr (1│x) is binary dependent variable, where Pr = 1 is the value for participants of input
credit scheme and Pr = 0 is the value for non-participant of input credit scheme
Zi denotes a set of farmer‟s characteristics for participating in the scheme
Β0 is the intercept and βi are the regression coefficients
The probit model regression was run to obtain significant variables that influence
participation in input credit scheme with these estimated coefficients used to estimate the
propensity scores for each farmer.
After estimating the propensity scores, the next step is to select a matching algorithm
which uses the estimated p-scores to match participants to non-participants of the
intervention. The Nearest Neighbour Matching algorithm which is the most straight
forward matching method was employed in matching and may be „with replacement‟ or
„without replacement‟. In „with replacement‟, an untreated individual can be used more
than once when matching where there is oversampling of respondents and „without
replacement‟ untreated individual is used only once. Replacing untreated individuals tend
to increase the average quality of the matching and also reduce the level of biasness
(Caliendo and Koepeinig, 2008). The study employs the NNM with replacement. Other
matching algorithms include caliper and radius matching and kernel matching methods.
Caliper and radius matching, another form of NNM algorithms sets to impose a common

41
support condition to avoid bad matches and increase matching quality. The matching
involves choosing an individual from a comparison group as a matching partner for a
treated partner who lies within a propensity range (caliper) and has a propensity score
that is closest to the treated partner. Similarly, the radius matching uses many comparison
units available within the caliper thus avoiding bad matches and increasing the sampling
used. Kernel matching methods are nonparametric matching estimators that use weighted
averages of nearly all individuals in the control group to create a counterfactual outcome,
thus achieving a lower variance due to the use of nearly all individuals of the group
(Caliendo and Koepeinig, 2008).
The next step is to estimate the effect of the intervention and finally conduct a sensitivity
analysis. In estimating the effect, the common support region is identified. This area
consists of positive balancing scores for both the treatment and comparison groups
(Wainaina et al. 2012). The common effects identified in project evaluation include the
Average Treatment Effect (ATE), Average Treatment Effect on the Treated (ATT) and
the Average Treatment Effect on the Untreated (ATU). The ATT measures the effect on
participants of the intervention and the ATU measures the effect the intervention would
have had on non-participants if they had participated. The ATE measures the effect of the
intervention on the sample population. The three effects are estimated in this study and
stated as:
ATE = E[E{Y1i /Di = 1, P(Zi)} – E{Y0i /Di = 0, P(Zi)}] (3.5)
ATT = E[E{Y1i /Di = 1, P(Zi)} – E{Y0i /Di = 0, P(Zi)}/Di = 1] (3.6)
ATU = E[E{Y1i /Di = 1, P(Zi)} – E{Y0i /Di = 0, P(Zi)}/Di = 0] (3.7)

42
Where:
Y1i and Y0i are the outcomes of participants and non-participants in the input credit
scheme.
Di is binary dependent variable, where Di = 1 is the value for participants of input credit
scheme and Di = 0 is the value for non-participant of input credit scheme
Zi are the characteristics of cocoa farmer i
P(Zi) are the propensity scores for each cocoa farmer
Sensitivity analysis is then conducted to check the effect of any hidden biases on the
estimated treatment effects and these biases occur when there are unobserved variables
which affect the inclusion into treatment group and the outcome variable (productivity) at
the same time (Caliendo and Koepeinig, 2008). When these hidden biases occur, there is
the need to measure the variables and include in the matching and the treatment effects
estimated. This can influence the significance of the effect and may make the results not
robust. The Rosenbaum bound test (r-bound test) is usually employed in the sensitivity
analysis. According to Wainaina et al. (2012) the r-bound is used to test the null
hypothesis indicating no change on the treatment effect for different values of unobserved
selection bias hence not deciding whether or not hidden biases exist as well as magnitude
of the biases.
Statement of Hypothesis
It is expected that participants of input credit scheme in the Amenfi West district have a
higher level of productivity as compared to non-participants because participants are able
to get more farm inputs to use on their farms. The test for difference of mean productivity
of participant and non-participant farmers in the district is hypothesized as:

43
Ho: there is no significant difference between the mean levels of productivity of
participant farmers and non-participant farmers in the Amenfi West district.
Ha: the mean productivity level of participant farmers is significantly greater than the
mean productivity level of non-participant farmers in the Amenfi West district.
Also, it is expected that participants of input credit scheme in the Prestea-Huni Valley
district have a higher level of productivity as compared to non-participants since
participants get more farm inputs to use on their farms.
The test for difference of mean productivity of participant and non-participant farmers in
the district is hypothesized as:
Ho: there is no significant difference between the mean levels of productivity of
participant farmers and non-participant farmers in the Prestea-Huni Valley district.
Ha: the mean productivity level of participant farmers is significantly greater than the
mean productivity level of non-participant farmers in the Prestea-Huni Valley district.
Again, the study hypothesizes that the mean productivity level of participants or non-
participants with access to extension agent will be higher than the mean productivity
level of participants or non-participants with limited access to extension agent. The
hypothesis is stated as:
Ho: there is no significant difference between the mean productivity of participants or
non-participants with access to extension agent.

44
Ha: there is a significant difference between the mean productivity level of participants or
non-participants with access to extension agent compared to the mean productivity level
of participants or non-participants with limited access to extension agent.
3.3.3 Identification and Ranking of Constraints Faced by Cocoa Farmers
Constraints faced by participants of credit programmes were identified from literature
and frequencies attached to the severity of the constraints. The constraints identified
included small amount of loan obtained from the scheme, longer time taken to process
loan request, delays in distributing farm inputs by suppliers among others. The researcher
identified other constraints from respondents through pretesting of questionnaire which
included poor producer prices, diseases and pests attack, high cost of inputs, among
others. The respondents were made to indicate the severity of constraints based on a
three-point likert scale: Disagree (1), Neutral (2) and Agree (3). Weighted mean index is
calculated and assigned to each constraint. The highest mean index of constraint indicates
the most pressing constraints faced by the respondents and corresponds to the highest
value of the likert scale. The lowest mean index is assigned to the least constraint which
corresponds to the lowest value of the likert scale. Assignment of weighted mean
averages to constraints is done in descending order. Other constraints facing participants
and non-participants of input credit scheme are included in the study. The items included
in the study are listed in Table 3.2

45
Table 3.2 Constraints faced by Cocoa Farmers in the Study Area
Constraints Disagree (1) Neutral (2) Agree(3)
Unfavorable weather conditions
Poor producer prices
High cost of farm inputs
High cost of labour
Diseases and pests attack
Limited access to extension agent
High interest rate on loan
The weighted means of constraints identified is used to rank the constraints according to
the most pressing to the least pressing by respondents in the study area. The highest
weighted means are ranked higher followed by the lowest weighted means of constraints
identified
3.4 Data Collection
3.4.1 Types and Sources of Data
The study was conducted in the Western region of Ghana. The target population was the
smallholder cocoa farmers consisting of both participants of input credit scheme and non-
participants.
Participant farmers who are included in the study are cocoa farmers who have benefitted
from the scheme provided by Opportunity International and have not benefitted from any
input credit such as those provided by government or other private interventions for the
past two years. Non-participant farmers included in the study are those who have not
participated in the input credit scheme provided by Opportunity International and may
have benefitted from other input credit by government or other private organizations.

46
Primary and secondary data were employed in the study. Primary data were gathered
through field survey from participants and non-participants of input credit scheme.
Secondary data was sought from research literature, articles, journals, thesis and other
related books. Other sources are web pages of Opportunity International, COCOBOD,
Ministry of Food and Agriculture.
3.4.2 Sampling Size and Sampling technique
A multistage sampling technique was employed in the selection of respondents. The first
stage comprised of the selection of districts which was employed with the use of
purposive sampling method. The Amenfi West and Prestea-Huni Valley districts were
selected due to the high level of cocoa production in the region and the implementation of
the scheme within the districts with these districts having a good number of active
participants of the scheme. The second stage involved the selection of communities
within the districts for the study. This selection was made based on the level of high
performing farmer groups within the scheme. In selecting the various communities,
purposive sampling was employed. This was achieved with assistance from staff of
Opportunity International to indicate the communities. The final stage employed the use
of simple random sampling to identify respondents who have benefitted solely from the
scheme and non-participants who have not benefitted from the scheme at all. In all, a
total of 88 participants were selected from both districts. The number of non-participants
interviewed was 169 with 84 respondents drawn from the Prestea-Huni Valley district
and the remaining from the Amenfi West district. A total of 257 respondents were
interviewed for the study.

47
3.4.3 Survey Instruments
Data collection was done through the administration of semi-structured questionnaire
with a face-to-face interview with smallholder cocoa farmers within the stated districts.
Data was collected based on the specific objectives aligning the research. A set of
questions was first developed and pretested in the study area in January, 2017 to identify
any omissions and questions that were not clear to the respondents. The pretest aided in
modifying the questions to finally obtain full set of questions that were administered to
the respondents.
3.5 The Study Area
The Western region, the highest cocoa producing region in the country, covers a land area
of 23,921 square kilometers representing 10% of the total land size in the country. The
region consists of twenty-two (22) metropolitan, municipalities and districts assemblies.
Major crops grown in the region are both cash and food crops. Predominant cash crops
grown are cocoa, oil palm, rubber and coffee. The region is located in the south-western
of the country and is bordered by Cote D‟ivoire on the West, Central region on the East,
Ashanti and Brong Ahafo regions on the North and on the South by coastline of the
Atlantic Ocean. The population of the region according to the 2010 Population and
Housing census is 2,376,021 with 1,187,774 males and 1,188,247 representing females.
The specific study areas for the research were the Amenfi West and Prestea-Huni Valley
districts.
Amenfi West District
The Amenfi West district is one of the high cocoa producing districts in the Western
region contributing about 20 percent of the country‟s cocoa and is located at the middle

48
part of the region. The district has a total land size of 1,448.56 square kilometers with
Asankrangwa as its capital and a total population of 92,152 consisting of 47,361 males
and 44,791 females. It is bounded to the South by Jomoro, Ellembelle and Nzema East
districts, to the West by Sefwi-Akontombra and Aowin districts, to the North by Bibiani-
Anhwiase-Bekwai, to the East by Prestea-Huni Valley and Wassa Amenfi Central
districts. It lies between latitude 5o 30‟ and 6
o 15‟N and longitude 1
o 45 W and 2
o 11‟W.
Agriculture is the major economic activity in the district and employs about 75.6 percent
of the active population who are mostly into peasant farming. The district is made up of
the semi-deciduous forest in the northern part, the tropical rainforest in the southern part
and the transitional zone found between the two vegetation zones. The tropical rainforest
produces the heaviest rainfall. Both cash and food crops are produced in the district. The
main soil types in the district are the forest ochrosol-oxysols and oxysols with these soils
supporting the cultivation of cocoa, oil palm, coffee and rubber as well as food crops
including rice, tomatoes, maize, plantain and cassava.
The district is one of the wettest parts of the country with a climatic condition comprising
of average annual rainfall from 173mm at the south to 140mm at the north with
temperatures ranging from 240C to 29
0C. Rainy seasons fall within March to July and
September to early December with temperatures rising in March and low temperature
recorded in August. The prevailing climate supports the growth of both cash and food
crops.
The Amenfi West district according to the 2010 Population and Housing census has a
total household number of 20,262 with an average household size of 4.5 persons per

49
household. In the district, about 32.8 percent of the household population is headed by
males and 11.8 percent representing female heads. The economically active population
(15 years and above) is represented by 71.1 percent with males having the highest
proportion of 73.2 percent. Majority of the population in the district are employed in the
agriculture, forestry and fishing industry with about 71.6 percent of the total households
engaged in agricultural activities with highest engagement in crop farming. Cocoa
contributes about 80 percent of incomes earned by farmers with it cultivation in many
parts of the district.
Prestea-Huni Valley District
The Prestea-Huni Valley district is one of the administrative districts in the Western
region. It is located at the south-western part of Ghana and constitutes about 7% of the
total land area of the region with a total land area of approximately 1,809 square km. It
shares boundaries with Amenfi East and Amenfi Central districts in the North, Amenfi
West to the West, Tarkwa Nsuaem Municipality to the South and Mpohor Wassa East
district to the East. The district is located in the rain forest zone and has two rainfall
patterns usually from March to July and from September to November. The mean annual
rainfall in the district is 187.83mm with an annual average temperature ranging between
260C and 30
0C. The vegetation of the district is tropical rainforest which support the
growth of economic trees such as wawa and odum as well as food crops including rice,
cassava and plantain. Majority of the population is engaged in agriculture which shows
that agriculture remains the backbone of the district.
According to the 2010 Population and Housing Census, the district has a population of
159,304 with males and females represented by 50.5% and 49.5% respectively. The

50
district population represents about 6.7% of the total population of the region. Population
of the district living in rural localities is higher than those in the urban localities and is
represented by 62.9% (rural) and 37.1% (urban). The average household size for the
district is 4.0 which is a little lower than the regional average of 4.2 with a total
household population of 154,528. Majority of the working class age (15 years and above)
are mainly engaged in agriculture and forestry. Crop, tree, livestock and fish farming
dominate in the district with about 93.7% of households engaged in crop farming and
about 28.1% in livestock rearing. The district also contributes to the total production of
cocoa from the region with vast lands cultivating cocoa.
Figure 3.1: Map of Western Region Showing Sampled Districts
Source: Geography Department, University of Ghana (2017)
3.6 Theoretical Framework
The theory underlining the study is the theory of the firm which is an economic theory
that focuses on analyzing how a firm makes choices concerning its production in relation

51
to some factors that affect such choices. The theory of the firm is also useful for
analyzing the outcomes of strategies undertaken by firms based on some conditions of
imperfect competition (Hart, 2008). The theory of the firm relates to the input-demand
function and is defined by the factors of production employed to produce a given level of
output. The factors of production employed are capital as a variable cost and land as a
fixed cost for production. Considering the input credit provided to cocoa farmers by
Opportunity International, input credit provides inputs mainly fertilizers and
agrochemicals which are constituents of factors of production for which the farmer pays
for on credit basis with quantities of inputs obtained based on the size of the land
cultivated. The theory of the firm defining the production of the firm, is adopted to
determine the level of inputs use which reflects in the input-demand function;
Qi = f (K, L) (3.8)
Where Qi is the outcome variable, output
K represents capital employed by the farmer
L is the land cultivated for cocoa production
It is assumed that in the short-run, capital employed is variable and land is fixed, thus
output is dependent on level of factors of production used. Capital (K) comprises of two
components, inputs provided by Opportunity International including fertilizers and other
agrochemicals for use on the farms. The other component of capital is the human
resource (labour) which is hired by the farmer and he pays for the services of the laborer.

52
Using the input-demand function, the production of the farmer is determined by the level
of inputs used to efficiently produce at a given quantity of output. The study seeks to
determine the quantities of inputs provided by the scheme which forms part of the capital
component of the input-demand function to assess whether or not the quantities of inputs
provided by the scheme to the farmers contributes to the given level of output produced.
3.7 Analytical framework
The study employs the “with” and “without” evaluation method. This method compares
two groups (participants and non-participants or treatment and control group) in terms of
their behavior by considering key variables that affect both groups. This method uses a
comparison group as a proxy for what would have happened to participants of an
intervention if the intervention did not exist. In conducting impact evaluation,
experimental, quasi-experimental and non-experimental evaluations are used and they
basically deal with control groups or non-participants. Experimental research is a method
that controls variables that are of interest to the researcher and randomly assigns
participants to treatment conditions. Non-experimental research relies on how
observational variables relate to each other rather than altering the variables and further
describes or interpret the findings of the research while quasi-experiment involves the
estimation of causal effect of an intervention on a target population with random
selection. Baker (2000) identifies other methods such as difference in difference methods,
instrumental variables methods and reflexive comparisons. Instrumental variable method
also addresses the problem of selection bias but it is cumbersome to use due to difficulty
in finding instruments that has the probability of affecting participation but do not affect
outcomes from the participation. Difference in Difference (DiD) approach is a research

53
design that estimates the causal effect of an intervention or changes in the outcomes of a
group of people in which the intervention does not affect every person within an
environment at the same time and in the same way (Lechner, 2011). It is suitable to use
when confounding variables are controlled or when the use of instrumental variable is not
appropriate or when information on pre-treatment is available for use. In using DID, it is
important to take into account time when differentiating among groups. Comparison is
done based on four different groups where three groups are grouped under those who
have not been affected by the treatment. Reflexive comparison method is the evaluation
of a group before and after an intervention and it is done using a baseline and a follow-up
survey where the impact on participants of an intervention is measured before and after
an intervention. The survey conducted before the intervention serves as a baseline survey
and a follow-up survey done after participation in the intervention.
Quasi-experimental or Non-experimental designs are methods used to evaluate the effect
of an intervention on outcomes of participants. The matching method is widely used by
researchers (Wainana et al. 2012) in accessing impact evaluations. The expected average
treatment effect on the treated (ATT) is estimated and it explains the difference between
the outcome variable level of participants and the outcome variable of non-participants
which gives a presentation of the outcome of what would have happened if there was no
participation in the intervention. The ATT is specified as:
ATT = E(Y1i – Y0i / Xi = 1) (3.9)
where:
54
Y1i represents the outcome variable of the ith
farmer when he participates in the
intervention
Y0i represents what the outcome variable of the ith
farmer had been if he did not
participate in the intervention. This results in counterfactual which cannot be measured as
compared to the outcome of non-participant which can be measured. The outcome of
non-participant group is represented as:
E(Y0i / Xi = 0) (3.10)
The mean difference between the treatment and control group is specified as:
D = E( Y1i / Xi =1) – E(Y0i / Xi = 0) (3.11)
D = ATT + U (3.12)
where U is represented as:
U = E(Y0i / Xi = 1) – E(Y0i / Xi = 0) (3.13)
To establish that the ATT has a true parameter, the outcome of the control and treatment
groups under the absence of the intervention must be same or equal to zero and is
presented as:
E(Y0i / Xi = 1) = E(Y0i / Xi = 0) (3.14)
Equation (3.13) shows that the error term of the ATT must be the same or equal to zero
but the magnitude of the error term cannot be estimated. This is because E(Y0i / Xi = 1) of
the bias equation cannot be measured since the difference between the outcomes of the
treated and untreated groups may not be known. Rosenbaum & Rubin (1983) suggested
the use of propensity score matching to reduce the self-selection bias in an intervention.

55
This matching method matches the characteristics of a participant group to a non-
participant group with similar characteristics. Other methods have been proposed by
other authors to deal with selection bias based on their own underlying assumptions.
The assumptions underlying the propensity score matching is i) conditional independence
which states that a given set of observable variables (X) must not be affected by the
treatment and that the potential outcomes of the treatment assignment are independent
(Caliendo & Kopeinig, 2008) and ii) a common support region or overlap condition must
be satisfied. This states that individuals with the same observable characteristics must
have a positive probability of being both participants and non-participants (Caliendo &
Kopeinig, 2008)
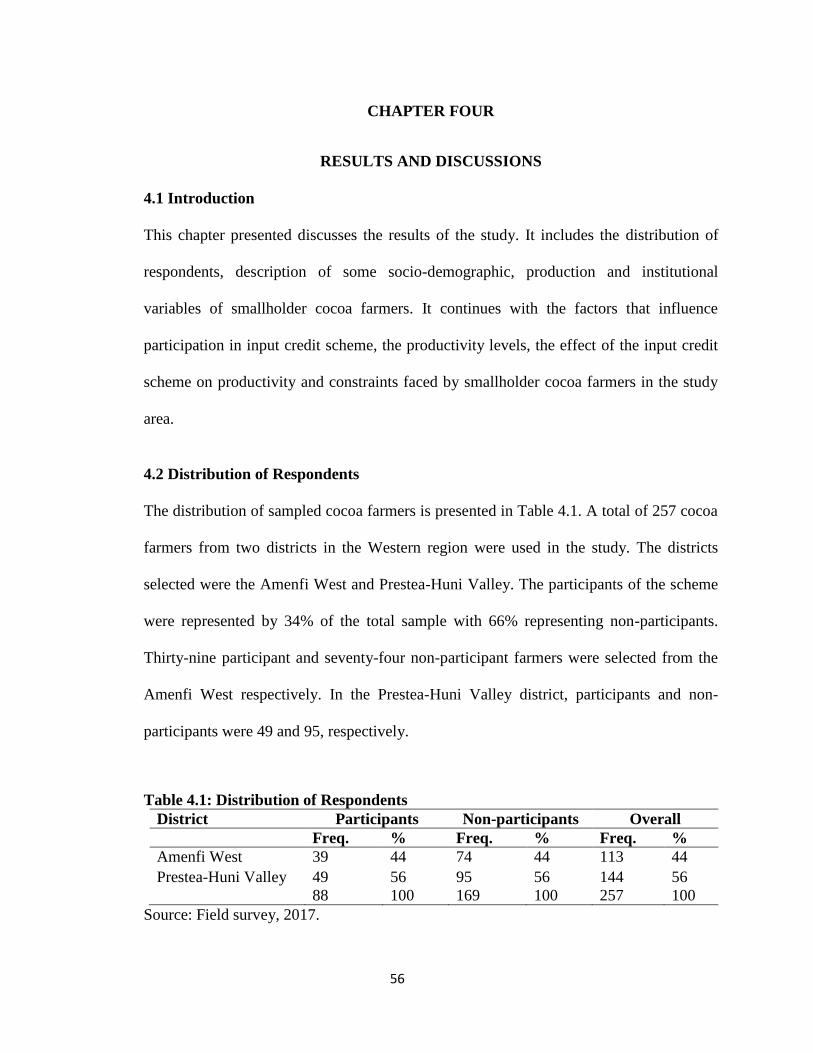
56
CHAPTER FOUR
RESULTS AND DISCUSSIONS
4.1 Introduction
This chapter presented discusses the results of the study. It includes the distribution of
respondents, description of some socio-demographic, production and institutional
variables of smallholder cocoa farmers. It continues with the factors that influence
participation in input credit scheme, the productivity levels, the effect of the input credit
scheme on productivity and constraints faced by smallholder cocoa farmers in the study
area.
4.2 Distribution of Respondents
The distribution of sampled cocoa farmers is presented in Table 4.1. A total of 257 cocoa
farmers from two districts in the Western region were used in the study. The districts
selected were the Amenfi West and Prestea-Huni Valley. The participants of the scheme
were represented by 34% of the total sample with 66% representing non-participants.
Thirty-nine participant and seventy-four non-participant farmers were selected from the
Amenfi West respectively. In the Prestea-Huni Valley district, participants and non-
participants were 49 and 95, respectively.
Table 4.1: Distribution of Respondents
District Participants Non-participants Overall
Freq. % Freq. % Freq. %
Amenfi West 39 44 74 44 113 44
Prestea-Huni Valley 49 56 95 56 144 56
88 100 169 100 257 100
Source: Field survey, 2017.

57
4.3 Socio-demographic Characteristics of Respondents
A description of some socio-demographic characteristics of the respondents are
represented in Table 4.2 and they include: age, gender, number of years spent in school,
household size, marital status, and farmers‟ main source of income.
The minimum age of participant farmers was 23 years and a maximum age of 74 years
with a mean age represented by 48.44 years. For non-participants, the minimum age was
21 years and the maximum age was 90 years with a mean age of 47.79.
Majority of the participants were dominated by males representing 72.7% and females
represented by 27.3%. Similarly, the non-participants were dominated by males with a
representation of 76.3% and females 23.7%.
Some participants and non-participants of the scheme had no education with maximum
formal education of 20 years and 12 years for participants and non-participants
respectively. Similarly, mean years of formal education of 9.42 and 4.14 represented
participants and non-participants respectively.
A value of 14 represented the maximum household size of participants and a value of 12
represented the maximum household size of non-participants. Minimum value of 1
represented both participants and non-participants household size. A mean household size
of 4.76 and 4.14 represented participants and non-participants respectively.
Again, majority of the participants were married (81.8%) with the remaining 18.2% being
unmarried (single, divorced and widowed). With non-participants, 81.1% and 18.9%
represented those who were married and those otherwise respectively.

58
Generally, participants who have other off-farm income sources were 19.3% with those
not engaged in off-farm income activities being 80.7%. About 18.9% of non-participants
were engaged in off-farm incomes activities while 81.1% had no off-farm income
sources.
Table 4.2: Distribution of some Socio-demographic Characteristics of Farmers
Variable Category Participants Non-
participants
Overall t-test Sig.
Age (years) Minimum 23 21 21
Maximum 74 90 90
Mean 48.44
(1.286)
47.79
(1.075)
48.12 -.374 0.709
Years of
schooling
(years)
Minimum 0 0 0
Maximum 20 12 20
Mean 9.42
(0.494)
4.14
(0.394)
6.78 -4.009 0.000
Household
size
(number)
Minimum 1 1 1
Maximum 14 12 14
Mean 4.76
(0.252)
4.14
(0.152)
4.45 -2.224 0.027
% % %
Gender Males 72.7 76.3 75.1
Females 27.3 23.7 24.9
Marital
status
Married 81.8 81.1 81.3
Otherwise
(single,
divorced,
widowed)
18.2 18.9 18.7
Off-farm
Income
sources
Yes 19.3 18.9 19.1
No 80.7 81.1 80.9
Standard Error are in parentheses
Source: Field survey, 2017

59
4.4 Production Characteristics of Respondents
Some production characteristics of respondents represented in this section are farming
experience, farm size, membership of FBO, fertilizer use and agrochemical use. Table 4.3
presents the production characteristics.
The minimum farming experience of participants was 3 years and a maximum of 43
years. With non-participants, values of 1 and 49 represented the minimum and maximum
years of farming experience. Mean years of 17.64 and 16.54 represented participants and
non-participants respectively.
All participants belonged to an FBO. Again, about 71.6% of non-participants did not
belong to an FBO while 28.4% were members of an FBO.
Generally, the minimum, maximum and mean farm size was represented by 0.8 hectares,
17.2 hectares and 6.98 hectares respectively. Farm sizes of non-participants were 0.6, 12
and 2.97 representing the minimum, maximum and mean farm sizes in hectares.
Participants of the scheme applied a maximum of 404kg/ha of fertilizers on their farms
while non-participants used a maximum of 300kg/ha of fertilizers. Both participants and
non-participants had a minimum of zero application of fertilizers on their cocoa farms.
Values of 115.76 and 42.96kg/ha were recorded as mean quantities of fertilizers applied
respectively.

60
Table 4.3 Production variables of respondents
Variable Category Participants Non-
participants
t-test Sig.
Farming
experience
(years)
Mean 17.64
(0.909)
16.54
(0.769)
-0.877 0.381
Minimum 3 1
Maximum 43 49
Farm size
(hectares)
Mean 6.98
(0.369)
2.97
(0.143)
-11.92 0.000
Minimum 0.8 0.6
Maximum 17.2 12
Fertilizer use
(kg/ha)
Mean 115.76
(13.477)
42.96
(6.637)
-5.440 0.000
Minimum 0 0
Maximum 404 300
Agrochemical
use (lit/ha)
Mean 22.78
(2.398)
5.71
(0.476)
-9.234 0.000
Minimum 0 0
Maximum 150 40
Average age
of cocoa tree
(years)
Mean 15.34
(0.827)
14.78
(0.695)
-0.492 0.623
Minimum 3.5 1
Maximum 40 50
(%) (%)
Membership
of FBO
Yes 100 28.4
No - 71.6
Standard Error are in parentheses
Source: Field survey, 2017
Similarly, both participant and non-participant farmers had a minimum of zero
application of agrochemicals on their farms. Participant farmers had a maximum of
150litres/ha application of agrochemicals while non-participants applied a maximum of
40litres/ha of agrochemicals.

61
The mean average age of cocoa trees of participants and non-participants were 15.34 and
14.78 years respectively. The maximum and minimum average ages of cocoa trees of
non-participant farmers were 1 and 50 years, respectively while participants recorded
minimum and maximum values of 3.5 and 40 years, respectively.
4.5. Institutional Factors of Respondents
In this section, institutional factors such as access to extension agents, timeliness of farm
inputs and awareness of financial institution are presented in Table 4.4.
Table 4.4 Institutional factors of respondents
Variable Category Participants Non-
participants
t-test Sig.
Access to extension
agent
Mean 3.34
(0.155)
0.89
(0.111)
-12.927 0.000
Minimum 1 0
Maximum 7 7
(%) (%)
Timeliness of farm
inputs
Yes 91 -
No 9 -
Awareness of
financial institution
Yes 100 24.3
No 0 75.7
Standard Error are in parentheses
Source: Field survey, 2017
Participant farmers had at least 1 contact with extension agent and a maximum contact of
7. With non-participants, farmers had a zero contact with extension agent and a
maximum contact of 7 as with participant farmers.
Overall, all participants of the scheme were aware of the existence of the financial
institution and that the institution provided an input credit instead of cash credit to
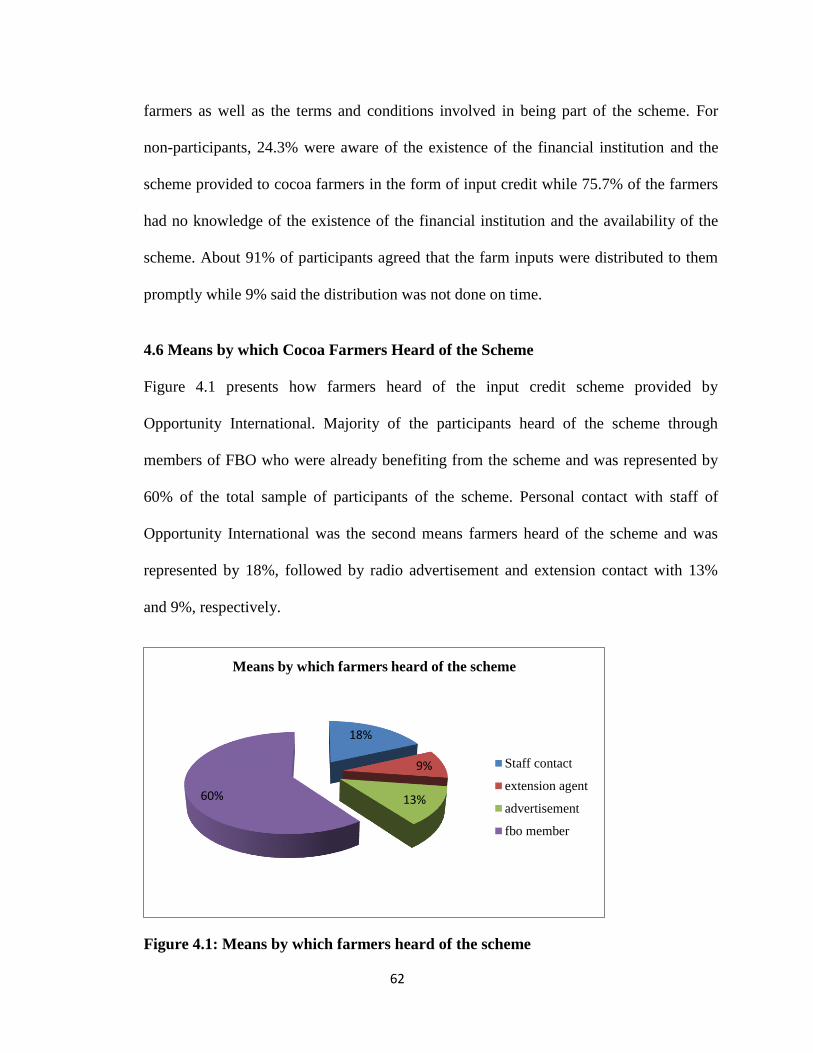
62
farmers as well as the terms and conditions involved in being part of the scheme. For
non-participants, 24.3% were aware of the existence of the financial institution and the
scheme provided to cocoa farmers in the form of input credit while 75.7% of the farmers
had no knowledge of the existence of the financial institution and the availability of the
scheme. About 91% of participants agreed that the farm inputs were distributed to them
promptly while 9% said the distribution was not done on time.
4.6 Means by which Cocoa Farmers Heard of the Scheme
Figure 4.1 presents how farmers heard of the input credit scheme provided by
Opportunity International. Majority of the participants heard of the scheme through
members of FBO who were already benefiting from the scheme and was represented by
60% of the total sample of participants of the scheme. Personal contact with staff of
Opportunity International was the second means farmers heard of the scheme and was
represented by 18%, followed by radio advertisement and extension contact with 13%
and 9%, respectively.
Figure 4.1: Means by which farmers heard of the scheme
18%
9%
13% 60%
Means by which farmers heard of the scheme
Staff contact
extension agent
advertisement
fbo member

63
4.6.1 Criteria for Selecting Farmers to Participate in Input Credit Scheme
For cocoa farmers to benefit from the scheme, they are required to satisfy some criteria
laid down by Opportunity International. The main criterion for participation in the input
credit scheme is to be a member of an FBO within the community in which the scheme is
implemented. The purpose of this criterion is for the group to serve as a source of
security or form of collateral for obtaining inputs on credit. The second major criterion is
for a farmer to relate with extension agents in the community. The extension agents serve
as contact between Opportunity International and the cocoa farmers. These extension
agents provide some knowledge to cocoa farmers on good agronomic practices in cocoa
production. Again, for a farmer to be a participant of the scheme, he/she must open an
account with the financial institution. This is to encourage the farmer to save.
4.7 Productivity Levels of Farmers
Table 4.5 presents the productivity levels of both participant and non-participant farmers.
The minimum productivity level (output) of participants is 100.5kg/ha and maximum
1380kg/ha. A minimum and maximum values of 64kg/ha and 1180kg/ha represent
outputs of non-participant farmers respectively. Output obtained are from tree crops with
maximum ages of 40 and 50 years for participants and non-participants respectively. The
mean output level of participants is significantly higher than the mean output level of
non-participants.

64
Table 4.5 Productivity Levels of Farmers
Type of
Farmer
Obs. Min.
output
(kg/ha)
Max.
output
(kg/ha)
Mean
output
(kg/ha)
Mean diff
(kg/ha)
t-test Sig.
Participants 88 100.5 1380 697.1
(284.5)
318.01 -15.745 0.000***
Non-
participants
169 64 1180 353.1
(208.1)
Standard Error are in parentheses
Source: Author‟s computation, 2017
4.8 Factors Influencing Participation in Input Credit Scheme
The Probit model was employed to estimate the parameters of the factors that influence
participation in input credit scheme in the study area. The probability value of 0.000
(Prob>Chi2) indicates the overall significance of the model meaning the model is
significant at 1%. The Pseudo R2 indicates the extent to which the explanatory variables
jointly explain the variations in the dependent variable. A value of 0.7848 means that
about 78% of the variations in the dependent variable are explained by the independent
variables in the overall model. Overall, the factors that positively influence participation
in input credit scheme are farm size, awareness of financial institution, membership of
FBO, access to extension contact, location of the farmer, timeliness of inputs and
adequacy of loan amount with age negatively influencing participation. However,
farming experience, off-farm income sources, household size, gender, flexibility of
payment and educational levels of respondents were not significant variables that
influenced participation in input credit scheme in the study area.

65
Table 4.6 Probit Regression Results of Factors Influencing Participation
Variable Coefficient Std. Error P>z
Farm size 0.6692 0.1143 0.000***
Awareness of financial institution 0.8349 0.2678 0.002***
Farming experience 0.0192 0.0209 0.357
Member of FBO 0.8210 0.5181 0.000***
Access to extension agent 0.9976 0.3859 0.015**
Off-farm income sources -0.0477 0.3257 0.883
Gender -0.8443 0.6188 0.172
Household size 0.0813 0.0624 0.192
Years spent in schools 0.0228 0.0251 0.364
Age -0.0262 0.0136 0.054*
Location 0.6751 0.4009 0.092*
Timeliness of Inputs supplied 0.8623 0.4355 0.048**
Flexibility of payment -0.1003 0.3855 0.795
Adequacy of loan amount 1.1740 0.4100 0.004***
Constant -3.1144 1.1607 0.007
No. of Obs. 257
Pseudo R2
0.7848
Prob.> Chi2 0.0000
* , ** and *** implies significance at 10%, 5% and 1% respectively
Source: Author‟s computation, 2017
The results of the study revealed a positive significance of farm size indicating that the
size of a farmer determined the probability of participating in input credit scheme and
corresponds to the a-priori expectation. This conforms to Etwire et al.(2013) and
Motsoari et al.(2015) who found that farm/firm size positively influenced participation in
agricultural projects as it helps farmers to easily get access to farm inputs to improve
farm yields. Baffoe et al.(2014) found farm size not significant as factors influencing
differences in productivity among household borrowers.
Farmer‟s awareness of financial institution providing the input credit was found to be
significant at 1% as it increases the farmer‟s access to credit. Once the farmer is aware of
the existence of the lending institution, probability of participating in the credit scheme is
high and this is consistent with a study by Motsoari et al.(2015).
66
Smallholder farmers who belong to an FBO increased their probability of participating in
the scheme. The study revealed that farmers who belonged to an FBO were likely to
participate in the scheme by 0.8210. This is consistent with criterion for participating in
the scheme by Opportunity International as the major requirement for a farmer to access
input credit is for a farmer to be a member of an FBO. Similarly, a study by Mensah &
Agbekpornu (2015) and Motsoari et al. (2015) found a positive relationship between an
agricultural firm being a member of a business organization and access to credit. Ayamga
et al.(2006) also found a negative relationship between distance between borrower and
micro-credit institution.
There was a positive relationship between access to extension agent and the probability
of participating in input credit scheme. The study indicated the probability of a cocoa
farmer to participate in the scheme was 0.9976 when the farmer has contact with an
extension agent. This also conforms to the criterion of the financial institution which
indicates for a farmer to benefit from the scheme he should have contact with an
extension agent. This is consistent with a study by Etwire et al. (2013) who found
farmer‟s contact with extension services to be positively related to participation in
agricultural projects.
Again, the study revealed that age of participant farmers determines the probability of
participation in the scheme but was negatively related which met the a-priori expectation
where it was expected that older farmers who are not risk takers are not willing to
participate in an agricultural programme. This contradicts with studies by Awotide et
al.(2015) and Etwire et al. (2013) who found age of a farmer to positively relate to
accessing credit and participating in agricultural projects respectively indicating that

67
young farmers are risk neutral and so would want to access credit or participate in
projects. On the other hand an older farmer would want to participate in an agricultural
intervention because he may not be more energetic to be involved in other activities to
generate funds and so would want to seek assistance from the intervention. Baffoe et al.
(2014) and Ayamga et al. (2006) also found a positive relationship between age and
participation in credit programmes.
The study showed a positive relationship between the timeliness of input supply and
participation in the input credit scheme, thus the probability of a farmer to participate in
the scheme is represented by 0.8623. This reflects in the majority of participant farmers
(about 91%) agreeing that the scheme supplied the farm inputs to farmers on time for use
before the farming season began. The result conforms to the a-priori expectation where it
was expected that the timeliness of input supplied results in influencing participation in
the scheme.
Also, the study revealed a positive relationship between adequacy of loan amount and the
probability of participating in the input credit scheme. Participant farmers indicated that
the quantities of farm inputs supplied in the form of loan credit were enough to cover the
use on their cocoa farms. Etwire et al. (2013) in their study found that farmers access to
production credit influences participation in agricultural projects and this supports the
result from the study that once farmers are able to obtain enough production credit, they
are willing to participate in the scheme.
The location of a farmer was expected to positively influence participation in the input
credit scheme based on the study‟s a-priori expectation. The result indicated a positive

68
relationship between the location of the farmer and the probability of participation in the
scheme. Cocoa farmers located in the Amenfi West and Prestea-Huni Valley districts are
likely to partake in the input credit scheme since these districts are operational districts of
the financial institution.
Variables that were not likely to influence participation in the scheme were not consistent
with other studies. Botlhoko & Oladele (2013) found household size to be a significant
factor that affects participation in agricultural projects and was also consistent with
Baffoe et al. (2014). Again, Baffoe et al. (2014) and Ayamga et al. (2006) found level of
education to be significantly related to credit programmes.
4.9 Propensity Score Matching Analysis of the Effect of Input Credit Scheme on
Productivity of Smallholder Cocoa Farmers
Results of the Probit regression model were employed in the estimation of propensity
scores for each farmer. Significant variables obtained from the regression model were
used in the propensity score matching. The PSM allowed for participants (treatment
group) and non-participants (control group) to be matched thus reducing the level of bias
in the study. After the derivation of propensity scores, the common support region is
required to validate the quality of the matching scores by discarding propensity scores of
treated individuals whose propensity scores lie beyond the range of propensity scores of
control individuals. This satisfies the assumption that the probability of participation in
the input credit scheme based on observed characteristics lie between 0 and 1 and is not
perfectly predicted.

69
4.9.1 PSM Results of Effect of Input Credit Scheme on Productivity
The productivity measure of the effect of input credit scheme was based on farmer‟s
output, fertilizer use and agrochemical use. The propensity score matching was done
using the Nearest Neighbour Matching algorithm (NNM) with replacement. Table 4.7
presents the results of the estimation. The effect of the input credit scheme on
productivity in terms of output is measured in kilograms per hectare. The ATT index
indicates the average effect of the intervention on participant farmers. Farmers
participation in the scheme increased their output on an average by 449.9kg/ha. This
indicates a positive and significant effect at 1% on participants of the scheme. The result
conforms to findings by Owusu et al. (2011) who found a positive and significant effect
of participation in non-farm income on household income. Also, the ATU which
presents the average effect of the intervention on non-participants has a positive and
significant effect by participating in the intervention. A value of 421.94kg/ha indicates
that the productivity of non-participants would have increased by that value if they had
participated in the scheme and has a positive and significant effect on non-participants.
Also, an ATE of 432.54kg/ha which is significant at 1% indicates that the productivity of
the sample population of cocoa farmers in the scheme increased by 432.54kg/ha on the
average.

70
Table 4.7 PSM results of Input Credit Scheme on Productivity
Productivity measure Sample Treated Control Difference T-stats
Output (kg/ha) ATT 842.37 392.47 449.9*** 4.52
ATU 476.99 898.93 421.94*** 3.91
ATE 432.54*** 4.51
Fertilizer use (kg/ha) ATT 100.22 15.91 84.31*** 2.55
ATU 45.22 120.72 75.50*** 2.02
ATE 78.84*** 2.45
Agrochemical use (lit/ha) ATT 14.89 4.94 9.95*** 3.84
ATU 8.67 17.61 8.93*** 2.13
ATE 9.56*** 3.36
*** denote significance at 1%
Source: Author‟s computation, 2017
In terms of fertilizer use, the ATT was 84.31kg/ha which has a positive and significant
effect on participant farmers. The result implies that participants of the scheme increased
their quantities of fertilizer use on their cocoa farms on an average by 84.31kg/ha. The
effect of the intervention on non-participants is presented by an ATU of 75.50kg/ha
which has a positive effect. A value of 75.50kg/ha indicates that the quantity of fertilizer
used by non-participants on their cocoa farms would have increased by 75.50kg/ha. Also,
on an average, the fertilizer use by sample population of cocoa farmers of the scheme
presented in the ATE was 78.84kg/ha (significant at 1%).
Overall, an ATE of 9.56litres/ha indicates that the use of agrochemicals of the sample
population of cocoa farmers in the scheme increased on an average by 9.56litres/ha. An
ATT value of 9.95litres/ha implies the use of agrochemicals by participants of the scheme
increased on an average by 9.95litres/ha. Lastly, an ATU of 8.93litres/ha implies the
quantity of agrochemicals used by non-participants would have increased by 8.93litres/ha
if they had participated in the scheme.

71
Generally, the values of ATT across the productivity measures of output, fertilizer use
and agrochemical use are higher compared to ATU and ATE values. This reveals that
cocoa farmers who have a higher probability of participating in the scheme increase their
level of productivity compared to farmers who have a less probability of participating in
the scheme.
Indicators of Matching Quality Before and After Matching
Table 4.8 shows the indicators of matching quality before and after matching. It is
observed that the Pseudo R2 and the Likelihood Ratio test are high and significant before
matching with a higher mean bias. But after matching, the Pseudo R2, the Likelihood
Ratio test as well as the mean bias are low. The low Pseudo R2
and the Likelihood Ratio
test being insignificant satisfy the hypothesis that distribution in covariates of participants
and non-participants are the same after matching. These low values imply that the
matching of the characteristics have been able to reduce the level of bias of the
characteristics of both participant and non-participant farmers. The characteristics of the
participants and non-participants are then balanced after matching.
Table 4.8 Indicators of Matching Quality Before and After Matching
Productivity measure Sample Pseudo R2 LR Chi
2 P>chi
2 Mean
bias
Output (kg/ha) Unmatched 0.677 220.13 0.000 165.4
Matched
0.047 2.35 0.502 38.3
Fertilizer use (kg/ha) Unmatched 0.677 220.13 0.000 165.4
Matched
0.047 2.35 0.50. 38.3
Agrochemical use (lit/ha) Unmatched 0.677 220.13 0.000 165.4
Matched 0.047 2.35 0.502 38.3
Source: Author‟s computation, 2017
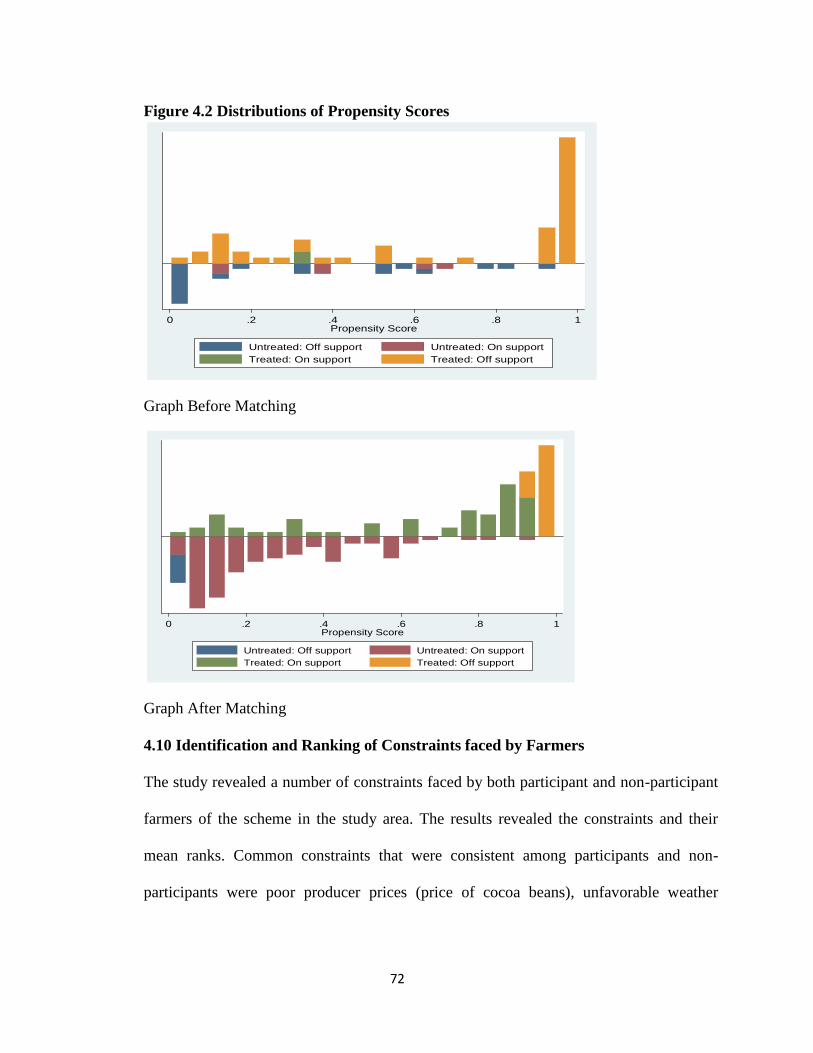
72
Figure 4.2 Distributions of Propensity Scores
Graph Before Matching
Graph After Matching
4.10 Identification and Ranking of Constraints faced by Farmers
The study revealed a number of constraints faced by both participant and non-participant
farmers of the scheme in the study area. The results revealed the constraints and their
mean ranks. Common constraints that were consistent among participants and non-
participants were poor producer prices (price of cocoa beans), unfavorable weather
0 .2 .4 .6 .8 1Propensity Score
Untreated: Off support Untreated: On support
Treated: On support Treated: Off support
0 .2 .4 .6 .8 1Propensity Score
Untreated: Off support Untreated: On support
Treated: On support Treated: Off support
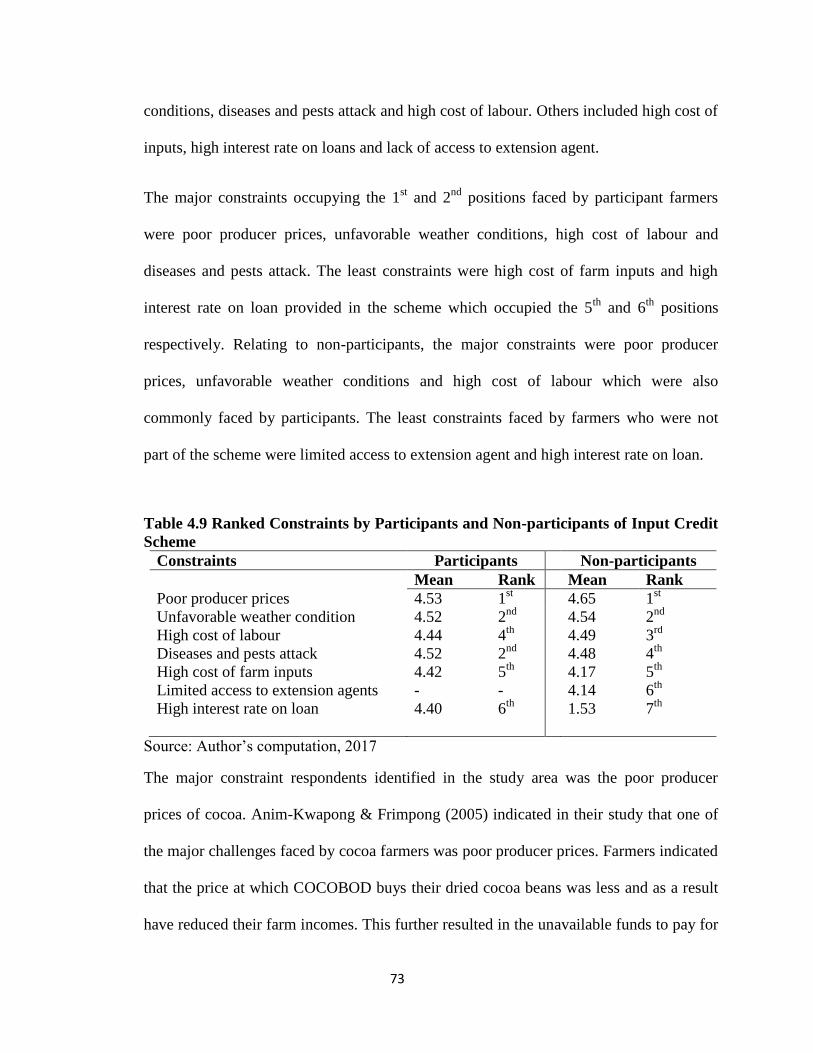
73
conditions, diseases and pests attack and high cost of labour. Others included high cost of
inputs, high interest rate on loans and lack of access to extension agent.
The major constraints occupying the 1st and 2
nd positions faced by participant farmers
were poor producer prices, unfavorable weather conditions, high cost of labour and
diseases and pests attack. The least constraints were high cost of farm inputs and high
interest rate on loan provided in the scheme which occupied the 5th
and 6th
positions
respectively. Relating to non-participants, the major constraints were poor producer
prices, unfavorable weather conditions and high cost of labour which were also
commonly faced by participants. The least constraints faced by farmers who were not
part of the scheme were limited access to extension agent and high interest rate on loan.
Table 4.9 Ranked Constraints by Participants and Non-participants of Input Credit
Scheme
Constraints Participants Non-participants
Mean Rank Mean Rank
Poor producer prices 4.53 1st 4.65 1
st
Unfavorable weather condition 4.52 2nd
4.54 2nd
High cost of labour 4.44 4th
4.49 3rd
Diseases and pests attack 4.52 2nd
4.48 4th
High cost of farm inputs 4.42 5th
4.17 5th
Limited access to extension agents - - 4.14 6th
High interest rate on loan 4.40 6th
1.53 7th
Source: Author‟s computation, 2017
The major constraint respondents identified in the study area was the poor producer
prices of cocoa. Anim-Kwapong & Frimpong (2005) indicated in their study that one of
the major challenges faced by cocoa farmers was poor producer prices. Farmers indicated
that the price at which COCOBOD buys their dried cocoa beans was less and as a result
have reduced their farm incomes. This further resulted in the unavailable funds to pay for
74
more farm inputs like fertilizers and other agrochemicals for use to increase their yields
and also reduced the number of laborers to engage in farming activities such as pruning,
weeding and harvesting.
An unfavorable weather condition was stated as the second most pressing constraint
faced by farmers and conforms to a study by Anang (2015). Farmers observed that rains
weren‟t coming as expected during the production year and so their cocoa trees did not
get the needed amount of rains for growth as farmers mainly depended on rainfall. It was
also indicated that throughout the production year intensive sunshine was experienced
resulting in drying up of cocoa leaves and pods. This caused a negative effect on yields
obtained during the production period which affected their farm incomes as well.
It was observed that laborers provide services to cocoa farmers in terms of some farming
activities such as pruning, spraying and harvesting. Farmers are charged according to the
type of activity and the size of the farm with a charge of between GHC20 to GHC60 per
person per day. Respondents confirmed that the charges were too high and this affected
their farm incomes negatively. Others who were cash trapped were unable to undertake
some activities such as pruning on time. Participant farmers of the scheme stated the cost
of labour was not catered for by the scheme and this created a major challenge for them
as many of them had limited cash to pay for labour services.
The study revealed the presence of diseases and pests in the study area posed a negative
effect on production of cocoa in communities of the Amenfi West and Prestea-Huni
Valley districts and this is similar to a study by Dormon et al. (2007). Major diseases
that affected the cocoa pods posed signs such as development of empty pods, black pods

75
and pest infestation that affected growth of the trees. The presence of diseases and pests
resulted in participant farmers demanding more agrochemicals to combat the infestation.
This further resulted in higher payments made which subsequently reduced the farm
incomes of the farmers. Farmers who were cash trapped particularly non-participant
farmers could afford few litres of the agrochemicals while others did not apply any at all
on their farms.
Participants of the scheme indicated that the prices of the farm inputs distributed to them
were too expensive as compared to inputs on the market. This increased their amount of
inputs bought on credit. Non-participants also agreed that the prices of farm inputs such
as fertilizers and other agrochemicals on the market are generally expensive and as a
result they are unable to buy enough to apply on their farms and others not buying at all.
This reduced their farm yields and subsequently reduction in incomes generated from
cocoa production.
Also, the study revealed majority of non-participant farmers‟ had limited contact with
extension agent which was a challenge to them as these agents serve as a source of
education and training for the farmers. This was evidenced that some farmers had zero
contact with extension agents the whole of the year and this affected their production as
they needed some guidelines to address the presence of pests and diseases on their cocoa
farms. Although this constraint was rated among the least pressing, respondents indicated
the limited access to extension agent had a negative effect on production. Majority of the
participants of the scheme had at least one contact with an extension agent during the
year and report showed farmers were not limited in accessing assistance from these

76
agents. This is due to the fact that staff of Opportunity International operated through the
extension agents within the communities
A common constraint both participant and non-participant farmers faced which occupied
the lowest position was the high interest rate on loan. Participants of the scheme revealed
the interest rate the financial institution charges on the credit inputs was too high as this
reduced the incomes they had after harvesting. Even though the payment of the credit
was flexible that is payment made during periods of harvest usually between October to
December, farmers complained that an annual interest rate of 42% was high on their part.
Due to this constraint, some members of the scheme were contemplating exiting the
scheme.
Similar challenge faced was with the rural banks and money lenders in the community.
Money lenders were charging 100% interest on loans which posed a major threat to their
farm incomes. Non-participants also revealed loans obtained from money lenders were
very high and this deterred some farmers from accessing such loans.
77
CHAPTER FIVE
SUMMARY, CONCLUSIONS AND RECOMMENDATIONS
5.1 Introduction
This chapter presents the summary, conclusions and policy recommendations based on
the findings of the study.
5.2 Summary of the Study
The primary objective of the study was to analyze the effect of access to input credit on
productivity of smallholder cocoa farmers in the Amenfi West and Prestea-Huni Valley
districts of the Western Region of Ghana by the input credit scheme. The main objective
was achieved by first identifying the factors influencing participation in the scheme with
analysis made using the Probit regression model. The second objective which was to
determine the effect of access to input credit scheme on productivity was analyzed using
the Propensity Score Matching (PSM) approach using the Nearest Neighbour Matching
algorithm. With the help of a three-point likert scale, the last objective which was to
identify the constraints faced by farmers in the study area was achieved with ranking
done based on the weighted means of constraints. Constraints were identified from
literature and pretested on the field where respondents also identified other constraints
faced.
Purposive sampling technique was employed in selecting the districts in which the
scheme was operating and was based on the high level of involvement of the farmers in
the scheme. The Amenfi West and Prestea-Huni Valley districts were purposively
sampled from the Western region with the aim of obtaining enough respondents since

78
these two districts had the active members in the scheme. Similarly, the communities
visited were purposively sampled from each district and respondents randomly sampled.
A total of 88 participant cocoa farmers and 169 non-participant cocoa farmers were
selected from both districts.
The results showed farm size, awareness of financial institution, membership of FBO,
access to extension agent, location of farmer, timeliness of input supplied, adequacy of
loan amount and age of the farmer as factors influencing participation in input credit
scheme in the study area. All the variables except age had a positive relationship with
probability of participation in the scheme. Farm size, awareness of financial institution,
membership of FBO and adequacy of loan amount were significant at 1% with age and
location of farmer been significant at 10%. Access to extension agent and timeliness of
input were significant at 5%. The Pseudo R2 for the overall model was 0.7848 indicating
the independent variables were able to explain the variations in the dependent variable by
78.48%. The probability value of 0.000 represented by Prob>Chi2 indicated the overall
model was significant at 1%. Other factors that did not significantly influence
participation in the input credit scheme were farming experience, off-farm income
sources, household size, gender, flexibility of payment and number of years spent in
school by respondents.
Again, the study revealed farmers‟ participation in the input credit scheme has a positive
effect on the productivity of participants as it resulted in increases in outputs, fertilizer
and agrochemical use. Cocoa farmers who participated in the scheme had their output
increased on an average by 449.9kg/ha. The effect of participation in the intervention also
increased farmers use of fertilizers on an average by 84.31kg/ha. The quantity of

79
agrochemicals used by participant farmers also increased on an average by 9.95litres/ha.
Also, on an average, farmers who did not participate in the scheme would have increased
their output by 421.94kg/ha. Non-participant farmers would have obtained average
increases in the use of fertilizers and agrochemicals by 75.50kg/ha and 8.93litres/ha
respectively.
Lastly, results from the study indicate both participants and non-participants were faced
with common constraints in the production of cocoa. The most pressing constraints faced
were the poor producer prices for cocoa and unfavorable weather conditions which
occupied the 1st and 2
nd positions respectively. The least constraints faced by participant
farmers were high cost of farm inputs and high interest rate on loans. Non-participants
identified limited access to extension agent and high interest rate on loans as the least
pressing constraints occupying the 6th
and 7th
positions respectively. Other constraints
identified were high cost of labour and diseases and pests attack on cocoa farms.
5.3 Conclusions of the Study
Results of the study showed farm size, awareness of financial institution, membership of
FBO, access to extension agent, location of the farmer, timeliness of inputs, adequacy of
loan amount and age of cocoa farmers as factors that influence participation in input
credit scheme in the study area. It is concluded that for a farmer to likely participate in
the input credit scheme provided by Opportunity International, a farmer must consider
the stated factors in order to participate in the scheme. All factors except age had a
positive relationship with participation in the intervention.

80
Empirical results also revealed that the input credit scheme has a positive and significant
effect on the productivity of smallholder cocoa farmers in terms of their output, fertilizer
use and agrochemical use. It is concluded that farmers who participated in the input credit
scheme were able to obtain more farm inputs including fertilizers and agrochemicals for
use on their farms. This subsequently resulted in increases in the output of the participant
farmers as indicated in the significantly higher access to fertilizers and agrochemicals
compared to non-participants.
Lastly, both participant and non-participant farmers are faced with some constraints in
cocoa production in the study area. The major constraints faced by farmers are poor
producer prices and unfavorable weather conditions with less pressing constraints faced
by participants been high cost of farm inputs and high interest rate on loans with non-
participants identifying limited access to extension agent and high interest rate on loans
as less pressing constraints. Other constraints identified are high cost of labour and
diseases and pests attack on farms in the study area.
5.4 Policy Recommendations
Smallholder cocoa farmers are encouraged to join FBOs in order to benefit from the
scheme as this is one of the main criteria by Opportunity International for farmers to
participate in the scheme. Also, for farmers to be aware and interested to participate in
the intervention, Opportunity International should increase the level of awareness of the
scheme through advertisement and frequent staff visits to various communities. Again,
the involvement of extension agents must be encouraged to increase the awareness
among farmers in other communities within the districts as these agents serve as point of

81
contact. Opportunity International is also encouraged to continue supplying farm inputs
to farmers on time to ensure the inputs are used at the right time to increase production. It
is also recommended that Opportunity International maintains or increases the amount of
loan in terms of input credit to farmers to ensure more inputs are used on the farms for
increased outputs.
Government should provide mechanisms or incentives to help support private credit
schemes for cocoa production. This will encourage other organizations or institutions to
replicate the scheme in parts of the country to increase farmers‟ access to fertilizers and
other agrochemicals to enhance productivity. Through this intervention, farmers are able
to increase their access to farm inputs such as fertilizers and other agrochemicals. This
will further boost the supply of cocoa beans on the world market by Ghana.
To encourage production, government should pump in more funds into the stabilization
fund to better cushion farmers and protect them against any shocks in the international
market to encourage farmers to increase cocoa supply. Ghana in the past years has
experienced smuggling of cocoa beans to Cote D‟ivoire due to the poor prices offered for
the produce. To mitigate this, the government in collaboration with COCOBOD should
increase prices offered to cocoa farmers through the stabilization fund to prevent
smuggling and improve production. Also, government in collaboration with COCOBOD
should employ more agricultural extension agents to liaise with cocoa farmers in the
districts in order to increase extension contact. This will help farmers to gain more
knowledge about their farming activities.

82
In addressing the problem of unfavorable weather conditions, farmers are encouraged to
adopt climate-smart production systems to help address the over-dependence on weather
especially for source of water. Practices such as construction of irrigation systems,
planting of shade trees to ward off excessive sunlight and adoption of improved planting
varieties can help increase farm yields which subsequently increases farmer‟s income.
This can be achieved through assistance from NGO, other financial institutions and crop
research institutes.
Lastly, Opportunity International is encouraged to support farmers with cash to pay for
labour as farmers are mostly cash trapped before harvesting thus finding it difficult hiring
labour to work on their farms. When labour is not available, some production activities
are not able to be undertaken such as pruning, fertilizer application, harvesting among
others, thus negatively affecting cocoa yields of farmers. To avoid any misuse of cash
credit, Opportunity International must adopt strict procedure for payment to laborers
hired to work on farms.

83
REFERENCES
Adjinah K.O. & Opoku, I.Y. (2010). The national cocoa diseases and pests control:
Achievements and challenges. Retrieved from
http://www.modernghana.com/news/273336.
Adjei-Frimpong, E. (2016). The challenges of the cocoa industry: A myth or reality?
Retrieved from http://www.bftonline.com on 18th
November, 2016.
AGRIFIN. (2012). Access to agricultural finance in Ghana. A technical brief paper.
Retrieved, from http://www.agrifinfacility.org/access-agriculture-finance-ghana.
January 2016.
Agyekum, A.F. (2013). Effect of MiDA Intervention on Productivity of Maize Farmers
in the Afram Basin of Ghana. Retrieved from University of Ghana
http://ugspace.ug.edu.gh on 9th
November, 2016. pp 87-89.
Agyekum, A.P. (2015). Input Credit Scheme Effects on the Adoption of Cocoa
Production Technologies and Productivity of Smallholder Cocoa Farmers in
Ghana. Retrieved from University of Ghana http://ugspace.ug.edu.gh on 21st
February, 2018. pp 62-64.
Aryeetey, E. (2008). From Informal Finance to Formal Finance in Sub-Saharan Africa:
Lessons from linkage efforts. Paper presented at the High level Seminar on
African Finance for the 21st Century Organized by IMF Institute and the Joint
African Institute Tunis, Tunisia, March 4-5, 2008.
Ashaolu, O.F., Momoh, S., Phillip, B.B. & Tijani, I.A. (2011). Microcredit Effect of
Agricultural Productivity: A Comparative Analysis of Rural Farmers in Ogun
State, Nigeria. International Journal of Applied Agricultural and Agricultural
Research, pp 23-35, Vol 7, No 1 (2011).
Ashley, C., & Maxwell, S. (2001). Rethinking Rural Development. Development Policy
Review 19(4): 395-425.
Adebayo, O., & Olagunju, K. (2015). Working Paper No. 2015/07.
Anang, B. T., Sipiläinen, T., Bäckman, S., & Kola, J. (2015). Factors Influencing
Smallholder Farmers ‟ Access to Agricultural Microcredit in Northern Ghana.
African Journal of Agricultural Research, 10(24), 2460–2469.
http://doi.org/10.5897/AJAR2015.9536
Awotide, B. A., Abdoulaye, T., Alene, A., & Manyong, V. M. (2015). Impact of Access
to Credit on Agricultural Productivity : Evidence from Smallholder Cassava Farmers
in Nigeria. International Conference of Agricultural Economists, 1–34. Retrieved
from http://purl.umn.edu/210969
Awunyo-Vitor, D. (2012). Determinants of loan repayment default among farmers in
Ghana. Journal of Development and Agricultural Economics, 4(November), 339–

84
345. http://doi.org/10.5897/JDAE12.053
Ayamga, M., Sarpong, D. B., & Asuming-Brempong, S. (2007). Factors Influencing the
Decision to Participate in Micro-credit Programme: An Illustration for Northern
Ghana. Ghana Journal of Development Studies.
Ayegba, O., & Ikani, D. I. B. (2013). An Impact Assessment of Agricultural Credit on
Rural Farmers in Nigeria. Research Journal of Finance and Accounting, 4(18), 80–
90.
Baffoe, G., Matsuda, H., Nagao, M., & Akiyama, T. (2014). The Dynamics of Rural
Credit and its Impacts on Agricultural Productivity: An Empirical Study in Rural
Ghana. OIDA International Journal of Sustainable Development, Vol.7, No. 5, pp
19-34.
Botlhoko, G. J., & Oladele, O. I. (2013). Factors affecting farmers participation in
agricultural projects in Ngaka Modiri Molema District North West province , South
Africa. Journal of Human Ecology, 41(August 2011), 201–206.
Busschaert, H. (2014). Microfinance for Smallholder Farms ( MF4ShF ) Concept Note.
Acpeu, 19.
Caliendo, M., & Kopeinig, S. (2008). Some practical guidance for the implementation of
propensity score matching. Journal of Economic Surveys, 22(1), 31–72.
http://doi.org/10.1111/j.1467-6419.2007.00527.x
Carroll, T., Stern, A., Zook, D., Funes, R., Rastegar, A., & Lien, Y. (2012). Catalyzing
Smallholder Agricultural Finance. Report, (September), 1–43.
Agyekum, A.F. (2013). Effect of MiDA Intervention on Productivity of Maize Farmers in
the Afram Basin of Ghana. University of Ghana http://ugspace.ug.edu.gh.
Agyekum, A.P. (2015).Input Credit Scheme Effects on the Adoption of Cocoa
Production Technologies and Productivity of Smallholder Cocoa Farmers in Ghana.
University of Ghana http://ugspace.ug.edu.gh.
Danso-Abbeam, Daniel; Cobbina, Tawiah Mensah; Antwi, R. A. (2016).
AGRICULTURAL CREDIT UTILIZATION AMONG FARMERS IN BOLE
DISTRICT, 3(March), 70–80.
Davis, K., & Mekonnen, D. A. (2012). Impact of Farmer Field Schools on Agricultural
Productivity and Poverty in East Africa. World Development, 40(2), 402–413.
http://doi.org/10.1016/j.worlddev.2011.05.019
Davis, K., Nkonya, E., Kato, E., Mekonnen, D. A., Odendo, M., Miiro, R., … Okoth, J.
(2009). Impact of farmer field schools on agricultural productivity, poverty, and
farmer empowerment in East Africa, (June).
Dormon, E. N. a., Leeuwis, C., Fiadjoe, F. Y., Sakyi-Dawson, O., & van Huis, a. (2007).
Creating space for innovation: the case of cocoa production in the Suhum-Kraboa-

85
Coalter District of Ghana. International Journal of Agricultural Sustainability, 5(2–
3), 232–246. http://doi.org/10.1080/14735903.2007.9684824
Elias, A., Nohmi, M., Yasunobu, K., & Ishida, A. (2013). Effect of Agricultural
Extension Program on Smallholders‟ Farm Productivity: Evidence from Three
Peasant Associations in the Highlands of Ethiopia. Journal of Agricultural Science,
5(8), 163–182. http://doi.org/10.5539/jas.v5n8p163
Etwire, P. M., Dogbe, W., Wiredu, A. N., Martey, E., Etwire, E., Owusu, R. K., &
Wahaga1, E. (2013). Factors Influencing Farmer‟s Participation in Agricultural
Projects: The case of the Agricultural Value Chain Mentorship Project in the
Northern Region of Ghana. Journal of Economics and Sustainable Development,
4(10), 36–43.
Farid, K. S., Mozumdar, L., Kabir, M. S., & Goswami, U. K. (2009). Nature and extent
of rural women‟s participation in agricultural and non-agricultural activities.
Agricultural Science Digest, 29(4), 254–259. Retrieved from
http://search.ebscohost.com/login.aspx?direct=true&db=lah&AN=20103050185&sit
e=ehost-
live%5Cnhttp://www.cabi.org/cabdirect/showpdf.aspx?PAN=http://www.cabi.org/c
abdirect/showpdf.aspx?PAN=20103050185
Fletschner, D., Guirkinger, C., & Boucher, S. (2010). Risk, credit constraints and
financial efficiency in Peruvian agriculture. Journal of Development Studies, 46(6),
981–1002. http://doi.org/10.1080/00220380903104974
Girabi, F., & Mwakaje, A. (2013). Impact of Microfinance on Smallholder Farm
Productivity in Tanzania: The Case of Iramba District. Asian Economic and
Financial Review, 3(2), 227.
Gockowski, J., Afari-Sefa, V., Sarpong, D. B., Osei-Asare, Y. B., & Agyeman, N. F.
(2013). Improving the productivity and income of Ghanaian cocoa farmers while
maintaining environmental services: what role for certification? International
Journal of Agricultural Sustainability, 11(4), 331–346.
http://doi.org/10.1080/14735903.2013.772714
Hart, O. (2008). an Economist â€TM
S Perspective on the Theory of the Firm, 89(7),
1757–1774.
Kudi, T. M., Odugbo, S. B., Banta, A. L., & Hassan, M. B. (2009). Impact of UNDP
microfinance programme on poverty alleviation among farmers in selected local
government areas of Kaduna State , Nigeria, 1(6), 99–103.
Lechner, M. (2011). The Estimation of Causal Effects by Difference-in-Difference
Methods. Foundations and Trends in Econometrics, 4(3), 165–224.
http://doi.org/10.1561/0800000014
Mensah, S. O., & Agbekpornu, H. (2015). Determinants of Access to Credit by
Agribusiness Operators in the Kumasi Metropolis , Ghana, 6(5), 333–346.

86
http://doi.org/10.9734/AJEA/2015/12477
Miller, C. (2011). Microcredit and Crop Agriculture: New Approaches, technologies and
Other Innovations to Address Food Insecurity among the Poor, 1–33.
Mmye. (2007). Labour practices in cocoa production in Ghana, (April), 1–120.
Motsoari, C., Cloete, P. C., & van Schalkwyk, H. D. (2015). An analysis of factors
affecting access to credit in Lesotho‟s smallholder agricultural sector. Development
Southern Africa, 32(5), 592–602. http://doi.org/10.1080/0376835X.2015.1044077
Mpiira, S., Kiiza, B., Katungi, E., Staver, C., Tabuti, J. S., Kyotalimye, M., & Muwumba,
P. (2013). Factors influencing households participation in the Savings and Credit
Cooperative ( SACCO ) programmes in Uganda, 8(43), 5276–5284.
http://doi.org/10.5897/AJAR11.1673
Nxumalo, K. K. S., & Oladele, O. I. (2013). Factors Affecting Farmers‟ Participation in
Agricultural Programme in Zululand District, Kwazulu Natal Province, South
Africa. J Soc Sci, 34(1), 83–88.
Oduro, F. T., & Omane-Adjepong, M. (2012). Estimating the Impact of the Cocoa Hi-
Tech and Mass Spraying Programmes on Cocoa Production in Ghana: An
Application of Intervention Analysis. International Journal of Applied Science and
Technology, 2(8).
Oecd. (2001). Overview of productivity measures. Measuring Productivity - OECD
Manual, 2, 11–21. http://doi.org/10.1787/9789264194519-en
Osei Boadu, M. (2014). Assessment of Pesticides Residue Levels in Cocoa Beans From
the Sefwi Wiawso District of the Western Region of Ghana.
Owusu-antwi, G., & Antwi, J. (2010). The Analysis Of The Rural Credit Market In
Ghana. International Business and Economics Research Journal, 9(8), 45–56.
Owusu, V., Frimpong, F. K., & Owusu, V. (2014). No Title, 1–11.
Peprah, K. (2015). Sustainability of cocoa farmers‟ livelihoods: A case study of Asunafo
District, Ghana. Sustainable Production and Consumption, 4(April), 2–15.
http://doi.org/10.1016/j.spc.2015.09.001
Quarmine, W., Haagsma, R., Sakyi-Dawson, O., Asante, F., Van Huis, A., & Obeng-
Ofori, D. (2012). Incentives for cocoa bean production in Ghana: Does quality
matter? NJAS - Wageningen Journal of Life Sciences, 60–63, 7–14.
http://doi.org/10.1016/j.njas.2012.06.009
Wainaina, P. (2012). Impact of contract farming on smallholder poultry farmers‟ Income
in Kenya. 2012 Conference, August …, 18–24. Retrieved from
http://ageconsearch.umn.edu/bitstream/126196/2/Priscilla~2012.pdf

87
APPENDICES
APPENDIX I Probit regression Results using STATA 14
Probit regression Number of obs 257
LR chi2 (14) 256.90
Prob>chi2 0.0000
Log likelihood -35.212983 Pseudo R2 0.7848
Inpcb Coef. Std. Err z P>|z| [95% Conf. Interval]
Gen -.709609 .439925 -1.61 0.107 -1.571847 .152628
Age -.026242* .0136202 -1.93 0.054 -.0529371 .0004531
Age2 0 (omitted)
NuYrSh .0299489 .0375132 0.80 0.425 -.0435757 .1034735
HhSiz .1002701 .1009453 0.99 0.321 -.097579 .2981192
Offarinc -.9976015 .4512058 -2.21 0.027 -1.881949 -.1132543
Extcon .9354519** .3859859 2.42 0.015 .1789335 1.69197
FBO 2.821096*** .5181054 5.45 0.000 1.805628 3.836563
Farmexp .0192915 .0209501 0.92 0.357 -.0217698 .0603529
Awlend .8349454*** .2678445 3.12 0.002 .3099798 1.359911
FarSiz .669232*** .1143591 5.85 0.000 .4450923 .8933717
Loc .675133* .4009826 1.68 0.092 1.461045 .1107786
TimInp .8623215** .4355093 1.98 0.048 .0087389 1.715904
FlexPyt -.1002702 .3855338 -0.26 0.795 -.8559025 .6553621
AdqLn 1.174011*** .4100958 2.86 0.004 .3702382 1.977784
Constant -3.114432 1.160674 -2.68 0.007 -5.389311 -.839553

88
APPENDIX II Result of Covariate Balancing Before and After Matching
Variable Unmatched
Matched
Mean %|bias| %reduct
|bias|
t-test
Treated Control T p>|t|
Gender U 0.72093 0.7619 -9.3 -0.71 0.479
M 0.77778 0.72222 12.6 -35.6 0.37 0.710
Age U 48.488 47.929 4.3 0.32 0.752
M 47.111 48.056 -7.2 -68.7 -0.25 0.803
NuYrSh U 9.5 6.756 56.7 4.20
M 9.5556 10.056 -10.3 81.8 -0.32 0.748
HhSiz U 4.7558 4.1488 28. 2.18 0.030
M 4.3889 4.2222 7.7 72.5 0.31 0.757
Offarinc U 0.18605 0.18452 0.4 0.03 0.977
M 0.22222 0.22222 100 1.000
Extcon U 3.3721 0.8869 171.8 12.9 0.000
M 2.3333 2.1111 15.4 91.1 0.42 0.674
FBO U 0.94186 0.28571 181.7 12.58 0.000
M 0.83333 0.61111 61.5 66.1 1.49 0.145
Awlend U 0.98837 0.2381 240.8 16.01 0.000
M 0.94444 1 -17.8 92.6 -1.00 0.324
FarSiz U 7.0116 3 142.6 11.84 0.000
M 4.8444 5.9111 -37.9 73.4 -0.86 0.395
Loc U 0.5122 0.685 103.2 10.84 0.000
M 0.7682 1.6447 -28.1 57.6 -0.16 0.388
TimInp U 6.7951 0.644 134.2 4.20 0.847
M 0.4945 5.8257 31.6 56.1 -10.31 0.752
FlexPyt U 42.80 0.679 115.3 0.31 0.892
M 45.6 1 -11.1 40.4 2.18 1.000
AdqLn U 78.04 0.5 77.2 5.2 0.000
M 44.72 0.4427 35.1 58.4 -0.25 0.876

89
Sample Pseudo R2 LR chi
2 p>chi
2 MeanBias MedBias
Raw 0.855 278.07 0.000 83.6 42.4
Matched 0.026 10.95 0.279 17.7 11.5

90
QUESTIONNAIRE
EFFECT OF INPUT CREDIT SCHEME ON PRODUCTIVITY OF
SMALLHOLDER COCOA FARMERS IN THE AMENFI WEST AND PRESTEA-
HUNI VALLEY DISTRICTS IN THE WESTERN REGION: A CASE OF
OPPORTUNITY INTERNATIONAL
Questionnaire number
Country Country
RegionRRg Region
District
Community
Name of enumerator Name of enumerator
Date Date …….. / …….. / ……..
Time of interviewT Time of interview Start time: …… s Start time:…… End time:……..
Respondent‟s contact Respondent‟s contact number
Section (1): PERSONAL AND HOUSEHOLD CHARACTERISTICS OF RESPONDENT.
PLEASE INDICATE OR TICK WHERE APPROPRIATE.
1. Name of cocoa farmer …………………………………………………………….
2. Gender of cocoa farmer a. Male [ ] b. Female [ ]
3. Age of respondent …………………..
4. Marital status of respondent a. Married [ ] b. Single [ ] c. Divorced/Separated [ ]
d. Widowed [ ]
5. Is the respondent the head of the household? a. Yes [ ] b. No [ ]
6. Number of years spent in school……………………..
7. Household characteristics of respondent
No First
name
Gender Age Main
occupation
Other
activities

91
Section (2): FACTORS INFLUENCING PARTICIPATION IN INPUT CREDIT
SCHEME
8. How many years have you been cultivating cocoa? …………………..
9. Do you belong to a cocoa farmer based organization? a. Yes [ ] b. No [ ]
10. If Yes, how many years have you been a member? Please specify ……………………
11. Do you have available funds for production? a. Yes [ ] b. No [ ]
12. Are you aware of Opportunity International‟s input credit scheme in your
community?
a. Yes [ ] b. No [ ]
13. How long have you been part of the input credit scheme? ………..years
14. How did you get to know of the scheme?
a. FBO member [ ] b. Staff of OI [ ] c. Extension agent [ ] d. Advertisement [ ]
e. Other, specify………..
15. Is the credit from Opportunity International enough to support your production? a.
Yes [ ] b. No [ ]
16. How many contacts have you made with extension officers?..................................
17. What are your sources of income?
Source Amount obtained (GH₵)
1.
2.
3.
18. Parcel of cocoa lands
Farm
size (ha)
Age of
farm
Variety of
cocoa
Inputs
used per
land
Type of
input used
19. When do you place in your request for input supply?........................
20. How long does it take to receive the inputs from Opportunity
International?.................................

92
21. Where are the inputs delivered to you?................................
Section (3): EFFECT OF OPPORTUNITY INTERNATIONAL’S INPUT CREDIT
SCHEME ON PRODUCTIVITY
22. OUTPUT OF FARMER
2015 2016
Quantity of dry seeds from farm (kg)
Quantity bought by L Quantity bought by LBC (kg)
Output price (per kg)O Output price (per kg)
23. How did you become a beneficiary of the input credit scheme? Please select your
option(s)
Criteria for selection Response
Account holder of the financial institution
Smallholder farmer cultivating at least 2 acres of
land
Relationship with extension officers
Member of FBO
Other, specify
24. Were you oriented on how the scheme operates before joining? a. Yes [ ] b. No [ ]
25. Were you satisfied with the terms and conditions of the scheme before joining?
a. Yes[ ] b. No [ ]
25. If No, please state your reasons……………………
26. Have you benefited from the scheme since you joined? a. Yes [ ] b. No [ ]
27. If Yes, please indicate how you have benefitted
Benefit Response
Timeliness of input supply
Increase in yield
Access to extension agent
Access to pre-application training
Availability of recommended inputs
Others, specify
28. Do you still have interest in participating in the input credit scheme in subsequent
crop seasons? a. Yes [ ] b. No [ ]

93
29. If No, please state your reasons (if any)…………………………..
30. Have you received credit for on-farm activities from any financial institution during
the last season? a. Yes [ ] b. No [ ]
31. If Yes, which institution provided you with the credit? ……………………………
32. What form did the credit take? a. Cash credit [ ] b. Input credit
Section 4: CONSTRAINTS FACED BY COCOA FARMERS
33. Are you faced with any problems in the cultivation of cocoa in your community? a.
Yes [ ] b. No [ ]
34. If Yes, please indicate the degree of problems faced by ticking
Constraints Response
Disagree (1) Neutral (2) Agree (3)
Credit constraints:
Loan amount too small
Longer time taken in processing loan
request
Delays in distributing farm inputs
Tenure of repayment too short
Interest rate on loan too high
High cost of loan application
Production constraints:
Unfavourable weather condition
Lack of access to extension agent
Poor road network
Poor producer price
High cost of inputs
High cost of labour
Others, specify
35. Do you report the challenges (if any) to staff of OI? a. Yes [ ] b. No [ ] c. Not
Applicable [ ]
36. If No, please state reason why …………………
37. Does staff of OI address your challenges before the next season? a. Yes [ ] b.
No [ ]
38. Have you reported these problems to extension officers of COCOBOD? a. Yes [ ] b.
No [ ]
39. Have these problems been addressed before the current season? a. Yes [ ] b. No [ ]
94
Non-beneficiaries of input credit
40. Are you able to afford the cost of obtaining inputs during the crop season? a. Yes [ ]
b. No [ ]
41. If No, how are you able to manage the problem………………
42. If Yes, what is your source of funds? a. Personal [ ] b. Credit [ ]
43. What do you use the credit for?..………………………
44. Are you able to pay back the credit by the end of the repayment period? a. Yes [ ] b.
No [ ]

95