effect of micro and macro economic factors on the
TRANSCRIPT

Published by the Society for Alliance, Fidelity and Advancement (SAFA) 47
Research
Paper
Accepted 17 February, 2019
SAFA1= 0.63
International Journal of Business and Management Science
Chief Editor: Mohammad Safa
www.safaworld.org/ijbms23
Submission: [email protected]
Effect of Micro and Macro Economic Factors on the Financial Health of General Insurance Companies
in Indonesia
aToto Sugiharto,
bNovita Sulistiowati,
cRina Nofiyanti
ac
Faculty of Economics, Gunadarma University, Indonesia bFaculty of Information and Communication Technology, Gunadarma University,
Indonesia
*Corresponding author: [email protected]
Abstract: The objective of the study is to analyze the effect of macro and micro
economic factors on the financial health of general insurance companies in
Indonesia. Macroeconomic factors include economic growth rate, inflation rate, and
interest rate; microeconomic factors include company size, investment
performance, loss ratio, and current ratio. Financial health is represented by risk-
based capital. Automatic linear modeling was performed to test the proposed
hypotheses. It is revealed that the financial health of general insurance companies is
significantly influenced by, respectively, current ratio, reference interest rate,
inflation rate, and company size in different directions and magnitudes.
Keywords: General Insurance Companies; Risk Based Capital; Economic Growth;
Inflation Rate; Interest Rate; Company Size; Investment Performance; Current
Ratio
1SAFA stands for Standardized Acceptance Factor Average which is calculated based on the review scores. If the
obtained SAFA lies between 0.5 and 1 tends to be accepted for publication with the recommended level of
revision, if other requirements are satisfied. 2 Copyright @ 2025, Mohammad Safa: Unless otherwise noted, copyrights for the texts which comprise all issues
of the International Journal of Business and Management Science (IJBMS) are held by the copyright owner.
Items published by IJBMS may be freely shared among individuals, but they may NOT be republished in any medium without written consent from the copyright owner. In order to discuss any relevant issues or acquire
permission for reprint or reuse of data, please contact the editors at [email protected]. 3 Disclaimer: Facts and opinions published in the International Journal of Business and Management Science (IJBMS) express solely the opinions of the respective author(s). Author(s) are responsible for citing sources and
the accuracy of their references. The editors cannot be held responsible for any lacks or possible violations of
third parties’ rights. If any misconduct found in any published items, the relevant party may contact the editors for suggestions.

Effects of Macro and Micro Economic Factors on Insurance companies ISSN 1985-692X
48 International Journal of Business and Management Science, 9(1): 47-65, 2019
INTRODUCTION
In the economic system, financial institutions function as economic support
through the provision of facilities that encourage capital outflows and capital
inflows or capital turnover. As one of the sectors in the financial industry,
insurance companies serve a special role in supporting monetary and investment
activities by providing long-term funds, while increasing risk-taking capabilities.
Additionally, the insurance sector is an integral part of a country's financial
industry whose role cannot be underestimated. Accordingly, if the performance of
this important sector is not encouraging and does not experience substantial
growth, it will influence the economic system in a very unfavorable way.
Insurance companies play an important role for both businesses and individuals
where they compensate for any losses and place them in the same position as
before the loss occurred. The level of the financial health of an insurance company
determines its position within the market, which, in turn, increases market growth.
The diversity in numbers and size of insurance companies, which are closely
related with both internal (microeconomic) factors and external (macroeconomic)
factors, provide an important contribution in determining the financial health as
well as financial performance of insurance companies.
Ghimire (2104) defines insurance as a means of financial protection from
events that result in loss of property (wealth or assets), loss of family head as the
backbone of family breadwinners, and loss of income due to accident, prolonged
illness, and disability permanent. Meanwhile, from a legal point of view,
according to Article 246 of the Commercial Code, insurance or coverage is
defined as an agreement where the insurers bind themselves to the insured by
obtaining a premium, to give him compensation due to a loss, damage, or not
expected benefit, which may be suffered due to an uncertain event. In addition, the
Financial Services Authority of Indonesia (OJK) defines insurance as the
agreement between the insurer and the insured requires the insured to pay a
premium to provide compensation for the risk of loss, damage, death, or loss of
expected profits, which may occur for unexpected events.
In the last decade, insurance companies in Indonesia experienced substantial
growth, particularly in total assets, premium growth rates and the ratio between the
rates of growth of premiums and gross domestic product. Data on these three
attributes over the past five years is presented in Table 1 below.
Table 1: Premium growth rate, premium growth rate to gross domestic product ratio and assets of
insurance companies 2012-2016
Attribute Year
2012 2013 2014 2015 2016
PGR1 (%) 14.90 9.80 28.10 19.50 15.36
PGR/GDP2 (%) 2.13 2.13 2.35 2.56 2.00
Asset (trilion IDR3) 584.02 659.73 807.68 853.42 984.53
Source: Financial Service Authority of Indonesia (Insurance Statistics 2016)
Note: 1Premium Growth Rate (Laju Pertumbuhan Premi); 2Gross Domestic Product (Produk
Domestik Bruto), 3Indonesian Rupiah

Effects of Macro and Micro Economic Factors on Insurance companies ISSN 1985-692X
International Journal of Business and Management Science, 9(1): 47-65, 2019 49
In has been predicted by Rahim (2013) that the insurance industry in Indonesia
in the next five years has the potential to grow quite rapidly. However, there are
three important agendas that must be accomplished to realize these optimistic
projections. Firstly, internal consolidation that includes the consistent
implementation of the principle of risk-based capital (RBC), the implementation of
risk-based pricing (RBP) and the implementation of the principles of good
corporate governance (GCG) in a comprehensive manner. Secondly, the increase
and expansion of business activities through the application of the transfer of risk
concept that is to bear the risk of economic actors in other sectors through
professional asset management practices. Thirdly, improving human resources
(HR) quality, service quality, and the efficiency of corporate management through,
among others, the application of information and communication technology
(ICT) including information systems (Rahim, 2013).
Based on the above-mentioned background to the recent study, this research—
which aims to analyze the influence of macroeconomic and microeconomic
(company specific) factors on the financial health of Indonesian general insurance
companies—is of importance and, therefore, needs to be accomplished. Results of
the study are expected to provide managers or practitioners of insurance industry,
particularly general insurance companies, with information regarding
macroeconomic and microeconomic factors that potentially affect the financial
health of general insurance companies.
The paper is organized as follows. The second section describes the literature
review which consists of the financial health of insurance companies, the
determining factors of the financial health of insurance companies, the
macroeconomic determinants of the financial health of insurance company and research hypotheses. The third section explains the methods of the study which
covers research model and variables, methods of analysis and sampling
procedures. The fourth section consists of results and discussions which include
the descriptive statistical analysis of research variables, the results of the automatic
data preparation and the inferential statistical analysis of research variables.
Finally, we present our conclusions.
LITERATURE REVIEW
Financial Health of Insurance Companies
Similar with other types of business organizations, insurance companies are
established and operate their business activities with the aim of maximizing the
wealth of their shareholders by, among others, maximizing the company's market
value (Necas, 2016). In addition, Dahnel et al. (2005) in Necas (2016) explained
that the relationship between shareholders, insurance companies, and
policyholders (clients) can be illustrated as follows. Shareholders provide
capital—along with its related risks—for insurance companies with the hope of
obtaining revenue along with other requirements, namely the increase in market
value of the funds invested. On the other hand, policyholders (clients) divert risk
to insurance companies with the hope that in the future all obligations contained in
insurance policies are met by the insurance companies. In return, insurance

Effects of Macro and Micro Economic Factors on Insurance companies ISSN 1985-692X
50 International Journal of Business and Management Science, 9(1): 47-65, 2019
companies demand premiums in accordance with the risks faced by clients taken
over by insurance companies.
Shareholders demand high returns - in this case return on assets (ROA) with
low risk. Policy holders (clients) want the maximum guarantee that the insurance
company in the future fulfills all its obligations in accordance with the insurance
policy (insurance policy) agreed upon by both parties. The extent to which the
insurance company is able to fulfill all of its obligations depends very much on
what is referred to as capital endowment or capital support or capital availability.
Meanwhile, the higher the level of capital support — the greater the capital
support that needs to be provided - it will be increasingly difficult for shareholders
to obtain the required or desired income. In uniting or harmonizing the desires of
both parties namely shareholders - who demand high returns (ROA) - and
policyholders (clients), who demand definitive and comprehensive guarantees,
insurance companies can use financial stability as an intermediary or the bridging
aspect between shareholders and policyholders. Chen and Wong (2004) use the
term financial stability and financial health insurance companies alternately or
interchangeably, meaning that they have the same meaning. Financial stability or
financial health of an insurance company acts as a prerequisite for insurance
companies in fulfilling the wishes of shareholders and policyholders (Necas,
2016). This is in line with Vaughan and Vaughan (2008) who states that the
financial stability or financial health of insurance companies is a very important
factor that must be considered in choosing an insurance company.
Chen and Wong (2004) and Necas (2016) in their study found that financial
stability and financial health are closely related to the solvency or solvency of
insurance or reinsurance companies to guarantee fulfillment of obligations
permanently following insurance or reinsurance activities from their own
resources , liquidity — the ability to fulfill its financial obligations at the right
time, without affecting normal operations, and profitability — the ability of
insurance companies to make profits. In Indonesia, based on the Financial Services
Authority (2016), compulsory insurance companies at all times meet financial
health level requirements where the level of financial health company includes: (a)
solvency level; (b) technical reserves; (c) sufficient investment; (d) equity; (e)
guarantee funds; and (f) other provisions relating to financial health.
Determining Factors of the Financial Health of Insurance Companies
Chen and Wong (2004) state that the financial health of insurance company
which is represented by insolvency of the company are influenced by a number of
factors. In general, these factors are classified into two major groups, i.e. micro-
determinants or micro-economic indicators or company-specific determinants and
macro determinants or macro-economic indicators (Chen and Wong, 2004;
Caporale et al., 2017). Micro-economic indicators that have the potential to affect
the health level of insurance companies, both life insurance and general insurance,
are presented in Table 2.
Effects of Macro and Micro Economic Factors on Insurance companies ISSN 1985-692X
International Journal of Business and Management Science, 9(1): 47-65, 2019 51
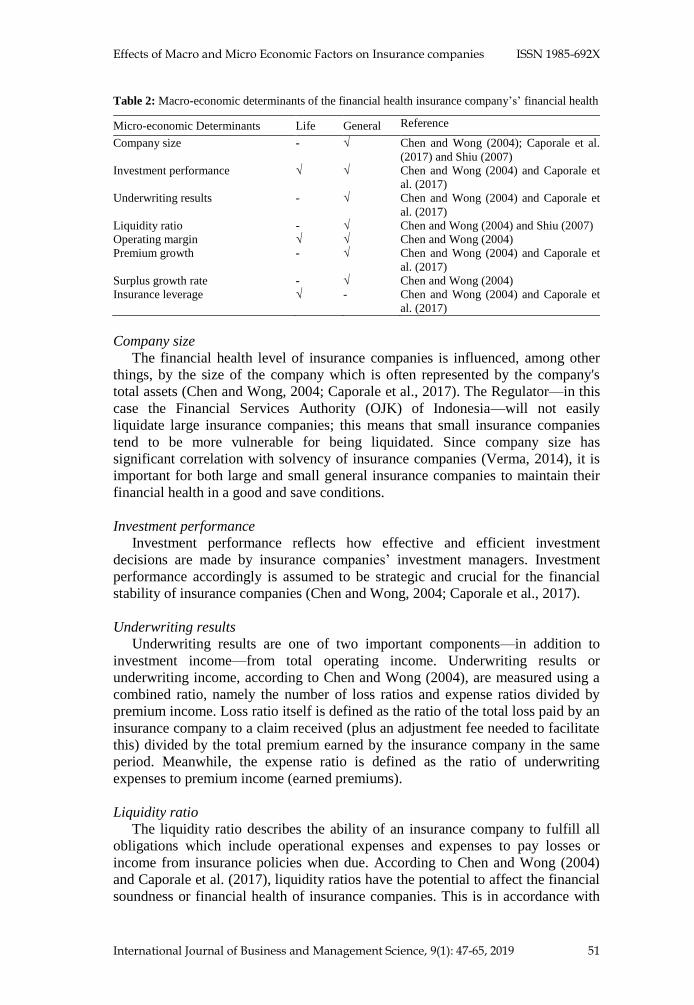
Table 2: Macro-economic determinants of the financial health insurance company’s’ financial health
Micro-economic Determinants Life General Reference
Company size - √ Chen and Wong (2004); Caporale et al.
(2017) and Shiu (2007)
Investment performance √ √ Chen and Wong (2004) and Caporale et
al. (2017)
Underwriting results - √ Chen and Wong (2004) and Caporale et
al. (2017)
Liquidity ratio - √ Chen and Wong (2004) and Shiu (2007)
Operating margin √ √ Chen and Wong (2004)
Premium growth - √ Chen and Wong (2004) and Caporale et
al. (2017)
Surplus growth rate - √ Chen and Wong (2004)
Insurance leverage √ - Chen and Wong (2004) and Caporale et
al. (2017)
Company size
The financial health level of insurance companies is influenced, among other
things, by the size of the company which is often represented by the company's
total assets (Chen and Wong, 2004; Caporale et al., 2017). The Regulator—in this
case the Financial Services Authority (OJK) of Indonesia—will not easily
liquidate large insurance companies; this means that small insurance companies
tend to be more vulnerable for being liquidated. Since company size has
significant correlation with solvency of insurance companies (Verma, 2014), it is
important for both large and small general insurance companies to maintain their
financial health in a good and save conditions.
Investment performance
Investment performance reflects how effective and efficient investment
decisions are made by insurance companies’ investment managers. Investment
performance accordingly is assumed to be strategic and crucial for the financial
stability of insurance companies (Chen and Wong, 2004; Caporale et al., 2017).
Underwriting results
Underwriting results are one of two important components—in addition to
investment income—from total operating income. Underwriting results or
underwriting income, according to Chen and Wong (2004), are measured using a
combined ratio, namely the number of loss ratios and expense ratios divided by
premium income. Loss ratio itself is defined as the ratio of the total loss paid by an
insurance company to a claim received (plus an adjustment fee needed to facilitate
this) divided by the total premium earned by the insurance company in the same
period. Meanwhile, the expense ratio is defined as the ratio of underwriting
expenses to premium income (earned premiums).
Liquidity ratio
The liquidity ratio describes the ability of an insurance company to fulfill all
obligations which include operational expenses and expenses to pay losses or
income from insurance policies when due. According to Chen and Wong (2004)
and Caporale et al. (2017), liquidity ratios have the potential to affect the financial
soundness or financial health of insurance companies. This is in accordance with

Effects of Macro and Micro Economic Factors on Insurance companies ISSN 1985-692X
52 International Journal of Business and Management Science, 9(1): 47-65, 2019
Verma’s (2014) research results which indicate that liquidity ratio significantly
affect the solvency of insurance companies, in particular life insurance companies.
Operating margin
Intuitively, insurance companies that are considered profitable (profitable)
means they obtain more revenues than their expenses (expenses). Operating
margin, thus, is a measure of the proportion of the income of the insurance
company remaining after deduction to pay for all variable costs such as salary,
Premium growth
Premium growth reflects the level of market penetration of insurance
companies. The results of research conducted by Kim et al. (1995) indicate that
high premium growth is one of the numbers of factors that led to a decrease in the
level of financial health of insurance companies which in this study were
represented by insolvency. This indicates that the rate of premium growth that is
too fast and high will result in the phenomenon of self-destruction, especially if
other objectives of the insurance company are ignored (Chen and Wong, 2004).
Surplus growth rate
The surplus growth is closely related to operational margins (Chen and Wong,
2004). Therefore, it can be interpreted that insurance companies that fall into the
category of profitable will have a high surplus growth rate. However, it should be
considered that surplus growth is too fast and too substantial because the
phenomenon indicates that insurance companies will have a high level of
operational risk. This situation—too high an operational risk—will have an impact
on the financial soundness of insurance companies (Lee and Urrutia, 1996).
Insurance leverage
Insurance leverage is defined as a reserve for surplus (Chen and Wong, 2004).
Insurance companies that have a level of insurance leverage or financial leverage
will have a high risk that, among other things, is reflected in their low level of
financial health (Carson and Hoyt, 1995). Furthermore Carson and Hoyt (1995)
explained that the level of financial health of insurance companies can be
predicted from the amount of insurance leverage or financial leverage.
Macroeconomic Determinants of the Financial Health of Insurance Company
According to Browne and Hoyt (1999), there are three reasons for the
importance of understanding macroeconomic conditions for managers of insurance
companies. First, the health level of insurance companies is closely related to
macroeconomic conditions that are influenced by government policies - in this
case the Financial Services Authority (OJK). Second, the effectiveness of the
policies taken by the government (OJK) which have the potential to influence the
level of financial health of insurance companies is closely related to
macroeconomic conditions. Third, the resources needed to carry out supervision
and or control over the level of financial health of insurance companies depend
heavily on the macroeconomic conditions in which the insurance company
operates.
Effects of Macro and Micro Economic Factors on Insurance companies ISSN 1985-692X
International Journal of Business and Management Science, 9(1): 47-65, 2019 53
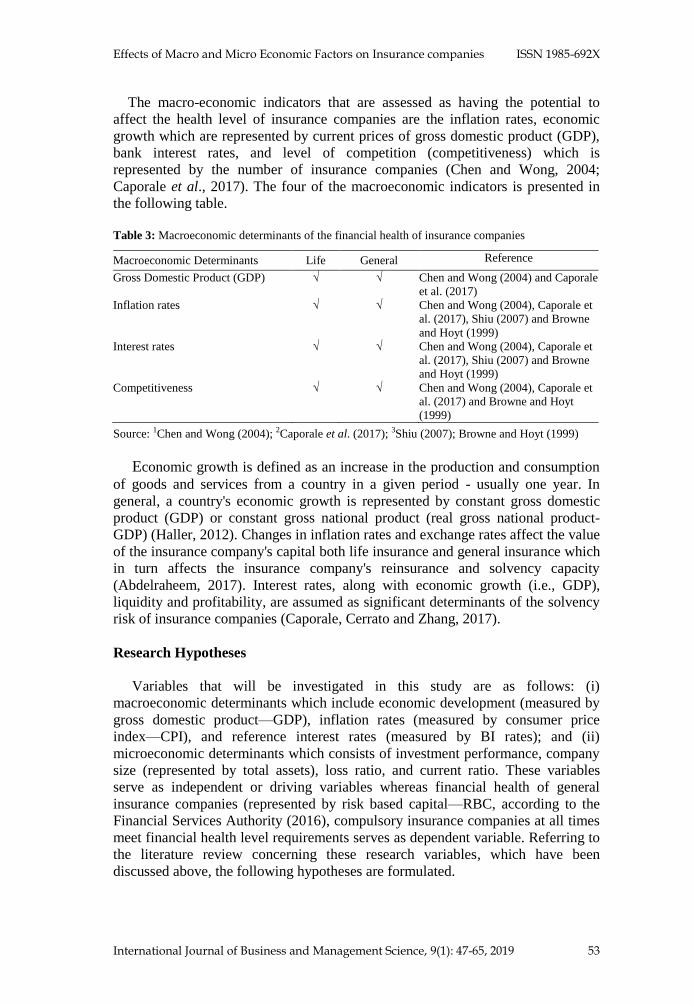
The macro-economic indicators that are assessed as having the potential to
affect the health level of insurance companies are the inflation rates, economic
growth which are represented by current prices of gross domestic product (GDP),
bank interest rates, and level of competition (competitiveness) which is
represented by the number of insurance companies (Chen and Wong, 2004;
Caporale et al., 2017). The four of the macroeconomic indicators is presented in
the following table.
Table 3: Macroeconomic determinants of the financial health of insurance companies
Macroeconomic Determinants Life General Reference
Gross Domestic Product (GDP) √ √ Chen and Wong (2004) and Caporale
et al. (2017)
Inflation rates √ √ Chen and Wong (2004), Caporale et
al. (2017), Shiu (2007) and Browne
and Hoyt (1999)
Interest rates √ √ Chen and Wong (2004), Caporale et
al. (2017), Shiu (2007) and Browne
and Hoyt (1999)
Competitiveness √ √ Chen and Wong (2004), Caporale et
al. (2017) and Browne and Hoyt
(1999)
Source: 1Chen and Wong (2004); 2Caporale et al. (2017); 3Shiu (2007); Browne and Hoyt (1999)
Economic growth is defined as an increase in the production and consumption
of goods and services from a country in a given period - usually one year. In
general, a country's economic growth is represented by constant gross domestic
product (GDP) or constant gross national product (real gross national product-
GDP) (Haller, 2012). Changes in inflation rates and exchange rates affect the value
of the insurance company's capital both life insurance and general insurance which
in turn affects the insurance company's reinsurance and solvency capacity
(Abdelraheem, 2017). Interest rates, along with economic growth (i.e., GDP),
liquidity and profitability, are assumed as significant determinants of the solvency
risk of insurance companies (Caporale, Cerrato and Zhang, 2017).
Research Hypotheses
Variables that will be investigated in this study are as follows: (i)
macroeconomic determinants which include economic development (measured by
gross domestic product—GDP), inflation rates (measured by consumer price
index—CPI), and reference interest rates (measured by BI rates); and (ii)
microeconomic determinants which consists of investment performance, company
size (represented by total assets), loss ratio, and current ratio. These variables
serve as independent or driving variables whereas financial health of general
insurance companies (represented by risk based capital—RBC, according to the
Financial Services Authority (2016), compulsory insurance companies at all times
meet financial health level requirements serves as dependent variable. Referring to
the literature review concerning these research variables, which have been
discussed above, the following hypotheses are formulated.
Effects of Macro and Micro Economic Factors on Insurance companies ISSN 1985-692X
54 International Journal of Business and Management Science, 9(1): 47-65, 2019
H1: Economic growth is assumed to have a positive correlation with financial
health of general insurance companies. General insurance companies operated
within an economic systems with high economic growth will have healthier
financial conditions (i.e., higher risk based capital—RBC).
H2: Inflation is assumed to have a negative correlation with financial health of
general insurance companies. General insurance companies operated within
an economic systems with high rates of inflation will have lower level of
financial health conditions (i.e., lower risk based capital—RBC).
H3: Reference interest rate is assumed to have a negative correlation with
financial health of general insurance companies. General insurance operated
within an economic systems with high rates of reference interest will have
lower financial health level (i.e., lower risk based capital—RBC).
H4: Investment performance is assumed to have a positive correlation with
financial health of general insurance companies. General insurance
companies with higher investment performance will have healthier financial
conditions (i.e., higher risk based capital—RBC).
H5: Company is assumed to have a positive correlation with financial health of
general insurance companies. A bigger general insurance companies will
have healthier financial conditions (i.e., higher risk based capital—RBC).
H6: Loss ratio is assumed to have a negative correlation with financial health of
general insurance companies. General insurance companies with higher loss
ratio will have less healthy financial conditions (i.e., lower risk based
capital—RBC).
H7: Current ratio is assumed to have a positive correlation with financial health
of general insurance companies. General insurance companies with higher
current ratio will have healthier financial conditions (i.e., higher risk based
capital—RBC).
METHODOLOGY
Research Model and Variables
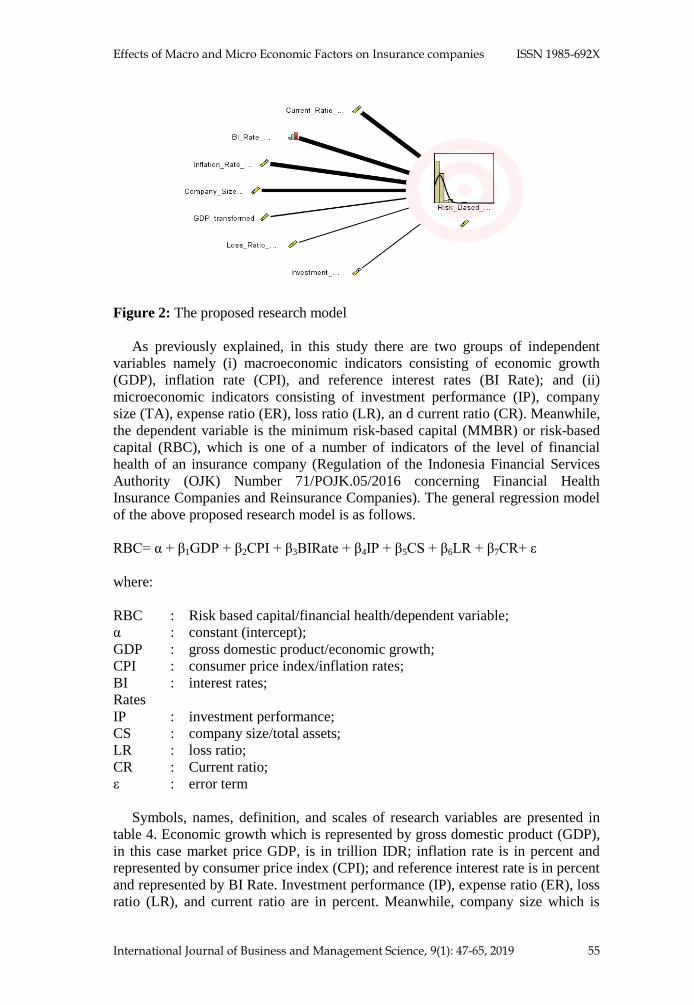
Research model that illustrates the pattern of causal relationships amongst
variables, in this case between independent variables (i.e., economic development
(GDP), inflation rates (CPI), reference interest rates (BI rates), investment
performance, company size, loss ratio, and current ratio) and dependent variable
(i.e., financial health of general insurance companies measured by RBC) is
presented in figure 2 which follows.
Effects of Macro and Micro Economic Factors on Insurance companies ISSN 1985-692X
International Journal of Business and Management Science, 9(1): 47-65, 2019 55
Figure 2: The proposed research model
As previously explained, in this study there are two groups of independent
variables namely (i) macroeconomic indicators consisting of economic growth
(GDP), inflation rate (CPI), and reference interest rates (BI Rate); and (ii)
microeconomic indicators consisting of investment performance (IP), company
size (TA), expense ratio (ER), loss ratio (LR), an d current ratio (CR). Meanwhile,
the dependent variable is the minimum risk-based capital (MMBR) or risk-based
capital (RBC), which is one of a number of indicators of the level of financial
health of an insurance company (Regulation of the Indonesia Financial Services
Authority (OJK) Number 71/POJK.05/2016 concerning Financial Health
Insurance Companies and Reinsurance Companies). The general regression model
of the above proposed research model is as follows.
RBC= α + β1GDP + β2CPI + β3BIRate + β4IP + β5CS + β6LR + β7CR+ ε
where:
RBC : Risk based capital/financial health/dependent variable;
α : constant (intercept);
GDP : gross domestic product/economic growth;
CPI : consumer price index/inflation rates;
BI
Rates
: interest rates;
IP : investment performance;
CS : company size/total assets;
LR : loss ratio;
CR : Current ratio;
ε : error term
Symbols, names, definition, and scales of research variables are presented in
table 4. Economic growth which is represented by gross domestic product (GDP),
in this case market price GDP, is in trillion IDR; inflation rate is in percent and
represented by consumer price index (CPI); and reference interest rate is in percent
and represented by BI Rate. Investment performance (IP), expense ratio (ER), loss
ratio (LR), and current ratio are in percent. Meanwhile, company size which is

Effects of Macro and Micro Economic Factors on Insurance companies ISSN 1985-692X
56 International Journal of Business and Management Science, 9(1): 47-65, 2019
represented by total asset (TA) is in billion IDR. The level of financial health is
represented by risk based capital (RBC) and it is in percent.
Table 4: Symbols, names, definition, and scales of research variables
No. Research Variables
Definition Unit/Scale Symbol Name
Independent variables
1 GDP Economic growth The amount of added value generated
by all business units in a country or
the total value of final goods and
services produced by all economic
units of a country is estimated by
gross domestic product (GDP).
Trillion IDR
2 IR Inflation rates The trend of rising prices of goods and
services continues continuously. Percent
3 BI-Rate Reference interest rates The interest rate reflects the monetary
policy adopted by Bank Indonesia and
announced to the public.
Percent
4 IP Investment
performance
Investment performance illustrates the
effectiveness and efficiency of
investment decisions made estimated
by the ratio of net investment income
to total income.
Percent
5 CS Company size (Total
Assets)
The size of the insurance company
represented by the company's total
assets.
Trillion IDR
6
LR Loss ratio Ratios that describe losses
experienced by insurance companies
as a proportion of premium income
earned during the year.
Percent
7 CR Current Ratio Ratios which reflect the ability of an
insurance company to pay off all its
short-term debt.
Percent
Dependent Variable
8 RBC Risk-based capital. The amount of capital needed for
which the determination is based on
the risks faced.
Percent
Methods of Analysis
Automatic linear modeling (ALM – a procedure of linear regression analysis in
SPSS) is performed to test the proposed hypotheses. In addition, partial classical
assumption tests or model diagnosis (i.e., multicollinearity and autocorrelation) are
performed to analyze data. Different from traditional or conventional regression
analysis (i.e., multiple linear regression analysis), automatic linear modeling
accelerates the data analysis process through a number of automatic mechanisms.
Two of which are automatic variable selection and automatic data preparation
(Yang, 2014).
Automatic variable selection
A data set with a large number of independent variables where each of them
has the potential to serve as determinant of the dependent variable is very often
collected by researcher. Accordingly, deciding which variables will be included in

Effects of Macro and Micro Economic Factors on Insurance companies ISSN 1985-692X
International Journal of Business and Management Science, 9(1): 47-65, 2019 57
multiple linear regression models is very difficult. This is believed to be the most
difficult part in multiple linear regression modeling. In general, researchers want
to choose at least one of the many variables that have the potential to be predictors
that provide accurate predictions with reasonable measurement costs. The
approach that is often used for this purpose is the method of variable selection,
which is one of the methods that is available and commonly used in the data
mining field. With the relevant determinants identified using the method of
selecting these variables, estimates and predictions will be more appropriate. Of
the many methods of selecting variables, the stepwise method and the all-
possibility-subset methods or the best-subset are still the most commonly used
methods. Automatic linear modeling has both all-possible-subsets and phases
ability (i.e., step forward) where both approaches are guided by some optimality
statistics. In this study, the best-subset method of variable selection is performed
where the objective of the linear modeling is to create or build a standard model.
Automatic data preparation
Before a linear modeling is accomplished, in this case a multiple linear
regression, the data to be used must be cleaned and, in turn, ready for use.
Common problems related to data include (i) missing data must that must be
replaced, (ii) data in the form of date/month/hour must be changed to duration
data, (iii) predetermined category predictors, and (iv) identify and handle outliers
correctly. In relation to the above-mentioned issues, automatic linear modeling
provides an automatic data preparation (ADP) platform with which many of data
cleaning procedures can be accomplished.
The automatic data preparation used in this study include the followings (i)
data and time handling, (ii) adjustment of measurement level, (iii) missing and
outlier values handling, and (iv) supervised merging.
Model Diagnostic Test
Results of model diagnostic which include autocorrelation test and
multicollinearity test are summarized in table 7 below.
Table 7: Summary of model diagnostic of research variables
Diagnostic test Method Results Conclusions
Autocorrelation Durbin-Watson 1.572 No autocorrelations
Multicollinearity Variance Inflation Factors (VIF) 1.047-1.468 No multicollinearity
Based on the results of model diagnostic tests, it is clear that the resulting
model is acceptable. Accordingly, the model can be regarded as the best linear
unbiased estimator of risk based capital (financial health) of general insurance in
Indonesia.
Sampling Procedures
Sixty seven general insurance companies in Indonesia (approximately 84
percent of the population) were involved in this study. These companies were
derived from 81 general insurance companies in 2011, 81 in 2012, 80 in 2013, 79

Effects of Macro and Micro Economic Factors on Insurance companies ISSN 1985-692X
58 International Journal of Business and Management Science, 9(1): 47-65, 2019
in 2014, 75 in 2015, 75 and 75 in 2016. General insurance companies that will be
selected and involved in this study as sample should satisfy the following
conditions:
(i) exists in the whole research period (i.e., 2011-2016);
(ii) provides financial reports (i.e., balance sheets and income statements); and
(iii) provides all research variables (i.e., risk based capital, current ratio, loss ratio,
expense ratio, and investment performance).
The selected general insurance companies, which fulfilled all research
conditions, are presented in table 5 which follows.
Table 5: Sampling procedures
Conditions No of companies
Exists in the whole research period (i.e., 2011-2016); 75
Provides financial reports (i.e., balance sheets and income statements 72
Provides all research variables (i.e., risk based capital, current ratio, loss
ratio, expense ratio, and investment performance). 67
The selected general insurance companies 67
As clearly depicted in table 5 above, from 81 general insurance companies in
2011 and 75 general insurance companies in 2016, only 75 general insurance
companies that exist during the whole five years period (i.e., 2011-2016) where 72
of which that satisfy the second research conditions (i.e., provide a complete
financial reports for the whole research period of 2011-2016) and only 67 general
insurance companies which satisfy all research conditions. Accordingly, we have
only 67 general insurance companies that can be selected and involved as samples
in this study.
Panel data set comprising research variables was used in this study. Financial
reports which include balance sheets and income statements of the general
insurance companies covering the period 2011-2016 serve as the primary sources
of data. Therefore, the sample size of this study is 402 (i.e., 67 general insurance
companies x 6 periods). These were obtained from the Financial Services
Authority of Indonesia (OJK). Other data (i.e., regional economic development
and consumer price index) was obtained from Statistics Indonesia.
RESULTS AND DISCUSSION
Descriptive Statistical Analysis of Research Variables
In Table 6, which follows, results of descriptive analysis of dependent and
independent research variables are described. As clearly shown in the table,
general insurance companies’ financial health, which is in this study represented
by risk-based capital (RBC), substantially varied. It ranges from as low as 55
percent to as high as 3,866.24 percent and averages at 343.81 percent. Its
substantial variability is indicated by the value of coefficient of variation (CV)
which is more than 100 percent (i.e., 103.12 percent).

Effects of Macro and Micro Economic Factors on Insurance companies ISSN 1985-692X
International Journal of Business and Management Science, 9(1): 47-65, 2019 59
Table 6: Descriptive statistics of research variables
Variables Descriptive Statistics
Minimum Maximum Mean Stdev* CV**
Risk based capital (percent) 55.00 3,866.24 343.81 354.53 103.12
GDP (trillion IDR) 7,831.73 12,406.81 9,928.56 1,683.70 16.96
Inflation rates (percent) 3.02 8.36 4.52 1.78 39.38
BI-rate (percent) 4.75 7.50 6.37 0.96 15.07
Investment performance
(percent)
0.01 42.59 6.62 4.10 61.93
Company size (billion IDR) 52.88 12,016.87 1,441,51 2,249.06 156.22
Loss ratio (percent) 0.01 12,078.12 230.80 613.20 265.68
Current ratio (percent) (267.10) 412.85 28.91 43.06 148.95
Note: * Standard deviation; ** Coefficients of Variation
Variability in macroeconomic indicators or determinant such as economic
growth (i.e., GDP), inflation rate (i.e., consumer price index), and reference
interest rate (i.e., BI Rate) is relatively low. Their coefficients of variances are,
consecutively, 16.96, 39.38, and 15.07 percent which indicates that the economic
conditions of the nation during the research time span relatively stable.
Significant divergences, meanwhile, are also found in microeconomic
indicators or company specific factors which include company size (ranges from
52.88 to 12,016.87 billion IDR), expense ratio (ranges from -26.77 to 515.77
percent), loss ratio (ranges from 0.01 to 12,078.12 percent), and current ratio
(ranges from -267.10 to 412.85 percent). Substantial variations amongst general
insurance companies’ specific factors also indicated by their related coefficient of
variations which are higher than 100 percent (i.e., their standard deviations are
higher than their mean). These substantial variations indicate that management
quality amongst general insurance companies is varied.
Results of the Automatic Data Preparation
Table 8 provides results of the automatic data preparation facilities available in
the Automatic Linear Modeling.
Table 8: Results of the automatic data preparation within the Automatic Linear
Modeling
Variables Role Action Taken
BI rates Predictor Change measurement level from continuous to ordinal
Merge categories to maximize association with target
Company size Predictor Trims Outliers
Current ratio Predictor Trims Outliers
GDP Predictor Trims Outliers
Inflation rate Predictor Trims Outliers
Investment performance Predictor Trims Outliers
Loss ratio Predictor Trims Outliers
Outliers were identified by procedures where continuous predictor values that
were outside the cutoff value (i.e., three standard deviations from the mean) were

Effects of Macro and Micro Economic Factors on Insurance companies ISSN 1985-692X
60 International Journal of Business and Management Science, 9(1): 47-65, 2019
treated as outliers. As indicated in the table, except BI rate which was converted its
measurement from continuous to ordinal and merge the categories to maximize
association with target (i.e., dependent variable RBC) outliers within all
independent variable were trimmed. In addition, the automatic linear model also
provides diagnostic statistics, i.e., Cook’s Distance, which measures the effect of
each of the identified outliers on the suitable models. There were 23 outliers data
which were identified to have important contribution to the fitted model when they
were taken out from the model. However, only one of 23 data that have Cook’s
Distance greater than 0.5 but, fortunately, less than 1 (i.e., 0.634) which indicates
that the data can be assumed to be less influential. Accordingly, the resulting
model is acceptable.
Inferential Statistical Analysis of Research Variables: Results of the
Automatic Linear Modeling
Results of the Automatic Linear Modeling which represent the magnitudes
(regression coefficients), directions (sign of regression coefficients), significances
(p values), and importance of causal relationship amongst research variables (i.e.,
independent variables and dependent variable), is presented in the figure 3 below
and table 9 which follows.
Figure 3: The effects of independent variables on dependent variable (i.e., risk
based capital—RBC).
Figure 3 clearly shows that risk-based capital (RBC) of general insurance
companies in Indonesia is influenced in different directions and magnitudes by
current ratio, expense ratio, reference interest rate (BI Rate), inflation rate
(consumer price index), company size, and loss ratio. BI rate are presented in two
version of measurements (i.e., continues and ordinal). Both of them have similar
effect direction with slightly different magnitudes.
Risk based capital of general insurance companies, as clearly depicted in figure
3 and shown in Table 8, is significantly affected, consecutively, by current ratio,
reference interest rates (measured using BI Rate), inflation rates (consumer price
index), and company size (measured using total assets) in different magnitudes and
directions.

Effects of Macro and Micro Economic Factors on Insurance companies ISSN 1985-692X
International Journal of Business and Management Science, 9(1): 47-65, 2019 61
Table 9: Regression coefficients (magnitude effects) and significance effect of causal relationships
between independent and dependent variables
Variables Coefficients Significance Importance/Strength
Intercept1 507.947 0.000 -
Current Ratio 1.861 0.000 0.556
BI Rate (continues) -427.844 0.000 0.188
BI Rate (ordinal) -226.576 0.000 0.188
Inflation Rate -78. 695 0.000 0.174
Company Size -0.043 0.000 0.082
Accuracy (R2): 24.30 percent,
F-test: 26.709 (p<0.000)
Current ratio
Current ratio is one of several measures of liquidity ratio of general insurance
companies. This ratio indicates an insurance company’s ability to settle its current
liabilities without prematurely selling long term investments or to borrow money.
If this ratio is less than 100 percent, then the insurance company’s liquidity
becomes sensitive to the cash flow from premium collections. Liquidity and
solvency are essential for insurance companies (D´Oliveira, 2006) in which
deficiency of liquidity means delays in honoring obligations with service
providers. If this situation is sustained over a long period, the market is likely to be
negatively impacted.
Finding of this research which revealed that current ratio significantly affects
the solvency (i.e., RBC) of general insurance companies is in line with D’Oliviera
(2006), Chen and Wong (2004), and Caporale et al. (2017). Current ratio affects
risk based capital in positive ways which means that general insurance companies
with higher current ratio tend to have higher risk based capital or financially
healthier than those of general insurance companies with lower current ratio.
Company size
Other microeconomic indicator or company specific determinant which
significantly affects financial health (RBC) of general insurance companies is
company size which is represented by company’s total assets. Interestingly, it
influences the financial health of general insurance companies in a negative way
meaning that larger general insurance companies tend to have lower RBC or less
healthy financially than those smaller general insurance companies. This finding is
to same extent in accordance with Chen and Wong (2004) as well as Caporale et
al. (2017) who state that financial health of an insurance company is affected by its
size. Since large insurance company tends not to be liquidating easily by the
authority, larger general insurance company tends to have lower RBC.
Reference interest rate (BI rate)
BI rate (reference interest rate) is found to negatively affect risk based capital
of general insurance companies. This implies that general insurance reference
interest rate (BI rate) will have lower risk based capital or financially less healthy.
In other words, the higher the reference interest rates the lower the RBC or the
lower the financial health of the company. In general, this finding is in line with

Effects of Macro and Micro Economic Factors on Insurance companies ISSN 1985-692X
62 International Journal of Business and Management Science, 9(1): 47-65, 2019
those findings of Abdelraheem (2017) and Caporale et al. (2017) where increase in
interest rates tends to reduce the level of financial health of general insurance
companies. Empirical results of Boubaker and Sghaier (2012) support the finding
which shows that the interest rate and the inflation rate have a differentiated
impact on the non-life insurance premiums depending on the value of the inflation
rate. The inflation rate and exchange rate, according to Ahlgrim and D’Arcy
(2012), negatively influence the financial health of insurance companies where
companies which are operated within an economic system characterized by higher
inflation rates tend to have lower financial health condition.
Inflation rate (Consumer price index)
Inflation rate (consumer price index) is revealed to have negative effect on risk-
based capital of general insurance companies. General insurance companies which
is operated within an economic system characterized by higher rate of inflation
(consumer price index) will have lower risk-based capital or financially less
healthy.
This finding is, to some degree, in accordance with Ahlgrim and D‘Arcy (2012)
statement that the effect of inflation rate on financial health insurance companies,
which is in negative way, considered as one of the top risk list for insurers. In
addition, the inflation rate has a direct effect on claims cost and investment
performance as well as assets and liabilities of insurance company.
CONCLUSIONS
The level of financial health of general insurance companies which in this study is
estimated by risk-based capital (RBC) was influenced by reference interest rates
(i.e., BI rates), inflation rates (i.e., consumer price index—CPI), liquidity (i.e.,
current ratio—CR), and company size (i.e., total assets) in different directions and
magnitudes. Macro-economic factors which include reference interest rates and
inflation rates are revealed to significantly affect the financial health of general
insurance companies in negative way. This means that increases in either interest
rates or inflation rates will cause risk-based capital of general insurance companies
to decrease or have lower level of financial health vice verza. This also indicates
that macro-economic environments which are characterized by high rates of
interest and inflation will decrease the financial health of general insurance
companies. Microeconomic indicators which significantly affect the financial
health of general insurance companies are liquidity ratio (i.e., current ratio) and
company size (i.e., total assets). General insurance companies having higher
liquidity ratio tend to have better financial health conditions. Larger general
insurance companies, interestingly, tend to have lower level of financial health
conditions.
LIMITATION OF THE RESEARCH
In the present study financial health of general insurance companies is only
represented by risk-based capital (RBC). Other measures of financial health of

Effects of Macro and Micro Economic Factors on Insurance companies ISSN 1985-692X
International Journal of Business and Management Science, 9(1): 47-65, 2019 63
insurance companies, both general/non-life and life insurance, according to the
Indonesia Financial Authority Regulation No. 71/POJK.5/2016, include technical
reserve, equity, and investment adequacy. For further study, it is recommended to
take these measures into account to examine whether any difference amongst these
measures in relation to their potential driving factors i.e., macroeconomic as well
as microeconomic ones.
ACKNOWLEDGEMENTS
Special appreciation is addressed to the Directorate of Research and Extensions,
Directorate General of Higher Education, Ministry of Research and Higher
Education of the Republic of Indonesia for providing the required research funds.
Gunadarma University Research Center and the Indonesia Insurance Institute
(AAMAI) were of great support for providing supporting data and information for
the study.
REFERENCES
Abiodun, A.J. (2009). Empirical evidence of executives’ perception and scanning of
business environment in Nigeria. Buletinul Universitatii Petrol. 61(3): 12-25.
Adam, M., J. Anderson, L-F. Anderson and M. Lindmaar (2005). The historical relation
between banking, insurance and economic growth in Sweden: 1830 to 1998. Available
from: https://brage.bibsys.no.adams mike 2605.pdf [Accessed 25 October 2017].
Akinlo, T. and O. T. Apanisile (2014). Relationship between insurance and economic
growth in Sub-Saharan African: A panel data analysis. Modern Economy. 2(5): 120-
127.
Akpan, S. S., Mahat, F., Noordin, B-A. and Nassir, A. (2017). Contrasting the effect of
risk- and Non-risk-based capital structure on insurers’ performance in Nigeria, Social
Science, 2(6): 143-148.
Bednarczyk, T. H. (2013). Insurance development as a factor in long-term economic
growth. Insurance Review. 4(23): 29-46.
Bellando, J-L (2006) Assessing the financial health of insurance undertakings to protect
the insured from the risks to which these firms are exposed: Solvency rules. Available
from: www.oecd.org/finance/insurance/1857594 20 [Accessed 14 December 2017].
Brainard, L. (2008). What is the role of insurancein economic development? (The Second
Paper), Zurich, Switzerland: Zurich Government and Industry Affairs.
Burca, A-M. and G. Batrinca (2013). The determinants of financial performance in the
Romanian insurance market, International Journal of Academic Research in
Accounting, Finance and Management Sciences. 4(1): 299–308.
Capital Market and Financial Institution Supervisory Agency (2012). Insurance Statistics
of Indonesia 2011. Jakarta, Indonesia: Capital Market and Financial Institution
Supervisory Agency of the Republic of Indonesia.
Caporale, G.M., Cerrato, M. and Zhang, X. (2017). Analysing the determinants of
insolvency risk for general insurance firms in the UK, Journal of Banking and Finance.
3(84): 107-122.
Cekrezi, A. (2015). Determinants of financial performance of the insurance companies: A
case of Albania, International Journal of Economics, Commerce and Management.
3(4): 1-10.

Effects of Macro and Micro Economic Factors on Insurance companies ISSN 1985-692X
64 International Journal of Business and Management Science, 9(1): 47-65, 2019
Chen, R. and Wong, K. A. (2004). The determinants of financial health of Asian insurance
companies, The Journal of Risk and Insurance. 71(3): 469-499.
Cristea, M., Marcu, N. and. Carstina, S. (2014). The relationship between insurance and
economic growth in Romania compared to the main results in Europe–a theoretical and
empirical analysis. Procedia Economics and Finance. 4(8): 226-235.
Curak, M., Loncar, S. and Poposki, K. (2009). Insurance sector development and economic
growth in transition countries. International Research Journal of Finance and
Economics. 4(34): 29-41.
Delen, D., Kuzey, C. and Uyar, A. (2013). Measuring firm performance using financial
ratios: A decision tree approach, Expert Systems with Applications. 40 (2013): 3970–
3983.
Ege, I. and Bahadir, T. (2011). The relationship between insurance sector and economic
growth: An econometric analysis. International Journal of Economic Research. 2(2): 1-
9.
Financial Service Authority of Indonesia (2013). Insurance statistics of Indonesia 2012.
Jakarta, Indonesia: Financial Service Authority of Indonesia.
Financial Service Authority of Indonesia (2014). Insurance statistics of Indonesia 2013.
Jakarta, Indonesia: Financial Service Authority of Indonesia.
Financial Service Authority of Indonesia (2015). Insurance statistics of Indonesia 2014.
Jakarta, Indonesia: Financial Service Authority of Indonesia.
Financial Service Authority of Indonesia (2016). Insurance statistics of Indonesia 2015.
Jakarta, Indonesia: Financial Service Authority of Indonesia.
Financial Service Authority of Indonesia (2017). Insurance statistics of Indonesia 2016.
Jakarta, Indonesia: Financial Service Authority of Indonesia
Financial Service Authority of Indonesia (2013). Financial Services Authority (OJK)
Regulation Number 71/POJK.05.2016 concerning Insurance and Reinsurance
Companies. Jakarta, Indonesia: Financial Service Authority of Indonesia
Ghimire, R. (2014). Contribution of insurance industries in economic development of
Nepal. Reflection. 3(5): 1-12.
Han, L., D. Li, Moshirian, F. and Tian, Y. (2010). Insurance development and economic
growth. The Geneva Papers 5(35): 183–199.
International Monetary Fund (2107). Financial system stability assessment. (IMF Country
Report No. 17/152). Washington DC. USA: International Monetary Fund.
Joo, B.A. (2013). Analysis of financial stability of Indian non-life insurance companies,
Asian Journal of Finance & Accounting 5(1): 306-319.
Kaur, N. and R. Kapoor (2007). Profitability analysis of public sector banks in India.
Indian Management Studies Journal 7(11): 167-180.
Kyule, J.M (2015). Impact of liquidity and solvency on financial performance of firms
listed at the Nairobi Securities Exchange. Unpublished master’s thesis. University of
Nairobi. Nairobi, Kenya.
Liedtke, P.M. (2007). What’s insurance to a modern economy? The Geneva Papers, 7(32):
211-221.
Maaka, Z.A. (2013). The relationship between liquidity risk and financial performance of
commercial banks in Kenya. Unpublished master’s thesis, University of Nairobi,
Nairobi, Kenya.
Malik, H. (2011). Determinants of insurance companies’ profitability: An analysis of
insurance sector of Pakistan, Academic Research International. 1(3): 2-16.
Moro, O. and Anderloni, L. (2014). Non-life insurance economic performances—An
empirical investigation, Journal of Economics and Management. 3(8): 160-177.
Obudho, A.R. (2014). The relationship between financial risk and financial performance
of insurance companies in Kenya. Unpublished master’s thesis, University of Nairobi,
Nairobi, Kenya.

Effects of Macro and Micro Economic Factors on Insurance companies ISSN 1985-692X
International Journal of Business and Management Science, 9(1): 47-65, 2019 65
Pervan, I. and Kuvek, T. (2013). The relative importance of financial ratios and non-
financial variables in predicting of insolvency, Croatian Operational Research Review
(CRORR), 4(4): 187-198.
Rahim, H. (2013). Indonesian insurance growth optimism: Five-year development
projection (2014-2018). Journal of Insurance and Risk Management. 1(2): 1-21.
Setiawan, S. (2013). Prospects and competitiveness of Indonesia's insurance sector amid
the challenges of integrating ASEAN financial services. In H. Amir (Ed.).
Strengthening International Economic and Financial Relations in Support of National
Development. Jakarta, Indonesia: Naga Media.
Sherris, M. (2007). Risk based capital and capital allocation in insurance (Institute of
Actuaries of Australia Biennial Convention 2007). Canberra, Australia: The Institute of
Actuaries of Australia.
Smith, T.M. and Reece, J.S. (1999). `The relationship of strategy, fit, productivity and
business performance in a service setting, Journal of Operations Management. 2(17):
145-161
Vaughan, E.J. and Vaughan, T. (2008) Fundamentals of risk and insurance. Hoboken, New
Jersey, USA: John Wiley & Sons.
Verma, A. and Bala, R. (2013). The relationship between life insurance and economic
growth: Evidence from India. Global Journal of Management and Business Studies.
3(4): 413-422.