effect of recirculation ratio on the uniformity flow in a
TRANSCRIPT
Journal of Engineering Volume 21 September 2015 Number 9
169
Effect of Recirculation Ratio on the Uniformity Flow in a High Area Ratio of
Outlets Pipe at Different Entrance flow rates
Dr. Wissam H. Alawee Dr. Jafar M. Hassan Dr. Wahid S. Mohammad
Lecture professor professor
Center of truuing-Univ. of tecnology Mech. Eng. Dep.- Univ.of Technology Mech. Eng. Dep.- Univ. of Technology
[email protected] [email protected] [email protected]
ABSRTACT
The uniform flow distrbiution in the multi-outlets pipe highly depends on the several parameters
act togather. Therefor, there is no general method to achieve this goal. The goal of this study is to
investigate the proposed approach that can provide significant relief of the maldistribution. The
method is based on re-circulating portion of flow from the end of the header to reduce pressure at
this region . The physical model consists of main manifold with uniform longitudinal section having
diameter of 152.4 mm (6 in), five laterals with diameter of 76.2 mm (3 in), and spacing of 300 mm.
At first, The experiment is carried out with conventional manifold, which is a closed-end. Then,
small amount of water is allowed by controling the valve located at the end of the manifold slowly.
The pressure and the flow distribution among the lateral pipes were recorded. Different inlet flows
have been tested and the values of these flows are (625, 790, and 950) l/min. The result reveals that
the conventional header give high non-uniform flow distrbution and the distribution of flow is
greatly improved by using the perposed methods . When the recircluting ratio is of 15%, the non-
uniform coefficient (the stander devation) is reduced from 0.48 to 0.13 which means improves in the
flow distribution by 75%.
Keyword: Flow distribution, manifold, uniform
التذفق ف انبىب متعذد المنافز رو نسبت مساحت عالتتىحذ على التذور إعادة نسبت تأثر
عنذ معذلاث تذفق مختلفت
وحذ شات محمذد. د. جعفر مهذي حسن وسام حمذ علىي د.
رار ذسط اسرأر أس
اىجاؼح اىرنىجح -اىجاؼح اىرنىجح قس اىذسح اىنانح -اىجاؼح اىرنىجح قس اىذسح اىنانح -شمض اىرذسة
الخلاصت
ىزىل. جرغ تشنو ذؤثش اىر اىرغشاخ اىؼذذ ػيى مثش تشنو ؼرذ اىافز رؼذدج الااتة خلاه ىيجشا اىرظ اىرصغ
. اىجشا ذصغ سء ذقيو ا ن قرشحح ىطشقح ذطش اىحاى اىثحث. اىذف زا ىرحقق حذدج طشقح اك ذجذ لا
ز ف اىشذفغ اىضغظ ىرقيورىل ع اىرفش ىلاثب اىغيقح اىاح اىائغ سثح حذدج سحة ػيى اىطشقح ز ذسرذ
76.2) تقطش فشػح ااتة خسح (ي 152.4) تقطش سئس اثب رن قطغ الاخرثاس اىسرخذ ف اىثحث . اىطقح
ي(. أجضخ اىرجاسب ف اىثذاح ػيى قطغ الاخرثاس تاىرص اىرقيذي )اىاح 300ت الااتة اىفشػح ماد ) اىسافح ،ي(
غيقح( تؼذ رىل ر اىساح ىناخ خريفح اىاء اىشس اىاح اىغيقح خلاه صا ذحن ثثد ف اح الاثب.
ة /ثاح. تد اىرائج ا ػيح سح( ىرش950، 790، 625ح اىرذفق اىذاخو خلاه اىرجاسب )ثلاثح ق خريفح ىناسرخذد

Journal of Engineering Volume 21 September 2015 Number 9
170
جضء اىاء اىاح اىغيقح ىلاثب اىرفشع سا اىى حذ مثش ف ذحس ذصغ اىجشا، حث ا ػذ سثح اػادج ذذش
.75تقذاس % ذصغ اىجشا، زا حس 0.13اىى 0.48( قيد ق ؼاو الاحشاف 15قذاسا )%
1. INTROUDUCTION
Multiple-outlet pipes, often referred to as manifolds, are used in many engineering applications such
as infiltration systems, (Burt et al., 1992), heat exchanger (Ranganayakulu et al., 1997), gas pipe
burners (Mishra et al., 2013), fuel cells (Kang et al., 2009), and ocean outfalls (Kang et al.,
2002).The flow rate distribution through the lateral pipes depends on the pressure difference across,
and, the shape of the header or manifold. Two main challenges of the multiple-outlet pipes are first,
to obtain a even flow distribution through lateral pipes, and second, to reduce the pressure loss along
the lenght of the manifold (Hsien and Hin, 2008, Tong et al., 2007). There are two types of
multiple-outlet pipes. One of these categories is dividing multiple-outlet pipes, wherein there is a
single inlet and multiple exits The other category is combininng multiple-outlet pipes, where there
are multiple inlets and a single exit. Combining-flow multiple-outlet pipes are discussed in (Graber,
2004, 2007), The present paper addresses dividing-flow multiple-outlet pipes.
A major study has been investigated by (Acrivos et al., 1959) for pipe spargers. they found that the
flow distribution depends on frictional pressure drop due to the miner and majer losses, and pressure
recovery due to the reduction in velocity in the flow direction. In addition, the results showed that
the high cross section area of distribution manifold give uniform flow distribution. Kim et al., 1995,
numerically investigated the effect of outlet header shapes on the flow distribution with the same
inlet velocity for three different header geometries (i.e., rectangular, triangular, and trapezoidal) with
the Z-type flow direction. Their results indicated that the triangular shape provided the best
distribution regardless the inlet flow rate. Zhe and zhong, 2003, and Zhang et al.,2004 conducted
the experimental studies as well as CFD simulation studies to understand the effect of manifold
configuration in plate heat exchangers. Tong et al., 2009, investigated the influence of the cross
sectional area of the header. They concluded that the simplest way to obtain outflow uniformity is to
enlarge the header to increase the cross sectional area or reduce the flow area ratio.
Hassan et al., 2008, studied numerically the effect of the area ratio (the ratio between sum of areas
of all outlets to the area of the main pipe) (AR) on the flow distribution through manifold with five
lateral pipes. The simulation results showed that the area ratio has a highly impact on flow
distribution through the lateral pipes.
Hassan et al., 2012, performed numerically model to predict the flow distribution in a square cross
section header with five branch channels. Three geometrical parameters were considered to
investigate their effect on flow distrbution. The geometrical parameters include the distance among
laterals, the length of the laterals, and the laterals size. Results showed that increasing the length of
the laterals and reducing lateral size give uniform flow profile at lateral outlet.
Fu et al., 1994, studied experimentally and numerically the flow distribution in distribution
manifold of square cross-section. Wang and Yu, 1989, studied experimentally the flow distribution
in inlet and outlet flow for solar collectors. The results show that the header systems can be
categorized as pressure regain type and pressure decrease type according to the static pressure
distribution along the multiple-outlet pipes. Kenji and Hidesato, 2005, presents an experimental
study to determine energy loss coefficients for smooth, sharp-edged tees of circular cross-section
with large area ratio. By using equations developed from the continuity, energy, and momentum
principles they expressed the loss coefficients with correspond correction factors needed in the

Journal of Engineering Volume 21 September 2015 Number 9
171
equations. The comparison of the proposed equations with the experimental results obtained by
authors showed that the proposed equations with the correction factors gives good agreement with
the experimental results for the area ratio greater than 8.
The literature survey indicates that a flow uniformity are gaining importance in many engineering
applications. Also, it was found that impossible achieve this goal for conventional header has area
ratio greater than unity (area ratio, AR the ratio between sum of areas of all outlets to the area of the
main pipe). Wissam, 2005, studied numerically and experimentally several methodologies to
improve the flow uniformity in distribution manifold. One of these methodologies were study the
effect of drawing ratio (flow out from closed end of manifold) on the flow distribution at the
manifold diameter of 101.6 mm (4 in). The results showed that the flow drawing from the end of
manifold reduced the flow maldistribution through lateral pipes. The objective of the present study
is to investigate the effect of drawing ratio on the flow distribution at large header diameter 152.6
mm (6 in), different drawing ratio, and different entrance velocities.
2. EXPERIMENTAL SETUP
The test rig of this study is shown in Fig. 1. The rig was built at a selected site in Department of
Machinacl Engineering, University of Technology, Baghdad. The test rig, shown in Figure consists
of the follwing parts: the main supply pipe, test section, shalow tank to collection water, flow meter,
manometer and a centrifugal pump to recycle water to main supply pipe. In order to make a
successful and accurate experimental study using the proposed approach, two test sections are made;
the first one is made according to conventional design with large area ratio. It is simply shaped with
uniform cross section header. The second is made according to the proposed approach. It connected
with a globe valve to investigate the effect downstream outflow on uniformity of flow distribution.
These test sections consist of a manifold with five-lateral pipe orizontal header and five parallel
channels. The header is made of acrylic material to ensure the good visibility of developed flow. It
has 1500 mm long and 152.4mm (6 in) diameter.
The inlet of each test section is connected to a 3500 mm length pipe made of clear polyvinyl
chloride (PVC) at same diameter of test section. The long pipe provides a fully developed flow. The
first test section is dead end where it is closed by a PVC plug. the end of another test section is
connected to globel valve. Each branch has 76.2-mm diameter. The branches are regularly 300-mm
spaced along the header. The diagrames in Fig.2. show the general configuration of the test sections
used.
3. FLOW LOOP AND MEASURING DEVICES
The experimental loop is shown in Fig.3. Water is the test fluid. The water flow rate from each
lateral pipe is collected in a shallow tank, with dimentioin 1500-mm x 1500-mm x 400-mm, then
discharged continuously through pipe with diameter of 152.4 mm (6 in) to recycle water by
centrifugal pump to main supply tank. The water flow rate is measured by five glass containers with
a capacity of 50 liter for each container. The containers are placed on a movable support, which
allows it to move freely at the same time of carrying out of experiments. The containers and support
are shown in Fig.4. Nine pressure tapes are located along the length of the test section. These
pressure tapes are used to measure the pressure head in inlet of manifold and at different points

Journal of Engineering Volume 21 September 2015 Number 9
172
along the length of the distribution manifold. The inlet water to the test section is controlled by a
globle valve and is measured by a target flo.wmeter.
4. EXPERIMENTAL CONDITIONS
The first tests are carried out with the reference geometry (a multiple-outlet pipes with dead end) to
test the effect of the inlet flow rate on the flow distrbution. Inlet flow rates ranges are 625–950
l/min. Three different of drawing ratio are investigated to study its impact on the flow uniformity.
All tests are performed at a room temperature and at a atmosphere pressure.
5. MATHEMATICAL MODEL
Fig. 5 shows The control volume in an dividing manifold. The theoretical flow model for present
work is based on the same mathematical style as that in the previous work (Wang, 2008, Wang,
2011). The mass and momentum balances can be written as follows:
Mass Conservation:
where A and Al are the cross-sectional areas of the header and the lateral pipe, respectively, Wl the
axial velocity in header pipe, Ul the velocity in lateral pipe, Z axial coordinate, L length of the
header, and n number of lateral pipes. Setting ∆X = L/n . Momentum Conservation:
(
) (
)
Where P is pressure in the manifold, D diameter of header pipe, w is given by Darcy–Weisbach
formula, , and . After inserting w and Wl into Eq. (3) and neglecting the
higher orders of ∆X, Eq. (3) can be rearranged as follows:
The flow in the lateral pipes can be described by Bernoulli’s equation with a consideration of flow
turning loss. Hence, the velocity in a lateral pipe, Ul, is correlated to the pressure difference between
the manifold and the ambient as follows:
(
)

Journal of Engineering Volume 21 September 2015 Number 9
173
where Cf is turning loss coefficient from the manifold into the lateral pipes, H is length of the lateral
pipe, dl is diameter of lateral pipe, fl is coefficient of the friction for the lateral pipe. Inserting Eq. (2)
into Eq. (5), gives:
(
)
(
)
Eqs. (4) and (6) can be reduced to dimensionless form using the following dimensionless groups.
(
)
(
)
where W0 is the inlet velocity of the manifold. Inserting Eq. (9) into Eq. (8) and after rearranging,
one obtains an ordinary differential equation for the velocity in the distributon manifold:
(
)
(
)
5.1 Analytical Solution
We define two constants:
(
)
(
)
Thus, Eq. (10) is reduced as follows:
The general solutions of the governing equation (13) for flow distribution in manifold is similar to
that done by Wang, 2008, 2011. To solve Equation (13), we assume that the function, w, is
a solution of Equation (13) and substitute it and its derivatives into Eq. (13), we obtain the
characteristic equation of Equation (13).

Journal of Engineering Volume 21 September 2015 Number 9
174
The solutions of Equation (13) depends on the sign of Q3 + R
2, which have three cases. The
solutions of case (Q3 + R
2 > 0) is listed here.
* √ +
* √ +
√
√
Where * √ +
* √ +
Thus, the general solution of Eq. (13) and boundary conditions can be written as follows:
[ (√ ) (√ )]
The equation of axial velocity in the manifold can be written as follows:
[ (√ )
(√ )]
The equation of velocity of lateral can be written as follows:
(
) *
√ √ √
√ +
Flow distribution through lateral pipe:
(
)
*
√ √ √
√ +
5. RESULTS AND DISCUSSION
According to Hassan et al., 2008 and Wissam, 2015 the flow distribution along multi-outlet pipe
is depended largely on the area ratio. They found that, when the area ratio increases to larger than
unity, the flow distribution along multi-outlet pipe is far from uinform. On the contrary, when the
area ratio decreases, the distribution of flow improves dramatically. Therefore, the present results
are expected for area ratio greater than unity. These results will be a reference to investigate the
effect of proposed approach on the flow and pressure distribution.
The results of the flow rate for each outlet at three different inlet flow rates (625, 790, 950) l/min.
are given in Fig.6. As expected, the water flow in the outlets tends to increase, starting with the first

Journal of Engineering Volume 21 September 2015 Number 9
175
outlet which is badly fed to the last one which is so highly fed (more than twice the mean water flow
rate). In contrast, the pressure distribution along the length of manifold also be uneven.
There is a clear flow maldistribution which can be explained as follows: there are two factors
control the pressure variations in multi-outlet header: friction and momentum. These two factors
work in opposite directions to each other. The friction effect lowers the pressure along the header in
opposing the momentum effect. In tradetional header, the momentum cannot balance the friction
effect, resulting in a non-uniform flow distribution. When the multi-outlet pipe is dead end, water is
recirculating at the closed end. This causes unstable flow and pressure increase, resulting in an
increase in flow rate through branch No.5. This is in agreement with the findings in reference,
Pertorius, 1997.This is in agreement with the results of reference, Pertorius, 1997.
The behavior of flow distribution is consistent with the pressure distributions that have been
displayed in Fig.7. This figure shows that the pressure increases with increasing of downstream
distances. Since the pressure difference drives the per-outlet water flow rate, so it is necessary to
increase the flow rate with downstream distance.
The difficulty in obtaining uniform distribution is due to pressure build-up at the header end. To
reduce the pressure, a portion of the flow is re-circulated to supply tank were carried out. Figs. 8, 9,
and 10 present the results of flow rate at drawing ratios of 5%, 10%, and 15% respectively. From
these figures, it can be seen that the ratio of withdrawal water from the closed end of manifold helps
to a great extent to improve the distribution of the flow regardless of inlet flow rate (in the range
used in the experiment that is from 625 l/min. to 950 l/min.). When the drawing ratio is 0%, it means
that there is no flow from the end of the manifold. In this case, a part of the kinetic energy is
converted to a rise in pressure at that region.Thus, the water flow through the outlets is increasing
towards dead end of the header. When the drawing ratio is certain percentage, the pressure at the
dead end will decrease and hence the water flow from the last outlet is also decreases. When the
drawing ratio increses from 5% to 15%, the pressure along the manifold was become nearly uniform
which gives a better flow distribution through the outlets.
Fig.11 shows the percentage of flow rate fraction for each outlet takes from the total flow at
different drawing ratio. Comparing these results with those of traditional header (closed end), a clear
improvement can be seen in flow distribution. For example, when the traditional header is used, the
discharge from last outlet is about 29.5% of the total flow rate while for the header with 15%
drawing ratio, the percentage is reduced from 29.5% to 22.5%. In other words, the flow discharge
from first outlet is 64% less than that from last outlet but when the header with 15% drawing ratio is
used, this percentage is reduced from 64% to 20%.
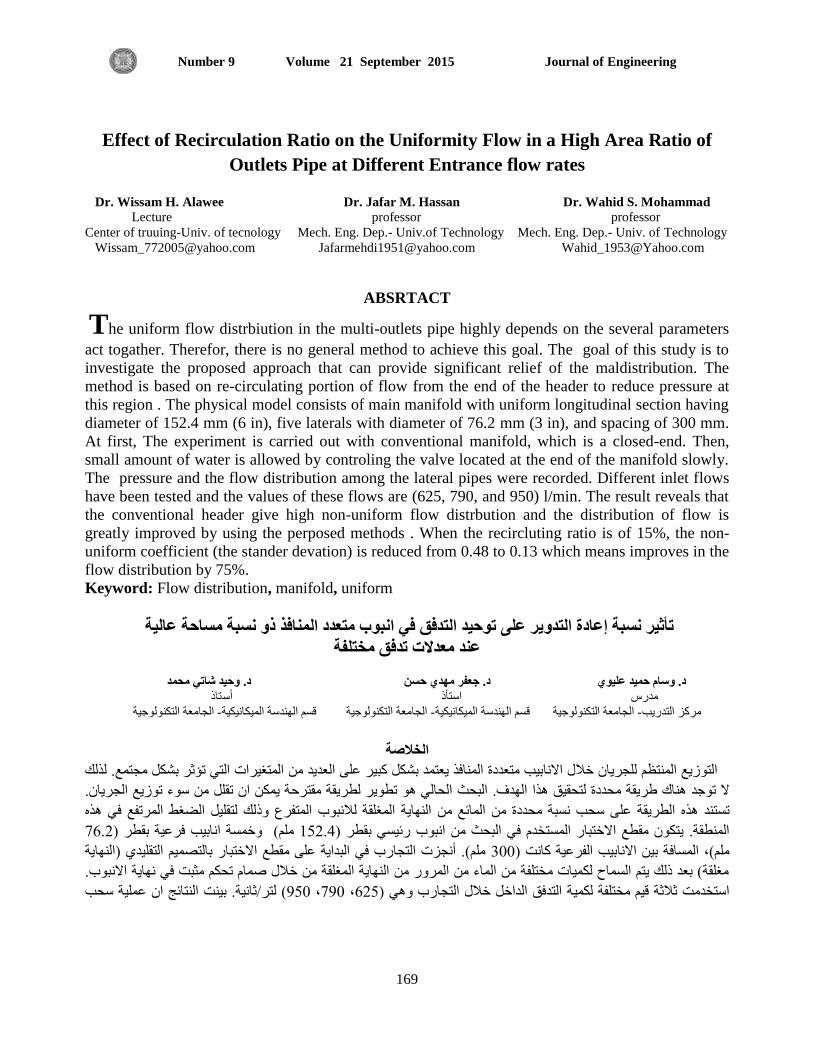
The percentage of absolute mean deviation from average flow rate is shown in Fig.12. From this
figure, the values of standard deviation (STD) are 0.48, 0.439, 0.311, and 0.241 at Drawing ratio of
0%, 5%, 10%, and 15%, respectively. The lowest value of (Φ) was of the header with 15% drawing
ratio that corresponding to 0.025. It is clear that water withdrawal in certain proportions from the
high pressure region (in which the kinetic energy is converted to a rise in pressure) would help
reduce pressure in this region, thus resulting in improved flow distribution.

Journal of Engineering Volume 21 September 2015 Number 9
176
A comparison between the present results and the result of Wissam, 2015 shows (see Table 1) that
the selection of drawing ratio depends largely on the header diameter. On the other hand, the total
inlet flow rate does not affect the flow distribution. When the drawing ratio of 10%, the value of
stander deviation is (0.377). Also, when using the same ratio but with header diameter of (6 in), the
value of deviation coefficient is reduces from 0.377 to 0.311.
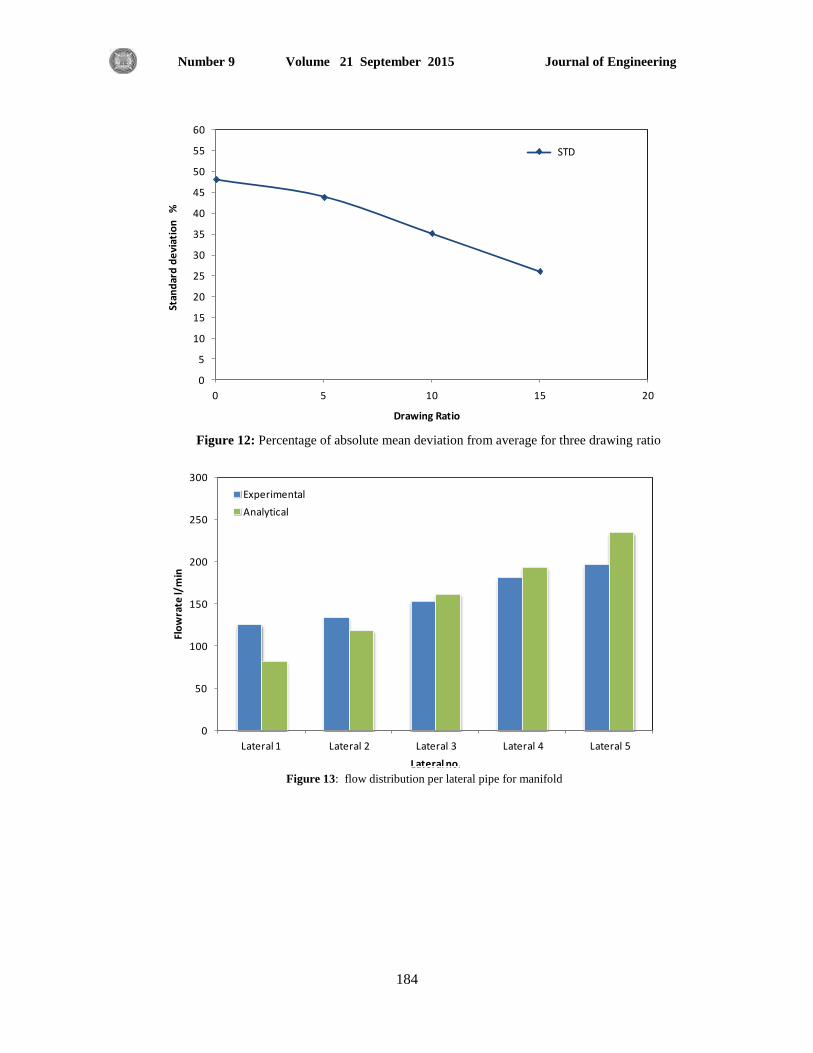
Experimental tests for flow distribution from manifold have been conducted, which made it
possible to validate the analytical procedures. Fig. 13 shows comparison between the computed and
experimental flow rate per-outlet. It can be clearly seen from the figures that the different of flow
rate between computed and experimental value is acceptable.
5. CONCLUSION
Two test sections representing different header structures were used in this study. The first test
section is uniform header, the second header with drawingratio. In both test sections, the diameter of
the main pipe was 152.4 mm and of the lateral pipe 76.2 mm. the method of withdrawal water from
the dead end of manifold is a very successful approach to improve flow uniformity. where, the flow
distribution is improved by 75% which means the stander devation is reduced from 0.48 to
0.241.Three different values of inlet flow rate of (625, 790,950) l/min had been used in the
experiments. From the results, it is found that change in the total flow rate has a slight effect on flow
uniformity. Therefore, it can be safely said that the inlet flow rate has no effect on flow distribution.
ACKNOWLEDGEMENTS
The authors would like to thank the Mechanical Engineering depertment, University of technology
for its assistance.
REFFERENCE
Acrivos, A., Babcock, B.D., and Pigford, R.L., 1959. Flow distribution in manifolds. Chem.
Eng. Sci. vol. 10, pp. 112–124.
Alawee, W. H., 2015, Solution Methodologies for the Fluid Flow Distribution Manifold
Problem, Ph.D Thesis, Department of Mechanical Engineering, University of Technology,
Iraq.
Burt, C. M., Walker, R. E., Styles, S. W., 1992, Infiltration System Evaluation Manual.
Irrigation Training And Research Center,. California polytechnic state, Univcity San Luis
Obispo, CA.
Bleninger, T., Lipari, G., and Jirka, G., 2002, Design And Optimization Program For Internal
Diffuser, 2nd Int. Conf. on Marine Waste Water Discharges, MWWD 2002.
FU H., Watkins, A. P., and Yianneskis M., 1994, The Effects Of Flow Split Ratio And Flow
Rate In Manifolds,. Int. J. Numerical Methods in Fluids, vol.18, no.9, pp. 871-886.

Journal of Engineering Volume 21 September 2015 Number 9
177
Graber, S. D., 2004, Concepts of spatially varied flow.” Proc., HTFED, 2004 ASME Heat
Transfer/Fluids Engineering Summer Conf., ASME, New York.
Graber, S. D., 2007, Full-flowing collection conduits with nonuniform inflow.” Journal.
Environment Engineering, vol. 133, no. 6, pp. 575–580.
Hassan, J. M., Mohamed, T. A., Mohammad, W. S., and Alawee,W. H., 2014, Experimental
and Numerical Study on the Improvement of Uniformity Flow for Three-Lateral Dividing
Manifold, World Research & Innovation Convention on Engineering & Technology,
Putrajaya, Malaysia, 25-26 November 2014.
Hsien-Ter Chou and Hin-Chi Lei, 2008, Outflow Uniformity along a Continuous Manifold,
Journal of Hydraulic Engineering,ASCE / SEPTEMBER 2008 , pp. 1383-1388.
Hassan, J. M.,208, Flow Distribution in Manifolds, Journal of Engineering and
Development, vol. 12, no.4, pp. 159-177.
Hassan, J. M., 2012, Study of Three Dimensional Fluid Flow in Manifold-Laterals System,
Eng. & Tech. Journal, vol.30, no. 7,pp. 1132-1148.
Kang, S., Min, K., Mueller, F., and Brouwer, J., 2009, Configuration effects of air, fuel, and
coolant inlets on the performance of a proton exchange membrane fuel cell for automotive
applications, International Journal of Hydrogen Energy, vol.34, no.16, pp. 6749–6764.
Kim, S., Choi, E., and Cho, Y.I., 1995, The effect of header shapes on the flow distribution in
a manifold for electronic packaging applications, International Communicationsin Heat and
Mass Transfer, vol. 22, pp. 329-341.
Kenji, O., Hidesato, I., 2005, Energy Losses at Tees with Large Area Ratios, Transactions of
the ASME, Journal of Fluids Engineering, Vol. 127, pp. 110-116.
Mishra, N. K., Muthukumar, P., and Mishra, S. C., 2013, Performance Tests on Medium-
Scale Porous Radiant Burners for LPG Cooking Applications, International Journal of
Emerging Technology and Advanced Engineering Vol. 3, Special Issue 3, pp. 126-130.
Pertorius W.A., Dividing- flow Manifold Calculations with a Spreadsheet, water science, 23
(2) (1997) 147-150.
Ranganayakulu, Ch., Seetharamu, K. N., and Sreevatsan, K.V., 1997, The Effects of Inlet
Fluid FlowNonuniformity on Thermal Performance and Pressure Drops in Crossflow Plate-
fin Compact Heat Exchangers, Int. J. Heat Mass Transfer, vol. 40, no. 1, pp. 27–38.
Tong, J.C.K., Sparrow, E.M., Abraham, J.P., 2007, Attainment of flowrate uniformity in the
channels that link a distribution manifold to a collection manifold, Journal Fluids
Engineering, vol. 129, pp.1186–1192.
Tong, J.C., Sparrow, E.M., and Abraham, J.P.,2009, Geometric strategies for attainment of
identical outflows through all of the exit ports of a distribution manifold in a manifold
system, Appl. Therm. Eng., vol. 29, pp. 3552–3560.
Zhe Z., Yan-zhong, L., 2003, CFD simulation on inlet configuration of plate-fin heat
exchangers, Cryogenics, vol. 43, no. 12, pp. 673-678.

Journal of Engineering Volume 21 September 2015 Number 9
178
Zhe, Z., Yan-zhong, L., and Qing, X., 2004, Experimental research on the effects of
distributor configuration in plate-fin heat exchangers, Heat Transfer-Asian Research, vol. 33,
no.6, pp. 402.
Wang, X. A. and P. Yu, Isothermal flow distribution in header systems, International Journal
of Solar Energy, 7(1989)159-169
Wang J., Pressure drop and flow distribution in parallel-channel configurations of fuel cells:
U-type arrangement, International journal of hydrogen energy, 33( 2008 ) 6339 – 6350.
Wang, J., Theory of flow distribution in manifolds, Chem. Eng. J., 168 (2011)1331–1345.
7. NOMENCLATURE
Cf = coefficients of turning losses.
D= diameter of manifold, m.
dl = diameter of the lateral pipe, m.
f =friction factor
A, Al = cross-sectional area of manifold and lateral pipe, m2.
H= length of lateral pipe, m.
L= length of manifold, m.
n = numbers of lateral pipes.
Pa = ambient pressure
pa = dimensionless ambient pressure
P = pressure in manifold
P = dimensionless pressure.
Q = coefficient in Eq. (13), defined by Eq. (11)
R = coefficient in Eq. (13), defined by Eq. (11)
r, r1, r2 = roots of characteristic equation.
W = velocity in manifold (m/s)
w =dimensionless velocity in manifold.
Ul = velocity of lateral pipe, m/s.
ul = dimensionless velocity of lateral pipe.
vc =dimensionless volume flow rate in lateral pipes.
β = average velocity ratio in manifold (Wl/W)
ρ = fluid density (kg/m3)
τw = wall shear stress (N/m2)
ζ = average total head loss coefficient for port flow

Journal of Engineering Volume 21 September 2015 Number 9
179
Table 1. A comparison of the results obtained in the present study with those of Ref.,
Alawee,2015.
Researcher Drawing
ratio, %
Percentage of flow rate fraction for each outlet
takes from the total flow
Outlet
1
Outlet
2
Outlet
3
Outlet
4
Outlet
5 STD
Wissam, 2015
Header diameter=101.6 mm
(4″)
8 11% 15% 12% 22% 22% 0.371
10 11.9 16.6 23.1 23.6 24.8 0.354
The present work
Header daimeter=152.6 mm
(6″)
10 13.3 16.6 22.0 23.8 24.1 0.311
15 14.6 18.5 21.0 21.4 21.9 0.241

Journal of Engineering Volume 21 September 2015 Number 9
180
Figure 1. Plate of the experimental rig for five-lateral manifold.
Figure 2. Multi-outlets pipe with/without recirculation ratio .

Journal of Engineering Volume 21 September 2015 Number 9
181
Figure 3: Schematic diagram of flow loop.
Figure 4: Containers to measure water from outlets
Figure 5: Control volume for the distrbution manifold.

Journal of Engineering Volume 21 September 2015 Number 9
182
0
50
100
150
200
250
300
350
0 1 2 3 4 5 6
Flo
w r
ate
l/m
in
Branch no.
Qinlet=950 l/min.
Qinlet=790 l/min.
Qinlet=625 l/min.
0
50
100
150
200
250
300
350
0 1 2 3 4 5 6
Flo
w r
ate
l/m
in
Branch no.
Qinlet=950 l/min.
Qinlet=790 l/min.
Qinlet=625 l/min.
Header diameter = 152.4 mm lateral diameter = 76.2 mm
Figure 6: Flow distribution plot at three value of inlet flow water .
0
10
20
30
40
50
60
70
0 0.2 0.4 0.6 0.8 1 1.2 1.4 1.6
Pre
ssre
he
ad,
cmH
2O
Header Length (m)
Qinlet=950 l/min.
Qinlet=790 l/min.
Qinlet=625 l/min.
Figure 7: Variations of pressure head along the manifold .
Drawing Ratio=5%
Figure 8: Flow distribution plot of manifold with 5% drawing ratio at
three value of inlet flow water .

Journal of Engineering Volume 21 September 2015 Number 9
183
0
50
100
150
200
250
300
0 1 2 3 4 5 6
Flo
w r
ate
l/m
in
Branch no.
Qinlet=950 l/min.
Qinlet=790 l/min.
Qinlet=625 l/min.
Drawing Ratio=10%
Figure 9: Flow distribution plot of manifold with 10% drawing ratio at
three value of inlet flow water .
0
50
100
150
200
250
300
0 1 2 3 4 5 6
Flo
w r
ate
l/m
in
Branch no.
Qinlet=790 l/min.
Qinlet=950 l/min.
Qinlet=625 l/min.
Drawing Ratio=15%
Figure 10: Flow distribution plot of manifold with 15% drawing ratio at
three value of inlet flow water.
Figure 11: Flow rate fraction at three value of drawing ratio.
0
5
10
15
20
25
30
35
40
0 1 2 3 4 5 6
Flw
oFr
acti
on
, %
Branch no.
Dead end
Rec. Ratio=5 %
Rec. Ratio=10 %
Rec. Ratio=15 %
Journal of Engineering Volume 21 September 2015 Number 9
184
0
50
100
150
200
250
300
Lateral 1 Lateral 2 Lateral 3 Lateral 4 Lateral 5
Flo
wra
te l/
min
Lateral no.
Experimental
Analytical
Figure 12: Percentage of absolute mean deviation from average for three drawing ratio
0
5
10
15
20
25
30
35
40
45
50
55
60
0 5 10 15 20
Stan
dar
d d
evi
atio
n
%
Drawing Ratio
STD
Figure 13: flow distribution per lateral pipe for manifold