effect of reinforcement grade and ratio on seismic...
TRANSCRIPT
907ACI Structural Journal/September-October 2016
ACI STRUCTURAL JOURNAL TECHNICAL PAPER
Reinforcement grades higher than 75 ksi (520 MPa) are not allowed in members that form plastic hinges due to a lack of information on material characteristics and on the seismic performance of columns constructed with high-strength steel (HSS) reinforcement. This research investigated the performance of reinforced concrete columns containing Grade 80 (minimum yield strength of 80 ksi [550 MPa]) HSS reinforcement. Four columns were subjected to lateral cyclic loading to determine the effects of the steel reinforce-ment grade and longitudinal reinforcement ratio. Results indicate that columns constructed with Grade 80 (550) HSS reinforce-ment achieved similar resistances, similar maximum drifts, and similar curvature ductility values when compared with the control columns. Results also indicate that the effect of the longitudinal reinforcement ratio on column performance is similar for columns constructed with either Grade 60 or 80 (420 or 550) reinforcement. Columns constructed with Grade 80 (550) reinforcement exhibited lower energy dissipation than the control columns.
Keywords: columns; cyclic tests; Grade 80 steel reinforcement; high-strength reinforcing steel; longitudinal reinforcement ratio; reinforced concrete bridge columns; seismic performance.
INTRODUCTION AND BACKGROUNDAlthough ASTM A706 Grade 80 (550) reinforcement
is commercially available, its use in practice today is still limited. Bridge and building design codes in the United States have limited the nominal yield strength of reinforce-ment to 75 ksi (520 MPa). However, in 2011, the American Association of State Highway and Transportation Offi-cials (AASHTO) began allowing the use of high-strength steel (HSS) reinforcement with nominal yield strengths up to 100 ksi (690 MPa), but only for members that are not expected to form plastic hinges (for example, not bridge columns). The primary reason for limiting the use of HSS reinforcement is because increasing the yield strength of reinforcement typically results in decreased ductility. However, the actual limit on ductility and strength is not well-defined. There is an overall lack of data on the perfor-mance of reinforced concrete (RC) compression members constructed with HSS reinforcement that can form plastic hinges. In addition, designers are reluctant to specify HSS reinforcement because of potential errors in the construc-tion process that may result in Grade 60 (420) reinforcement being placed in members where Grade 80 (550) reinforce-ment is required.
Even though the seventh (2014) edition of the “AASHTO LRFD Bridge Design Specifications” (Section 5.4.3.3) allows State Highway Agencies (SHAs) to approve the use of Grade 80 reinforcement in plastic hinge regions, there are limited experimental data on the low cycle fatigue perfor-mance of columns constructed with this reinforcement.
Currently, AASHTO does not allow the use of Grade 100 or 120 reinforcement in plastic hinge regions. In addition, SHAs are interested in promoting Grade 80 (550) reinforce-ment because manufacturing costs per unit weight are similar to manufacturing costs for Grade 60 (420) reinforcing steel in the Western United States.
The main objective of this study is to generate data on the performance of circular RC bridge columns constructed with Grade 80 (550) reinforcement subjected to reversed cyclic lateral loading. Because HSS reinforcement could result in reduced reinforcement congestion, and because reduced reinforcement quantities could result in more econom-ical structures, research is needed to assess the use of HSS Grade 80 (550) reinforcement in RC members. This research will provide seminal data to support engineers and SHAs in the design of bridge columns constructed with Grade 80 (550) reinforcement.
The evolution of the development of steel reinforcement grade is worth reviewing. This review will provide infor-mation on why Grade 80 (550) reinforcement is currently not used in RC bridge columns in the United States, even though similar reinforcement is currently used in seismi-cally prone regions of the world such as New Zealand and a few European countries. The first specifications in the United States for concrete reinforcement were developed by the American Association of Steel Manufacturers in 1910 (Concrete Reinforcing Steel Institute 2001). The following year, ASTM adopted standard specification A15 for billet steel reinforcement, which required a yield strength of 33,000 psi (228 MPa) for structural grade reinforcement. The standard specification A15 was in effect for many years. However, in 1959, ASTM developed new specifications for concrete reinforcement for yield strengths of 60 and 75 ksi (414 and 520 MPa) (Gustafson 2010). Engineers began recognizing the potential benefits of HSS reinforcement. Specifically, reports identified that Grade 80 (550) reinforcement could be economically used and produced and that, if produced, they would be in demand (Gustafson 2010). Several decades later, Grade 80 (550) reinforcement made its way into the standards, but has not yet been widely accepted or used. This is likely a result of the Grade 80 (550) reinforcement not being allowed in plastic hinge regions, but possibly due to lack of interest from the producers in lobbying for its use, as the price per unit weight would likely not be substantially
Title No. 113-S77
Effect of Reinforcement Grade and Ratio on Seismic Performance of Reinforced Concrete Columnsby David Trejo, Timothy B. Link, and André R. Barbosa
ACI Structural Journal, V. 113, No. 5, September-October 2016.MS No. S-2014-217.R2, doi: 10.14359/51689015, received August 14, 2015, and
reviewed under Institute publication policies. Copyright © 2016, American Concrete Institute. All rights reserved, including the making of copies unless permission is obtained from the copyright proprietors. Pertinent discussion including author’s closure, if any, will be published ten months from this journal’s date if the discussion is received within four months of the paper’s print publication.
908 ACI Structural Journal/September-October 2016
different than Grade 60 (420) reinforcement. This is the case even though the nominal yield strength-to-unit weight ratio is increased by 33%. However, currently there is a renewed interested from the producers and SHAs to further develop and use Grade 80 (550) reinforcement.
One of the first investigations on structural elements designed with Grade 80 (550) reinforcement was reported by Rice and Gustafson (1976). The authors analytically assessed the moment capacity of structural elements constructed with Grade 80 (550) reinforcement. Using moment interaction diagrams, the authors showed that columns constructed with Grade 80 (550) reinforcement exhibited a significant increase in moment capacity compared to columns constructed with Grade 60 (420) reinforcement. The authors also conducted an economic analysis and reported that the use of Grade 80 (550) reinforcement could have a significant reduction in cost if large quantities could be manufactured (Rice and Gustafson 1976). Even with these promising results in 1976, designers and the construction market were not ready to accept HSS reinforcement.
HSS reinforcement can replace Grade 60 (420) reinforce-ment in two ways: first, the equivalent strengths would result in reduced reinforcement quantities, which could potentially reduce reinforcement congestion; and second, by main-taining reinforcement quantities and possibly increasing member capacity. Reinforcement congestion can be a signif-icant challenge, especially in seismic regions (Gustafson 2010; Risser and Hoffman 2014). Rautenberg et al. (2010) reported that HSS reinforcement reduced reinforcement congestion without significantly reducing the performance for RC columns with low axial loads. Test results indicated that columns constructed with conventional A615 Grade 60 (420) and A1035 Grade 120 (830) reinforcement both exhibited drift ratios exceeding 4%, and both had similar moment capacities. Results indicated that as long as the fracture strain of the longitudinal reinforcement exceeded 7% for a reference gauge length (8 in. [203 mm]) and the amount and detailing of the transverse reinforcement is adequate to prevent shear failure, bond failure, and bar buckling, then the amount of reinforcement can be reduced proportionally with the increase in yield strength. However, the authors reported a noticeable reduction in hysteretic energy dissipation between the columns constructed with Grade 60 and 120 (420 and 830) reinforcement, but noted that the difference was a result of the difference in column stiffness. Mander et al. (1994) reported that an increase in reinforcement strength should result in a larger amount of energy dissipation per reinforcing bar. The observations by Mander et al. (1994) applies to an increase in strength from Grade 40 to Grade 60. Similar observations could be expected when increasing strength from Grade 60 to Grade 80 (420 to 550) reinforcing steel. Based on the authors’ interpretation of the existing literature, if RC members containing Grade 80 (550) reinforcement are designed and constructed to have the same capacity as columns constructed with Grade 60 (420) reinforcement, reducing the amount of reinforcement could result in reduced energy dissipation. However, this is yet to be shown through laboratory testing.
Rodriguez et al. (1999) investigated the effects of buck-ling in the reverse cyclic loading of steel reinforcement. The authors reported if insufficient tie spacing exists and if this is combined with large tension and compression strain reversals progressing into the inelastic range, buckling of the longitudinal reinforcement can occur during an earthquake (Rodriguez et al. 1999). This indicates that the increased yield strength of Grade 80 (550) reinforcement may not be fully utilized due to potential effects of buckling, which may control the fracture strain under reversed cyclic loading. This paper will investigate these effects further.
As noted, one approach in the design of RC columns constructed with Grade 80 (550) reinforcement is to main-tain the design column capacity while reducing the amount of reinforcement that would be required if Grade 60 (420) reinforcement was used. Currently, AASHTO limits the minimum longitudinal reinforcing ratio to 1% when Grade 60 (420) reinforcement is used. One potential issue with the use of Grade 80 (550) reinforcement is that rein-forcement ratios may be lower than 1%. Priestley and Benzoni (1996) investigated the seismic performance of circular columns with low longitudinal reinforcement ratios. The columns had an aspect ratio of 3.75. One column had the minimum longitudinal reinforcement ratio of 1% and one column had a longitudinal reinforcement ratio of 0.5%. The authors reported that the column with a longitudinal reinforcement ratio of 0.5% exhibited a ductile response, adequate distribution of flexural cracking, and failed with an associated displacement ductility μΔ of 10 due to shear failure. The maximum drift angle was reported to be 2.6%. The authors also reported that failure of columns with 1.0% longitudinal reinforcement ratio was due to shear and concluded that the results confirmed analytical predictions that 0.5% reinforcement ratio can safely be used as the lower longitudinal reinforcement ratio for RC columns subjected to low axial loads. This conclusion could prove critical to implementing Grade 80 (550) reinforcement because current codes limit the minimum ratio to 1%. This paper will inves-tigate this issue.
Although there are potential benefits in using Grade 80 (550) reinforcement, significant questions still exist. The main objective of this paper is to provide insight into some of these questions by comparing the cyclic behavior of four RC columns constructed with different reinforcement grades and different reinforcement ratios. Two columns were constructed with Grade 80 (550) reinforcement meeting ASTM A706 specifications and other two columns were constructed with Grade 60 (420) reinforcement meeting the same standard specification. In terms of performance, the focus of this paper is on the maximum lateral drifts and the tested moment capacity. Secondary topics are also addressed. First, the energy dissipation of RC systems containing Grade 80 (550) reinforcement is not well defined, and comparisons between the Grade 60 (420) and Grade 80 (550) columns are presented and discussed. Second, to achieve optimal benefits of Grade 80 (550) reinforcement, the current minimum reinforcement ratio may have to be reduced and fall below the specified 1% minimum longitu-dinal reinforcement ratio. One specimen constructed in this
909ACI Structural Journal/September-October 2016
research and containing Grade 80 (550) has a longitudinal reinforcement ratio that is less than 1%. Lastly, the poten-tial pros and cons of using Grade 80 (550) reinforcement in cyclic loading applications are assessed and quantified.
RESEARCH SIGNIFICANCEGrade 80 (550) reinforcement used in RC bridge columns
could result in lower quantities of reinforcement and reduced congestion if research results can show similar and safe performance when compared to columns constructed with Grade 60 (420) reinforcement. This research reports on the experimental testing of four circular RC columns constructed with either Grade 80 (550) or Grade 60 (420) reinforcement meeting ASTM A706 requirements. This paper evaluates and compares the performance of circular RC columns constructed with Grade 60 (420) and Grade 80 (550) reinforcements. This information can be used to assess the potential use of HSS reinforcement.
EXPERIMENTAL PLAN AND PROCEDUREAn experimental program was developed to assess the
performance of RC columns constructed with Grade 80 (550) reinforcement meeting ASTM A706 specifications when subjected to cyclic loading. The experimental program consisted of testing four half-scale circular RC bridge columns. Two of the columns were designed and constructed with Grade 80 reinforcement and the remaining two columns were designed and constructed with Grade 60 reinforcement also meeting ASTM A706 specifications. In addition to the reinforcement grade, the effect of the longitudinal reinforce-ment ratio was evaluated.
Column specimens were 2 ft (0.61 m) in diameter and 12 ft (3.66 m) tall (measured from the top of the footing to the axis of the actuator). This corresponds to a half-scale, typical 4 ft (1.22 m) diameter column built in the western United States, including California, Oregon, and Wash-ington. The total weight of the columns, including the RC load stub (header) and footing, was 10.45 tons (9.48 tonnes). The specimens are representative of a bridge containing a
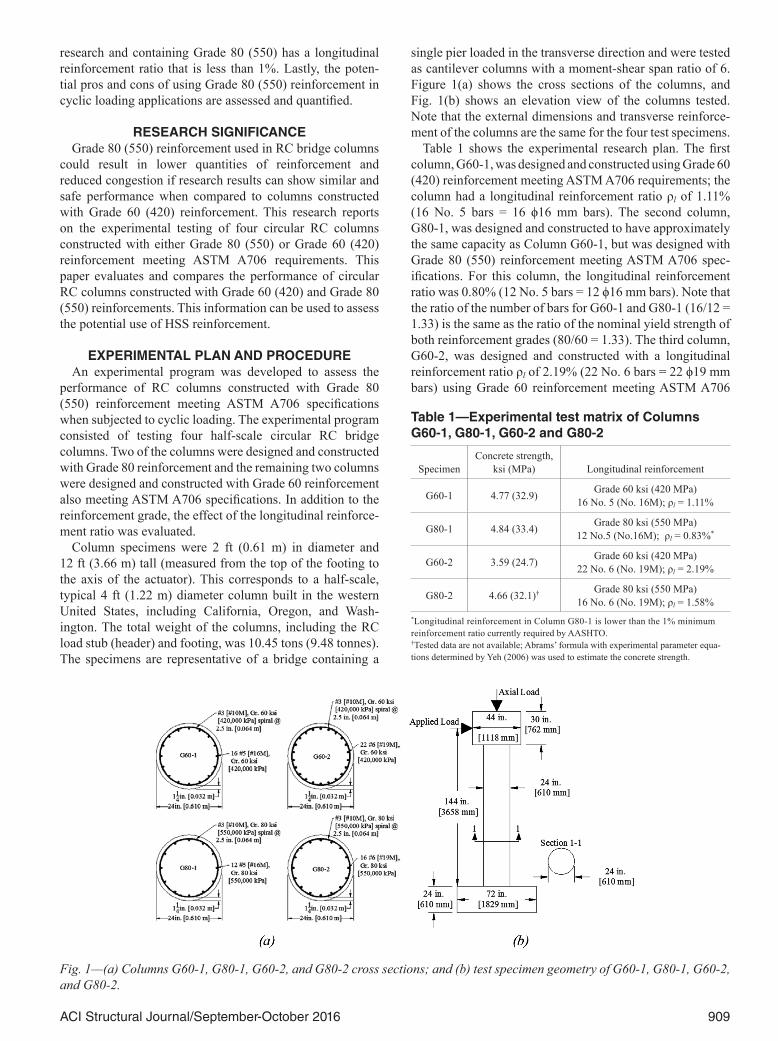
single pier loaded in the transverse direction and were tested as cantilever columns with a moment-shear span ratio of 6. Figure 1(a) shows the cross sections of the columns, and Fig. 1(b) shows an elevation view of the columns tested. Note that the external dimensions and transverse reinforce-ment of the columns are the same for the four test specimens.
Table 1 shows the experimental research plan. The first column, G60-1, was designed and constructed using Grade 60 (420) reinforcement meeting ASTM A706 requirements; the column had a longitudinal reinforcement ratio ρl of 1.11% (16 No. 5 bars = 16 ϕ16 mm bars). The second column, G80-1, was designed and constructed to have approximately the same capacity as Column G60-1, but was designed with Grade 80 (550) reinforcement meeting ASTM A706 spec-ifications. For this column, the longitudinal reinforcement ratio was 0.80% (12 No. 5 bars = 12 ϕ16 mm bars). Note that the ratio of the number of bars for G60-1 and G80-1 (16/12 = 1.33) is the same as the ratio of the nominal yield strength of both reinforcement grades (80/60 = 1.33). The third column, G60-2, was designed and constructed with a longitudinal reinforcement ratio ρl of 2.19% (22 No. 6 bars = 22 ϕ19 mm bars) using Grade 60 reinforcement meeting ASTM A706
Fig. 1—(a) Columns G60-1, G80-1, G60-2, and G80-2 cross sections; and (b) test specimen geometry of G60-1, G80-1, G60-2, and G80-2.
Table 1—Experimental test matrix of Columns G60-1, G80-1, G60-2 and G80-2
SpecimenConcrete strength,
ksi (MPa) Longitudinal reinforcement
G60-1 4.77 (32.9) Grade 60 ksi (420 MPa)16 No. 5 (No. 16M); ρl = 1.11%
G80-1 4.84 (33.4) Grade 80 ksi (550 MPa)12 No.5 (No.16M); ρl = 0.83%*
G60-2 3.59 (24.7) Grade 60 ksi (420 MPa)22 No. 6 (No. 19M); ρl = 2.19%
G80-2 4.66 (32.1)† Grade 80 ksi (550 MPa)16 No. 6 (No. 19M); ρl = 1.58%
*Longitudinal reinforcement in Column G80-1 is lower than the 1% minimum reinforcement ratio currently required by AASHTO.†Tested data are not available; Abrams’ formula with experimental parameter equa-tions determined by Yeh (2006) was used to estimate the concrete strength.
910 ACI Structural Journal/September-October 2016
specifications. The fourth column, G80-2, was designed and constructed to have approximately the same capacity as Column G60-2, but was designed with Grade 80 (550) rein-forcement meeting ASTM A706 specifications. This corre-sponded to a longitudinal reinforcement ratio ρl of 1.58% (16 No. 6 bars = 16 ϕ19 mm bars). Note that the ratio of the number of bars for G60-2 and G80-2 (22/16 = 1.38) is not the same as the ratio of the nominal yield strength of both reinforcement grades (80/60 = 1.33). For all columns, the transverse reinforcement ratio ρt was designed to be 0.82%, which corresponded to a spiral pitch (spacing) of 2.50 in. (63.5 mm) on center. The spiral reinforcement bar size was No. 3 (10 mm) for all columns. The grade of the transverse reinforcement was the same grade as the longitudinal reinforcement for each test column.
Concrete casting was done in two separate placements. The footing was cast first and this was followed by casting of the column and load stub (header) several days later. The footings for Specimens G60-1 and G80-1 were cast at the same time from the same concrete batch; the footings for Specimens G60-2 and G80-2 were cast at the same time from the same concrete batch; the columns and headers for Specimens G60-1 and G80-1 were cast at the same time from the same concrete batch; and the columns and headers for Specimens G60-2 and G80-2 were cast at the same time from the same concrete batch. The concrete mixture contained a 3/8 in. (9.5 mm) maximum size aggregate (half-scale of typical 3/4 in. [19.1 mm]) and had a 28-day design compressive strength of 4 ksi (28 MPa). The mixture was also proportioned to be pumpable and had a minimum required slump of 5 in. (127 mm). Additional details on the specimen and materials can be found in Trejo et al. (2014). It should be noted that the concrete compressive strength at the time of testing for each specimen were not the same. This was due to the fact that the concrete age was different at the time of testing for the different columns.
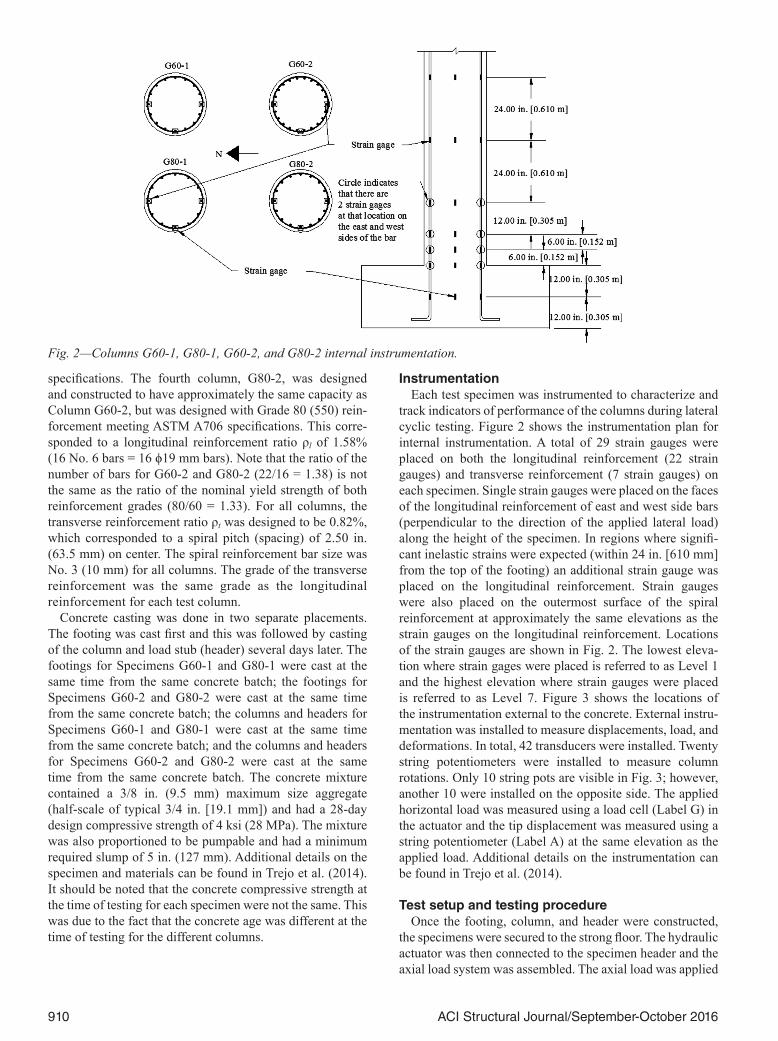
InstrumentationEach test specimen was instrumented to characterize and
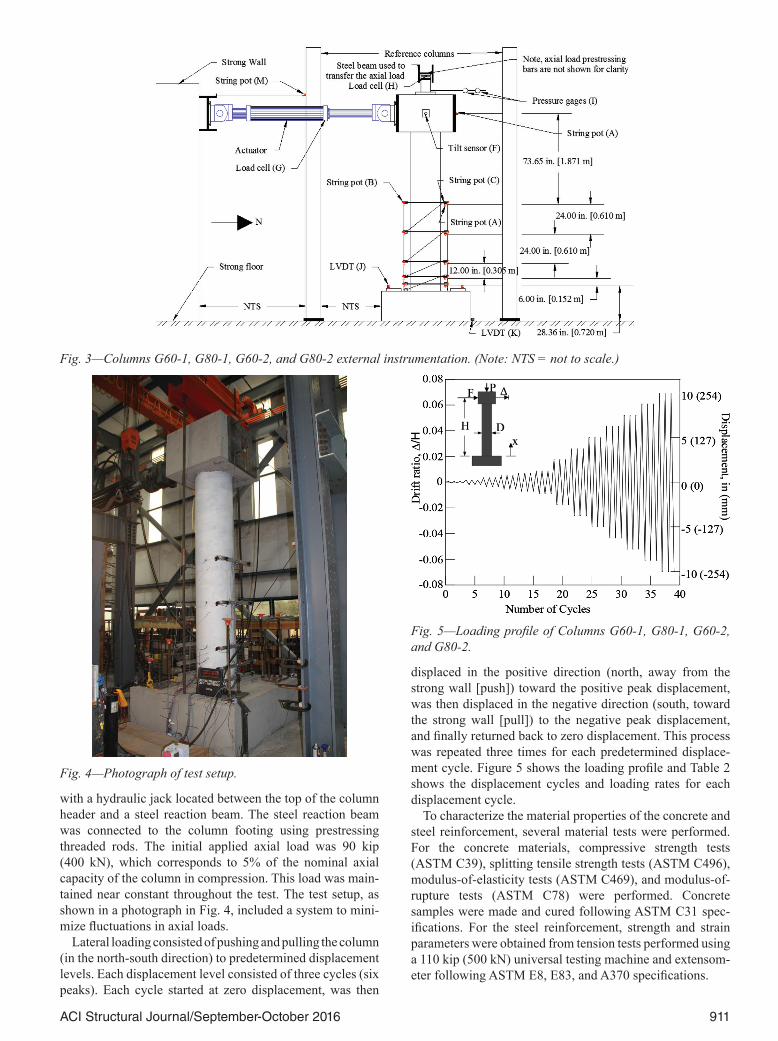
track indicators of performance of the columns during lateral cyclic testing. Figure 2 shows the instrumentation plan for internal instrumentation. A total of 29 strain gauges were placed on both the longitudinal reinforcement (22 strain gauges) and transverse reinforcement (7 strain gauges) on each specimen. Single strain gauges were placed on the faces of the longitudinal reinforcement of east and west side bars (perpendicular to the direction of the applied lateral load) along the height of the specimen. In regions where signifi-cant inelastic strains were expected (within 24 in. [610 mm] from the top of the footing) an additional strain gauge was placed on the longitudinal reinforcement. Strain gauges were also placed on the outermost surface of the spiral reinforcement at approximately the same elevations as the strain gauges on the longitudinal reinforcement. Locations of the strain gauges are shown in Fig. 2. The lowest eleva-tion where strain gages were placed is referred to as Level 1 and the highest elevation where strain gauges were placed is referred to as Level 7. Figure 3 shows the locations of the instrumentation external to the concrete. External instru-mentation was installed to measure displacements, load, and deformations. In total, 42 transducers were installed. Twenty string potentiometers were installed to measure column rotations. Only 10 string pots are visible in Fig. 3; however, another 10 were installed on the opposite side. The applied horizontal load was measured using a load cell (Label G) in the actuator and the tip displacement was measured using a string potentiometer (Label A) at the same elevation as the applied load. Additional details on the instrumentation can be found in Trejo et al. (2014).
Test setup and testing procedureOnce the footing, column, and header were constructed,
the specimens were secured to the strong floor. The hydraulic actuator was then connected to the specimen header and the axial load system was assembled. The axial load was applied
Fig. 2—Columns G60-1, G80-1, G60-2, and G80-2 internal instrumentation.
911ACI Structural Journal/September-October 2016
with a hydraulic jack located between the top of the column header and a steel reaction beam. The steel reaction beam was connected to the column footing using prestressing threaded rods. The initial applied axial load was 90 kip (400 kN), which corresponds to 5% of the nominal axial capacity of the column in compression. This load was main-tained near constant throughout the test. The test setup, as shown in a photograph in Fig. 4, included a system to mini-mize fluctuations in axial loads.
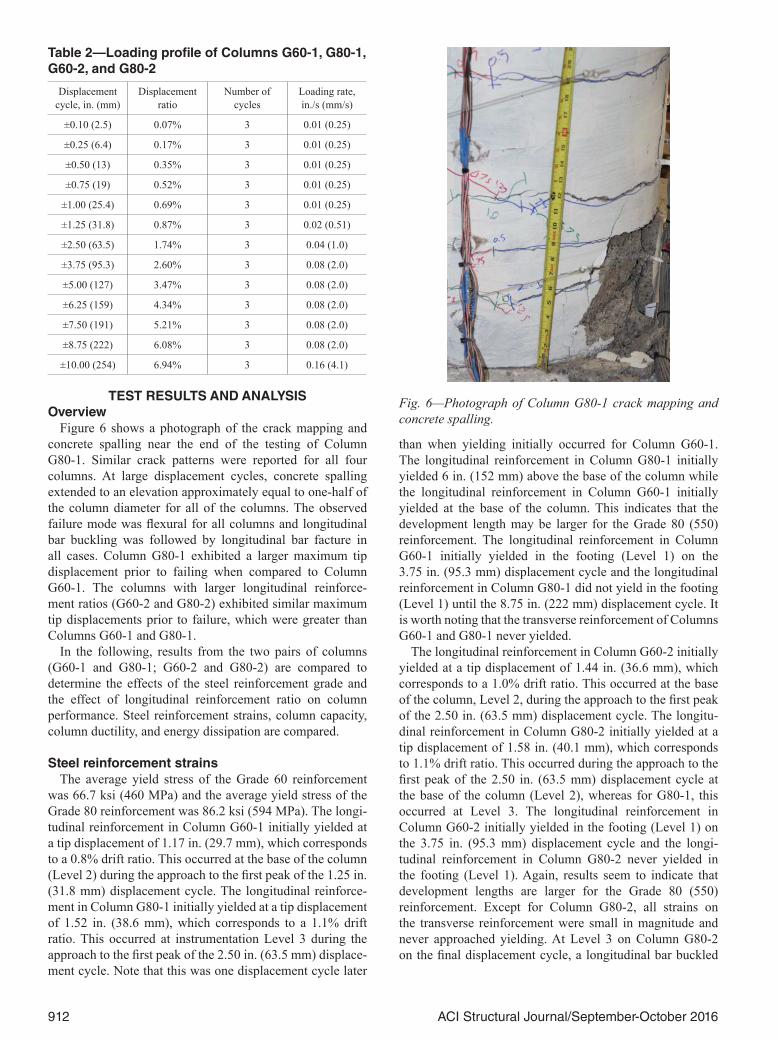
Lateral loading consisted of pushing and pulling the column (in the north-south direction) to predetermined displacement levels. Each displacement level consisted of three cycles (six peaks). Each cycle started at zero displacement, was then
displaced in the positive direction (north, away from the strong wall [push]) toward the positive peak displacement, was then displaced in the negative direction (south, toward the strong wall [pull]) to the negative peak displacement, and finally returned back to zero displacement. This process was repeated three times for each predetermined displace-ment cycle. Figure 5 shows the loading profile and Table 2 shows the displacement cycles and loading rates for each displacement cycle.
To characterize the material properties of the concrete and steel reinforcement, several material tests were performed. For the concrete materials, compressive strength tests (ASTM C39), splitting tensile strength tests (ASTM C496), modulus-of-elasticity tests (ASTM C469), and modulus-of- rupture tests (ASTM C78) were performed. Concrete samples were made and cured following ASTM C31 spec-ifications. For the steel reinforcement, strength and strain parameters were obtained from tension tests performed using a 110 kip (500 kN) universal testing machine and extensom-eter following ASTM E8, E83, and A370 specifications.
Fig. 3—Columns G60-1, G80-1, G60-2, and G80-2 external instrumentation. (Note: NTS = not to scale.)
Fig. 4—Photograph of test setup.
Fig. 5—Loading profile of Columns G60-1, G80-1, G60-2, and G80-2.
912 ACI Structural Journal/September-October 2016
TEST RESULTS AND ANALYSISOverview
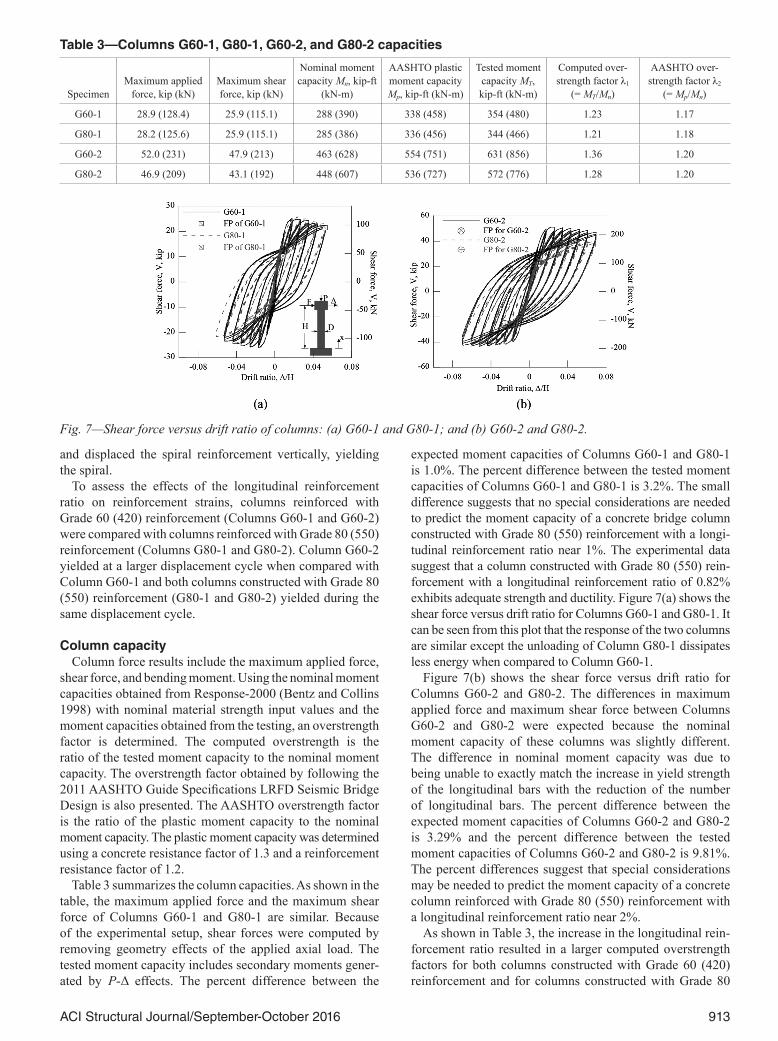
Figure 6 shows a photograph of the crack mapping and concrete spalling near the end of the testing of Column G80-1. Similar crack patterns were reported for all four columns. At large displacement cycles, concrete spalling extended to an elevation approximately equal to one-half of the column diameter for all of the columns. The observed failure mode was flexural for all columns and longitudinal bar buckling was followed by longitudinal bar facture in all cases. Column G80-1 exhibited a larger maximum tip displacement prior to failing when compared to Column G60-1. The columns with larger longitudinal reinforce-ment ratios (G60-2 and G80-2) exhibited similar maximum tip displacements prior to failure, which were greater than Columns G60-1 and G80-1.
In the following, results from the two pairs of columns (G60-1 and G80-1; G60-2 and G80-2) are compared to determine the effects of the steel reinforcement grade and the effect of longitudinal reinforcement ratio on column performance. Steel reinforcement strains, column capacity, column ductility, and energy dissipation are compared.
Steel reinforcement strainsThe average yield stress of the Grade 60 reinforcement
was 66.7 ksi (460 MPa) and the average yield stress of the Grade 80 reinforcement was 86.2 ksi (594 MPa). The longi-tudinal reinforcement in Column G60-1 initially yielded at a tip displacement of 1.17 in. (29.7 mm), which corresponds to a 0.8% drift ratio. This occurred at the base of the column (Level 2) during the approach to the first peak of the 1.25 in. (31.8 mm) displacement cycle. The longitudinal reinforce-ment in Column G80-1 initially yielded at a tip displacement of 1.52 in. (38.6 mm), which corresponds to a 1.1% drift ratio. This occurred at instrumentation Level 3 during the approach to the first peak of the 2.50 in. (63.5 mm) displace-ment cycle. Note that this was one displacement cycle later
than when yielding initially occurred for Column G60-1. The longitudinal reinforcement in Column G80-1 initially yielded 6 in. (152 mm) above the base of the column while the longitudinal reinforcement in Column G60-1 initially yielded at the base of the column. This indicates that the development length may be larger for the Grade 80 (550) reinforcement. The longitudinal reinforcement in Column G60-1 initially yielded in the footing (Level 1) on the 3.75 in. (95.3 mm) displacement cycle and the longitudinal reinforcement in Column G80-1 did not yield in the footing (Level 1) until the 8.75 in. (222 mm) displacement cycle. It is worth noting that the transverse reinforcement of Columns G60-1 and G80-1 never yielded.
The longitudinal reinforcement in Column G60-2 initially yielded at a tip displacement of 1.44 in. (36.6 mm), which corresponds to a 1.0% drift ratio. This occurred at the base of the column, Level 2, during the approach to the first peak of the 2.50 in. (63.5 mm) displacement cycle. The longitu-dinal reinforcement in Column G80-2 initially yielded at a tip displacement of 1.58 in. (40.1 mm), which corresponds to 1.1% drift ratio. This occurred during the approach to the first peak of the 2.50 in. (63.5 mm) displacement cycle at the base of the column (Level 2), whereas for G80-1, this occurred at Level 3. The longitudinal reinforcement in Column G60-2 initially yielded in the footing (Level 1) on the 3.75 in. (95.3 mm) displacement cycle and the longi-tudinal reinforcement in Column G80-2 never yielded in the footing (Level 1). Again, results seem to indicate that development lengths are larger for the Grade 80 (550) reinforcement. Except for Column G80-2, all strains on the transverse reinforcement were small in magnitude and never approached yielding. At Level 3 on Column G80-2 on the final displacement cycle, a longitudinal bar buckled
Table 2—Loading profile of Columns G60-1, G80-1, G60-2, and G80-2
Displacement cycle, in. (mm)
Displacement ratio
Number of cycles
Loading rate, in./s (mm/s)
±0.10 (2.5) 0.07% 3 0.01 (0.25)
±0.25 (6.4) 0.17% 3 0.01 (0.25)
±0.50 (13) 0.35% 3 0.01 (0.25)
±0.75 (19) 0.52% 3 0.01 (0.25)
±1.00 (25.4) 0.69% 3 0.01 (0.25)
±1.25 (31.8) 0.87% 3 0.02 (0.51)
±2.50 (63.5) 1.74% 3 0.04 (1.0)
±3.75 (95.3) 2.60% 3 0.08 (2.0)
±5.00 (127) 3.47% 3 0.08 (2.0)
±6.25 (159) 4.34% 3 0.08 (2.0)
±7.50 (191) 5.21% 3 0.08 (2.0)
±8.75 (222) 6.08% 3 0.08 (2.0)
±10.00 (254) 6.94% 3 0.16 (4.1)
Fig. 6—Photograph of Column G80-1 crack mapping and concrete spalling.
913ACI Structural Journal/September-October 2016
and displaced the spiral reinforcement vertically, yielding the spiral.
To assess the effects of the longitudinal reinforcement ratio on reinforcement strains, columns reinforced with Grade 60 (420) reinforcement (Columns G60-1 and G60-2) were compared with columns reinforced with Grade 80 (550) reinforcement (Columns G80-1 and G80-2). Column G60-2 yielded at a larger displacement cycle when compared with Column G60-1 and both columns constructed with Grade 80 (550) reinforcement (G80-1 and G80-2) yielded during the same displacement cycle.
Column capacityColumn force results include the maximum applied force,
shear force, and bending moment. Using the nominal moment capacities obtained from Response-2000 (Bentz and Collins 1998) with nominal material strength input values and the moment capacities obtained from the testing, an overstrength factor is determined. The computed overstrength is the ratio of the tested moment capacity to the nominal moment capacity. The overstrength factor obtained by following the 2011 AASHTO Guide Specifications LRFD Seismic Bridge Design is also presented. The AASHTO overstrength factor is the ratio of the plastic moment capacity to the nominal moment capacity. The plastic moment capacity was determined using a concrete resistance factor of 1.3 and a reinforcement resistance factor of 1.2.
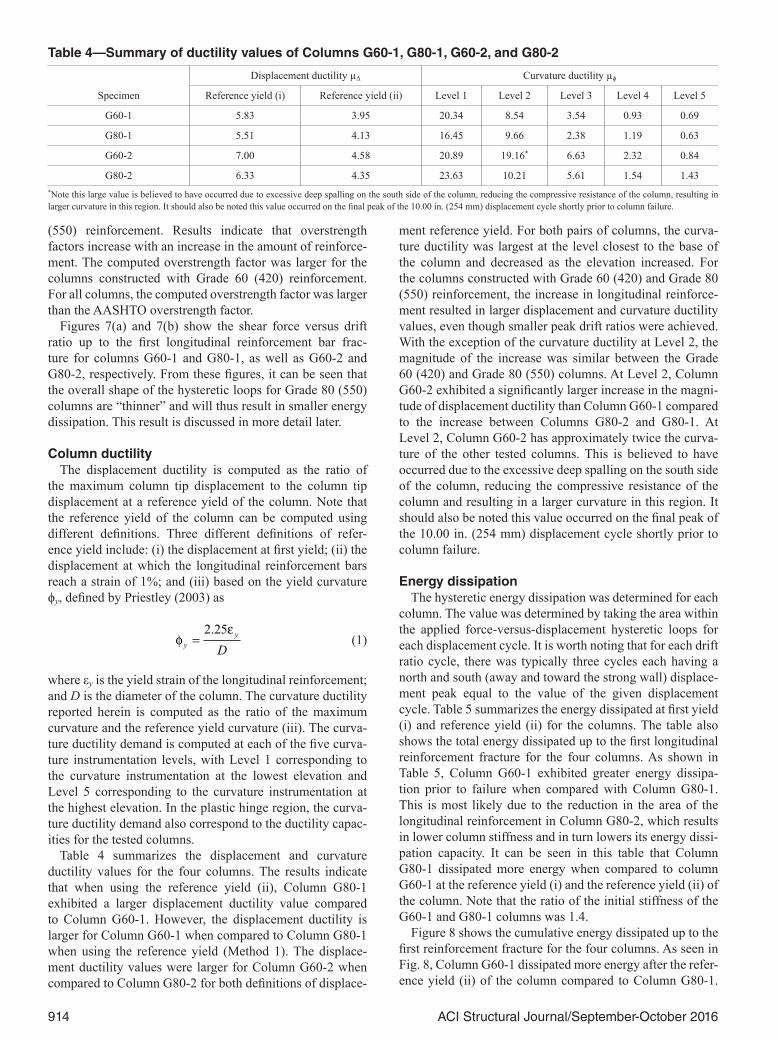
Table 3 summarizes the column capacities. As shown in the table, the maximum applied force and the maximum shear force of Columns G60-1 and G80-1 are similar. Because of the experimental setup, shear forces were computed by removing geometry effects of the applied axial load. The tested moment capacity includes secondary moments gener-ated by P-Δ effects. The percent difference between the
expected moment capacities of Columns G60-1 and G80-1 is 1.0%. The percent difference between the tested moment capacities of Columns G60-1 and G80-1 is 3.2%. The small difference suggests that no special considerations are needed to predict the moment capacity of a concrete bridge column constructed with Grade 80 (550) reinforcement with a longi-tudinal reinforcement ratio near 1%. The experimental data suggest that a column constructed with Grade 80 (550) rein-forcement with a longitudinal reinforcement ratio of 0.82% exhibits adequate strength and ductility. Figure 7(a) shows the shear force versus drift ratio for Columns G60-1 and G80-1. It can be seen from this plot that the response of the two columns are similar except the unloading of Column G80-1 dissipates less energy when compared to Column G60-1.
Figure 7(b) shows the shear force versus drift ratio for Columns G60-2 and G80-2. The differences in maximum applied force and maximum shear force between Columns G60-2 and G80-2 were expected because the nominal moment capacity of these columns was slightly different. The difference in nominal moment capacity was due to being unable to exactly match the increase in yield strength of the longitudinal bars with the reduction of the number of longitudinal bars. The percent difference between the expected moment capacities of Columns G60-2 and G80-2 is 3.29% and the percent difference between the tested moment capacities of Columns G60-2 and G80-2 is 9.81%. The percent differences suggest that special considerations may be needed to predict the moment capacity of a concrete column reinforced with Grade 80 (550) reinforcement with a longitudinal reinforcement ratio near 2%.
As shown in Table 3, the increase in the longitudinal rein-forcement ratio resulted in a larger computed overstrength factors for both columns constructed with Grade 60 (420) reinforcement and for columns constructed with Grade 80
Table 3—Columns G60-1, G80-1, G60-2, and G80-2 capacities
SpecimenMaximum applied
force, kip (kN)Maximum shear force, kip (kN)
Nominal moment capacity Mn, kip-ft
(kN-m)
AASHTO plastic moment capacity Mp, kip-ft (kN-m)
Tested moment capacity MT, kip-ft (kN-m)
Computed over-strength factor λ1
(= MT/Mn)
AASHTO over-strength factor λ2
(= Mp/Mn)
G60-1 28.9 (128.4) 25.9 (115.1) 288 (390) 338 (458) 354 (480) 1.23 1.17
G80-1 28.2 (125.6) 25.9 (115.1) 285 (386) 336 (456) 344 (466) 1.21 1.18
G60-2 52.0 (231) 47.9 (213) 463 (628) 554 (751) 631 (856) 1.36 1.20
G80-2 46.9 (209) 43.1 (192) 448 (607) 536 (727) 572 (776) 1.28 1.20
Fig. 7—Shear force versus drift ratio of columns: (a) G60-1 and G80-1; and (b) G60-2 and G80-2.
914 ACI Structural Journal/September-October 2016
(550) reinforcement. Results indicate that overstrength factors increase with an increase in the amount of reinforce-ment. The computed overstrength factor was larger for the columns constructed with Grade 60 (420) reinforcement. For all columns, the computed overstrength factor was larger than the AASHTO overstrength factor.
Figures 7(a) and 7(b) show the shear force versus drift ratio up to the first longitudinal reinforcement bar frac-ture for columns G60-1 and G80-1, as well as G60-2 and G80-2, respectively. From these figures, it can be seen that the overall shape of the hysteretic loops for Grade 80 (550) columns are “thinner” and will thus result in smaller energy dissipation. This result is discussed in more detail later.
Column ductilityThe displacement ductility is computed as the ratio of
the maximum column tip displacement to the column tip displacement at a reference yield of the column. Note that the reference yield of the column can be computed using different definitions. Three different definitions of refer-ence yield include: (i) the displacement at first yield; (ii) the displacement at which the longitudinal reinforcement bars reach a strain of 1%; and (iii) based on the yield curvature ϕy, defined by Priestley (2003) as
φε
yy
D=2 25.
(1)
where εy is the yield strain of the longitudinal reinforcement; and D is the diameter of the column. The curvature ductility reported herein is computed as the ratio of the maximum curvature and the reference yield curvature (iii). The curva-ture ductility demand is computed at each of the five curva-ture instrumentation levels, with Level 1 corresponding to the curvature instrumentation at the lowest elevation and Level 5 corresponding to the curvature instrumentation at the highest elevation. In the plastic hinge region, the curva-ture ductility demand also correspond to the ductility capac-ities for the tested columns.
Table 4 summarizes the displacement and curvature ductility values for the four columns. The results indicate that when using the reference yield (ii), Column G80-1 exhibited a larger displacement ductility value compared to Column G60-1. However, the displacement ductility is larger for Column G60-1 when compared to Column G80-1 when using the reference yield (Method 1). The displace-ment ductility values were larger for Column G60-2 when compared to Column G80-2 for both definitions of displace-
ment reference yield. For both pairs of columns, the curva-ture ductility was largest at the level closest to the base of the column and decreased as the elevation increased. For the columns constructed with Grade 60 (420) and Grade 80 (550) reinforcement, the increase in longitudinal reinforce-ment resulted in larger displacement and curvature ductility values, even though smaller peak drift ratios were achieved. With the exception of the curvature ductility at Level 2, the magnitude of the increase was similar between the Grade 60 (420) and Grade 80 (550) columns. At Level 2, Column G60-2 exhibited a significantly larger increase in the magni-tude of displacement ductility than Column G60-1 compared to the increase between Columns G80-2 and G80-1. At Level 2, Column G60-2 has approximately twice the curva-ture of the other tested columns. This is believed to have occurred due to the excessive deep spalling on the south side of the column, reducing the compressive resistance of the column and resulting in a larger curvature in this region. It should also be noted this value occurred on the final peak of the 10.00 in. (254 mm) displacement cycle shortly prior to column failure.
Energy dissipationThe hysteretic energy dissipation was determined for each
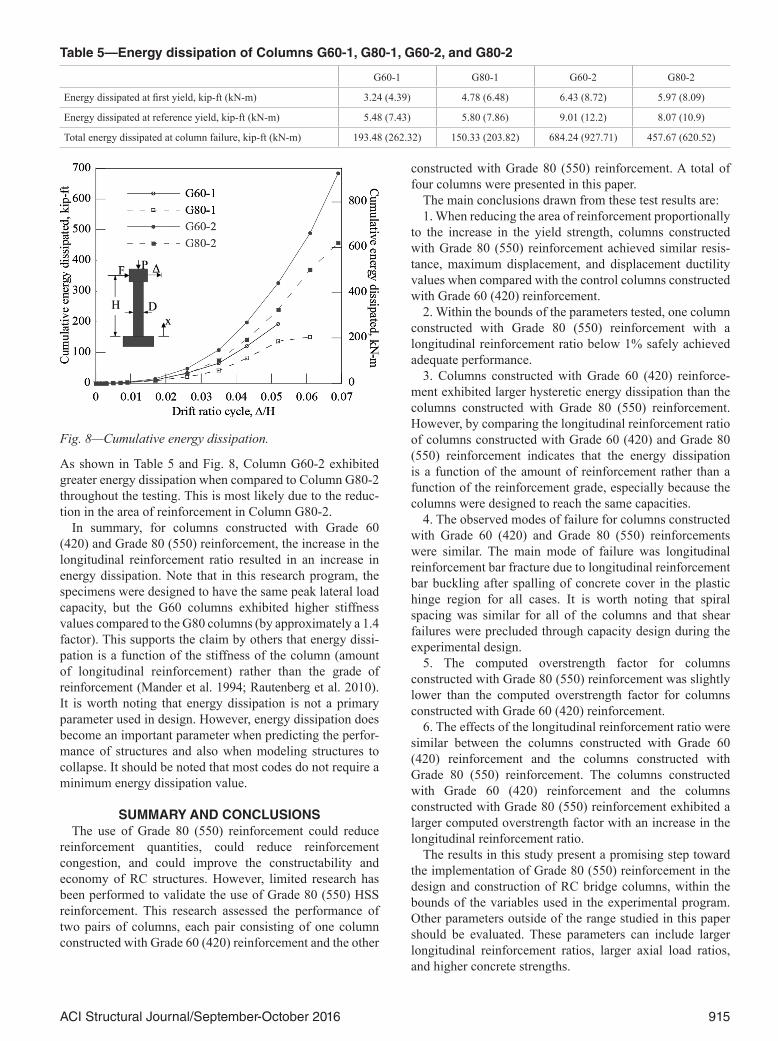
column. The value was determined by taking the area within the applied force-versus-displacement hysteretic loops for each displacement cycle. It is worth noting that for each drift ratio cycle, there was typically three cycles each having a north and south (away and toward the strong wall) displace-ment peak equal to the value of the given displacement cycle. Table 5 summarizes the energy dissipated at first yield (i) and reference yield (ii) for the columns. The table also shows the total energy dissipated up to the first longitudinal reinforcement fracture for the four columns. As shown in Table 5, Column G60-1 exhibited greater energy dissipa-tion prior to failure when compared with Column G80-1. This is most likely due to the reduction in the area of the longitudinal reinforcement in Column G80-2, which results in lower column stiffness and in turn lowers its energy dissi-pation capacity. It can be seen in this table that Column G80-1 dissipated more energy when compared to column G60-1 at the reference yield (i) and the reference yield (ii) of the column. Note that the ratio of the initial stiffness of the G60-1 and G80-1 columns was 1.4.
Figure 8 shows the cumulative energy dissipated up to the first reinforcement fracture for the four columns. As seen in Fig. 8, Column G60-1 dissipated more energy after the refer-ence yield (ii) of the column compared to Column G80-1.
Table 4—Summary of ductility values of Columns G60-1, G80-1, G60-2, and G80-2
Specimen
Displacement ductility µΔ Curvature ductility µϕ
Reference yield (i) Reference yield (ii) Level 1 Level 2 Level 3 Level 4 Level 5
G60-1 5.83 3.95 20.34 8.54 3.54 0.93 0.69
G80-1 5.51 4.13 16.45 9.66 2.38 1.19 0.63
G60-2 7.00 4.58 20.89 19.16* 6.63 2.32 0.84
G80-2 6.33 4.35 23.63 10.21 5.61 1.54 1.43*Note this large value is believed to have occurred due to excessive deep spalling on the south side of the column, reducing the compressive resistance of the column, resulting in larger curvature in this region. It should also be noted this value occurred on the final peak of the 10.00 in. (254 mm) displacement cycle shortly prior to column failure.
915ACI Structural Journal/September-October 2016
As shown in Table 5 and Fig. 8, Column G60-2 exhibited greater energy dissipation when compared to Column G80-2 throughout the testing. This is most likely due to the reduc-tion in the area of reinforcement in Column G80-2.
In summary, for columns constructed with Grade 60 (420) and Grade 80 (550) reinforcement, the increase in the longitudinal reinforcement ratio resulted in an increase in energy dissipation. Note that in this research program, the specimens were designed to have the same peak lateral load capacity, but the G60 columns exhibited higher stiffness values compared to the G80 columns (by approximately a 1.4 factor). This supports the claim by others that energy dissi-pation is a function of the stiffness of the column (amount of longitudinal reinforcement) rather than the grade of reinforcement (Mander et al. 1994; Rautenberg et al. 2010). It is worth noting that energy dissipation is not a primary parameter used in design. However, energy dissipation does become an important parameter when predicting the perfor-mance of structures and also when modeling structures to collapse. It should be noted that most codes do not require a minimum energy dissipation value.
SUMMARY AND CONCLUSIONSThe use of Grade 80 (550) reinforcement could reduce
reinforcement quantities, could reduce reinforcement congestion, and could improve the constructability and economy of RC structures. However, limited research has been performed to validate the use of Grade 80 (550) HSS reinforcement. This research assessed the performance of two pairs of columns, each pair consisting of one column constructed with Grade 60 (420) reinforcement and the other
constructed with Grade 80 (550) reinforcement. A total of four columns were presented in this paper.
The main conclusions drawn from these test results are:1. When reducing the area of reinforcement proportionally
to the increase in the yield strength, columns constructed with Grade 80 (550) reinforcement achieved similar resis-tance, maximum displacement, and displacement ductility values when compared with the control columns constructed with Grade 60 (420) reinforcement.
2. Within the bounds of the parameters tested, one column constructed with Grade 80 (550) reinforcement with a longitudinal reinforcement ratio below 1% safely achieved adequate performance.
3. Columns constructed with Grade 60 (420) reinforce-ment exhibited larger hysteretic energy dissipation than the columns constructed with Grade 80 (550) reinforcement. However, by comparing the longitudinal reinforcement ratio of columns constructed with Grade 60 (420) and Grade 80 (550) reinforcement indicates that the energy dissipation is a function of the amount of reinforcement rather than a function of the reinforcement grade, especially because the columns were designed to reach the same capacities.
4. The observed modes of failure for columns constructed with Grade 60 (420) and Grade 80 (550) reinforcements were similar. The main mode of failure was longitudinal reinforcement bar fracture due to longitudinal reinforcement bar buckling after spalling of concrete cover in the plastic hinge region for all cases. It is worth noting that spiral spacing was similar for all of the columns and that shear failures were precluded through capacity design during the experimental design.
5. The computed overstrength factor for columns constructed with Grade 80 (550) reinforcement was slightly lower than the computed overstrength factor for columns constructed with Grade 60 (420) reinforcement.
6. The effects of the longitudinal reinforcement ratio were similar between the columns constructed with Grade 60 (420) reinforcement and the columns constructed with Grade 80 (550) reinforcement. The columns constructed with Grade 60 (420) reinforcement and the columns constructed with Grade 80 (550) reinforcement exhibited a larger computed overstrength factor with an increase in the longitudinal reinforcement ratio.
The results in this study present a promising step toward the implementation of Grade 80 (550) reinforcement in the design and construction of RC bridge columns, within the bounds of the variables used in the experimental program. Other parameters outside of the range studied in this paper should be evaluated. These parameters can include larger longitudinal reinforcement ratios, larger axial load ratios, and higher concrete strengths.
Table 5—Energy dissipation of Columns G60-1, G80-1, G60-2, and G80-2
G60-1 G80-1 G60-2 G80-2
Energy dissipated at first yield, kip-ft (kN-m) 3.24 (4.39) 4.78 (6.48) 6.43 (8.72) 5.97 (8.09)
Energy dissipated at reference yield, kip-ft (kN-m) 5.48 (7.43) 5.80 (7.86) 9.01 (12.2) 8.07 (10.9)
Total energy dissipated at column failure, kip-ft (kN-m) 193.48 (262.32) 150.33 (203.82) 684.24 (927.71) 457.67 (620.52)
Fig. 8—Cumulative energy dissipation.
916 ACI Structural Journal/September-October 2016
AUTHOR BIOSDavid Trejo, FACI, is a Professor and the Hal Pritchett Endowed Chair in the School of Civil and Construction Engineering at Oregon State University, Corvallis, OR. He is Chair of ACI Committee 222, Corrosion of Metals in Concrete, and a member of ACI Committees 201, Durability of Concrete; 236, Materials Science of Concrete; and 365, Service Life Prediction. His research interests include durability and performance issues of reinforced concrete systems, corrosion of steel in cementitious materials, service-life analyses, innovative concrete materials for improved construction, and modeling deterioration mechanisms.
ACI member Tim B. Link is a Bridge Engineer at David Evans and Asso-ciates, Portland, OR. He received his BS in civil engineering from Oregon State University. His research interests include the use of innovative materials for improving the economy and performance of reinforced concrete systems.
ACI member André R. Barbosa is an Assistant Professor in the School of Civil and Construction Engineering at Oregon State University. He received his licenciature in civil engineering and MS in structural engi-neering from Instituto Superior Técnico (IST), Lisboa, Portugal, and his PhD in structural engineering from the University of California San Diego, San Diego, CA. His research interests include testing of innovative struc-tural materials and structures, performance-based multi-hazard assessment and design, and reliability of structures.
ACKNOWLEDGMENTSThe authors would first like to acknowledge the Oregon Department
of Transportation and the Pacific Northwest Transportation Consortium for providing funding for this research project. The assistance of M. Dyson, J. Batti, M. Dietrich, and the many students who participated in the research is acknowledged. The authors especially thank T. Murphy and D. Lauber from Cascade Steel (McMinnville, OR) for producing a special heat of Grade 80 (550) reinforcement.
REFERENCESAASHTO, 2014, AASHTO LRFD Bridge Design Specifications, Amer-
ican Association of State Highway and Transportation Officials, Wash-ington, DC.
ASTM A370/A370M-14, 2014, “Standard Test Methods and Defini-tions for Mechanical Testing of Steel Products,” ASTM International, West Conshohocken, PA, 50 pp.
ASTM C39/C39M-12, 2012, “Standard Test Method for Compressive Strength of Cylindrical Concrete Specimens,” ASTM International, West Conshohocken, PA, 7 pp.
ASTM C78/C78M-10, 2010, “Standard Test Method for Flexural Strength of Concrete (Using Simple Beam with Third-Point Loading),” ASTM International, West Conshohocken, PA, 4 pp.
ASTM C469/C469M-14, 2014, “Standard Test Method for Static Modulus of Elasticity and Poisson’s Ratio of Concrete in Compression,” ASTM International, West Conshohocken, PA, 5 pp.
ASTM C496/C496M-11, 2011, “Standard Test Method for Splitting Tensile Strength of Cylindrical Concrete Specimens,” ASTM International, West Conshohocken, PA, 5 pp.
ASTM E8/E8M-13, 2013, “Standard Test Methods for Tension Testing of Metallic Materials,” ASTM International, West Conshohocken, PA, 28 pp.
ASTM E83/E83M-10, 2010, “Standard Practice for Verification and Classification of Extensometer Systems,” ASTM International, West Conshohocken, PA, 15 pp.
Bentz, E. C., and Collins, M. P., 1998, RESPONSE-2000: Reinforced Concrete Sectional Analysis Using the Modified Compression Field Theory.
Concrete Reinforcing Steel Institute, 2001, “Evaluation of Reinforcing Bars in Old Reinforced Concrete Structures,” Engineering Data Report 48, 4 pp.
Gustafson, D. P., 2010, “Raising the Grade,” Concrete International, V. 32, No. 4, Apr., pp. 59-62.
Mander, J.; Panthaki, F.; and Kasalanati, A., 1994, “Low Cycle Fatigue Behavior of Reinforcing Steel,” Journal of Materials in Civil Engineering, ASCE, V. 6, No. 4, pp. 453-468. doi: 10.1061/(ASCE)0899-1561(1994)6:4(453)
Priestley, M. J. N., 2003, Myths and Fallacies in Earthquake Engi-neering, Revisited, IUSS Press, Pavia, Italy, 98 pp.
Priestley, M. J. N., and Benzoni, G., 1996, “Seismic Performance of Circular Columns with Low Longitudinal Reinforcement Ratios,” ACI Structural Journal, V. 93, No. 4, July-Aug., pp. 474-485.
Rautenberg, J. M.; Pujol, S.; and Lepage, A., 2010, “Cyclic Response of Concrete Columns Reinforced with High-Strength Steel.” 9th US National and 10th Canadian Conference on Earthquake Engineering 2010, Including Papers from the 4th International Tsunami Symposium 3 (July). http://nees.org/resources/679/download/2010EQConf-000996.PDF.
Rice, P., and Gustafson, D., 1976, “Grade 80 Reinforcing Bars and ACI 318-71,” ACI Journal Proceedings, V. 73, No. 4, Apr., pp. 199-206.
Risser, R., and Hoffman, M., 2014, “Turning Billets into Bars,” Concrete Construction, http://www.concreteconstruction.net/rebar/turning-billets-in-to-bars.aspx.
Rodriguez, M.; Botero, J.; and Villa, J., 1999, “Cyclic Stress-Strain Behavior of Reinforcing Steel Including Effect of Buckling,” Journal of Structural Engineering, ASCE, V. 125, No. 6, pp. 605-612. doi: 10.1061/(ASCE)0733-9445(1999)125:6(605)
Trejo, D.; Barbosa, A.; and Link, T., 2014, Seismic Performance of Circular Reinforced Concrete Bridge Columns Constructed with Grade 80 Reinforce-ment, Research SRS 500-610, Oregon State University, Corvallis, OR.
Yeh, I.-C., 2006, “Generalization of Strength versus Water-Cementitious Ratio Relationship to Age,” Cement and Concrete Research, V. 36, No. 10, pp. 1865-1873. doi: 10.1016/j.cemconres.2006.05.013