effect of salinity and ph on growth, phycoerythrin, and
TRANSCRIPT

Vol.:(0123456789)1 3
https://doi.org/10.1007/s10811-021-02547-4
Effect of salinity and pH on growth, phycoerythrin, and non‑volatile umami taste active compound concentration of Rhodomonas salina using a D‑optimal design approach
Christos Latsos1 · Georgios Bakratsas1 · Tanja Moerdijk1 · Jasper van Houcke1 · Klaas R. Timmermans1,2
Received: 14 April 2021 / Revised and accepted 16 June 2021 © The Author(s) 2021
AbstractThe cryptophyte Rhodomonas salina is widely used in aquaculture due to its high nutritional profile. This study aims to investigate the effect of salinity and pH on the growth, phycoerythrin concentrations, and concentrations of non-volatile umami taste active compounds of R. salina, using a design of experiment approach. Rhodomonas salina was cultivated in a flat-panel photobioreactor in turbidostat mode in a range of salinity (20–40 ‰) and pH (6.5–8.5). The strain was able to grow steadily under all conditions, but the optimal productivity of 1.17 g dry weight L−1 day−1 was observed in salinity 30 ‰ and pH 7.5. The phycoerythrin concentration was inversely related to productivity, presenting higher values in conditions that were not optimal for the growth of R. salina, 7% of dry weight at salinity 40 ‰, and pH 8.5. The identification of the umami taste of R. salina was based on the synergistic effect of umami compounds 5′-nucleotides (adenosine 5′-monophos-phate, guanosine 5′-monophosphate, inosine 5′-monophosphate) and free amino acids (glutamic and aspartic acids), using the equivalent umami concentration (EUC). The results indicated that an increase in pH induces the accumulation of 5′-nucleotides, resulting in an EUC of 234 mg MSG g−1 at a salinity of 40 and pH 8.5. The EUC values that were observed in R. salina were higher compared to other aquatic animals, a fact that makes R. salina promising for further research and application in the food and feed sectors.
Keywords Cryptophyceae · Microalgae production · Biomass productivity · Photobioreactors · Free amino acid · Umami taste
Introduction
Marine microalgae have a wide range of commercial and indus-trial applications (Spolaore et al. 2006; Chu 2013; Khatoon and Pal 2015). They have been introduced to the human diet for thousands of years and have been utilised as high-value food (Borowitzka 1998; Varfolomeev and Wasserman 2011; Hudek et al. 2014). In the last 20 years, the most dominant microalgae in food and nutraceutical applications are Spirulina, Chlorella, Dunaliella, and Haematococcus due to their biochemical
characteristics and nutritional benefits (Bishop and Zubeck 2012; Koyande et al. 2019).
Except for the biochemical composition, the flavour is also an important criterion for the use of microalgae in the food sector. Free amino acids (FAAs) are associated with the characteristic taste of marine food. FAAs contribute to different degrees to the five primary tastes of food (sweet-ness, sourness, saltiness, bitterness, and umami) according to their side chains (Shallenberger 1993; Kawai et al. 2002). Alanine and glycine, for example, have a pleasant sweet taste and significant umami enhancement. It is reported that the sweet taste of lobster and crab is mainly influenced by gly-cine, while the characteristic taste of sea urchin is due to methionine (Nishimura and Kato 2009). The biochemical composition and sensory characteristics of oysters are attrib-uted to the dietary composition, indicating that the flavour characteristics of algae can be carried through to the fed organism (van Houcke et al. 2017).
* Christos Latsos [email protected]
1 HZ University of Applied Sciences, P.O. Box 364, 4380 AJ Vlissingen, The Netherlands
2 Department of Estuarine and Delta Systems, Netherlands Institute for Sea Research (NIOZ), P.O. Box 140, Royal 4400 AC Yerseke, The Netherlands
/ Published online: 21 July 2021
Journal of Applied Phycology (2021) 33:3591–3602
1 3
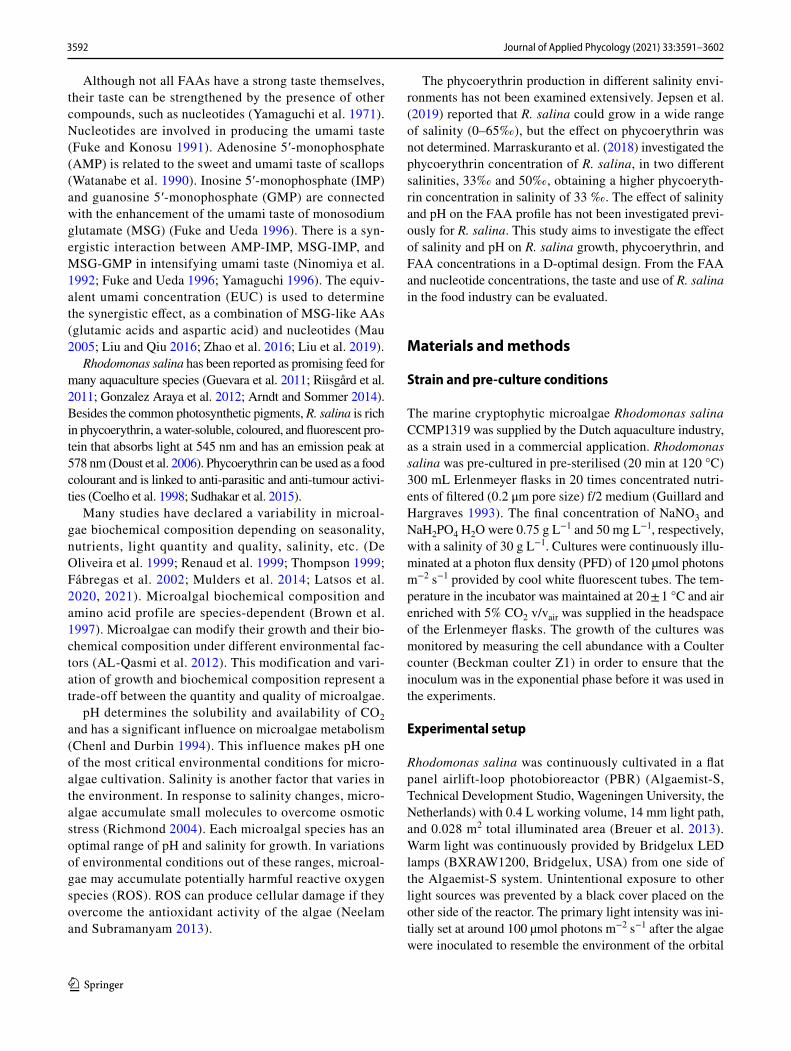
Although not all FAAs have a strong taste themselves, their taste can be strengthened by the presence of other compounds, such as nucleotides (Yamaguchi et al. 1971). Nucleotides are involved in producing the umami taste (Fuke and Konosu 1991). Adenosine 5′-monophosphate (AMP) is related to the sweet and umami taste of scallops (Watanabe et al. 1990). Inosine 5′-monophosphate (IMP) and guanosine 5′-monophosphate (GMP) are connected with the enhancement of the umami taste of monosodium glutamate (MSG) (Fuke and Ueda 1996). There is a syn-ergistic interaction between AMP-IMP, MSG-IMP, and MSG-GMP in intensifying umami taste (Ninomiya et al. 1992; Fuke and Ueda 1996; Yamaguchi 1996). The equiv-alent umami concentration (EUC) is used to determine the synergistic effect, as a combination of MSG-like AAs (glutamic acids and aspartic acid) and nucleotides (Mau 2005; Liu and Qiu 2016; Zhao et al. 2016; Liu et al. 2019).
Rhodomonas salina has been reported as promising feed for many aquaculture species (Guevara et al. 2011; Riisgård et al. 2011; Gonzalez Araya et al. 2012; Arndt and Sommer 2014). Besides the common photosynthetic pigments, R. salina is rich in phycoerythrin, a water-soluble, coloured, and fluorescent pro-tein that absorbs light at 545 nm and has an emission peak at 578 nm (Doust et al. 2006). Phycoerythrin can be used as a food colourant and is linked to anti-parasitic and anti-tumour activi-ties (Coelho et al. 1998; Sudhakar et al. 2015).
Many studies have declared a variability in microal-gae biochemical composition depending on seasonality, nutrients, light quantity and quality, salinity, etc. (De Oliveira et al. 1999; Renaud et al. 1999; Thompson 1999; Fábregas et al. 2002; Mulders et al. 2014; Latsos et al. 2020, 2021). Microalgal biochemical composition and amino acid profile are species-dependent (Brown et al. 1997). Microalgae can modify their growth and their bio-chemical composition under different environmental fac-tors (AL-Qasmi et al. 2012). This modification and vari-ation of growth and biochemical composition represent a trade-off between the quantity and quality of microalgae.
pH determines the solubility and availability of CO2 and has a significant influence on microalgae metabolism (Chenl and Durbin 1994). This influence makes pH one of the most critical environmental conditions for micro-algae cultivation. Salinity is another factor that varies in the environment. In response to salinity changes, micro-algae accumulate small molecules to overcome osmotic stress (Richmond 2004). Each microalgal species has an optimal range of pH and salinity for growth. In variations of environmental conditions out of these ranges, microal-gae may accumulate potentially harmful reactive oxygen species (ROS). ROS can produce cellular damage if they overcome the antioxidant activity of the algae (Neelam and Subramanyam 2013).
The phycoerythrin production in different salinity envi-ronments has not been examined extensively. Jepsen et al. (2019) reported that R. salina could grow in a wide range of salinity (0–65‰), but the effect on phycoerythrin was not determined. Marraskuranto et al. (2018) investigated the phycoerythrin concentration of R. salina, in two different salinities, 33‰ and 50‰, obtaining a higher phycoeryth-rin concentration in salinity of 33 ‰. The effect of salinity and pH on the FAA profile has not been investigated previ-ously for R. salina. This study aims to investigate the effect of salinity and pH on R. salina growth, phycoerythrin, and FAA concentrations in a D-optimal design. From the FAA and nucleotide concentrations, the taste and use of R. salina in the food industry can be evaluated.
Materials and methods
Strain and pre‑culture conditions
The marine cryptophytic microalgae Rhodomonas salina CCMP1319 was supplied by the Dutch aquaculture industry, as a strain used in a commercial application. Rhodomonas salina was pre-cultured in pre-sterilised (20 min at 120 °C) 300 mL Erlenmeyer flasks in 20 times concentrated nutri-ents of filtered (0.2 μm pore size) f/2 medium (Guillard and Hargraves 1993). The final concentration of NaNO3 and NaH2PO4 H2O were 0.75 g L−1 and 50 mg L−1, respectively, with a salinity of 30 g L−1. Cultures were continuously illu-minated at a photon flux density (PFD) of 120 µmol photons m−2 s−1 provided by cool white fluorescent tubes. The tem-perature in the incubator was maintained at 20 ± 1 °C and air enriched with 5% CO2 v/vair was supplied in the headspace of the Erlenmeyer flasks. The growth of the cultures was monitored by measuring the cell abundance with a Coulter counter (Beckman coulter Z1) in order to ensure that the inoculum was in the exponential phase before it was used in the experiments.
Experimental setup
Rhodomonas salina was continuously cultivated in a flat panel airlift-loop photobioreactor (PBR) (Algaemist-S, Technical Development Studio, Wageningen University, the Netherlands) with 0.4 L working volume, 14 mm light path, and 0.028 m2 total illuminated area (Breuer et al. 2013). Warm light was continuously provided by Bridgelux LED lamps (BXRAW1200, Bridgelux, USA) from one side of the Algaemist-S system. Unintentional exposure to other light sources was prevented by a black cover placed on the other side of the reactor. The primary light intensity was ini-tially set at around 100 µmol photons m−2 s−1 after the algae were inoculated to resemble the environment of the orbital
3592 Journal of Applied Phycology (2021) 33:3591–3602

1 3
incubator where the algae grew in the pre-culture phase. Then, the light intensity was raised gradually to 300 µmol photons m−2 s−1, which is reported as non-limiting for R. salina (Vu et al. 2016). The temperature was maintained at 22 °C using a water jacket, attached to the culture compart-ment of the photobioreactor. Turbidostat mode was applied to ensure stable outgoing light at the rear of the reactor of 15 μmol photons m−2 s−1, by diluting the reactor with 20 times concentrated f/2 medium filtered through a 0.2-μm pore filter. pH was maintained constant by mixing CO2 with the airflow on demand. The CO2 levels in the water were not measured.
Design of experiment
A D-optimal design of experiment (DoE) approach, created by Design Expert 11 software (StatEase, USA), was fol-lowed, with salinity (20–40 ‰) and pH (6.5–8.5) as factors. A D-optimality was selected to produce a design that best estimates the effect of the factors and is particularly suited for screening studies. Six lack-of-fit points were added to make the design more robust. The centre point, in which the input factors are set in the middle of the highest and low-est values, was performed in triplicate. By performing the centre point in triplicates, the accuracy and reproducibility of the experiments are increased. This approach resulted in 15 experiments, which are illustrated in Table 1.
Culture measurements
Samples were taken from the PBR on a daily basis and were analysed for basic culture characteristics. Optical density was measured at 750 nm (OD750nm), from which biomass concentration (Cx) was calculated (Supplementary data). Cell density and volume was measured in Coulter Coun-ter (Multisizer 3, Beckman Coulter, USA) in the size range 7–14 μm. The growth rate (μ) was calculated when the PBR was running in turbidostat mode as the dilution rate (D) according to Eq. (1), where VH is the harvested volume in a Δt period of time and VR the reactor volume:
The biomass production rate (rx) for the turbidostat mode was calculated from the growth rate and the biomass con-centration (Cx, Eq. (2)):
The biomass production rate and the absorbed light (ΔIph = Iph,in-Iph,out) were used for the calculation of biomass yield on light (Yx,ph) (Eq. (3)). Yx,ph is defined as the biomass concentration that can be produced over a mol of photons:
(1)� = D =
VH
Δt
VR
(2)rx = � × Cx
Tabl
e 1
Exp
erim
enta
l con
ditio
ns a
nd re
sults
of t
he D
oE o
n th
e gr
owth
of R
hodo
mon
as s
alin
a. A
ll da
ta a
re e
xpre
ssed
as
the
aver
age
of a
ser
ies
(n =
5) o
f dai
ly m
easu
rem
ents
whe
n th
e re
acto
r w
as in
a st
eady
stat
e. T
he st
anda
rd d
evia
tion
was
less
than
10%
pH6.
57.
58.
5
Salin
ity‰
2025
3035
4020
2530
3030
3520
2530
40
Bio
mas
s con
cent
ratio
ng
dry
wei
ght L
−1
0.96
1.18
1.29
1.28
1.24
1.25
1.30
1.24
1.34
1.33
1.21
1.00
1.01
1.13
1.11
Gro
wth
rate
day−
10.
730.
850.
840.
670.
600.
610.
860.
820.
770.
880.
760.
500.
780.
580.
52Pr
oduc
tivity
g dr
y w
eigh
t L−
1 day
−1
0.70
0.99
1.05
0.85
0.74
0.76
1.12
1.01
1.04
1.17
0.91
0.50
0.97
0.62
0.58
Bio
mas
s yie
ld o
n lig
htg
dry
wei
ght m
ol−
1 pho
tons
0.39
0.54
0.57
0.47
0.40
0.41
0.60
0.57
0.56
0.62
0.48
0.27
0.52
0.35
0.31
Phyc
oery
thrin
% o
f dry
wei
ght
6.31
6.07
4.73
4.99
6.17
6.00
4.22
3.50
3.91
4.09
4.25
5.99
5.98
5.56
6.99
3593Journal of Applied Phycology (2021) 33:3591–3602
1 3
Cellular composition
Phycoerythrin concentration
Samples of each experiment were taken for phycoerythrin determination when the culture was in a steady state. The phycobilin pigments were extracted in phosphate buffer by a freeze-thawing process, centrifuged (10 min at 1153 g), and analysed using UV–VIS spectroscopy according to Bennett and Bogorad (1973; Lawrenz et al. 2011). Absorbance at 545 nm was used after scatter corrected by subtracting the absorbance at 750 nm. Phycoerythrin was calculated in μg L−1 according to Eq. (4):
where ε is the molar extinction coefficient of phycoerythrin (2.41 × 10⁶ L mol−1 cm−1), MW is the molecular weight of phycoerythrin (240,000 g mol−1), d is the path length in cm, and Vsample and Vbuffer are the volumes of the sample and the buffer, respectively.
FAA and nucleotides
When the PBR was in steady-state, 50 mL of culture was sampled and concentrated by centrifuging at 1153 xg for 15 min. The supernatant was discarded and 50 mL of ammo-nium formate (0.5 M) was added to rinse out the salt and to prevent osmotic shock. This rinsing was repeated twice. Then, the biomass was lyophilised and stored at − 20 °C before the FAA and nucleotide analysis. FAA and nucleo-tides were extracted and analysed according to Moerdijk-Poortvliet et al. (under review for Food Chemistry). In brief, 15 mg of biomass and 5 mL Milli-Q were homogenised and extracted for 15 min at 35 °C followed by centrifugation (3000 rpm, 20 min). The supernatant was taken and an acid precipitation step was performed to remove contaminants. For FAA, an additional purification step was performed using DOWEX 50WX8 cation exchange resin. FAA and nucleotide samples were analysed by means of high-per-formance liquid chromatography (HPLC) using a DIONEX Ultimate 3000 HPLC system. For FAA analysis, the HPLC was equipped with an Agilent InfinityLab Poroshell 120 HPH-C18 column (100 × 4.6 mm; 2.7 µm, matching guard column (5 × 4.6 mm; 2.7 µm), and a fluorescence detec-tor (FLD 3100)). For nucleotide analysis, the HPLC was equipped with a SIELC PrimeSep D mixed-mode column
(3)Yx,ph =rx
ΔIph
(4)PE =A
�d×MW ×
Vsample
Vbuffer
× 106
(150 × 4.6 mm; 5 µm) with a corresponding guard column (10 × 4.6 mm; 5 µm) and an ultraviolet detector (DAD 3000).
Equivalent umami concentration
The umami estimation can be determined based on the con-centration of monosodium glutamate (mg MSG g−1), which is equivalent to the umami intensity. The synergy effect between the mixture MSG-like AAs and 5′-nucleotides is represented by Eq. (5) (Yamaguchi et al. 1971):
where Y is the EUC (mg MSG g−1); ai is the concentration (mg g−1) of each umami AA (aspartic or glutamic acid); aj is the concentration (mg g−1) of each umami 5′-nucleotide (IMP, GMP, or AMP); bi is the relative umami concentration (RUC) for each umami AA to MSG (1 for glutamic acid, and 0.077 for aspartic acid); and bj is the RUC for each umami 5′-nucleotide to IMP (1 for IMP, 2.3 for GMP, and 0.18 for AMP). A total of 12.18 is the synergistic constant based on the concentration of mg g−1 used.
Data analysis and statistics
All data measurements are shown as average (± SD) of 5 daily measurements when the reactor was in a steady-state (stable dilution rate). Data were tested for normal distribu-tion (Kolmogorov-Smirnoff goodness of fit test). For the growth rate, productivity, biomass yield on light, and PE data, different models were able to fit the data. The quad-ratic model was chosen, because this model was adding the most significant explanation of the data compared to the other models (lowest sequential p-value, highest lack of fit p-value), with an ANOVA test to imply the significance of the model. The quadratic model looks to second-order terms in addition to the linear blending model. Statistical analysis was performed using SPSS 25.0 statistical package (SPSS Inc, USA) and Design Expert 11 software (StatEase, USA).
Results
Growth rate, biomass concentration, productivity, and yield on light
The growth rate of R. salina was affected more by the pH (p = 0.038) than by salinity. The highest observed growth rate was 0.88 day−1 at one of the triplicates of the centre point of D-optimal design (30 ‰ and 7.5 pH). The cen-tre point of the D-optimal design was reproducible with a biomass concentration of 1.3 ± 0.04 g L−1, a growth rate of 0.82 ± 0.04 day−1, a biomass productivity of 1.07 ± 0.07 g
(5)Y =∑
aibi + 12.18(∑
aibi)(∑
ajbj)
3594 Journal of Applied Phycology (2021) 33:3591–3602

1 3
L−1 day−1, and a biomass yield on light of 0.58 ± 0.03 g mol photon−1. The maximum growth rate was predicted by the model in 28.2 ‰ and 6.9 pH, equal to 0.85 day−1 (p = 0.0084, Fig. 1A). Above 7.5 pH, the growth rate was reduced, with an observed minimum at pH 8.5 of 0.5 day−1.
The biomass concentration was stable during each experi-ment, due to the turbidostat sensor. However, our results indicate that the biomass concentration is affected by both salinity and pH (p = 0.04). The lowest biomass concentra-tion was observed at 20 ‰ and pH 6.5, 0.96 g L−1, while the highest biomass concentration was measured in the centre point of the design (30 ‰ and 7.5 pH), 1.30 ± 0.04 g L−1. According to the model, and illustrated by Fig. 1B, the maxi-mum biomass concentration is predicted at 34.9 ‰ salinity and 7.2 pH, which is equal to 1.33 g L−1 (p = 0.009).
As a combination of growth rate and biomass concentra-tion, the biomass productivity reported the highest value in one of the centre points (30 ‰ and 7.5 pH), 1.17 g L−1 day−1. pH had a significant influence on the biomass productivity (p = 0.04), illustrating the lowest values at pH 8.5 and the edges of the salinity range, 20 and 40 ‰, 0.5, and 0.58 g L−1 day−1, respectively (Fig. 2). After taking into account all the centre points with average biomass produc-tivity of 1.07 g L−1 day−1, the model predicts maximum bio-mass productivity in 29.7 ‰ and 7.2 pH, 1.11 g L−1 day−1 (p = 0.0056).
The biomass yield on light followed the same pattern as the productivity. The biomass yield on light was significantly affected by the pH (p = 0.037), presenting higher values at 7.5 and lower at 8.5. The highest measured biomass yield on light was at pH 7.5 and salinity 30 ‰, while according to the quadratic model, the maximum biomass yield on light is pre-dicted at pH 7.2 and salinity of 29.5 ‰ (p = 0.005) (Fig. 1C).
Cellular composition
Phycoerythrin
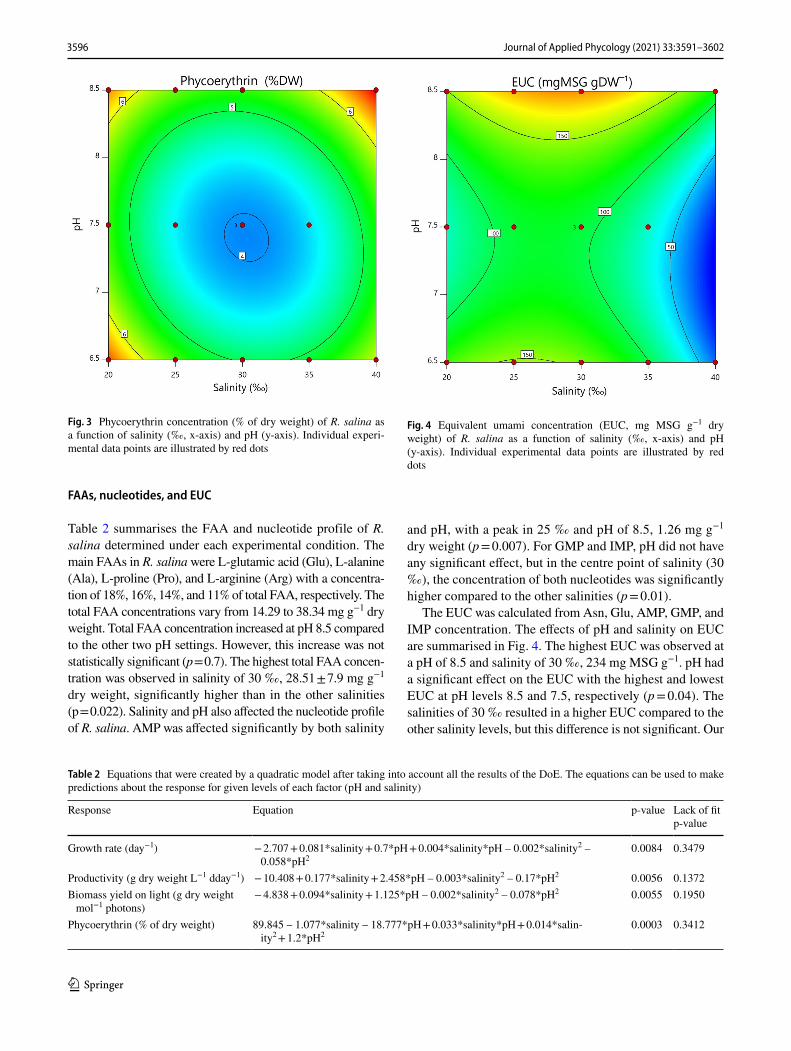
From our experimental data, the significant effect of pH and salinity on the phycoerythrin concentration of R. salina was estimated and is illustrated in Fig. 3 (p < 0.001). The highest phycoerythrin concentration was observed in salinity of 40 ‰ and pH of 8.5, with 6.99% of dry weight. The lowest concentration was detected in the triplicates of the centre point of the D-optimal design, 3.82 ± 0.27% of dry weight.
Fig. 1 Effect of salinity (‰, x-axis) and pH (y-axis) on (A) growth rate (day−1), (B) biomass concentration (g dry weight L−1 day−1), and (C) biomass yield on light (g dry weight mol−1 photons) of R. salina. Individual experimental data points are illustrated by red dots
Fig. 2 Effect of salinity (‰, x-axis) and pH (y-axis) on growth (z-axis, g dry weight L−1 day−1) of R. salina. Individual experimental data points are illustrated by red dots
3595Journal of Applied Phycology (2021) 33:3591–3602
1 3
FAAs, nucleotides, and EUC
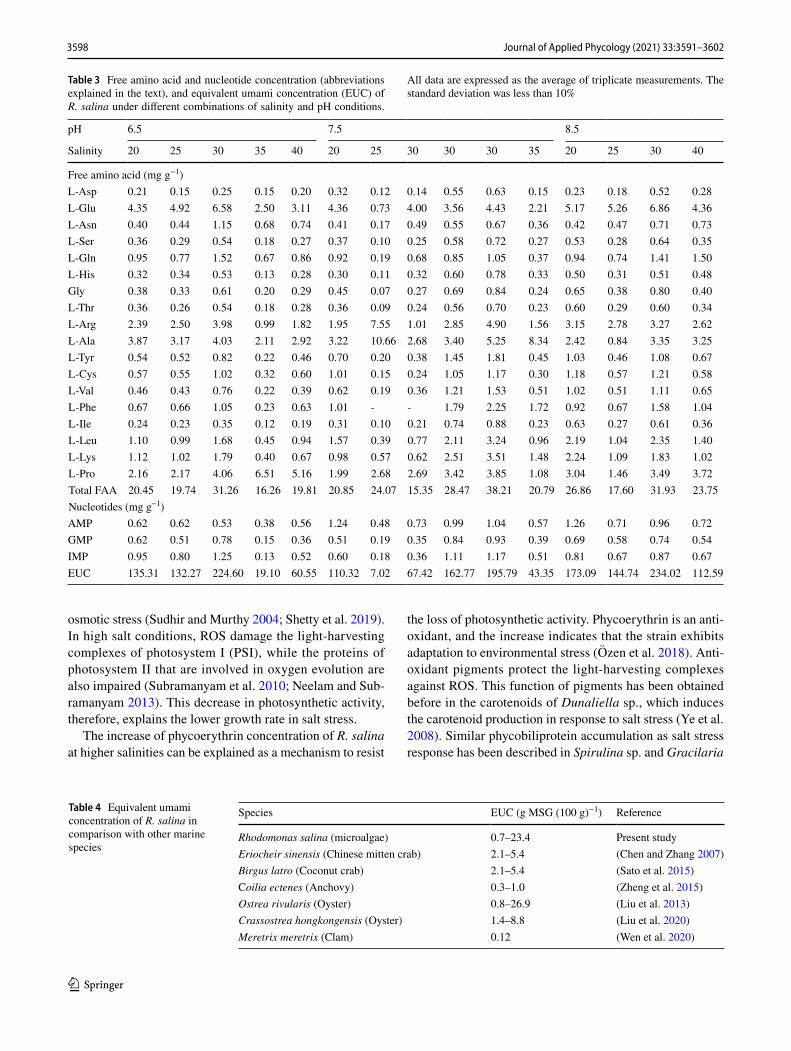
Table 2 summarises the FAA and nucleotide profile of R. salina determined under each experimental condition. The main FAAs in R. salina were L-glutamic acid (Glu), L-alanine (Ala), L-proline (Pro), and L-arginine (Arg) with a concentra-tion of 18%, 16%, 14%, and 11% of total FAA, respectively. The total FAA concentrations vary from 14.29 to 38.34 mg g−1 dry weight. Total FAA concentration increased at pH 8.5 compared to the other two pH settings. However, this increase was not statistically significant (p = 0.7). The highest total FAA concen-tration was observed in salinity of 30 ‰, 28.51 ± 7.9 mg g−1 dry weight, significantly higher than in the other salinities (p = 0.022). Salinity and pH also affected the nucleotide profile of R. salina. AMP was affected significantly by both salinity
and pH, with a peak in 25 ‰ and pH of 8.5, 1.26 mg g−1 dry weight (p = 0.007). For GMP and IMP, pH did not have any significant effect, but in the centre point of salinity (30 ‰), the concentration of both nucleotides was significantly higher compared to the other salinities (p = 0.01).
The EUC was calculated from Asn, Glu, AMP, GMP, and IMP concentration. The effects of pH and salinity on EUC are summarised in Fig. 4. The highest EUC was observed at a pH of 8.5 and salinity of 30 ‰, 234 mg MSG g−1. pH had a significant effect on the EUC with the highest and lowest EUC at pH levels 8.5 and 7.5, respectively (p = 0.04). The salinities of 30 ‰ resulted in a higher EUC compared to the other salinity levels, but this difference is not significant. Our
Fig. 3 Phycoerythrin concentration (% of dry weight) of R. salina as a function of salinity (‰, x-axis) and pH (y-axis). Individual experi-mental data points are illustrated by red dots
Table 2 Equations that were created by a quadratic model after taking into account all the results of the DoE. The equations can be used to make predictions about the response for given levels of each factor (pH and salinity)
Response Equation p-value Lack of fitp-value
Growth rate (day−1) − 2.707 + 0.081*salinity + 0.7*pH + 0.004*salinity*pH – 0.002*salinity2 – 0.058*pH2
0.0084 0.3479
Productivity (g dry weight L−1 dday−1) − 10.408 + 0.177*salinity + 2.458*pH – 0.003*salinity2 – 0.17*pH2 0.0056 0.1372Biomass yield on light (g dry weight
mol−1 photons) − 4.838 + 0.094*salinity + 1.125*pH – 0.002*salinity2 – 0.078*pH2 0.0055 0.1950
Phycoerythrin (% of dry weight) 89.845 – 1.077*salinity – 18.777*pH + 0.033*salinity*pH + 0.014*salin-ity2 + 1.2*pH2
0.0003 0.3412
Fig. 4 Equivalent umami concentration (EUC, mg MSG g−1 dry weight) of R. salina as a function of salinity (‰, x-axis) and pH (y-axis). Individual experimental data points are illustrated by red dots
3596 Journal of Applied Phycology (2021) 33:3591–3602

1 3
model predicts the maximum EUC at 31 ‰ salinity, and pH levels out of range of the design, above 9.
Discussion
This study investigated the variability in growth and bio-chemical composition of R. salina as an effect of salinity and pH. R. salina was successfully cultivated in a range of salinity and pH under continuous conditions with high productivity, > 0.5 g dry weight L−1 day−1. A clear optimal growth was observed in a combination of salinity and pH, while the slowest growth was observed at the edges of the experimental design.
Growth
Studies have reported that the growth rate of R. salina ranges between 0.75 and 1.2 day−1 (Bartual et al. 2002; Valenzuela-Espinoza 2005; Lafarga-De la Cruz et al. 2006; Jepsen et al. 2019; Yamamoto et al. 2020). However, it is noteworthy that this range of growth rate is observed in batch culture experi-ments, meaning that it is the maximum growth rate. In our study, the growth rate was determined by the dilution, hence not the maximum but the constant growth rate was studied. A limited body of literature exists on the growth of R. salina under continuous cultivation (Vu et al. 2019; Thoisen et al. 2020). These studies were performed in larger scale and the growth rate did not exceed the 0.52 day−1 in a maxi-mum cell density of 2.5 × 10⁶ cells mL−1. Oostlander et al. (2020) did demonstrate constant growth rates on R. salina in continuous flat plate photobioreactors, which were around 0.98 day−1. This value is higher than the values of our research, 0.88 day−1. This difference can be explained by the contrast in turbidity settings of our reac-tors as compared to the study of Oostlander et al. (2020). A more accurate comparison of the growth between the two studies can be performed by comparing the biomass production rate, after taking into account the biomass concentration in the reactor. The highest biomass produc-tion rate in this study was observed in a salinity of 30 ‰ and a pH of 7.5, 1.17 g L−1 day−1. Likewise, Oostlander et al. (2020), under similar light intensity, salinity and pH conditions, reported a biomass production rate of 1.04 g L−1 day−1. A previous study on continuous culti-vation of R. salina in the Algaemist-S system presented a constant maximum growth rate of 0.73 day−1 in lower light intensity of blue light (Latsos et al. 2021).
The optimum growth rate of R. salina was observed in salinity of 30 ‰. This observation is compatible with the study of Jepsen et al. (2019), which confirms the wide salinity tolerance of R. salina from 5 to 50 ‰, with a maximum growth rate of 1.13 day−1 at 29.1 ‰.
This study illustrated a significant effect of pH on the growth of R. salina. Although the strain was able to grow at the full range of pH, 6.5–8.5, our model predicted a maxi-mum growth at pH 6.9. This result is analogous to the lit-erature. For example, Berge et al. (2010) demonstrated that R. marina could tolerate wide pH fluctuations, namely, from pH 4.4 to 9.6, and maintained the maximum growth and pro-duction rate down to pH 7. In contrast, our study showed that the growth of R. salina was significantly lower at pH 8.5. This latter finding is in good agreement with the study of Hansen (2002), who demonstrated that the growth rate of R. salina significantly decreased at pH 9. The lower growth in low pH can be explained by the fact that in microalgae, low pH values increase the maintenance energy requirements, by affecting solute transport and cell membrane/wall biosyn-thesis (Kallas and Castenholz 1982). In contrast, higher pH values may inhibit the growth by limiting the availability of the pH (Chenl and Durbin 1994).
Phycoerythrin
The phycoerythrin concentration that was obtained in this study is in line with the reported values of previous litera-ture (Latsos et al. 2021). The phycoerythrin concentration was higher in conditions, which were not favourable for R. salina, with a peak in salinity of 40 ‰. An explanation for this phenomenon is illustrated in Fig. 5, where the phyco-erythrin concentration is plotted against the biomass produc-tivity of R. salina. According to Fig. 5, the phycoerythrin concentration is inversely proportional to the biomass pro-ductivity. There is extensive literature that emphasises the change of photosynthetic activity under salt stress of micro-algae. Most microalgae reduce their photosynthetic activity due to the production of reactive oxygen species (ROS) and
Fig. 5 Correlation of phycoerythrin (% of dry weight) with growth (g dry weight L−1 day−1) of R. salina
3597Journal of Applied Phycology (2021) 33:3591–3602
1 3
osmotic stress (Sudhir and Murthy 2004; Shetty et al. 2019). In high salt conditions, ROS damage the light-harvesting complexes of photosystem I (PSI), while the proteins of photosystem II that are involved in oxygen evolution are also impaired (Subramanyam et al. 2010; Neelam and Sub-ramanyam 2013). This decrease in photosynthetic activity, therefore, explains the lower growth rate in salt stress.
The increase of phycoerythrin concentration of R. salina at higher salinities can be explained as a mechanism to resist
the loss of photosynthetic activity. Phycoerythrin is an anti-oxidant, and the increase indicates that the strain exhibits adaptation to environmental stress (Özen et al. 2018). Anti-oxidant pigments protect the light-harvesting complexes against ROS. This function of pigments has been obtained before in the carotenoids of Dunaliella sp., which induces the carotenoid production in response to salt stress (Ye et al. 2008). Similar phycobiliprotein accumulation as salt stress response has been described in Spirulina sp. and Gracilaria
Table 4 Equivalent umami concentration of R. salina in comparison with other marine species
Species EUC (g MSG (100 g)−1) Reference
Rhodomonas salina (microalgae) 0.7–23.4 Present studyEriocheir sinensis (Chinese mitten crab) 2.1–5.4 (Chen and Zhang 2007)Birgus latro (Coconut crab) 2.1–5.4 (Sato et al. 2015)Coilia ectenes (Anchovy) 0.3–1.0 (Zheng et al. 2015)Ostrea rivularis (Oyster) 0.8–26.9 (Liu et al. 2013)Crassostrea hongkongensis (Oyster) 1.4–8.8 (Liu et al. 2020)Meretrix meretrix (Clam) 0.12 (Wen et al. 2020)
Table 3 Free amino acid and nucleotide concentration (abbreviations explained in the text), and equivalent umami concentration (EUC) of R. salina under different combinations of salinity and pH conditions.
All data are expressed as the average of triplicate measurements. The standard deviation was less than 10%
pH 6.5 7.5 8.5
Salinity 20 25 30 35 40 20 25 30 30 30 35 20 25 30 40
Free amino acid (mg g−1)L-Asp 0.21 0.15 0.25 0.15 0.20 0.32 0.12 0.14 0.55 0.63 0.15 0.23 0.18 0.52 0.28L-Glu 4.35 4.92 6.58 2.50 3.11 4.36 0.73 4.00 3.56 4.43 2.21 5.17 5.26 6.86 4.36L-Asn 0.40 0.44 1.15 0.68 0.74 0.41 0.17 0.49 0.55 0.67 0.36 0.42 0.47 0.71 0.73L-Ser 0.36 0.29 0.54 0.18 0.27 0.37 0.10 0.25 0.58 0.72 0.27 0.53 0.28 0.64 0.35L-Gln 0.95 0.77 1.52 0.67 0.86 0.92 0.19 0.68 0.85 1.05 0.37 0.94 0.74 1.41 1.50L-His 0.32 0.34 0.53 0.13 0.28 0.30 0.11 0.32 0.60 0.78 0.33 0.50 0.31 0.51 0.48Gly 0.38 0.33 0.61 0.20 0.29 0.45 0.07 0.27 0.69 0.84 0.24 0.65 0.38 0.80 0.40L-Thr 0.36 0.26 0.54 0.18 0.28 0.36 0.09 0.24 0.56 0.70 0.23 0.60 0.29 0.60 0.34L-Arg 2.39 2.50 3.98 0.99 1.82 1.95 7.55 1.01 2.85 4.90 1.56 3.15 2.78 3.27 2.62L-Ala 3.87 3.17 4.03 2.11 2.92 3.22 10.66 2.68 3.40 5.25 8.34 2.42 0.84 3.35 3.25L-Tyr 0.54 0.52 0.82 0.22 0.46 0.70 0.20 0.38 1.45 1.81 0.45 1.03 0.46 1.08 0.67L-Cys 0.57 0.55 1.02 0.32 0.60 1.01 0.15 0.24 1.05 1.17 0.30 1.18 0.57 1.21 0.58L-Val 0.46 0.43 0.76 0.22 0.39 0.62 0.19 0.36 1.21 1.53 0.51 1.02 0.51 1.11 0.65L-Phe 0.67 0.66 1.05 0.23 0.63 1.01 - - 1.79 2.25 1.72 0.92 0.67 1.58 1.04L-Ile 0.24 0.23 0.35 0.12 0.19 0.31 0.10 0.21 0.74 0.88 0.23 0.63 0.27 0.61 0.36L-Leu 1.10 0.99 1.68 0.45 0.94 1.57 0.39 0.77 2.11 3.24 0.96 2.19 1.04 2.35 1.40L-Lys 1.12 1.02 1.79 0.40 0.67 0.98 0.57 0.62 2.51 3.51 1.48 2.24 1.09 1.83 1.02L-Pro 2.16 2.17 4.06 6.51 5.16 1.99 2.68 2.69 3.42 3.85 1.08 3.04 1.46 3.49 3.72Total FAA 20.45 19.74 31.26 16.26 19.81 20.85 24.07 15.35 28.47 38.21 20.79 26.86 17.60 31.93 23.75Nucleotides (mg g−1)AMP 0.62 0.62 0.53 0.38 0.56 1.24 0.48 0.73 0.99 1.04 0.57 1.26 0.71 0.96 0.72GMP 0.62 0.51 0.78 0.15 0.36 0.51 0.19 0.35 0.84 0.93 0.39 0.69 0.58 0.74 0.54IMP 0.95 0.80 1.25 0.13 0.52 0.60 0.18 0.36 1.11 1.17 0.51 0.81 0.67 0.87 0.67EUC 135.31 132.27 224.60 19.10 60.55 110.32 7.02 67.42 162.77 195.79 43.35 173.09 144.74 234.02 112.59
3598 Journal of Applied Phycology (2021) 33:3591–3602

1 3
gracilis (Kumar et al. 2010; Hifney et al. 2013; Özen et al. 2018).
pH values higher than 8 and lower than 7 exerted a nega-tive effect on the growth of R. salina. Conversely, phyco-erythrin was higher at pH of 6.5 and 8.5 compared to 7.5. Phycoerythrin is stable and retains its colour at pH range 4–8.4, based on its absorption spectrum, with the highest absorbance peak at pH 7.6 (Marraskuranto et al. 2019). However, more extensive pH changes can disrupt the struc-ture of the chromophore and phycoerythrin is colourless above pH 9 (Munier et al. 2014). The literature on the effect of pH on cryptophytes is not extensive, but in cyanobacteria, the phycoerythrin content increases with the increase of pH, obtaining a maximum at pH 8 (Poza-Carrión et al. 2001; Hemlata and Fatma 2009; Begum et al. 2016). Additionally, the alkaline conditions increase the concentrations of ROS and increase the possibility of cell damage (Liu et al. 2007). The increased phycoerythrin concentration at higher pH can be associated with the increase of ROS as an antioxidant response.
FAAs, nucleotides, and EUC
The main FAAs that were obtained are L-glutamic acid (Glu), L-alanine (Ala), L-proline (Pro), and L-arginine (Arg), which is in line with literature studies on Rhodomonas sp. (Seixas et al. 2009; van Houcke et al. 2017). These FAAs are also the most common in other Cryptophyceae as well (Martin-Jézéquel et al. 1988; Brown 1991). The total FAA concentration is not affected by the salinity. However, the L-proline concentration increases significantly with the increase of the salinity, from 2.5 mg g dry weight−1 at 20 ‰ to 4.4 mg g dry weight−1 at 40 ‰. The accumulation of proline in algal cells in response to hyperosmotic stress has been reported in other studies (Schobert 1980; Reynoso and de Gamboa 1982). Proline has the ability to function as an osmotic regulator and restore the non-stress volume and turgor pressure (Shetty et al. 2019). In addition, proline is associated with the regulation of the cell’s water structure, which protects the cell against dehydration in salt stress (Le Rudulier et al. 1984; Kendall 1996).
Despite the effect of salinity on the FAA concentration of R. salina, there is no significant change in the 5′-nucleotide concentration associated with the salinity. Unlike salinity, pH changes affected the 5′-nucleotide concentration, show-ing a peak at pH 8.5. It is known that in low pH, IMP, GMP, and AMP hydrolyse to their corresponding bases, hypox-anthine, guanine, and adenine, respectively (Golankiewicz et al. 1985). The aqueous hydrolysis rate of 5′-nucleotides is double at pH 7 compared to pH 8 (Shaoul and Sporns 1987).
The synergistic effect of the umami AAs and the flavour nucleotides in R. salina was evaluated by the EUC value. Due to the higher concentration of 5′-nucleotides at pH 8.5,
the EUC is also significantly higher at pH 8.5, 234 mg MSG g−1. There is no literature to compare the EUC value of R. salina with other microalgae. However, the average EUC in R. salina was higher than the values that have been reported in many aquatic animals (Tables 3 and 4), which means that the umami taste of R. salina was intense.
Conclusion
In this study, using a D-optimal DoE, the effect of salinity and pH on growth, phycoerythrin, and non-volatile umami taste active compounds of R. salina was investigated. This microalga was able to adapt and grow sufficiently in a range of salinity and pH, showing the highest growth at salinity 29 ‰ and pH 7. These results provide valuable information for the large-scale production of R. salina. Photopigment com-position analysis illustrated that R. salina was rich in phyco-erythrin when it was cultivated in conditions which were not favourable for the growth of the strain (i.e. high salinity and pH). This increase of phycoerythrin can be explained by the antioxidant activity of the pigment, which is required under those conditions. The umami taste attribute was examined based on the estimation method of EUC. The EUC of R. salina was significantly affected by the pH, with higher EUC at higher pH values. R. salina was rich in umami taste active compounds compared to other aquaculture species, suggest-ing that the characteristic taste of R. salina is suitable for use as an umami condiment.
In summary, in unfavourable growth conditions, R. salina accumulates compounds to protect itself. There is a trade-off between the growth and the quality of R. salina in terms of phycoerythrin and EUC. This trade-off has to be carefully balanced according to the desired biochemical composition of R. salina as an end product. An ideal sys-tem could be a two-stages R. salina production. An initial stage, where R. salina would be cultivated in the optimal conditions for growth, and a second stage, where the culti-vation conditions would be favourable for the phycoeryth-rin production or the enhance of umami taste.
Supplementary Information The online version contains supplemen-tary material available at https:// doi. org/ 10. 1007/ s10811- 021- 02547-4.
Author contribution C. Latsos: conceptualisation, implementation, investigation, formal analysis, writing original draft, writing—review and editing. J. van Houcke: conceptualisation, writing – review and editing, supervision. T. Moerdijk: formal analysis, writing – review and editing. G. Bakratsas: implementation, formal analysis, writing – review and editing. K. R. Timmermans: conceptualisation, writing – review and editing, supervision.
Funding This work was financially supported by ValgOrize project, funded by the INTERREG V 2 Seas Mers Zeeën program, with the financial support of the European Regional Development Fund.
3599Journal of Applied Phycology (2021) 33:3591–3602

1 3
Data availability Full data available from the authors upon request.
Declarations
Conflict of interest The authors declare no competing interests.
Open Access This article is licensed under a Creative Commons Attri-bution 4.0 International License, which permits use, sharing, adapta-tion, distribution and reproduction in any medium or format, as long as you give appropriate credit to the original author(s) and the source, provide a link to the Creative Commons licence, and indicate if changes were made. The images or other third party material in this article are included in the article’s Creative Commons licence, unless indicated otherwise in a credit line to the material. If material is not included in the article’s Creative Commons licence and your intended use is not permitted by statutory regulation or exceeds the permitted use, you will need to obtain permission directly from the copyright holder. To view a copy of this licence, visit http:// creat iveco mmons. org/ licen ses/ by/4. 0/.
References
AL-Qasmi M, Raut N, Talebi S, Al-Rajhi S, Al-Barwani T (2012) A review of effect of light on microalgae growth. In: Proceedings of the World Congress on Engineering WCE 2012, London pp 1–3
Arndt C, Sommer U (2014) Effect of algal species and concentration on development and fatty acid composition of two harpacticoid copepods, Tisbe sp. and Tachidius discipes, and a discussion about their suitability for marine fish larvae. Aquac Nutr 20:44–59
Bartual A, Lubián LM, Gálvez JA, Niell FX (2002) Effect of irra-diance on growth, photosynthesis, pigment content and nutrient consumption in dense cultures of Rhodomonas salina (Wislouch) (Cryptophyceae). Cienc Mar 28:381–392
Begum H, Yusoff FMD, Banerjee S, Khatoon H, Shariff M (2016) Availability and utilization of pigments from microalgae. Crit Rev Food Sci Nutr 56:2209–2222
Bennett A, Bogorad L (1973) Complementary chromatic adaptation in a filamentous blue-green alga. J Cell Biol 58:419–435
Berge T, Daugbjerg N, Andersen BB, Hansen PJ (2010) Effect of low-ered pH on marine phytoplankton growth rates. Mar Ecol Prog Ser 416:79–91
Bishop WM, Zubeck HM (2012) Evaluation of microalgae for use as nutraceuticals and nutritional supplements. J Nutr Food Sci 2:5
Borowitzka MA (1998) Algae as food. In: Wood BJB (ed) Microbiol-ogy of Fermented Foods. Springer, Boston, pp 585–602
Breuer G, Lamers PP, Martens DE, Draaisma RB, Wijffels RH (2013) Effect of light intensity, pH, and temperature on triacylglycerol (TAG) accumulation induced by nitrogen starvation in Scenedesmus obliquus. Bioresour Technol 143:1–9
Brown MR (1991) The amino-acid and sugar composition of 16 species of microalgae used in mariculture. J Exp Mar Bio Ecol 145:79–99
Brown MR, Jeffrey SW, Volkman JK, Dunstan GA (1997) Nutri-tional properties of microalgae for mariculture. Aquaculture 151:315–331
Chen DW, Zhang M (2007) Non-volatile taste active compounds in the meat of Chinese mitten crab (Eriocheir sinensis). Food Chem 104:1200–1205
Chenl CY, Durbin EG (1994) Effects of pH on the growth and carbon uptake of marine phytoplankton. Mar Ecol Prog Ser 109:83–94
Chu W-L (2013) Biotechnological applications of microalgae. IeJSME 6(Suppl 1):S24–S37
Coelho L, Prince J, Nolen T (1998) Processing of defensive pigment in Aplysia californica: acquisition, modification and mobilization
of the red algal pigment, r-phycoerythrin by the digestive gland. J Exp Biol 201:425–42538
De Oliveira MACL, Monteiro MPC, Robbs PG, Leite SGF (1999) Growth and chemical composition of Spirulina maxima and Spirulina platensis biomass at different temperatures. Aquac Int 7:261–275
Doust AB, Wilk KE, Curmi PMG, Scholes GD (2006) The photo-physics of cryptophyte light-harvesting. J Photochem Photobiol A 184:1–17
Fábregas J, Maseda A, Domínguez A, Ferreira M, Otero A (2002) Changes in the cell composition of the marine microalga, Nannochloropsis gaditana, during a light:dark cycle. Biotechnol Lett 24:1699–1703
Fuke S, Konosu S (1991) Taste-active components in some foods: a review of Japanese research. Physiol Behav 49:863–868
Fuke S, Ueda Y (1996) Interactions between umami and other flavor characteristics. Trends Food Sci Technol 7:407–411
Golankiewicz B, Zielonacka-Lis E, Wojciech F (1985) Kinetics and mechanism of the acid-catalyzed hydrolysis of a hypermodified nucleoside wyosine and its 5′-monophosphate. Nucleic Acids Res 13:8019–8033
Gonzalez Araya R, Mingant C, Petton B, Robert R (2012) Influ-ence of diet assemblage on Ostrea edulis broodstock condi-tioning and subsequent larval development. Aquaculture 364–365:272–280
Guevara M, Bastardo L, Cortez R, Arredondo-Vega B, Romero L, Gómez P (2011) Rhodomonas salina (Cryptophyta) pastes as feed for Brachionus plicatilis (Rotifera). Rev Biol Trop 59:1503–1515 (In Spanish)
Guillard RRL, Hargraves PE (1993) Stichochrysis immobilis is a diatom, not a chrysophyte. Phycologia 32:234–236
Hansen PJ (2002) Effect of high pH on the growth and survival of marine phytoplankton: Implications for species succession. Aquat Microb Ecol 28:279–288
Hemlata FT (2009) Screening of cyanobacteria for phycobiliproteins and effect of different environmental stress on its yield. Bull Envi-ron Contam Toxicol 83:509–515
Hifney A, Issa AA, Fawzy M (2013) Abiotic stress induced production of β-carotene, allophycocyanin and total lipids in Spirulina sp. J Biol Earth Sci 3:54–64
Hudek K, Davis LC, Ibbini J, Erickson L (2014) Commercial prod-ucts from algae. In: Bajpai R, Prokop A, Zappi M (eds) Algal Biorefineries, vol 1. Cultivation of Cells and Products. Springer, Dordrecht, pp 275–295
Jepsen PM, Thoisen CV, Carron-Cabaret T, Pinyol-Gallemí A, Nielsen SL, Hansen BW (2019) Effects of salinity, commercial salts, and water type on cultivation of the cryptophyte microalgae Rhodomonas salina and the calanoid copepod Acartia tonsa. J World Aquac Soc 50:104–118
Kallas T, Castenholz RW (1982) Internal pH and ATP-ADP pools in the cyanobacterium Synechococcus sp. during exposure to growth-inhibiting low pH. J Bacteriol 149:229–236
Kawai M, Okiyama A, Ueda Y (2002) Taste enhancements between various amino acids and IMP. Chem Senses 27:739–745
Kendall L (1996) The osmotic adjustment of marine microalgae and the complex role osmolytes play in this process. Masters Thesis, The University of Groningen
Khatoon N, Pal R (2015) Microalgae in biotechnological application: a commercial approach. In: Bahadur B, Rajam MV, Sahijram L, Krisnamurthy KV (eds) Plant biology and biotechnology: Volume II: Plant genomics and biotechnology. Springer, New Delhi pp 27–47
Koyande AK, Chew KW, Rambabu K, Tao Y, Chu DT, Show PL (2019) Microalgae: a potential alternative to health supplemen-tation for humans. Food Sci Hum Wellness 8:16–24
Kumar M, Kumari P, Gupta V, Reddy CRK, Jha B (2010) Biochemi-cal responses of red alga Gracilaria corticata (Gracilariales,
3600 Journal of Applied Phycology (2021) 33:3591–3602

1 3
Rhodophyta) to salinity induced oxidative stress. J Exp Mar Bio Ecol 391:27–34
Lafarga-De la Cruz F, Valenzuela-Espinoza E, Millán-Núñez R, Trees CC, Santamaría-del-Ángel E, Núñez-Cebrero F (2006) Nutrient uptake, chlo-rophyll a and carbon fixation by Rhodomonas sp. (Cryptophyceae) cultured at different irradiance and nutrient concentrations. Aquac Eng 35:51–60
Latsos C, Van HJ, Blommaert L, Verbeeke GP, Kromkamp J, Tim-mermans KR (2021) Effect of light quality and quantity on pro-ductivity and phycoerythrin concentration in the cryptophyte Rhodomonas sp. J Appl Phycol 33:729–741
Latsos C, Van HJ, Timmermans KR (2020) The effect of nitrogen starvation on biomass yield and biochemical constituents of Rhodomonas sp. Front Mar Sci 7:563333
Lawrenz E, Fedewa EJ, Richardson TL (2011) Extraction protocols for the quantification of phycobilins in aqueous phytoplankton extracts. J Appl Phycol 23:865–871
Le Rudulier D, Strom AR, Dandekar AM, Smith LT, Valentine RC (1984) Molecular biology of osmoregulation. Science 224:1064–1068
Liu C, Ji W, Jiang H, Shi Y, He L, Gu Z, Zhu S (2020) Comparison of biochemical composition and non-volatile taste active com-pounds in raw, high hydrostatic pressure-treated and steamed oysters Crassostrea hongkongensis. Food Chem 344:128632
Liu TT, Xia N, Wang QZ, Chen DW (2019) Identification of the non-volatile taste-active components in crab sauce. Foods 8:324
Liu W, Au DWT, Anderson DM, Lam PKS, Wu RSS (2007) Effects of nutrients, salinity, pH and light:dark cycle on the production of reactive oxygen species in the alga Chattonella marina. J Exp Mar Bio Ecol 346:76–86
Liu Y, Qiu C (2016) Calculated taste activity values and umami equiva-lences explain why dried sha-chong (Sipunculus nudus) is a valu-able condiment. J Aquat Food Prod Technol 25:177–184
Liu Y, Zhang C, Chen S (2013) Comparison of active non-volatile taste components in the viscera and adductor muscles of oyster (Ostrea rivularis Gould). Food Sci Technol Res 19:417–424
Marraskuranto E, Raharjo TJ, Kasiamdari RS, Nuringtyas TR (2018) Influence of salinity on growth and phycoerythrin production of Rhodomonas salina. Squalen Bull Mar Fish Postharvest Biotech-nol 13:109
Marraskuranto E, Raharjo TJ, Kasiamdari RS, Nuringtyas TR (2019) Color stability of phycoerythrin crude extract (PECE) from Rhodomonas salina toward physicochemical factors. Squalen Bull Mar Fish Post-harvest Biotechnol 14:21–31
Martin-Jézéquel V, Poulet S, Harris R, Moal J, Samain J (1988) Inter-specific and intraspecific composition and variation of free amino acids in marine phytoplankton. Mar Ecol Prog Ser 44:303–313
Mau JL (2005) The umami taste of edible and medicinal mushrooms. Int J Med Mushrooms 7:119–125
Mulders KJM, Lamers PP, Martens DE, Wijffels RH (2014) Phototro-phic pigment production with microalgae: biological constraints and opportunities. J Phycol 50:229–242
Munier M, Jubeau S, Wijaya A, Morançais M, Dumay J, Marchal L, Jaouen P, Fleurence J (2014) Physicochemical factors affecting the stability of two pigments: R-phycoerythrin of Grateloupia turuturu and B-phycoerythrin of Porphyridium cruentum. Food Chem 150:400–407
Neelam S, Subramanyam R (2013) Alteration of photochemistry and protein degradation of photosystem II from Chlamydomonas reinhardtii under high salt grown cells. J Photochem Photobiol B 124:63–70
Ninomiya Y, Kurenuma S, Nomura T, Uebayashi H, Kawamura H (1992) Taste synergism between monosodium glutamate and 5′-ribonucleotide in mice. Comp Biochem Physiol 101A:97–102
Nishimura T, Kato H (2009) Taste of free amino acids and peptides. Food Rev Int 37–41
Oostlander PC, van Houcke J, Wijffels RH, Barbosa MJ (2020) Optimi-zation of Rhodomonas sp. under continuous cultivation for indus-trial applications in aquaculture. Algal Res 47:101889
Özen M, Kozak A, Dere Ş, Tüney Kızılkaya İ (2018) The effects of different salt concentrations on the biochemical contents of Gracilaria gracilis Greville (Rhodophyta). Celal Bayar Üniver-sitesi Fen Bilim Derg 14:303–307
Poza-Carrión C, Fernández-Valiente E, Piñas FF, Leganés F (2001) Acclimation of photosynthetic pigments and photosynthesis of the cyanobacterium Nostoc sp. strain UAM206 to combined fluctua-tions of irradiance, pH, and inorganic carbon availability. J Plant Physiol 158:1455–1461
Renaud SM, Van TL, Parry DL (1999) The gross chemical composi-tion and fatty acid composition of 18 species of tropical Aus-tralian microalgae for possible use in mariculture. Aquaculture 170:147–159
Reynoso GT, de Gamboa BA (1982) Salt tolerance in the freshwater algae. Comp Biochem Physiol 73:95–99
Richmond A (ed) (2004) Handbook of Microalgal Culture: Biotechnol-ogy and Applied Phycology. Blackwell Science, Oxford
Riisgård HU, Egede PP, Barreiro Saavedra I (2011) Feeding behaviour of the mussel, Mytilus edulis : New observations, with a minire-view of current knowledge. J Mar Sci 2011:312459
Sato T, Ohgami, Kaneniwa SM (2015) Seasonal variations in free amino acids, nucleotide-related compounds, and fatty acids and meat yield of the coconut crab Birgus latro. Fish Sci 81:959–970
Schobert B (1980) Proline catabolism, relaxation of osmotic strain and membrane permeability in the diatom Phaeodactylum tricornutum. Physiol Plant 50:37–42
Seixas P, Coutinho P, Ferreira M, Otero A (2009) Nutritional value of the cryptophyte Rhodomonas lens for Artemia sp. J Exp Mar Biol Ecol 381:1–9
Shallenberger R (1993) Taste of amino acids. In: Taste Chemistry. Chapman & Hall, London pp 226–233
Shaoul O, Sporns P (1987) Hydrolytic stability at intermediate pHs of the common purine nucleotides in food, inosine-5′-monophosphate, guanosine-5′-monophosphate and adenosine-5′-monophosphate. J Food Sci 52:810–812
Shetty P, Gitau MM, Maróti G (2019) Salinity stress responses and adaptation mechanisms in eukaryotic green microalgae. Cells 8:e8121657
Spolaore P, Joannis-Cassan C, Duran E, Isambert A (2006) Commer-cial applications of microalgae. J Biosci Bioeng 101:87–96
Subramanyam R, Jolley C, Thangaraj B, Nellaepalli S, Webber AN, Fromme P (2010) Structural and functional changes of PSI-LHCI supercomplexes of Chlamydomonas reinhardtii cells grown under high salt conditions. Planta 231:913–922
Sudhakar MP, Jagatheesan A, Perumal K, Arunkumar K (2015) Meth-ods of phycobiliprotein extraction from gracilaria crassa and its applications in food colourants. Algal Res 8:115–120
Sudhir P, Murthy SDS (2004) Effects of salt stress on basic processes of photosynthesis. Photosynthetica 42:481–486
Thoisen C, Pedersen JS, Jørgensen L, Kuehn A, Hansen BW, Nielsen SL (2020) The effect of cell density on biomass and fatty acid productivity during cultivation of Rhodomonas salina in a tubular photobioreactor. Aquac Res 51:3367–3375
Thompson P (1999) The response of growth and biochemical composi-tion to variations in daylength, temperature, and irradiance in the marine diatom Thalassiosira pseudonana (Bacillariophyceae). J Phycol 35:1215–1223
Valenzuela-Espinoza E (2005) Growth, nutrient uptake and proximate composition of Rhodomonas sp cultured using f/2 medium and agricultural fertilizers. Cienc Mar 31:79–89
van Houcke J, Medina I, Maehre HK, Cornet J, Cardinal M, Linssen J, Luten J (2017) The effect of algae diets (Skeletonema costatum and Rhodomonas baltica) on the biochemical composition and
3601Journal of Applied Phycology (2021) 33:3591–3602
1 3
sensory characteristics of Pacific cupped oysters (Crassostrea gigas) during land-based refinement. Food Res Int 100:151–160
Varfolomeev SD, Wasserman LA (2011) Microalgae as source of biofuel, food, fodder, and medicines. Appl Biochem Microbiol 47:789–807
Vu MTT, Douëtte C, Rayner TA, Thoisen C, Nielsen SL, Hansen BW (2016) Optimization of photosynthesis, growth, and biochemi-cal composition of the microalga Rhodomonas salina—an estab-lished diet for live feed copepods in aquaculture. J Appl Phycol 28:1485–1500
Vu MTT, Jepsen PM, Jørgensen NOG, Hansen BW, Nielsen SL (2019) Testing the yield of a pilot-scale bubble column photobioreactor for cultivation of the microalga Rhodomonas salina as feed for intensive calanoid copepod cultures. Aquac Res 50:63–71
Watanabe K, Lan H-L, Yamaguchi K, Konosu S (1990) Taste-active components of scallop Part II. Role of extractive components of scallop in its characteristic taste development. Nippon Shokuhin Kogyo Gakkaishi 37:439–445
Wen X, Chen A, Wu Y, Yang Y, Xu Y, Xia W, Zhang Y, Cao Y, Chen S (2020) Comparative evaluation of proximate compositions and taste attributes of three Asian hard clams (Meretrix meretrix) with different shell colors. Int J Food Prop 23:400–411
Yamaguchi K (1996) Recent advances in microalgal bioscience in Japan, with special reference to utilization of biomass and metabo-lites: a review. J Appl Phycol 8:487–502
Yamaguchi S, Tomoko Y, Shingo I, Tsunehiko N (1971) Measure-ment of the relative taste intensity of some L-α-amino acids and 5′-nucleotides. J Food Sci 36:846–849
Yamamoto S, Bossier P, Yoshimatsu T (2020) Biochemical charac-terization of Rhodomonas sp. Hf-1 strain (cryptophyte) under nitrogen starvation. Aquaculture 516:734648
Ye ZW, Jiang JG, Wu GH (2008) Biosynthesis and regulation of carot-enoids in Dunaliella: progresses and prospects. Biotechnol Adv 26:352–360
Zhao CJ, Schieber A, Gänzle MG (2016) Formation of taste-active amino acids, amino acid derivatives and peptides in food fermen-tations – a review. Food Res Int 89:39–47
Zheng J-Y, Tao N-P, Gong J, Gu S-Q, Xu C-H (2015) Comparison of non-volatile taste-active compounds between the cooked meats of pre- and post-spawning Yangtze Coilia ectenes. Fish Sci 81:559–568
Publisher’s note Springer Nature remains neutral with regard to jurisdictional claims in published maps and institutional affiliations.
3602 Journal of Applied Phycology (2021) 33:3591–3602