effective decision-making on climate change impacts and ... · effective decision-making on climate...
TRANSCRIPT

International Workshop on Governance of Climate-related Risks
in Europe: the need for policy-oriented research
Brussels, 8-9 September 2011
Effective decision-making on climate
change impacts and adaptation
The MEDIATION project
Stefan Hochrainer-Stigler
Reinhard Mechler, Keith Williges

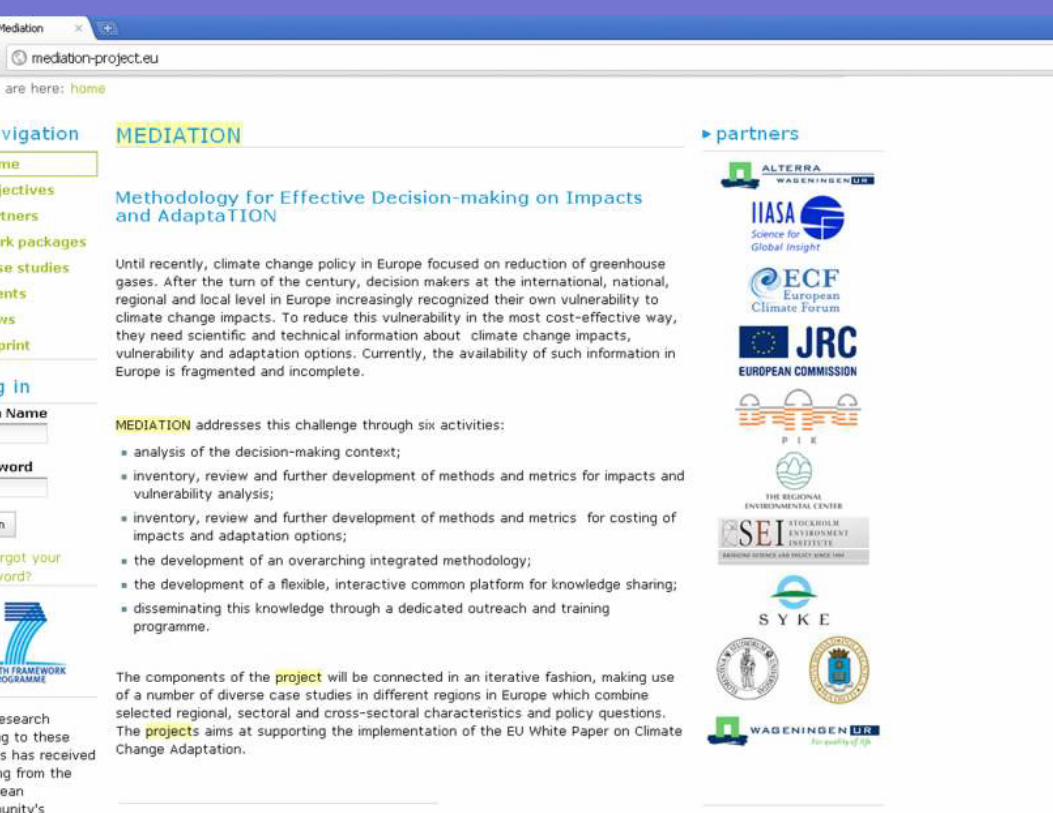
MEDIATION - Introduction
Assessment of climate change impacts, vulnerability and adaptation
requires a combination of generic and context-specific
knowledge.
Currently, the availability of such knowledge in Europe is
fragmented and incomplete
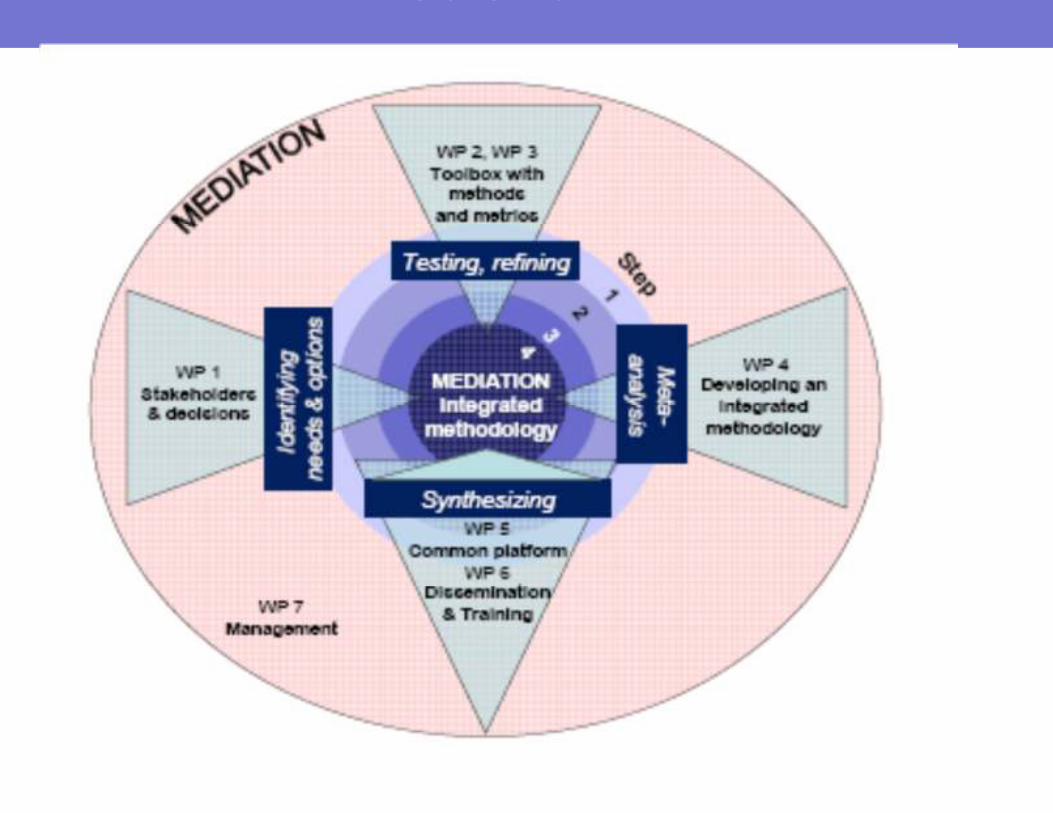
MEDIATION addresses this challenge.
decision making context
methods and metrics for impacts and vulnerability analysis
costing of impacts and adaptation
integrated methodology
platform for knowledge sharing

Mediation Goal-Framework for Methodologies

The following case studies are included in MEDIATION:
Northern Europe
Case NE1: Vulnerability of the elderly to Climate change in the Nordic region
Case NE2: Implications of biodiversity change for conservation policy in Finland
Western Europe
Case WE1: Implications of land use change for discharge dynamics and adaptation in river Rhine basin
Case WE2: Fresh water, salinization and coping with uncertainty in coastal areas (the Netherlands)
Case WE3: Implications sea level rise for coastal areas and functioning of ecosystems
Central Europe
Case CE1: Central/Eastern European case: hydropower and agriculture Albania
Case CE2: Central/Eastern European case: Droughts in Serbian agriculture
Southern Europe
Case SE1: Southern European case: Tuscany – sorry, no more wine (lead UNIFI)
Case SE2: Southern European case: Tuscany – Tuscan people is hot (lead UNIFI)
Case SE3: The Guadiana river basin
Case SE4: Goudalquivir river basin
European (Lead EC-JRC)
Case EU3: Forest Fires
Case EU2: Flood risk
Mediation: Case Studies
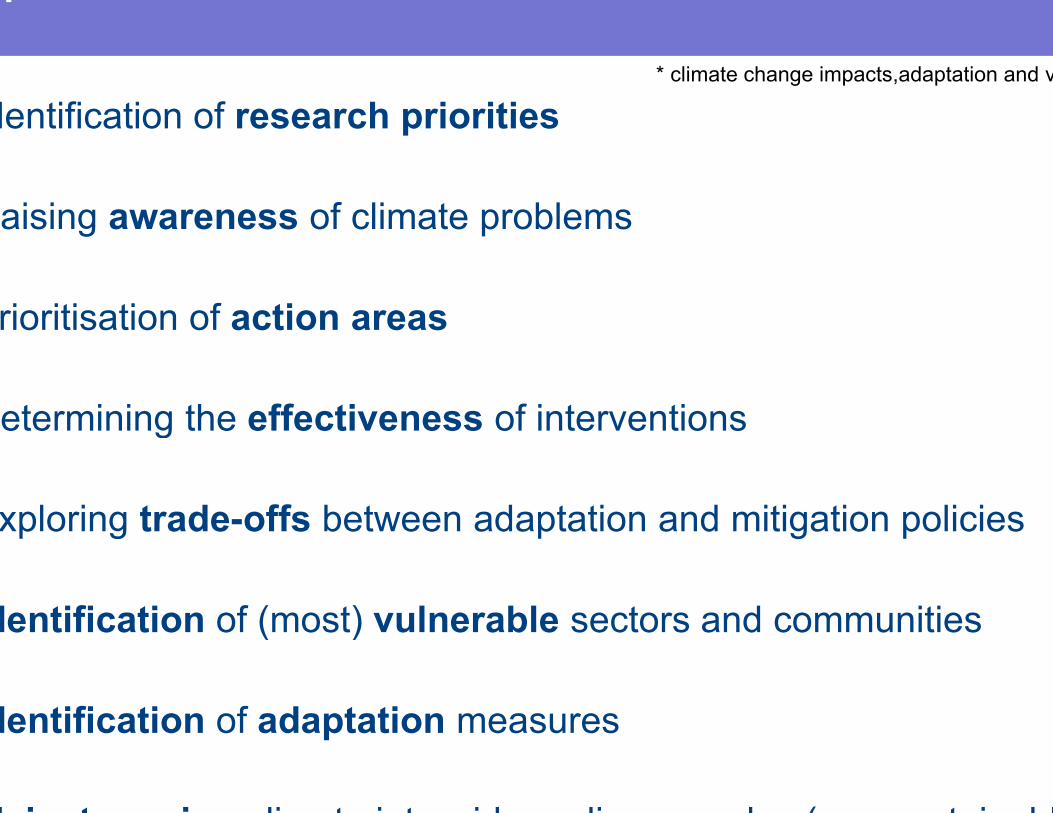
Purposes of CCIAV* assessments are manifold
Identification of research priorities
Raising awareness of climate problems
Prioritisation of action areas
Determining the effectiveness of interventions
Exploring trade-offs between adaptation and mitigation policies
Identification of (most) vulnerable sectors and communities
Identification of adaptation measures
Mainstreaming climate into wider policy agendas (e.g. sustainable
* climate change impacts,adaptation and vulnerability
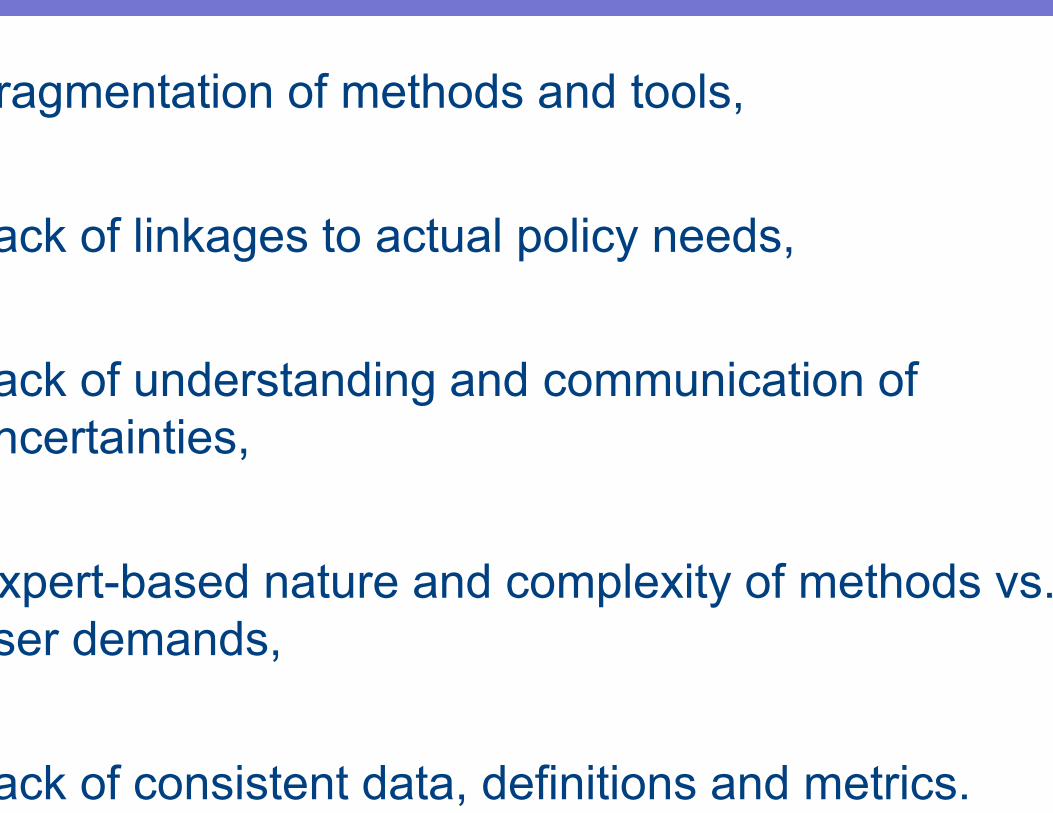
Fragmentation of methods and tools,
Lack of linkages to actual policy needs,
Lack of understanding and communication of
uncertainties,
Expert-based nature and complexity of methods vs.
user demands,
Lack of consistent data, definitions and metrics.

Objectives: Toolbox development
Toolbox: Set of models, methods and metrics for
the assessment of impacts and vulnerability and
adaptation options.
Responding to stakeholder needs
Apply the toolbox to salient adaptation problems
identified in the case studies
Iterative development in conjunction with
workshops
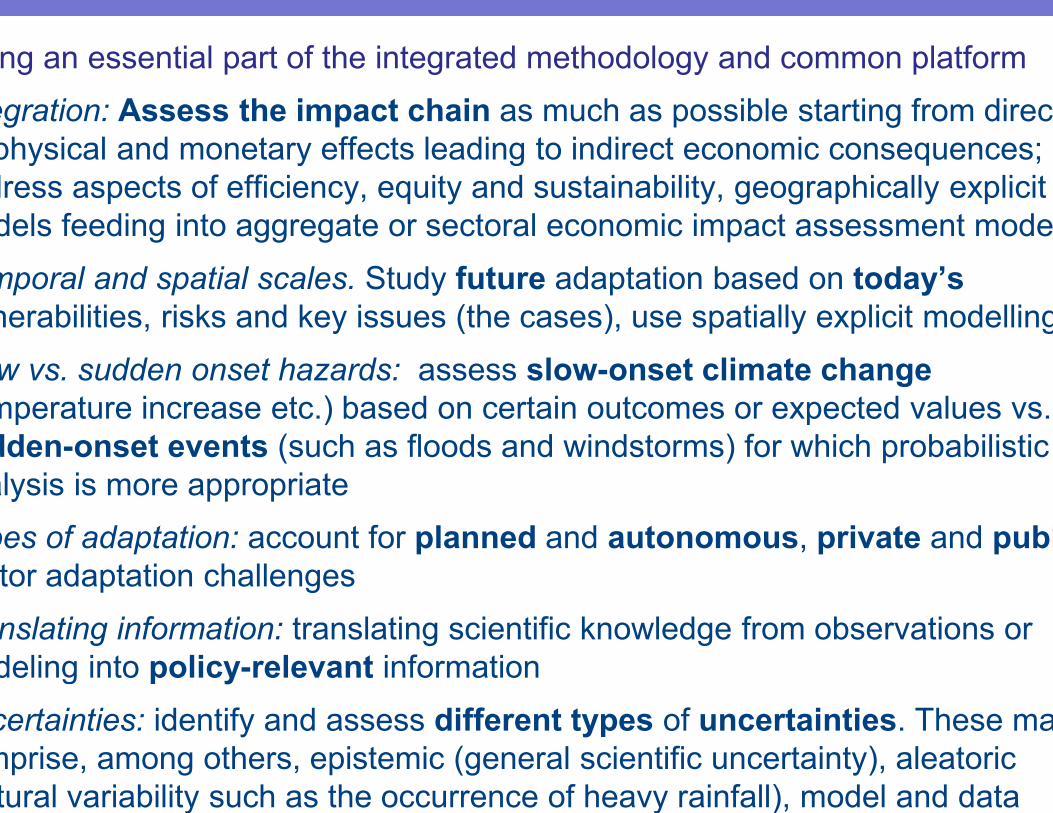
Creating an essential part of the integrated methodology and common platform
Integration: Assess the impact chain as much as possible starting from direct
biophysical and monetary effects leading to indirect economic consequences;
address aspects of efficiency, equity and sustainability, geographically explicit
models feeding into aggregate or sectoral economic impact assessment models.
Temporal and spatial scales. Study future adaptation based on today’s
vulnerabilities, risks and key issues (the cases), use spatially explicit modelling
Slow vs. sudden onset hazards: assess slow-onset climate change
(temperature increase etc.) based on certain outcomes or expected values vs.
sudden-onset events (such as floods and windstorms) for which probabilistic
analysis is more appropriate
Types of adaptation: account for planned and autonomous, private and public
sector adaptation challenges
Translating information: translating scientific knowledge from observations or
modeling into policy-relevant information
Uncertainties: identify and assess different types of uncertainties. These may
comprise, among others, epistemic (general scientific uncertainty), aleatoric
(natural variability such as the occurrence of heavy rainfall), model and data
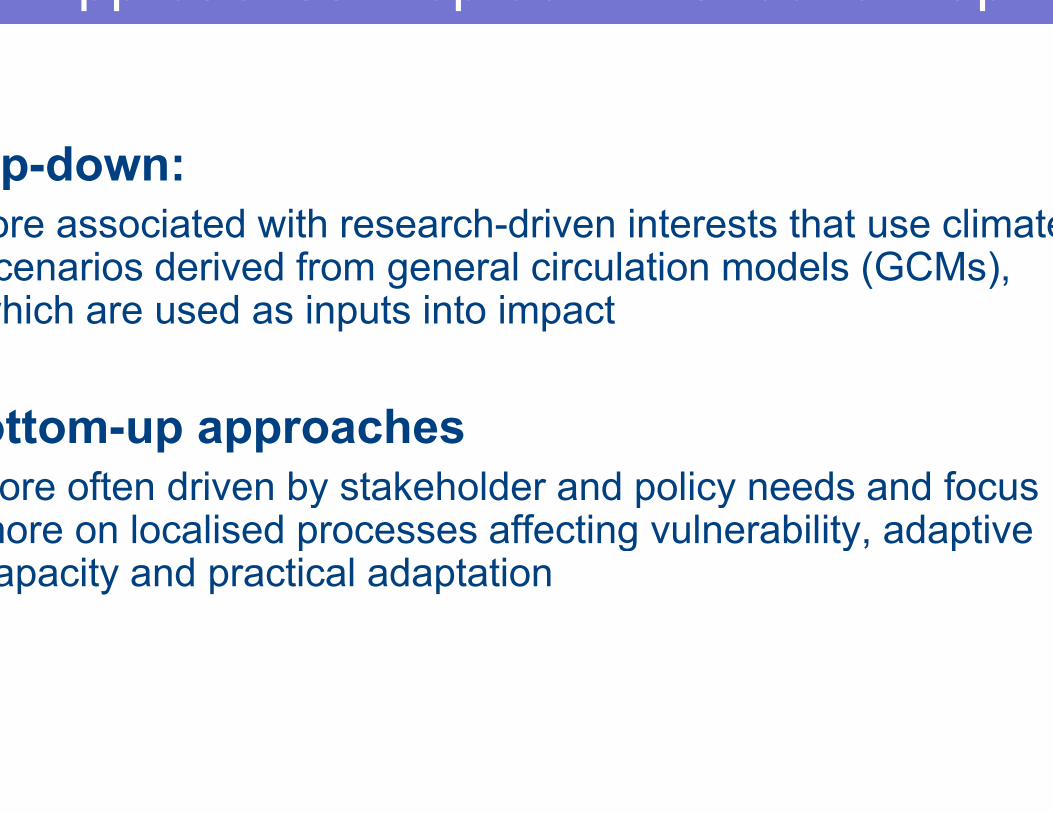
Approaches: Top down vs. bottom up
Top-down:
more associated with research-driven interests that use climate scenarios derived from general circulation models (GCMs), which are used as inputs into impact
Bottom-up approaches
more often driven by stakeholder and policy needs and focus more on localised processes affecting vulnerability, adaptive capacity and practical adaptation
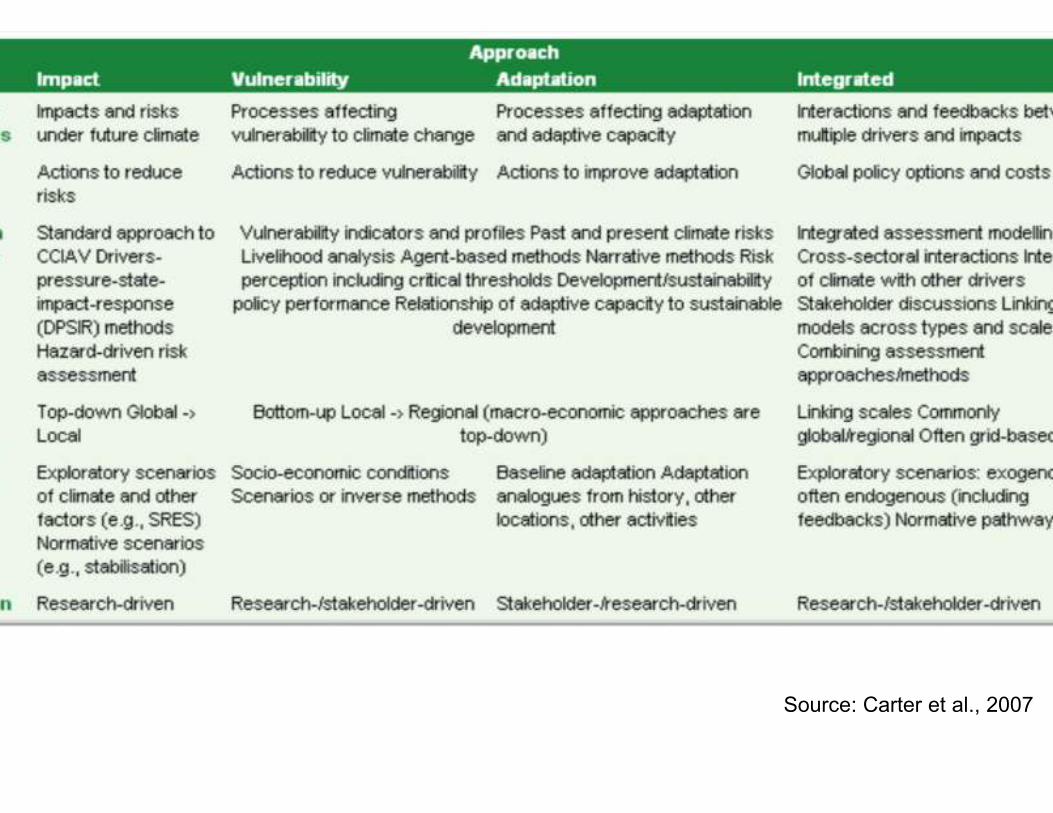
Source: Carter et al., 2007

Review of toolboxes
Examination of a number of toolboxes in different fields:
there is no single pattern of construction;
overall design is based on a number of decisions, falling on a
continuum between one extreme and another, which changes
depending on proposed users as well as the identified goal of
the toolbox.
Each platform balances a choice between simple and
complex, whether it be in verbose, in-depth descriptions of
each component, or a simple, bullet point list overview, with
links to outside resources, or between a built in search tool
allowing for fast location of specific data and a structure that
leads the user to the appropriate methods based on a linear
website design.

Improving users’ experience
Instilling organization through
typology
Standardizing the myriad of
methods and data
Assessing functionality of
individual items
Positively influencing the
integrated methodology and
common platform

Cases
Region
Northern Europe,
including the boreal and arctic
region
Central and
Eastern Europe, incl. mountain
regions & Danube river
basin
Southern Europe,
covering the Mediterranean
Western Europe,
covering the Atlantic countries
Europe-wide
Special emphasis
on key sectors
Agriculture, forestry and
biodiversity
Water management
(floods) and
agriculture
Water management
(droughts), health
(heat waves), cities, tourism
Riverbasin management
Flooding, agriculture, forest
fires
Special emphasis on decision
domain
Multilevel
multisector resource
management
Disaster
management
high cost, low
probability events.
Multilevel
multisector resource
management
Disaster
management, economic
assessment
Identification of
vulnerable hotspots, impacts
and feedbacks
Decision problems
Stabilize
agricultural
livelihoods
Maintaining
biodiversity
Drought and
floods on
agriculture
How to help
farmers against drought ?
How to protect
people against heat waves?
How to help
tourism against
changing in tourist fluxes ?
Land use vs.
riverbasin
management
How to improve
efficiency and
equity in sharing extreme event
risks over Europe, e.g. with EU
Solidarity Fund?
Key partners
(leader in bold)
SYKE (Tim),
EC-JRC, WU
REC
(Zsuzsanna, IIASA
UNIFI (Marco),
UMP
ALT (Saskia),
ECF, PIK
EC-JRC
(Alessandro), IIASA
Models, tools and data
possibly to be used
Land use models
(IIASA)
Land use models
(IIASA)
Land use models
(IIASA)
Crop models
Data (see position
paper)
JRC crop and
flood risk models,
CATSIM catastrophe
simulation model (IIASA)
Possible gaps
… …. Methodology to
quantitative
assessment of impact and
adaptation in health and
tourism sectors
…. Climate variability
in climate
projections
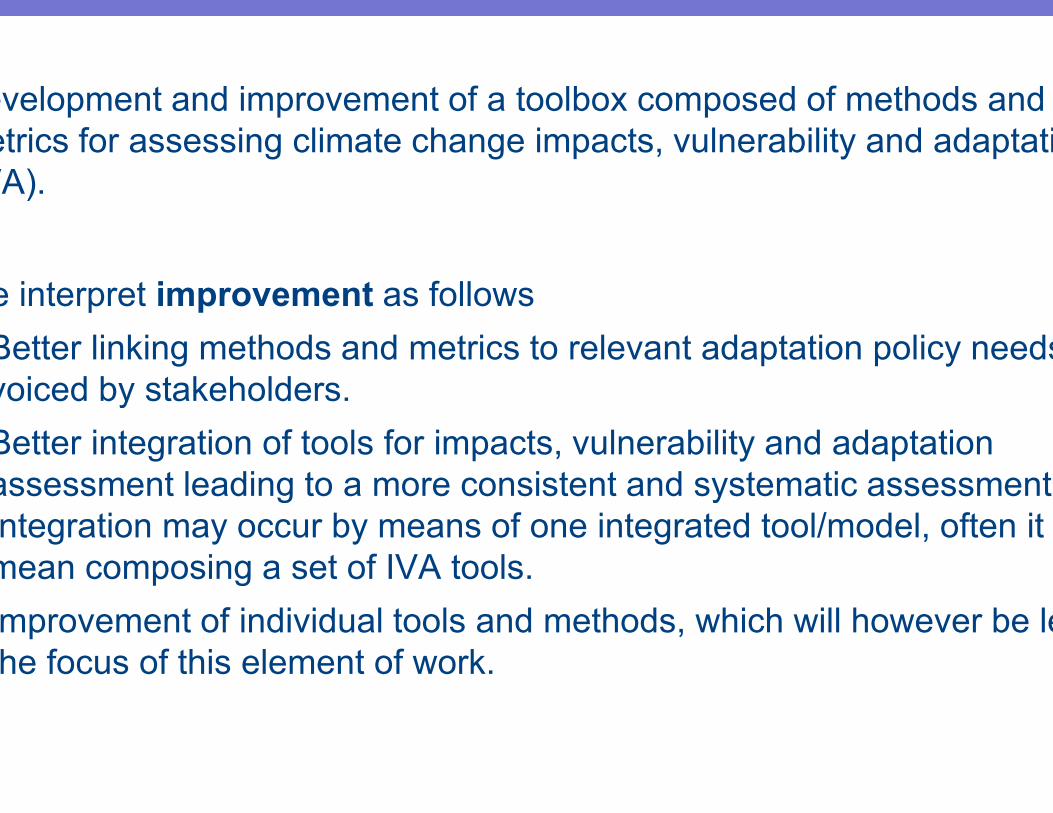
evelopment and improvement of a toolbox composed of methods and
metrics for assessing climate change impacts, vulnerability and adaptation
(IVA).
We interpret improvement as follows
Better linking methods and metrics to relevant adaptation policy needs as
voiced by stakeholders.
Better integration of tools for impacts, vulnerability and adaptation
assessment leading to a more consistent and systematic assessment.
Integration may occur by means of one integrated tool/model, often it will
mean composing a set of IVA tools.
Improvement of individual tools and methods, which will however be less
the focus of this element of work.

Case studies as drivers for
development
Improve:
Access
Understanding
Availability
Design iteratively
Name Type Class Case
Cropsys Model Impact CE4
Lisflood Model Impact CE4
CATSIM Model Integrated CE4
A1b NUTS2 Scenario Scenario CE4
A2 Scenario Scenario CE4
CLM (+ Fire
module) Model Impact EU F.F.
FP6
ENSEMBLES Scenario Scenario EU F.F.
COSMO-CLM
(Regional
Climate) Model climate EU F.F.
Grapevine
growth model Model Impact Tuscany Case

Field Description
Description
Explains the type of framework or tool being presented, what type of information this tool helps
the user to evaluate and provides a basic summary of how the tool works, including the type of
data required and the processes used to evaluate these data.
Appropriate useDescribes where the framework or tool is (and is not) applicable. This gives the user an idea of the
stage at which it is appropriate to use.
Scope Covers the spatial scope in which the framework or tool is applicable
Key outputDescribes the final product of the framework or tool (e.g., a model, a cost effectiveness
evaluation, an organizing framework).
Key input Explains the information or data required to use the framework or tool.
Ease of use Describes the level of difficulty associated with implementing the framework or tool.
Background A short summary and citations of any previous research
Training requiredDescribes the level of expertise and any specific skills required to use the framework or tool
effectively.
Training available Describes the training available to learn how to use the framework or tool effectively.
Computer requirements Describes the computer hardware and software necessary to use the framework or tool.
DocumentationProvides the citations for sources describing in detail how to use the framework or tool. Generally
this is a user’s manual or similar document.
Applications Briefly describes actual cases and projects where the framework or tool has been applied.
Contacts for framework/tools,
documentation, technical assistance
Provides information on who to contact for further information, documentation, and technical
assistance.
Provides information on the cost of obtaining documentation or software for the framework or
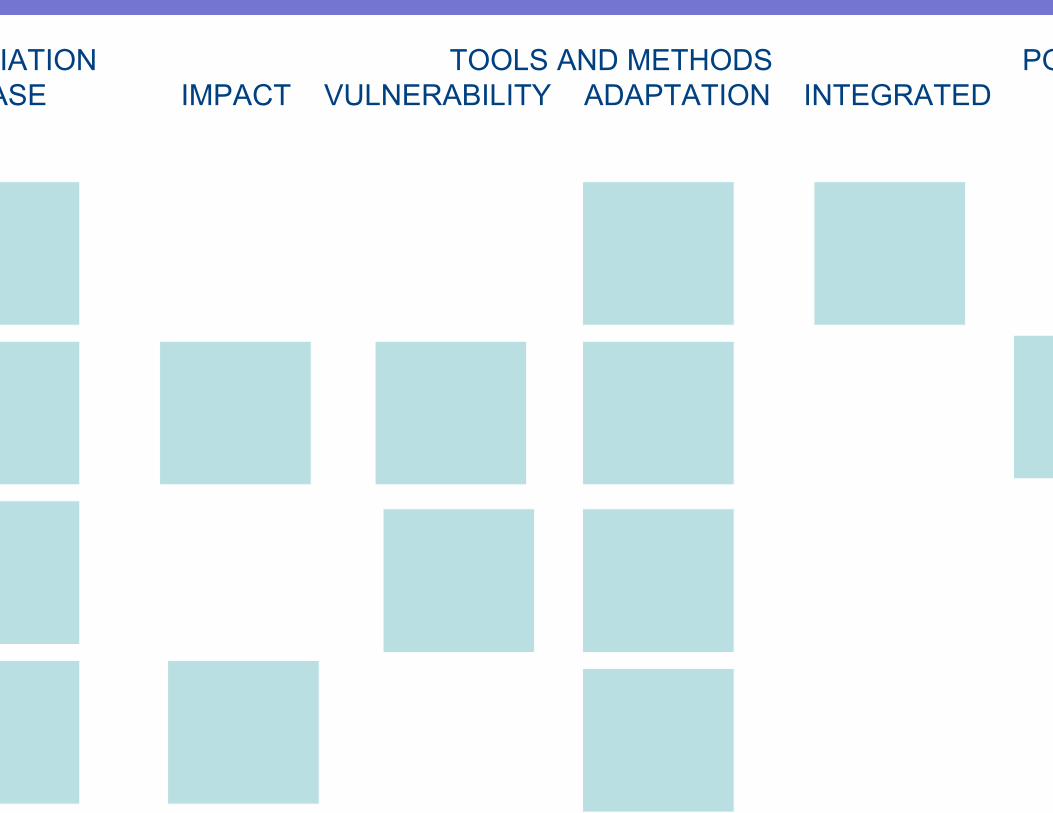
MEDIATION TOOLS AND METHODS POLICY
CASE IMPACT VULNERABILITY ADAPTATION INTEGRATED

MEDIATION TOOLS AND METHODS POLICY
CASE IMPACT VULNERABILITY ADAPTATION INTEGRATED

Adaptation TOOLS AND METHODS POLICY
Problem IMPACT VULNERABILITY ADAPTATION INTEGRATED
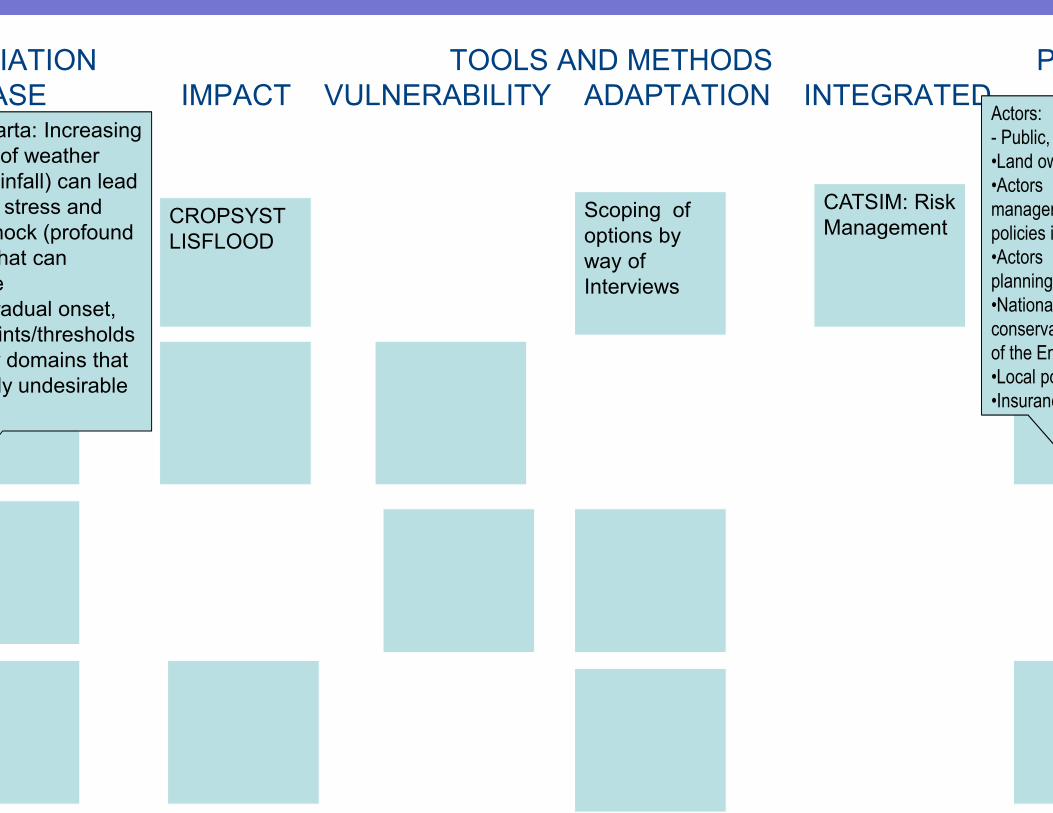
MEDIATION TOOLS AND METHODS POLICY
CASE IMPACT VULNERABILITY ADAPTATION INTEGRATED
CROPSYST
LISFLOOD
Scoping of
options by
way of
Interviews
Upper Warta: Increasing
variability of weather events
(rainfall) can lead to chronic
stress and sudden shock
(profound drought) that can
precipitate sudden/gradual
onset, tipping
points/thresholds to stability
domains that are socially
Upper Warta: Increasing
variability of weather
events (rainfall) can lead
to chronic stress and
sudden shock (profound
drought) that can
precipitate
sudden/gradual onset,
tipping points/thresholds
to stability domains that
are socially undesirable
CATSIM: Risk
Management
Public, private
•Land owners,
•Actors dealing
and WFD
implementation
•Actors
planning of
•National
conservation
Environment,
•Local policy
•Insurance
Actors:
- Public,
•Land owners,
•Actors
management
policies implementation
•Actors dealing
planning
•National
conservation
of the Environment,
•Local policy
•Insurance

GAMS
AQUACROP
WEAP
DSS
MEDIATION TOOLS AND METHODS POLICY
CASE IMPACT VULNERABILITY ADAPTATION INTEGRATED
CROPSYS
LISFLOOD
Guadiana
Scoping of
options: by
way of
Interviews
Upper Warta: Increasing
variability of weather events
(rainfall) can lead to chronic
stress and sudden shock
(profound drought) that can
precipitate sudden/gradual
onset, tipping
points/thresholds to stability
domains that are socially
The Guadiana is
expected to
experience severe
climate change
impacts, especially
in relation to the
reduction of
available water
resources. Socio-
economic and
environmental
impacts of climate
change are
expected to be high
in the agricultural
and irrigation water
domains.
CATSIM: Risk
Management
Public, private
•Land owners,
•Actors dealing
and WFD
implementation
•Actors
planning of
•National
conservation
Environment,
•Local policy
•InsurancePolicy makers at national
regional levels face
challenge to design adequate
CC adaptation strategies
cope with these impacts
Policy Questions
Assessment of impacts,
vulnerabilities and
adaptation strategies
climate change. Integration
different sectoral
(water and agriculture),
adaptation to climate
focus.
Econometric
analysis
Scoping of
options by
way of
Interviews
1. Qualitative & Descriptive analysis
• Institutional mapping
• Policy Mapping3. Analysis of impacts
• Mathematical Programming
Economic model (GAMS)
• Agronomic model (AquaCrop)
• Hydrology model (WEAP)
• Bayesian networks (DSS)
4. Vulnerability assessment
• Econometric analysis
• Classification trees
2. System analysis
• Stakeholder participation
• Fuzzy cognitive maps
• Bayesian networks
Climate change
scenarios
Policy
scenarios
Key elements
of the system
System’s
constraints
Fieldwork Databases
5. Assessment of
adaptation strategies
Qualitative
Quantitative
Semi-quantitative or combined qualitative
and quantitative elements

Identification of research priorities
Raising awareness of climate problems
Prioritisation of action areas
Determining the effectiveness of interventions
Exploring trade-offs between adaptation and mitigation policies
Identification of (most) vulnerable sectors and communities
Identification of adaptation measures
Mainstreaming climate into wider policy agendas (e.g. sustainable development, regional and fiscal planning)
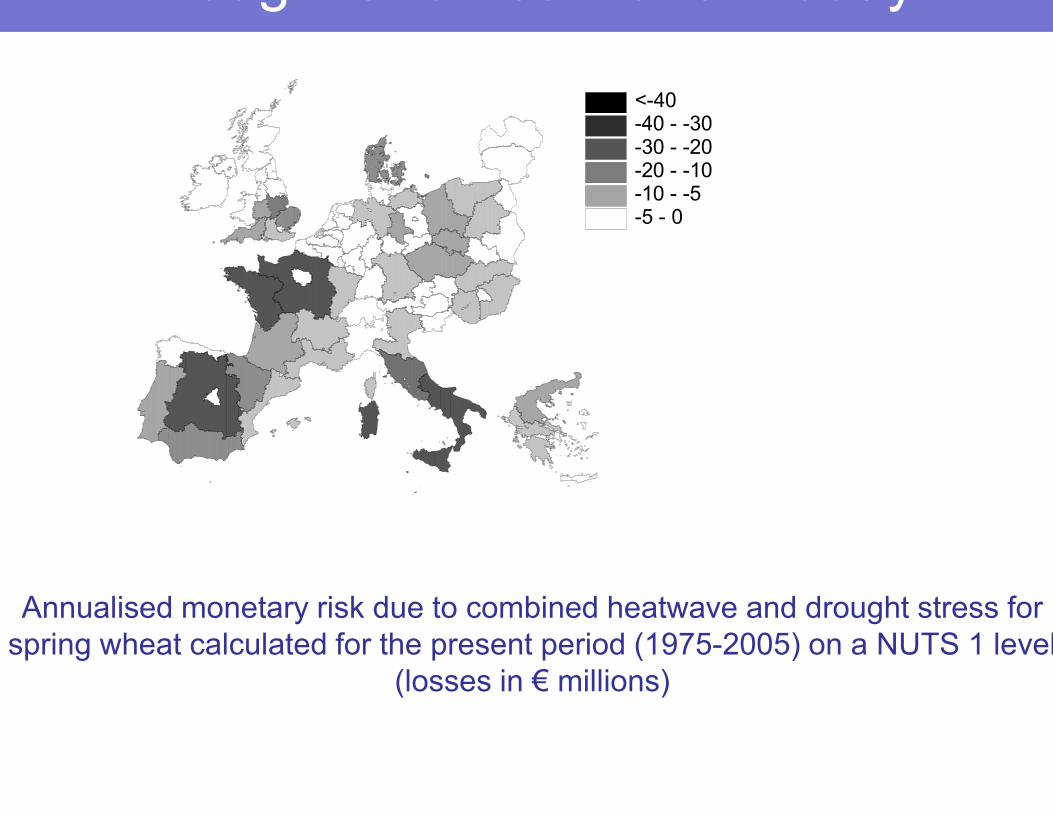
Drought and heatwave - today
<-40-40 - -30-30 - -20-20 - -10-10 - -5-5 - 0
Annualised monetary risk due to combined heatwave and drought stress for
spring wheat calculated for the present period (1975-2005) on a NUTS 1 level
(losses in € millions)

Changes in annualised drought
and heatwave risks to spring
wheat over a future period in
2060 compared to today,
without adaptation (A) and with
adaptation in terms of advanced
sowing (B) and longer cycle
variety (C) (in € millions)
Drought and heatwave - future
<-40-40 - -30-30 - -20-20 - -10-10 - -5-5 - 00 - 55 - 1010 - 2020 - 3030 - 40>40
B
C

Spain: Vulnerability profiles
= 31.58
VERY HIGH
%
12.5
0.0
25.0
ANNUAL_INT_PC > 31.58
Node 3
Class = MEDIUM
FARM_SIZE_HA <= 8.75
Class Cases %
HIGH 13 29.5
LOW 0 0.0
MEDIUM 27 61.4
PERMANENT_CROPS_PC <= 25.86
Node 2
Class = HIGH
ANNUAL_INT_PC <= 31.58
Class Cases %
HIGH 14 26.9
LOW 0 0.0
MEDIUM 29 55.8
VERY HIGH 9 17.3
W = 52.00
N = 52
PERMANENT_CROPS_PC > 25.86
Terminal
Node 8
Class = LOW
Class Cases %
HIGH 0 0.0
LOW 8 100.0
MEDIUM 0 0.0
VERY HIGH 0 0.0
W = 8.00
N = 8
Node 1
Class = HIGH
PERMANENT_CROPS_PC <= 25.86
Class Cases %
HIGH 14 23.3
LOW 8 13.3
MEDIUM 29 48.3
VERY HIGH 9 15.0
W = 60.00
N = 60
a) Upper Guadiana
b) Middle Guadiana
Source: a) Varela-Ortega et al. (2007) and b) Esteve (2009)
CART Classification trees
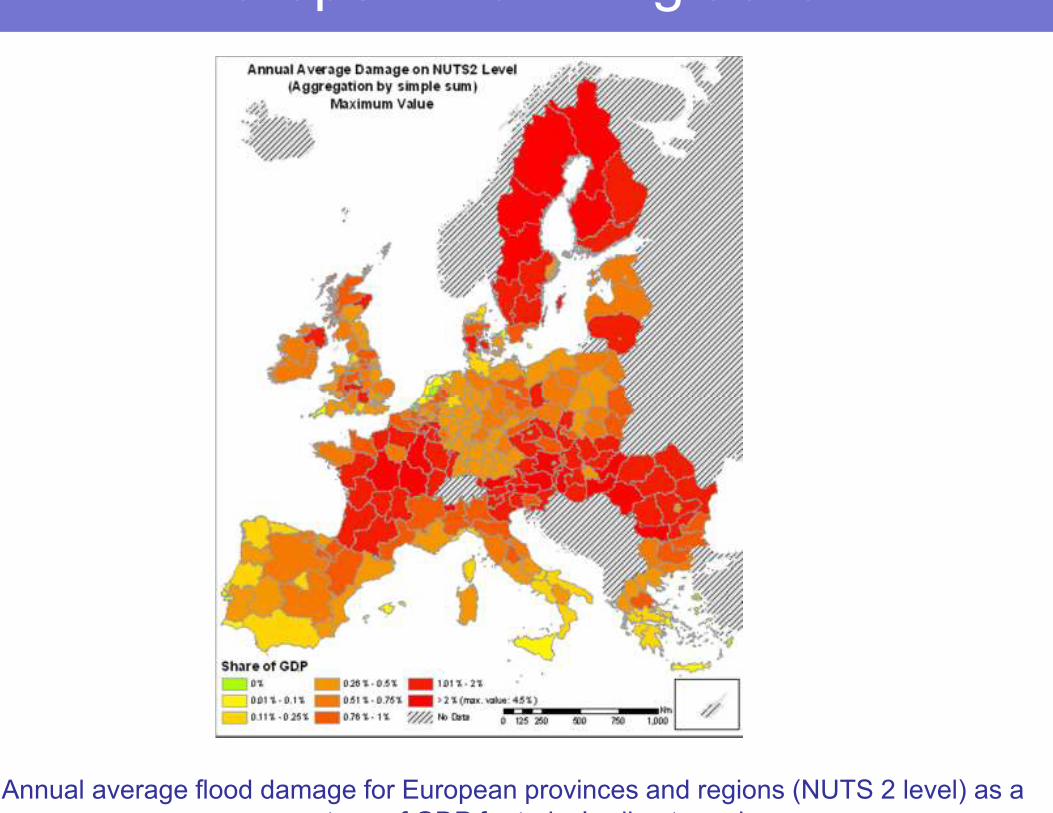
Europe: Prioritizing action
Annual average flood damage for European provinces and regions (NUTS 2 level) as a
percentage of GDP for today’s climate regime
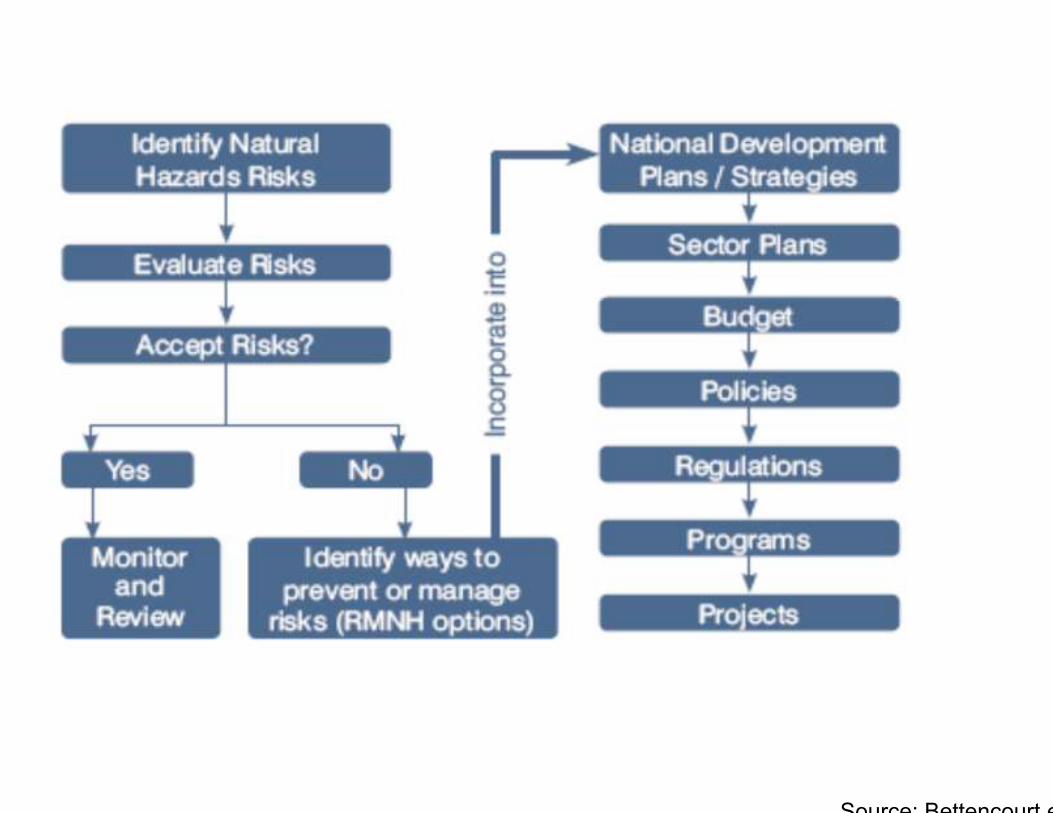
Source: Bettencourt et al., 2006
risks
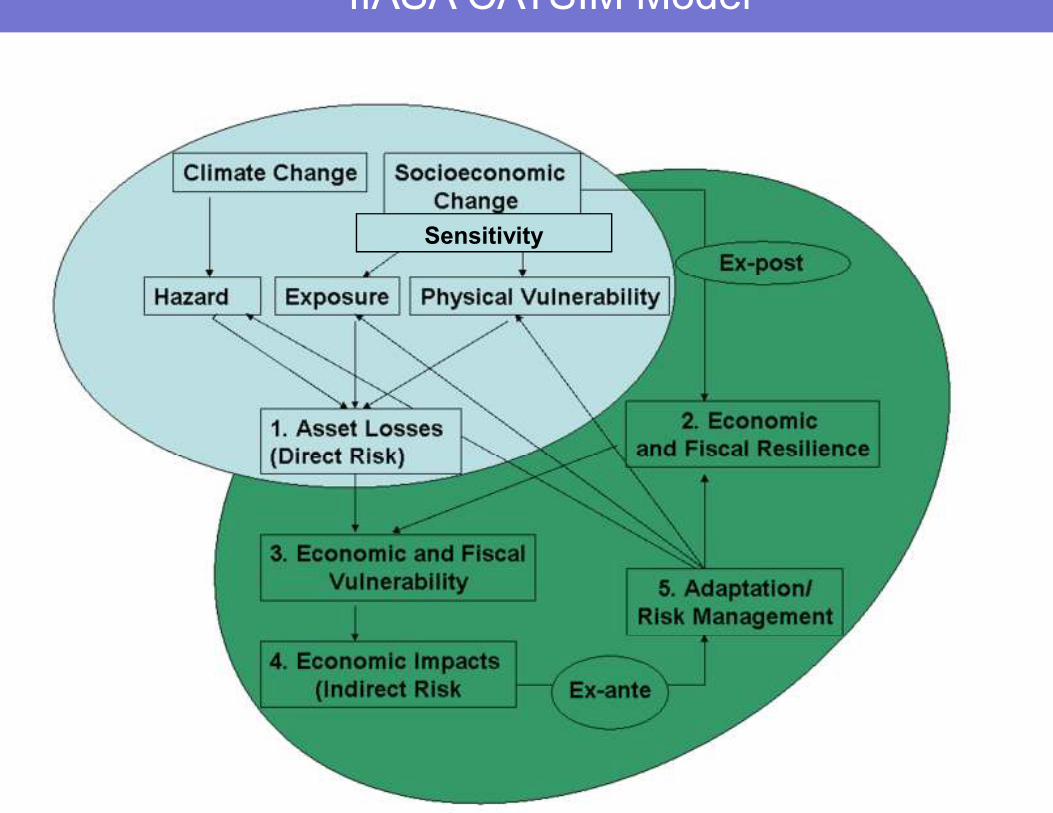
IIASA CATSIM Model*
Sensitivity

0%
1%
2%
3%
4%
5%
6%
Austria
Hungary
Romania
Czech
Republic
Latvia
Poland
Bulgaria
Slovakia
Lithuania
Per cent of GDP
Government flood risk liability
Projected fiscal deficit 2009
Fiscal vulnerability

The fund
is capitalized at €1 billion
covers public expenses for restoring public infrastructure,
providing services for relief and clean up, and protecting
cultural heritage
can be called upon if natural disaster exceeds €3 billion
or 0.6% of gross national income
in exceptional cases, can be mobilized for regional
disasters that do not reach this threshold
EU Solidarity Fund

0 500 1000 1500 2000 25000
0.1
0.2
0.3
0.4
0.5
0.6
0.7
0.8
0.9
1
Million Euro
F
Payment distribution for the EUSF
upper scenario
baseline
lower scenario
On average, every 7 years one can expect that the EUSFcan not meet its
Adaptation robustness
Mediation-IM
WP 2 Partners