effective population size/adult population size ratios in ... · & graur (1984) estimates has...
TRANSCRIPT

Genet. Res., Camb. (1995), 66, pp. 95-107 With 1 text-figure Copyright © 1995 Cambridge University Press 95
Effective population size/adult population size ratios inwildlife: a review
RICHARD FRANKHAMSchool of Biological Sciences, Macquarie University NSW 2109. Australia. Phone: (612) 850-8186. Fax: (612) 850-8245.E-mail: rfrankhafa rna.bio.mq.edu.au
(Received 27 June 1995)
Summary
The effective population size is required to predict the rate of inbreeding and loss of geneticvariation in wildlife. Since only census population size is normally available, it is critical to knowthe ratio of effective to actual population size (NJN). Published estimates of NJN (192 from 102species) were analysed to identify major variables affecting the ratio, and to obtain acomprehensive estimate of the ratio with all relevant variables included. The five most importantvariables explaining variation among estimates, in order of importance, were fluctuation inpopulation size, variance in family size, form of TV used (adults v. breeders v. total size), taxonomicgroup and unequal sex-ratio. There were no significant effects on the ratio of high v. low fecundity,demographic r. genetic methods of estimation, or of overlapping v. non-overlapping generationswhen the same variables were included in estimates. Comprehensive estimates of NJN (thatincluded the effects of fluctuation in population size, variance in family size and unequal sex-ratio)averaged only 0-10—0-11. Wildlife populations have much smaller effective population sizes thanpreviously recognized.
1. Introduction
Finite population size results in inbreeding and loss ofgenetic variation. Its genetic effects are predicted todepend on the effective population size (Ne) ratherthan the actual size (TV). The predicted relationshipsof genetic variation and inbreeding with effectivepopulation size are given by equation (1) (Falconer,1989)
HJH0 = [1 -\/2Ne)]> = l -F, (1)
where Ht is heterozygosity after / generations, Hn isinitial heterozygosity, and F is the inbreeding co-efficient.
Since census sizes are the only demographic dataavailable for most populations, the ratio of NJN is acritical parameter for evolutionary genetics andwildlife management. For example, a minimum ratioof 0-2 is assumed in the Mace-Lande criteria forendangerment (Mace & Lande, 1991), andassumptions for NJN are inherent in estimates ofminimum viable population size (Nunney & Campbell,1993). Unequal sex-ratios, variance in family sizes,and fluctuations in population size over generationsare all predicted to affect NJN (Wright, 1969;Falconer, 1989). Experimental tests have validated
these predictions (Borlase et al. 1993; Briton et al.1994; Woodworth et al. 1994).
Widely divergent views have been expressed aboutthe magnitude of NJN. Empirical estimates werereported to be 0-5-0-8 (Falconer, 1989; Spiess 1989),0-2-0-4 (Denniston, 1978; Mace, 1986), 0-2-0-5 (Mace& Lande, 1991), 0-25-1 -0 (Nunney & Campbell, 1993),or 0-56-1-27 (Nunney & Elam, 1994), while values aslow as 10~6 have been reported (Hedgecock, Chow &Waples, 1992). Nunney (1993) predicted that specialcircumstances would be required for the ratio to bemuch less than 0-5, Nunney & Campbell (1993)suggested that it would usually be greater than 0-25,while Nei & Tajima (1981) suggested that it would beless than 0-1 in small organisms. In spite of the criticalimportance of NJN ratios in conservation andevolutionary biology, there has been no recentcomprehensive review of estimates.
To predict the effects of finite population size oninbreeding and loss of genetic variation, estimatesmust encompass the effects of unequal sex-ratio,variance in family size and fluctuation in populationsize (comprehensive estimates). A range of genetic anddemographic methods have been used to estimate Ne
(see below). Typically genetic estimates have includedall three relevant variables, while most demographic
https://www.cambridge.org/core/terms. https://doi.org/10.1017/S0016672300034455Downloaded from https://www.cambridge.org/core. IP address: 54.39.106.173, on 07 Mar 2020 at 12:33:36, subject to the Cambridge Core terms of use, available at

R. Frankham 96
estimates have not included the effects of fluctuationsin population size. Consequently, many availableestimates of NJN, particularly demographic ones,may be overestimates.
Wildlife species differ in life history characteristics,so they may differ in NJN ratios. High fecundityspecies might be expected to have lower ratios due tohigh variance in family sizes, and perhaps greaterfluctuations in population size over generations.Species exhibiting polygamy would be expected tohave lower ratios than monogamous species due tounequal sex-ratio and high variance of male gameticcontributions.
The objectives of this contribution were to reviewestimates of NJN in order to identify the majorvariables affecting the ratio, and to obtain a reliablecomprehensive estimate of the ratio. In particular,they were to test the hypotheses that (i) sex-ratio,variance in family size, and fluctuating population sizeaffect the ratio; (ii) taxonomic groups differ in ratio;(iii) life history characteristics affect the ratio and (iv)different methods yield different estimates. Estimateswere compared with the 0-5 and 0-25 values predictedabove. Means for comprehensive estimates werecomputed by two methods. NJN averaged onlyO10-0-11, much smaller than previously recognized.
2. Methods of estimating Ne
The concept of effective population size was intro-duced by Wright (1931, 1938, 1939) and has beenrefined by others, especially Crow and co-workers (seeCrow & Kimura, 1970; Caballero, 1994). Ne is definedas the size of an idealized population that would giverise to the same variance of gene frequency, or rate ofinbreeding as in the actual population under con-sideration (see Falconer, 1989; Caballero, 1994).Three effective sizes have been denned: inbreeding,variance and eigenvalue. Estimates from the formertwo are the same under random mating and constantsize over generations, but can differ when populationsizes are changing, and also differ from the eigenvalueestimate (see Caballero, 1994; Templeton & Read,1994).
Unequal sex-ratio (SR), variance in family size(VFS), and fluctuations in population size (FPS) arethe major variables predicted to affect Ne (Wright,1969; Lande & Barrowclough, 1987; Falconer, 1989).Their effects are given by equations 2-4 below.
= 4N,Nm/[N,+ Nm (2)
where Nf and Nm are the number of female and maleparents of the next generation.
Ne = N/[\+{Vk-mk)/mk], (3)
where N is the number of sexually mature, non-senescent adults, mk is the mean number of gametesper individual contributing to production of matureindividuals in the next generation, and Vk is the
variance in gametic contributions (Gowe, Robertson& Latter, 1959).1 /Ne = [1 /Ne, +1 /Ne2 + 1 /Ne3 + ...1 /Net... 1 /Net]/t,
(4)where Nei is the effective population size in the rthgeneration.
Equations to accommodate overlapping gener-ations have been developed by Hill and others (seeCaballero 1994; Nunney & Elam, 1994), and oneto include the effects of selfing by Heywood (1986).
Demographic estimates of Ne have relied on one ormore of equations 2-4. Very few such estimates haveincluded all these variables. Genetic estimates havebeen made from changes in allozyme heterozygosity(or quantitative genetic variation) over time usingequation 1 (Briscoe et al. 1992), from drift variancesamong populations for allozymes (Easteal & Floyd,1986), from linkage disequilibrium (Hill, 1981; Bartleyet al. 1992), lethal allelism (Malpica & Briscoe, 1981),and from changes in pedigree inbreeding over time(Tomlinson et al. 1991). Typically genetic estimateswere comprehensive estimates.
The time frame of interest in conservation biologyis several generations to a few hundred generations.The genetic estimates reviewed here reflect this timeframe. Long-term species estimates of Ne, based oneither a neutral interpretation of allozyme variation(Nei & Graur, 1984; Schoen & Brown, 1991), a drift-heterokaryotype disadvantage model of karyotypeevolution (Lande, 1979; Barrowclough & Shields,1984), or DNA sequence divergence (Avise, Ball &Arnold, 1988) operate over hundreds of thousands tomillions of generations, and require additionalassumptions, so they have not been included in thesurvey in the Appendix. However, the mean of the Nei& Graur (1984) estimates has been computed tocompare with estimates from the data in the Appendix.
3. Data
There are 192 published estimates of the NJN ratiofrom 102 species of insects, molluscs, amphibians,reptiles, birds, mammals and plants listed in theAppendix along with estimation methods, thevariables they include, and the N value used. Thevalues reported for the Japanese human population(Imaizumi, Nei & Furusho, 1970) were restricted tomothers' birth dates prior to 1910 as birth controlaffected values after that. Estimates based on the useof segregating mutations (Nozawa, 1963, 1970;Wright, 1977, 1978; Wade, 1980; Pray et al. 1995) aregiven for comparative purposes, but were not includedin statistical analyses as they may have been influencedby natural selection, and such estimates were notavailable outside insects. NJN estimates for whitespruce and black spruce that included only the effectsof maternal-to-seed sampling, rather than seedlingestablishment, were not included (Cheliak, Pitel &Murray, 1985; Barrett, Knowles & Cheliak, 1987).
https://www.cambridge.org/core/terms. https://doi.org/10.1017/S0016672300034455Downloaded from https://www.cambridge.org/core. IP address: 54.39.106.173, on 07 Mar 2020 at 12:33:36, subject to the Cambridge Core terms of use, available at

Ne/N in wildlife 97
Values for domestic animal populations and mutantstocks were excluded. The estimate for Rana pipiensfrom Merrell (1968) was not used in the statisticalanalyses as it was only an estimate of the ratio ofbreeding adults to all adults.
Estimates varied widely in methods used, variablesincluded, precision, and in the value of N used. Fewdemographic estimates were based on paternities thathad been verified with genetic markers. Many earlyestimates were based on limited data, and are littlebetter than guesses. Details of what had been done, orwhat N was used for the divisor were sometimesunclear (and the authors could not always clarify suchmatters!). The information in the Appendix representsmy best attempt to glean the details for the publishedestimates. Apart from one case, the values of Ne andN given by the authors have been accepted.
Three different values of TV have been used in NJNestimates, total census size (NT = adults + juveniles),number of adults (NA = breeding + senescent adults),and number of breeding adults (NB = sexually matureadults, including sterile individuals and non-breedinghelpers). No one measure of N fits all needs, and thereis a clear need to specify carefully which N is used. Forcomparative purposes, a single type of N must beused. NA is probably the most appropriate value forthis purpose (Nunney & Elam, 1994). Conversely, forconservation purposes, the census size (Nc) is the mostappropriate divisor, as the ratio of Ne/Nc is requiredto translate census size into Ne. The census populationsize may be NA, NB or NT, depending on the organismsbeing considered. Wherever possible NA or NB hasbeen reported herein, with 60 estimates using NA,90 NB and 24 NT. The effects of using different Nvalues were tested in the analyses described below.
The specification of N when population sizefluctuates is also a difficult issue. Since we wish toextrapolate from observed population sizes to Ne, themean population size seems the appropriate value toinsert; this is what I have used. The issue is morevexed where there have been large increases ordecreases in population size. In the northern hairy-nosed wombat (Taylor, Sherwin & Wayne, 1994), thepopulation dropped from several thousands to 20-30adults by 1981 and has subsequently increased to 53adults (A. Taylor pers. comm.). To be conservative, Ihave used the mean of 25 and 53 = 39 as the divisorfor the NJN ratios for this species in the Appendix.
Data were inappropriate to test directly for theeffects of polygamy on an individual species basis, asbreeding systems were often not specified, or notknown. A weak test of the effects of polygamy v.monogamy was provided by comparing mammalswith birds, as the former group is commonly pol-ygamous, while the latter is reputed to be largelymonogamous (see Briton et al. 1994).
In some cases repeat estimates were available on thesame populations (Malpica & Briscoe, 1981 andBriscoe et al. 1992; Tomlinson et al. 1991; Reed et al.
1993 and Blackwell et al. 1995; Crow & Morton, 1955and Nei & Murata, 1966; Imaizumi et al. 1970;MacCluer & Shull, 1970 and Nei, 1970; Felsenstein,1971, Emigh & Pollak, 1979 and Charlesworth, 1980;Taylor et al. 1994 and Taylor pers. comm.; Husband& Barrett, 1992). Analyses were generally done onboth the full data set and on the data set where repeatestimates on the same population were pooled.
4. Statistical analyses
All statistical analyses were done using the MINITABstatistical package (release 7). Where a range wasgiven for an estimate, statistical analyses were basedon means of the individual estimates, or the mid-pointof this range where no further information wasavailable. The main analyses were done on four datasets; the full data set that included 165 estimates withcomplete information, including repeat estimates onthe same populations, but excluding one outlier (seebelow). The pooled data set had 135 estimates; repeatestimates on the same population were pooled and themean on the transformed scale (see below) used. Thefull comprehensive data set consists of the 56 estimatesthat had the effects of all relevant variables included(FPS, VFS and SR). The pooled comprehensive dataset had 36 entries with repeat estimates pooled asabove. The estimates for the plant Eichhorniapaniculata (Husband & Barrett, 1992) had all relevantvariables included and so were included in com-prehensive estimates, but they were monoecious sothey were not considered to include the effects ofunequal sex-ratio.
(i) Normality and outliers
As the data were not normally distributed (sigmoidnormal probability plot between NSCOR and data),they were arcsine square root transformed (radians)prior to analyses. Data were normally distributed onthis scale (linear relationship between NSCOR andtransformed data, correlation = 0-997). One clearoutlier was identified (see Fig. 1), the estimate of 0-9
• ••• • • • # ••••••• •••••••••• • • • © comprehensive
00011
0-2 0-4 0-5 0-6 0-8 10
• •• ••• •••••••• • •• • • • • • • • • • • • • • • • • • • •• • • • • • • • • • • • • • • • • • • • • • • • •# • • • •• • • • • • • • • • • • • • • • • • • • • • A • • • • • • • • • • • • •• • • • • • • • •• ••••• •• • • •
•• ••••••••••• •••• •00 +
034 05Ne/N
, all1 0
Fig. 1. Distributions of estimates of effective/actualpopulation size (NJN) ratios. Comprehensive estimates(that include the effects of fluctuation in population size,variance in family size and unequal sex-ratio) are aboveand all estimates below. The circled outlier is for a pairmated rainbow trout (Oncorhynchus mykiss) population.Means of estimates are indicated below vertical lines.
https://www.cambridge.org/core/terms. https://doi.org/10.1017/S0016672300034455Downloaded from https://www.cambridge.org/core. IP address: 54.39.106.173, on 07 Mar 2020 at 12:33:36, subject to the Cambridge Core terms of use, available at

R. Frankham 98
for pair mated rainbow trout (Bartley et al. 1992). Asthis was a managed population, while all the otherswere relatively unmanaged, it was omitted prior tostatistical analyses, except for overall mean and the?-test of all data versus 0-5. Otherwise the number ofpotential outliers identified by regressions or analysesof variance were within the numbers expected. Thetwo remaining estimates with the highest standardizedresiduals were 0-78-0-93 for the plant Chaemacristafasciculata and 009 for the bird Melanerpes formici-vorous. There were no clear biological reasons to omitthese values. The minimum estimate (10~6 for thePacific oyster Crassostrea gigas) was not identified asan outlier.
(ii) Identifying major variables affecting Ne/N
Stepwise multiple regressions were performed toidentify the most important variables explainingdifferences in NJN. Independent variables wereinclusion v. exclusion of the effects of fluctuation inpopulation size, variance in family size, unequal sex-ratio and overlapping generations, plus method ofestimation, high v. low fecundity, taxonomic group,and NB v. NA v. NT. Where more than one degree offreedom was associated with an effect, single degree offreedom indicator variables were generated and usedin the analyses. The effect of different methods ofestimation (genetic v. demographic) was tested in thefull data set by one way analysis of variance, and afterthe effects of FPS, VFS, N, taxonomic group and SRhad been removed in a general linear model (GLM)analysis of variance. Comprehensive estimates weretested for the full range of effects of method, fordemographic v. genetic and among genetic estimationmethods using GLM analyses of variance with formof N and method as the variables. The effect of plantsv. animals in the comprehensive data set was alsotested using a one-way analysis of variance.
(iii) Computation and testing of means
Means were computed on the transformed scale andde-transformed means reported. Comprehensive esti-mates were computed in two ways. Means for thoseestimates containing the effects of all relevant variables(FPS, VFS and SR) were computed for both the fulldata set and the pooled data set. Multiple regressionswere done on the full and pooled data sets with FPS,VFS and SR effects entered in this order, and estimatesof the comprehensive NJN derived from the multipleregression equations. Means were also computed forthose estimates that included only the effects of VFS,only SR, and only VFS and SR.
Tests of means against predictions were done usingMests (all estimates v. 0-5, estimates that includedVFS and SR, but not FPS v. 0-5, comprehensive
estimates v. 0-25). Comprehensive estimates werecompared with estimates that did not include allvariables using a two sample r-test.
The mean of the estimates made by Nei & Graur(1984) was obtained by subjecting them to arcsinesquare root transformation (excluding 13 estimates of0 and setting two estimates of greater than unity to1-0), computing means, and de-transforming them.Confidence intervals were computed on the trans-formed scale, and de-transformed.
5. Results
(i) Factors accounting for variation in Ne/N
Estimates of NJN ranged from 10"6 in Pacific oysters(Crassostrea gigas) to 0-994 in humans and averaged0-34 (Table 1). A major reason for the large variationamong estimates was that they were estimatingdifferent things (Appendix). They included or excludedSR, VFS, and FPS, and different values ofN(NB, NA
or NT) were used as divisors. Less than one third werecomprehensive estimates that included the effects ofall relevant variables. Comprehensive estimatesshowed a much lower variance than all estimates(Fig. 1).
The most important variables explaining differencesin NJN in the pooled data set, in order of importance,were fluctuation in population size, variance in familysizes, NB v. NA and NT, plants v. animals, unequal sexratio, and birds v. other animals as revealed by
Table 1. Mean estimates ofNJNfor the effects offluctuations in population size (FPS), variance infamily size (VFS), unequal sex-ratios (SR), and theircombinations, plus form o/N, plants v. animals, andbirds v. other animals
Estimates Mean
SR + VFS + FPS- Comprehensive estimates 011* f-Multiple regression 010* f
SR +VFS only 0-35VFS only 0-46SR only 0-64All data 0-34
GLM estimates}FPSVFSSR
NB v. NA v. NT
Plants v. animalsBirds v. other animals
Inclusion0140140-20
0-390160-21
Exclusion0-400-400-33
0-25 0160-390-32
* Mean for the pooled data set.t Mean for the full data sets.% Means below all generated following GLM analysis ofvariance with FPS, VFS, N, plants v. animals, SR and birdsv. other animals.
https://www.cambridge.org/core/terms. https://doi.org/10.1017/S0016672300034455Downloaded from https://www.cambridge.org/core. IP address: 54.39.106.173, on 07 Mar 2020 at 12:33:36, subject to the Cambridge Core terms of use, available at
N e /N in wildlife 99
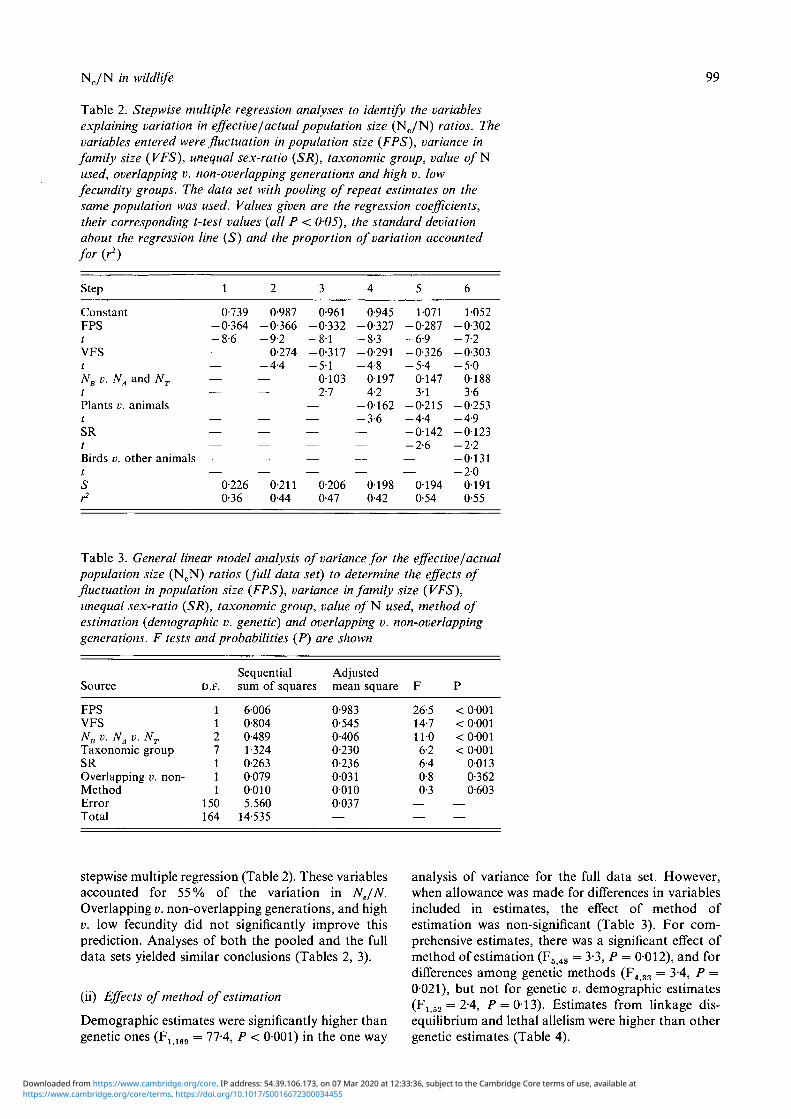
Table 2. Stepwise multiple regression analyses to identify the variablesexplaining variation in effective/actual population size (Ne/N) ratios. Thevariables entered were fluctuation in population size (FPS), variance infamily size (VFS), unequal sex-ratio (SR), taxonomic group, value o / Nused, overlapping v. non-overlapping generations and high v. lowfecundity groups. The data set with pooling of repeat estimates on thesame population was used. Values given are the regression coefficients,their corresponding t-test values (all P < 0-05), the standard deviationabout the regression line (S) and the proportion of variation accountedfor (r2)
Step
ConstantFPStVFStNB v. NA and NT
tPlants v. animalstSRtBirds v. other animalstSr2
1
0-739-0-364-8-6——————————
0-2260-36
2
0-987-0-366-9-2-0-274-4-4————————
0-2110-44
3
0-961-0-332- 8 1-0-317-5-1
01032-7
——————
0-2060-47
4
0-945-0-327-8-3-0-291-4-8
01974-2
- 0 1 6 2-3-6————
01980-42
5
1071-0-287-6-9-0-326-5-4
01473-1
-0-215-4-4- 0 1 4 2-2-6——
01940-54
6
1-052-0-302-7-2-0-303- 5 0
01883-6
-0-253-4-9- 0 1 2 3-2-2-0-131- 2 0
01910-55
Table 3. General linear model analysis of variance for the effective/actualpopulation size (NeN) ratios {full data set) to determine the effects offluctuation in population size (FPS), variance in family size (VFS),unequal sex-ratio (SR), taxonomic group, value of N used, method ofestimation (demographic v. genetic) and overlapping v. non-overlappinggenerations. F tests and probabilities (P) are shown
Source
FPSVFSNB v. NA v. NT
Taxonomic groupSROverlapping v. non-MethodErrorTotal
D.F.
1127111
150164
Sequentialsum of squares
60060-8040-4891-3240-263007900105.560
14-535
Adjustedmean square
0-9830-5450-4060-2300-236003100100-037—
F
26-514-71106-26-40-80-3
——
P
< 0001< 0001< 0001< 0001
00130-3620-603
——
stepwise multiple regression (Table 2). These variablesaccounted for 55% of the variation in NJN.Overlapping v. non-overlapping generations, and highv. low fecundity did not significantly improve thisprediction. Analyses of both the pooled and the fulldata sets yielded similar conclusions (Tables 2, 3).
(ii) Effects of method of estimation
Demographic estimates were significantly higher thangenetic ones (Fr 169 = 77-4, P < 0001) in the one way
analysis of variance for the full data set. However,when allowance was made for differences in variablesincluded in estimates, the effect of method ofestimation was non-significant (Table 3). For com-prehensive estimates, there was a significant effect ofmethod of estimation (F5 48 = 3-3, P = 0012), and fordifferences among genetic methods (F4 33 = 3-4, P =0021), but not for genetic v. demographic estimates(Fj 52 = 2-4, P = 013). Estimates from linkage dis-equilibrium and lethal allelism were higher than othergenetic estimates (Table 4).
https://www.cambridge.org/core/terms. https://doi.org/10.1017/S0016672300034455Downloaded from https://www.cambridge.org/core. IP address: 54.39.106.173, on 07 Mar 2020 at 12:33:36, subject to the Cambridge Core terms of use, available at
R. Frankham 100
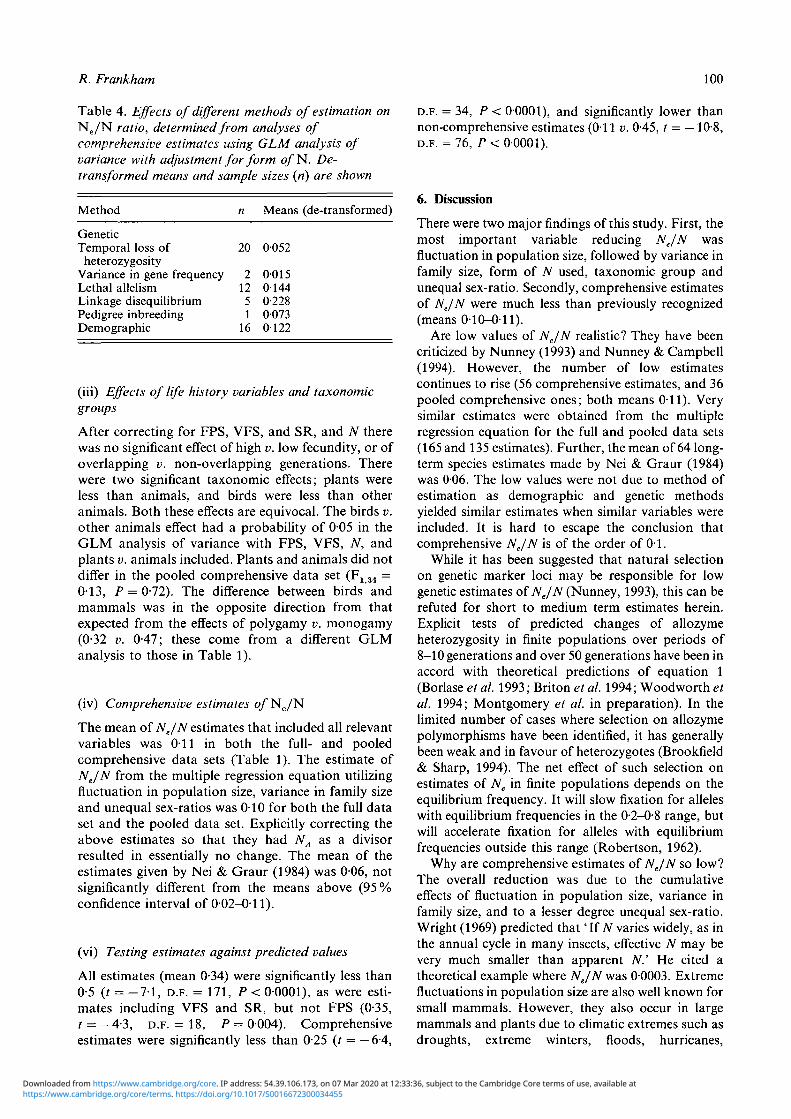
Table 4. Effects of different methods of estimation onNe/N ratio, determined from analyses ofcomprehensive estimates using GLM analysis ofvariance with adjustment for form o/N. De-transformed means and sample sizes (n) are shown
Method n Means (de-transformed)
GeneticTemporal loss of
heterozygosityVariance in gene frequencyLethal allelismLinkage disequilibriumPedigree inbreedingDemographic
20
21251
16
0-052
001501440-22800730122
(iii) Effects of life history variables and taxonomicgroups
After correcting for FPS, VFS, and SR, and N therewas no significant effect of high v. low fecundity, or ofoverlapping v. non-overlapping generations. Therewere two significant taxonomic effects; plants wereless than animals, and birds were less than otheranimals. Both these effects are equivocal. The birds v.other animals effect had a probability of 005 in theGLM analysis of variance with FPS, VFS, N, andplants v. animals included. Plants and animals did notdiffer in the pooled comprehensive data set (F13t =0-13, P = 0-72). The difference between birds andmammals was in the opposite direction from thatexpected from the effects of polygamy v. monogamy(0-32 v. 0-47; these come from a different GLManalysis to those in Table 1).
(iv) Comprehensive estimates of Ne/N
The mean of NJN estimates that included all relevantvariables was 011 in both the full- and pooledcomprehensive data sets (Table 1). The estimate ofNe/N from the multiple regression equation utilizingfluctuation in population size, variance in family sizeand unequal sex-ratios was 010 for both the full dataset and the pooled data set. Explicitly correcting theabove estimates so that they had NA as a divisorresulted in essentially no change. The mean of theestimates given by Nei & Graur (1984) was 0-06, notsignificantly different from the means above (95%confidence interval of 0-02-0-11).
(vi) Testing estimates against predicted values
All estimates (mean 0-34) were significantly less than0-5 (t = -7 -1 , D.F. = 171, P < 0-0001), as were esti-mates including VFS and SR, but not FPS (0-35,r = _4-3, D.F. = 18, P = 0004). Comprehensiveestimates were significantly less than 0-25 (/ = —6-4,
D.F. = 34, P < 00001), and significantly lower thannon-comprehensive estimates (011 v. 0-45, t = —10-8,D.F. = 76, P < 0 0001).
6. Discussion
There were two major findings of this study. First, themost important variable reducing NJN wasfluctuation in population size, followed by variance infamily size, form of N used, taxonomic group andunequal sex-ratio. Secondly, comprehensive estimatesof NJN were much less than previously recognized(means 010-011).
Are low values of NJN realistic? They have beencriticized by Nunney (1993) and Nunney & Campbell(1994). However, the number of low estimatescontinues to rise (56 comprehensive estimates, and 36pooled comprehensive ones; both means 011). Verysimilar estimates were obtained from the multipleregression equation for the full and pooled data sets(165 and 135 estimates). Further, the mean of 64 long-term species estimates made by Nei & Graur (1984)was 006. The low values were not due to method ofestimation as demographic and genetic methodsyielded similar estimates when similar variables wereincluded. It is hard to escape the conclusion thatcomprehensive NJN is of the order of 0-1.
While it has been suggested that natural selectionon genetic marker loci may be responsible for lowgenetic estimates of NJN (Nunney, 1993), this can berefuted for short to medium term estimates herein.Explicit tests of predicted changes of allozymeheterozygosity in finite populations over periods of8-10 generations and over 50 generations have been inaccord with theoretical predictions of equation 1(Borlase et al. 1993; Briton et al. 1994; Woodworth etal. 1994; Montgomery et al. in preparation). In thelimited number of cases where selection on allozymepolymorphisms have been identified, it has generallybeen weak and in favour of heterozygotes (Brookfield& Sharp, 1994). The net effect of such selection onestimates of Ne in finite populations depends on theequilibrium frequency. It will slow fixation for alleleswith equilibrium frequencies in the 0-2-0-8 range, butwill accelerate fixation for alleles with equilibriumfrequencies outside this range (Robertson, 1962).
Why are comprehensive estimates of NJN so low?The overall reduction was due to the cumulativeeffects of fluctuation in population size, variance infamily size, and to a lesser degree unequal sex-ratio.Wright (1969) predicted that' If N varies widely, as inthe annual cycle in many insects, effective TV may bevery much smaller than apparent N.' He cited atheoretical example where NJN was 00003. Extremefluctuations in population size are also well known forsmall mammals. However, they also occur in largemammals and plants due to climatic extremes such asdroughts, extreme winters, floods, hurricanes,
https://www.cambridge.org/core/terms. https://doi.org/10.1017/S0016672300034455Downloaded from https://www.cambridge.org/core. IP address: 54.39.106.173, on 07 Mar 2020 at 12:33:36, subject to the Cambridge Core terms of use, available at

Ne/N in wildlife 101
parasites and disease (Young, 1994). While there ishigher variance in population size per year in smallerthan larger mammals, different sized animals havesimilar variance in population size when measured ona per generation basis (Sinclair, 1995). Fluctuation inpopulation size was identified as the most importantvariable affecting the ratio by my analyses. Wright(1978) recognized that variance in family size mayalso reduce NJN substantially; he attributed empiricalestimates of NJN for the moth Panaxia dominula of0-26 and 008 to this factor. This was identified as thesecond most important factor reducing the ratio.
The published estimates do not support Nunney's(1993) suggestion that estimates should only be lessthan 0-5 in exceptional circumstances, as they weresignificantly less than this value. Comprehensiveestimates were significantly less than Nunney &Campbell's (1993) prediction of a minimum of 0-25.These authors suggested that values could be less thanthis if population sizes fluctuated significantly. Thisseems to be the case. This study identified fluctuationin population size as the most important variableaffecting the ratio.
Surprisingly, life history characteristics showedlittle evidence of effects of NJN. The effects ofhigh v. low fecundity, overlapping v. non-overlappinggenerations, and polygamy v. monogamy (frommammals v. birds) showed no clear effects. The onlysignificant taxonomic effects were those of plants v.animals and birds v. other animals, and there is somedoubt about the reality of both those effects. Theeffects of life history characteristics and taxonomicgroup should be reevaluated when more estimates(especially comprehensive ones) accumulate.
Estimates of NJN from demographic and geneticmethods did not differ when the same variables wereincluded, in agreement with Husband & Barrett's(1992) findings. There were significant differencesamong genetic methods in analyses of comprehensiveestimates; estimates from lethal allelism and linkagedisequilibrium were higher than other genetic esti-mates. Falconer (1989) obtained similar estimates ofNe from temporal changes in heterozygosity, drift ingene frequencies and pedigree inbreeding in pedigreedmouse population. In Drosophila, similar estimatesfrom temporal changes in heterozygosity and pedigreeinbreeding (Borlase et al. 1992; Woodworth et al.1994), and among temporal changes in heterozygosity,quantitative genetic variation, and from lethal allelismhave been found (Briscoe et al. 1992). Conversely,Begon, Krimbas & Loukas (1980) concluded thatestimates from lethal allelism and an ecologicalmethod were concordant, while a lower estimate fromtemporal genetic change was attributed to directionalselection on two allozyme loci. In birds, Blackwell etal. (1995) found lower NJN estimates from pedigreeinbreeding than from demographic estimates, possiblyas a consequence of the population structure. Whilethere may be real differences among methods, they do
not alter the conclusion that comprehensive estimatesof NJN are low.
Estimates of Ne are expected to depend on theenvironmental conditions experienced by populations.Climatic conditions are likely to affect birth and deathrates, variance in family sizes, and perhaps matingpatterns in different years and habitats. Further,crowding is likely to affect demographic variables.Lower NJN ratios at higher densities have beenreported in Drosophila (Nozawa, 1963, 1970),Tribolium (Wade, 1980; Pray et al. 1995), the mothPanaxia dominula (Wright, 1978) and the plantEichhornia paniculata (Husband & Barrett, 1992).Bird populations in different habitats had differentratios (Reed et al. 1993). Such factors deserve moreattention than they have hitherto received.
These observations have important conservationimplications. First, NJN ratios are even lower thanpreviously suspected. Most current estimates of theratio ignore the effects of fluctuation in populationsize, and are thus serious overestimates. Consequently,wildlife populations are in a worse state geneticallythan is currently recognized. Secondly, criteria such asthe Mace-Lande criteria for endangerment and mini-mum viable population size estimates need to berevised to take account of the lower than assumedNJN values. Typical values of Ne are about one orderof magnitude less than adult population sizes. Theform of census sizes differs among taxonomic groups,typically being NA in insects and plants, NA or NB inbirds and NT in mammals. Consequently, the requiredadjustment will be even greater in mammals as mostcensus size estimates include both adults and juveniles.For humans, the required further downward ad-justment is approximately 1/3, based on 1/3 of thecensus size being sexually mature adults, 1 /3 juveniles,and 1/3 beyond reproductive age (Jorde, 1980). Forbirds, either adults or breeding pairs are recorded. Anupwards adjustment is required if TV is breeding pairs.It is of critical importance that the form of N bespecified when reporting estimates of NJN, and thatthe proportion of adults be specified if census sizeestimates contain other than adults, so that theadjustment factor can be calculated to estimate Ne
from census numbers.In conclusion, comprehensive values of NJN are
much smaller than has previously been recognized.
I thank Jon Ballou, Nancy FitzSimmons, Georgina Mace,Eleanor Russell, Bill Sherwin and Andrea Taylor forinformation, David Briscoe, Deborah Charlesworth, MarkEldridge, Philip England, Douglas Falconer, Dean Gilligan,Michael Gilpin, Bill Hill, Russell Lande, Barrie Latter,Annette Lindsay, Len Nunney, Sienna Margan, MargaretMontgomery, Kathy Rails, Derek Spielman, Paul Sunnucks,Andrea Taylor, Lynn Woodworth and two anonymousreferees for comments and Barbara Duckworth for as-sistance in preparing the figure. This research was supportedby Australian Research Council and Macquarie Universityresearch grants. Publication No. 177 of the Research Unitfor Biodiversity and Bioresources.
https://www.cambridge.org/core/terms. https://doi.org/10.1017/S0016672300034455Downloaded from https://www.cambridge.org/core. IP address: 54.39.106.173, on 07 Mar 2020 at 12:33:36, subject to the Cambridge Core terms of use, available at

R. Frankham
Appendix
102
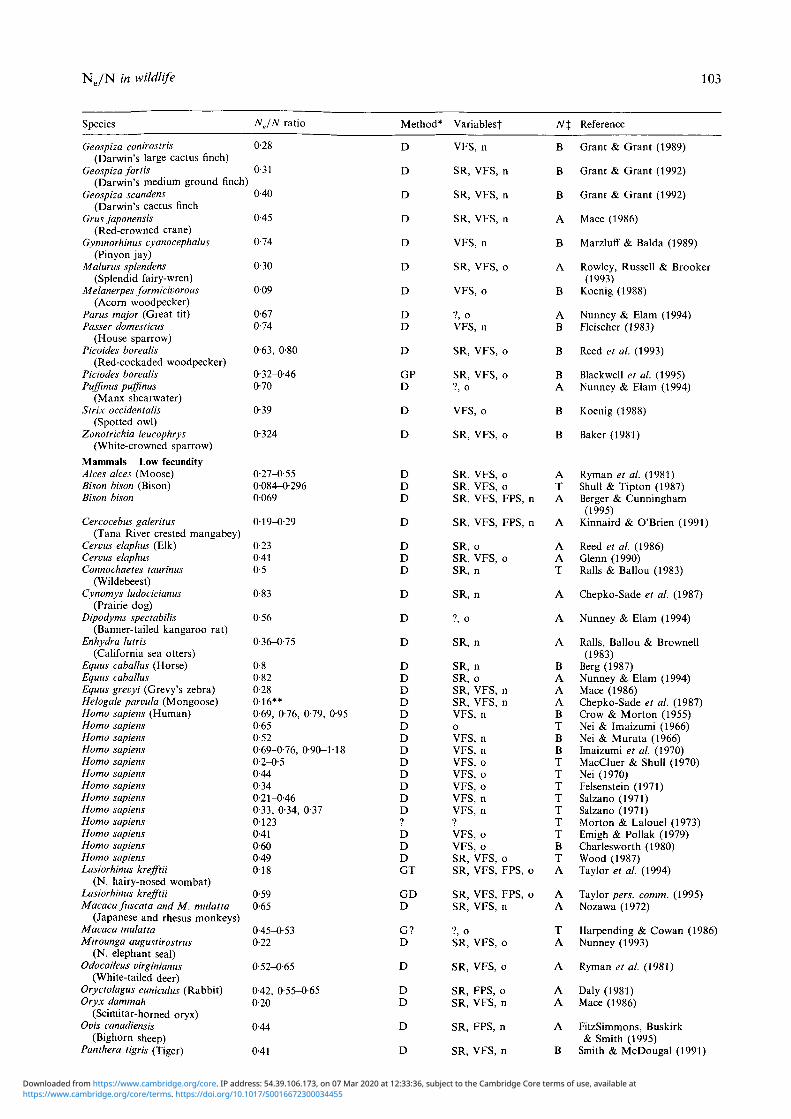
Estimates of effective/actual population size (Ne/N) ratios in different species, along with method of estimation,variables included in the estimate, the form of population size (N) used as divisor, and the reference. Commonnames are given in brackets
Species
Insects High fecundityCeratitis capitata
(Mediterranean fruit fly)Coelopa frigida (Seaweed fly)Dacus oleae (Olive fruit fly)Drosophila melanogaster
(Fruit fly)D. melanogaster
D. melanogasterD. melanogaster
D. melanogasterD. melanogaster
D. melanogasterD. melanogaster
D. melanogaster
D. melanogasterD. pseudoobscuraD. subobscuraPanaxia dominula (Moth)Tribolium castaneum
(Red flour beetle)Tribolium castaneum
Molluscs High fecundityCepaea nemoralis (Snail)Crassostrea gigas
(Pacific oyster)Lymnea columella (Snail)
Fish High fecundityA tractoscion nobilis
(Sea bass)Oncorhynchus kisutch
(Coho salmon)Oncorhynchus mykiss
(Rainbow trout)Oncorhynchus tshawytscha
(Chinook salmon)
Amphibians High fecundityBufo marinus (Great toad)Notophthalmus viridescens
(Red-spotted newt)Rana pipiens (Leopard frog)Rana sylvatica (Wood frog)
Reptiles High fecunditySceloporus olivaceus
(Rusty lizard)Uta stansburiana stejnegera
(Lizard)Birds Low fecundityAccipiter gentilis
(Northern goshawks)Aphelocoma coerulescens
(Florida scrub jay)Cairina scutulata
(White-winged wood duck)Cairina scutulata
NJN ratio
0-41
00047, 000090180.256, oo§
0-48, 0-71, 0-72, 0-74,0-85, 0-85, 0-90
0-38, 0-231-07, 0-98, 0-80, 0-32,
0-14, 0-73, 0-72, 0-72,0-35, 016
0-1380-83, 0-72, 0-67, 0-75,
0-69, 0-460-360-038, 0077, 0-079, 0-085
0-225, 0-2500078, 0122, 0151,
0-285, oo§0037, 0051, 0004, 00160012, 00360-083-0097H0077, 0-2560-76-0-95
104, 0-98, 0-96, 0-95,0-91, 0-78, 0-75
0-5< 10"6
0-75
0-27-0-40
0-24
0-90
0013, 0-043
O-O16-O0880073
001-0-670-44
0-22
0-61-0-74
0-41
0-48
0052
0094
Method*
D
GTGTGL
D
GMGM
GLGM
GDGL
GL
GTGTDGMGM
GM
DGV
D
GD
D
GD
GD
GVD
DD
D
D
D
D
GP
D
Variables')-
VFS, n
SR, VFS, FPS, oSR, VFS, FPS, oSR, VFS, FPS, o
VFS, n
SR, VFS, nVFS, n
SR, VFS, FPS, oVFS, n
SR, VFS, FPS, oSR, VFS, FPS, o
SR, VFS, FPS, o
SR, VFS, FPS, oSR, VFS, FPS, oSR, VFS, FPS, nSR, VFS, nVFS, n
VFS, n
VFS, nSR, VFS, FPS, o
VFS, n
SR, VFS, FPS, o
SR, VFS, n
SR, VFS, FPS, o
SR, VFS, FPS, o
SR, VFS, FPS, oSR, VFS§, FPS, n
nSR, FPS, n
VFS, o
VFS, n
?, o
VFS, o
SR, VFS, FPS, o
SR, VFS, FPS, o
Nt
A
TAA
B
BB
AB
AA
A
AABAB
B
AA
B
A
A
A
A
AA
AB
A
B
B
B
T
T
Reference
Debouzie (1980)
Butlin & Day (1989)Nei & Tajima (1981)Prout (1954)
Crow & Morton (1955)
Nozawa (1963)Nozawa (1970)
Murata (1970)Wright (1977)
Hill (1981)Malpica & Briscoe (1981)
Lopez-Fanjul & Torroja(1982)
Briscoe et al. (1992)Briscoe et al. (1992)Begon (1977)Wright (1978)Wade (1980)
Pray et al. (1955)
Greenwood (1974)Hedgecock, Chow & Waples
(1992)Crow & Morton (1955)
Bartley et al. (1992)
Simon, Mclntyre &Hemmingsen (1986)
Bartley et al. (1992)
Bartley et al. (1992)
Easteal & Floyd (1986)Gill (1978)
Merrell (1968)Berven & Grudzien (1990)
Kerster (1964)
Tinkle (1965)
Reed, Doerr & Walters(1986)
Koenig (1988)
Tomlinson et al. (1991)
Tomlinson et al. (1991)
https://www.cambridge.org/core/terms. https://doi.org/10.1017/S0016672300034455Downloaded from https://www.cambridge.org/core. IP address: 54.39.106.173, on 07 Mar 2020 at 12:33:36, subject to the Cambridge Core terms of use, available at
N e /N in wildlife 103
Species NJN ratio Method* Variablesf N% Reference
Geospiza conirostris(Darwin's large cactus finch)
Geospiza fortis(Darwin's medium ground finch)
Geospiza scandens(Darwin's cactus finch
Grus japonensis(Red-crowned crane)
Gymnorhinus cyanocephalus(Pinyon jay)
Malurus splendens(Splendid fairy-wren)
Melanerpes formicivorous(Acorn woodpecker)
Parus major (Great tit)Passer domesticus
(House sparrow)Picoides borealis
(Red-cockaded woodpecker)Piciodes borealisPuffinus puffinus
(Manx shearwater)Strix occidentalis
(Spotted owl)Zonotrichia leucophrys
(White-crowned sparrow)
Mammals Low fecundityAlces alces (Moose)Bison bison (Bison)Bison bison
Cercocebus galeritus(Tana River crested mangabey)
Cervus elaphus (Elk)Cervus elaphusConnochaetes taurinus
0-28
0-31
0-40
0-45
0-74
0-30
0-09
0670-74
0-63, 0-80
0-32-0-460-70
0-39
0-324
0-27-0-550-084-0-2960069
019-0-29
0-230-410-5
(Wildebeest)Cynomys ludocicianus
(Prairie dog)Dipodyms spectabilis
(Banner-tailed kangaroo rat)Enhydra lutris
(California sea otters)Equus caballus (Horse)Equus caballusEquus grevyi (Grevy's zebra)Helogale parvula (Mongoose)Homo sapiens (Human)Homo sapiensHomo sapiensHomo sapiensHomo sapiensHomo sapiensHomo sapiensHomo sapiensHomo sapiensHomo sapiensHomo sapiensHomo sapiensHomo sapiensLasiorhinus krefftii
(N. hairy-nosed wombat)Lasiorhinus krefftiiMacaca fuscata and M. mulatto
(Japanese and rhesus monkeys)Macaca mulattoMirounga augustirostrus
(N. elephant seal)Odocoileus virginianus
(White-tailed deer)Oryctolagus cuniculus (Rabbit)Oryx dammah
(Scimitar-horned oryx)Ovis canadiensis
(Bighorn sheep)Panthera tigris (Tiger)
0-83
0-56
0-36-0-75
0-80-820-28016**0-69, 0-76, 0-79, 0-950-65
0-52
0-69-0-76, 0-90-1 180-2-0-50-440-340-21-0-460-33, 0-34, 0-3701230-410-600-49018
0-590-65
0-45-0-530-22
0-52-0-65
0-42, 0-55-0-650-20
0-44
0-41
D
D
D
D
D
D
D
DD
D
GPD
D
D
Q
VFS, n
SR, VFS, n
SR, VFS, n
SR, VFS, n
VFS, n
SR, VFS, o
VFS, o
?, 0VFS, n
SR, VFS, o
SR, VFS, o?, o
VFS, o
SR, VFS, o
SR, VFS, oSR, VFS, oSR, VFS, FPS, n
SR, VFS, FPS, n
SR, oSR, VFS, oSR, n
B
B
B
A
B
A
B
AB
B
BA
B
B
ATA
A
AAT
Grant & Grant (1989)
Grant & Grant (1992)
Grant & Grant (1992)
Mace (1986)
Marzluff & Balda (1989)
Rowley, Russell & Brooker(1993)
Koenig (1988)
Nunney & Elam (1994)Fleischer (1983)
Reed et al. (1993)
Blackwell et al. (1995)Nunney & Elam (1994)
Koenig (1988)
Baker (1981)
Ryman et al. (1981)Shull & Tipton (1987)Berger & Cunningham(1995)
Kinnaird & O'Brien (1991)
Reed et al. (1986)Glenn (1990)Rails & Ballou (1983)
D
D
SR, n
•', o
A Chepko-Sade et al. (1987)
A Nunney & Elam (1994)
D
DDDDDDDDDDDDD?
DDDGT
GDD
G?D
D
DD
D
D
SR, n
SR, nSR, oSR, VFS, nSR, VFS, nVFS, n0
VFS, nVFS, nVFS, oVFS, oVFS, oVFS, nVFS, n?VFS, oVFS, oSR, VFS, oSR, VFS, FPS, o
SR, VFS, FPS, oSR, VFS, n
?, oSR, VFS, o
SR, VFS, o
SR, FPS, oSR, VFS, n
SR, FPS, n
SR, VFS, n
A
BAAABTBBTTTTTTTBTA
AA
TA
A
AA
A
B
Rails, Ballou & Brownell(1983)
Berg (1987)Nunney & Elam (1994)Mace (1986)Chepko-Sade et al. (1987)Crow & Morton (1955)Nei & Imaizumi (1966)Nei & Murata (1966)Imaizumi et al. (1970)MacCluer & Shull (1970)Nei (1970)Felsenstein (1971)Salzano (1971)Salzano (1971)Morton & Lalouel (1973)Emigh & Pollak (1979)Charlesworth (1980)Wood (1987)Taylor et al. (1994)
Taylor pers. comm. (1995)Nozawa (1972)
Harpending & Cowan (1986)Nunney (1993)
Ryman et al. (1981)
Daly (1981)Mace (1986)
FitzSimmons, Buskirk& Smith (1995)
Smith & McDougal (1991)
https://www.cambridge.org/core/terms. https://doi.org/10.1017/S0016672300034455Downloaded from https://www.cambridge.org/core. IP address: 54.39.106.173, on 07 Mar 2020 at 12:33:36, subject to the Cambridge Core terms of use, available at

R. Frankham
Species
Perameles gunnii(E. barred bandicoot)
Pleropus rodricensis(Rodrigues fruit bat)
Rhinoceros unicornis(Greater one-horned rhinoceros)
Sciurus caroliniensis(Gray squirrel)
Urocyon littoralis (Island fox)Ursus americanus (Black bear)Ursus arctos (Grizzly bear)
Plantsff High fecundityAgrostemma githargoAnagallis minimaAstrocaryum mexicanum
(Tropical palm)Avena fatua (Wild oats)Bidens cernuaBidens tripartataBlackstonia perfoliataCardamine hirsuta
Centaurium erythraeaChaenorhinum minusChamaecrista fasciculataCicendia fiiiformisCrassula tilaeaDamasonium alismaDiamophora smalliiEichhornia paniculata
Eichhornia paniculata
Gaillardia pulchellaImpatiens pallidaKickxia elatineKickxia spuriaLapsana communisLegousia hybridaLinum catharticumLinanthes androsaceusLudwigia leptocarpaMatricaria matricarioidesMoenchia erectaMyosurus minimusPapaver dubium (Poppy)Papaver dubiumPapaver rhoeasPhlox drummondiiPicea glauca
(White spruce)Radiola linoidesSaxifraga tridaclylitesSenecio sylvaticulsSolanum nigrumStephanomeria exiugaVeronica hederaefolia
NJN ratio
0135
018-0-43
0-61
0-59
0-500-690-28
0-676, 0-510}}0-413, 0-260}}0-18-0-43
0-510-511, 0-343}}0-517, 0-349}}0-212, 0-119}}0-585, 0.376,
0-414JJ, 0-232}}0-379, 0-234}}0-188, 0-104}}0-78-0-930-676, 0-511}}0-605, 0-433}}0-485, 0-321}}0-431, 0-275}}0054, 0015, 0093, 0002,
0146, 0164, 0174, 0086,0160, 0168
0114, 0080, 0-290, 0008,0191, 0066, 0-341, 0139,0191, 0184
0-386, 0-239}}0-344, 0-208}}0-265, 0152}}0-140, 0075}}0-379, 0-234}}0194, 0108}}0146, 0079}}0-306, 0181}}0-227, 0128}}0-31, 0-19}}0-62, 0-45}}0-63, 0-46}}0070-251, 0-144}}0-317, 0-188}}0-355, 0-216}}019
0-391, 0-243}}0-502, 0-335}}0-619, 0-448}}0-216, 0121}}0-299, 0-210}}0-660, 0-493}}
Method*
D
D
D
D
DDD
DDD
DDDDD
DDDDDDDGT
D
DDDDDDDDDDDDDDDDD
DDDDDD
Variables']-
SR, VFS. o
SR, VFS, FPS, o
SR, n
VFS, o
?, oSR, nSR, VFS, o
VFS, nVFS, nVFS, o
VFS, nVFS, nVFS, nVFS, nVFS, n
VFS, nVFS, nVFS, nVFS, nVFS, nVFS, nVFS, nVFS, FPS, o
VFS, FPS, n
VFS, nVFS, nVFS, nVFS, nVFS, nVFS, nVFS, nVFS, nVFS, nVFS, nVFS, nVFS, nVFS, nVFS, nVFS, nVFS, nVFS, n
VFS, nVFS, nVFS, nVFS, nVFS, nVFS, n
Nt
A
T
A
B
?
AT
BBA
BBBBB
BBABBBBB
B
BBBBBBBBBBBBABBBB
BBBBBB
104
Reference
Sherwin & Brown (1990)
Carroll & Mace (1988)
Dinerstein & McCracken(1990)
Charlesworth (1980)
Wayne et al. (1991)Chepko-Sade et al. (1987)Allendorf, Harris & Metzgar(1991)
Heywood (1986)Heywood (1986)Eguiarte et al. (1993)
Jain & Rai (1974)Heywood (1986)Heywood (1986)Heywood (1986)Heywood (1986)
Heywood (1986)Heywood (1986)Fenster (1991)Heywood (1986)Heywood (1986)Heywood (1986)Heywood (1986)Husband & Barrett (1992)
Husband & Barrett (1992)
Heywood (1986)Heywood (1986)Heywood (1986)Heywood (1986)Heywood (1986)Heywood (1986)Heywood (1986)Heywood (1986)Heywood (1986)Heywood (1986)Heywood (1986)Heywood (1986)Crawford (1984)Heywood (1986)Heywood (1986)Heywood (1986)Brown & Schoen (1992)
Heywood (1986)Heywood (1986)Heywood (1986)Heywood (1986)Heywood (1986)Heywood (1986)
* Methods used to estimate Ne were D = demographic, GD = linkage disequilibrium, GL = lethal allelism, GM = analysesof populations segregating for mutations, GP = pedigree, GT = changes in genetic variation over time, and GV = variancein gene frequencies.t Variables included are SR = sex-ratio variation, VFS = variation in family sizes, FPS = fluctuations in population sizeover generations, n = non-overlapping generations, o = overlapping generations, and ? = unclear what was included.% N = population size used; A = adults, B = breeding adults, T = total adults-I-juveniles).§ Estimates of oo are presumed to reflect contamination of populations, and were omitted from analyses.|| Where ranges are given, analyses were based on means if available, otherwise the mid-point of the range.f Variance in family size was from variance among demes.** Recalculated using equation 3 to determine the effect of VFS.ft All plants were annuals, apart from Astrocaryum mexicanum and Picea glaucaXX The two estimates for each species made by Heywood (1986) represented one assuming an inbreeding coefficient of 0, andthe second a value of 1-0. Analyses were based on the former.
https://www.cambridge.org/core/terms. https://doi.org/10.1017/S0016672300034455Downloaded from https://www.cambridge.org/core. IP address: 54.39.106.173, on 07 Mar 2020 at 12:33:36, subject to the Cambridge Core terms of use, available at

N e /N in wildlife 105
References
Allendorf, F. W., Harris, R. B. & Metzgar, L. H. (1991).Estimation of effective population size of grizzly bears bycomputer simulation. Proceedings of the Fourth Inter-national Congress of Systematic and Evolutionary Biologypp. 650-654.
Avise, J. C, Ball, R. M. & Arnold, J. (1988). Current versushistorical population sizes in vertebrate species with highgene flow: a comparison based on mitochondrial DNAlineages and inbreeding theory for neutral mutations.Molecular Biology and Evolution 5, 331-344.
Baker, M. C. (1981). Effective population size in a songbird:some possible implications. Heredity 46, 209-218.
Barrett, J. W., Knowles, P. & Cheliak, W. M. (1987). Themating system in a black spruce clonal seed orchard.Canadian Journal of Forest Research 17, 379—382.
Barrowclough, G. F. & Shields, G. F. (1984). Karyotypicevolution and long-term effective population sizes ofbirds. Auk 101, 99-102.
Bartley, D., Bagley, M., Gall, G. & Bentley, B. (1992). Useof linkage disequilibrium data to estimate effective size ofhatchery and natural fish populations. ConservationBiology 6, 365-375.
Begon, M. (1977). The effective size of a natural Drosophilasubobscura population. Heredity 38, 13-18.
Begon, M., Krimbas, C. B. & Loukas, M. (1980). Thegenetics of Drosophila subobscura populations. XV.Effective size of a natural population estimated by threeindependent methods. Heredity 45, 335-350.
Berg, W. J. (1987). Effective population size estimates andinbreeding in feral horses: a preliminary assessment.Equine Veterinary Science 6, 240-245.
Berger, J. & Cunningham, C. (1995). Multiple bottlenecks,allopatric lineages and badlands bison Bos bison: conse-quences of lineage mixing. Biological Conservation 71,12-23.
Berven, K. A. & Grudzien, T. A. (1990). Dispersal in thewood frog (Rana sylvatica): implications for geneticpopulation structure. Evolution 44, 2047-2056.
Blackwell, B. F., Reed, J. M., Walters, J. R. & Doerr, P. D.(1995). Inbreeding rate and effective population size: acomparison of estimates from pedigree analysis and ademographic model. Biological Conservation 71, 299-304.
Borlase, S. C, Loebel, D. A., Frankham, R., Nurthen,R. K., Briscoe, D. A. & Daggard, G. E. (1993). Modelingproblems in conservation genetics using captiveDrosophila populations: consequences of equalization offamily sizes. Conservation Biology 7, 122-131.
Briscoe, D. A., Malpica, J. M., Robertson, A., Smith, G. J.,Frankham, R., Banks, R. G. & Barker, J. S. F. (1992).Rapid loss of genetic variation in large captive populationsof Drosophila flies: Implications for genetic managementof captive populations. Conservation Biology 6, 416-425.
Briton, J., Nurthen, R. K., Briscoe, D. A. & Frankham, R.(1994). Modelling problems in conservation genetics usingcaptive Drosophila populations: Consequences of harems.Biological Conservation 69, 267-275.
Brookfield, J. F. Y. & Sharp, P. M. (1994). Neutralism andselectionism face up to DNA data. Trends in Genetics 10,109-111.
Brown, A. H. D. & Schoen, D. J. (1992). Plant populationgenetic structure and biological conservation. InConservation of Biodiversity for Sustainable Development(ed. O. T. Sandlund, K. Hindar and A. H. D. Brown),pp. 88-104. Oslo: Scandinavian University Press.
Butlin, R. K. & Day, T. H. (1989). Environment correlatesof inversion frequencies in natural populations of seaweedflies (Coelopa frigida). Heredity 62, 223-232.
Caballero, A. (1994). Developments in the prediction ofeffective population size. Heredity 73, 657-679.
Carroll, J. B. & Mace, G. M. (1988). Population man-agement of the Rodrigues fruit bat Pteropus rodricensis incaptivity. International Zoo Yearbook 27, 70-78.
Charlesworth, B. (1980). Evolution in Age-Structured Popu-lations. Cambridge: Cambridge University Press.
Cheliak, W. M., Pitel, J. A. & Murray, G. (1985). Populationstructure and the mating system of white spruce. CanadianJournal of Forest Research 15, 301-308.
Chepko-Sade, B. D., Shields, W. M., Berger, J., Halpin,Z. T., Jones, W. T., Rogers, L. L., Rood, J. P. & Smith,A. T. (1987). The effects of dispersal and social structureon effective population size. In Mammalian DispersalPatterns: The Effects of Social Structure on PopulationGenetics (ed. B. D. Chepko-Sade and Z. T. Halpin), pp.287-321. Chicago, IL: University of Chicago Press.
Crawford, T. J. (1984). What is a population? InEvolutionary Ecology (ed. B. Shorrocks), pp. 135-173.Oxford: British Ecological Society Symposium No. 23,Blackwell.
Crow, J. F. & Kimura, M. (1970). An Introduction toPopulation Genetics Theory. New York: Harper & Row.
Crow, J. F. & Morton, N. E. (1955). Measurement of genefrequency drift in small populations. Evolution 9,202-214.
Daly, J. C. (1981). Effects of social organization andenvironmental diversity on determining the genetic struc-ture of a population of wild rabbits, Oryctolagus cuniculus.Evolution 35, 689-706.
Debouzie, D. (1980). Estimate of variance effective popu-lation size in a laboratory Ceratitis population. Heredity45, 297-299.
Denniston, C. (1978). Small population size and geneticdiversity. Implications for endangered species. InEndangered Birds: Management Techniques for PreservingEndangered Species (ed. S. A. Temple), pp. 281-290.Madison, WI: University of Wisconsin Press.
Dinerstein, E. & McCracken, G. F. (1990). Endangeredgreater one-horned rhinoceros carry high levels of geneticvariation. Conservation Biology 4, 417—422.
Easteal, S. & Floyd, R. B. (1986). The ecological genetics ofintroduced populations of the giant toad, Bufo marinus(Amphibia: Anura): dispersal and neighbourhood size.Biological Journal of the Linnean Society 27, 17-45.
Eguiarte, L. E., Burquez, A., Rodriguez, J., Martinez-Ramos, M., Sarukhan, J. & Pinero, D. (1993). Direct andindirect estimates of neighborhood and effective popu-lation size in a tropical palm Astrocaryum mexicanum.Evolution 47, 75-87.
Emigh, T. H. & Pollak, E. (1979). Fixation probabilities andeffective population numbers in diploid populations withoverlapping generations. Theoretical Population Biology15, 86-107.
Falconer, D. S. (1989). Introduction to Quantitative Genetics(3rd ed.). Harlow: Longman.
Felsenstein, J. (1971). Inbreeding and variance effectivenumbers in populations with overlapping generations.Genetics 68, 581-597.
Fenster, C. B. (1991). Gene flow in Chamaecrista fasciculata(Leguminosae) II. Gene establishment. Evolution 45,410-422.
Fleischer, R. C. (1983). A comparison of theoretical andelectrophoretic assessments of genetic structure in popu-lations of the house sparrow (Passer domesticus).Evolution 37, 1001-1009.
FitzSimmons, N. N., Buskirk, S. W., Smith, M. H. (1995).Population history, genetic variability, and horn growthin bighorn sheep. Conservation Biology 9, 314-323.
https://www.cambridge.org/core/terms. https://doi.org/10.1017/S0016672300034455Downloaded from https://www.cambridge.org/core. IP address: 54.39.106.173, on 07 Mar 2020 at 12:33:36, subject to the Cambridge Core terms of use, available at

R. Frankham 106
Gill, D. E. (1978). Effective population size and interdemicmigration rates in a metapopulation of the red-spottednewt, Notophthalmus viridescens (Rafinesque). Evolution32, 839 849.
Glenn, T. C. (1990). Genetic Variation in the Michigan Elk(Cervus elaphus). M.Sc. thesis, University of Michigan.
Gowe, R. S., Robertson, A. & Latter, B. D. H. (1959).Environment and poultry breeding problems. 5. Thedesign of poultry control strains. Poultry Science 38,462-471.
Grant, B. R. & Grant, P. R. (1989). Evolutionary Dynamicsof a Natural Population: The Large Cactus Finch of theGalapagos. Chicago, IL: University of Chicago Press.
Grant, P. R. & Grant, B. R. (1992). Demography and thegenetically effective size of two populations of Darwin'sfinches. Ecology 73, 766-784.
Greenwood, J. J. D. (1974). Effective population size in thesnail Cepaea nemoralis. Evolution 28, 513—526.
Harpending, H. & Cowan, S. (1986). Primate populationstructure: evaluation of models. American Journal ofPhysical Anthropology 70, 63-68.
Hedgecock, D., Chow, V. & Waples, R. S. (1992). Effectivepopulation numbers of shellfish broodstocks estimatedfrom temporal variance in allelic frequencies. Aquaculture108, 215-232.
Heywood, J. S. (1986). The effect of plant size variationon genetic drift in populations of annuals. AmericanNaturalist 127, 851-861.
Hill, W. G. (1981). Estimation of effective population sizefrom data on linkage disequilibrium. Genetical Research38, 209-216.
Husband, B. C. & Barrett, S. C. H. (1992). Effectivepopulation size and genetic drift in tristylous Eichhorniapaniculata (Pontederiaceae). Evolution 46, 1875-1890.
Imaizumi, Y., Nei, M. & Furusho, T. (1970). Variability andheritability of human fertility. Annals of Human Genetics33, 251-259.
Jain, S. K. & Rai, K. N. (1974). Population biology ofAvena. IV. Polymorphism of small populations of Avenafatua. Theoretical and Applied Genetics 44, 7—11.
Jorde, L. B. (1980). The genetic structure of subdividedhuman populations: A review. Current Developments inAnthropological Genetics 1, 135—208.
Kerster, H. W. (1964). Neighborhood size in the rustylizard, Sceloporus olivaceus. Evolution 18, 445-451.
Kinnaird,M. F. & O'Brien, T. G. (1991). Viable populationsfor an endangered forest primate, the Tana River crestedmangabey (Cercocebus galeritus galeritus). ConservationBiology 5, 203-213.
Koenig, W. D. (1988). On determination of viable popu-lation size in birds and mammals. Wildlife Society Bulletin16, 230-234.
Lande, R. (1979). Effective deme size during long-termevolution estimated from rates of chromosomalrearrangement. Evolution 33, 234—251.
Lande, R. & Barrowclough, G. F. (1987). Effective popu-lation size, genetic variation, and their use in populationmanagement. In Viable Populations for Conservation(ed. M. E. Soule), pp. 87-123. Cambridge: CambridgeUniversity Press.
Lopez-Fanjul, C. & Torroja, E. (1982). Presion ambiental yreaccion genetica en caracteres cuantitativos. Adas VCongr. Latinoam. Genetica pp. 272—279.
MacCluer, J. W. & Shull, W. J. (1970). Estimating theeffective size of human populations. American Journal ofHuman Genetics 22, 176-183.
Mace, G. M. (1986). Genetic management of small popu-lations. International Zoo Yearbook 24/25, 167-174.
Mace, G. M. & Lande, R. (1991). Assessing extinctionthreats: towards a reevaluation of IUCN threatenedspecies categories. Conservation Biology 5, 148-157.
Malpica, J. M. & Briscoe, D. A. (1981). Effective populationnumber estimates of laboratory populations of Drosophilamelanogaster. Experientia 37, 947-948.
Marzluff, J. M. & Balda, R. P. (1989). Causes and conse-quences of female-biased dispersal in a flock-living bird,the Pinyon jay. Ecology 70, 316-328.
Merrell, D. J. (1968). A comparison of the estimated and the'effective size' of breeding populations of the leopard frogRana pipiens. Evolution 22, 274-283.
Morton, N. E. & Lalouel, J. M. (1973). Bioassay of kinshipin Micronesia. American Journal of Physical Anthropology38, 709-720.
Murata, M. (1970). Frequency distribution of lethalchromosomes in small populations. Genetics 64, 559-571.
Nei, M. (1970). Effective size of human populations.American Journal of Human Genetics 22, 694-696.
Nei, M. & Graur, D. (1984). Extent of protein polymorphismand the neutral mutation theory. Evolutionary Biology 17,73-118.
Nei, M. & Imaizumi, Y. (1966). Genetic structure of humanpopulations. II. Differentiation of blood group genefrequencies among isolated populations. Heredity 21,183-190.
Nei, M. & Murata, M. (1966). Effective population sizewhen fertility is inherited. Genetical Research 8, 257-260.
Nei, M. & Tajima, F. (1981). Genetic drift and estimation ofeffective population size. Genetics 98, 625-640.
Nozawa, K. (1963). Competition between brown gene andits wild-type allele in Drosophila melanogaster. II. Es-timation of relative viability of brown homozygotes andan analysis of change in gene-frequency. Japanese Journalof Genetics 38, 6-20.
Nozawa, K. (1970). Estimation of the effective size inDrosophila experimental populations. Drosophila Infor-mation Service 45, 117-118.
Nozawa, K. (1972). Population genetics of Japanesemonkeys. I. Estimation of the effective troop size. Primates13, 381-393.
Nunney, L. (1993). The influence of mating system andoverlapping generations on effective population size.Evolution 47, 1329-1341.
Nunney, L. & Campbell, K. A. (1993). Assessing minimumviable population size: demography meets populationgenetics. Trends in Ecology and Evolution 8, 234-239.
Nunney, L. & Elam, D. R. (1994). Estimating the effectivepopulation size of conserved populations. ConservationBiology 8, 175-184.
Pray, L. A., Goodnight, C. J., Stevens, L., Schwartz, J. M.& Yan, G. (1995). The effect of population size oneffective population size: an empirical study in the redflour beetle Tribolium castaneum. Conservation Biology(submitted).
Prout, T. (1954). Genetic drift in irradiated experimentalpopulations of Drosophila melanogaster. Genetics 39,529-546.
Rails, K. & Ballou, J, (1983). Extinction: lessons from zoos.In Genetics and Conservation: A Reference for ManagingWild Animal and Plant Populations (ed. C. M.Schonewald-Cox, S. M. Chambers, B. MacBryde &L. Thomas), pp. 164-184. Menlo Park, CA: Benjamin/Cummings.
Rails, K., Ballou, J. & Brownell, R. L. Jr. (1983). Geneticdiversity in California sea otters: theoretical considera-tions and management implications. Biological Conser-vation 25, 209-232.
Reed, J. M, Doerr, P. D. & Walters, J. R. (1986). Deter-mining minimum population size for birds and mammals.Wildlife Society Journal 14, 244-261.
https://www.cambridge.org/core/terms. https://doi.org/10.1017/S0016672300034455Downloaded from https://www.cambridge.org/core. IP address: 54.39.106.173, on 07 Mar 2020 at 12:33:36, subject to the Cambridge Core terms of use, available at
Ne/N in wildlife 107
Reed, J. M., Walters, J. R., Emigh, T. E. & Seaman, D. E.(1993). The effective population size in red-cockadedwoodpeckers: Population and model differences.Conservation Biology 7, 302-308.
Robertson, A. (1962). Selection for heterozygotes in smallpopulations. Genetics 47, 1291-1300.
Rowley, I., Russell, E. & Brooker, M. (1993). Inbreeding inbirds. In The Natural History of Inbreeding andOutbreeding: Theoretical and Empirical Perspectives (ed.N. W. Thornhill), pp. 304-328. Chicago, IL: Universityof Chicago Press.
Ryman, N., Baccus, R., Reuterwall, C. & Smith, M. H.(1981). Effective population size, generation interval, andpotential loss of genetic variability in game species underdifferent hunting regimes. Oikos 36, 257-266.
Salzano, F. M. (1971). Demographic and genetic inter-relationships among the Cayapo Indians of Brazil. SocialBiology 18, 148-157.
Schoen, D. J. & Brown, A. H. D. (1991). Intraspecificvariation in population gene diversity and effective sizecorrelates with the mating system in plants. Proceedingsof the National Academy of Sciences, USA 88, 4494-4497.
Sherwin, W. S. & Brown, P. R. (1990). Problems in theestimation of the effective size of a population of theEastern Barred bandicoot {Perameles gunnii) at Hamilton,Victoria. In Bandicoots and Bilbies (ed. J. H. Seebeck,P. R. Brown, R. L. Wallis and C. M. Kemper), pp.367-373. Chipping Norton, NSW: Surrey Beatty & Sons.
Shull, A. M. & Tipton, A. R. (1987). Effective populationsize of bison on the Whichita Mountains Wildlife Refuge.Conservation Biology 1, 35—41.
Simon, R. C, Mclntyre, J. D. & Hemmingsen, A. R. (1986).Family size and effective population size in a hatcherystock of Coho salmon {Oncorhynchus kisutch). CanadianJournal of Fisheries and Aquatic Science 43, 2434—2442.
Sinclair, A. R. E. (1995). Mammal populations: fluctuation,regulation and conservation. In Frontiers of PopulationEcology (ed. R. Floyd, A. Shepherd and L. Lawrence),(in press) Canberra, ACT: CSIRO Publications.
Smith, J. L. D. & McDougal, C. (1991). The contribution ofvariance in lifetime reproduction to effective populationsize in tigers. Conservation Biology 5, 484-490.
Spiess, E. B. (1989). Genes in Populations (2nd ed.). NewYork, Wiley.
Taylor, A. C, Sherwin, W. B. & Wayne, R. K. (1994).Genetic variation of microsatellite loci in a bottlenecked
species: the northern hairy-nosed wombat Lasiorhinuskrefftii. Molecular Ecology 3, 277-290.
Templeton, A. R. & Read, B. (1994). Inbreeding: Oneword, several meanings, much confusion. In ConservationGenetics (ed. V. Loeschcke, J. Tomiuk and S. K. Jain),pp. 91-105. Basel: Birkhauser.
Tinkle, D. W. (1965). Population structure and effective sizeof a lizard population. Evolution 18, 569-573.
Tomlinson, C, Mace, G. M., Black, J. M. & Hewston, N.(1991). Improving the management of a highly inbredspecies: the case of the white-winged wood duck Cairinascutulata in captivity. Wildfowl 42, 123-133.
Wade, M. J. (1980). Effective population size: the effects ofsex, genotype, and density on the mean and variance ofoffspring numbers in the flour beetle, Tribolium castaneum.Genetical Research 36, 1-10.
Wayne, R. K., George, S. B., Gilbert, D., Collins, P. W.,Kovach, S. D., Girman, D. & Lehman, N. (1991). Amorphologic and genetic study of the Island fox, Urocyonlittoralis. Evolution 45, 1849-1868.
Wood, J. W. (1987). The genetic demography of the Gainjof Papua New Guinea. 2. Determinants of effectivepopulation size. American Naturalist 129, 165-187.
Woodworth, L. M., Montgomery, M. E., Nurthen, R. K.,Briscoe, D. A. & Frankham, R. (1994). Modellingproblems in conservation genetics using Drosophila:consequences of fluctuating population sizes. MolecularEcology 3, 393^00.
Wright, S. (1931). Evolution in Mendelian populations.Genetics 16, 97-159.
Wright, S. (1938). Size of population and breeding structurein relation to evolution. Science 87, 430-431.
Wright, S. (1939). Statistical genetics in relation to evolution.In Exposes de Biome'trie et de la Statistique BiologiqueXIII, pp. 5-64. Paris: Hermann et Cie.
Wright, S. (1969). Evolution and the genetics of populations.Vol. 2. The theory of gene frequencies. Chicago, IL:University of Chicago Press.
Wright, S. (1977). Evolution and the genetics of populations.Vol. 3. Experimental Results and Evolutionary Deductions.Chicago, IL: University of Chicago Press.
Wright, S. (1978). Evolution and the genetics of populations,Vol. 4. Variability within and among Natural Population.Chicago, IL: University of Chicago Press.
Young, T. P. (1994). Natural die-offs of large mammals:Implications for conservation. Conservation Biology 8,410-418.
https://www.cambridge.org/core/terms. https://doi.org/10.1017/S0016672300034455Downloaded from https://www.cambridge.org/core. IP address: 54.39.106.173, on 07 Mar 2020 at 12:33:36, subject to the Cambridge Core terms of use, available at