effects of cattle slurry manure management on grass yield
TRANSCRIPT
Effects of cattle slurry manuremanagement on grass yield
R.L.M. Schils* and I. Kok
Research Institute for Animal Husbandry, P.O. Box 2176, NL-8203 AD Lelystad, The Netherlands
* Corresponding author (fax: +31-320-241584; e-mail: [email protected])
Received 25 April 2003; accepted 30 June 2003
Abstract
The effects of application method, cattle slurry manure type and use of additives on grassland perform-
ance were studied in a 3-year field experiment on two farms on sandy soils in the northern part of the
Netherlands. The objectives were to determine the effects on (1) nitrogen (N) utilization, (2) soil organic
matter and soil N content, and (3) botanical composition of the sward. Cattle slurry manure from the
two dairy farms was compared. Farm Harkema represented conventional management, while farm
Drogeham used the additive Euromestmix® and reduced the N content of the dairy cow rations. In addi-
tional treatments, the slurry manure types were combined with the additives Effective Microbes® (EM)
or FIR-naturel®. In all slurry manure type – additive combinations the slurry manure was either
surface-applied or slit-injected. The resulting 12 treatments were applied without or with additional
inorganic fertilizer N (165 kg ha–1). The annual apparent N recovery (ANR) of N fertilizer was 0.79 kg
kg–1. The ANR of surface-applied slurry manure (0.30 kg kg–1) was consistently lower than that of slit-
injected manure (0.44 kg kg–1), a difference that could be fully attributed to the manure applications
during the growing season. No effect of application method was observed at the first application in
March. Slurry manure type and additive use had no consistent effects on grass yield or N utilization.
Statistically significant effects were only observed occasionally, mostly in interaction with other experi-
mental factors. During the three experimental years, the changes in soil organic matter and soil N
content were small. Application method had no effect on the measured soil characteristics. Slurry
manure type and additive use had a small statistically significant effect at one site only. However,
longer-term monitoring is necessary to draw firm conclusions. Application method, slurry manure type
or additive use did not affect the botanical composition of the sward.
Additional keywords: slurry manure additive, application method, N efficiency, grassland, N recovery.
Introduction
From the 1950s onwards, dairy farms in the Netherlands have been highly intensified
and as a result became increasingly dependent on imports of inorganic fertilizers and
41NJAS 51-1/2, 2003

concentrates (e.g. Aarts et al., 1992; Van Der Meer, 1994). The amount of inorganic
fertilizer nitrogen (N) applied to grassland increased from around 75 kg ha–1 year–1 in
1950 to approximately 300 kg ha–1 year–1 in the mid-1980s (Bussink & Oenema, 1998).
Since then, developments such as the introduction of milk quotas, a growing interest
in organic farming and concern about N emissions have caused a gradual decrease in
the use of inorganic fertilizer N. At present, inorganic fertilizer N application levels
are about 220 kg ha–1 year–1 (Anon., 2002).
Apart from inorganic fertilizer, grassland receives N from animal excreta, either
directly during grazing or through application of cattle slurry manure. For a typical
dairy farm on sandy soils in the early 1980s, Aarts et al. (1992) estimated an additional
N input of 164 kg ha–1 year–1 through animal excreta during grazing and 120 kg ha–1
year–1 through slurry manure application. Generally, slurry manure was surface-
applied to grassland, leading to environmentally unacceptable N emissions through
ammonia volatilization (Thompson et al., 1987; Bussink et al., 1994; Huijsmans et al.,
2001). To reduce ammonia emissions, alternative slurry manure application methods
were developed (Van Der Meer et al., 1987; Wouters, 1995), which led to a range of so-
called low-emission techniques, from injection at a depth of 15 cm to band spreading.
The most commonly used technique on sandy soils is slit injection at a depth of 5 to
10 cm and a distance between slits of 20 cm. In the Netherlands, the use of low-emis-
sion techniques on grassland is obligatory since 1990.
At present, slit injection is widely used on sandy and clay soils in the Netherlands
and is mostly carried out by contractors. However, some farmers are reluctant to have
contractors apply the manure. A number of farmers consider slit injection by contrac-
tors as inflexible. With a self-owned, relatively cheap unit for surface application farm-
ers can apply slurry manure immediately after a pasture is grazed or cut without
losing valuable regrowth time. Furthermore, being independent from a contractor
means farmers can apply manure under suitable weather conditions and, consequent-
ly, can reduce the risk of ammonia emissions (Huijsmans et al., 2001). Other farmers
argue that slit injection has negative effects on the physical and biological properties of
the soil. Generally, injection techniques involve relatively heavy machinery with a high
risk of soil compaction. Due to the smaller effective working width of injection equip-
ment, the tyres affect a large proportion of the area. The negative effect of injected
manure on biological soil quality is based on visual observations of dead earthworms
after manure injection and on the assumption that slurry manure may have toxic
effects on soil organisms. Another argument against the use of slit injection is that
feeding dairy cows with a lower N content in the diet leads to a lower concentration of
inorganic N in slurry manure, and thus to a lower risk of ammonia volatilization
following surface application. Finally, various kinds of chemical, biological and physi-
cal additives have been developed with the objective to reduce ammonia volatilization,
and this might justify surface application. Until now, only the use of acids (Bussink et
al., 1994; Schils et al., 1999) has a proven record in reducing ammonia losses from
slurry manure. There is no literature on the effects of other additives on slurry manure
utilization following application to grassland.
Within the Nutrient Management Project of ‘Vereniging Eastermar’s Lânsdouwe’
(VEL) and ‘Vereniging Agrarisch Natuur en Landschapsbeheer Achtkarspelen’ (VANLA)
R.L.M. Schils and I. Kok
42 NJAS 51-1/2, 2003

60 farms have formulated goals regarding the reduction of N emissions (Roep et al.,
2003). To achieve the target, both the use of inorganic fertilizer N and the N content
in dairy cow rations are reduced. Beside these general practices, some farmers use the
additive Euromestmix or Effective Microbes . Euromestmix® contains clay minerals
and micro-organisms, and is added to the slurry manure. The absorbing capacity of
the additive is claimed to immobilize toxic products in the manure. The farmers who
use Euromestmix® have been granted a temporary permit for surface application of
slurry manure. Effective Microbes® (Higa, 1994) is a mixture of bacteria, actino-
mycetes, yeasts and other micro-organisms, and is sprayed over the grass sward. The
claimed effects are, amongst other, improvement of the physical, chemical and biologi-
cal status of the soil, a better rooting system and an improved organic matter utiliza-
tion.
Next to the general farm-monitoring programme, a field experiment was set up to
study in detail the effects of some of the slurry manure management practices of the
VEL & VANLA project. The objectives of this experiment were to determine the effect
of slurry manure type, application method and additive use on (1) nitrogen utilization,
(2) soil organic matter and soil N contents, and (3) botanical composition of the sward.
Materials and methods
Sites
The experiment was laid out on grassland paddocks of two commercial dairy farms –
Harkema and Drogeham – that participated in the VEL & VANLA project. Both loca-
tions were on sandy soils rich in organic matter from anthropogenic origin (Table 1).
The average groundwater table varied from –25 to –80 cm in winter to lower than
Cattle slurry manure management and grassland production
43NJAS 51-1/2, 2003
Table 1. Soil characteristics at the start of the experiments.
Location Sampling Organic Total N P2O5 K2O
depth matter
(cm) (%) (g kg–1) (mg per 100 g)
Drogeham 0–5 11.2 4.77 40 39
5–10 6.7 3.78 29 11
10–20 5.4 2.36 20 7
20–30 4.6 1.75 14 5
Harkema 0–5 9.2 3.80 46 32
5–10 5.7 2.65 41 11
10–20 4.7 2.04 36 5
20–30 3.7 1.42 28 3

–120 cm in summer. The site at Harkema was slightly drier than the site at Droge-
ham. Both experimental sites were under grass for more than 50 years, and were used
for grazing and silage cutting. Before the start of the experiment the approximate N
application levels, through inorganic fertilizer and slurry manure, were about 400 kg
N ha–1 year–1 at Harkema and about 300 kg N ha–1 year–1 at Drogeham. Drogeham start-
ed to use Euromestmix® in 1982. At the start of the experiment, in March 1990, the
phosphorus status and the potassium status of the topsoil (0–5 cm) were agronomical-
ly amply sufficient (Anon., 1998). Soil nitrogen supply (SNS), estimated from soil N
content of the 0–20 cm soil layer (Hassink, 1995; 1996), was 185 kg ha–1 year–1 at
Harkema and 200 kg ha–1 year–1 at Drogeham, the latter being the maximum SNS for
sandy soils. Organic matter and soil nutrient contents decreased with depth. However,
at Harkema the phosphorus status in the 5–30 cm soil layer was relatively high.
At both sites the dominant sward components were perennial ryegrass and rough
stalked meadowgrass (Table 2). Together they made up approximately 80% of the
sward. The contribution of white clover to the sward production was minimal.
Weather data (Figure 1) were collected from the nearest weather station (Anon.,
1999–2002). Additionally, precipitation was measured at the experimental sites, daily
at Drogeham and weekly at Harkema. The three growing seasons were warmer than
the 20-year average, viz. +1.4, +0.9 and + 0.6 oC in 1999, 2000 and 2001, respectively.
Precipitation during the growing season (April–September) was normal in 1999, but
higher than average in 2000 and 2001. The total precipitation surpluses, i.e., precipi-
tation minus reference evaporation according to Makkink (Hooghart & Lablans, 1988),
during the growing season amounted to –31, +187 and +167 mm, for the successive
years. The experimental fields were not irrigated.
R.L.M. Schils and I. Kok
44 NJAS 51-1/2, 2003
Table 2. Botanical composition (%) of the swards at Drogeham and Harkema at the start of the
experiments (15 April 1999).
Component Scientific name Drogeham Harkema
Total plant cover 91 86
Perennial ryegrass Lolium perenne L. 44 56
Rough stalked meadowgrass Poa trivialis L. 33 25
Annual meadowgrass Poa annua L. 3 5
Creeping bentgrass Agrostis stolonifera L. 9 0
Couch grass Elytrigia repens L. 0 4
Other grasses 3 3
White clover Trifolium repens L. 1 3
Dandelion Taraxacum officinale Web s.l. 3 1
Other herbs 2 2

Experimental treatments
The core of the experiment, designed as a split-plot, consisted of specific combinations
of slurry manure type (Drogeham and Harkema), manure application method (slit
injection and surface application) and additives (no additive, Effective Microbes® and
FIR-naturel®). As the use of FIR-naturel® is not part of the VEL & VANLA project, it
was only combined with Harkema slurry manure. (FIR-naturel® contains carbon and
clay minerals, and is supposed to reduce the phosphate-fixing capacity of the soil
Cattle slurry manure management and grassland production
45NJAS 51-1/2, 2003
-5
0
5
10
15
20
25
0
25
50
75
1001999
Precipitation (mm)Temperature ( oC)
-5
0
5
10
15
20
25
0
25
50
752000
-5
0
5
10
15
20
25
J F M A M J J A S O N D
Months
0
25
50
75
1002001
Figure 1. Mean temperature at 1.5 m (–––) and total precipitation (bars) per 10-day periods during the
growing seasons of 1999–2001.
through the fixation of iron.) In addition to these treatment combinations the experi-
ment included the treatments inorganic fertilizer (calcium ammonium nitrate – CAN)
and no inorganic fertilizer (control). There were 2 replicates per farm, each consisting of
2 complete main plots, one with a low the other with a high N level.
The high and low N levels for the main plots were defined as the total amount of N
applied through inorganic fertilizer and slurry manure. The high N level was set at 250 kg
ha–1 year–1, which is approximately equivalent to the application rate used by the farmers
participating in the VEL & VANLA project. Approximately 170 kg ha–1 year–1 was applied
as inorganic fertilizer, and 80 kg ha–1 year–1 in the form of slurry manure (Table 3). The
partitioning of the annual application rate of inorganic N over the 5 successive cuts was 35,
15, 25, 15 and 10%, respectively. The low N level was set at 80 kg ha–1 year–1, and involved
either inorganic fertilizer or slurry manure, but not a combination.
Slurry manure was applied at a rate of 40 m3 ha–1 year–1, split into two or three
applications. In 1999, 20 m3 ha–1 was applied before the first and third cuts (Table 4).
R.L.M. Schils and I. Kok
46 NJAS 51-1/2, 2003
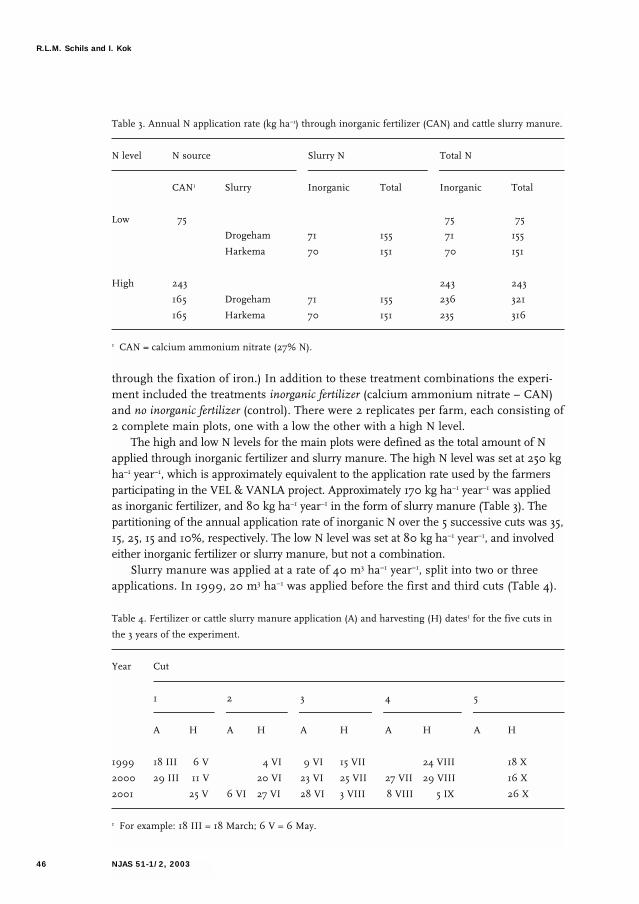
Table 3. Annual N application rate (kg ha–1) through inorganic fertilizer (CAN) and cattle slurry manure.
N level N source Slurry N Total N
CAN1 Slurry Inorganic Total Inorganic Total
Low 275 275 175
Drogeham 71 155 271 155
Harkema 70 151 270 151
High 243 243 243
165 Drogeham 71 155 236 321
165 Harkema 70 151 235 316
1 CAN = calcium ammonium nitrate (27% N).
Table 4. Fertilizer or cattle slurry manure application (A) and harvesting (H) dates1 for the five cuts in
the 3 years of the experiment.
Year Cut
1 2 3 4 5
A H A H A H A H A H
1999 18 III 6 V 4 VI 9 VI 15 VII 24 VIII 18 X
2000 29 III 11 V 20 VI 23 VI 25 VII 27 VII 29 VIII 16 X
2001 25 V 6 VI 27 VI 28 VI 3 VIII 8 VIII 5 IX 26 X
1 For example: 18 III = 18 March; 6 V = 6 May.
As the farmers in the project considered a surface application of 20 m3 ha–1 during the
growing season as impractical, the second application was split into two applications
of 10 m3 ha–1 each. In 2001, the experiment was hampered by the outbreak of Foot and
Mouth disease, and spring application of slurry manure was not possible. Therefore
the slurry manure was applied before the second, third and fourth cuts.
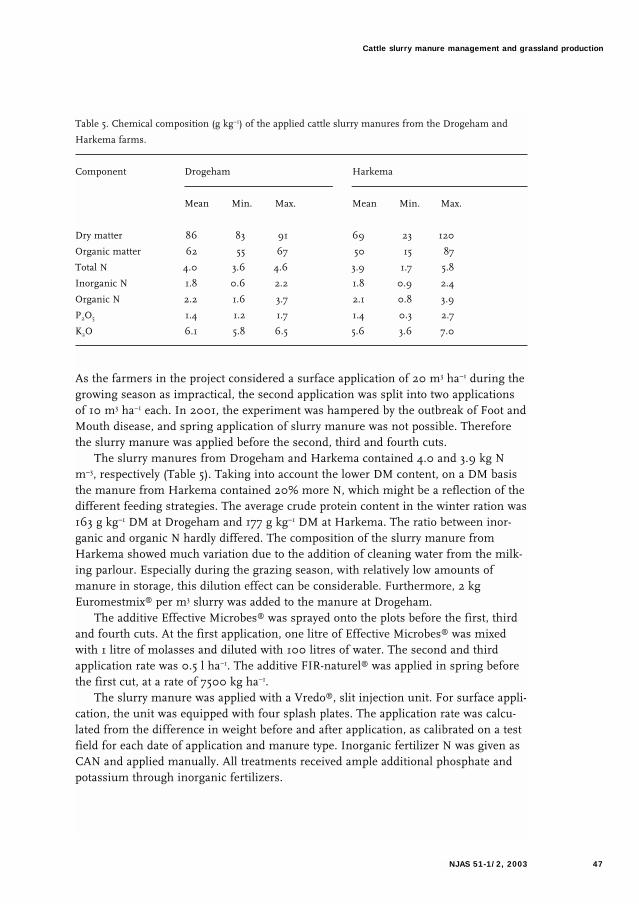
The slurry manures from Drogeham and Harkema contained 4.0 and 3.9 kg N
m–3, respectively (Table 5). Taking into account the lower DM content, on a DM basis
the manure from Harkema contained 20% more N, which might be a reflection of the
different feeding strategies. The average crude protein content in the winter ration was
163 g kg–1 DM at Drogeham and 177 g kg–1 DM at Harkema. The ratio between inor-
ganic and organic N hardly differed. The composition of the slurry manure from
Harkema showed much variation due to the addition of cleaning water from the milk-
ing parlour. Especially during the grazing season, with relatively low amounts of
manure in storage, this dilution effect can be considerable. Furthermore, 2 kg
Euromestmix® per m3 slurry was added to the manure at Drogeham.
The additive Effective Microbes® was sprayed onto the plots before the first, third
and fourth cuts. At the first application, one litre of Effective Microbes® was mixed
with 1 litre of molasses and diluted with 100 litres of water. The second and third
application rate was 0.5 l ha–1. The additive FIR-naturel® was applied in spring before
the first cut, at a rate of 7500 kg ha–1.
The slurry manure was applied with a Vredo®‚ slit injection unit. For surface appli-
cation, the unit was equipped with four splash plates. The application rate was calcu-
lated from the difference in weight before and after application, as calibrated on a test
field for each date of application and manure type. Inorganic fertilizer N was given as
CAN and applied manually. All treatments received ample additional phosphate and
potassium through inorganic fertilizers.
Cattle slurry manure management and grassland production
47NJAS 51-1/2, 2003
Table 5. Chemical composition (g kg–1) of the applied cattle slurry manures from the Drogeham and
Harkema farms.
Component Drogeham Harkema
Mean Min. Max. Mean Min. Max.
Dry matter 86 83 91 69 23 120
Organic matter 62 55 67 50 15 87
Total N 4.0 3.6 4.6 3.9 1.7 5.8
Inorganic N 1.8 0.6 2.2 1.8 0.9 2.4
Organic N 2.2 1.6 3.7 2.1 0.8 3.9
P2O5 1.4 1.2 1.7 1.4 0.3 2.7
K2O 6.1 5.8 6.5 5.6 3.6 7.0
Measurements and data analysis
Harvests were planned to take place when the fastest growing plots yielded approxi-
mately 3.5 to 4.0 t DM ha–1 at the first cut, and approximately 2.5 t DM ha–1 at later
cuts. All treatments were harvested on the same day (Table 4) using a Haldrup® forage
harvester. The area cut was 10 m × 1.5 m and a stubble was left of 5–6 cm. Yields were
recorded and a sample was taken for analysis of DM and total N. The botanical compo-
sition of each plot was assessed visually during the growth of the first cut. Before the
start of the experiment, soil samples consisting of 40 cores per bulked sample were
taken on both sites at depths of 0–5, 5–10, 10–20 and 20–30 cm and analysed for
organic matter, total N, phosphorus (P-AL) and potassium (K-HCl). This was repeated
per plot (20 cores bulked per sample) each year after the last cut.
Apparent N recoveries (ANR) at the low N level were calculated as (N yield of fertil-
ized plot – N yield of unfertilized plot) / total N applied. Apparent N efficiencies (ANE)
were calculated as (DM yield of fertilized plot – DM yield of unfertilized plot) / total N
applied. Efficiency index for the effect on N yield (EI-N) was calculated as (ANR of
slurry manure) × 100 / (ANR of CAN). Efficiency index for the effect on DM yield
(EI-DM) was calculated as (ANE of slurry manure) × 100 / (ANE of CAN).
Data were analysed by means of standard programmes for analysis of variance and
multiple regression analysis, using GENSTAT 5 (Anon., 2001).
Results
Sward characteristics
The most dominant grass species differed among treatments and mainly depended on N
level (data not shown). During the experiment total plant cover increased on all plots,
and was higher on the low-N plots. On the unfertilized control plots the proportion of
perennial ryegrass decreased with 7%. This was compensated at Drogeham by an
increased proportion of creeping bentgrass and at Harkema by rough stalked meadow-
grass. At Drogeham the proportion of perennial ryegrass only increased on the high-N
plots, at the expense of rough stalked meadowgrass. The proportion of couch grass
slightly decreased at the low N level at Harkema, but increased at the high N level. Slurry
manure type, additives and application method had no effect on botanical composition.
Annual dry matter yield
At Drogeham the overall mean annual DM yield was 10.1, 11.4 and 9.1 t ha–1, in the
three successive years. The DM yield at Harkema showed a similar pattern over the
three years: 9.9, 10.9 and 8.3 t ha–1, respectively. The DM yield at Harkema was
consistently lower than at Drogeham, on average 0.5 t ha-1.
In 1999 and 2000, the DM yield of the unfertilized treatments (Table 6) was
slightly higher at Harkema than at Drogeham. In 2001, however, the DM yield of the
unfertilized treatment at Drogeham was higher than at Harkema. There was a clear
R.L.M. Schils and I. Kok
48 NJAS 51-1/2, 2003

contrast in the response to fertilizer N at both sites. At Drogeham the response was
positive and linear up to 250 kg N ha–1, while at Harkema the response to N decreased
with an increasing application rate (Figure 2, quadrant II).
Each year, and on both sites, the DM yield was significantly higher on the plots
with injected slurry manure than on the plots with surface-applied manure. At the low
N level, the average yield difference was 0.69 t ha–1 year–1, with a range of 0.54 to 0.76
t ha–1 year–1. In the second and third year, there was a significant interaction between
N level and application method. The positive effect of slit injection on the DM yield
was less apparent at the high N level than at the low N level.
Cattle slurry manure management and grassland production
49NJAS 51-1/2, 2003
Table 6a. Annual grass dry matter yields (t ha–1) in 1999 at Drogeham and Harkema in relation to nitro-
gen level, nitrogen source, cattle slurry manure application method, slurry manure type and additive use.
N level/ Slurry type Additive1 Drogeham Harkema
N source
Surface Injected Mean Surface Injected Mean
applied applied
Nil 6.37 6.61
Low
CAN2 9.21 9.85
Slurry Harkema None 7.33 7.96 7.65 8.57 9.01 8.79
EM 7.51 7.71 7.61 9.13 9.45 9.29
FIR 7.44 7.92 7.68 8.50 9.13 8.82
Drogeham None 6.87 7.70 7.29 8.35 9.11 8.73
EM 6.72 7.93 7.32 8.35 8.91 8.63
Mean 7.17 7.84 7.51 8.58 9.12 8.85
High
CAN 14.43 11.80
Slurry Harkema None 12.94 13.08 13.01 11.54 11.63 11.59
EM 12.48 13.25 12.86 11.26 12.13 11.70
FIR 13.01 13.69 13.35 11.21 11.89 11.58
Drogeham None 13.29 12.99 13.14 11.05 11.61 11.33
EM 12.26 13.04 12.65 11.22 11.46 11.34
Mean 12.80 13.21 13.00 11.26 11.74 11.50
Statistical significance3
Application method ** **
Slurry type n.s. *
Additive n.s. n.s.
1 EM = Effective Microbes®; FIR = FIR-naturel®.
2 CAN = calcium ammonium nitrate (27% N).
3 * = P < 0.05; ** = P < 0.01; n.s. = not statistically different.
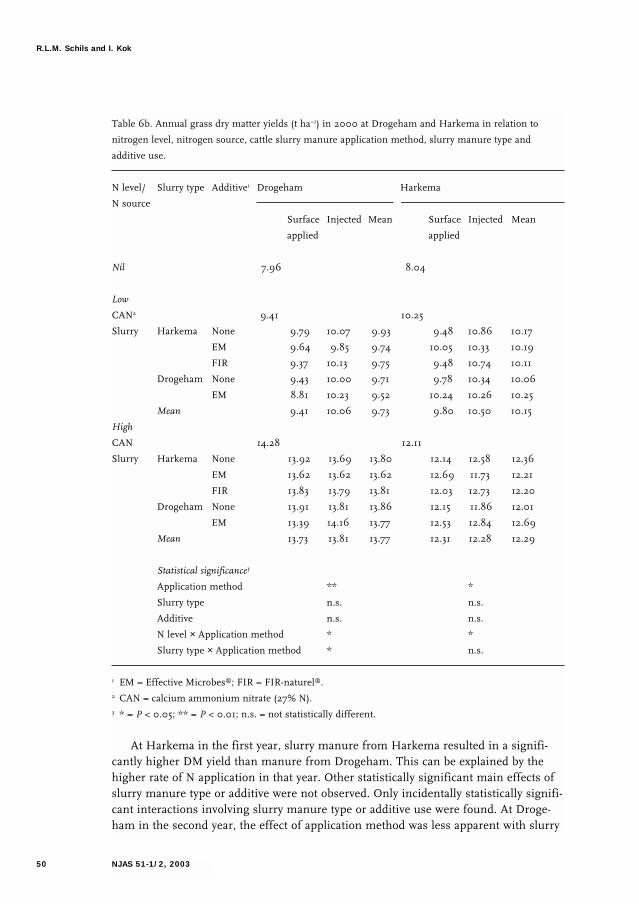
At Harkema in the first year, slurry manure from Harkema resulted in a signifi-
cantly higher DM yield than manure from Drogeham. This can be explained by the
higher rate of N application in that year. Other statistically significant main effects of
slurry manure type or additive were not observed. Only incidentally statistically signifi-
cant interactions involving slurry manure type or additive use were found. At Droge-
ham in the second year, the effect of application method was less apparent with slurry
R.L.M. Schils and I. Kok
50 NJAS 51-1/2, 2003
Table 6b. Annual grass dry matter yields (t ha–1) in 2000 at Drogeham and Harkema in relation to
nitrogen level, nitrogen source, cattle slurry manure application method, slurry manure type and
additive use.
N level/ Slurry type Additive1 Drogeham Harkema
N source
Surface Injected Mean Surface Injected Mean
applied applied
Nil 7.96 8.04
Low
CAN2 9.41 10.25
Slurry Harkema None 9.79 10.07 9.93 9.48 10.86 10.17
EM 9.64 9.85 9.74 10.05 10.33 10.19
FIR 9.37 10.13 9.75 9.48 10.74 10.11
Drogeham None 9.43 10.00 9.71 9.78 10.34 10.06
EM 8.81 10.23 9.52 10.24 10.26 10.25
Mean 9.41 10.06 9.73 9.80 10.50 10.15
High
CAN 14.28 12.11
Slurry Harkema None 13.92 13.69 13.80 12.14 12.58 12.36
EM 13.62 13.62 13.62 12.69 11.73 12.21
FIR 13.83 13.79 13.81 12.03 12.73 12.20
Drogeham None 13.91 13.81 13.86 12.15 11.86 12.01
EM 13.39 14.16 13.77 12.53 12.84 12.69
Mean 13.73 13.81 13.77 12.31 12.28 12.29
Statistical significance3
Application method ** *
Slurry type n.s. n.s.
Additive n.s. n.s.
N level × Application method * *
Slurry type × Application method * n.s.
1 EM = Effective Microbes®; FIR = FIR-naturel®.
2 CAN = calcium ammonium nitrate (27% N).
3 * = P < 0.05; ** = P < 0.01; n.s. = not statistically different.

manure from Harkema than with slurry manure from Drogeham. In the third year,
the use of Effective Microbes® had a positive effect on DM yield, but only with slit
injection. Finally, at Drogeham in the third year, FIR-naturel® had a positive effect on
DM yield at the low N level, but a negative effect on DM yield at the high N level.
Cattle slurry manure management and grassland production
51NJAS 51-1/2, 2003
Table 6c. Annual grass dry matter yields (t ha–1) in 2001 at Drogeham and Harkema in relation to nitro-
gen level, nitrogen source, cattle slurry manure application method, slurry manure type and additive
use.
N level/ Slurry type Additive1 Drogeham Harkema
N source
Surface Injected Mean Surface Injected Mean
applied applied
Nil 5.61 4.93
Low
CAN2 6.92 7.36
Slurry Harkema None 7.12 7.89 7.51 6.76 8.32 7.54
EM 7.23 7.86 7.54 7.20 8.43 7.82
FIR 7.74 8.22 7.98 7.64 7.93 7.79
Drogeham None 7.66 7.84 7.75 7.70 8.63 7.98
EM 6.94 8.27 7.60 8.01 8.14 8.08
Mean 7.34 8.02 7.68 7.46 8.26 7.84
High
CAN 11.30 9.79
Slurry Harkema None 11.48 10.84 11.16 9.70 9.31 9.51
EM 11.06 11.54 11.30 9.17 10.11 9.64
FIR 10.77 11.12 10.94 9.53 9.56 9.54
Drogeham None 11.40 11.43 11.42 9.65 9.15 9.40
EM 11.34 11.83 11.59 9.51 10.11 9.81
Mean 11.21 11.35 11.28 9.51 9.65 9.58
Statistical significance3
Application method ** **
Slurry type n.s. n.s.
Additive n.s. n.s.
N level × Application method n.s. *
Application method × Additive * n.s.
N level × FIR * n.s.
N level × Applic. method × Additive n.s. *
1 EM = Effective Microbes®; FIR = FIR-naturel®.
2 CAN = calcium ammonium nitrate (27% N).
3 * = P < 0.05; ** = P < 0.01; n.s. = not statistically different.

Annual nitrogen yield
In the three successive years the overall mean annual N yields were 250, 333 and 233
kg ha–1. The average annual N yield was almost similar at the two sites (Table 7). The
N yields on the unfertilized plots followed a similar pattern over the three years but
the differences between the two sites were larger. In the first year, the N yield on the
unfertilized plots was higher at Harkema than at Drogeham, but in the third year the
opposite was found. Only in the second year, the annual N yields of the unfertilized
plots were close to the calculated SNS of 185 kg ha–1 year–1 at Harkema and 200 kg ha–1
year–1 at Drogeham. In the first and third year, the N yields of the unfertilized plots
were clearly lower than the calculated SNS. The average response of the N yield to
inorganic fertilizer N was almost similar, but the shape of the response curve was not
identical (Figure 2, quadrant IV).
The effect of application method as observed for the DM yield was also established
for the N yield. At both N levels, N yield was significantly higher with slit injection
than with surface application. The average yield difference was 23 kg N ha–1 year–1,
with a range of 18 to 30 kg N ha–1 year–1.
R.L.M. Schils and I. Kok
52 NJAS 51-1/2, 2003
CAN Drogeham
SA Drogeham
SI Drogeham
CAN Harkema
SA Harkema
SI Harkema
N yield (kg ha-1
year-1
)
DM yield (t ha-1 year-1)
N application (kg ha-1 year-1)
III
IV
200 50150 100250
N application (kg ha-1 year-1)
190
130
70
250
2.3% N
3% N
11.5
9.5
13.5
7.5
250 300 350200
Figure 2. Relationship between annual fertilizer-N application, N yield and DM yield for inorganic N
(CAN), surface-applied (SA) and slit-injected (SI) cattle slurry manure at Harkema and Drogeham. Data
are averages over the period 1999–2001.
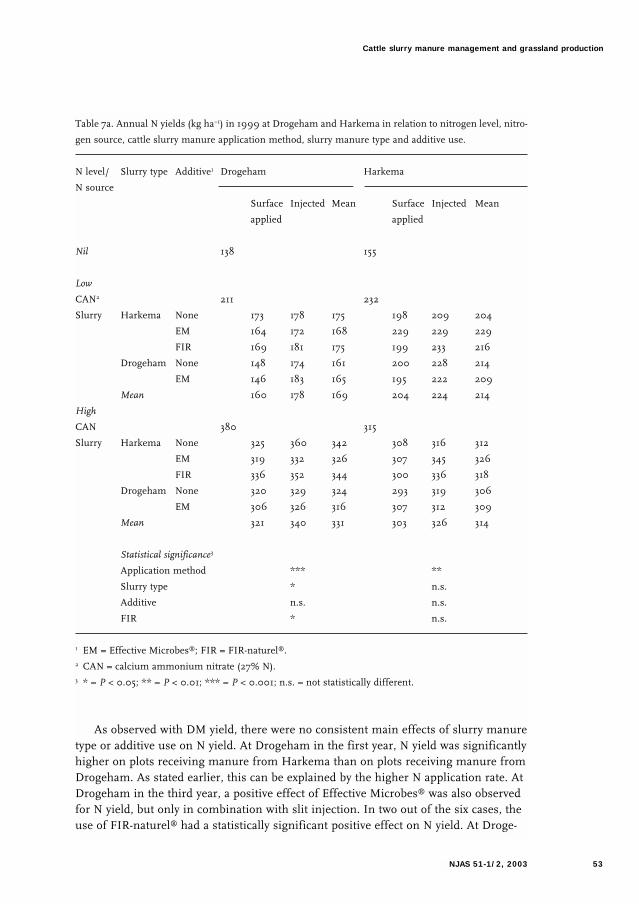
As observed with DM yield, there were no consistent main effects of slurry manure
type or additive use on N yield. At Drogeham in the first year, N yield was significantly
higher on plots receiving manure from Harkema than on plots receiving manure from
Drogeham. As stated earlier, this can be explained by the higher N application rate. At
Drogeham in the third year, a positive effect of Effective Microbes® was also observed
for N yield, but only in combination with slit injection. In two out of the six cases, the
use of FIR-naturel® had a statistically significant positive effect on N yield. At Droge-
Cattle slurry manure management and grassland production
53NJAS 51-1/2, 2003
Table 7a. Annual N yields (kg ha–1) in 1999 at Drogeham and Harkema in relation to nitrogen level, nitro-
gen source, cattle slurry manure application method, slurry manure type and additive use.
N level/ Slurry type Additive1 Drogeham Harkema
N source
Surface Injected Mean Surface Injected Mean
applied applied
Nil 138 155
Low
CAN2 211 232
Slurry Harkema None 173 178 175 198 209 204
EM 164 172 168 229 229 229
FIR 169 181 175 199 233 216
Drogeham None 148 174 161 200 228 214
EM 146 183 165 195 222 209
Mean 160 178 169 204 224 214
High
CAN 380 315
Slurry Harkema None 325 360 342 308 316 312
EM 319 332 326 307 345 326
FIR 336 352 344 300 336 318
Drogeham None 320 329 324 293 319 306
EM 306 326 316 307 312 309
Mean 321 340 331 303 326 314
Statistical significance3
Application method *** **
Slurry type * n.s.
Additive n.s. n.s.
FIR * n.s.
1 EM = Effective Microbes®; FIR = FIR-naturel®.
2 CAN = calcium ammonium nitrate (27% N).
3 * = P < 0.05; ** = P < 0.01; *** = P < 0.001; n.s. = not statistically different.
ham in the first year, N yield was higher on the FIR-naturel® plots than on the other
slurry manure plots. At Drogeham in the third year, a similar effect was observed, but
only at the low N level.
Annual nitrogen content
The overall mean annual N content in the harvested herbage was 25, 30 and 27 g N
per kg DM, in the three successive years (data not shown). At Drogeham, herbage N
R.L.M. Schils and I. Kok
54 NJAS 51-1/2, 2003
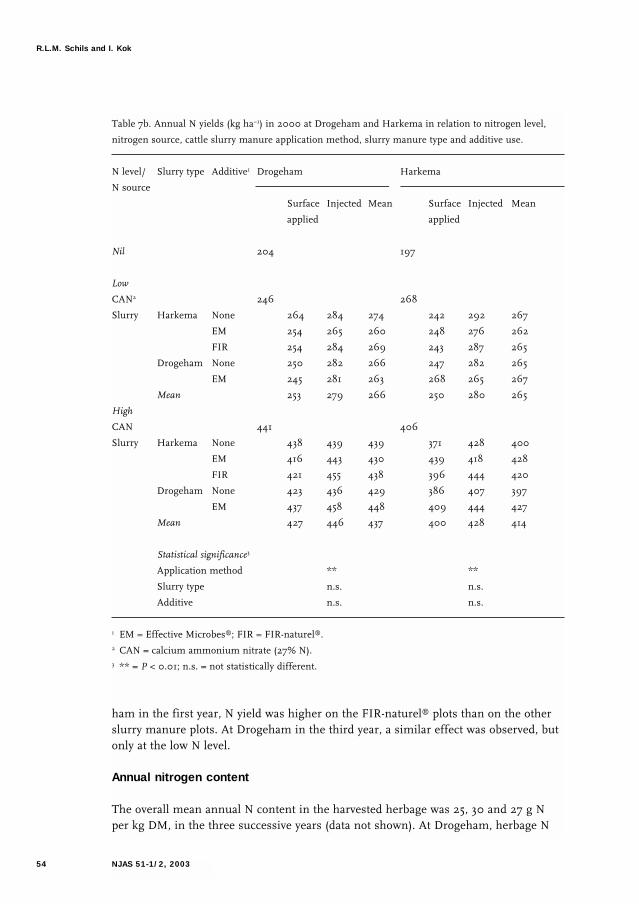
Table 7b. Annual N yields (kg ha–1) in 2000 at Drogeham and Harkema in relation to nitrogen level,
nitrogen source, cattle slurry manure application method, slurry manure type and additive use.
N level/ Slurry type Additive1 Drogeham Harkema
N source
Surface Injected Mean Surface Injected Mean
applied applied
Nil 204 197
Low
CAN2 246 268
Slurry Harkema None 264 284 274 242 292 267
EM 254 265 260 248 276 262
FIR 254 284 269 243 287 265
Drogeham None 250 282 266 247 282 265
EM 245 281 263 268 265 267
Mean 253 279 266 250 280 265
High
CAN 441 406
Slurry Harkema None 438 439 439 371 428 400
EM 416 443 430 439 418 428
FIR 421 455 438 396 444 420
Drogeham None 423 436 429 386 407 397
EM 437 458 448 409 444 427
Mean 427 446 437 400 428 414
Statistical significance3
Application method ** **
Slurry type n.s. n.s.
Additive n.s. n.s.
1 EM = Effective Microbes®; FIR = FIR-naturel®.
2 CAN = calcium ammonium nitrate (27% N).
3 ** = P < 0.01; n.s. = not statistically different.
content increased from 24 g N per kg DM without inorganic fertilizer to 28 g N per kg
DM, with inorganic fertilizer N. At Harkema the response to the same range of inor-
ganic fertilizer N was from 24 to 30 g N per kg DM.
Slit injection resulted in significantly higher N contents than surface application, on
average 1.0 g N per kg DM. DM yield production per unit N yield (Figure 2, quadrant I)
was lower with slit injection than with surface application, especially at Drogeham.
Cattle slurry manure management and grassland production
55NJAS 51-1/2, 2003
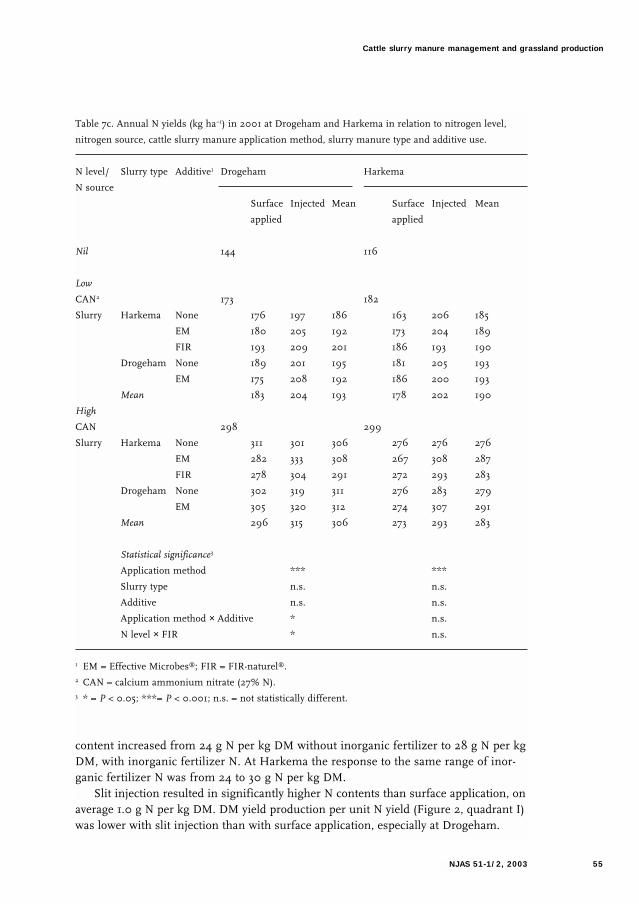
Table 7c. Annual N yields (kg ha–1) in 2001 at Drogeham and Harkema in relation to nitrogen level,
nitrogen source, cattle slurry manure application method, slurry manure type and additive use.
N level/ Slurry type Additive1 Drogeham Harkema
N source
Surface Injected Mean Surface Injected Mean
applied applied
Nil 144 116
Low
CAN2 173 182
Slurry Harkema None 176 197 186 163 206 185
EM 180 205 192 173 204 189
FIR 193 209 201 186 193 190
Drogeham None 189 201 195 181 205 193
EM 175 208 192 186 200 193
Mean 183 204 193 178 202 190
High
CAN 298 299
Slurry Harkema None 311 301 306 276 276 276
EM 282 333 308 267 308 287
FIR 278 304 291 272 293 283
Drogeham None 302 319 311 276 283 279
EM 305 320 312 274 307 291
Mean 296 315 306 273 293 283
Statistical significance3
Application method *** ***
Slurry type n.s. n.s.
Additive n.s. n.s.
Application method × Additive * n.s.
N level × FIR * n.s.
1 EM = Effective Microbes®; FIR = FIR-naturel®.
2 CAN = calcium ammonium nitrate (27% N).
3 * = P < 0.05; ***= P < 0.001; n.s. = not statistically different.

At Drogeham there was a consistent statistically significant interaction between
slurry manure type and additive. On plots receiving manure from Drogeham, the use
of Effective Microbes® increased the annual N content of the herbage from 26.1 to
26.8 g N per kg DM. On plots receiving manure from Harkema, the use of Effective
Microbes® decreased the annual N content from 27.1 to 26.4 g N per kg DM. Further-
more, in two out of the six cases the use of Effective Microbes® increased the N
content after surface application.
Apparent nitrogen efficiency and recovery
The mean ANE of CAN was 27.8 kg DM per kg N, while the mean ANR of CAN was
0.79 kg kg–1 (Tables 8 and 9). Although the mean ANE and ANR were nearly similar
at both sites, the ANE and ANR showed more variation at Drogeham than at Harkema.
It has to be taken into account that for the year 2001 the calculation of the ANE and
ANR was based on the annual yield, excluding the first unfertilized cut.
R.L.M. Schils and I. Kok
56 NJAS 51-1/2, 2003
Table 8. Annual apparent nitrogen efficiency (kg DM per kg N) at Drogeham and Harkema in the years
1999 to 2001 in relation to cattle slurry application method, inorganic fertilizer (CAN), type of slurry
manure, and additive use, at the low N level.
N source Additive1 Drogeham Harkema
1999 2000 20012 mean 1999 2000 20012 mean
CAN3 37.6 28.8 18.8 28.4 32.0 24.1 25.5 27.2
Surface application
Harkema slurry None 7.1 21.5 7.5 12.0 7.5 8.9 7.6 8.0
EM 7.9 20.2 5.8 11.3 9.2 13.7 11.0 11.3
FIR 7.6 18.0 8.8 11.5 7.2 8.9 11.1 9.1
Drogeham slurry None 6.2 15.2 5.5 9.0 8.2 9.3 8.7 8.7
EM 5.3 10.9 4.6 6.9 8.2 12.5 8.4 9.7
Mean 6.8 17.2 6.4 10.1 8.1 10.7 9.4 9.4
Slit injection
Harkema slurry None 10.1 20.3 12.5 14.3 10.6 17.4 16.3 14.8
EM 8.9 18.8 10.6 12.8 12.7 13.6 17.6 14.6
FIR 9.9 20.8 13.4 14.7 10.2 16.5 14.1 13.6
Drogeham slurry None 11.1 17.3 11.0 13.1 12.7 11.9 14.1 12.9
EM 12.5 18.8 11.3 14.2 11.6 11.5 13.2 12.1
Mean 10.5 19.2 11.8 13.8 11.6 14.2 15.1 13.6
1 EM = Effective Microbes®; FIR = FIR-naturel®.
2 Not including the unfertilized 1st cut.
3 CAN = calcium ammonium nitrate (27% N).

The statistically significant effect of application method on the DM and N yields is
clearly reflected in the ANE and ANR. The mean ANE of slurry manure was 9.8 kg
DM per kg N following surface application, and 13.7 kg DM per kg N following slit
injection. Compared with the ANE of CAN this results in an efficiency index for the
effect of slurry-manure N on DM yield (EI-DM) of 36% for surface application and
50% for slit injection. The mean ANR of surface-applied slurry manure was 0.30 kg
kg–1, while the mean ANR of slit-injected manure was 0.44 kg kg–1. This leads to an
efficiency index for the effect of slurry manure N on N yield (EI-N) of 38% for surface
application and 56% for slit injection. Similar to the observation for CAN, it was found
that the variation in ANE and ANR of slurry manure was higher at Drogeham than at
Harkema. The annual variation for the two application methods was not different.
Slurry manure type and additive use had no consistent main effect on ANE or
ANR. Considering the stated effects of slurry manure type and additive on DM and N
yields, there are two relevant observations. At Drogeham in each year, slurry manure
Cattle slurry manure management and grassland production
57NJAS 51-1/2, 2003
Table 9. Annual apparent nitrogen recovery (kg N per kg N) at Drogeham and Harkema in the years
1999 to 2001 in relation to cattle slurry manure application method, inorganic fertilizer (CAN), type of
slurry manure and additive use, at the low N level.
N source Additive1 Drogeham Harkema
1999 2000 20012 mean 1999 2000 20012 mean
CAN3 0.96 0.84 0.54 0.78 0.75 0.86 0.78 0.80
Surface application
Harkema slurry None 0.23 0.69 0.21 0.38 0.16 0.33 0.23 0.24
EM 0.19 0.60 0.20 0.33 0.29 0.38 0.32 0.33
FIR 0.21 0.60 0.26 0.36 0.16 0.34 0.36 0.29
Drogeham slurry None 0.14 0.47 0.18 0.26 0.21 0.30 0.25 0.25
EM 0.13 0.43 0.14 0.23 0.18 0.45 0.25 0.29
Mean 0.18 0.56 0.20 0.31 0.20 0.36 0.28 0.28
Slit injection
Harkema slurry None 0.25 0.73 0.37 0.45 0.22 0.64 0.51 0.46
EM 0.22 0.60 0.37 0.40 0.31 0.52 0.52 0.45
FIR 0.27 0.73 0.42 0.47 0,32 0.60 0.43 0.45
Drogeham slurry None 0.29 0.62 0.34 0.42 0.38 0.50 0.42 0.43
EM 0.35 0.62 0.35 0.44 0.34 0.39 0.40 0.38
Mean 0.28 0.66 0.37 0.44 0.32 0.53 0.46 0.44
1 EM = Effective Microbes®; FIR = FIR-naturel®.
2 Not including the unfertilized 1st cut.
3 CAN = calcium ammonium nitrate (27% N).
from Harkema had a higher ANE and ANR than slurry manure from Drogeham, but
only if surface-applied. Averaged over three years (Drogeham), EI-N for surface-applied
slurry manure from Harkema and Drogeham was 46 and 32%, respectively, whereas
for injected manure these figures were 56 and 55%, respectively. The second observa-
tion is that at Drogeham in the third year, treatments with FIR-naturel® had a higher
ANE and ANR than the other slurry manure treatments.
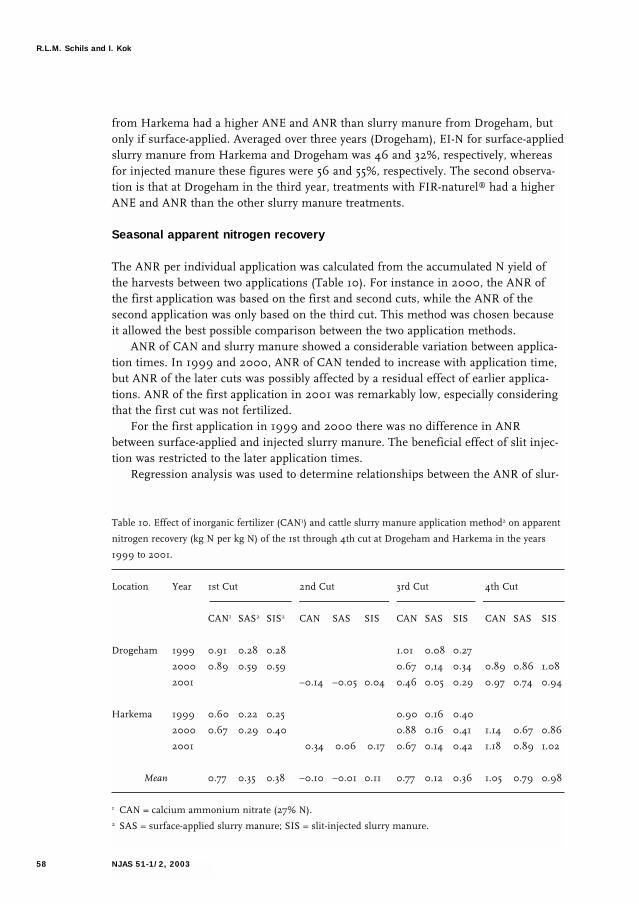
Seasonal apparent nitrogen recovery
The ANR per individual application was calculated from the accumulated N yield of
the harvests between two applications (Table 10). For instance in 2000, the ANR of
the first application was based on the first and second cuts, while the ANR of the
second application was only based on the third cut. This method was chosen because
it allowed the best possible comparison between the two application methods.
ANR of CAN and slurry manure showed a considerable variation between applica-
tion times. In 1999 and 2000, ANR of CAN tended to increase with application time,
but ANR of the later cuts was possibly affected by a residual effect of earlier applica-
tions. ANR of the first application in 2001 was remarkably low, especially considering
that the first cut was not fertilized.
For the first application in 1999 and 2000 there was no difference in ANR
between surface-applied and injected slurry manure. The beneficial effect of slit injec-
tion was restricted to the later application times.
Regression analysis was used to determine relationships between the ANR of slur-
R.L.M. Schils and I. Kok
58 NJAS 51-1/2, 2003
Table 10. Effect of inorganic fertilizer (CAN1) and cattle slurry manure application method2 on apparent
nitrogen recovery (kg N per kg N) of the 1st through 4th cut at Drogeham and Harkema in the years
1999 to 2001.
Location Year 1st Cut 2nd Cut 3rd Cut 4th Cut
CAN1 SAS2 SIS2 CAN SAS SIS CAN SAS SIS CAN SAS SIS
Drogeham 1999 0.91 0.28 0.28 1.01 0.08 0.27
2000 0.89 0.59 0.59 0.67 0,14 0.34 0.89 0.86 1.08
2001 –0.14 –0.05 0.04 0.46 0.05 0.29 0.97 0.74 0.94
Harkema 1999 0.60 0.22 0.25 0.90 0.16 0.40
2000 0.67 0.29 0.40 0.88 0.16 0.41 1.14 0.67 0.86
2001 0.34 0.06 0.17 0.67 0.14 0.42 1.18 0.89 1.02
Mean 0.77 0.35 0.38 –0.10 –0.01 0.11 0.77 0.12 0.36 1.05 0.79 0.98
1 CAN = calcium ammonium nitrate (27% N).
2 SAS = surface-applied slurry manure; SIS = slit-injected slurry manure.

ry manure and weather parameters (like temperature, precipitation, evaporation and
precipitation surplus) and manure characteristics (like dry matter content and inorgan-
ic N content). Irrespective of application method, the precipitation surplus at the day
of application had a significant positive effect on ANR. Furthermore, DM content of
slurry manure had a statistically significant negative effect on ANR. Together, the
Cattle slurry manure management and grassland production
59NJAS 51-1/2, 2003
Table 11. Changes in soil organic matter (% units; 0–10 cm) at Drogeham and Harkema over the 3-year
experimental period (1999–2001) in relation to nitrogen level, nitrogen source, cattle slurry manure
application method, slurry manure type and additive use.
N level/ Slurry type Additive1 Drogeham Harkema
N source
Surface Injected Mean Surface Injected Mean
applied applied
Nil 1.5 0.2
Low
CAN2 0.8 0.2
Slurry Harkema None 0.7 1.4 1.0 –0.3 0.2 –0.1
EM 1.0 0.5 0.7 –0.1 0.2 –0.1
FIR 1.6 1.1 1.3 –0.4 0.2 –0.3
Drogeham None 0.9 1.2 1.0 –0.0 0.4 –0.2
EM 0.7 0.2 0.5 –0.0 0.4 –0.2
Mean 1.0 0.9 0.9 –0.0 0.3 –0.1
High
CAN 1.0 –0.5
Slurry Harkema None 0.0 0.8 0.4 –0.4 –0.8 –0.6
EM 0.8 0.3 0.5 –0.0 –0.9 –0.4
FIR 1.4 0.5 0.9 –0.1 –0.1 –0.0
Drogeham None 1.1 1.2 1.1 –0.6 –0.5 –0.6
EM 0.7 0.7 0.7 –0.5 –0.3 –0.1
Mean 0.8 0.7 0.7 –0.3 –0.4 –0.3
Statistical significance3
Application method n.s. n.s.
Slurry type n.s. n.s.
Additive n.s. n.s.
FIR * n.s
Application method × Additive * n.s.
1 EM = Effective Microbes®; FIR = FIR-naturel®.
2 CAN = calcium ammonium nitrate (27% N).
3 * = P < 0.05; n.s. = not statistically different.

factors application method, precipitation surplus and DM content accounted for 63%
of the variation in ANR.
Soil organic matter and nitrogen
At the end of the third year, mean soil organic matter content measured at a depth of
10 cm had increased by 0.9% at Drogeham but had stabilized at Harkema (Table 11).
The changes in N content were even smaller (data not shown). At Drogeham, average
soil N content decreased with 0.13 g kg–1, which is only 3% of the initial value. At
Harkema no change in average soil N content was observed.
At both sites, application method had no effect on the changes in soil organic
matter or soil N content. At Drogeham, the use of FIR-naturel® had a positive statisti-
cally significant effect on organic matter content, especially with surface application.
Furthermore, at Drogeham the use of Effective Microbes® had a statistically signifi-
cant negative effect on soil organic matter content only in combination with slit injec-
tion.
Also at Drogeham there was a significant interaction between slurry manure type
and N level in their effect on soil N content. At the low N level, soil N content was
higher with manure from Harkema, while at the high N level soil N content was high-
er with manure from Drogeham.
Discussion
General
This paper presents the results of the first three years of an experiment of which the
third year was hampered by an outbreak of Foot and Mouth disease. The main find-
ings concern the direct relationship, within one year, between N input through various
sources and N uptake and DM yield of grass. These results allow us to meet the first
objective, i.e., to establish the effect of slurry manure management on N utilization.
As to the longer-term objectives, i.e., the effects on soil and sward characteristics, only
preliminary conclusions can be drawn. As the experiment will be continued, more
conclusive results are to be expected in the future.
The strategy of the VEL and VANLA farmers to attain their objectives comprises a
combination of management measures. Slurry manure management is only one of
them, but is recognized to play a key role in the total N cycle of a dairy farm. So a field
experiment that studies a single aspect in detail, which would not be possible in a
whole-farm experiment, is justified. However, a field experiment brings about certain
implications that have to be accounted for when translating its results to the farm situ-
ation. The experiment was carried out as a cutting trial, which excludes extra variation
through grazing and thus is not representative for the grassland management in the
region. Grazing involves an additional but very heterogeneous input of N and organic
matter. It furthermore may affect sward composition, which can mask the effects of
the experimental factors studied. The measured grass yields in a cutting experiment
R.L.M. Schils and I. Kok
60 NJAS 51-1/2, 2003

are gross yields and do not necessarily represent the net intake by the grazing dairy
cows. Slurry manure type or application method may affect grazing behaviour and
thus net production of grassland (Laws & Pain, 2002). All plots were cut on the same
day, which means that the slower growing treatments were harvested at a lower DM
yield than the faster growing ones. In practice, a slow-growing pasture is grazed or
harvested at a later date, but at the same yield as a fast-growing pasture. So in this
experiment the lower yielding plots had a higher cutting frequency than they would
have had in practice, which resulted in an under-estimation of annual DM yield and in
an over-estimation of crude protein content (Vellinga & André, 1999). On the other
hand, the regrowth is faster for a lower yielding plot than for a higher yielding plot (De
Wit, 1987).
Application method
The annual N utilization of surface-applied slurry manure was consistently lower than
that of slurry manure applied by slit injection, which is in line with earlier findings in
the Netherlands (Van Der Meer et al., 1987; Schils, 1992a; Schreuder et al., 1995).
Although ammonia volatilization was not measured in this experiment, it is most like-
ly that the lower N utilization is caused by higher ammonia losses (Huijsmans et al.,
2001).
In this experiment the average N efficiency index (EI-N) for surface application and
slit injection was 38 and 56%, respectively. Although consistent and statistically signif-
icant, this difference between application methods is smaller than the difference found
in earlier experiments. Integration of earlier experiments by Noij et al. (1992), in
which EI-N for surface application and slit injection was 26 and 50%, respectively, has
led to the present recommendations (Anon., 1994; 1998). In our experiment the rela-
tively high annual EI-N for surface application was caused entirely by the relatively
high N utilization following the first slurry manure application in March. However,
this experiment was not suitable to determine effects of application time. The two or
three applications were given to the same plot. Consequently, the observed effect after
the second application was a combination of the direct effect of the second and the
residual effects of the first application. In earlier experiments with surface application
and slit injection approximately 50 to 60% of the annual yield effect was found in the
first cut following slurry manure application. The remaining 40 to 50% was obtained
in later cuts. This probably contributes to the high ANR values found at later applica-
tion times. Nevertheless, the present results clearly show that the difference between
surface application and slit injection only occurred at later application times. Until
now an effect of application time on N utilization has only been observed for injection
(Schils, 1992a, b; Schreuder et al., 1995). As to our experiment it is unclear what
caused the higher N utilization with spring application. Based on ammonia volatiliza-
tion measurements (Bussink et al., 1994; Huijsmans et al., 2001) it can be argued that
the generally prevailing lower temperature and lower radiation in spring justify the
expectation of a higher N utilization in that season. The positive effect of precipitation
surplus on N utilization found in this experiment could not be specifically related to
spring application. Furthermore, the observed effect of precipitation surplus was irre-
Cattle slurry manure management and grassland production
61NJAS 51-1/2, 2003
spective of the application method, and thus does not explain the relative differences
between application methods.
The higher EI-N for surface application in comparison with earlier experiments
can be split into two effects. First, the ANR of surface-applied slurry manure (0.30 kg
kg–1) was indeed higher than in earlier experiments, e.g. 0.23 kg kg–1 by Van Der Meer
et al. (1987), 0.21 kg kg–1 by Schils (1992a) and 0.15 kg kg–1 by Schreuder et al. (1995).
In addition, the ANR of CAN in the present experiment (0.79 kg kg–1) was lower than
in earlier experiments by Van Der Meer et al. (1987), Schils (1992a) and Schreuder et
al. (1985), who found ANR values of 0.91, 0.87 and 0.87 kg kg–1, respectively.
The overall results of the present experiment substantiate the claim that slit injec-
tion has a positive effect on N utilization of grassland. However, it can be argued that
within the Mineral Accounting System (MINAS) (Henkens & Van Keulen, 2001) farm-
ers have their own responsibility in attaining the objectives. If they choose to use
surface application, the N losses increase by approximately 30 kg ha–1 year–1. Conse-
quently they will have to take other measures to compensate these losses. Such a
system would encourage farmers to maximize N utilization from surface-applied slur-
ry manure, and thus carefully choose the appropriate time of application.
Beside N utilization, the choice of the application method should be judged against
other criteria, such as costs, flexibility, precision of application, energy use, denitrifica-
tion losses (Thompson et al., 1987) and impact on soil quality. De Goede et al. (2003)
studied the latter within the same field experiment. They found for instance that in the
summer of 2000 slit injection at Drogeham had a negative effect on the earthworm
population. A reduced earthworm population signifies a potentially lower N mineral-
ization. During the course of the first three years of this experiment, soil data have not
shown any effect of application method on soil organic matter or soil N content.
Slurry manure type and additive use
The characteristics of the two slurry manure types used are brought about by a combi-
nation of management measures. The slurry manure from Harkema could be consid-
ered as manure from conventional management. Compared with the average composi-
tion of slurry manure in the Netherlands in 1998, it contained a similar amount of N
(Anon., 1998). The slurry manure from Harkema had a lower DM content than the
manure from Drogeham, especially in the second and third year. Harkema manure
had a positive effect on grass DM yield at Drogeham in the second year. As many
experiments have shown beneficial effects of slurry manure dilution on ammonia
volatilization (Bussink & Bruins, 1992; Sommer & Oleson, 1999) and N utilization
(Stevens et al., 1992; Van Der Meer, 1994) this positive response may have been
caused by the lower DM content. The farm at Drogeham combined two management
measures, i.e., the use of Euromestmix® and a reduction in protein supply of the dairy
herd. The manure from Drogeham contained a similar amount of N as the manure
from farms participating in the ‘Cows & Opportunities’ project (Oenema et al., 2001).
These farms also aim to reduce the N losses through a range of measures.
Slurry manure type and additive had no consistent effect on manure-N utilization.
However, occasionally a statistically significant effect was observed, but mostly in inter-
R.L.M. Schils and I. Kok
62 NJAS 51-1/2, 2003

action with other factors. If we consider that the experiment consisted of 24 compar-
isons (2 locations, 3 years, 2 N levels and 2 application methods), the effects of slurry
manure type and additive can be summarized as follows. The annual DM yield was posi-
tively affected by the use of Harkema slurry manure (2×), Effective Microbes® (2×) and
FIR-naturel® (2×), and negatively affected by FIR-naturel® (2×). The annual N yield was
positively affected by Harkema slurry manure (4×), Effective Microbes® (2×), and FIR-
naturel® (6×). Further research is necessary to study whether a longer-term consistent
effect can be found, and moreover, what factors affect the large variation in the observa-
tions. In this respect it is remarkable that nearly all statistically significant effects of slur-
ry manure type and additive use were found at Drogeham and none at Harkema.
At Drogeham the observed higher N yield with the use of FIR-naturel® might be
associated with the higher organic matter content of the FIR-naturel® plots. It has to
be realized that the organic matter was determined with the ‘loss on ignition’ method
at 550 oC. Although the carbon in FIR-naturel® is inert, the added clay minerals lead to
an overestimation of the organic matter content.
Apart from the statistical significance of the effects of slurry manure type and addi-
tive, it is important to consider the relevance of the observed effects, especially in rela-
tion to the costs. The annual costs of the additives, in accordance with the way they
were used in this experiment, are € 52, € 29 and € 852 ha–1 year–1, for Euromestmix®,
Effective Microbes® and FIR-naturel®, respectively. In practice, FIR-naturel® is usually
not applied each year like in this experiment, but once every 10 or 20 years. When
using Euromestmix®, for instance, a fodder price of € 0.10 per kg DM requires an
annual DM yield increase of 520 kg ha–1 to break even.
Conclusions
– The annual N utilization of slurry manure was 18% higher with slit injection than
with surface application. The positive effect of slit injection was obtained with
applications from June onwards. Slurry manure application in March resulted in a
similar N utilization for both application techniques.
– Slurry manure type and additive use had no consistent effect on the manure-N
utilization, but statistically significant effects – always in interaction with another
experimental factor – were occasionally observed for both factors,
– Application method, slurry manure type or additive use had no effect on changes
in soil organic matter or soil N content. Longer-term monitoring is necessary to
draw firm conclusions.
– Application method, slurry manure type or additive use did not affect the botanical
composition of the sward.
Acknowledgements
We wish to thank Messrs S. Sikkema and T. Hoeksma for their kind permission to
conduct the experiments on their farms. We also thank Jan Zonderland, Jan Boonstra,
Cattle slurry manure management and grassland production
63NJAS 51-1/2, 2003

Klaas Sikkema, Henk Schilder and Tim Wiersma for their contribution to the field-
work, and Johan Van Riel for the statistical analysis. This project was funded by the
Ministry of Agriculture, Nature and Food Quality, through Research Programme PO-9.
References
Anonymous, 1994. Fertilizer Recommendations for Grassland and Fodder Crops. Publikatie No 44.
Information and Knowledge Center (IKC), Lelystad, 82 pp. (In Dutch)
Anonymous, 1998. Fertilizer Recommendations for Grassland and Fodder Crops. Research Station for
Cattle, Sheep and Horse Husbandry (PR), Lelystad, 53 pp. (In Dutch)
Anonymous, 1999–2001. Monthly Weather Surveys of the Netherlands. Koninklijk Nederlands Meteo-
rologisch Instituut (KNMI), De Bilt. (In Dutch)
Anonymous, 2001. GENSTAT 5, Release 4.21. Lawes Agricultural Trust, Rothamsted Experimental
Station, Harpenden 796 pp.
Anonymous, 2002. Farm Accountancy Data Network. Agricultural Economics Research Institute.
(www.lei.wageningen-ur.nl).
Aarts, H.F.M., E.E. Biewinga & H. Van Keulen, 1992. Dairy farming systems based on efficient nutrient
management. Netherlands Journal of Agricultural Science 40: 285–299.
Bussink, D.W. & M.A. Bruins, 1992. Reduction of Ammonia Volatilization using different Slurry Appli-
cation Techniques on Grassland. Meststoffen 1992: 31–36. (In Dutch)
Bussink, D.W., J.F.M. Huijsmans & J.J.M.H. Ketelaars, 1994. Ammonia volatilization from nitric-acid-
treated cattle slurry, surface applied to grassland. Netherlands Journal of Agricultural Science 42:
293–309.
Bussink, D.W. & O. Oenema, 1998. Ammonia volatilization from dairy farming systems in temperate
areas: a review. Nutrient Cycling in Agroecosystems 51: 19–33.
De Goede, R.G.M., L. Brussaard & A.D.L. Akkermans, 2003. On-farm impact of cattle slurry manure
management on biological soil quality. NJAS – Wageningen Journal of Life Sciences 51. (This issue)
De Wit, M.A.E., 1987. The Effect of the Yield of a Preceding Cut on the Regrowth of Grass. Rapport No
107, Research Station for Cattle, Sheep and Horse Husbandry (PR), Lelystad, 123 pp. (In Dutch)
Hassink, J., 1995. Organic matter dynamics and N mineralization in grassland soils. PhD thesis
Wageningen Agricultural University, Wageningen, 250 pp.
Hassink, J., 1996. Prediction of the soil nitrogen supply of grassland soils. In: J.W.G.M. Loonen &
W.E.M. Bach-De Wit. Stikstof in beeld. Onderzoek inzake de Mest- en Ammoniakproblematiek in
de Veehouderij 20. DLO, Wageningen, pp. 15–35. (In Dutch)
Henkens, P.L.C.M. & H. Van Keulen, 2001. Mineral policy in the Netherlands and nitrate policy within
the European Community. Netherlands Journal of Agricultural Science 49: 117–134.
Higa, T., 1994. Effective Micro-organisms for a Sustainale Agriculture and a Healthy Environment. Van
Arkel, Utrecht, 191 pp. (In Dutch)
Hooghart, J.C. & W.N. Lablans, 1988. From Penman to Makkink: a new Calculation Method for Clima-
tological Evaporation figures. Technische Rapporten No 11, Koninklijk Nederlands Meteorologisch
Instituut (KNMI), De Bilt, 19 pp. (In Dutch)
Huijsmans, J.F.M., J.M.G. Hol & M.M.W.B. Hendriks, 2001. Effect of application technique, manure
characteristics, weather and field conditions on ammonia volatilization from manure applied to
grassland. Netherlands Journal of Agricultural Science 49: 323–342.
R.L.M. Schils and I. Kok
64 NJAS 51-1/2, 2003

Laws, J.A. & B.F. Pain, 2002. Effect of method, rate and timing of slurry application to grassland on the
preference by catlle for treated and untreated areas of pasture. Grass and Forage Science 57: 93–104.
Noij, I.G.A.M. & H.J. Westhoek, 1992. Utilization of Animal Manure on Grass and Maize following
Low-emission Application. Intern Rapport No 8, Information and Knowledge Centre (IKC),
Lelystad, 44 pp. (In Dutch)
Oenema, J., G.J. Koskamp & P.J. Galama, 2001. Guiding commercial pilot farms to bridge the gap
between experimental and commercial dairy farms; the project ‘cows & opportunities’. Netherlands
Journal of Agricultural Science 49: 277–296.
Roep, D., J.D. Van Der Ploeg & J.C.S. Wiskerke, 2003. Managing technical-institutional design process-
es: some strategic lessons from environmental co-operatives in the Netherlands. NJAS – Wage-
ningen Journal of Life Sciences 51. (This issue)
Schils, R.L.M., 1992a. Effect of Application Time on Nitrogen Utilization of Cattle Slurry Applied to
Grassland. Rapport No 136, Research Station for Cattle, Sheep and Horse Husbandry (PR),
Lelystad, 139 pp. (In Dutch)
Schils, R.L.M., 1992b. Injection of cattle slurry into grassland; effects of application time. In: Proceed-
ings of the 14th General Meeting of the European Grassland Federation, 8–11 June 1992, Lahti,
pp. 336–339.
Schils, R.L.M., H.G. Van Der Meer H.G., A.P. Wouters, J.H. Geurink & K. Sikkema, 1999. Nitrogen
utilization from diluted and undiluted nitric acid treated cattle slurry following surface application
to grassland. Nutrient Cycling in Agroecosystems 53: 269–280.
Schreuder, R., A.P. Wouters & P.J.M. Snijders, 1995. Development Slit Injector and N Utilization of
Cattle Slurry. Rapport No 162, Research Station for Cattle, Sheep and Horse Husbandry (PR),
Lelystad, 106 pp. (In Dutch)
Sommer, S.G. & J.E. Oleson, 1991. Effects of dry matter content and temperature on ammonia loss
from surface applied cattle slurry. Journal of Environmental Quality 20: 679–683.
Stevens, R.J., R.J. Laughlin, J.P. Frost & R. Anderson, 1992. Evaluation of separation plus acidification
with nitric acid and sepeartion plus dilution to make cattle slurry a balanced efficient fertilizer for
grass and silage. Journal of Agricultural Science, Cambridge 119: 391–399.
Thompson, R.B., J.C. Ryden & D.R. Lockyer, 1987. Fate of nitrogen in cattle slurry following surface
appliaction or injection to grassland. Journal of Soil Science 38: 689–700.
Van Der Meer, H.G., R.B. Thompson, P.J.M. Snijders & J.H. Geurink, 1987. Utilization of nitrogen
from injected and surface-spread cattle slurry applied to grassland. In: H.G. Van Der Meer,
R.J. Unwin, T.A. Van Dijk & G.C. Ennik (Eds), Animal Manure on Grassland and Fodder Crops.
Fertilizer or Waste? Martinus Nijhoff, Dordrecht. pp. 47–72.
Van Der Meer, H.G., 1994. Grassland and society. In: L. ’T Mannetje & J. Frame (Eds), Grassland and
Society. Proceedings of the 15th General Meeting of the European Grassland Federation, 6–9 June
1994, Wageningen. Wageningen Pers, Wageningen, pp. 19–32.
Vellinga, Th.V. & G. André, 1999. Sixty years of Dutch nitrogen fertiliser experiments, an overview of
the effects of soil type, fertiliser input, management and developments in time. Netherlands Journal
of Agricultural Science 47: 215–241.
Wouters, A.P., 1995. New application techniques make slurry again a valuable nutrient. In: W. Luten,
H. Snoek, S. Schukking & M. Verboon (Eds), Proceedings of the Symposium Applied Research for
Sustainable Dairy Farming, 31 May – 2 June 1995, Wageningen. Research Station for Cattle, Sheep
and Horse Husbandry, Lelystad, pp. 13–18.
Cattle slurry manure management and grassland production
65NJAS 51-1/2, 2003