effects of lithologic heterogeneity on landscape evolution in the canyons of the colorado plateau...
TRANSCRIPT

Effects of Lithologic Heterogeneity on Landscape Evolution in the Canyons of the Colorado Plateau
Courtney StarlingKelin Whipple
Andrew Darling
Arizona State University
Brian Clarke
2014-2015 Arizona Space Grant Symposium
April 18, 2015

OutlineObjectives: Characterize
lithologic heterogeneityMethod: Seismic refraction studyAnalyze field findings using
seismic softwareCompare p-wave field velocities
to lab core sample velocities.

Seismic Refraction Field StudyP-wave – Propagates parallel to
particle motion.
Measure p-wave velocities using Geophones and seismographs.
Animation courtesy Larry Braile, Purdue University
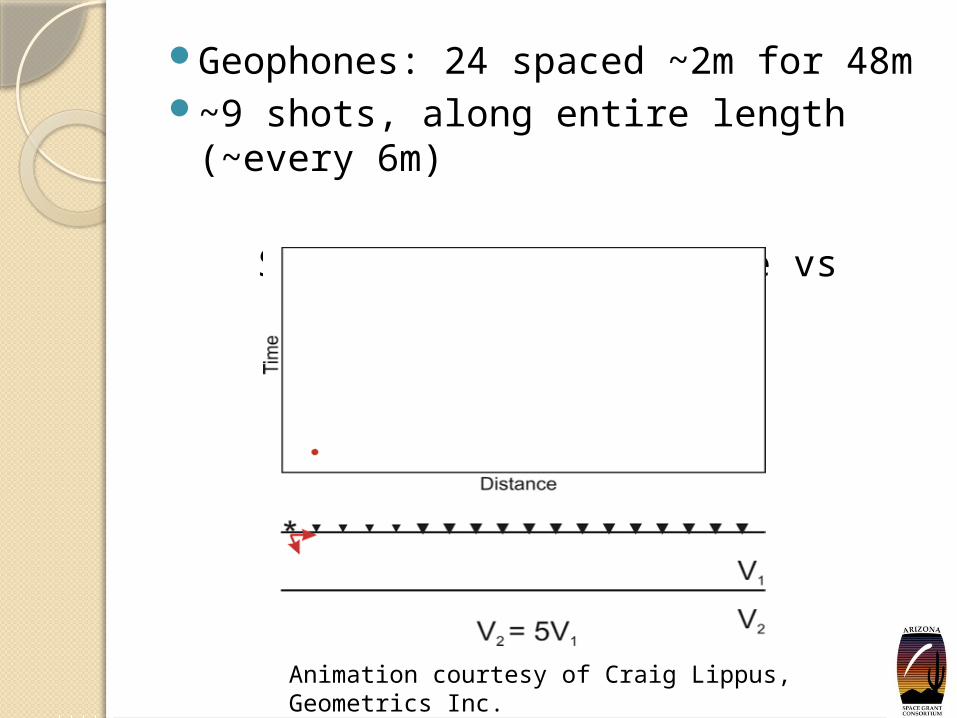
Geophones: 24 spaced ~2m for 48m~9 shots, along entire length (~every
6m)
Seismic Refraction Time vs Distance
Animation courtesy of Craig Lippus, Geometrics Inc.

Field Set-upSeismic HammerSeismic PlateGeophonesMeasuring Tape
Photo Courtesy of Marina Bravo Foster, ASU
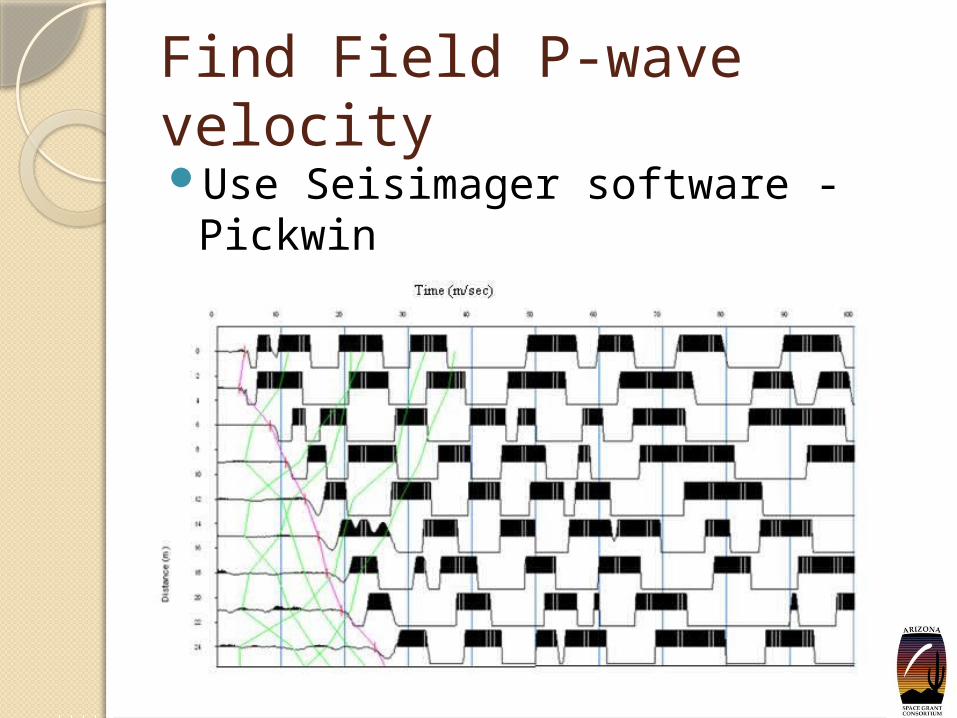
Find Field P-wave velocityUse Seisimager software -
PickwinMake first picks

P-wave velocity at depthAs depth increases p-wave velocity
increases
Figure courtesy of Brian Clarke

Esplanade 5 Formation
• Ray paths from geophones– Determines depth of model

Esplanade 5 Formation• Surface Velocity: 0.6-0.9 km/s– Weathered rock at surface to Soil
• Velocity at Depth: 2.0-2.2 km/s

Other Tomographies
Hermit 2-Elevated Formation- Slow Velocities
Navajo 1-Longest survey
Claron 2-Fast Velocities at Depth

ConclusionsField Velocities confirm earlier
observationsFormations with outcrops of bedrock-
faster field velocities.Future work – Compare Field to Lab
Velocities
11
Survey NameMinimum Velocity
Maximum Velocity
Minimum Velocity
Maximum Velocity
Kaibab5 0.3 0.9 1.6 2.3 3.62Esplanade5 0.6 0.9 2 2.2 3.72Esplanade4 0.8 2.5 2.5 2.5+ 2.86Claron1 0.5 1.2 2.2 2.4 5Claron2 0.5 1 2.4 2.5 5.11Navajo1 0.4 0.5 1.1 1.3 9.24Hermit 2 0.3 0.5 1.4 1.4 5.71
Data Depth
(m)
Surface Velocity (km/s) Velocity at Depth (km/s)

Thank You
Acknowledgements:
Dr. Kelin WhippleDr. Brian ClarkeAndrew Darling
Marina Bravo Foster