effects of radiation and long-term thermal cycling on epc
TRANSCRIPT

National Aeronautics and Space Administration
Effects of Radiation and Long-Term Thermal Cycling on EPC 1001Thermal Cycling on EPC 1001
Gallium Nitride Transistors
Richard L. Patterson, NASA GRCLeif Scheick, JPL
Jean Marie Lauenstein & Megan Casey NASA GSFCJean-Marie Lauenstein & Megan Casey, NASA GSFCAhmad Hammoud, Vantage Partners LLC
September 2012
www.nasa.gov
September 2012
1

National Aeronautics and Space Administration
SCOPE OF WORKSCOPE OF WORK
A NEPP (NASA Electronic Parts and Packaging)• A NEPP (NASA Electronic Parts and Packaging) collaborative effort among NASA Centers to address performance and reliability of new COTS (Commercial-Off-
S f)The-Shelf) power devices based on wide bandgap semiconductor for use in space harsh environment
• Test and evaluate performance of emerging GaN (Gallium Nitride) & SiC (Silicon Carbide) power devices under the exposure to radiation and thermal cyclingexposure to radiation and thermal cycling
• Document results and disseminate findings
www.nasa.gov 2
Document results and disseminate findings

National Aeronautics and Space Administration
TECHNICAL APPROACHTECHNICAL APPROACH:
• Identify and acquire candidate power devicesy q p
• Perform parametric evaluation
• Subject devices to radiation exposure representative of mission environment
• Perform long-term thermal cycling on survived parts
• Determine effects of radiation and temperature cycling on performance of devices
• Address reliability, determine risk factors, and identify f
www.nasa.gov 3
mitigation techniques for device use in space missions

National Aeronautics and Space Administration
TEST DEVICES
• Efficient Power Conversion, EPC1001, GaN transistors grown on Si (Silicon) wafer; http://www.epc-co.com
• Passivated die form with solder bumps• Passivated-die form with solder bumps
LET
Sample die mounted on test structure
# ofParts
DeviceLabel Condition Ion Energy
(MeV)
LET(MeVcm2
/gm)
Range(μm)
Dose(rad)
1 K7063 Irradiated Au 2342 84 7 122 9 227181 K7063 Irradiated Au 2342 84.7 122.9 22718
1 K7064 Irradiated Xe 1569 98.8 124.5 8301
1 K7044 Irradiated Xe 1569 50.9 124.5 7886
www.nasa.gov 4
1 K7065 Irradiated Xe 1569 98.8 124.5 15838
4 K7068-K7071 Control (un-irradiated)

National Aeronautics and Space Administration
EPC1001 E h t M d G N P T i tEPC1001 Enhancement-Mode GaN Power Transistor
Manufacturer’s Specifications
Part # EPC1001
Manufacturer s Specifications
Drain-Source Voltage, VDS (V) 100
Gate Threshold Voltage, VTH (V) 1.4 @ VDS = VGS, ID = 5 mA
Drain Current, ID (A) 25
Drain-Source On Resistance, RDS(ON) (mΩ) 5.6 @ VGS = 5V, ID = 25 A
Operating Temperature, TJ (ºC) -40 to +125
Package Type Passivated-Die with Solder Bumps
www.nasa.gov 5
Package Type Passivated Die with Solder Bumps

National Aeronautics and Space Administration
Focused Ion Beam and SEM Cross-Sectionf EPC G N T i tof EPC GaN Transistor
SEM Micrograph, 65X ,52 deg Tilt
SEM Micrograph after FIB Cut, 2500X 52 deg Tilt52 deg. Tilt 2500X, 52 deg. Tilt
Sn/Pb
www.nasa.gov 6

National Aeronautics and Space Administration
RADIATION DATA
• Devices were irradiated under bias at increasing drain biases• Transfer curves were measured between irradiations• Devices still functioned but were well out of spec after irradiation• Devices still functioned but were well out of spec after irradiation
Device K7044
Drain Current
Gate Current
(I)
Drain Voltage
www.nasa.gov 7

National Aeronautics and Space Administration
RADIATION DATA
Device K7063Device K7063
Drain Current
)
D i V lt
Gate Current
(I)
Drain Voltage
www.nasa.gov 8

National Aeronautics and Space Administration
THERMAL CYCLING TESTTHERMAL CYCLING TEST
Cycling profile
Total # of Cycles 1000 Temperature rate of change: 10 ºC/min 18 min temp change time 18 min temp change time Temperature range: -55 ºC to +125 ºC Soak time at extreme temperatures: 10 min
10 min10 min+125 ºC
10 ºC/min
-55 ºC
www.nasa.gov 9
10 min 10 min

National Aeronautics and Space Administration
THERMAL CYCLING SETUP & MEASUREMENT
ParametersI V O t t Ch t i ti• I-V Output Characteristics
• Gate Threshold Voltage, VTH• Drain-Source On-Resistance, RDS(on)
Equipment• SONY/Tektronix 370A Curve Tracer• Keithley 238 Source-Measure-UnitsKeithley 238 Source Measure Units• Sun System Environmental Chamber
Measurements• Pre, during, & post-cycling• At room temperature
www.nasa.gov 10

National Aeronautics and Space AdministrationI-V Curves for K7068 (control)
0 8
0.9K7068.pdw
0 8
0.9K7068.pdw
VGS = 1.88 V
I D (A
)
0.5
0.6
0.7
0.8 VGS = 2.0 V1.5 V
1.4 V
1.3 V
I D (A
)
0.5
0.6
0.7
0.8 GS 88
1.38 V
1.28 V
1.48 V
0.1
0.2
0.3
0.4
1.2 V
1.1 V 0.1
0.2
0.3
0.4
1.18 V
1.08 V
0.98 V
Pre-Cycling After 500 CyclesVDS (V)
0.0 0.2 0.4 0.6 0.80.0
VDS (V)0.0 0.2 0.4 0.6 0.8
0.0
0.9K7068.pdw
0.9K7068.pdw
I D (A
)
0.5
0.6
0.7
0.8
VGS = 1.88 V1.38 V
1.28 VI D
(A)
0.5
0.6
0.7
0.8
VGS = 1.83 V
1.33 V
1.23 V
I
0.1
0.2
0.3
0.4 1.18 V
1.08 V
0.98 V
I
0.1
0.2
0.3
0.4
1.13 V
1.03 V
www.nasa.gov 11
After 824 Cycles After 1000 CyclesVDS (V)
0.0 0.2 0.4 0.6 0.80.0
VDS (V)0.0 0.2 0.4 0.6 0.8
0.0

National Aeronautics and Space AdministrationI-V Curves for K7069 (control)
0 8
0.9K7069.pdw
VGS = 2.0 V0 8
0.9K7069.pdw
I D (A
)
0.5
0.6
0.7
0.8
1.5 V
1.4 V
1.6 V
I D (A
)
0.5
0.6
0.7
0.8 VGS = 1.950 V
1.35 V
1.55 V1.45 V
0.1
0.2
0.3
0.4
1.3 V
1.2 V 0.1
0.2
0.3
0.4
1.25 V
1.15 V
Pre-Cycling After 500 CyclesVDS (V)
0.0 0.2 0.4 0.6 0.80.0
VDS (V)0.0 0.2 0.4 0.6 0.8
0.0
0 8
0.9K7069.pdw
0.9K7069.pdw
I D (A
)
0.5
0.6
0.7
0.8
VGS = 1.950 V
1.35 V1.45 V
I D (A
)0.5
0.6
0.7
0.8VGS = 1.95 V
1.35 V
1.45 V
0.1
0.2
0.3
0.41.25 V
1.15 V
1.05 V 0.1
0.2
0.3
0.4
1.25 V
1.15 V
1.05 V
www.nasa.gov 12
After 824 Cycles After 1000 CyclesVDS (V)
0.0 0.2 0.4 0.6 0.80.0
VDS (V)0.0 0.2 0.4 0.6 0.8
0.0

National Aeronautics and Space AdministrationI-V Curves for K7070 (control)
0 8
0.9K7070.pdw
0 8
0.9K7070.pdw
I D (A
)
0.5
0.6
0.7
0.8VGS = 1.9 V
1.4 V1.3 V
I D (A
)
0.5
0.6
0.7
0.8VGS = 1.77 V
1.17 V
1 07 V
1.27 V
0.1
0.2
0.3
0.4 1.2 V
1.1 V
1.0 V 0.1
0.2
0.3
0.4 1.07 V
0.97 V
0.87 V
Pre-Cycling After 500 CyclesVDS (V)
0.0 0.2 0.4 0.6 0.80.0
VDS (V)0.0 0.2 0.4 0.6 0.8
0.0
0.9K7070.pdw
VGS = 1 77 V0.9
K7070.pdw
D (A
)
0.5
0.6
0.7
0.8VGS = 1.77 V
1.17 V
1 07 V
1.27 V
D (A
)0.5
0.6
0.7
0.8VGS = 1.72 V
1.22 V
1.12 V
I
0.1
0.2
0.3
0.41.07 V
0.97 V
0.87 V
I
0.1
0.2
0.3
0.4
1.02 V
0.92 V
www.nasa.gov 13
After 824 Cycles After 1000 CyclesVDS (V)
0.0 0.2 0.4 0.6 0.80.0
VDS (V)0.0 0.2 0.4 0.6 0.8
0.0

National Aeronautics and Space AdministrationI-V Curves for K7071 (control)
0 8
0.9K7071.pdw
VGS = 2.0 V0 8
0.9K7071.pdw
I D (A
)
0.5
0.6
0.7
0.8
1.5 V
1.6 V
I D (A
)
0.5
0.6
0.7
0.8 VGS = 2.0 V
1.4 V
1.5 V1.6 V
0.1
0.2
0.3
0.4 1.4 V
1.3 V
0.1
0.2
0.3
0.4
1.3 V
1.2 V
Pre-Cycling After 500 CyclesVDS (V)
0.0 0.2 0.4 0.6 0.80.0
VDS (V)0.0 0.2 0.4 0.6 0.8
0.0
0.9K7071.pdw
0.9K7071.pdw
I D (A
)
0.5
0.6
0.7
0.8 VGS = 2.0 V
1.4 V1.5 V
I D (A
)0.5
0.6
0.7
0.8VGS = 2.0 V
1.4 V
1 3 V
1.5 V
I
0.1
0.2
0.3
0.4 1.3 V
1.2 V
1.1 V
I
0.1
0.2
0.3
0.41.3 V
1.2 V
1.1 V
www.nasa.gov 14
After 824 Cycles After 1000 CyclesVDS (V)
0.0 0.2 0.4 0.6 0.80.0
VDS (V)0.0 0.2 0.4 0.6 0.8
0.0

National Aeronautics and Space AdministrationI-V Curves for K7063 (irradiated, Au ions, 22.7 krad)
0 8
0.9K7063.pdw
VGS = 2.0 V1 6 V 0 8
0.9K7063.pdw
I D (A
)
0.5
0.6
0.7
0.8
1.5 V
1.4 V
1.6 V
I D (A
)
0.5
0.6
0.7
0.8 VGS = 1.98 V
1.38V
1 28 V
1.48 V
0.1
0.2
0.3
0.4
1.3 V
1.2 V0.1
0.2
0.3
0.4 1.28 V
1.18 V
1.08 V
Pre-Cycling After 500 CyclesVDS (V)
0.0 0.2 0.4 0.6 0.80.0
VDS (V)0.0 0.2 0.4 0.6 0.8
0.0
0.9K7063.pdw
V 1 98 V
0.9K7063.pdw
I D (A
)
0.5
0.6
0.7
0.8 VGS = 1.98 V
1.38V
1.28 V
1.48 V
D (A
)0.5
0.6
0.7
0.8VGS = 1.92 V
1.32 V1.42 V
I
0.1
0.2
0.3
0.4
1.18 V
1.08 V
I
0.1
0.2
0.3
0.4 1.22 V
1.12 V
1.02 V
www.nasa.gov 15
After 824 Cycles After 1000 CyclesVDS (V)
0.0 0.2 0.4 0.6 0.80.0
VDS (V)0.0 0.2 0.4 0.6 0.8
0.0

National Aeronautics and Space AdministrationI-V Curves for K7064 (irradiated, Xe ions, 8.3 krad)
0 8
0.9K7064.pdw
VGS = 1.85 V0 8
0.9K7064.pdw
V = 1 815 V
I D (A
)
0.5
0.6
0.7
0.81.35 V
1.25 V
I D (A
)
0.5
0.6
0.7
0.8 VGS = 1.815 V
1.315 V1.215 V
1.115 V
0.1
0.2
0.3
0.4
1.15 V
1.05 V0.1
0.2
0.3
0.41.015 V
0.915 V
Pre-Cycling After 500 CyclesVDS (V)
0.0 0.2 0.4 0.6 0.80.0
VDS (V)0.0 0.2 0.4 0.6 0.8
0.0
0.9K7064.pdw
0.9K7064.pdw
I D (A
)
0.5
0.6
0.7
0.8 VGS = 1.815 V
1.315 V1.215 V
1.115 VI D
(A)
0.5
0.6
0.7
0.8VGS = 1.72 V
1.22 V
1.12 V
I
0.1
0.2
0.3
0.4
1.015 V
0.915 V
I
0.1
0.2
0.3
0.4 1.02 V
0.82 V
0.92 V
www.nasa.gov 16
After 824 Cycles After 1000 CyclesVDS (V)
0.0 0.2 0.4 0.6 0.80.0
VDS (V)0.0 0.2 0.4 0.6 0.8
0.0

National Aeronautics and Space AdministrationI-V Curves for K7044 (irradiated, Xe ions, 7.9 krad)
0 8
0.9K7044.pdw
VGS = 1.95 V1 45 V 0 8
0.9K7044.pdw
I D (A
)
0.5
0.6
0.7
0.8 1.45 V
1.35 V
1.25 V I D (A
)
0.5
0.6
0.7
0.8 VGS = 1.85 V
1.35 V1.25 V
1.15 V
0.1
0.2
0.3
0.4
1.15 V
0.1
0.2
0.3
0.4
1.05 V
0.95 V
Pre-Cycling After 500 CyclesVDS (V)
0.0 0.2 0.4 0.6 0.80.0
VDS (V)0.0 0.2 0.4 0.6 0.8
0.0
0.9K7044.pdw
0.9
K7044.pdw
D (A
)
0.5
0.6
0.7
0.8 VGS = 1.85 V1.35 V
1.25 V
1.15 VD
(A)
0 4
0.6
0.7
0.8 VGS = 1.76 V
1.26 V
1.16 V
I
0.1
0.2
0.3
0.4
1.05 V
0.95 V
I
0.1
0.2
0.3
0.4
1.06 V
0.96 V
www.nasa.gov 17
After 824 Cycles After 1000 CyclesVDS (V)
0.0 0.2 0.4 0.6 0.80.0
VDS (V)0.0 0.2 0.4 0.6 0.8
0.0

National Aeronautics and Space AdministrationI-V Curves for K7065 (irradiated, Xe ions, 15.8 krad)
0 8
0.9K7065.pdw
0 8
0.9K7065.pdw
I D (A
)
0.5
0.6
0.7
0.8 VGS = 2.0 V
1.5 V
1.6 V
I D (A
)
0.5
0.6
0.7
0.8VGS = 2.0 V
1.5 V1.4 V
0.1
0.2
0.3
0.4 1.4 V
1.3 V
1.2 V 0.1
0.2
0.3
0.4
1.2 V
1.1 V
1.3 V
Pre-Cycling After 500 CyclesVDS (V)
0.0 0.2 0.4 0.6 0.80.0
VDS (V)0.0 0.2 0.4 0.6 0.8
0.0
0.9K7065.pdw
V 2 0 V
0.9K7065.pdw
D (A
)
0.5
0.6
0.7
0.8 VGS = 2.0 V
1.5 V
1.4 V
I D (A
)0.5
0.6
0.7
0.8 VGS = 2.0 V
1.5 V
1.4 V
1 3 VI
0.1
0.2
0.3
0.4
1.2 V
1.1 V
1.3 V
I
0.1
0.2
0.3
0.4
1.2 V
1.1 V
1.3 V
www.nasa.gov 18
After 824 Cycles After 1000 CyclesVDS (V)
0.0 0.2 0.4 0.6 0.80.0
VDS (V)0.0 0.2 0.4 0.6 0.8
0.0
National Aeronautics and Space Administration
5
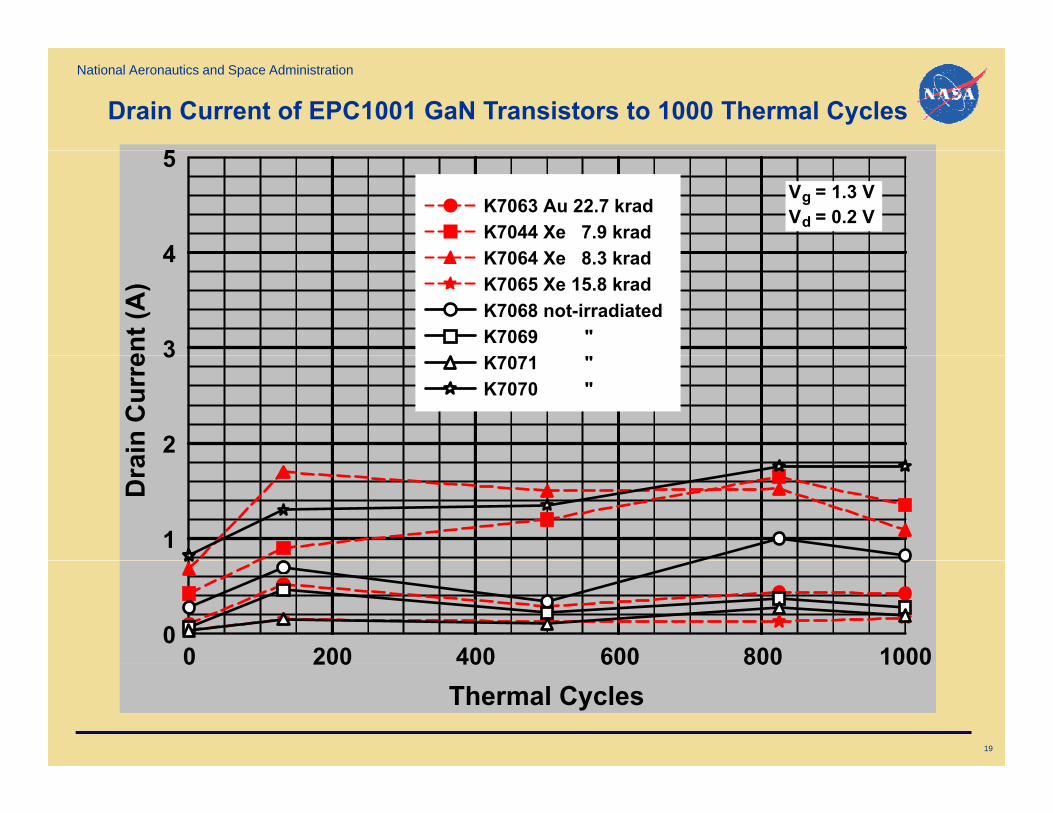
Drain Current of EPC1001 GaN Transistors to 1000 Thermal Cycles
4
5
K7063 Au 22.7 kradK7044 Xe 7.9 kradK7064 X 8 3 k d
Vg = 1.3 VVd = 0.2 V
ent (
A)
3
4 K7064 Xe 8.3 kradK7065 Xe 15.8 kradK7068 not-irradiatedK7069 "
ain
Cur
re
2
3 K7071 "K7070 "
Dra
1
0 200 400 600 800 10000
www.nasa.gov 19
Thermal Cycles0 200 400 600 800 1000

National Aeronautics and Space Administration
GATE THRESHOLD VOLTAGE, VTH
2 0
2.5
K7068K7069
V)V) 1.5
2.0 K7070K7071K7044 (irrad.)K7063 (irrad.)K7064 (irrad.)
V TH
(VV T
H (V
1.0
1.5 K7064 (irrad.)K7065 (irrad.)
0.5
0 200 400 600 800 10000.0
www.nasa.gov 20
Number of Thermal CyclesNumber of Thermal Cycles0 200 400 600 800 1000

National Aeronautics and Space Administration
Drain-Source On Resistance, RDS(ON)
500
m
)m
)
300
400 K7068K7069K7070K7071K7044 (irrad.)
RD
S (m
RD
S (m
200
300 ( )K7063 (irrad.)K7064 (irrad.)K7065 (irrad.)
100
200
0 200 400 600 800 10000
www.nasa.gov 21
Number of Thermal CyclesNumber of Thermal Cycles0 200 400 600 800 1000

National Aeronautics and Space Administration
OBSERVATIONS• All eight GaN transistors remained functional after exposure toAll eight GaN transistors remained functional after exposure to
radiation followed by 1000 thermal cycles between -55 & +125 ⁰C
• Main impact of radiation was increase in leakage current of d idevices
• Thermal cycling seemed to introduce inconsistent variation in I-V characteristic curves of the GaN transistors; notably in their transconductance
• VTH of tested devices experienced an initial decrease with cycling but seemed to level off after exposure to about 130 cycles;but seemed to level off after exposure to about 130 cycles; possibly due to thermal conditioning
• For the RDS(ON) data, at 1000 thermal cycles the values ofRDS(ON) occurred in two distinct clusters. A two-sample t-test (p<0.005) showed that the means of the clusters were different. The cause of the two distinct clusters is not known, but further i ti ti h ld b bl it til th d ti f
www.nasa.gov
investigation should probably wait until the second generation of the devices is tested.
22

National Aeronautics and Space Administration
PROPOSED FOLLOW UPPROPOSED FOLLOW-UP
• Conduct multi-stress tests (electrical/thermal) onConduct multi stress tests (electrical/thermal) on these control and irradiated GaN FETs (Field Effect Transistors).
• Perform overstress tests to determine failure mechanisms
• Evaluate and assess performance of second generation of these devices
• Repeat work on newly-developed GaN and SiC COTS power devices in support of NEPP Program
www.nasa.gov 23

National Aeronautics and Space Administration
ACKNOWLEDGMENTACKNOWLEDGMENT
This collaborative work was performed in support of theThis collaborative work was performed in support of the NASA Electronic Parts and Packaging Program. Guidance and funding provided by the Program’s co-managers Michael Sampson and Kenneth LaBel aremanagers Michael Sampson and Kenneth LaBel are greatly appreciated. Part of this work was done at the NASA Glenn Research Center under GESS-3 Contract # NNC12BA01B.
www.nasa.gov 24