effects on groundwater composition by the koga...
TRANSCRIPT

Independent Project at the Department of Earth Sciences Självständigt arbete vid Institutionen för geovetenskaper
2016: 4
Effects on Groundwater Composition by the Koga Irrigation Scheme Påverkan av grundvattnets sammansättning
i Kogadammens konstbevattningsområde
Jeff Viksten
DEPARTMENT OF EARTH SCIENCES
I N S T I T U T I O N E N F Ö R
G E O V E T E N S K A P E R

Independent Project at the Department of Earth Sciences Självständigt arbete vid Institutionen för geovetenskaper
2016: 4
Effects on Groundwater Composition by the Koga Irrigation Scheme
Påverkan av grundvattnets sammansättning i Kogadammens konstbevattningsområde
Jeff Viksten

Copyright © Jeff Viksten Published at Department of Earth Sciences, Uppsala University (www.geo.uu.se), Uppsala, 2016

Sammanfattning Påverkan av grundvattnets sammansättning i Kogadammens konstbevattningsområde Jeff Viksten Tillgång till rent dricksvatten är en av de viktigaste resurserna för samhället såväl som varje enskild människa. Utan tillgång till rent dricksvatten kan hälsa och livs-kvalitet komma att påverkas av vattenburna patogener.
I torra länder som Etiopien med periodisk torka har man gjort insatser för att hushålla med vattnet utöver regnperioderna. Ett exempel på detta är Kogadammen i Merawi, där en fördämning har konstruerats för att förse ett område med konst-bevattning. Genom bevattning ett område ändrar man de hydrologiska förhållanden som råder vilket gör att grundvattnets sammansättning kan komma att ändras.
Denna rapport syftar till att försöka samla in data som stödjer teorin att konst-bevattningen i området påverkar grundvattnets sammansättning. Prover av grund-vatten och ytvatten samlades och jämfördes för att se om några slutsatser kunde dras. Också allmänna dricksvatten parametrar ingick såsom förekomsten av bio-logiska patogener. Antalet prover som tagits är ensamt inte tillräckligt för att dra slutsatser, men när de kombineras med data från tidigare fältarbete i området och litteraturstudier stödjer de antagandet om att konstbevattningen i området påverkar grundvattensammansättningen. Nyckelord: Etiopien, Kogadammen, patogen, konstgjord bevattning, grundvatten Självständigt arbete i geovetenskap, 1GV029, 15 hp, 2016 Handledare: Jean-Marc Mayotte Institutionen för geovetenskaper, Uppsala universitet, Villavägen 16, 752 36 Uppsala (www.geo.uu.se) Hela publikationen finns tillgänglig på www.diva-portal.org

Abstract Effects on Groundwater Composition by the Koga Irrigation Scheme Jeff Viksten Access to clean drinking water is one of the most important resources for any society and its citizens. Without access to clean drinking water, health and living quality will be affected when pathogens will make people ill.
In arid countries such as Ethiopia with seasonal drought, efforts to manage the water resources to last longer can be made by constructing dams and artificial irrigation systems. One example of this is the Koga dam in the Merawi region where a dam has been constructed to provide water for artificial irrigation. By irrigating an area one changes the hydrological conditions which might change the chemical composition of groundwater.
This report aims to try and collect data that support the theory of the hydrological conductivity between irrigation water and groundwater in the area. Samples of groundwater and surface water was collected and compared to see if any conclu-sions supporting this theory could be made. Also general drinking water parameters were included such as presence of biological pathogens. The number of samples collected is on its own not enough to draw conclusions from but when combined with previous field work in the area and studying literature it supports the assumption of irrigation affecting the groundwater composition. Key words: Ethiopia, Koga reservoir, pathogens, artificial irrigation, groundwater Independent Project in Earth Science, 1GV029, 15 credits, 2016 Supervisor: Jean-Marc Mayotte Department of Earth Sciences, Uppsala University, Villavägen 16, SE-752 36 Uppsala (www.geo.uu.se) The whole document is available at www.diva-portal.org

Table of Contents Aim of study .......................................................................................................................... 1 Introduction ........................................................................................................................... 1
Geography ......................................................................................................................... 1 Geology ............................................................................................................................. 2 The Koga irrigation scheme ............................................................................................... 2
Theory ................................................................................................................................... 3 Groundwater ......................................................................................................................... 4 Method .................................................................................................................................. 5
Fieldwork ........................................................................................................................... 6 Sampling ............................................................................................................................ 7
Field testing parameters ................................................................................................. 7 Lab work ............................................................................................................................ 7
Chemical composition .................................................................................................... 7 Biological Parameters .................................................................................................... 8
Results .................................................................................................................................. 8 Groundwater level .............................................................................................................. 8 Chemical Composition ....................................................................................................... 9 Temperature .....................................................................................................................11 Conductivity & TDS ...........................................................................................................11 Physical parameters. ........................................................................................................11
Temperature ..................................................................................................................11 TDS ...............................................................................................................................12 E.coli and other coliforms ..............................................................................................12 Conductivity ...................................................................................................................12 Chloride .........................................................................................................................12 Fluoride .........................................................................................................................12 pH .................................................................................................................................13 Potassium .....................................................................................................................13 Magnesium ....................................................................................................................13 Calcium .........................................................................................................................13
Biological testing ...............................................................................................................13 Discussion ............................................................................................................................14 Conclusion ...........................................................................................................................15
Acknowledgments .............................................................................................................15 References ...........................................................................................................................16

1
Aim of study The main purpose of this study is to try to determine the possible difference in chemical composition of groundwater from inside and outside the area of artificial irrigation provided by the Koga dam in the Amhara region. It has been suggested in previous reports that the irrigation of land might increase the conductivity of surface and groundwater (Horgby & Larsson, 2013). The secondary purpose of this study is compare these results to WHO water quality standards, also adding biological parameters such as presence of E.coli bacteria.
Introduction Access to clean drinking water is one of the most important resources to any society. If drinking water of good quality cannot be provided people will suffer from illness both long and short term and it might drastically decrease living quality. Diseases can be caused by waterborne pathogens such as E.coli and cholera, and by longtime exposure to higher than recommended levels of elements as fluoride (skeletal fluorosis) (WHO, 2001c) or arsenic (arsenicosis) (WHO, 2001a). It is estimated that diarrhea causes 2.2 million deaths per year. Most of these deaths are children in developing countries where sanitation is low or non-existing and correct treatment and medicine unavailable (WHO, 2001b).
Groundwater is a source for drinking water when clean surface water is not available or in dry or arid areas. Wells have been dug by man for thousands of years to find this vital resource. The layers of soil that surface water has to percolate down through to replenish the groundwater acts as a natural filtration for cleaning surface water from pathogens and pollutants by biological and chemical processes occurring when the water travels through layers of soil. In the quest for a better living standard for its growing population the Ethiopian government in 2011 constructed an irrigation scheme in the Merawi region in northern Ethiopia. It supplies the area with an all year access of irrigation water thus being able to increase the harvest from agriculture. Previously only one harvest following the rain-season was possible but with an all year supply of water for irrigation two or three harvest per year is possible depending on the type of crop.
But by doing so have the groundwater table been raised with a following consequence for the quality of the groundwater. It is possible that the raised water table puts soils previously in the vadose zone now in the saturated zone (Figure 3) with an increased level of elements as a consequence. Also the time and distance it takes for surface water to percolate down might have been shortened resulting in less natural filtration of groundwater before it recharges the groundwater. In other words has one problem possibly been replaced with another. Background Geography Ethiopia is a country located in East Africa. It has no coast and neighboring countries are Eritrea, Somalia Djibouti and Kenya (Figure 1). It is one of two African countries never been colonized. The landscape is dramatic with a mix of high level plateaus and high mountains. The East African rift valley runs through the country from north-East close to Djibouti to around Addis Abeba and then continuing down through Kenya and Tanzania. It has a surface of 1,127,000 km2 and its major land use is

2
Agriculture which employs close to 80% of its population of 96million people (British Geological Survey, 2001). Found in Ethiopia are some of the most spectacular geological occurrences on the planet. Two of these are Semien mountains in the northern part of the country peaking at 4,550 meters above the sea and the Danakil depression with its active volcanoes and salt lakes situated about 130 meters below sea-level.
Geology The bedrock in Ethiopia is a mix of crystalline basement rocks, volcanic rocks and sedimentary rock. The highlands around the rift valley is of volcanic origin and in the south part of the rift mostly of acidic origin compared to north where an iron and manganese basaltic rock type is dominant as in the case of the Koga area, the volcanic rocks are often mixed into the sedimentary rock (British Geological Survey, 2001).
The Koga irrigation scheme The irrigation scheme is located about 35km south of Lake Tana and the City Bahir Dar and a few kilometers South of the town Merawi. The dam is constructed as an earth fill dam in the Koga river. The dam distributes water to the three different command areas by a main channel that is lined with concrete to prevent erosion and percolation. The red fine grained soil in the region is prone to erosion by winds and especially the forces of flowing water. Along the main channel secondary channels also lined with concrete carries water from the main channel out to the command areas. After the secondary channels smaller unlined tertiary channels or carries water out to the individual fields (Figure 3). Along the main channel reservoirs for night storage of water are located and these are connected to the main channel by smaller concrete channels.
3
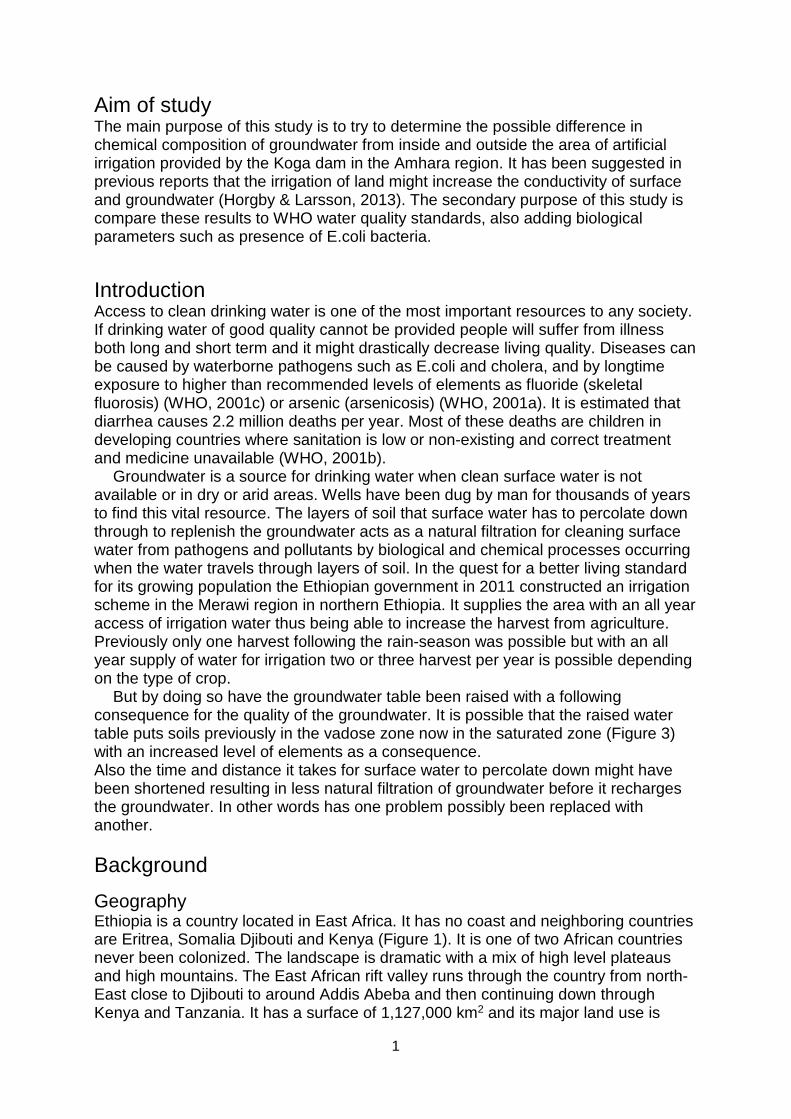
Figure 1. Map over Ethiopia showing neighboring countries and its position on the horn of Africa. The red arrow marks the location of the city of Bahir Dar close the the Koga irrigation project.
Theory Previous work conducted by students from the geological institution of Uppsala University suggests the possible change of groundwater composition inside the command area. This due to the effects of groundwater levels rising as a consequence of the irrigation scheme (Horgby & Larsson, 2013). It is possible that the groundwater quality might change when the ground water table rises. This because the artificial irrigation causes a continuous percolation of surface waters all year round and not as previously, only during the rainy season. This raises the ground water table putting soil previously in the unsaturated zone beneath the water table. The raised water table shortens the distance and time it takes for surface water to percolate down through the soil to replenish the groundwater, affecting the natural purifying processes taking place.
The water used for irrigation in the different command areas are exposed to both artificial fertilizer and manure from the animals grazing in the area (Figure 2) before it starts to percolate. The location of latrines in the area might also be a factor for possible feces contamination in the groundwater. Part of the surface water will also
4
be lost to the evapo-transpiration (Figure 3) and therefore the concentration of elements should increase when the water percolates down to the groundwater. It is likely that the concentration of conservative ions will be lower from the water samples from inside the command area compared to the samples taken from outside the command area. This might be a indicator that the irrigation scheme, constructed to increase the availability of water for crops has a negative impact on the quality of the groundwater used for drinking water.
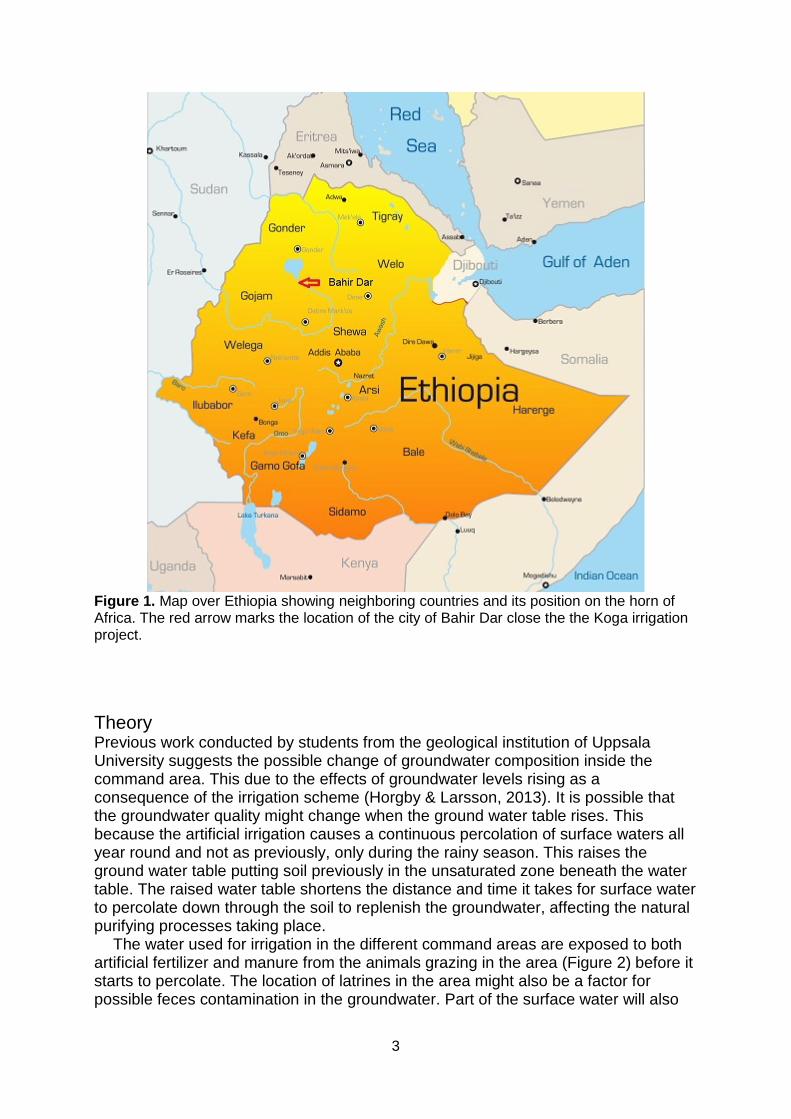
Figure 2. Left, this picture shows a young boy herding cattle along one of the tertiary channels with the animals drinking, walking and defecating in the irrigation water. Right, the erosion of water in the predominant red clay soil in the area can be dramatic as in this ditch when rushing water during the rainy season cuts deep into the land.
Groundwater The chemical composition of a ground-water sample can be viewed as a record of all the different processes that the water undergoes when percolating down to the groundwater, first as rain to the surface (precipitation). And after that when the water infiltrates the soil and percolates down through the layers of soil or bedrock before replenishing the aquifer see (Figure 3). The time it takes for these processes to take place can be from days to thousands of years depending on the composition of the soil (Plummer, 2003). The composition of elements in groundwater are mainly made up of only seven solutes, these are calcium (Ca), Chloride (Cl), bicarbonate (HCO3), potassium (K), Magnesium (Mg), sodium (Na), and sulfate (SO4). The other five remaining percent are shared by all other solutes and referred to as trace elements.
5
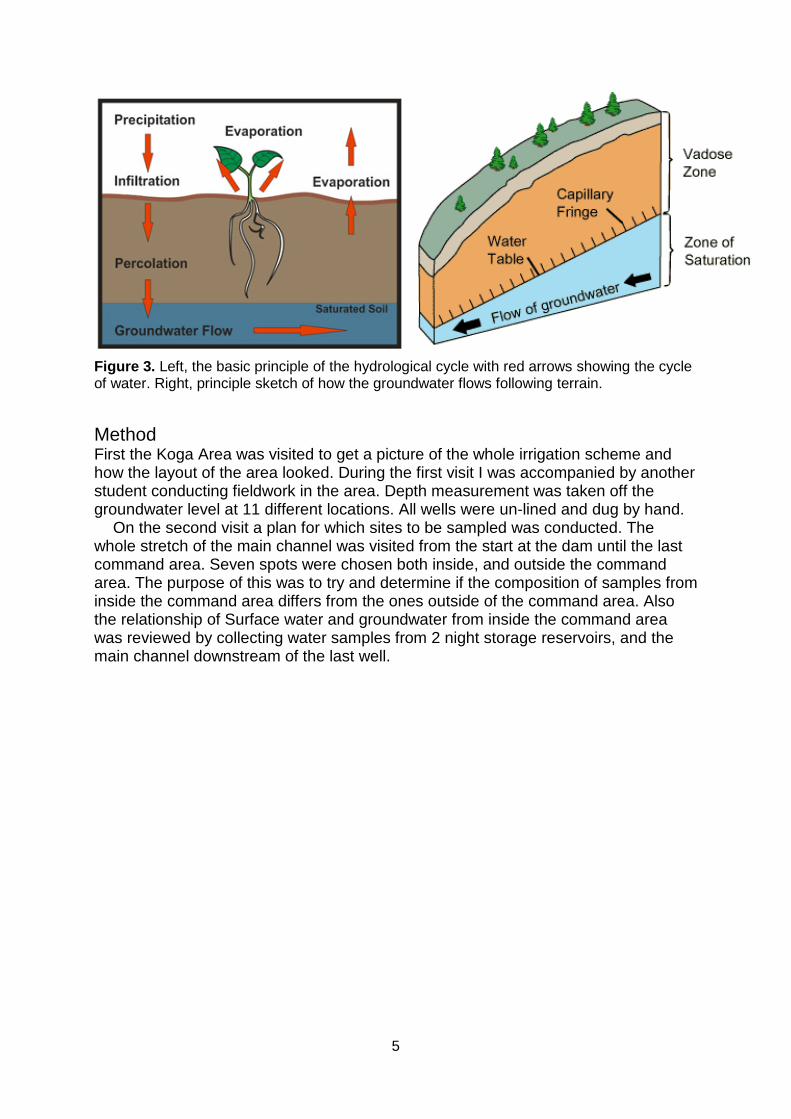
Figure 3. Left, the basic principle of the hydrological cycle with red arrows showing the cycle of water. Right, principle sketch of how the groundwater flows following terrain.
Method First the Koga Area was visited to get a picture of the whole irrigation scheme and how the layout of the area looked. During the first visit I was accompanied by another student conducting fieldwork in the area. Depth measurement was taken off the groundwater level at 11 different locations. All wells were un-lined and dug by hand.
On the second visit a plan for which sites to be sampled was conducted. The whole stretch of the main channel was visited from the start at the dam until the last command area. Seven spots were chosen both inside, and outside the command area. The purpose of this was to try and determine if the composition of samples from inside the command area differs from the ones outside of the command area. Also the relationship of Surface water and groundwater from inside the command area was reviewed by collecting water samples from 2 night storage reservoirs, and the main channel downstream of the last well.
6
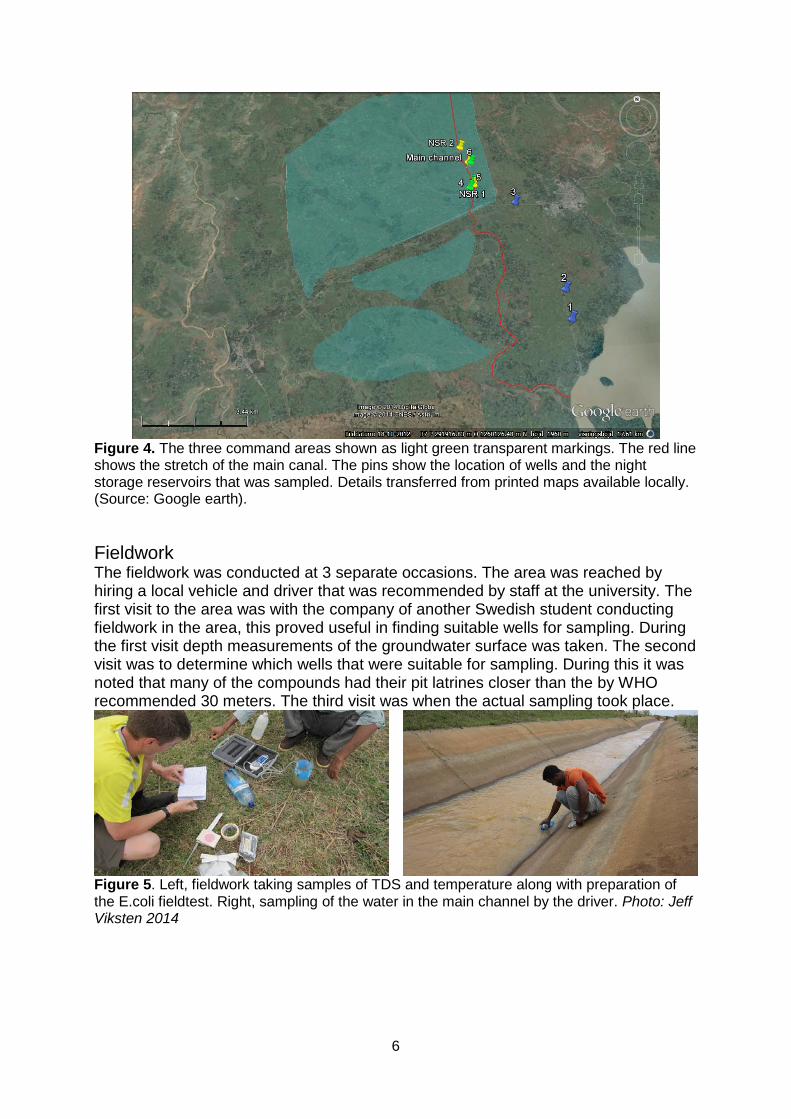
Figure 4. The three command areas shown as light green transparent markings. The red line shows the stretch of the main canal. The pins show the location of wells and the night storage reservoirs that was sampled. Details transferred from printed maps available locally. (Source: Google earth).
Fieldwork The fieldwork was conducted at 3 separate occasions. The area was reached by hiring a local vehicle and driver that was recommended by staff at the university. The first visit to the area was with the company of another Swedish student conducting fieldwork in the area, this proved useful in finding suitable wells for sampling. During the first visit depth measurements of the groundwater surface was taken. The second visit was to determine which wells that were suitable for sampling. During this it was noted that many of the compounds had their pit latrines closer than the by WHO recommended 30 meters. The third visit was when the actual sampling took place.
Figure 5. Left, fieldwork taking samples of TDS and temperature along with preparation of the E.coli fieldtest. Right, sampling of the water in the main channel by the driver. Photo: Jeff Viksten 2014
7
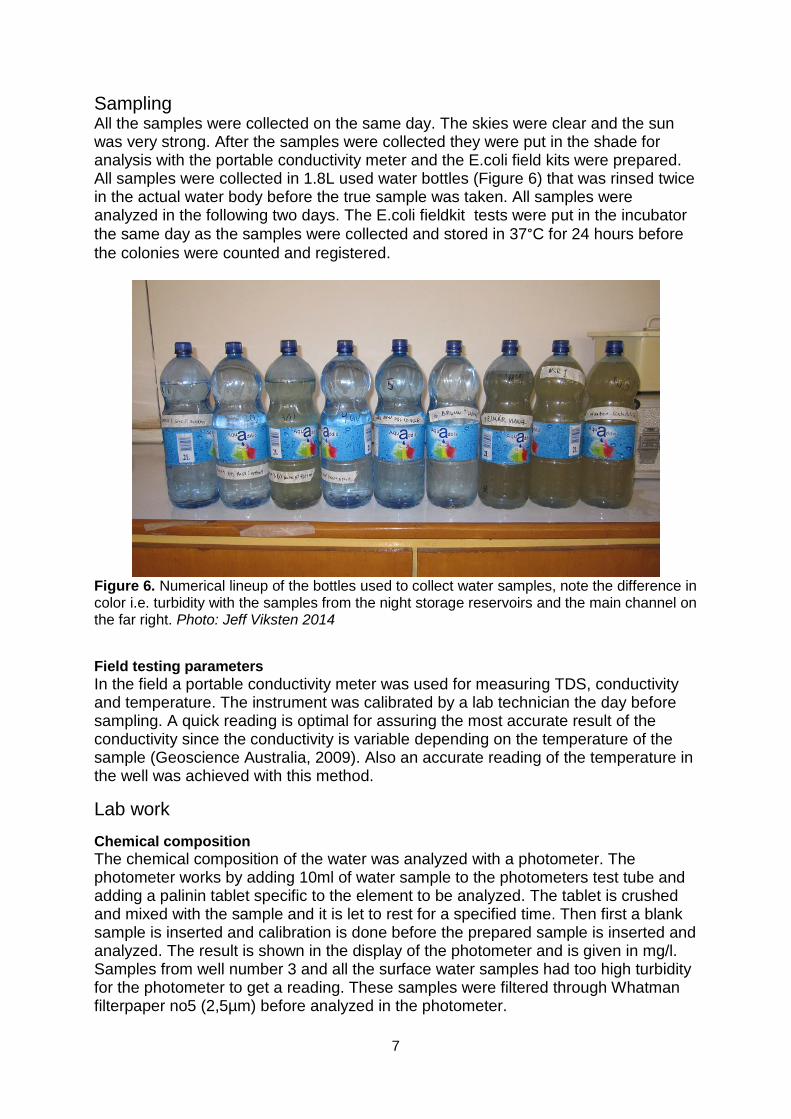
Sampling All the samples were collected on the same day. The skies were clear and the sun was very strong. After the samples were collected they were put in the shade for analysis with the portable conductivity meter and the E.coli field kits were prepared. All samples were collected in 1.8L used water bottles (Figure 6) that was rinsed twice in the actual water body before the true sample was taken. All samples were analyzed in the following two days. The E.coli fieldkit tests were put in the incubator the same day as the samples were collected and stored in 37°C for 24 hours before the colonies were counted and registered.
Figure 6. Numerical lineup of the bottles used to collect water samples, note the difference in color i.e. turbidity with the samples from the night storage reservoirs and the main channel on the far right. Photo: Jeff Viksten 2014
Field testing parameters In the field a portable conductivity meter was used for measuring TDS, conductivity and temperature. The instrument was calibrated by a lab technician the day before sampling. A quick reading is optimal for assuring the most accurate result of the conductivity since the conductivity is variable depending on the temperature of the sample (Geoscience Australia, 2009). Also an accurate reading of the temperature in the well was achieved with this method.
Lab work Chemical composition The chemical composition of the water was analyzed with a photometer. The photometer works by adding 10ml of water sample to the photometers test tube and adding a palinin tablet specific to the element to be analyzed. The tablet is crushed and mixed with the sample and it is let to rest for a specified time. Then first a blank sample is inserted and calibration is done before the prepared sample is inserted and analyzed. The result is shown in the display of the photometer and is given in mg/l. Samples from well number 3 and all the surface water samples had too high turbidity for the photometer to get a reading. These samples were filtered through Whatman filterpaper no5 (2,5µm) before analyzed in the photometer.
8
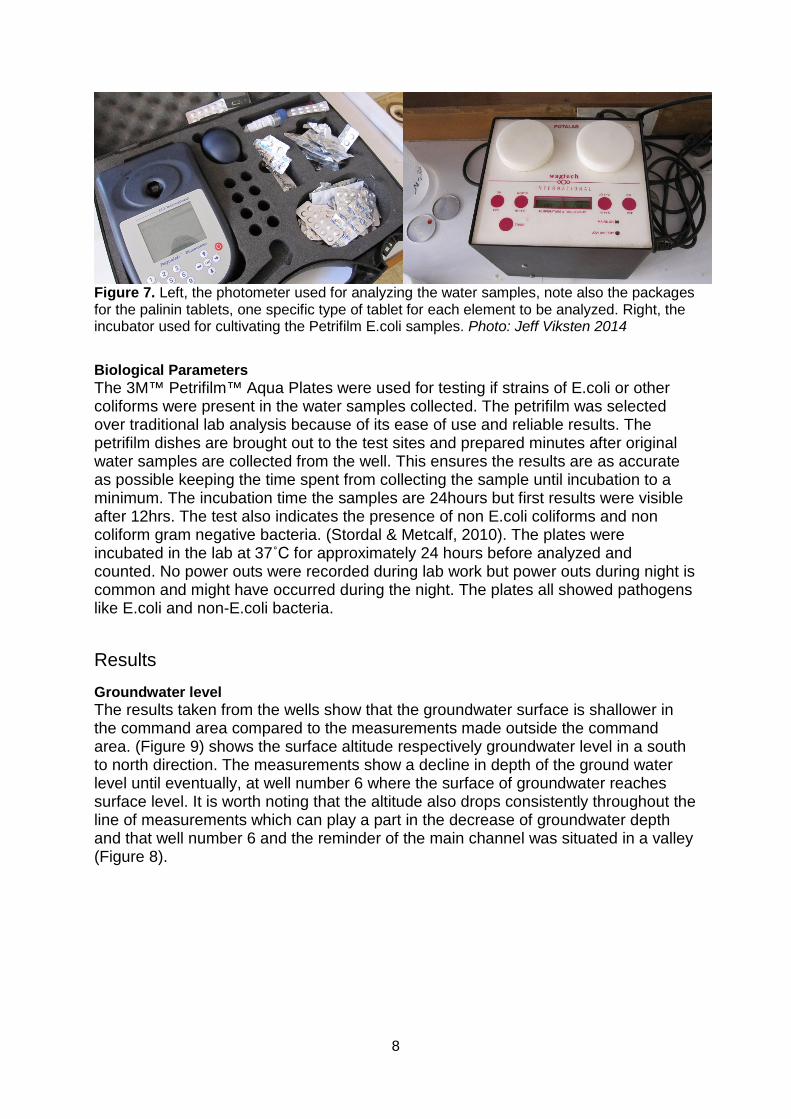
Figure 7. Left, the photometer used for analyzing the water samples, note also the packages for the palinin tablets, one specific type of tablet for each element to be analyzed. Right, the incubator used for cultivating the Petrifilm E.coli samples. Photo: Jeff Viksten 2014
Biological Parameters The 3M™ Petrifilm™ Aqua Plates were used for testing if strains of E.coli or other coliforms were present in the water samples collected. The petrifilm was selected over traditional lab analysis because of its ease of use and reliable results. The petrifilm dishes are brought out to the test sites and prepared minutes after original water samples are collected from the well. This ensures the results are as accurate as possible keeping the time spent from collecting the sample until incubation to a minimum. The incubation time the samples are 24hours but first results were visible after 12hrs. The test also indicates the presence of non E.coli coliforms and non coliform gram negative bacteria. (Stordal & Metcalf, 2010). The plates were incubated in the lab at 37˚C for approximately 24 hours before analyzed and counted. No power outs were recorded during lab work but power outs during night is common and might have occurred during the night. The plates all showed pathogens like E.coli and non-E.coli bacteria.
Results Groundwater level The results taken from the wells show that the groundwater surface is shallower in the command area compared to the measurements made outside the command area. (Figure 9) shows the surface altitude respectively groundwater level in a south to north direction. The measurements show a decline in depth of the ground water level until eventually, at well number 6 where the surface of groundwater reaches surface level. It is worth noting that the altitude also drops consistently throughout the line of measurements which can play a part in the decrease of groundwater depth and that well number 6 and the reminder of the main channel was situated in a valley (Figure 8).

9
Figure 8. Left, map over the area of irrigation scheme, the yellow markers indicates wells that were used for depth measurements. See Figure 7 for the corresponding measurements. Note that this map uses another chronology than the results from the chemical composition, see Figur 1. Right, the valley where well number6 was located and the remaining flow of the main channel.
Figure 9. Diagram shows ground level (asl) and the corresponding groundwater (Gv) level from the wells used for sampling. Note that this map uses another chronology than the results from the chemical composition data. The wells follow an order from south to north .
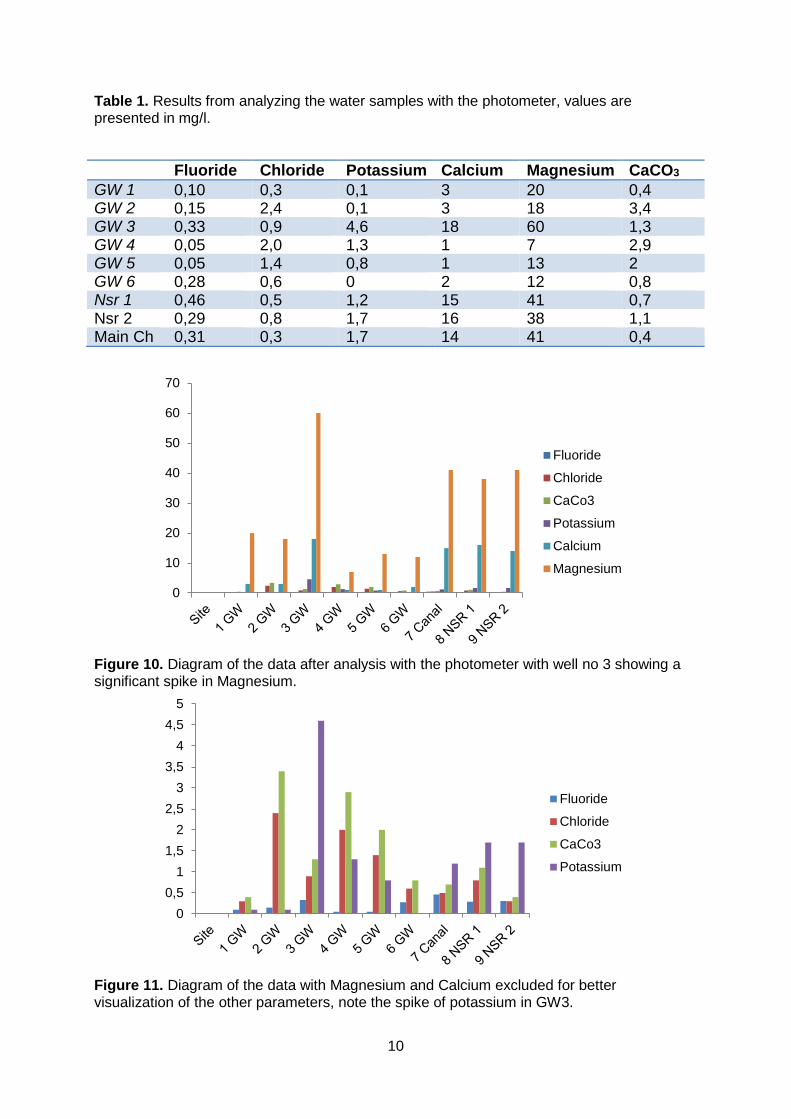
Chemical Composition The data collected from the chemical analysis shows higher values for Calcium and Magnesium in the wells located outside the command area, these elements are weathering products of basaltic rock and clay minerals (Nelson, 2014).
1940
1960
1980
2000
2020
2040
11 10 9 1 7 3 6 5
Met
res
abov
e se
a le
vel
Well number
Surface level
Groundwater level
10
Table 1. Results from analyzing the water samples with the photometer, values are presented in mg/l.
Figure 10. Diagram of the data after analysis with the photometer with well no 3 showing a significant spike in Magnesium.
Figure 11. Diagram of the data with Magnesium and Calcium excluded for better visualization of the other parameters, note the spike of potassium in GW3.
0
10
20
30
40
50
60
70
Fluoride
Chloride
CaCo3
Potassium
Calcium
Magnesium
00,5
11,5
22,5
33,5
44,5
5
Fluoride
Chloride
CaCo3
Potassium
Fluoride Chloride Potassium Calcium Magnesium CaCO3
GW 1 0,10 0,3 0,1 3 20 0,4 GW 2 0,15 2,4 0,1 3 18 3,4 GW 3 0,33 0,9 4,6 18 60 1,3 GW 4 0,05 2,0 1,3 1 7 2,9 GW 5 0,05 1,4 0,8 1 13 2 GW 6 0,28 0,6 0 2 12 0,8 Nsr 1 0,46 0,5 1,2 15 41 0,7 Nsr 2 0,29 0,8 1,7 16 38 1,1 Main Ch 0,31 0,3 1,7 14 41 0,4

11
Temperature
Figure 12. Temperature chart for the different sampling points, the night storage reservoirs note a higher temperature most likely because the water being still and heated by the sun.
Conductivity & TDS The results from the parameters tested in the field shows that conductivity and TDS is generally higher in the wells from outside the scheme. But it also shows that the values of these parameters are highest in the surface water from the NSR and main canal with the exception of well number three outside the command area.
Figure 13. Clearly visible in this diagram are the higher values of elements in well number three following the trend from the element analysis.
Physical parameters. Temperature Cold water is generally considered more fresh and tasty for consumption. With increased temperature follows more solubility of chemicals and elements. Also microbial growth is increased with warmer temperature. Not only the quality but also
15
17
19
21
23
25
27
Temperature ̊C
Temperature ̊C
0
500
1000
1500
2000
2500
TDS (mg/L)
Conductivity(µS/m)

12
the smell and taste of water are negatively affected by higher temperature (WHO, 2011).
TDS Total dissolved solids are the salts dissolved in water together with the dissolved organic material. TDS is compromised largely by calcium, potassium, chlorides, magnesium, potassium, sodium, bicarbonates and sulphates. Depending on the bedrock or soil type TDS can have great variation due to the different elements that’s being weathered. There are no health based guidelines for TDS (WHO, 2011).
E.coli and other coliforms E.coli bacteria occurs naturally in the lover parts of the intestines of warm blood animals and can survive for periods outside the body, that makes it a suitable indicator for fecal contamination of a water source. Generally the temperature in water distributing systems is too low for these bacteria to grow.
Infections by pathogens such as the E.coli bacteria is the most likely disease connected with drinking water, especially in rural areas with poor sanitation or in places where waste is mixed with drinking water. Presence of E.coli or other coliforms is a strong indication of leakage of sewer water to the water source or of dirt or feces falling into the water source if the wells are not covered (WHO, 2011). Other coliforms can occur but does not necessarily originate from fecal contamination nor be dangerous for humans. About 60 to 90% of total coliforms originates from fecal from humans and animals and out of these, 90% are E.coli out of which some strains causes serious illness (CNA Environmental Inc, 2005).
Conductivity Salt are found in all waters, they are chemical compositions of positively charged (cat ions) and negatively charged (anions) when dissolved in water. The conductivity of the water is depending of the amount of dissolved ions and is measured by putting an electrode in the water and measuring the resistance of the water. The value is given in mS/m and is higher when the amount of dissolved salts (ions) in the water is high and low when there is a low concentration of ions. A high level of conductivity is often a sign of intrusion of polluted water or sea water. Measuring conductivity can easily be done in the field with portable equipment and is a good way to determine and compare results needed for water analysis. For the values of specific ions in the water other methods are used (SGU, 2013).
Chloride Chloride found in the drinking water comes from natural sources as the bedrock and from anthropogenic sources as runoff from cities and industry. Another source for high levels of chloride in groundwater is intrusion of sea water. There are no values given by the WHO as for drinking water but over 250 mg/L can give a evident taste in the drinking water (WHO, 2011).
Fluoride Fluoride is a common element in the crust of the earth, it is most know for improving the health of teeth and a suitable amount of fluoride in drinking water for this purpose is between 0.5 to 1mg/l. Fluoride is absorbed by the body and is stored in teeth and bone, it is often added to the drinking water or as pills or mouthwash to improve dental health. However a sustained high level intake of fluoride have a negative impact and lead to skeletal fluorosis with an increased risk of bone fracture. WHO guidelines for Fluoride is set to 1,5mg/l (WHO, 2011).
13
pH pH is a mausurement of how basic or acidic a solution is. pH is not mostly important for the quality of the drinking water but a low ph is corrosive and can in turn cause wear on water distribution pipes and machinery. There is no guidelines for pH by the WHO according to drinking water quality (WHO, 2011).
Potassium Potassium is one of the 10 most common minerals in the earth’s crust and is added to the groundwater by weathering of the bedrock and soil. (Dye, 2013) Lack of potassium can lead to cramps or muscle weakness. Recommended daily intake of potassium is >3000mg and there are no guidelines set for drinking water. (WHO, 2011).
Magnesium Magnesium is found in over 60 minerals and make up for about 2% of the earth’s crust, it is the third most found element in seawater (USGS, 2014). A lack of magnesium for human can affect growth and cause heart problems (Livsmedelsverket, 2013) .
Calcium Calcium is the fifth most common mineral in the crust at 3,4% a high concentration of calcium leads to what is referred to as “hard water” and can cause problems in household piping and appliances (Duesing, 2014). Calcium is essential to humans for the formation of bone and teeth, a lack of calcium can lead to slow growth and prolonged lack of calcium can lead to osteoporosis (porous bones) (Livsmedelsverket, 2012).
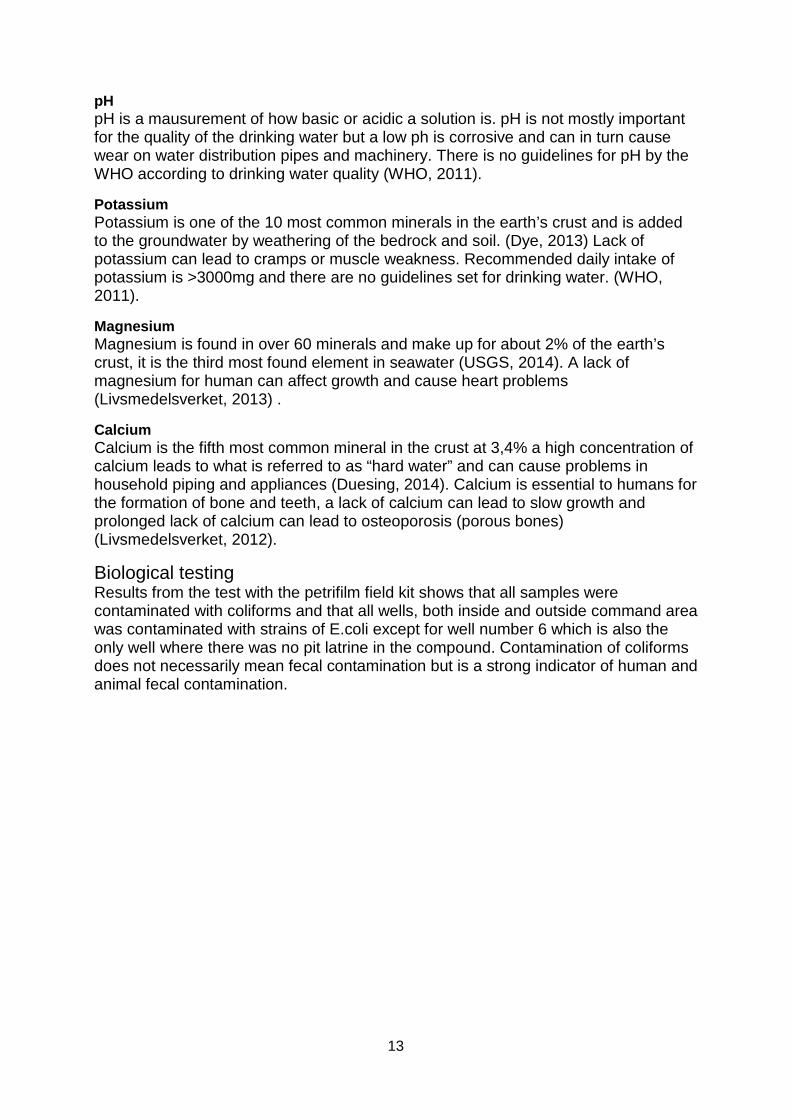
Biological testing Results from the test with the petrifilm field kit shows that all samples were contaminated with coliforms and that all wells, both inside and outside command area was contaminated with strains of E.coli except for well number 6 which is also the only well where there was no pit latrine in the compound. Contamination of coliforms does not necessarily mean fecal contamination but is a strong indicator of human and animal fecal contamination.
14
Figur 14. The results from cultivating the petrifilm fieldtests indicates that all wells except no6 was contaminated with E.coli, the compound where well number 6 was situated was also the only one without a pit latrine.
Discussion The area has an basaltic bedrock and the soil in the area is a rust red clay or silty fine grained vertisol (BGS, 2015). The weathering products of these includes Magnesium (Mg2+) and calcium (Ca2+) that were found in greater concentration in the samples taken outside the command areas. The results from the sampling and the depth measurements support the theory of the irrigation scheme affecting the groundwater level within the command area. The depth measurements show a decrease in the depth of the groundwater surface when comparing wells from outside the command area to the ones inside the command area. This because the added volume of surface water percolating, the chemical composition of the samples shows that the levels of TDS and conductivity generally are higher in wells one to three. These are the sampling points furthest from the areas irrigated suggesting that the water is being replenished in a slower rate allowing more elements to dissolve to the groundwater from the soil and bedrock.
The petrifilm tests also showed that all the groundwater wells are contaminated by coliforms. This is not likely to solely be the cause of the irrigation but rather the fact that compounds had deep pit latrines close to their wells. The wells and latrines were all situated within the compounds with exception for well number six that had no dug latrine and were located in an area of big fields and no surrounding compounds. Well number six was also the only one that did not show any E.coli in the sample analyzed. The depth of the latrines were not known by the owners of the compounds but if the latrines were dug under or close to the level of groundwater this increases the risk of pathogens reaching the groundwater, and subsequently the water retrieved from the wells. This is interesting and leads to the thought that the immediate threat to people’s health in this area regarding groundwater quality does not come from the irrigation scheme but rather from the habit of having pit latrines too close to the wells. The general recommendation from WHO regarding pit latrines is at least 30 meters from wells (WHO, 2015) and this was not achieved in most of the compounds.
0
20
40
60
80
100
120
E.coli
Non E.coli
Non coliforms

15
All wells were unlined and covered only by a bucket or pieces of plastic allowing contaminations to fall into the well from the surface or leaking in from the walls of the well. The link in between pit latrines and the proximity to the source of drinking water is worth looking into for further research. This thesis was conducted as a field study during a short period of time and the sampling and following lab work is the result of one sampling session. To be able to draw any conclusions regarding the possible effect of the Koga irrigation on the groundwater composition and the level of the groundwater, continuous sampling over a long time should be conducted, preferably measurement during a whole hydrological year would give a statistically more reliable result and exclude any possibility of data being a one time, or short time effect. The people living in this area are dependent on their wells for survival as it is their source of drinking water. But these wells, especially the wells heavy contaminated by different coliforms might be making them ill and lowering their health status.
Relocating the wells, and for the future increase the distance between latrines and wells is a way of removing the risk of contracting pathogens when collecting drinking water. Also a question that was discussed with the professors at the Bahir Dar university was that even though the soil type in the area consisted of a rust-red soil with clay-silt sized grains that one would expect not to be very permeable (SGI, 2008). Water in the fields percolates down just within a few hours maybe suggesting a more permeable layer underneath, the rapid percolation of water was also confirmed by one of the guards working in one of the command areas.
Conclusion The results from the fieldwork conducted, strongly indicates that the irrigation has an effect on the levels and composition of groundwater in the command area. The depth of groundwater from the surface can be seen decreasing when comparing results from wells outside and inside the command area. Also the significantly higher values of Calcium and Magnesium, being the weathering product of the soil type in the area suggests that the water outside the command area is not circulated in the same extent as inside the command area.
An earlier report made in the area in 2013 also suggested an increased conductivity between surface water and groundwater (Horgby & Larsson, 2013) This thesis has only nudged the question that I set out to explore, also a big need for research on both hydrological, health and social questions is needed in this area. It is my firm opinion that even basic research and education about the supply of drinking water could lead to drastic improvements in terms of health and living quality for the people in this area.
Acknowledgments I would like to thank my supervisor Jean-Marc Mayotte for always being positive and supportive during this work. Erik Rosenberg deserves recognition for introducing me to the MFS program and guidance through the application process. I also want to thank Elin Friberg for introducing me to the city of Bahir Dar and for pleasant company during the first weeks of my stay.
I would also want to thank Dr. Essayas Kaba and the staff at Bahir Dar University for supporting me during my stay. A special thank you and thought to my friend Temesgen for helping me and keeping me safe during fieldwork, introducing me to his family and showing me Bahir Dar.
16
References British Geological Survey (2001). Groundwater Quality: Ethiopia. Wateraid, information
sheet. Great Britain: BGS. Dye, J. L. (2014). Potassium, properties, occurrence, and uses. In: Encyclopedia Britannica.
http://www.britannica.com/EBchecked/topic/472373/potassium-K Geological Survey of Sweden (2013). Bedömningsgrunder för grundvatten. Uppsala: SGU. Horgby, Å., & Larsson, K. (2013). Effects on Drinking Water Quality. Independant Project in
Earth Science, Uppsala: Department of Earth Sciences Larsson,R. (2008). Jords egenskaper. Linköping: Statens geotekniska institut.
http://www.swedgeo.se/upload/Publikationer/Info/pdf/SGI-I1.pdf Plummer, N. (2003). How ground-water chemistry helps us understand the aquifer. U.S.
Geological Survey Circular 1222. Denver: USGS. Stordal, L. & Metcalf, R. H. A. (2010). Practical method for rapid assesment of the
bacteriological quality of water, a field based guide. United Nations Human Settlement Programme. Nairobi, UNON, Publishing Services Section.
Sundaram, B., Feitz, A., Caritat, P. de, Plazinska, A., Brodie, R., Coram, J. and Ransley, T., 2009. Groundwater Sampling and Analysis – A Field Guide. Geoscience Australia, Record 2009/27
WHO (2011). Guidelines for Drinking-water Quality 4th edition. Gutenberg: WHO. http://whqlibdoc.who.int/publications/2011/9789241548151_eng.pdf
WHO (2015). Water Sanitation Health. Fact sheet 3.4: Simple pit latrines. Available from: http://www.who.int/water_sanitation_health/hygiene/emergencies/envsanfactsheets/en/index2.html
Internet sources Duesing, B. (2014). The Calcium Cycle. Retrieved 05 11, 2014, from Yale-New Haven
Teachers Institute: http://www.yale.edu/ynhti/curriculum/units/1985/7/85.07.08.x.html Livsmedelsverket (2012). Salt & Mineraler. Kalcium. Retrieved 05 11, 2014, from
http://www.livsmedelsverket.se/livsmedel-och-innehall/naringsamne/salt-och-mineraler1/kalcium/
Livsmedelsverket (2013). Salt & Mineraler. Magnesium. Retrieved 05 11, 2014, from http://www.livsmedelsverket.se/livsmedel-och-innehall/naringsamne/salt-och-mineraler1/magnesium/
Nelson, S. A. (2014). Weathering and clay minerals. Retrieved 06 02, 2015, from http://www.tulane.edu/~sanelson/eens211/weathering&clayminerals.htm
United States Geological Survey. (2014). Magnesium Statistics and Information. Retrieved 05 11, 2014, from http://minerals.usgs.gov/minerals/pubs/commodity/magnesium/
WHO (2001a). Water-related diseases: Arsenicosis. Retrieved 05 11, 2014, from: http://www.who.int/water_sanitation_health/diseases/arsenicosis/en/
WHO (2001b). Water-related diseases: Diarrhoea. Retrieved 05 11, 2014, from Water-related diseases: http://www.who.int/water_sanitation_health/diseases/diarrhoea/en/
WHO (2001c). Water-related diseases: Skeletal flourosis. Retrieved 05 11, 2014, from Water Sanitation Health: http://www.who.int/water_sanitation_health/diseases/fluorosis/en/

