efficiency analysis of rspo oil palm farms in...
TRANSCRIPT

EFFICIENCY ANALYSIS OF RSPO OIL PALM FARMS
IN THAILAND
BY
ANUAPRP SAENGSATHIEN
A THESIS SUBMITTED IN PARTIAL FULFILLMENT OF
THE REQUIREMENTS FOR THE DEGREE OF MASTER OF
ENGINEERING (LOGISTICS AND SUPPLY CHAIN SYSTEMS
ENGINEERING)
SIRINDHORN INTERNATIONAL INSTITUTE OF TECHNOLOGY
THAMMASAT UNIVERSITY
ACADEMIC YEAR 2015

EFFICIENCY ANALYSIS OF RSPO OIL PALM FARMS
IN THAILAND
BY
ANUPARP SAENGSATHIEN
A THESIS SUBMITTED IN PARTIAL FULFILLMENT OF
THE REQUIREMENTS FOR THE DEGREE OF MASTER OF
ENGINEERING (LOGISTICS AND SUPPLY CHAIN SYSTEMS
ENGINEERING)
SIRINDHORN INTERNATIONAL INSTITUTE OF TECHNOLOGY
THAMMASAT UNIVERSITY
ACADEMIC YEAR 2015


ii
Acknowledgements
I would like to express my grateful thank to my advisor Asst. Prof. Dr.
Morrakot Raweewan, Ph.D. for SIIT faculty quota scholarship to financial support
study master degree, kind help, available time and worthful comments. I wish to
extend my thanks to all RSPO members of community enterprise group Suratthani,
Ms. Chulita Somkaew (RSPO Co‐operator/Group Manager) and Southern Palm Oil
Industry (1993) Company Limited for supporting acquisition of data.
Beside my advisor, I would like to convey special thanks the rest of my thesis
committee: Assoc. Prof. Dr. Somrote Komolavanij and Assoc. Prof. Dr. Jirachai
Buddhakulsomsiri, for their support, perceptive comments, and questions.
I am enormously grateful to Mr. Chutchai Suksa-ard, PhD student for useful
recommendation and prehensile comments.
Last, I would like to thank my family for supporting me to study master
degree.

iii
Abstract
EFFICIENCY ANALYSIS OF RSPO OIL PALM FARMS IN THAILAND
by
ANUPARP SAENGSATHIEN
B.Sc. (Management Technology) Sirindhorn International Institute of Technology,
Thammasat University, 2011
M.Eng. (Logistics and Supply Chain Systems Engineering) Sirindhorn International
Institute of Technology, Thammasat University, 2015
According to Roundtable on Sustainable Palm Oil (RSPO), Thailand is
the first oil palm producer in the world to achieve independent smallholders RSPO-
certified under the RSPO Group Certification in 2012. The purpose of this study was
to measure technical efficiency, cost efficiency, allocative efficiency and to identify
factors affecting cost efficiency in RSPO oil palm plantation in Thailand. The RSPO
record book from 2014 was analyzed using data envelopment analysis method in
value-based cost efficiency model of Tone (2002). The estimated technical efficiency,
cost efficiency and allocative efficiency of RSPO oil palm farms were found to be
86.04, 55.08, and 63.40 percent, respectively. The result of ordinary least square
regression revealed that the important factors showing positive relationship on cost
efficiency are applied empty fresh fruit bunch on the ground of oil palm farm and
payment for water supply such as artesian well.
Keywords: Roundtable on Sustainable Palm Oil (RSPO), Data Envelopment
Analysis, Ordinary Least Square Regression

iv
Table of Contents
Chapter Title Page
Signature Page i
Acknowledgements ii
Abstract iii
Table of Contents iv
List of Tables vii
1 Introduction 1
1.1 Overview of oil palm farm in Thailand 1
1.2 RSPO oil palm farm in Thailand 3
1.3 Objectives 4
1.4 Overview of thesis 4
2 Literature Review 5
2.1 Definition of efficiency 5
2.1.1 Technical efficiency 5
2.1.2 Allocative efficiency or Price efficiency 5
2.1.3 Cost efficiency or Economic efficiency 6
2.2 Previous study in agriculture efficiency measurement
and the others fields 6
2.3 Data envelopment analysis 8
2.3.1 The advantage of data envelopment analysis 8
2.3.2 The limitations of data envelopment analysis 9
2.4 Ordinary regression analysis 10
2.5 Principles of RSPO certification 10

v
Table of Contents
Chapter Title Page
3 Methodology 12
3.1 Data sources 12
3.2 Data analysis 13
3.2.1 Measuring value-based technical, value-based cost efficiency
and value-based allocative efficiency using data envelopment
analysis 13
3.2.2 Regression analysis 16
4 Results and discussion 19
4.1 Descriptive analysis of data 19
4.2 Result of value-based efficiency model of Tone (2002) 20
4.3 Number of DMUs appear in reference set in the basis of
benchmarking cost efficiency 22
4.4 Descriptive analysis of data used for regression model 23
4.5 Result of ordinary least square regression analysis 24
5 Conclusions and recommendations 26
5.1 Conclusion 26
5.2 Recommendation for further study 27
References 28

vi
Table of Contents
Chapter Title Page
Appendices 31
Appendix A 32
Appendix B 36
Appendix C 39
Appendix D 42
Appendix E 45
Appendix F 48
Appendix G 51

vii
List of Tables
Tables Page
1.1 The oil palm plantation cost in Thailand, 2002-2015 2
3.1 Variable definitions and measurement for technical, cost efficiency
and allocative efficiency 12
3.2 Type of explanatory variables and expected signs of coefficients 18
4.1 Descriptive statistics of output and input variables 20
4.2 Summary statistic for value-based technical, value-based cost efficiency
and value-based allocative efficiency score for all RSPO oil palm farms 21
4.3 Frequency distribution of value-based technical efficiency,
value-based cost efficiency and value-based allocative efficiency for
RSPO oil palm farms 22
4.4 Highest ranking of DMUs on the basis of cost efficiency 23
4.5 Descriptive statistics of explanatory variables 24
4.6 Result of ordinary least square regression analysis 25

1
Chapter 1
Introduction
1.1 Overview of oil palm farm in Thailand
Palm oil is vegetable oil traded worldwide. In terms of production and
consumption, palm oil is the world’s leading vegetable oil. Global consumption of
palm oil was 52.1 million tons in 2012. In Thailand, production of oil palm can satisfy
all of domestic demand in various fields. Most of producers in Thailand is
agriculturists and small entrepreneurs that lead to higher oil palm production cost than
the big producers such as Malaysia and Indonesia. Palm oil demand is highly
increasing in the global market. Oil palm is used as raw material in thousand products
currently on the market. The suitable area for oil palm plantations are located at
latitude 10 north - south of the equator or up to latitude 20 north - south of the
equator. This makes ASEAN countries, especially Malaysia and Indonesia to become
the world's main producers of palm oil. Thailand locates in one of the suitable areas
for oil palm plantations. This plantation area in Thailand has been increasing
constantly with an average annual growth rate of 11% from 1981 to 2000 and 9%
from 2001 to 2010 (Dallinger, 2011). However, the rapid expansion of oil palm
plantation worldwide is due to high demand of oil palm that could lead to
deforestation, environmental problem and biodiversity. However, no report is found
on the negative effect of oil palm plantation expansion in Thailand (Wangrakdiskul &
Yodpijit, 2013). Malaysia and Indonesia are the world's main oil palm producers that
are continually expanding their plantation areas. Following the increase in oil palm
plantation area, some forests were changed into oil palm farms (Fitzherbert et al.,
2008). The United Nations Environment Program (UNEP) then declared oil as the
main driver of deforestation in both countries.
Thailand is the third largest palm oil producer in the world. The plantation of
oil palm in Thailand was 95% from smallholder farmers produce and only 5% of
plantation owned by crushing mill and private company (Department of International
Trade 2013). Three main cultivation areas in Thailand are Chumporn, Krabi and
Suratthani. The production performance in Thai oil palm is still lower than

2
competitors. OER (Oil Extraction Rate) of Thailand oil palm industry is about 15.7%
but 20.2% for Indonesia and 19.3% for Malaysia. This is because of the lack of skill
labors in harvesting mature fresh fruit bunch. The ratio of yield of fresh fruit bunch to
plantation area is 14.5 ton/hectare. This is still low because most of the plantation is in
low scale area (Kasikorn Research Center).
In the past twenty years, OER in Thailand has been showing a declining trend
(Dallinger, 2011). From 1990 to 1994, the average OER was 18 percent. From 2005
to 2009, the average OER was 16.6 percent which represents the decreasing in OER
of about 2 percent. OER in palm oil milling operation depends on various factors such
as the delivery of fresh fruit bunch from oil palm farm to palm oil mill organized by
intermediaries. There, intermediaries collect and combine the harvest of many
smallholders to send into bigger truck loads. Normally, intermediaries do malpractice
such as watering down the fresh fruit bunch or adding sand or soil to increase the
weight of fresh fruit bunch which leads to deterioration of fresh fruit bunch quality. If
the quality of processed fresh fruit bunch is low, the oil extraction rate in palm oil mill
will be of low quality.
Table 1.1: The oil palm plantation cost in Thailand, 2002-2015
Year
Variable Cost Fixed Cost Total Cost
(Baht/Rai) (Baht/Rai) (Baht/Rai) (Baht/Ton) (Baht/Kg)
2002 2580.91 700.23 3,281.14 1350 1.35
2003 2759.43 696.88 3,456.31 1270 1.27
2004 2676.8 700.23 3,377.03 1260 1.26
2005 3,438.88 700.23 4,139.11 1680 1.68
2006 3,626.41 700.23 4,326.64 1530 1.53
2007 3,703.90 700.41 4,404.31 1840 1.84
2008 5,899.87 947.83 6,847.70 2130 2.13
2009 5,996.52 947.65 6,944.17 2712.57 2.71
2010 5,730.61 1,135.47 6,866.08 2970 2.97
2011 6,736.10 1,244.31 7,980.41 2770 2.77
2012 7,302.82 1,399.25 8,702.07 2850 2.85

3
Year
Variable Cost Fixed Cost Total Cost
(Baht/Rai) (Baht/Rai) (Baht/Rai) (Baht/Ton) (Baht/Kg)
2013 7,228.83 1,459.64 8,688.47 2640 2.64
2014 7,237.36 1,690.80 8,928.16 2840 2.84
2015 7,098.90 1,853.06 8,951.96 3130 3.13
Source: Office of Agricultural Economics, 2015
As illustrates in the Table 1.1, oil palm plantation cost in Thailand tends to increase.
Cost structure of oil palm plantation can be classified into two categories of fix costs
and variable costs (Nillaket & Wattanakul , 2014). Fix costs include land rental cost,
land tax, mechanic and tool depreciation. Variable costs include hired labor cost,
harvesting cost, chemical and natural fertilizer cost, pesticide cost, herbicide cost,
transportation fuel, mechanic and tool maintenance cost, oil palm seedling and
maintenance oil fuel. Smallholder farmers and entrepreneurs in the oil palm business
need to improve oil palm productivity. Since the growers, mills and refineries purified
by focusing on cost reduction and increasing of the production yield. To keep prices
competitive with imported palm oil, oil palm growers should focus on improving
crops to achieve a higher crop yield per area. This can be done by selecting the proper
cultivation terrain and appropriate climate including selective seedling. In order to
cultivate a high rate of oil extraction, one needs to study the period of apply and type
of fertilizer in each age group of palm trees, to prune oil palm frond as well as to plan
oil palm plantations as a replacement of older trees that give lower yield.
1.2 RSPO oil palm farm in Thailand
Using credible global standards and engagement of stakeholders, the Roundtable on
Sustainable Palm Oil (RSPO) has been formed to promote the growth and use of
sustainable oil palm products since 2004. In order to create the norm on sustainable
oil palm, RSPO targets transformation of the markets. Community enterprise group
for sustainable palm oil production (Chonburi), community enterprise group
Suratthani, the sustainable oil palm smallholders’ production (Univanich Plaipraya)
and UPOIC Nuakhlong-Khaopanom are the very first groups of independent
smallholders to achieve RSPO Certification (Wangrakdiskul & Yodpijit, 2013). These

4
four groups participated in "Sustainable Palm Oil Production" project which took
three and a half years from January 2009 to June 2012. This project aimed to
implement the principles of RSPO certification and requirements to smallholder oil
palm farmers in Thailand which was supported by German Academy for International
Cooperation (GIZ). By implementing the RSPO standard, the oil palm smallholder
farmers have experienced an increase in fresh fruit bunch production.
1.3 Objective
This research study measured the technical efficiency, cost efficiency and allocative
efficiency as well as investigated factors affecting cost efficiency of RSPO oil palm
farmers in Thailand. The objectives of this study were
1. To estimate the best practice or production frontier of oil palm farm using
data envelopment analysis technique.
2. To apply suitable data envelopment analysis technique to problem under
study
3. To review previous researches on the application of data envelopment
analysis technique in different fields
4. To investigate factors affecting cost efficiency
1.4 Overview of thesis
There are five chapters in this thesis, which are as follows:
Chapter 1 is the introduction part which includes an outline of oil palm farm in
Thailand and RSPO oil palm farm in Thailand, objective and overview of the thesis.
Chapter 2 is the literature review part. It consists of the discussions about the
past researches done on the efficiency measurement in agricultural field.
Chapter 3 is the methodology part. In this part, the DEA mathematical model
and regression analysis model are presented.
Chapter 4 is the result and discussion part. Results are presented and
discussed.
Chapter 5 is the conclusion and recommendation for further study.

5
Chapter 2
Literature Review
2.1 Definition of efficiency
The ratio of output to input was simply defined as efficiency. Data
envelopment analysis (DEA) is non-parametric approach to indicate relative
efficiency of a set of decision making units (Atici & Podinovski). When the concept
of efficiency measurement study was applied in DEA method, three different
efficiency measures can be determined namely the technical efficiency, allocative
efficiency and economic efficiency. These can be described as follow (Farrell, 1957;
Phitthayaphinant & Somboonsuk, 2013):
2.1.1 Technical Efficiency
The technical efficiency can be defined as a degree to which a decision
making unit produces the maximum feasible production output from a given bundle of
inputs or uses the minimum feasible amount of inputs to produce a given amount of
output. In agriculture field, technical efficiency refers to the ability of farmers in using
the least amount of inputs to achieve the productivity level required or in producing as
many as they can under the existing production technology. For oil palm plantation, it
means the comparison between the actual yield obtained from the use of inputs and
the highest yield possible. Farmers with higher or equal yield under fewer inputs than
others show higher technical efficiency in producing oil palm.
2.1.2 Allocative Efficiency or Price Efficiency
The price efficiency is the decision making unit’s ability to produce a given
level of output using cost minimizing input ratios. In agricultural area, price efficiency
refers to the ability of farmers in allocating mix of inputs to achieve lowest production
cost or highest profit under the existing production technology and the supply cost
faced. Price efficiency can be called allocative efficiency when comparing production
cost spent at a time point with the least possible production cost. In comparison with
other farmers producing the same amount of output, the one using appropriate amount

6
and similar quality of inputs under comparable production technology but with lower
cost of inputs or higher profits show higher price efficiency in producing oil palm.
2.1.3 Cost Efficiency or Economic Efficiency
The economic efficiency is the decision making unit’s ability to produce
predetermined quantity of output at a minimum cost. Besides, this efficiency type can
be defined as a product of technical efficiency and allocative efficiency. Within a field
of agriculture, cost efficiency refers to the ability of farmers in running oil palm farm
by allocating mix of inputs and using most appropriate production process to achieve
lowest production cost and highest yield at certain supply cost and production
technology. It can be said as the ability of farms in producing oil palm at the level of
having both technical efficiency and allocative efficiency at the same time.
2.2 Previous studies in agriculture efficiency measurement and the other fields
The majority of literature on agriculture efficiency measurement used either
parametric or non-parametric approaches. Sharma et al. (1997) proposed a
comparison between stochastic production frontier and data envelopment analysis in
examining the performance of Hawaii’s swine industry for improvement and
identifying the source of inefficiency. The data envelopment analysis was confirmed
to be more straightforward than the stochastic production frontier.
Kazim Baris Atici and Victor V. Podinovski reviewed research studies on data
envelopment analysis applied in agricultural field. Cost was proposed as key factor
which is normally determined as input in agriculture data envelopment analysis
studies. Wirat (2001) analyzed technical efficiency, scale efficiency and pure
technical efficiency of oil palm farm in Thailand using input-oriented DEA approach.
This research study revealed two important results. First, thirty-two percent of overall
technical inefficiency can be reduced by adopting the best-practice to decrease pure
technical efficiency and by operating oil palm farm at optimal scale. Second, scale
efficiency of oil palm farm makes large high contribution to the overall inefficiency.
While, the input-oriented DEA was used by Eyitayo et al. (2011) to examine
the technical efficiency of cocoa farms in Cross River State in Nigeria. This study
recommended that training should be provided to farmers to support suitable

7
combination of input resources. Ibitoye et al. (2011) examined factors influencing oil
palm production in Ondo state by using regression analysis. The result revealed that
only two variables have significant relationship with the fresh fruit bunch production
including the level of education attained and the number of times the respondents
attended training. Banaeian et al. (2011) investigated both technical efficiency and scale
efficiency of greenhouse strawberry in Iran. This research study used aggregated
inputs to distinguish between technical and allocative effects. However, this may lead
to failure. The multi-stage DEA was applied to overcome this. Multi-stage DEA
method was used for invariant to unit measurement and to identify representative
efficient point. By using DEA as a benchmark tool, the inefficient greenhouses can
recognize resources that should be changed to increase their performance. The result
revealed that 29 percent of fertilizer cost can be saved through the improvement of
management practices.
Taraka et al. (2010) combined DEA with tobit regression analysis to
investigate the efficiency of rice farms in central Thailand in crop year between 2009
and 2010. The result revealed that family labors, extension service by extension
officers, certified seed used, weedy rice and insect infestation were the main key
factors affecting technical inefficiency. Taraka et al. (2014) applied stochastic frontier
to measure technical efficiency of rice farms in central Thailand in crop year between
2009 and 2010. The significant result showed that gender, farming experience, GAP
certificate and cropping intensity affected technical efficiency statistically. Bozoğlu
and Ceyhan (2007) recommended that many policies should be used to support better
extension service, farmer training program and access to credit for example, to
enhance the technical efficiency level. Tipi et al. (2009) measured both technical
efficiency and scale efficiency and investigated the determinants of efficiency of rice
farm in Marmara region in Turkey through the use of input-oriented DEA and tobit
regression analysis. The result revealed that farm size and membership of co-
operative showed positive relationship with technical efficiency.
In previous studies, various literatures (B.H. Gabdo, 2013; Z. Bayramoglu and
E. Gundogmus, 2008) employed traditional cost efficiency model proposed by Färe et
al. (1985) to estimate cost efficiency. B.H. Gabdo (2013) applied DEA to measure

8
cost efficiency and allocative efficiency of smallholder livestock-oil palm integration
farms in Johor, Malaysia. The DEA method in traditional cost efficiency model by
Färe et al. (1985) was employed. The result revealed that in order to improve cost and
allocative efficiency, livestock-oil palm integration farmers should carefully purchase
production input at cheaper rate and be prudent.
In South Sumatra Indonesia, Malini and Aryani (2012) analyzed the efficiency
level of plantation and compared the income of RSPO certified and without RSPO
certified using applied mathematical calculations and statistical methods. The result
revealed that smallholder farmers in oil palm plantation with RSPO certified had
higher income than the one without RSPO certified. Both land expansion and capital
influenced oil palm plantation with RSPO certified while only land expansion had an
influence on the plantation without RSPO certified.
However, this study, to our knowledge, is the first to employ DEA method in
value-based technical, value-based cost, value-based allocative efficiencies model of
Tone (2002) to estimate technical efficiency, cost efficiency and allocative efficiency
at farm level in Thai agriculture.
2.3 Data envelopment analysis (DEA)
Data envelopment analysis (DEA) was first introduced by Charnes et al.
(1978) who worked to measure the efficiency of decision making units. It uses linear
prog02ramming method to construct production frontier of a set of decision making
units and to measure the relative technical efficiency of each DMU. This approach
also identifies efficient production unit. Data envelopment analysis is a non-
parametric programming technique that requires a few priori assumptions concerning
the functional relationship between input and output. That also develops production
frontier or best practice by optimizing the weighted output/input ratio of each decision
making unit.
2.3.1 The advantage of data envelopment analysis
The main strength of DEA model is to generate new alternatives to enhance
performance compared with other methods. The backbone of the DEA technique is
linear programming based on optimization platform. The strength of DEA over the

9
other methods is to identify the optimal ways of performance rather than the average
number that lead to benchmarking in a normative approach. The main advantages of
DEA are in the following:
1. Source of inefficiency can be identified, analyzed and quantified for all
evaluation units.
2. Mathematical formulation form does not require to be specified for production
function.
3. The DEA results indicate the peer group for decision making unit which are
not observed to be efficient. This is useful for inefficient DMU to site study
efficient DMU.
2.3.2 The limitations of data envelopment analysis
1. DEA only evaluates efficiency relative to best practice or efficiency frontier
within the particular set of sample. It cannot compare the efficiency scores
between two different groups of study
2. DEA shows the result that especially responsive to measurement error in
which stochastic frontier analysis has strength over DEA
3. Input, output and the size of sample make DEA score sensitive. If we increase
the sample size, the average efficiency score will be decreased. Because
increasing sample size lead to DEA work for higher scope to find the
comparison organization.
The limitation of DEA must be recognized. Despite these limitations, there is still
potential benefit in using DEA to strength forward understanding the oil palm farm
performance and potential ways to improve farm. The measure of inputs and output
must be inclusive as much as possible.

10
2.4 Ordinary regression analysis
Most of past literature studies employed the Tobit regression model (TRM) to
explore factors affecting efficiency in agriculture field (Traka et al. 2010; Tipi et al.
2009; Wirat, 2004). However, McDonald (2009) argued that DEA efficiency score is
fractional data and not generated by a censoring process. Then, TRM is not
appropriate in this situation. According to Banker and Natarajan (2008), using
ordinary regression analysis in second stage DEA to explore factors affecting
efficiency level will obtain better results than using TRM.
2.5 Principles of farmer certification
Farmer certification consists of 8 principles and 39 criteria. The principles and
main requirement are presented in the following (Wangrakdiskul &Yodpijit, 2013,
RSPO, 2013):
Principle 1 Commitment to transparency: Oil palm farmers provide
information to public on environmental, social and legal issues.
Principle 2 Compliance with relevant laws and regulations: Oil palm farmers
concern with laws, regulations and the right of land use through legal advice,
documents and records.
Principle 3 Commitment to long term economic and financial viability: Oil
palm farmers implemented the plan concerning financial advice, R&D or extension
service for long term economic and financial viability management.
Principle 4 Use of appropriate best practices by growers and millers: Oil palm
farmers are required to manage the appropriate manner by performing good operation,
maintaining the soil fertilizer, maintaining the ground/surface water and soil quality,
adopting Integrated Pest Management (IPM), preventing the environment,
occupational health and safety, and training members in farms.
Principle 5 Environmental responsibility and conservation of natural
resources and biodiversity: Oil palm farmers concern with the reduction, recycling,
reuse and disposal of waste. The burning of disposed wastes should be avoided. The
use of renewable energy should be maximized.
Principle 6 Recognition of the employees’ right: The sexual harassment is
prevented. Child labor is prohibited. Oil palm farmers must respect human right.

11
Principle 7 Responsible development of new plantings: Oil palm farmers are
required to publicly announce before launching new plants and avoid the use of fire
for preparation of new plantings.
Principle 8 Commitment to continuous improvement in key areas of activity:
Oil palm farmers regularly monitor and review activities, perform third party audits
and provide trainings for farmers.
12
Chapter 3
Research Methodology
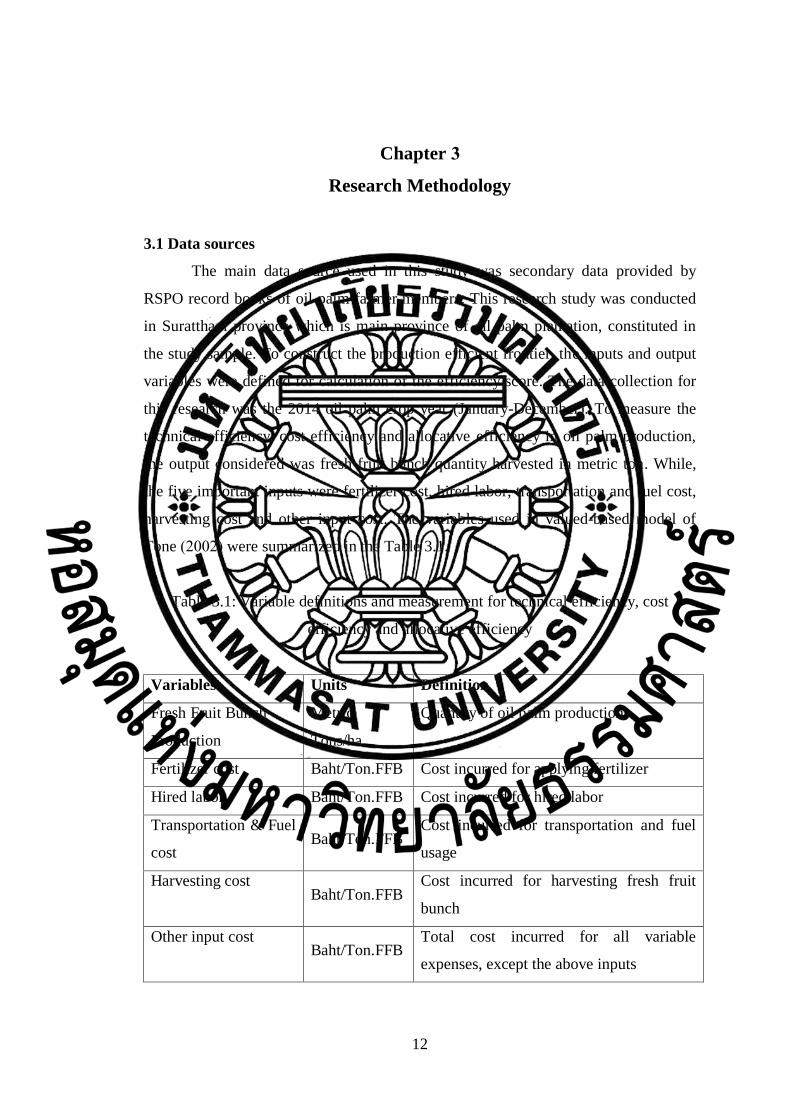
3.1 Data sources
The main data source used in this study was secondary data provided by
RSPO record books of oil palm farmer members. This research study was conducted
in Suratthani province which is main province of oil palm plantation, constituted in
the study sample. To construct the production efficient frontier, the inputs and output
variables were defined for calculation of the efficiency score. The data collection for
this research was the 2014 oil palm crop year (January-December). To measure the
technical efficiency, cost efficiency and allocative efficiency in oil palm production,
the output considered was fresh fruit bunch quantity harvested in metric ton. While,
the five important inputs were fertilizer cost, hired labor, transportation and fuel cost,
harvesting cost and other input cost. The variables used in valued-based model of
Tone (2002) were summarized in the Table 3.1.
Table 3.1: Variable definitions and measurement for technical efficiency, cost
efficiency and allocative efficiency
Variables Units Definition
Fresh Fruit Bunch
Production
Metric
Tons/ha
Quantity of oil palm production
Fertilizer cost Baht/Ton.FFB Cost incurred for applying fertilizer
Hired labor Baht/Ton.FFB Cost incurred for hired labor
Transportation & Fuel
cost Baht/Ton.FFB
Cost incurred for transportation and fuel
usage
Harvesting cost Baht/Ton.FFB
Cost incurred for harvesting fresh fruit
bunch
Other input cost Baht/Ton.FFB
Total cost incurred for all variable
expenses, except the above inputs

13
3.2 Data analysis
Two mathematical techniques were applied in two stages as analytical tools in this
research study:
3.2.1 Measuring technical efficiency, cost efficiency and allocative efficiency
using Data Envelopment Analysis (DEA)
Data envelopment analysis was used for measuring the technical, cost and
allocative efficiency of oil palm farm in the sample data. In the first stage, technical,
cost and allocative efficiency scores were calculated by using input-oriented variable
return to scale DEA. The technical efficiency scores and cost efficiency scores in this
research study were estimated by using computer program, IBM ILOG CPLEX
Optimization software.
The following was done in order to analyze the cost efficiency of RSPO oil
palm farms in Southern Thailand. In this study, n observed decision making units
(DMUs) were dealt with; each uses m input to produce s output. Let 𝑥𝑗 =
(𝑥1𝑗, … , 𝑥𝑚𝑗)𝑇 ∈ ℝ≥0𝑚 and 𝑦𝑗 = (𝑦1𝑗, … , 𝑦𝑠𝑗)𝑇 ∈ ℝ≥0
𝑠 be the input and output
vectors of DMUj, respectively with 𝑗 ∈ 𝐽 = {1, … , 𝑛}. Let 𝑐𝑗 = (𝑐1𝑗, … , 𝑐𝑚𝑗)𝑇 ∈ ℝ≥0𝑚
be the non-negative price vectors of inputs of DMUj. The input-spending of each
DMUj was assumed to be �̅� , where �̅� = 𝑐 ∗ 𝑥. Here, ∗ was the component-wise
multiplication of vectors. The cost efficiency of the evaluated oil palm farm was
measured as the ratio of the minimum cost to the actual cost. In the following model
of Sahoo et al. (2014), it comprises of cost efficiency model of Färe et al. (1985) and
value-based model of Tone (2002):

14
Cost efficiency model of Färe et al. (1985)
𝛾𝑜 = 𝑀𝑖𝑛𝜆,𝑥 = 1
𝐶𝑜∑ 𝑐𝑖𝑜𝑥𝑖
𝑚
𝑖=1
𝑠𝑢𝑏𝑗𝑒𝑐𝑡 𝑡𝑜
∑ 𝜆𝑗𝑗∈𝐽
𝑥𝑖𝑗 ≤ 𝑥𝑖 , 𝑖 = 1, … , 𝑚,
∑ 𝜆𝑗𝑗∈𝐽
𝑦𝑟𝑗 ≥ 𝑦𝑟𝑜, 𝑟 = 1, … , 𝑠,
∑ 𝜆𝑗𝑗∈𝐽
= 1,
𝜆𝑗 ≥ 0, ∀𝑗 ∈ 𝐽,
where 𝐶𝑜=∑ 𝑐𝑖𝑜𝑥𝑖𝑜𝑚𝑖=1 is the observed cost of DMUo
The concept of cost efficiency originated by Farrell (1957) was then further developed
using linear programming technique by Färe et al. (1985). In their study, each oil palm
farmer used different kinds of herbicide, fertilizer usages and purchased the inputs
with different prices. The cost efficiency DEA model by Färe et al. (1985) can be
limited because this model assumed the same input prices across all decision making
units (DMUs) and homogeneous (physical) inputs. In order to keep away from this
weak point, the value-based technology in DEA is appropriate to applied. Then, the
value-based cost efficiency model of Tone (2002) was employed in this study.
Value-based cost efficiency model of Tone (2002)
𝛾𝑜𝐶𝐸 = 𝑀𝑖𝑛𝜆,�̅�
1
𝐶𝑜∑ �̅�𝑖
𝑚
𝑖=1
𝑠𝑢𝑏𝑗𝑒𝑐𝑡 𝑡𝑜
∑ 𝜆𝑗𝑗∈𝐽
�̅�𝑖𝑗 ≤ �̅�𝑖 , 𝑖 = 1, … , 𝑚,
∑ 𝜆𝑗𝑗∈𝐽
𝑦𝑟𝑗 ≥ 𝑦𝑟𝑜, 𝑟 = 1, … , 𝑠,
∑ 𝜆𝑗𝑗∈𝐽
= 1,
𝜆𝑗 ≥ 0, ∀𝑗 ∈ 𝐽,
where 𝐶𝑜 = ∑ �̅�𝑖𝑜𝑚𝑖=1 is the observed cost of DMUo

15
Let 𝛾𝑜𝐶𝐸 denotes the value-based cost efficiency score having a value 0< 𝛾𝑜
𝐶𝐸 ≤1. If
the 𝛾𝑜𝐶𝐸 is equal to one, it means that the farm is on the frontier. The vector 𝜆𝑗 is non-
negative vector of weights which indicate the linear combination of the peers of the 𝑗-
th farm. 𝑚 is the number of inputs, 𝑠 is number of outputs, 𝑛 is number of DMUs (𝑗 =
1,…,𝑛), 𝑦1 represents the fresh fruit bunch production output, ∑ �̅�𝑖𝑚𝑖=1 is the minimum
cost which �̅�1 represents fertilizer cost, �̅�2 represents harvesting cost, �̅�3 represents
transportation and fuel cost, �̅�4 represents hired labor cost and �̅�5 represents other
input cost. 𝑦𝑟𝑜 represents 𝑟𝑡ℎoutput for DMUo (DMUo represents decision making
units under evaluation). To obtain value-based cost efficiency score (𝛾𝑜𝐶𝐸) for each
farm in the sample, the linear programming problem need to be solved 𝑛 times. Here,
IBM ILOG CPLEX Optimization software was used to execute data envelopment
analysis.
In addition, the input-oriented value based TE measure, 𝜌0𝐼𝑉𝑇𝐸, can be set up as
𝜌0𝐼𝑉𝑇𝐸 = 𝑀𝑖𝑛𝜆,�̅� �̅�
𝑠. 𝑡.
∑ 𝜆𝑗𝑗∈𝐽
�̅�𝑗 ≤ �̅��̅�𝑖𝑜, 𝑖 = 1, … , 𝑚,
∑ 𝜆𝑗𝑦𝑟𝑗𝑗∈𝐽
≥ 𝑦𝑟𝑜, 𝑟 = 1, … , 𝑠,
∑ 𝜆𝑗𝑗∈𝐽
= 1, 𝜆𝑗 ≥ 0, ∀𝑗 ∈ 𝐽,
Obviously, one can have the following relationship: 𝛾𝑜𝐶𝐸 ≤ 𝜌0
𝐼𝑉𝑇𝐸 ≤ 1, Using this
equation: 𝛾𝑜𝐶𝐸 ≤ 𝜌0
𝐼𝑉𝑇𝐸 ≤ 1, one can define the input-oriented AE (price
efficiency) as 𝛼𝑜𝐼𝐴𝐸 =
𝛾𝑜𝐶𝐸
𝜌0𝐼𝑉𝑇𝐸 ≤ 1, From this equation: 𝛼𝑜
𝐼𝐴𝐸 = 𝛾𝑜
𝐶𝐸
𝜌0𝐼𝑉𝑇𝐸 ≤ 1, the CE
measure, 𝛾𝑜𝐶𝐸, can be expressed as the product of the (input-oriented) value-based AE
and TE as the following:

16
𝛾𝑜𝐶𝐸 = 𝛼𝑜
𝐼𝐴𝐸 × 𝜌0𝐼𝑉𝑇𝐸, Decision making unit will be cost efficient (𝛾𝑜
𝐶𝐸 = 1) if the
both value-based technical efficient and allocative efficient. If 𝛾𝑜𝐶𝐸 < 1, it incurs
higher costs due to not being able to use.
3.2.2 Regression analysis
In the 2nd
stage after the cost efficiency was obtained by using DEA, OLS
regression analysis was used to explain variation in efficiency measurement of RSPO
oil palm farm, to determine the cause of efficiency and to analyze factors affecting the
cost efficiency. In this research study, the cost efficiency score obtained from the
DEA model in the first stage that considers the variable return to scale input-oriented
model was applied to explore the relationship between the cost efficiency and its
determinants. The cost efficiency score was selected as the dependent variable. This
cost efficiency score as dependent variable was regressed against explanatory
variables as independent variables. The explanatory variables were classified into four
categories including demographic variables and farm management characteristics, age
variables, location variables and fertilizer variable. The standard ordinary least
squares regression model can be specified as
𝑌 = 𝛽0 + 𝛽1𝑋1 + 𝛽2𝑋2 + ⋯ + 𝛽𝑛𝑋𝑛 + 𝜀
Where:
- 𝑌 is dependent variable
- 𝛽0 is the intercept term
- 𝛽𝑖 are unknown parameters to be estimated
- ε is the error term
The ordinary regression model was formulated as:
C.Ei = β0+β1GENDi+β2AGEi +β3FSIZEi+β4NHERBi+β5AEFFBi+β6AGE1i
+β7AGE2i+β8PAIDi+β9WCOURSEi+β10MAPUIi + ε

17
Where:
- C.Ei is value-based cost efficiency score for ith
RSPO oil palm farm
- β0 is the constant term
- β1-β10 are the coefficients of the explanatory variables or unknown
parameters to be estimated
- ε is the error term
Explanatory variables were classified into four categories. The information obtained
from the samples of RSPO oil palm farms by using RSPO record books can be shown
in the following:
1. Demographic variables and Farm Management Characteristics
1. GEND Gender (Male=1, Otherwise=0)
2. AGE Age of oil palm farmer (year)
3. FSIZE Farm Size (hectares)
4. NHERB Non-herbicide applied (Yes=1, Otherwise=0)
5. AEFFB Applied empty fresh fruit bunch (Yes=1, Otherwise = 0)
2. Age variables
6. AGE1 Age of oil palm 3 to 8 years (Yes=1, Otherwise = 0)
7. AGE2 Age of oil palm 9 to 19 years (Yes=1, Otherwise = 0)
3. Location Variables
8. PAID Paid for water-supply (Yes=1, Otherwise=0)
9. WCOURSE Watercourse in oil palm plantation
(Yes=1, Otherwise=0)
4. Fertilizer Variable
10. MAPUI Applied strange fertilizer (Yes=1, Otherwise=0)
The MINITAB 17.0 computer program was used for the OLS regression analysis to
estimate the parameters by using maximum likelihood method.

18
Table 3.2: Type of explanatory variables and expected signs of coefficients
Coefficient Explanatory Variable Type of variable Expected sign of coefficient
𝛽1 GEND Dummy positive or negative
𝛽2 AGE Continuous positive or negative
𝛽3 FSIZE Continuous negative
𝛽4 NHERB Dummy positive or negative
𝛽5 AEFFB Dummy positive
𝛽6 AGE1 Dummy negative
𝛽7 AGE2 Dummy positive
𝛽8 PAID Dummy positive
𝛽9 WCOURSE Dummy positive or negative
𝛽10 MAPUI Dummy positive
- Farm size was expected to have negative relationship with the cost efficiency
- Applied empty fresh fruit bunch was expected to have positive relationship
with the cost efficiency
- Age of oil palm from 3 to 8 years was expected to have negative relationship
with the cost efficiency
- Age of oil palm from 9 to 19 years was expected to have positive relationship
with the cost efficiency
- Paid for water-supply was expected to have positive relationship with the cost
efficiency
- Applied strange fertilizer was expected to have positive relationship with the
cost efficiency

19
Chapter 4
Result and Discussion
4.1 Descriptive analysis of data
Data was collected from record books of RSPO oil palm farmer members in
Suratthani, Thailand in September, 2015. The data gathered for the 2014 cost of input-
spending and oil palm production. Data was gathered from 116 oil palm farms from
66 smallholder farmers of RSPO oil palm farms. So finally data from 78 oil palm
farms were analyzed. The variables for DEA model include one output and five
inputs: fertilizer cost, harvesting cost, transportation & fuel cost, hired labor cost,
other input cost and fresh fruit bunch output.
Table 4.1 present the descriptive statistics of variables related to RSPO oil
palm farms. The average yield of oil palm plantation is 21.11 ton per hectare. It is
higher than an average oil palm yield of 19.54 ton per hectare in southern region as
reported by agricultural statistics of Thailand book (2014) from Office of Agricultural
Economics Thailand.
On average, the RSPO oil palm farmers spend 473.61 baht per ton of fresh
fruit bunch on fertilizer, 390.79 baht per ton of fresh fruit bunch on harvesting, 190.51
baht per ton of fresh fruit bunch on transportation and fuel, 195.82 baht per ton of
fresh fruit bunch on hired labor for fertilizer application, grass cutting, frond pruning,
herbicide application and 40.73 baht per ton of fresh fruit bunch on other input costs
including herbicide cost, fuel cost for grass cutting or others.

20
Table 4.1: Descriptive statistics of output and input variables
Variables Unit Mean Minimum Maximum Std. Dev.
Fresh Fruit Bunch
Production
Metric
Tons/ha 21.11 6.38 52.77 9.25
Fertilizer Cost Baht/Ton.FFB 473.61 0.00 1,525.08 295.24
Harvesting Cost Baht/Ton.FFB 390.79 287.12 573.23 74.30
Transportation &
Fuel Cost Baht/Ton.FFB 190.51 21.97 554.14 77.80
Hired Labor Cost Baht/Ton.FFB 195.82 0.00 681.83 168.72
Other Input Cost Baht/Ton.FFB 40.73 0.00 402.29 80.93
4.2 Result of value-based efficiency model of Tone (2002):
The mean of value-based technical, value-based cost and value-based
allocative efficiencies score for all RSPO oil palm farms was found to be 0.86038,
0.55080 and 0.63402. Value-based technical efficiency measure the relationship
between input-spending in oil palm production process and fresh fruit bunch output.
Value-based technical efficiency was found to be 0.86, on average. This imply that,
on average, RSPO oil palm farms with in studied group could reduce their input-
spending by 14 percent and still produce the same level of fresh fruit bunch output.
Value-based cost efficiency measure as the ratio of the minimum cost to the actual
cost, it was found to be 0.55, on average. This meaning that on average 45 percent
higher cost than needed if all oil palm farms were operating on the cost efficiency
frontier. Value-based allocative efficiency measure as the ratio of value-based cost
efficiency to value-based technical efficiency. In other word, the oil palm farm ability
to produce a given level of fresh fruit bunch using cost minimizing input ratios, it was
found to be 0.63, on average. This meaning that on average, 37 percent oil palm
inefficient at choosing an input bundle that is cost minimizing as summary statistic for
value-based technical efficiency, value-based cost efficiency and value-based
allocative efficiency score present in Table 4.2.

21
Table 4.2: Summary statistic for value-based technical efficiency, value-based cost
efficiency and value-based allocative efficiency score for all RSPO oil palm farms
Value-based TE
Score
Value-based CE
Score
Value-based AE
Score
Mean 0.86038 0.55080 0.63402
Maximum 1.00000 1.00000 1.00000
Minimum 0.53004 0.25318 0.31431
Std. Dev. 0.12285 0.18664 0.16916
The frequency distribution of value-based technical efficiency, value-based cost
efficiency and value-based allocative efficiency of RSPO oil palm farms is illustrated
in Table 4.3, the average technical efficiency of RSPO oil palm farms ranged from
minimum of 53.00 percent and a maximum of 100 percent with a mean of 86.04
percent. The result revealed that 15 farms out of 78 having technical efficiency score
equal to one meaning that those farms are technically efficient. These represent 19.23
percent of RSPO oil palm farms operating on the technical efficiency frontier.
Moreover, no oil palm farm has technical efficiency less than 50 percent, this
meaning that RSPO oil palm farms in Thailand achieve high technical efficiency
production. The result of this study revealed an average cost 55.08 percent, with a
minimum of 25.32 percent and a maximum of 100 percent. Only two oil palm farms
have cost efficiency score equal to 1. While, 35 oil palm farms amounting to 26
percent possess the lowest cost efficiency score of less than 50 percent. This revealed
that RSPO oil palm farms in Thailand achieve low cost efficiency production.
Furthermore, the average allocative efficiency of RSPO oil palm farms at 63.40
percent, with a minimum of 31.43 percent and a maximum of 100 percent.

22
Table 4.3: Frequency distribution of value-based technical efficiency, value-based
cost efficiency and value-based allocative efficiency for RSPO oil palm farms
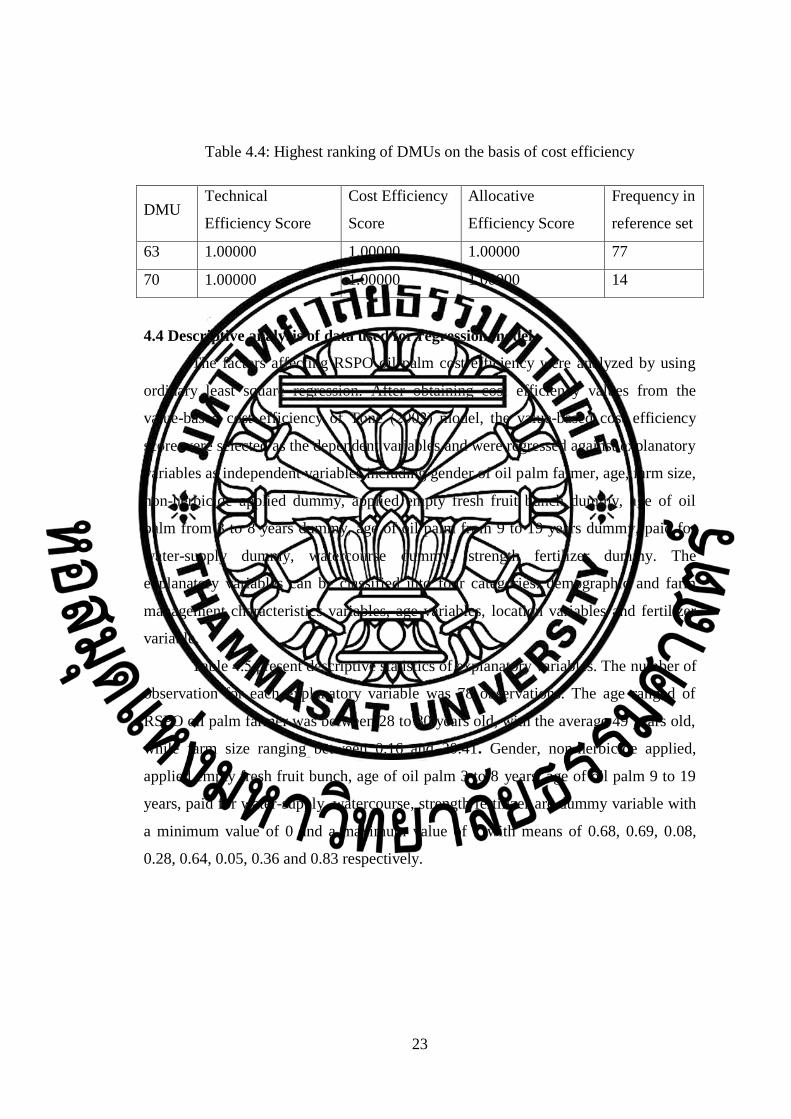
4.3 Number of DMUs appeared in reference set in the basis of benchmarking
cost efficiency
DMU 63 and DMU 70 achieved highest rank and operated their farms on the
cost efficiency frontier. Oil palm farmer of DMU 63 operated 4 oil palm farm plots in
the sample data. This oil palm farmer normally used natural fertilizer such as empty
fresh fruit bunch together with chemical fertilizer. Oil palm farmer of DMU 70
operated 3 oil palm farm plots in the sample data. This oil palm farmer installed
artesian well to their oil palm farm. In dry season, this oil palm farmer spent
electricity cost to ensure oil palm trees has enough water-supply.
Efficiency
Level
Value-based Technical, Cost and Allocative Efficiency
Value-based TE Value-based CE Value-based AE
Number of
farm %
Number of
farm %
Number of
farm %
0.01-0.10 0 0% 0 0% 0 0%
0.11-0.20 0 0% 0 0% 0 0%
0.21-0.30 0 0% 6 8% 0 0%
0.31-0.40 0 0% 11 14% 5 6%
0.41-0.50 0 0% 18 23% 17 22%
0.51-0.60 2 3% 17 22% 13 17%
0.61-0.70 9 12% 9 12% 16 21%
0.71-0.80 8 10% 8 10% 13 17%
0.81-0.90 28 36% 6 8% 8 10%
0.91-1.00 31 40% 3 4% 6 8%
Total 78 100% 78 100% 78 100%
23
Table 4.4: Highest ranking of DMUs on the basis of cost efficiency
DMU Technical
Efficiency Score
Cost Efficiency
Score
Allocative
Efficiency Score
Frequency in
reference set
63 1.00000 1.00000 1.00000 77
70 1.00000 1.00000 1.00000 14
4.4 Descriptive analysis of data used for regression model
The factors affecting RSPO oil palm cost efficiency were analyzed by using
ordinary least square regression. After obtaining cost efficiency values from the
value-based cost efficiency of Tone (2002) model, the value-based cost efficiency
score were selected as the dependent variables and were regressed against explanatory
variables as independent variables including gender of oil palm farmer, age, farm size,
non-herbicide applied dummy, applied empty fresh fruit bunch dummy, age of oil
palm from 3 to 8 years dummy, age of oil palm from 9 to 19 years dummy, paid for
water-supply dummy, watercourse dummy, strength fertilizer dummy. The
explanatory variables can be classified into four categories: demographic and farm
management characteristics variables, age variables, location variables and fertilizer
variable.
Table 4.5 present descriptive statistics of explanatory variables. The number of
observation for each explanatory variable was 78 observations. The age ranged of
RSPO oil palm farmer was between 28 to 80 years old, with the average 49 years old,
while farm size ranging between 0.16 and 20.41. Gender, non-herbicide applied,
applied empty fresh fruit bunch, age of oil palm 3 to 8 years, age of oil palm 9 to 19
years, paid for water-supply, watercourse, strength fertilizer are dummy variable with
a minimum value of 0 and a maximum value of 1 with means of 0.68, 0.69, 0.08,
0.28, 0.64, 0.05, 0.36 and 0.83 respectively.

24
Table 4.5: Descriptive statistics of explanatory variables
Variables Unit Mean Min Max S.D.
Gender Dummy 0.68 0 1 -
Age Year 48.51 28 80 10.98
Farm Size Hectares 3.6 0.16 20.41 3.04
Non-herbicide applied Dummy 0.69 0 1 -
Applied empty fresh fruit bunch Dummy 0.08 0 1 -
Age of oil palm 3 to 8 years Dummy 0.28 0 1 -
Age of oil palm 9 to 19 years Dummy 0.64 0 1 -
Paid for water-supply Dummy 0.05 0 1 -
Watercourse Dummy 0.36 0 1 -
Strength fertilizer Dummy 0.83 0 1 -
4.5 Results of ordinary least square regression analysis
The result of the ordinary least square was obtained using MINITAB 17
computer program. Following the empirical result from regression analysis, two
important factors affecting an increase in cost efficiency of RSPO oil palm farm are
applied empty fresh fruit bunch and paid for water-supply. Applied empty fresh fruit
bunch and paid for water-supply show positive coefficient and are statistically related
to efficiency indexes at one percent level of significance. This means that oil palm
farmers who used empty fresh fruit bunch in oil palm plantation and paid for water-
supply in dry season have higher cost efficiency than those without. Farm size show
negative coefficient and are statistically related to efficiency indexes at one percent
level of significance. This means that oil palm farmers who operated small plantation
area have higher cost efficiency than large plantation area.
Following a variation in age of palm in sample data of RSPO oil palm farm,
the age variables were used to emphasize the age of oil palm tree effect towards cost
efficiency. The result revealed that age of oil palm in period of 3 to 8 years has
negative coefficient and age of oil palm in period of 9 to 19 years has positive
coefficient which corresponds with the nature of oil palm tree. The rapid-increase,

25
yield-peak and decline periods of oil palm were reported in between 3-8 years, 9-19
years and over 20 years (Commodity Intelligence Report, 2012), respectively.
Location variables were introduced to investigate the effect of location of
water-supply towards cost efficiency. The result showed that the paid for water-
supply has positive coefficient as oil palm trees obtain water-supply in dry season.
Strength fertilizer was used to emphasize the effect towards cost efficiency.
The result showed that strength fertilizer has positive coefficient.
Table 4.6: Result of ordinary least square regression analysis
Variables Coefficient Standard error t-value p-value
Constant 0.665 0.133 5.00 0.000
Gender -0.0165 0.0442 -0.37 0.710
Age -0.00112 0.00185 -0.60 0.548
Farm Size -0.02044 0.00653 -3.13 0.003
Non-herbicide applied -0.0444 0.0487 -0.91 0.365
Applied empty fresh fruit bunch 0.2608 0.0763 3.42 0.001
Age of oil palm 3 to 8 years -0.0417 0.0781 -0.53 0.595
Age of oil palm 9 to 19 years 0.0107 0.0733 0.15 0.885
Paid for water-supply 0.2671 0.0956 2.79 0.007
Watercourse -0.0531 0.0453 -1.17 0.245
Strength fertilizer 0.0550 0.0580 0.95 0.347

26
Chapter 5
Conclusion and Recommendation
5.1 Conclusion
The purpose of this study was to measure technical, cost, allocative
efficiencies and to find out factors affecting cost efficiency of RSPO oil palm as well
as to focus on the impact of sustainable oil palm plantation. Data were collected from
116 oil palm farms from 66 smallholder farmers of RSPO oil palm farms; data from
78 oil palm farms were analyzed. This study adopted data envelopment analysis
method in technical, cost and allocative efficiencies model of Tone (2002) to measure
efficiency and used ordinary least square regression to find factors affecting cost
efficiency. The efficiency analysis estimated technical, cost and allocative efficiency
level to be 86.04%, 55.08% and 63.40%, respectively.
The output and input variables used in this study included fertilizer cost, hired
labor cost, transportation & fuel cost, harvesting cost and other input cost as inputs in
addition to fresh fruit bunch production as output. These output and input variables
were used in the first stage of DEA analysis to obtain technical, cost and allocative
efficiency scores of RSPO oil palm farms under variable return to scale assumption.
Then, the cost efficiency score obtained from the first stage were used as independent
variable to explore the factors affecting cost efficiency of these RSPO oil palm farms
through the ordinary least square model for regression analysis.
Demographic and farm management characteristics variables, age variables,
location variables and fertilizer variable were used to investigate efficiency
determinants. The regression model showed that applied empty fresh fruit bunch, age
of oil palm from 9 to 19 years, paid for water supply and strength fertilizer positively
influenced cost efficiency. While, gender, age, farm size, non-herbicide applied, age
of oil palm from 3 to 8 years, watercourse presented negative relationship with cost
efficiency. Most of the explanatory variables in efficiency model revealed the results
with expected sign of coefficient.
From the empirical result of regression analysis, among the factors which were
investigated for their effect on cost efficiency, the study revealed that two important

27
factors affecting an increase in cost efficiency of RSPO oil palm farm are applied
empty fresh fruit bunch and paid for water-supply. These variables were found to be
significant and showed positive relationship with cost efficiency. The results of this
study implied that the sustainable oil palm plantation helps enhancing cost efficiency
level in Thai oil palm industry.
5.2 Recommendation for further study
This study can be improved in a number of areas. These include employing fractional
regression model in the second stage of DEA to explore factors affecting efficiency as
well as executing DEA and stochastic frontier analysis then comparing the results.

28
References
1. Dallinger, J. (2011). “Oil palm development in Thailand: economic, social and
environmental considerations” in Oil Palm Expansion in South East Asia: Trends and
Implications for Local Communities and Indigenous Peoples, Forest Peoples
Programme, 24-49.
2. Ibitoye, O.O., Akinsorotan, A.O., Meludu, N.T., & Ibitoye, B.O. (2011).
Factors Affecting oil palm production in ONDO state of Nigeria. Journal of
Agricultural and Social Research (JASR), 11(1), 97-105.
3. Gabdo, B.H. (2013). Estimation of Cost and Allocative Efficiencies under
Smallholder Live-Oil Palm Integration Farms in Johor, Malaysia. Agricultural
Journal, 8(6), 304-307.
4. Malini, H., & Aryani, D. (2012). Efficiency Analysis of Palm Plantation
Plasma Farmers Certified RSPO and without RSPO on Sustainable Palm Plantation
Management in Musi Banyuasin Regency South Sumatera Indonesia. International
Conference on Environmental, Energy and Biotechnology (IPCBEE), 33, 194-199.
5. McDonald, J. (2009). Using least squares and tobit in second stage DEA
efficiency analyses. European Journal of Operational Research, 197(2), 792-798.
http://dx.doi.org/10.1016/j.ejor.2008.07.039
6. Wangrakdiskul, U., & Yodpijit, N. (2013). Current Situation of RSPO
Standard to Smallholder Farmers in Thailand. European Journal of Scientific
Research, 113(3), 466-479.
7. Sahoo, B., Mehdiloozad, M., & Tone, K. (2014). Cost, revenue and profit
efficiency measurement in DEA: A directional distance function approach. European
Journal Of Operational Research, 237(3), 921-931.
http://dx.doi.org/10.1016/j.ejor.2014.02.017
8. Thongrak, S., & Kiatpathomchai, S. (2012). Final Report: Impact Study of the
Project on Sustainable Palm Oil Production for Bio-energy in Thailand.
9. Fitzherbert, E. B., Struebig, M. J., Morel, A., Danielsen, F., Br¨uhl, C. A.,
Donald, P.F. & Phalan, B. (2008). How will oil palm expansion affect biodiversity?,
Trends in Ecology and Evolution , 23(10), 538-545.
http://dx.doi.org/10.1016/j.tree.2008.06.012

29
10. Färe, R., Grosskopf, S., & Lovell, C.A.K. (1985). The measurement of
efficiency of production Boston: Kluwer Nijhoff.
11. Bayramoglu, Z., & Gundogmus, E. (2008). Cost efficiency on organic
farming: a comparison between organic and conventional raisin-producing households
in Turkey. Spanish Journal Of Agricultural Research, 6(1), 3-11.
http://dx.doi.org/10.5424/sjar/2008061-289
12. Krasachat, W. (2001). Performance Measurement of the Thai Oil Palm Farms:
A Non-parametric Approach. Songklanakarin Journal of Science and Technology
23(Suppl.), 763-69.
13. Krasachat, W. (2004). Technical Efficiencies of Rice Farms in Thailand: A
Non-parametric Approach. The Journal of American Academy of business,
Cambridge 4(1), 64-69.
14. Tipi, T., Yildiz, N., Nargeleçekenler, M., & Çetin, B. (2009). Measuring the
technical efficiency and determinants of efficiency of rice ( Oryza sativa ) farms in
Marmara region, Turkey. New Zealand Journal of Crop and Horticultural Science,
37(2), 121-129. http://dx.doi.org/10.1080/01140670909510257
15. Taraka, K., Latif, I.A. & Shamsudin, M.N. (2010). A Nonparametric approach
to Evaluate Technical Efficiency of Rice Farms in Central Thailand. Chulalongkorn
Journal of Economics, 22, 1-14.
16. Taraka, K., Latif, I.A., Shamsudin, M.N. & Sidique, S.B.A. (2014).
Estimation of technical efficiency for rice farms in central Thailand using stochastic
frontier approach. Asian Journal of Agriculture and development, Vol. 9, No. 2
17. Banker, R., & Natarajan, R. (2008). Evaluating Contextual Variables
Affecting Productivity Using Data Envelopment Analysis. Operations Research,
56(1), 48-58. http://dx.doi.org/10.1287/opre.1070.0460
18. USDA, “Malaysia: Stagnating Palm Oil Yield Impede Growth”, Commodity
Intelligence Report, 2012.
19. Tone, K. (2002). A strange case of the cost and allocative efficiencies in DEA.
J Oper Res Soc, 53(11), 1225-1231. http://dx.doi.org/10.1057/palgrave.jors.2601438
20. Farrell, M. (1957). The Measurement of Productive Efficiency. Journal of The
Royal Statistical Society. Series A (General), 120(3), 253.
http://dx.doi.org/10.2307/2343100

30
21. Nillaket, I. & Wattanakul, T. (2014). Analysis of Potential Production of oil
palms and Market Structure: Case Study of Nongkhai and Bungkan Provinces,
Graduate Research Conference Khon Kaen University, pp.3022-3031.
22. OAE (Office of Agricultural Economics), “Fundamental Information of
Agricultural Economics 2015,” Ministry of Agriculture and Cooperative, Bangkok,
Thailand, 2015.
23. Atici, K. B., & Podinovski, V. V. A REVIEW OF DATA ENVELOPMENT
ANALYSIS STUDIES IN AGRICULTURE. University of Warwick, Warwick
Business School, Coventry, United Kingdom.
24. Eyit, O.A., Chris, O., Ejiola, M.T. & Enitan, F.T. (2011). Technical efficiency
of cocoa farms in Cross River State, Nigeria. African Journal of Agricultural Research
Vol. 6(22), pp.5080-5086.
25. Banaeian, N., Omid, M., & Ahmadi, H. (2011). Improvement of Cost
Efficiency in Strawberry Greenhouses by Data Envelopment Analysis. Journal of
Agricultura Tropica et Subtropica 06/2011; 44(3):144-15.
26. Sharma, K.R., Leung, P.S. & Zaleski, H.M. (1997). Productive efficiency of
the swine industry in Hawaii: stochastic frontier vs. data envelopment analysis.
Journal of Productivity Analysis; 8:447-459.
27. Bozoğlu, M. & Ceyhan V. (2007). Measuring the technical efficiency and
exploring the inefficiency determinants of vegetable farms in Samsun province,
Turkey. Agricultural Systems 94(3): 649-656.
28. Phitthayaphinant, P. & Somboonsuk, B. (2013). Economic Efficiency Analysis
of Oil Palm Production in Aoluek District, Krabi Province, Retrieved from April 25,
2016, http://kb.psu.ac.th/psukb/handle/2010/9196

31
Appendices

32
Appendix A
Raw Data of Inputs and Output for DEA
DMU
Fresh Fruit
Bunch
Production
Fertilizer
Cost
Harvesting
Cost
Transportation
& Fuel Cost
Hired
Labor
Cost
Other
Input
Cost
1 25.82 432.62 369.19 157.65 101.55 34.10
2 20.22 423.70 400.00 200.00 221.49 162.71
3 20.26 385.54 290.92 123.42 0.00 0.00
4 16.08 298.50 573.23 226.75 245.16 0.00
5 10.57 1,070.23 431.51 203.14 177.05 110.99
6 23.61 513.27 409.96 204.63 88.06 62.90
7 23.96 783.80 410.70 204.86 181.40 61.61
8 8.75 552.86 350.04 200.00 0.00 100.00
9 17.11 366.13 350.02 200.00 0.00 26.49
10 18.97 740.01 350.24 44.14 206.70 0.00
11 21.49 275.78 331.95 204.51 195.23 0.00
12 23.70 292.11 340.93 192.35 146.83 0.00
13 16.55 389.67 349.81 164.21 461.03 0.00
14 13.53 345.77 426.41 258.06 306.47 0.00
15 21.92 568.21 303.30 303.30 244.49 13.87
16 12.90 928.04 300.00 300.00 365.31 0.00
17 20.68 420.47 445.92 105.21 84.62 0.00
18 14.56 663.20 400.00 200.00 570.07 5.37
19 12.75 752.67 400.00 200.00 633.73 0.00
20 11.98 707.82 554.14 554.14 681.83 0.00
21 13.26 394.03 329.50 242.46 336.90 0.00

33
DMU
Fresh Fruit
Bunch
Production
Fertilizer
Cost
Harvesting
Cost
Transportation
& Fuel Cost
Hired
Labor
Cost
Other
Input
Cost
22 22.79 365.57 361.27 218.03 209.08 0.00
23 23.04 379.70 349.89 216.70 209.96 0.00
24 32.45 235.18 384.40 289.51 132.54 0.00
25 10.61 1,321.16 449.47 202.31 360.89 0.00
26 14.97 363.27 349.94 92.76 375.23 0.00
27 39.15 167.00 349.89 67.22 166.11 0.00
28 13.67 640.52 355.92 202.54 304.34 2.83
29 20.07 357.33 350.00 200.00 143.15 12.89
30 14.91 639.32 332.20 332.20 0.00 221.00
31 10.22 888.44 294.54 196.55 357.57 0.00
32 10.71 395.60 359.96 105.63 643.41 0.00
33 13.33 503.70 350.63 106.32 584.97 0.00
34 23.02 275.26 346.06 213.89 81.84 0.00
35 32.98 449.89 450.00 200.00 96.06 302.92
36 21.33 0.00 383.70 237.04 46.06 54.19
37 18.96 479.38 446.28 53.92 241.95 0.00
38 47.22 203.58 349.96 241.22 73.53 0.00
39 23.10 335.48 396.39 113.07 152.68 0.00
40 12.11 347.69 344.23 182.90 325.21 0.00
41 11.05 1,065.50 359.92 299.98 294.54 268.82
42 23.38 875.69 299.51 250.28 129.02 0.00
43 13.21 839.45 357.22 215.07 0.00 16.55
44 33.31 180.55 349.63 193.41 0.00 6.57
45 15.42 286.77 548.99 199.62 253.44 0.00
46 17.33 280.62 549.28 199.71 102.10 0.00

34
DMU
Fresh Fruit
Bunch
Production
Fertilizer
Cost
Harvesting
Cost
Transportation
& Fuel Cost
Hired
Labor
Cost
Other
Input
Cost
47 25.82 219.78 566.14 200.35 86.53 0.00
48 6.38 555.71 550.55 199.32 578.72 0.00
49 29.32 190.35 548.08 199.55 159.16 0.00
50 15.02 325.47 547.48 198.72 139.98 0.00
51 23.72 293.25 550.06 200.00 123.75 0.00
52 18.78 884.42 450.00 200.00 461.32 146.31
53 26.65 772.12 450.00 200.00 367.51 163.08
54 21.42 671.72 450.16 200.07 411.43 149.11
55 22.44 368.27 344.39 198.52 116.31 0.00
56 15.35 448.10 347.27 227.01 185.82 0.00
57 29.40 261.50 348.08 207.81 86.62 10.42
58 37.38 201.02 335.53 200.00 65.63 8.20
59 41.43 173.99 334.01 193.26 59.12 7.40
60 32.99 672.38 350.00 200.00 101.28 303.85
61 19.51 990.26 350.00 198.48 147.05 402.29
62 27.27 218.84 398.37 26.54 201.36 2.33
63 26.77 212.65 355.70 29.83 26.46 7.78
64 23.30 271.70 351.48 21.97 32.76 9.19
65 15.68 380.88 376.15 42.51 47.31 8.23
66 21.45 163.78 420.49 198.82 24.95 21.09
67 24.10 235.67 397.73 198.87 24.60 15.54
68 13.12 150.48 397.80 198.41 26.87 23.45
69 38.13 94.94 330.00 202.48 59.14 42.58
70 52.77 41.20 322.28 221.37 37.84 31.62
71 18.59 559.11 287.12 220.68 156.28 117.88

35
DMU
Fresh Fruit
Bunch
Production
Fertilizer
Cost
Harvesting
Cost
Transportation
& Fuel Cost
Hired
Labor
Cost
Other
Input
Cost
72 16.63 140.64 350.69 249.47 0.00 29.10
73 18.51 507.70 341.75 193.89 128.70 16.36
74 17.75 359.30 348.05 200.86 98.24 28.84
75 12.65 871.98 347.59 198.66 180.19 58.70
76 6.84 1,525.08 348.89 198.94 250.60 103.10
77 17.82 260.31 500.00 63.78 251.60 0.00
78 42.35 737.72 498.90 50.71 105.11 6.69

36
Appendix B
Value-based Technical Score, Value-based Cost Score and Value-
based Allocative Efficiency Score for Each RSPO Oil Palm Farm in
the Sample
DMU Value-based Technical
Efficiency Score
Value-based Cost
Efficiency Score
Value-based Allocative
Efficiency Score
1 0.814092 0.57750 0.70938
2 0.743367 0.44920 0.60428
3 1 0.79066 0.79066
4 0.605774 0.47069 0.77700
5 0.672982 0.31734 0.47154
6 0.716903 0.49454 0.68983
7 0.716419 0.38507 0.53750
8 0.831115 0.52576 0.63260
9 0.876267 0.67092 0.76565
10 1 0.47159 0.47159
11 0.971923 0.62775 0.64588
12 0.940923 0.65051 0.69135
13 0.868108 0.46341 0.53382
14 0.759952 0.47313 0.62258
15 0.96375 0.44128 0.45788
16 0.969733 0.33403 0.34445
17 0.91112 0.59878 0.65719
18 0.726985 0.34397 0.47315
19 0.727299 0.31838 0.43776
20 0.530044 0.25318 0.47767
21 0.906226 0.48541 0.53564
22 0.858747 0.54806 0.63821
23 0.873128 0.54697 0.62645

37
DMU Value-based Technical
Efficiency Score
Value-based Cost
Efficiency Score
Value-based Allocative
Efficiency Score
24 0.887597 0.61175 0.68922
25 0.647248 0.27099 0.41867
26 0.932163 0.53542 0.57438
27 1 0.85689 0.85689
28 0.817171 0.41990 0.51385
29 0.852273 0.59475 0.69784
30 0.875734 0.41479 0.47365
31 0.987697 0.36408 0.36861
32 0.886807 0.42033 0.47398
33 0.895969 0.40918 0.45669
34 0.946059 0.68964 0.72896
35 0.692377 0.42542 0.61444
36 1 0.87716 0.87716
37 1 0.51774 0.51774
38 1 0.74818 0.74818
39 0.815646 0.63395 0.77724
40 0.901609 0.50721 0.56256
41 0.797714 0.27632 0.34639
42 0.994108 0.40684 0.40925
43 0.814389 0.44279 0.54371
44 1 0.87369 0.87369
45 0.630541 0.49071 0.77823
46 0.827679 0.55883 0.67518
47 0.975526 0.58952 0.60431
48 0.563819 0.33564 0.59529
49 0.918622 0.57839 0.62963
50 0.699415 0.52196 0.74628
51 0.764747 0.54190 0.70860
52 0.645986 0.29525 0.45705

38
DMU Value-based Technical
Efficiency Score
Value-based Cost
Efficiency Score
Value-based Allocative
Efficiency Score
53 0.66755 0.32388 0.48517
54 0.64861 0.33596 0.51796
55 0.890008 0.61552 0.69159
56 0.843592 0.52345 0.62050
57 0.899804 0.69404 0.77132
58 0.973915 0.79143 0.81263
59 1 0.83979 0.83979
60 0.86559 0.39181 0.45265
61 0.826658 0.30288 0.36639
62 1 0.74679 0.74679
63 1 1.00000 1.00000
64 1 0.92043 0.92043
65 0.908869 0.73962 0.81378
66 0.827284 0.76276 0.92201
67 0.819623 0.72492 0.88446
68 0.849724 0.79350 0.93383
69 0.972413 0.88049 0.90546
70 1 1.00000 1.00000
71 1 0.47159 0.47159
72 1 0.82145 0.82145
73 0.849956 0.53217 0.62612
74 0.856232 0.61088 0.71345
75 0.832429 0.38164 0.45847
76 0.829184 0.26062 0.31431
77 0.992832 0.58794 0.59218
78 1 0.46139 0.46139

39
Appendix C
Optimal Input Spending for Each RSPO Oil Palm Farm in the
Sample to Reach Cost Efficiency Frontier
DMU
Fertilizer
Cost
Harvesting
Cost
Transportation &
Fuel Cost
Hired Labor
Cost
Other Input
Cost
1 212.65 355.7 29.834 26.462 7.7828
2 212.65 355.7 29.834 26.462 7.7828
3 212.65 355.7 29.834 26.462 7.7828
4 212.65 355.7 29.834 26.462 7.7828
5 212.65 355.7 29.834 26.462 7.7828
6 212.65 355.7 29.834 26.462 7.7828
7 212.65 355.7 29.834 26.462 7.7828
8 212.65 355.7 29.834 26.462 7.7828
9 212.65 355.7 29.834 26.462 7.7828
10 212.65 355.7 29.834 26.462 7.7828
11 212.65 355.7 29.834 26.462 7.7828
12 212.65 355.7 29.834 26.462 7.7828
13 212.65 355.7 29.834 26.462 7.7828
14 212.65 355.7 29.834 26.462 7.7828
15 212.65 355.7 29.834 26.462 7.7828
16 212.65 355.7 29.834 26.462 7.7828
17 212.65 355.7 29.834 26.462 7.7828
18 212.65 355.7 29.834 26.462 7.7828
19 212.65 355.7 29.834 26.462 7.7828
20 212.65 355.7 29.834 26.462 7.7828
21 212.65 355.7 29.834 26.462 7.7828
22 212.65 355.7 29.834 26.462 7.7828
23 212.65 355.7 29.834 26.462 7.7828
24 175.15 348.39 71.723 28.951 12.995

40
DMU
Fertilizer
Cost
Harvesting
Cost
Transportation &
Fuel Cost
Hired Labor
Cost
Other Input
Cost
25 212.65 355.7 29.834 26.462 7.7828
26 212.65 355.7 29.834 26.462 7.7828
27 130.99 339.78 121.06 31.883 19.134
28 212.65 355.7 29.834 26.462 7.7828
29 212.65 355.7 29.834 26.462 7.7828
30 212.65 355.7 29.834 26.462 7.7828
31 212.65 355.7 29.834 26.462 7.7828
32 212.65 355.7 29.834 26.462 7.7828
33 212.65 355.7 29.834 26.462 7.7828
34 212.65 355.7 29.834 26.462 7.7828
35 171.71 347.72 75.573 29.18 13.474
36 212.65 355.7 29.834 26.462 7.7828
37 212.65 355.7 29.834 26.462 7.7828
38 77.78 329.41 180.5 35.416 26.531
39 212.65 355.7 29.834 26.462 7.7828
40 212.65 355.7 29.834 26.462 7.7828
41 212.65 355.7 29.834 26.462 7.7828
42 212.65 355.7 29.834 26.462 7.7828
43 212.65 355.7 29.834 26.462 7.7828
44 169.51 347.29 78.033 29.326 13.781
45 212.65 355.7 29.834 26.462 7.7828
46 212.65 355.7 29.834 26.462 7.7828
47 212.65 355.7 29.834 26.462 7.7828
48 212.65 355.7 29.834 26.462 7.7828
49 195.81 352.42 48.649 27.58 10.124
50 212.65 355.7 29.834 26.462 7.7828
51 212.65 355.7 29.834 26.462 7.7828
52 212.65 355.7 29.834 26.462 7.7828
53 212.65 355.7 29.834 26.462 7.7828

41
DMU
Fertilizer
Cost
Harvesting
Cost
Transportation &
Fuel Cost
Hired Labor
Cost
Other Input
Cost
54 212.65 355.7 29.834 26.462 7.7828
55 212.65 355.7 29.834 26.462 7.7828
56 212.65 355.7 29.834 26.462 7.7828
57 195.29 352.32 49.227 27.614 10.196
58 142.7 342.06 107.98 31.106 17.507
59 115.96 336.85 137.84 32.881 21.223
60 171.63 347.71 75.659 29.185 13.485
61 212.65 355.7 29.834 26.462 7.7828
62 209.35 355.06 33.528 26.681 8.2425
63 212.65 355.7 29.834 26.462 7.7828
64 212.65 355.7 29.834 26.462 7.7828
65 212.65 355.7 29.834 26.462 7.7828
66 212.65 355.7 29.834 26.462 7.7828
67 212.65 355.7 29.834 26.462 7.7828
68 212.65 355.7 29.834 26.462 7.7828
69 137.7 341.09 113.56 31.438 18.202
70 41.198 322.28 221.37 37.844 31.617
71 212.65 355.7 29.834 26.462 7.7828
72 212.65 355.7 29.834 26.462 7.7828
73 212.65 355.7 29.834 26.462 7.7828
74 212.65 355.7 29.834 26.462 7.7828
75 212.65 355.7 29.834 26.462 7.7828
76 212.65 355.7 29.834 26.462 7.7828
77 212.65 355.7 29.834 26.462 7.7828
78 109.91 335.67 144.61 33.283 22.065

42
Appendix D
Optimal Input Spending for Each RSPO Oil Palm Farm in the
Sample to Reach Technical Efficiency Frontier
DMU Fertilizer
Cost
Harvesting
Cost
Transportation &
Fuel Cost
Hired Labor
Cost
Other Input
Cost
1 324.65 300.56 128.34 21.58 3.49
2 314.96 297.35 143.50 7.76 6.48
3 385.54 290.92 123.42 0.00 0.00
4 180.82 347.25 88.78 148.51 0.00
5 409.26 290.40 136.71 21.36 16.11
6 367.97 293.90 145.33 22.15 17.04
7 364.83 294.23 146.77 23.15 17.83
8 385.54 290.92 123.42 0.00 0.00
9 320.83 306.71 156.73 0.00 7.69
10 740.01 350.24 44.14 206.70 0.00
11 268.04 322.63 93.20 89.31 0.00
12 274.86 320.79 94.95 84.13 0.00
13 338.27 303.67 111.26 35.93 0.00
14 262.77 324.05 91.85 93.32 0.00
15 383.30 292.30 138.48 17.50 13.37
16 385.54 290.92 123.42 0.00 0.00
17 383.10 316.07 95.86 77.10 0.00
18 391.29 290.79 126.64 5.17 3.90
19 385.54 290.92 123.42 0.00 0.00
20 375.17 293.72 120.75 7.88 0.00
21 357.08 298.60 116.10 21.63 0.00
22 313.93 310.24 105.00 54.43 0.00
23 331.53 305.50 109.53 41.06 0.00
24 208.75 341.19 120.46 117.65 0.00

43
DMU Fertilizer
Cost
Harvesting
Cost
Transportation &
Fuel Cost
Hired Labor
Cost
Other Input
Cost
25 385.54 290.92 123.42 0.00 0.00
26 338.62 326.20 86.47 105.17 0.00
27 167.00 349.89 67.22 166.11 0.00
28 388.95 290.85 125.33 3.07 2.31
29 304.54 298.30 146.46 8.90 7.44
30 385.54 290.92 123.42 0.00 0.00
31 385.54 290.92 123.42 0.00 0.00
32 350.82 319.21 93.68 84.54 0.00
33 451.30 314.16 95.26 75.93 0.00
34 260.42 327.40 136.17 77.42 0.00
35 247.02 311.57 138.48 44.45 8.59
36 0.00 383.70 237.04 46.06 54.19
37 479.38 446.28 53.92 241.95 0.00
38 203.58 349.96 241.22 73.53 0.00
39 273.63 323.32 92.22 91.81 0.00
40 313.48 310.36 104.89 54.77 0.00
41 559.11 287.12 220.68 156.28 117.88
42 364.49 297.75 137.05 8.51 0.00
43 385.54 290.92 123.42 0.00 0.00
44 180.55 349.63 193.41 0.00 6.57
45 180.82 346.16 70.77 155.60 0.00
46 232.26 337.19 165.30 84.51 0.00
47 214.40 344.10 195.44 84.41 0.00
48 313.32 310.41 104.85 54.89 0.00
49 174.86 349.91 104.62 146.21 0.00
50 227.64 336.92 138.99 97.91 0.00
51 224.27 338.72 152.95 94.64 0.00
52 395.85 290.69 129.20 9.28 7.00
53 316.29 300.40 133.51 19.15 4.73

44
DMU Fertilizer
Cost
Harvesting
Cost
Transportation &
Fuel Cost
Hired Labor
Cost
Other Input
Cost
54 377.55 291.98 129.77 5.75 4.45
55 327.76 306.51 108.56 43.92 0.00
56 378.02 292.95 121.48 5.72 0.00
57 235.30 313.20 140.10 47.78 9.38
58 195.77 326.77 160.60 63.92 7.99
59 173.99 334.01 193.26 59.12 7.40
60 267.97 302.96 173.12 32.36 25.63
61 458.09 289.33 164.07 65.32 49.27
62 218.84 398.37 26.54 201.36 2.33
63 212.65 355.70 29.83 26.46 7.78
64 271.70 351.48 21.97 32.76 9.19
65 302.85 341.87 38.64 32.46 7.48
66 135.49 345.62 164.48 20.64 17.45
67 193.16 325.99 163.00 20.17 12.74
68 127.87 338.02 168.60 22.83 17.97
69 92.32 320.90 196.89 44.15 25.24
70 41.20 322.28 221.37 37.84 31.62
71 559.11 287.12 220.68 156.28 117.88
72 140.64 350.69 249.47 0.00 29.10
73 406.02 290.47 134.89 18.43 13.91
74 307.64 298.01 145.58 8.56 7.15
75 457.49 289.34 163.74 64.78 48.87
76 459.67 289.30 164.96 66.74 50.35
77 258.44 378.10 63.32 188.31 0.00
78 737.72 498.90 50.71 105.11 6.69

45
Appendix E
Benchmarking of Inefficient Farms (Technical Efficiency)
DMU Benchmark (Lambda) Peer Group
1 3(0.784884); 27(0.104774); 70(0.110342) 3,27,70
2 3(0.795032); 70(0.204968) 3,70
3 3(1.000000) 3
4 3(0.044948); 27(0.845631); 38(0.109421) 3,27,38
5 3(0.863333); 71(0.136667) 3,71
6 3(0.775535); 70(0.109161); 71(0.115304) 3,70,71
7 3(0.760816); 70(0.120149); 71(0.119034) 3,70,71
8 3(1.000000) 3
9 3(0.735755); 72(0.264245) 3,72
10 10(1.000000) 10
11 3(0.462338); 27(0.537662) 3,27
12 3(0.493534); 27(0.506466) 3,27
13 3(0.783714); 27(0.216286) 3,27
14 3(0.438212); 27(0.561788) 3,27
15 3(0.845529); 70(0.056090); 71(0.098381) 3,70,71
16 3(1.000000) 3
17 3(0.574475); 10(0.158029); 27(0.267496) 3,10,27
18 3(0.966911); 71(0.033089) 3,71
19 3(1.000000) 3
20 3(0.952558); 27(0.047442) 3,27
21 3(0.869760); 27(0.130240) 3,27
22 3(0.672322); 27(0.327678) 3,27
23 3(0.752833); 27(0.247167) 3,27
24 3(0.147797); 27(0.593929); 38(0.258274) 3,27,38
25 3(1.000000) 3

46
DMU Benchmark (Lambda) Peer Group
26 3(0.402541); 10(0.145986); 27(0.451472) 3,10,27
27 27(1.000000) 27
28 3(0.980374); 71(0.019626) 3,71
29 3(0.764768); 70(0.235232) 3,70
30 3(1.000000) 3
31 3(1.000000) 3
32 3(0.520915); 10(0.122134); 27(0.356951) 3,10,27
33 3(0.607531); 10(0.264439); 27(0.128030) 3,10,27
34 3(0.381763); 27(0.345252); 38(0.272985) 3,27,38
35 3(0.522576); 27(0.205685); 70(0.271739) 3,27,70
36 36(1.000000) 36
37 37(1.000000) 37
38 38(1.000000) 38
39 3(0.450722); 10(0.014186); 27(0.535092) 3,10,27
40 3(0.670283); 27(0.329717) 3,27
41 71(1.000000) 71
42 3(0.884312); 38(0.115688) 3,38
43 3(1.000000) 3
44 44(1.000000) 44
45 3(0.063242); 27(0.936758) 3,27
46 3(0.215964); 27(0.290130); 38(0.493906) 3,27,38
47 3(0.098921); 27(0.196124); 38(0.704954) 3,27,38
48 3(0.669524); 27(0.330476) 3,27
49 27(0.785069); 38(0.214931) 27,38
50 3(0.220356); 27(0.438338); 38(0.341306) 3,27,38
51 3(0.189840); 27(0.378777); 38(0.431384) 3,27,38
52 3(0.940605); 71(0.059395) 3,71
53 3(0.769230); 27(0.081176); 70(0.149594) 3,27,70
54 3(0.934985); 70(0.037218); 71(0.027797) 3,70,71

47
DMU Benchmark (Lambda) Peer Group
55 3(0.735621); 27(0.264379) 3,27
56 3(0.965560); 27(0.034440) 3,27
57 3(0.483274); 27(0.220090); 70(0.296637) 3,27,70
58 3(0.196684); 27(0.181335); 59(0.482241);
70(0.139741)
3,27,59,70
59 59(1.000000) 59
60 3(0.491821); 70(0.397323); 71(0.110855) 3,70,71
61 3(0.582036); 71(0.417964) 3,71
62 62(1.000000) 62
63 63(1.000000) 63
64 64(1.000000) 64
65 3(0.158114); 10(0.028075); 64(0.813811) 3,10,64
66 36(0.070410); 44(0.396123); 63(0.244942);
70(0.288525)
36,44,63,70
67 3(0.264641); 27(0.032390); 44(0.281520);
63(0.102267); 70(0.319182)
3,27,44,63,70
68 3(0.012297); 44(0.317295); 63(0.222921);
70(0.447487)
3,44,63,70
69 3(0.117798); 27(0.083926); 70(0.798275) 3,27,70
70 70(1.000000) 70
71 71(1.000000) 71
72 72(1.000000) 72
73 3(0.882044); 71(0.117956) 3,71
74 3(0.773778); 70(0.226222) 3,70
75 3(0.585476); 71(0.414524) 3,71
76 3(0.572921); 71(0.427079) 3,71
77 27(0.707280); 37(0.292720) 27,37
78 78(1.000000) 78

48
Appendix F
Benchmarking of Inefficient Farms (Cost Efficiency)
DMU Benchmark (Lambda) Peer Group
1 63(1.000000) 63
2 63(1.000000) 63
3 63(1.000000) 63
4 63(1.000000) 63
5 63(1.000000) 63
6 63(1.000000) 63
7 63(1.000000) 63
8 63(1.000000) 63
9 63(1.000000) 63
10 63(1.000000) 63
11 63(1.000000) 63
12 63(1.000000) 63
13 63(1.000000) 63
14 63(1.000000) 63
15 63(1.000000) 63
16 63(1.000000) 63
17 63(1.000000) 63
18 63(1.000000) 63
19 63(1.000000) 63
20 63(1.000000) 63
21 63(1.000000) 63
22 63(1.000000) 63
23 63(1.000000) 63
24 63(0.7813), 70(0.2187) 63,70
25 63(1.000000) 63

49
DMU Benchmark (Lambda) Peer Group
26 63(1.000000) 63
27 63(0.52373), 70(0.47627) 63,70
28 63(1.000000) 63
29 63(1.000000) 63
30 63(1.000000) 63
31 63(1.000000) 63
32 63(1.000000) 63
33 63(1.000000) 63
34 63(1.000000) 63
35 63(0.76119), 70(0.23881) 63,70
36 63(1.000000) 63
37 63(1.000000) 63
38 63(0.21337), 70(0.78663) 63,70
39 63(1.000000) 63
40 63(1.000000) 63
41 63(1.000000) 63
42 63(1.000000) 63
43 63(1.000000) 63
44 63(0.74835), 70(0.25165) 63,70
45 63(1.000000) 63
46 63(1.000000) 63
47 63(1.000000) 63
48 63(1.000000) 63
49 63(0.90176), 70(0.098236) 63,70
50 63(1.000000) 63
51 63(1.000000) 63
52 63(1.000000) 63
53 63(1.000000) 63
54 63(1.000000) 63
55 63(1.000000) 63

50
DMU Benchmark (Lambda) Peer Group
56 63(1.000000) 63
57 63(0.89875), 70(0.10125) 63,70
58 63(0.592), 70(0.408) 63,70
59 63(0.43607), 70(0.56393) 63,70
60 63(0.76075), 70(0.23925) 63,70
61 63(1.000000) 63
62 63(0.98071), 70(0.019286) 63,70
63 63(1.000000) 63
64 63(1.000000) 63
65 63(1.000000) 63
66 63(1.000000) 63
67 63(1.000000) 63
68 63(1.000000) 63
69 63(0.56284), 70(0.43716) 63,70
70 70(1.000000) 70
71 63(1.000000) 63
72 63(1.000000) 63
73 63(1.000000) 63
74 63(1.000000) 63
75 63(1.000000) 63
76 63(1.000000) 63
77 63(1.000000) 63
78 63(0.40075), 70(0.59925) 63,70

51
Appendix G
Program Source-Code
1. Technical efficiency score model (TE): The source code of the technical efficiency
score model is divided into two sub-files which are model file and data file. The
source code is as follows.
1.1 Model file
{int} m=...;
{int} s=...;
{int} J=...;
float x[m][J]=...;
float y[s][J]=...;
int o=...;
dvar float+ weight[J];
dvar float+ Efficiency;
minimize Efficiency;
subject to{
forall( i in m)
ct1: sum (j in J)weight[j]*x[i][j]<=Efficiency*x[i][o];
forall( r in s)
sum (j in J)weight[j]*y[r][j]>=y[r][o];
sum (j in J)weight[j]==1;
}

52
1.2 Data file
o=1;
s={1};
SheetConnection sheet("CostData.xlsx");
//s from SheetRead(sheet,"ResultDATA3!B1:B1");
J from SheetRead(sheet,"3!A2:A79");
m from SheetRead(sheet,"3!C1:G1");
x from SheetRead(sheet,"3!C2:G79");
y from SheetRead(sheet,"3!B2:B79");
2. Cost efficiency score model: The source code of the cost efficiency score (CE) is as
follows.
2.1 Model file
{int} m=...;
{int} s=...;
{int} J=...;
float x[m][J]=...;
float y[s][J]=...;
int o=...;
dvar float+ expenditure[m];
dvar float+ weight[J];
minimize (sum(i in m) expenditure[i])/(sum( i in m)x[i][o]);
subject to{
forall( i in m)
sum (j in J)weight[j]*x[i][j]<=expenditure[i];
forall( r in s)
sum (j in J)weight[j]*y[r][j]>=y[r][o];
sum (j in J)weight[j]==1;
}

53
2.2 Data file
o=1;
s={1};
SheetConnection sheet("CostData.xlsx");
//s from SheetRead(sheet,"ResultDATA3!B1:B1");
J from SheetRead(sheet,"3!A2:A79");
m from SheetRead(sheet,"3!C1:G1");
x from SheetRead(sheet,"3!C2:G79");
y from SheetRead(sheet,"3!B2:B79");