efficient online evaluation of big data stream classifiers
TRANSCRIPT

Efficient Online Evaluation ofBig Data Stream Classifiers
Albert Bifet1, Gianmarco De Francisci Morales2,Jesse Read2, Geoff Holmes3, Bernhard Pfahringer3
1HUAWEI Noah’s Ark Lab, Hong Kong2Aalto University, Finland
3University of Waikato, Hamilton, New Zealand
KDD 2015Sydney, 11 August 2015

Evaluation of Data StreamsData Streams
• Sequence is potentially infinite
• High amount of data: sublinear space
• High speed of arrival: sublinear time per example
• Change over time
• Once an element from a data stream has been processedit is discarded or archived
Evaluation of Data Streams
• should provide• statistical guarantees• real-time estimation• evolving unbalanced data distribution
• should be used to compare new algorithms

Stream Classification Evaluation
Stream ClassificationJoao Gama, Raquel Sebastiao, Pedro Pereira Rodrigues: Onevaluating stream learning algorithms. Machine Learning90(3): 317-346 (2013)
ClassificationJanez Demsar: Statistical Comparisons of Classifiers overMultiple Data Sets. Journal of Machine Learning Research 7:1-30 (2006)

Problem Motivation 1
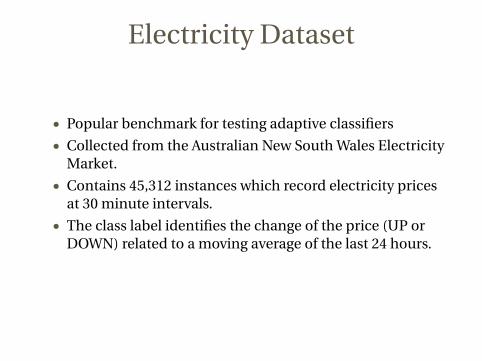
Electricity Dataset
• Popular benchmark for testing adaptive classifiers
• Collected from the Australian New South Wales ElectricityMarket.
• Contains 45,312 instances which record electricity pricesat 30 minute intervals.
• The class label identifies the change of the price (UP orDOWN) related to a moving average of the last 24 hours.

Electricity Dataset, Accuracy
0 1 2 3 4
·104
75
80
85
90
95
Time, instances
Acc
ura
cy,%
Classifier X Classifier Y
McNemar’s statistic test
McNemar’s statistic test is used in many data stream papers

Evaluation Example
AccuracyClassifier X 88.10%Classifier Y 85.71%

Evaluation Example
AccuracyClassifier X 88.10%Classifier Y 85.71%
The McNemar statistic (M ) is computed as
M = sign(a−b)× (a−b)2/(a+b)
a = number of examples where CX is right &CY is wrong
b = number of examples where CX is wrong &CY is right
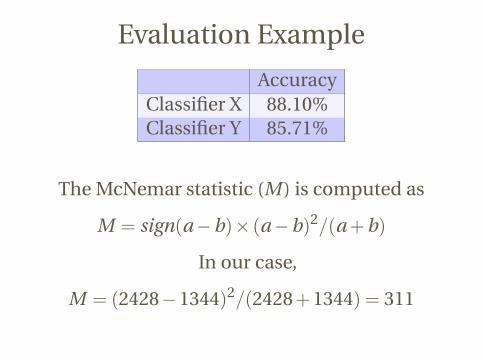
Evaluation Example
AccuracyClassifier X 88.10%Classifier Y 85.71%
The McNemar statistic (M ) is computed as
M = sign(a−b)× (a−b)2/(a+b)
In our case,
M = (2428−1344)2/(2428+1344) = 311

Evaluation Example
AccuracyClassifier X 88.10%Classifier Y 85.71%
There is statistical significance differencebetween the two classifiers

What is the problem?
Classifier X and Classifier Y are the same classifier (RandomForests) with different random seeds.

What is the problem?
Classifier X and Classifier Y are the same classifier (RandomForests) with different random seeds.
McNemar’s statistic test is NOT a good option for data streamclassifiers.

Electricity Dataset, McNemarStatistic
0 1 2 3 4
·104
0
100
200
300
Time, instances
McN
emar
Stat
isti
c
Classifier X - Classifier Y

Problem Motivation 2

Electricity Dataset, HoeffdingTree
0 1 2 3 4
·104
0
50
100
Time, examples
Ho
effd
ing
Tree
%
p0 accuracy κ statisticH harmonic accuracy

Electricity Dataset, MajorityClassifier
0 1 2 3 4
·104
0
20
40
60
80
100
Time, examples
Maj
ori
tyC
lass
%
p0 accuracy κ statisticH harmonic accuracy

Problem Motivation 3

Data Partition Strategy
When evaluating using several classifiers, ifthere is enough data available, should we splitthe data to train each classifier with differentexamples?
It seems that yes, since then training andtesting data will be completely independent

Proposal

Pipeline Evaluation
I1: Validation MethodologyI2: Statistical TestI3: Performance MeasureI4: Forgetting Mechanism

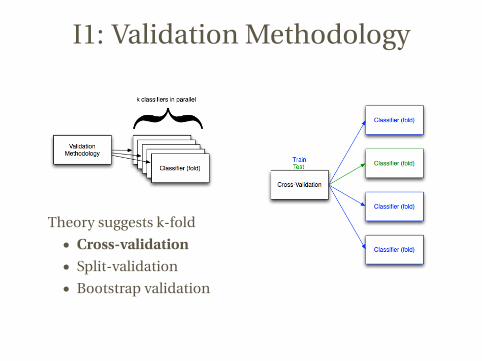
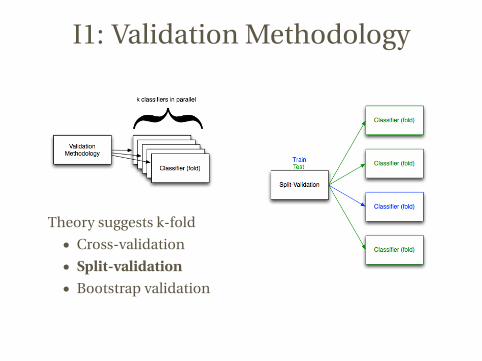
I1: Validation Methodology
Theory suggests k-fold
• Cross-validation
• Split-validation
• Bootstrap validation
I1: Validation Methodology
Theory suggests k-fold
• Cross-validation
• Split-validation
• Bootstrap validation
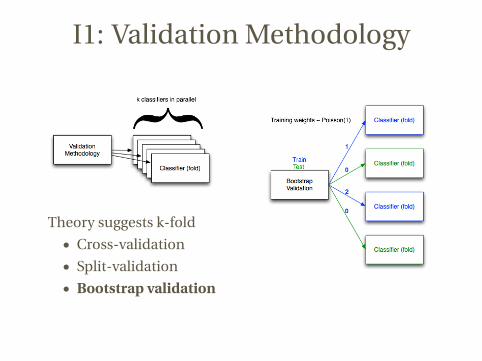
I1: Validation Methodology
Theory suggests k-fold
• Cross-validation
• Split-validation
• Bootstrap validation
I1: Validation Methodology
Theory suggests k-fold
• Cross-validation
• Split-validation
• Bootstrap validation

I2: Statistical Testing
• Often misunderstood, hard to do correctly• Non-parametric tests
• McNemar’s test• Wilcoxon’s signed-rank test• Sign test

I2: Statistical TestingWilcoxon’s signed-ranktest
• Fold as trial
• Rank absolute valueof performancedifference(ascending)
• Sum ranks ofdifferences withsame sign
• Compare minimumsum to critical value(z-score)
• H0 =⇒ W ∼Normal

I2: Statistical Testing
• Test for false positives• Randomized classifiers with different seeds (RF)
• Test for false negatives• Add random noise filter
p = p0× (1−pnoise)+(1−p0)×pnoise/c

I2: Statistical Testing
False Positives: Type I ErrorFalse Negatives: Type II Error

I3: Performance Measure
Kappa Statistic
• p0: classifier’s prequential accuracy
• pc : probability that a chance classifier makes a correctprediction.
• κ statisticκ =
p0−pc
1−pc
• κ = 1 if the classifier is always correct
• κ = 0 if the predictions coincide with the correct ones asoften as those of the chance classifier

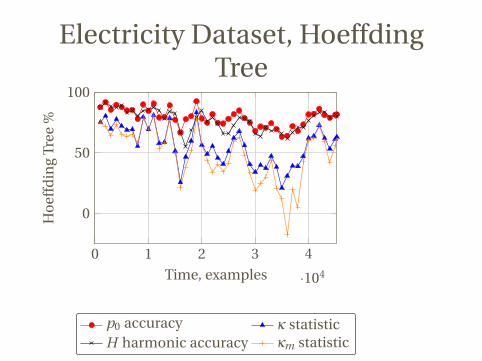
Electricity Dataset, HoeffdingTree
0 1 2 3 4
·104
0
50
100
Time, examples
Ho
effd
ing
Tree
%
p0 accuracy κ statisticH harmonic accuracy

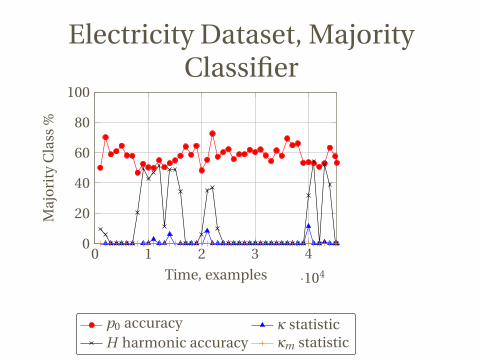
Electricity Dataset, MajorityClassifier
0 1 2 3 4
·104
0
20
40
60
80
100
Time, examples
Maj
ori
tyC
lass
%
p0 accuracy κ statisticH harmonic accuracy

I3: Performance Measure
κm Statistic
• p0: classifier’s prequential accuracy
• pe : majority classifier’s prequential accuracy
• κm statistic
κm =p0−pe
1−pe
• κm = 1 if the classifier is always correct
• κm = 0 if the predictions coincide with the correct ones asoften as those of the majority class classifier
Electricity Dataset, HoeffdingTree
0 1 2 3 4
·104
0
50
100
Time, examples
Ho
effd
ing
Tree
%
p0 accuracy κ statisticH harmonic accuracy κm statistic
Electricity Dataset, MajorityClassifier
0 1 2 3 4
·104
0
20
40
60
80
100
Time, examples
Maj
ori
tyC
lass
%
p0 accuracy κ statisticH harmonic accuracy κm statistic

I4: Forgetting Mechanism
0 0.2 0.4 0.6 0.8 1
·106
20
40
60
80
Time, instances
Ho
effd
ing
Tree
%
Hold-out

I4: Forgetting Mechanism
0 0.2 0.4 0.6 0.8 1
·106
20
40
60
80
Time, instances
Ho
effd
ing
Tree
%
Hold-out Window 100
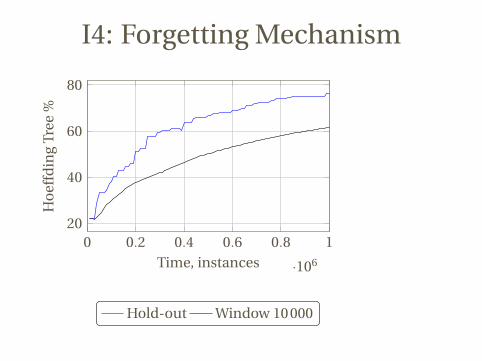
I4: Forgetting Mechanism
0 0.2 0.4 0.6 0.8 1
·106
20
40
60
80
Time, instances
Ho
effd
ing
Tree
%
Hold-out Window 10000

I4: Forgetting Mechanism
0 0.2 0.4 0.6 0.8 1
·106
20
40
60
80
Time, instances
Ho
effd
ing
Tree
%
Hold-out ADWIN
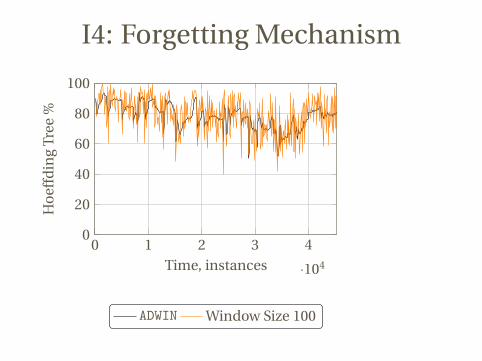
I4: Forgetting Mechanism
0 1 2 3 4
·104
0
20
40
60
80
100
Time, instances
Ho
effd
ing
Tree
%
ADWIN Window Size 100

I4: Forgetting Mechanism
0 1 2 3 4
·104
0
20
40
60
80
100
Time, instances
Ho
effd
ing
Tree
%
ADWIN Window Size 1000Window Size 10000

Conclusions
New Distributed Methodology
• I1: Validation Methodology: prequential k-folddistributed bootstrap or cross-validation
• I2: Statistical Test: Wilcoxon’s signed ranked test
• I3: Performance Measure: κm Statistic
• I4: Forgetting Mechanism: ADWIN Prequential Evaluation
Available in Apache SAMOA (runs on Apache Flink, Storm,Samza, S4)

Thanks!
Efficient Online Evaluation of Big Data StreamClassifiers