efore annual general meeting · ericsson best in class supplier national instruments 2013 2014 2015...
TRANSCRIPT


Efore Annual General Meeting March 30, 2016

Review by the CEO Heikki Viika
EFORE overview

EFORE – The trusted power partner
Efore Plc is an international group specialised in design, development and production of demanding power products.
Efore designs and manufactures cutting edge power conversion products; that offer superior energy efficiency, reliability, more intelligent designs, flexibility and creativity for the telecommunications including networks and broadcasting, industrial, medical, LED lighting and transportation markets.
Efore competences and know-how are embodied in the solutions we provide to our customers: high efficiency and high reliability.
• Net Sales 89,9M € (2015) • 737 employees (end 2015) • Established in 1975 • 2700 shareholders (end 2015) • Quoted on Nasdaq Helsinki
Key facts
Major shareholders * % of shares
1 Sievi Capital Oyj 21,8
2 Evli Pankki Oyj 9,4
3 Efore Oyj 6,3
4 Danske Bank Plc (Nom. reg.) 5,0
5 Jussi Invest Oy 3,4
6 Nordea Bank Finland Plc (Nom. reg.) 3,3
7 Tammivuori Leena 3,1
8 Rausanne Oy 2,9
9 Ilmarinen 2,8
10 Ulkomarkkinat Oy 2,0
* Status Feb. 29, 2016
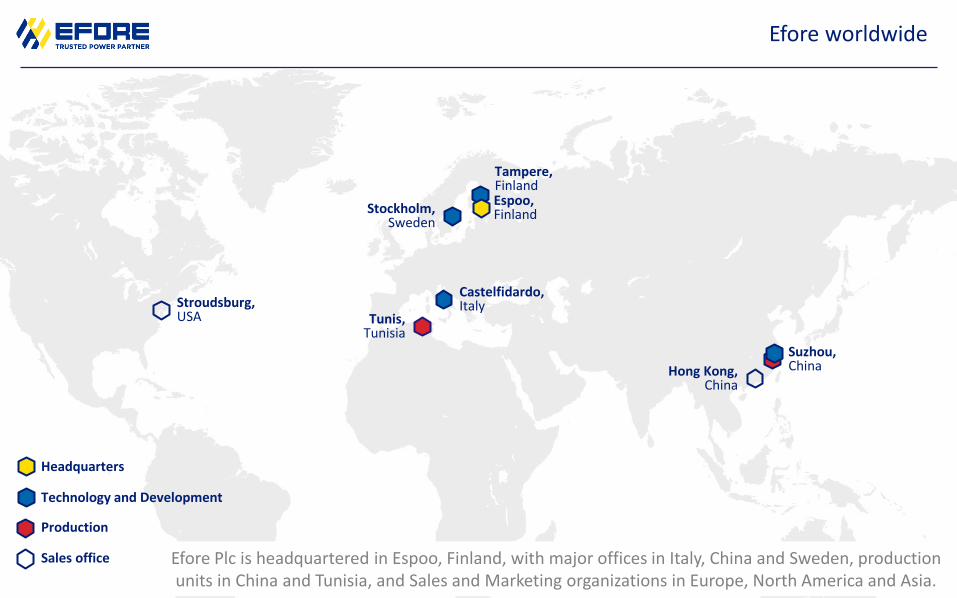
Efore worldwide
Efore Plc is headquartered in Espoo, Finland, with major offices in Italy, China and Sweden, production units in China and Tunisia, and Sales and Marketing organizations in Europe, North America and Asia.
Technology and Development
Production
Headquarters
Sales office
Espoo, Finland Stockholm,
Sweden
Castelfidardo, Italy
Tunis, Tunisia
Stroudsburg, USA
Hong Kong, China
Tampere, Finland
Suzhou, China

Industry leading customers globally recognize EFORE Group as a reliable and trusted partner for their power supply applications.
We’re proud of our worldwide customers
DEFENCE INDUSTRIAL DC SYSTEM
DIGITAL POWER TELECOM
LIGHTING
MEDICAL HOUSEHOLD APPLIANCES

Awarded supplier
SUPPLIER OF THE YEAR ABB Substation Automation Products
SUPPLIER OF THE YEAR Ericsson
BEST IN CLASS SUPPLIER National Instruments
2013 2014 2015
SUPPLIER OF THE YEAR &
BEST IN CLASS SUPPLIER National Instruments

Financial statements 2015

Financial development in 2015 did not meet the expectations
Key indicators, EUR million FY/2015 FY/2014
Net sales 89,9 85,3
- Telecommunication sector 44,8 46,0
- Industrial sector 45,1 39,3
Results from operating activities without one-time items -1,6 0,1
Results from operating activities -2,0 -2,0
Results before taxes -3,3 -3,1
Net result -3,4 -2,6
Return on equity (ROE), % -16,8 -11,8
Return on investment (ROI), % -9,2 -6,7
Earnings per share, EUR -0,07 -0,05
Solvency ratio, % 34,2 38,1
Gearing, % 24,5 9,0
Cash flow from business operations 1,8 3,8
Share price on Dec. 31, 2015 0,77 0,81
Market capitalization on Dec. 31, 2015 40,2 42,3
Personnel, average 887 914
53,9 % 46,1 %
49,8 % 50,2 %
Telecommunication Industrial
2015
FY 2015 (2014) Net sales by sector
41,6 %
27,2 %
15,1 %
16,1 %
49,0 %
26,0 %
14,0 %
11,0 %
EMEA APAC Americas Finland
FY2015 (2014) Net sales by region*
2015

Despite the poor financial performance a good progress was made in several areas
• Net sales increased 5.4% year-on-year despite the decline of the telecommunication sector.
• The Industrial sector growth trend continued throughout the whole year.
• The new strategy focusing on being The Trusted Power Partner was published.
• The partner network was strengthened with several new sales representative firms and distributors in the U.S.A and in Europe.
• The company structure was streamlined and the organization was flattened to support more efficiently the Group’s strategic and financial targets.
• A great number of R&D investments were made in the development of future products
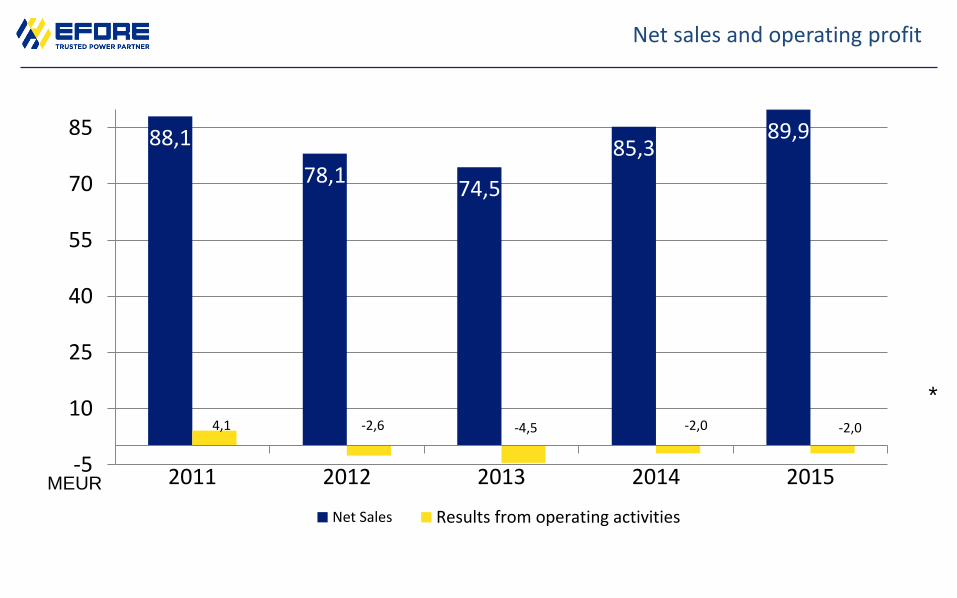
Net sales and operating profit
88,1
78,1 74,5
85,3 89,9
-5
10
25
40
55
70
85
2011 2012 2013 2014 2015
Net Sales Results from operating activities
4,1 -2,6 -4,5 -2,0 -2,0
MEUR
*

Net Sales and EBIT in 2015
10,4 11,6 10,9 12,1
13,1
12,1 12,0 7,7
0,7
0 0
-2,3 -2,5
-2
-1,5
-1
-0,5
0
0,5
1
0
5
10
15
20
25
Q1/2015 Q2/2015 Q3/2015 Q4/2015
Telecom
Industrial
EBIT
MEUR MEUR
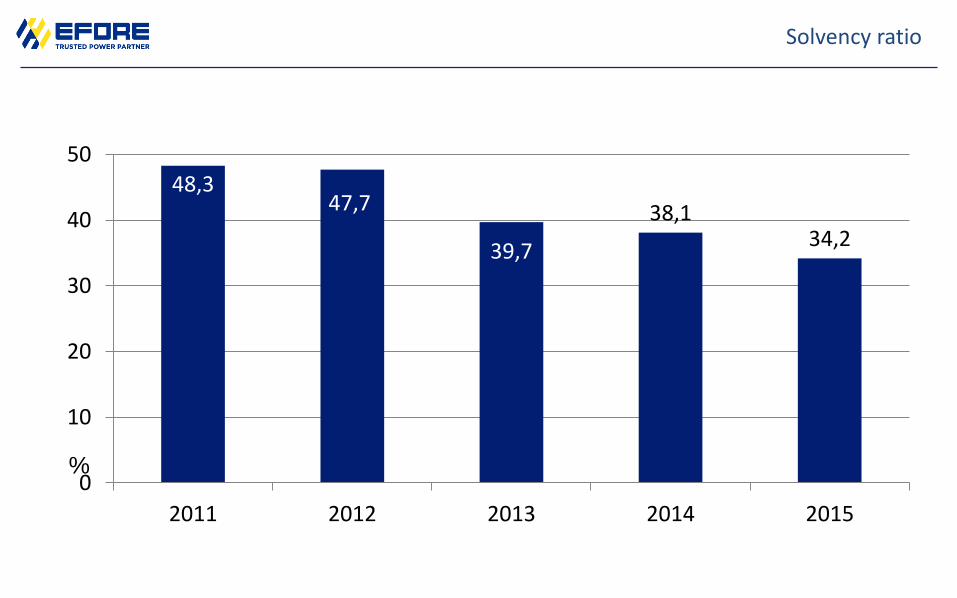
Solvency ratio
48,3 47,7
39,7
38,1 34,2
0
10
20
30
40
50
2011 2012 2013 2014 2015
%
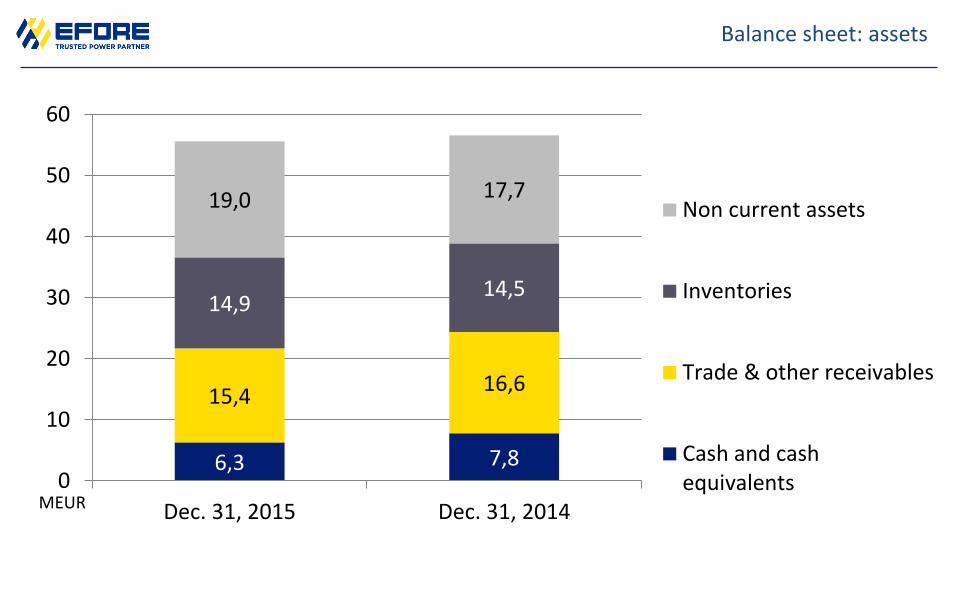
Balance sheet: assets
6,3 7,8
15,4 16,6
14,9 14,5
19,0 17,7
0
10
20
30
40
50
60
Dec. 31, 2015 Dec. 31, 2014
Non current assets
Inventories
Trade & other receivables
Cash and cashequivalents
MEUR
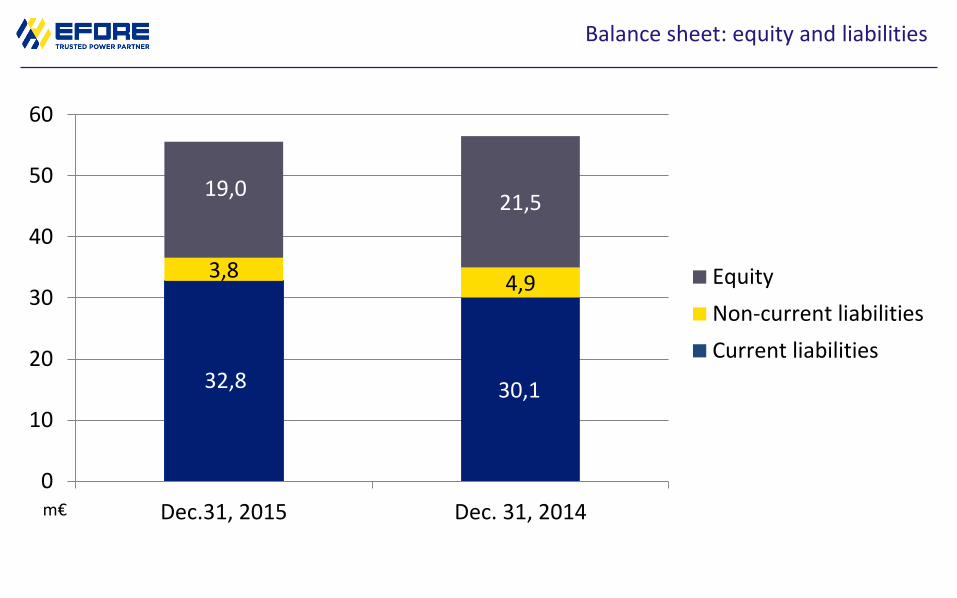
Balance sheet: equity and liabilities
32,8 30,1
3,8 4,9
19,0
21,5
0
10
20
30
40
50
60
Dec.31, 2015 Dec. 31, 2014
Equity
Non-current liabilities
Current liabilities
m€

Personnel by geographical area
694 714 568 616
415
213 90 358
352
315
9 8
7
0
200
400
600
800
1000
1200
2011 2012 2013 2014 2015
America
EMEA
APAC
Status on Dec. 31, 2015

Strategic plan 2015 - 2018

Efore strategy in a nutshell
Eval
uat
ion
TECHNOLOGY TRENDS
MARKET INTELLIGENCE
PRODUCT ROADMAP
GO-TO- MARKET
STRATEGY
Alig
nm
ent
CUSTOMER FOOTPRINT
MARKET NEEDS
EFORE STRUCTURE
COMPETENCY ALIGNMENT
Solution driven – we focus to fulfil our customers’ needs at high pace (TTM)
Cost efficiency – we provide our products and services cost efficiently (TCO)
Customer intimacy – we are approachable at all levels, from individual to individual
Reliability – our product lasts longer and our delivery is on time

Merchant power supply market
Source: Global Switching Power Supply Industry, Market Analysis, Micro-Tech Consultants
19942 20239 20467 20711
0
5000
10000
15000
20000
25000
2016 2017 2018 2019
Military and aerospace
Transportation
Medical
Industrial andInstrumentation
Networking/telecom/equipment
Computer/office/equipment
Consumer/retail/equipment
LED Lighting
m$
19943 20239 20467 20712
0
5000
10000
15000
20000
25000
2016 2017 2018 2019
Modified &CustomizedStandard
Standard
m$
20

Competitive landscape - Current strengths/weaknesses Efore vs. competitors
• Our competitors have the following main advantages due to their larger size
– Well recognized brand
– Larger standard product offering,
– Geographic proximity with the customer base (office locations and bigger sales force)
– Scale of new product development
– Economy of scale due to very large volume
BUT
• Same customers are concerned about their dimension especially when the power spend is not big enough to receive the highest level of attention, flexibility and service
• We know how to reach the highest level on Intimacy with our Tier 1 customers
• In 2013, 2014 and 2015 we have been awarded as ”Supplier of the year” from ABB, Ericsson and National Instrument and the selection provided the following motivation:
– Superior quality,
– Lower than average cost of doing business (TCO)
– On time delivery
– Technology Added Value for their final products to guarantee our customer’ customers satisfaction
• Long term business with our customers is a clear representation of the HIGH RETURN OF INTIMACY (RofI)
Competitors EFORE
Our customers trust Efore

Standard & custom strategy
EFORE is a power supply design and manufacturing company that is serving both custom and standard
markets.
Working with both business models EFORE will:
1. Use the standard platform as a starting point for customization
2. Mitigate the payback risk of R&D investments by developing new features for custom products
Custom specifications Non-recurring cost
contribution Specific custom volume
Tier1 Competitor Direct
Single market destination
CUSTOM Benchmark market
performances Own development costs Broader customer base
Wide competition Distribution
Multiple market destination
STANDARD
Customization/ Standardization

Strategic plan 2015 – 2018
Main actions in 2015
• Contracts signed with four sales agency chains to strengthen sales force in USA
• New dual dimming LED driver series CIELO launched
• Quick S.p.A. selected Efore Plc's Italian subsidiary to jointly develop a LED luminaire for marine and industry applications
• National Instruments awarded Efore’s Italian subsidiary again
– This was the fourth time ROAL was awarded by National Instruments after after
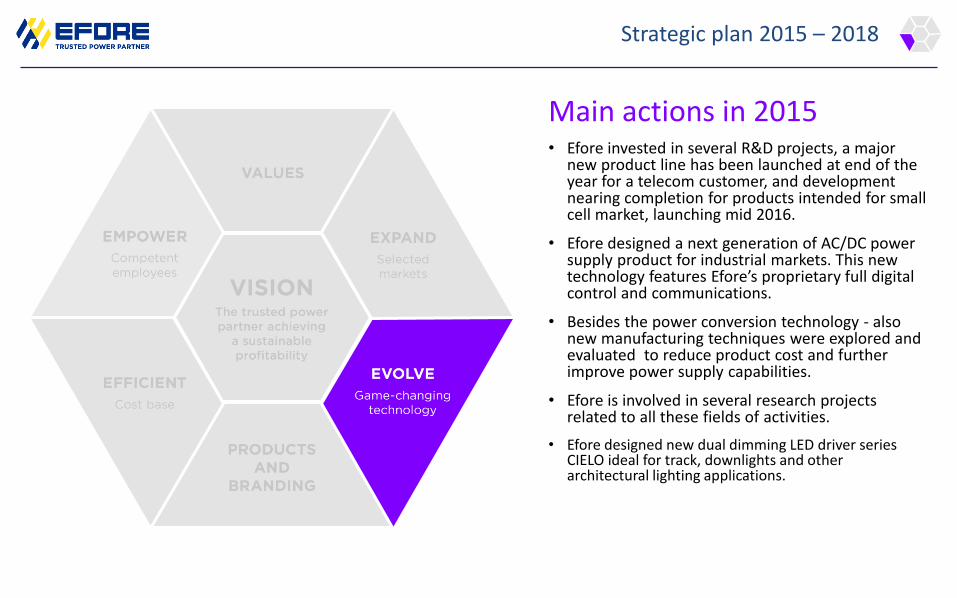
Strategic plan 2015 – 2018
Main actions in 2015 • Efore invested in several R&D projects, a major
new product line has been launched at end of the year for a telecom customer, and development nearing completion for products intended for small cell market, launching mid 2016.
• Efore designed a next generation of AC/DC power supply product for industrial markets. This new technology features Efore’s proprietary full digital control and communications.
• Besides the power conversion technology - also new manufacturing techniques were explored and evaluated to reduce product cost and further improve power supply capabilities.
• Efore is involved in several research projects related to all these fields of activities.
• Efore designed new dual dimming LED driver series CIELO ideal for track, downlights and other architectural lighting applications.
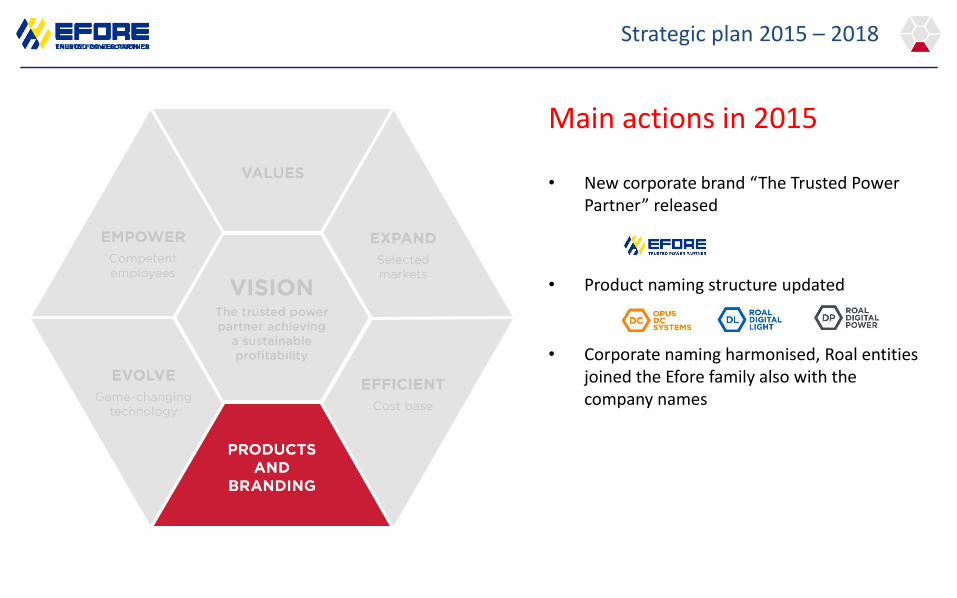
Strategic plan 2015 – 2018
Main actions in 2015
• New corporate brand “The Trusted Power Partner” released
• Product naming structure updated
• Corporate naming harmonised, Roal entities joined the Efore family also with the company names
Strategic plan 2015 – 2018
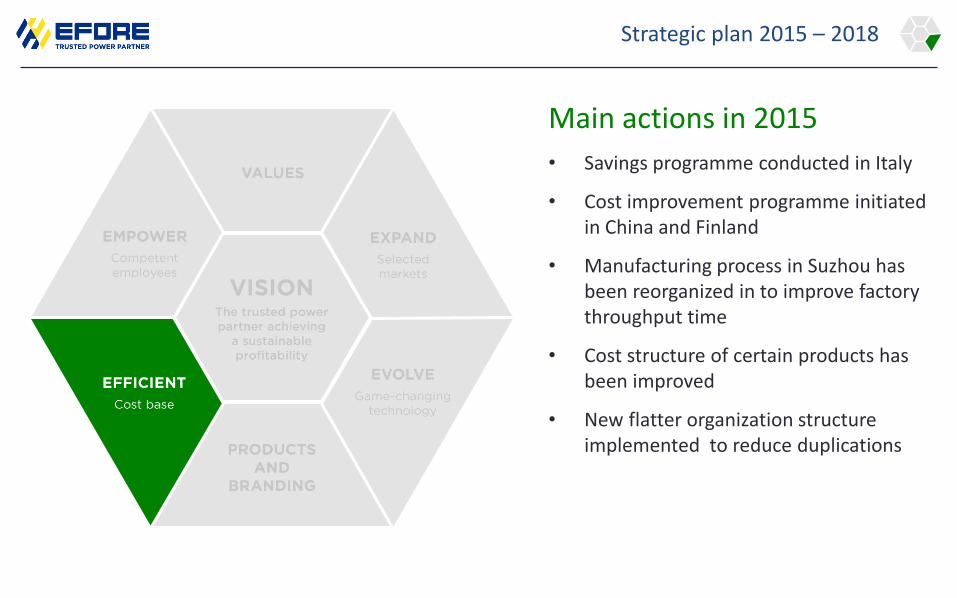
Main actions in 2015
• Savings programme conducted in Italy
• Cost improvement programme initiated in China and Finland
• Manufacturing process in Suzhou has been reorganized in to improve factory throughput time
• Cost structure of certain products has been improved
• New flatter organization structure implemented to reduce duplications

Changes in ownership, Suzhou plant
As an important step of creating a cost
efficient manufacturing platform Efore is
evaluating a possibility to sell out its
Suzhou factory to an external company.
A The plan is that manufacturing will continue as
such but owned and managed by the chosen
company. This company will act as Efore’s
trusted supplier for products manufactured in
Suzhou plant.
B
Efore will have an office in Suzhou taking care of R&D
activities, NPI activities as well as of the daily supply/
manufacturing activities. Efore will remain as the
supplier to its customers.
C The new owner shall have a strategy to
further develop the production site to be
a modern , competitive and high quality
production plant.
D
With this action Efore can release needed capital
to invest in its core capabilities. E Efore will invest in capabilities to further improve its competitiveness and time to
market in product development

Background to strategic action
Taking this action will allow us to take a leap forward
Ability to invest in Efore Core Competencies and to improve the time to market
• Global Product management
• Global Sales
• Technology
• Product Development
• Production Engineering team in Suzhou
• NPI
• Dedicated team in Suzhou supporting EMS
• Tunisia NPI factory
Securing Cost Competiveness also in the long run
• Utilization rate of production line
• Modernization of manufacturing technology
• Yield/Quality
• Concern of China cost level
• Maintain cost leverage
• EMS 2nd Sourcing to maintain cost pressure
• Component Supplier leverage through EMS partner volume
Securing our ability to supply reliably
• Capability to meet the demand
• Manage EMS locally in China
• Quality resouces near supplier
• Flexibility and Agreements
• Inhouse mfg
• Second Source
• Contractual agreements with main suppliers
• Recovery Management

Strategic plan 2015 – 2018
Main actions in 2015
• Organization was renewed to correspond to the business structure
• The head of both HR and Quality functions were included in the Executive Management Team
• Strategic actions are being cascaded throughout the organisation as personal targets
• Senior level succession planning for first two levels has been implemented

Conclusions
An updated vision for the company: The trusted power partner
• Four strategic cornerstones encapsulate the strategy
• Growth is aimed through
– Securing current large accounts at current high level or increasing the volumes
– Capturing selected new major accounts through planned approach
– Opening new sales channels including Internet
– Bringing new technologies to the market
• Improvements in profitability to reach 10% EBIT by end of
planning period are aimed through optimising overhead costs,
efficiency improvements in manufacturing and product
development, and ensuring a competitive materials cost base
• We are aiming at energising the company through
management commitment to leadership, empowering our
employees and ensuring we have the right competencies and
rewards system for the future

• Detailed information on annual accounts can be found in Annual Report 2015
- Group level from page 19
- Parent company from page 53
- Auditor’s report from page 73

Financial estimate for 2016
• The Company estimates its net sales of financial year 2016 to be higher than 2015, and the results from operating activities without one-time items to be positive.
• The estimate of the development of Efore's net sales and results from operating activities is based on current business structure as well as partly on forecasts and delivery plans received from the customers.

Thank you for your attention
HEIKKI VIIKA