efore oyj · npi support model to be defined by end of q4 2015. 3 we will review manufacturing...
TRANSCRIPT


EFORE Oyj Capital Markets Day
November 4, 2015
2

Disclaimer
• This document contains statements related to our future business and financial performance and future events or developments involving Efore that may constitute forward-looking statements. Such statements are based on the current expectations and certain assumptions of Efore's management, of which many are beyond Efore’s control. These are subject to a number of risks, uncertainties and factors, including, but not limited to those described in disclosures, in particular in the Risk Management section of the Efore website. Should one or more of these risks or uncertainties materialize, or should underlying expectations not occur or assumptions prove incorrect, actual results, performance or achievements of Efore may (negatively or positively) vary materially from those described explicitly or implicitly in the relevant forward-looking statement. Efore neither intends, nor assumes any obligation, to update or revise these forward-looking statements in light of developments which differ from those anticipated
• Forward-looking statements are any statements that are not historical facts. These statements are based on current decisions and plans and currently known factors.
• If any portion of this presentation is rebroadcast, retransmitted or redistributed at a later date, Efore will not be reviewing or updating the material that is contained herein.
4.11.2015 3

Agenda
4.11.2015 4
Markets and technology 4 Alessandro Leopardi Massimo Speciale
CEO introduction and welcome 1 Heikki Viika
EFORE overview 2 Heikki Viika
Financial situation and outlook 5 Riitta Järnstedt
Lunch 11:30 7
Strategic plan 2015 - 2018 3 Heikki Viika
Summary 6 Heikki Viika

EFORE overview
Heikki Viika, CEO
4.11.2015 5
EFORE – The trusted power partner
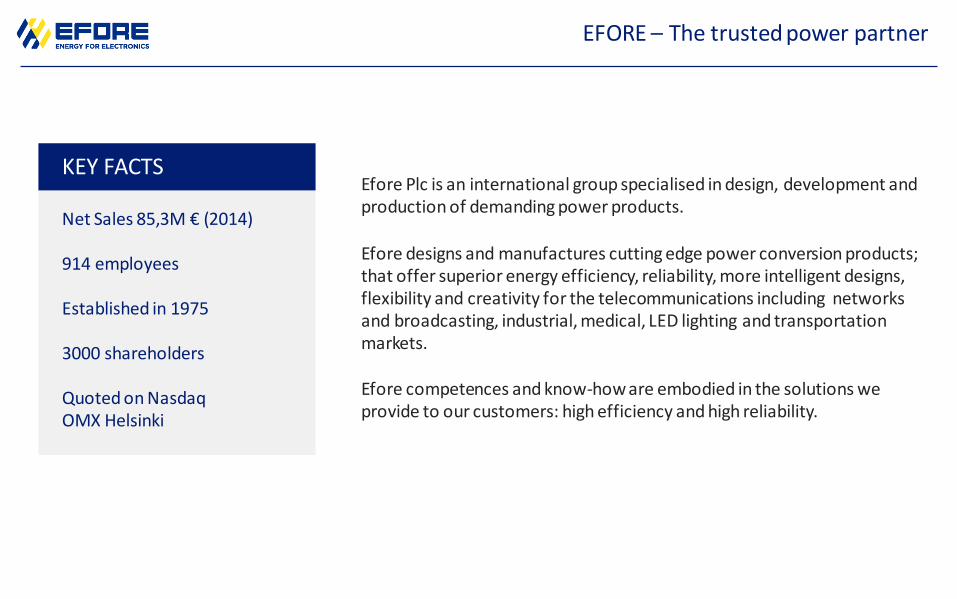
Efore Plc is an international group specialised in design, development and production of demanding power products.
Efore designs and manufactures cutting edge power conversion products; that offer superior energy efficiency, reliability, more intelligent designs, flexibility and creativity for the telecommunications including networks and broadcasting, industrial, medical, LED lighting and transportation markets.
Efore competences and know-how are embodied in the solutions we provide to our customers: high efficiency and high reliability.
Net Sales 85,3M € (2014) 914 employees Established in 1975 3000 shareholders Quoted on Nasdaq OMX Helsinki
KEY FACTS

Efore worldwide
Efore Plc is headquartered in Espoo, Finland, with major offices in Italy, China and Sweden, production units in China and Tunisia, and Sales and Marketing organizations in Europe, North America and Asia.
Technology and Development
Production
Headquarters
Sales office
Espoo, Finland Stockholm,
Sweden
Castelfidardo, Italy
Tunis, Tunisia
Stroudsburg, USA
Hong Kong, China
Tampere, Finland
Suzhou, China

Industry leading customers globally recognize EFORE Group as a reliable and trusted partner for their power supply applications.
We’re proud of our worldwide customers
DEFENCE INDUSTRIAL DC SYSTEM
DIGITAL POWER TELECOM
LIGHTING
MEDICAL HOUSEHOLD APPLIANCES
4.11.2015 8

Strategic plan 2015 - 2018
Heikki Viika, CEO
4.11.2015 9

Efore mission and vision
4.11.2015 10
EFORE mission and vision
Mission
• Saving energy with efficiency
Vision
• We endeavour to be the trusted power partner
• We deliver reliable products
• We delivery reliably
• Our customers can trust us to fulfill their needs.
• We achieve a sustainable profitability

Strategic plan 2015 – 2018
4.11.2015 11
Our values are
• Customer intimacy – we are approachable at all levels, from individual to individual
• Reliability – our product lasts longer and our delivery is on time
• Solution driven – we focus to fulfil our customers’ needs at high pace (TTM)
• Cost efficiency – we provide our products and services cost efficiently (TCO)

Strategic plan 2015 – 2018
4.11.2015 12
Products and branding
• We have a strong product base
• Clear branding strategy agreed
• Alignment of brand image to business strategy
• Clarity of product naming principles
• Stronger market communication

Brand naming structure
Our brand promise is:
The trusted power partner delivering reliable products, with reliable delivery.
Our customers can trust us to fulfil their needs.
EFORE CORPORATE BRAND
PRODUCT SEGMENTS
PRODUCT FAMILIES
* OPUS to be confirmed as DC systems family branding
*

Efore digital footprint
4.11.2015 14
Efore digital footprint enhancement:
Increased visibility on the internet and social media
ON-LINE INTERACTIVE
PRODUCT CATALOGUE NEW WEBSITE
COMMUNICATION
THROUGH SOCIAL MEDIA

Strategic plan 2015 – 2018
4.11.2015 15
Strategic Priorities 2015 – 2018
• Focus on target markets for correctly directing efforts to right segments & customers through well considered channels
• Review products and services in conjunction with the target market review
• Review processes and IT infrastructure to support the strategy
• Review group structure for cost improvement
• Develop hybrid manufacturing model and review long term strategy in parallel to ensure flexibility
• Secure quality awareness to drive reliable operation
• Organization development, right competences for future growth

Linking action to strategy
Alignment
CUSTOMER FOOTPRINT
MARKET NEEDS
EFORE STRUCTURE
COMPETENCY ALIGNMENT
4.11.2015 16
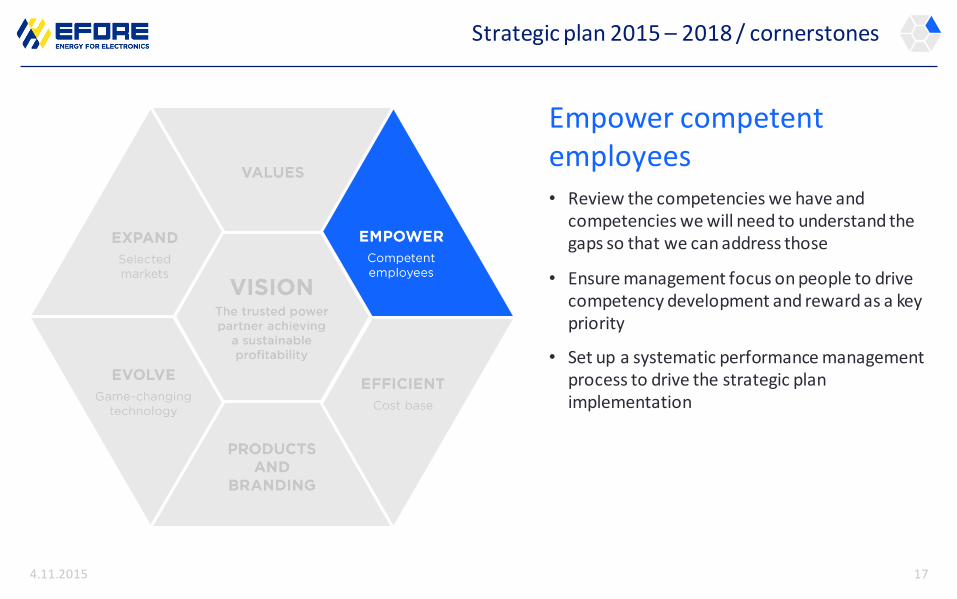
Strategic plan 2015 – 2018 / cornerstones
4.11.2015 17
Empower competent employees • Review the competencies we have and
competencies we will need to understand the gaps so that we can address those
• Ensure management focus on people to drive competency development and reward as a key priority
• Set up a systematic performance management process to drive the strategic plan implementation

Establish a proactive HR focus to drive development of the organisation and competencies within Efore
HR as a driver for strategic
realignment of the company
Organizational planning, talent development and succession plans
Establish a competency model, assess main competency gaps and prepare an action plan to fill the critical gaps
Set up a systematic performance management process and a rewards/compensation system
Set up recognition and development of High Potential employees
Teach the organisation again to cherish success through
celebrating good achievements
Bring in young blood through a graduate programme in
cooperation with local universities
4.11.2015 18

Strategic plan 2015 – 2018 / cornerstones
4.11.2015 19
Efficient cost base • Optimise overhead costs
• Improve operational speed & efficiency
• Ensure cost efficient manufacturing footprint, revise manufacturing long term strategy
• Review make/buy decisions and models
• Establish an ICT infrastructure that drives efficiency in organisation, harmonisation of ICT

President and CEO
Heikki Viika
Group Finance and
Administration
Riitta Järnstedt
Sales and
Marketing Alessandro Leopardi
Manufacturing John Cahill
Global Sourcing & Procurement
Ruben Tomassoni
Technology and Development
Markku Kukkonen (acting)
Quality and
Environment Markku Kukkonen
Human Resources Alexander Luiga
Communications Sari Jaulas Group EMT
Members
New organisation
• New organisation launched 7th September
• The new organisation flattens the structure by removing a layer through integration of the business units, all positions staffed internally with one exception
4.11.2015 20
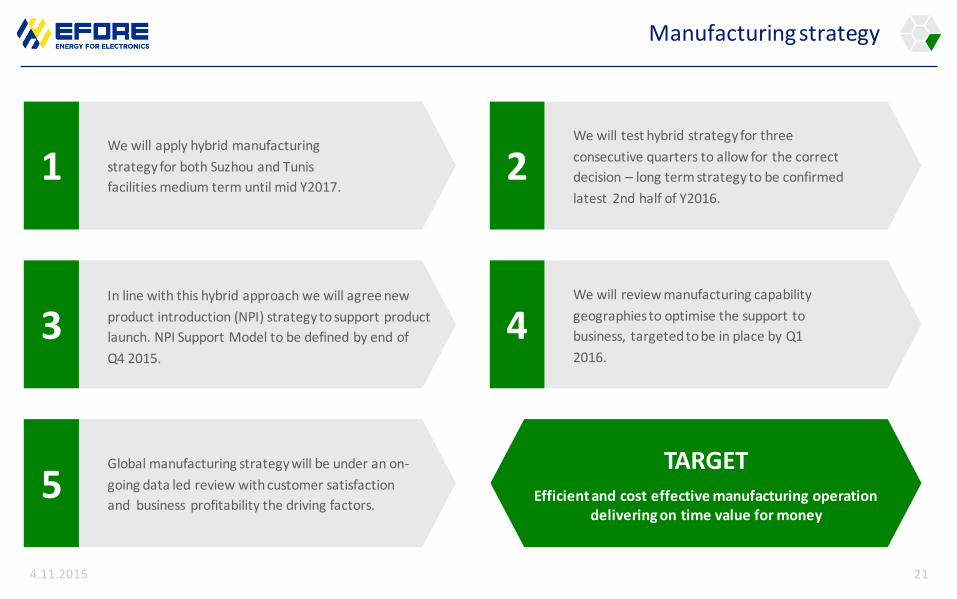
Manufacturing strategy
We will apply hybrid manufacturing
strategy for both Suzhou and Tunis
facilities medium term until mid Y2017. 1
We will test hybrid strategy for three
consecutive quarters to allow for the correct
decision – long term strategy to be confirmed
latest 2nd half of Y2016.
2
In line with this hybrid approach we will agree new
product introduction (NPI) strategy to support product
launch. NPI Support Model to be defined by end of
Q4 2015.
3 We will review manufacturing capability
geographies to optimise the support to
business, targeted to be in place by Q1
2016.
4
Global manufacturing strategy will be under an on-
going data led review with customer satisfaction
and business profitability the driving factors. 5
TARGET Efficient and cost effective manufacturing operation
delivering on time value for money
4.11.2015 21

Efore quality excellence roadmap
4.11.2015 22
Optimize
quality
cost
Implement
unified
management
system
Achieve level of
excellence in key
customers’
perception
Improve
quality
management
TARGET World class power
products provider in quality and
environmental aspects

Strategic plan 2015 – 2018 / cornerstones
4.11.2015 23
Evolve game-changing technology • Review products and services to be offered in
the various target markets
• Focus on developing products in the demanding high reliability – high dependability end of market
• Ensure the base technology and platform developments can be utilized across a broad customer base

Strategic plan 2015 – 2018 / cornerstones
4.11.2015 24
Expand on selected markets
• Increase focus on being a full service provider and winning design decisions.
• Focus improving customer intimacy and establish the right sales competencies.
• Maintain existing Tier 1 customers with high focus on securing satisfaction, and target selected new customers.

Markets and technology
Alessandro Leopardi, EVP, Sales and Marketing
Massimo Speciale, Director Product Development
4.11.2015 25
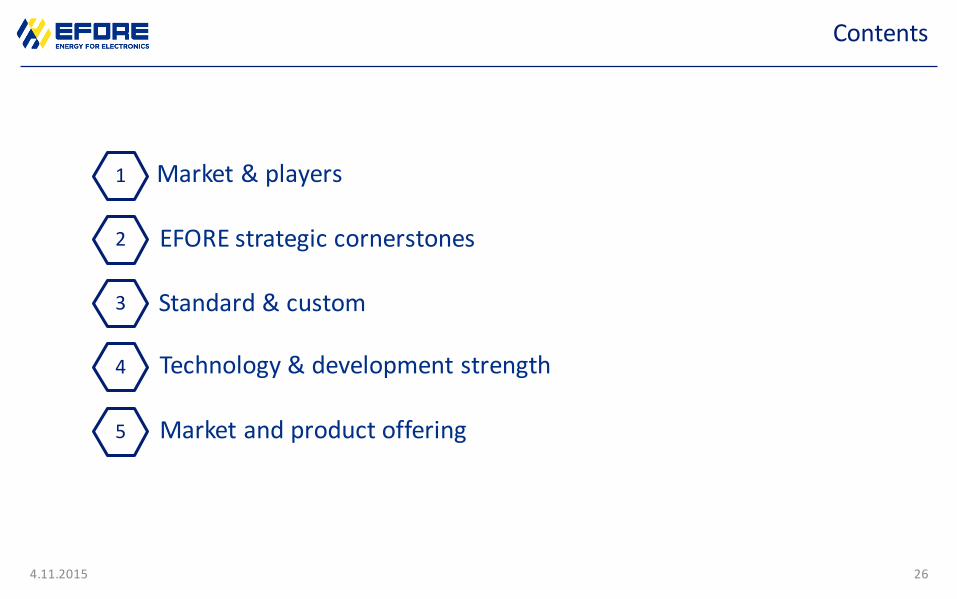
Contents
4.11.2015 26
Market & players 1
EFORE strategic cornerstones 2
Standard & custom 3
Technology & development strength 4
Market and product offering 5

Merchant power supply market
Source: Global Switching Power Supply Industry, Market Analysis, Micro-Tech Consultants
m$
19262 19610 19942 20239 20467 20711
0
5000
10000
15000
20000
25000
2014 2015 2016 2017 2018 2019
Military and aerospace
Transportation
Medical
Industrial andInstrumentation
Networking/telecom/equipment
Computer/office/equipment
Consumer/retail/equipment
LED Lighting
19259 19609 19943 20239 20467 20712
0
5000
10000
15000
20000
25000
2014 2015 2016 2017 2018 2019
Modified &CustomizedStandard
Standard
m$
4.11.2015 27

Top 10 power players and M&A impact
No PS Manufactures Sales m$ Market Share
1 Delta Electronics 3680 18,4%
2 Emerson Network Power 1470 7,3%
3 Lite On technology 1450 7,2%
4 Flextronics 850 4,2%
5 Chicony Power 800 4,0%
6 TDK-Lambda 670 3,3%
7 Murata 650 3,2%
8 FSP Group 645 3,2%
9 AcBel Polytech Inc 644 3,2%
10 Phihong 490 2,4%
2011 2014
No PS Manufactures Sales m$ Market Share
1 Delta Electronics 3741 17,1%
2 Lite On technology 1610 7,3%
3 Artesyn Embedded Tech 1000 4,6%
4 Chicony Power 880 4,0%
5 Salcomp 762 3,5%
6 Flextronics 750 3,4%
7 AcBel Polytech Inc 728 3,3%
8 Mean Well 656 3,0%
9 FSP Group 567 2,6%
10 TDK-Lambda 525 2,4%
4.11.2015 28
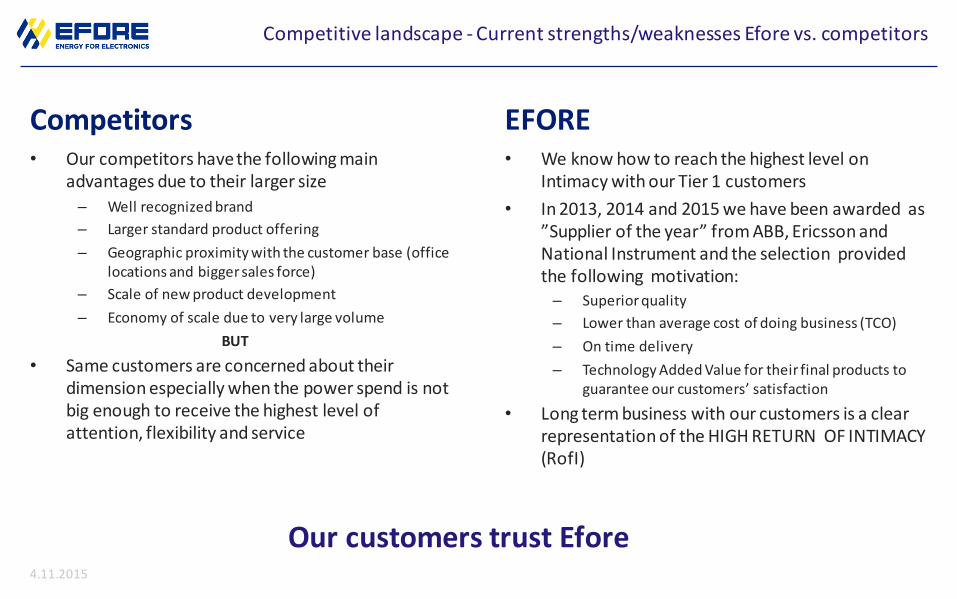
Competitive landscape - Current strengths/weaknesses Efore vs. competitors
• Our competitors have the following main advantages due to their larger size
– Well recognized brand
– Larger standard product offering
– Geographic proximity with the customer base (office locations and bigger sales force)
– Scale of new product development
– Economy of scale due to very large volume
BUT
• Same customers are concerned about their dimension especially when the power spend is not big enough to receive the highest level of attention, flexibility and service
• We know how to reach the highest level on Intimacy with our Tier 1 customers
• In 2013, 2014 and 2015 we have been awarded as ”Supplier of the year” from ABB, Ericsson and National Instrument and the selection provided the following motivation: – Superior quality
– Lower than average cost of doing business (TCO)
– On time delivery
– Technology Added Value for their final products to guarantee our customers’ satisfaction
• Long term business with our customers is a clear representation of the HIGH RETURN OF INTIMACY (RofI)
Competitors EFORE
Our customers trust Efore 4.11.2015

Awarded supplier
SUPPLIER OF THE YEAR ABB Substation Automation Products
SUPPLIER OF THE YEAR Ericsson
BEST IN CLASS SUPPLIER National Instruments
30
2013 2014 2015
SUPPLIER OF THE YEAR &
BEST IN CLASS SUPPLIER National Instruments
4.11.2015

Linking action to strategy
Evaluation
TECHNOLOGY TRENDS
MARKET INTELLIGENCE
PRODUCT ROADMAP
GO-TO- MARKET
STRATEGY
4.11.2015 31

Increasing service business
4.11.2015 32
Increase complete power system sales
This allows offering also complete servicing package with annual maintenance and spare part / parts renewal agreement so the customer can secure power to their critical services, e.g., telecom, hospitals, utilities.
This means we establish long term customer value creation.
Increase solutions sales Offer Services to support the customer long term
Leverage long term presence to achieve repeat business for
renewals
Grow profitability through higher system margins
Opus family of DC systems New generation power systems
Build service capabilities in l ine with solutions sales
Service production can be internal or external
Identify renewal / replacement opportunities early and offer easy opportunity to procure
Leverage system sales for increased leverage in margin and volume

Market priority matrix for EFORE C
OM
PAN
Y A
SSES
SMEN
T
Market trend
Competitors Presence
Profitability
Portfolio Proximity
Our skills
Sales Channel
Industrial Segment priority:
1A
Telecom. Segment priority:
1A
Networks Segment priority:
1B
Medical Segment priority:
1B
Lighting Segment priority:
1C
Transport Segment priority:
2
Military Segment priority:
3
MA
RK
ET A
SSES
SMEN
T
4.11.2015 33

Standard & custom strategy
EFORE is a power supply design and manufacturing company that is serving both custom and standard markets.
Working with both business models EFORE will:
1. Use the standard platform as starting point for customization
2. Mitigate the risk
Custom specifications
Non-recurring cost contribution
Specific custom volume
Tier1 Competitor
Direct
Single market destination
CUSTOM
Benchmark market performances
Own development cost
Broader customer base
Wide competition
Distribution
Multiple market destination
STANDARD
4.11.2015 34
Customization/Standardization

EFORE technology roadmap
EFORE technology and product roadmaps are continuously aligned to guarantee the appropriate knowledge to develop the medium short terms strategic platform
INDUSTRY AND MARKET TRENDS
R&D COMMUNITY
SEMICONDUCTOR TECHNOLOGY
ENABLING TECHNOLOGY (e.g. IoT)
TECHNOLOGY DEVELOPMENT ROADMAP
PRODUCT ROADMAPS
4.11.2015 Confidential 35

EFORE technology roadmap
2015 2016 2017 2018 2019
GEN
ERA
L TE
CH
NO
LOG
IES
PO
WER
CO
NV
ERSI
ON
AN
D
DIS
TRIB
UTI
ON
P
LATF
OR
MS
Funded program (5G, Solar)
Bi-directional PSU
Energy-efficient Wireless
Ultra high efficiency
Digital control platform PSU
Cooling, Harsh-Env.,Manuf.
PLD solution
AR
CH
ITEC
TUR
E
Digital control low power
Confidential 4.11.2015

NEW MARKETS
NEW CUSTOMERS
EFORE stretch path
4.11.2015 37
We expand our target market enchancing our technology vectors of differentiation
TECHNOLOGY STRETCH
Solar
DC/AC
Higher efficiency
New topology
New semiconductor
devices
Connectivity
Severe environ-
ment
Health monitoring
EFORE VECTORS OF DIFFERENTIATION
Power density Reliability
Digital control High efficiency

Market and product offering 1/3 Industrial & instrumentation
38
Target Market Market Size Application Today
Industrial
1170 mUSD CAGR 1,1 %
Factory automation Lighting Test & measurement
Led video Wall display
100 mUSD CAGR 11,6 %
Sports Commercial Transportation Advertising
Process industry
800 mUSD CAGR 1,1 %
Utilities
Power generation & distribution
Substation Power plants
Technology Enabler
Configurability Modularity High efficiency Thermal management Multi output design Intelligent Power
Outdoor enclosure Thermal management High reliability System architecture cost optimization
Power system design Intell igent power High efficiency Battery charger Programmability Scalability Remote control Outdoor Shielding
Future Penetration
Oil & gas Semiconductor manufacturing equipment
«Mediatainment» Market evolution
Harsh environment Utilities
Harsh environment Application

Market and product offering 2/3 Medical, telecom and lighting
4.11.2015 39
Target Market Market Size Application Today
Medical 530 mUSD CAGR 2,8 %
Display Operator protection Patient protection Surgical light
Telecom 1900 mUSD CAGR 0 %
Macro cell site Tele & datacom sites Medium/large telecom sites Energy measurement
Lighting 870 mUSD CAGR 13,8 %
Architectural Urban lighting Residential Indoor lighting Outdoor Marine
Technology Enabler
High efficiency Power density Means of protection Modularity Portability
Sealing Outdoor Reliability Programmability Remote controlling Thermal management
Programmability Remote controlling High efficiency Wireless Thermal management Power density
Future Penetration
Point of care (portable) UV light (curing, purification) Imaging
Micro cell site Utilities Oil & Gas
Industrial (high bay) Medical (surgical) Severe environment
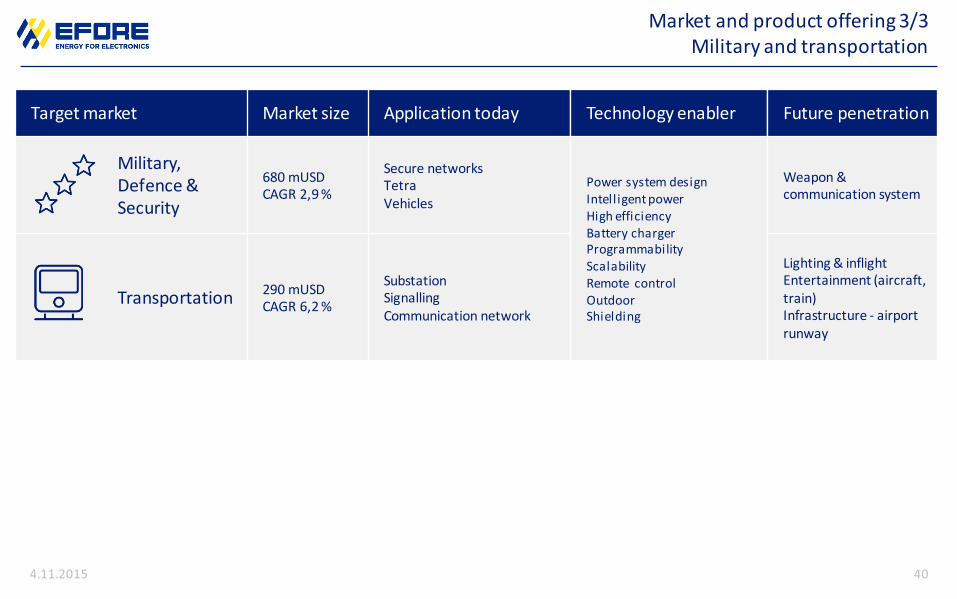
Market and product offering 3/3 Military and transportation
4.11.2015 40
Target market Market size Application today
Military, Defence & Security
680 mUSD CAGR 2,9 %
Secure networks Tetra Vehicles
Transportation 290 mUSD CAGR 6,2 %
Substation Signalling Communication network
Technology enabler
Power system design Intelligent power High efficiency Battery charger Programmability Scalability Remote control Outdoor Shielding
Future penetration
Weapon & communication system
Lighting & inflight Entertainment (aircraft, train) Infrastructure - airport runway
Financial situation and outlook
Riitta Järnstedt, CFO
4.11.2015 41
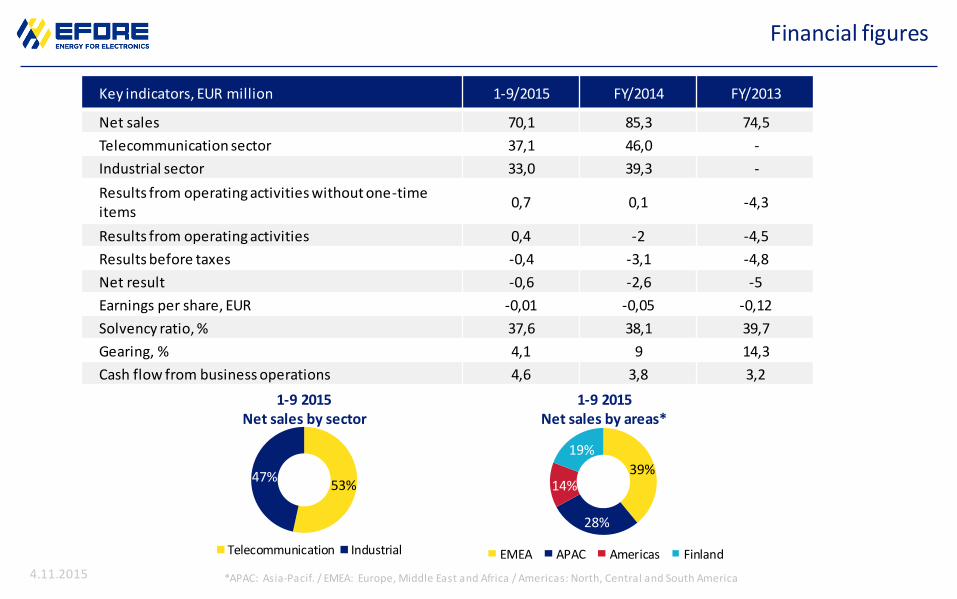
Financial figures
*APAC: Asia-Pacif. / EMEA: Europe, Middle East and Africa / Americas: North, Central and South America
53% 47%
Telecommunication Industrial
1-9 2015 Net sales by sector
39%
28%
14%
19%
EMEA APAC Americas Finland
1-9 2015 Net sales by areas*
Key indicators, EUR million 1-9/2015 FY/2014 FY/2013
Net sales 70,1 85,3 74,5
Telecommunication sector 37,1 46,0 -
Industrial sector 33,0 39,3 -
Results from operating activities without one-time items
0,7 0,1 -4,3
Results from operating activities 0,4 -2 -4,5
Results before taxes -0,4 -3,1 -4,8
Net result -0,6 -2,6 -5
Earnings per share, EUR -0,01 -0,05 -0,12
Solvency ratio, % 37,6 38,1 39,7
Gearing, % 4,1 9 14,3
Cash flow from business operations 4,6 3,8 3,2
4.11.2015
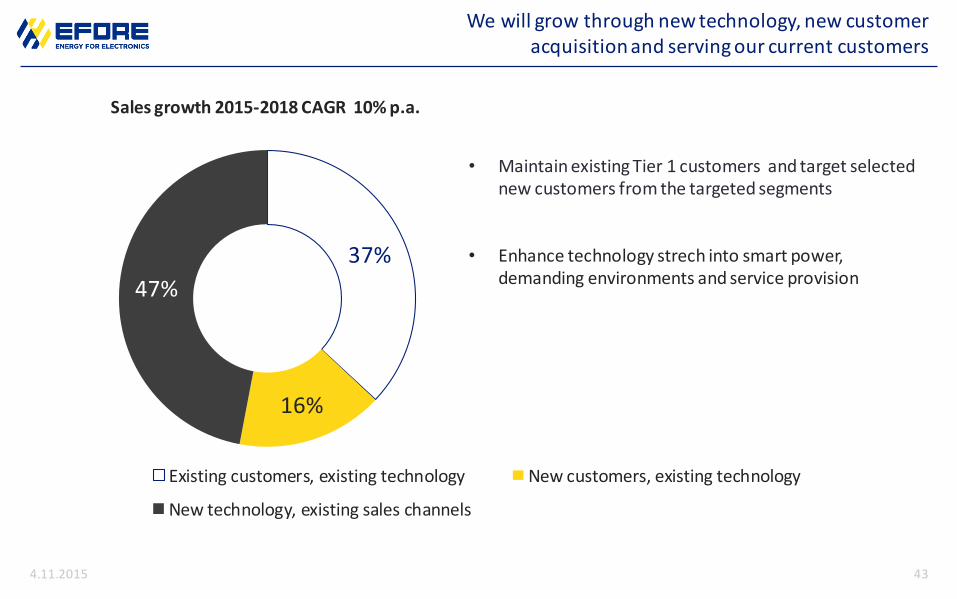
We will grow through new technology, new customer acquisition and serving our current customers
4.11.2015 43
37%
16%
47%
Sales growth 2015-2018 CAGR 10% p.a.
Existing customers, existing technology New customers, existing technology
New technology, existing sales channels
• Maintain existing Tier 1 customers and target selected new customers from the targeted segments
• Enhance technology strech into smart power, demanding environments and service provision
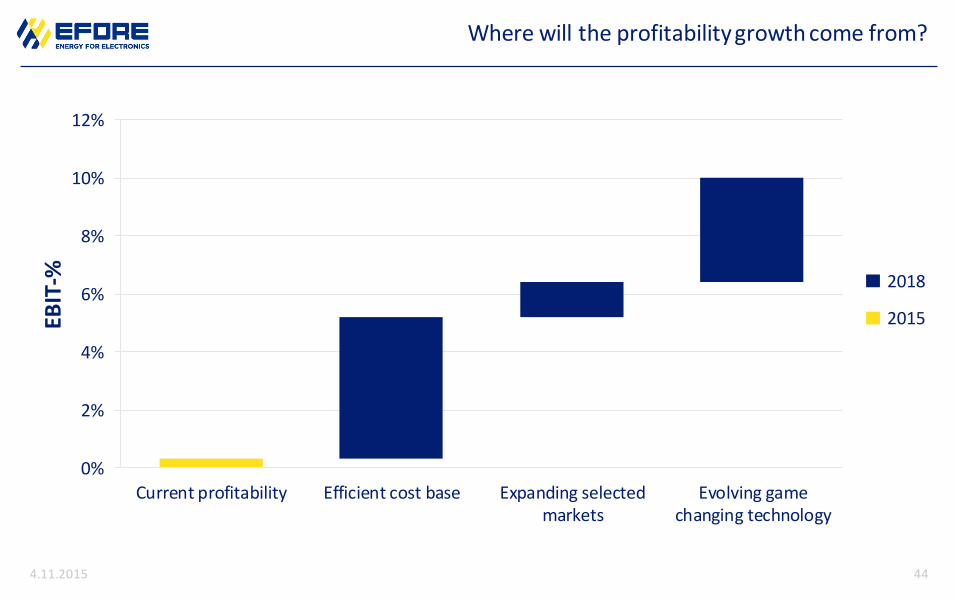
Where will the profitability growth come from?
0%
2%
4%
6%
8%
10%
12%
Current profitability Efficient cost base Expanding selectedmarkets
Evolving gamechanging technology
EBIT
-%
2018
2015
4.11.2015 44

Improving our Net Working Capital structure
4.11.2015 45
Receivables Inventory 2015
Payables C2C
Inventory 2018
Make the business self-financing

Summary
Heikki Viika
4.11.2015 46

Timeline of major milestones resulted from turnaround actions
4.11.2015 47
- Riitta Järnstedt appointed new CFO
- Heikki Viika appointed new CEO
- Major part of PCB assembly manufacturing transferred to an EMS partner
- CFO Riitta Järnstedt appointed also interim CEO
November 2014 December 2014 March 2015 April 2015 May 2015
July 2015 August 2015 September2015
...
2015 2014
June 2015 - New CEO joined
the company
- Start preparation of new strategy
- Cost improvement programme initiated in China and Finland
- Savings programme initiated in Italy
- PCB assembly manufacturing transfer to an EMS partner finalised
- Manufacturing process in Suzhou reorganized
- New strategy published
- Contract signed with four sales agency chains to strengthen sales force in USA
October2015
- Implementation of new organization structure
- Changes in Executive Management Team
Going forward
- Strong execution of strategy with regular follow up and review of its impact

Conclusions
4.11.2015 48
An updated vision created for the company: The trusted power partner
• Four strategic cornerstones encapsulate the strategy
• Growth is aimed through
– Securing current large accounts at current high level or increasing the volumes
– Capturing selected new major accounts through planned approach
– Opening new sales channels including Internet
– Bringing new technologies to the market
• Improvements in profitability to reach 10% EBIT by end of
planning period are aimed through optimising overhead costs,
efficiency improvements in manufacturing and product
development, and ensuring a competitive materials cost base
• We are aiming at energising the company through
management commitment to leadership, empowering our
employees and ensuring we have the right competencies and
rewards system for the future

Thank you for your attention
HEIKKI VIIKA