eia njc arunachal
TRANSCRIPT
i
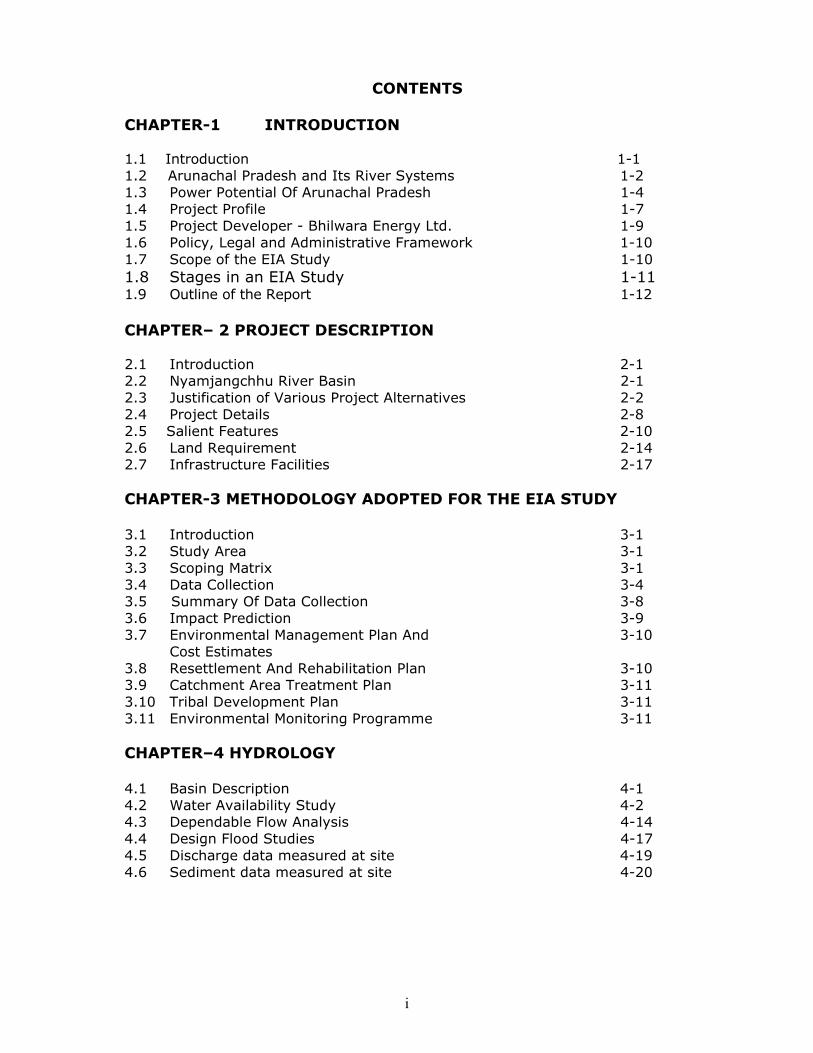
CONTENTS CHAPTER-1 INTRODUCTION 1.1 Introduction 1-1 1.2 Arunachal Pradesh and Its River Systems 1-2 1.3 Power Potential Of Arunachal Pradesh 1-4 1.4 Project Profile 1-7 1.5 Project Developer - Bhilwara Energy Ltd. 1-9 1.6 Policy, Legal and Administrative Framework 1-10 1.7 Scope of the EIA Study 1-10 1.8 Stages in an EIA Study 1-11 1.9 Outline of the Report 1-12 CHAPTER– 2 PROJECT DESCRIPTION 2.1 Introduction 2-1 2.2 Nyamjangchhu River Basin 2-1 2.3 Justification of Various Project Alternatives 2-2 2.4 Project Details 2-8 2.5 Salient Features 2-10 2.6 Land Requirement 2-14 2.7 Infrastructure Facilities 2-17
CHAPTER-3 METHODOLOGY ADOPTED FOR THE EIA STUDY 3.1 Introduction 3-1 3.2 Study Area 3-1 3.3 Scoping Matrix 3-1 3.4 Data Collection 3-4 3.5 Summary Of Data Collection 3-8 3.6 Impact Prediction 3-9 3.7 Environmental Management Plan And 3-10 Cost Estimates 3.8 Resettlement And Rehabilitation Plan 3-10 3.9 Catchment Area Treatment Plan 3-11 3.10 Tribal Development Plan 3-11 3.11 Environmental Monitoring Programme 3-11 CHAPTER–4 HYDROLOGY 4.1 Basin Description 4-1 4.2 Water Availability Study 4-2 4.3 Dependable Flow Analysis 4-14 4.4 Design Flood Studies 4-17 4.5 Discharge data measured at site 4-19 4.6 Sediment data measured at site 4-20
ii
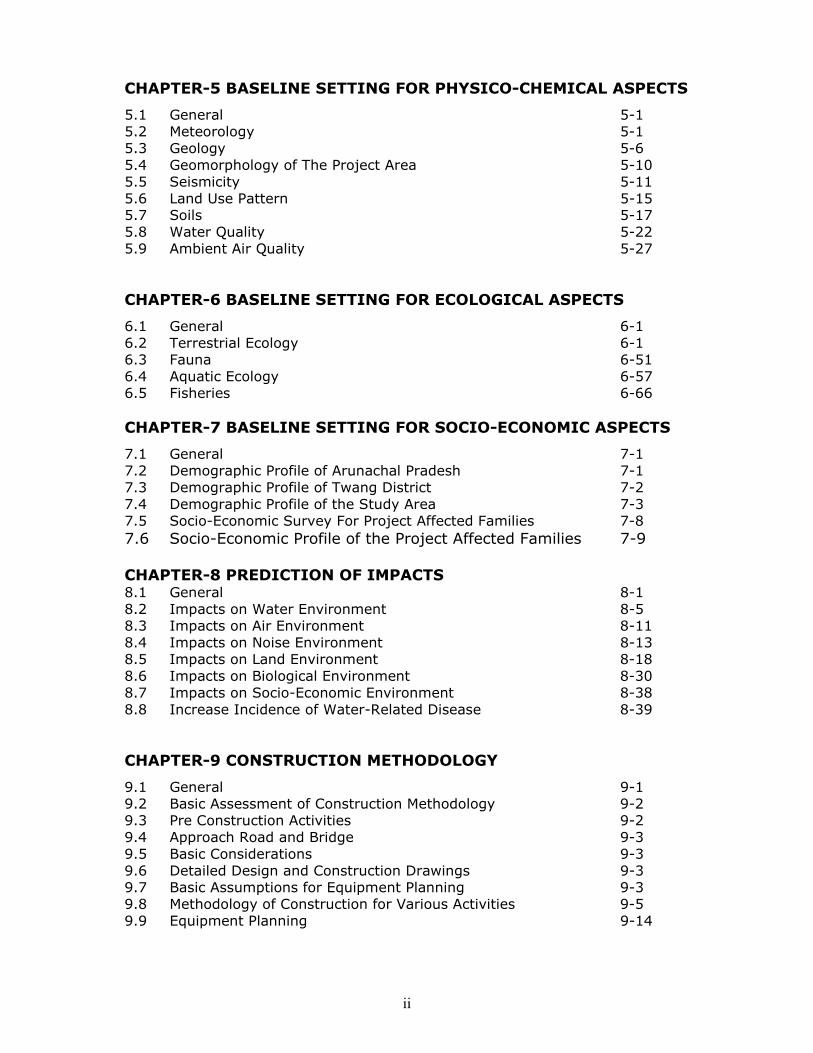
CHAPTER-5 BASELINE SETTING FOR PHYSICO-CHEMICAL ASPECTS
5.1 General 5-1 5.2 Meteorology 5-1 5.3 Geology 5-6 5.4 Geomorphology of The Project Area 5-10 5.5 Seismicity 5-11 5.6 Land Use Pattern 5-15 5.7 Soils 5-17 5.8 Water Quality 5-22 5.9 Ambient Air Quality 5-27 CHAPTER-6 BASELINE SETTING FOR ECOLOGICAL ASPECTS
6.1 General 6-1 6.2 Terrestrial Ecology 6-1 6.3 Fauna 6-51 6.4 Aquatic Ecology 6-57 6.5 Fisheries 6-66 CHAPTER-7 BASELINE SETTING FOR SOCIO-ECONOMIC ASPECTS
7.1 General 7-1 7.2 Demographic Profile of Arunachal Pradesh 7-1 7.3 Demographic Profile of Twang District 7-2 7.4 Demographic Profile of the Study Area 7-3 7.5 Socio-Economic Survey For Project Affected Families 7-8 7.6 Socio-Economic Profile of the Project Affected Families 7-9 CHAPTER-8 PREDICTION OF IMPACTS 8.1 General 8-1 8.2 Impacts on Water Environment 8-5 8.3 Impacts on Air Environment 8-11 8.4 Impacts on Noise Environment 8-13 8.5 Impacts on Land Environment 8-18 8.6 Impacts on Biological Environment 8-30 8.7 Impacts on Socio-Economic Environment 8-38 8.8 Increase Incidence of Water-Related Disease 8-39
CHAPTER-9 CONSTRUCTION METHODOLOGY
9.1 General 9-1 9.2 Basic Assessment of Construction Methodology 9-2 9.3 Pre Construction Activities 9-2 9.4 Approach Road and Bridge 9-3 9.5 Basic Considerations 9-3 9.6 Detailed Design and Construction Drawings 9-3 9.7 Basic Assumptions for Equipment Planning 9-3 9.8 Methodology of Construction for Various Activities 9-5 9.9 Equipment Planning 9-14

iii
Annexure Annexure-I A copy of the TOR approved by MoEF Annexure-II Drinking Water Quality Standards Annexure-III National Ambient Air Quality Standards Annexure-IV Ambient Noise Standards Annexure-V List of Plant Species (With their Family and Local Names) Found in the Study Area

iv
LIST OF FIGURES
Figure-1.1 Major river system of the state
Figure-1.2 Location of Tawang district Figure-1.3 Project location map Figure-2.1 Layout Plan
Figure-3.1 Study area map Figure-4.1 Satellite image of Nyamjang Chhu catchment Figure-4.2 Catchment area map showing drainage network
Figure-4.3 Rainfed and Snowfed catchment area Figure-4.4 Location of IMD stations in the region Figure-4.5 Flow duration curve Figure-5.1 Location of IMD stations at Bhalukpong and Dirang Figure-5.2 Annual rainfall at Bhalukpong and Dirang Figure-5.3 Monthly average rainfall at Bhalukpong and Dirang Figure-5.4 Seismic zoning map of India Figure-5.5 FCC image of the project area Figure-5.6 Classified image of the project area Figure-5.7 Sampling stations (Soil, Noise) Figure-6.1 Ecological sampling location (WAPCOS) Figure-6.2 Ecological sampling location (RSET) Figure-9.1 HRT Layout
NJC Hydropower Limited EIA study for Nyamjangchhu Hydroelectric Project
WAPCOS Limited 1-1
CHAPTER-1
INTRODUCTION
1.1 INTRODUCTION
India’s installed capacity in the hydropower sector is presently estimated at
around 36498 MW out of total installed capacity of 146753 MW. Only about 20%
of the economically feasible hydropower potential has been exploited. The
economic development in the country in recent times has resulted in widening of
the gap between the demand and the supply of power. In order to make power
available to all by 2012, the total installed capacity is planned to be increased to
about 210000 MW. The development of hydropower potential can significantly
help to bridge the gap between power demand and supply. The central
government alongwith various state governments have taken significant initiatives
for development of power projects in both public as well as private sectors.
Special emphasis is being made for development of hydropower potential of the
country to keep a balanced mix of thermal and hydro power generation.
Arunachal Pradesh, with an area of 83743 km2, is the largest state in the north-
east region in terms of land area. The state is endowed with mighty rivers with an
estimated feasible hydropower potential of about 57,000 MW. The hydropower
development in Arunachal Pradesh has been identified as a key area by both the
government of India and the state government of Arunachal Pradesh as one of the
key areas for meeting the country’s increasing energy requirements. Fast track
development of hydropower potential in the state both in public and private sector
is being pursued by Government of Arunachal Pradesh (GoAP). The state
government has signed Memoranda of Understanding (MoU) with 25 developers
for development of over 27000 MW of hydropower potential in the state.
The Government of Arunachal Pradesh has awarded the work of development of
the hydropower potential in the Nyamjang Chhu Basin in Tawang district to
Bhilwara Energy Limited (BEL). A memorandum of agreement in this regard was
signed between GoAP and BEL at Itanagar on the 27th October, 2006. The project
is designed as a run-of-the river scheme having a diversion barrage near the
Zimithang village with powerhouse near the confluence of the Tawang Chhu with
the Nyamjang Chhu.
NJC Hydropower Limited EIA study for Nyamjangchhu Hydroelectric Project
WAPCOS Limited 1-2
1.2 ARUNACHAL PRADESH AND ITS RIVER SYSTEMS
Profile
Arunachal Pradesh – the Land of the Rising Sun – with an area of 83,743 sq km.
is the largest state in the North Eastern region sharing international boundaries
with Bhutan in the West, China in the North and Myanmar in the East. The States
of Assam and Nagaland flank it’s Southern and South Eastern borders. The state
of Arunachal Pradesh is situated between latitudes 26° 30' N and 29° 30 ' N and
longitudes 91° 30' E and 97° 30' E. Arunachal Pradesh is divided in thirteen
administrative districts namely; Tawang, West Kameng, East Kameng, Lower
Subansiri, Upper Subansiri, West Siang, East Siang, Dibang Valley, Changlang,
Tirap, Papum Pare, Lohit and Upper Siang. The main rivers in the State are the
Siang, Kameng, Subansiri, Kamla, Siyom, Dibang, Lohit, Noa-Dihing Kamlang and
Tirap.
Forest covers about 82% area of the state and numerous turbulent streams,
roaring rivers, deep gorges, lofty mountains, snow clad peaks and rich diversity
of flora and fauna characterize the landscape. The climate varies from sub-
tropical in the South to temperate and alpine in the North, with large areas
experiencing snowfalls during winter. The heights of the mountain peaks vary,
the highest peak being Kangte (7,090m above msl) in West Kameng District.
The major rivers draining the area with their numerous tributaries from west to
east are Tawang, Kameng, Subansiri, Siang, Dibang, Lohit, Kamlang, Noa -
Dihing and Tirap.
Climate
The climate of Arunachal Pradesh varies with elevation. Areas at high elevations in
the Upper Himalayas, close to the Tibetan border are subject to a Tundra-type
climate, while areas in Middle Himalayas have a temperate climate. The sub-
Himalayan and sea-level elevation areas generally experience a humid sub-
tropical climate, along with hot summers and mild winters. The annual average
rainfall in various parts of Arunachal Pradesh varies between 2000 mm and 4000
mm. The area experiences high precipitation during the monsoon period between
May and September. The prolonged period of Monsoon has resulted in lush forest
growth over the hill slopes. The mountain slopes are covered with Alpine,
Temperate and Subtropical forest of dwarf rhododendron, Oak, Pine, Maple and
Fir. Juniper, Sal and Teak are the main economic species. During winters,
NJC Hydropower Limited EIA study for Nyamjangchhu Hydroelectric Project
WAPCOS Limited 1-3
especially months of December to February, the area experiences severe fog with
thick mist formation and occasional rainfall. The summer season is hot and humid.
Flora
Arunachal Pradesh has a rich diversity of flora and fauna and the state is entirely
covered with hills and forests. Nearly 61000 sq. km of the total land area of
83743 sq. km is covered with forests. Forest products are the most significant
sector of economy next to agriculture. These forests are home to a sizeable
population of various tribes who extract resources from them for their livelihood.
The forests of Arunachal Pradesh include some 5000 species of plants, about 85
terrestrial mammals, over 500 birds and a large number of butterflies, insects and
reptiles.
The vegetation of the state falls under four broad climatic categories and can be
classified in five broad forest types which are: tropical forests, sub-tropical forests,
pine forests, temperate forests and alpine forests.
Rivers
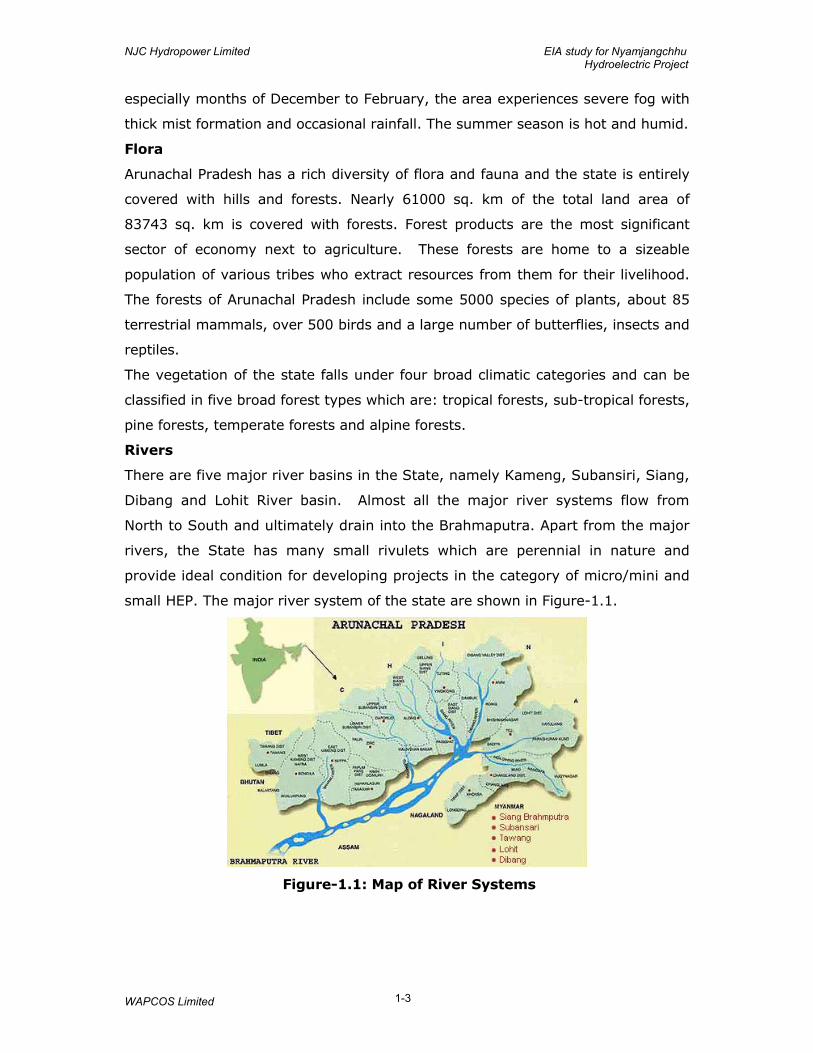
There are five major river basins in the State, namely Kameng, Subansiri, Siang,
Dibang and Lohit River basin. Almost all the major river systems flow from
North to South and ultimately drain into the Brahmaputra. Apart from the major
rivers, the State has many small rivulets which are perennial in nature and
provide ideal condition for developing projects in the category of micro/mini and
small HEP. The major river system of the state are shown in Figure-1.1.
Figure-1.1: Map of River Systems
NJC Hydropower Limited EIA study for Nyamjangchhu Hydroelectric Project
WAPCOS Limited 1-4
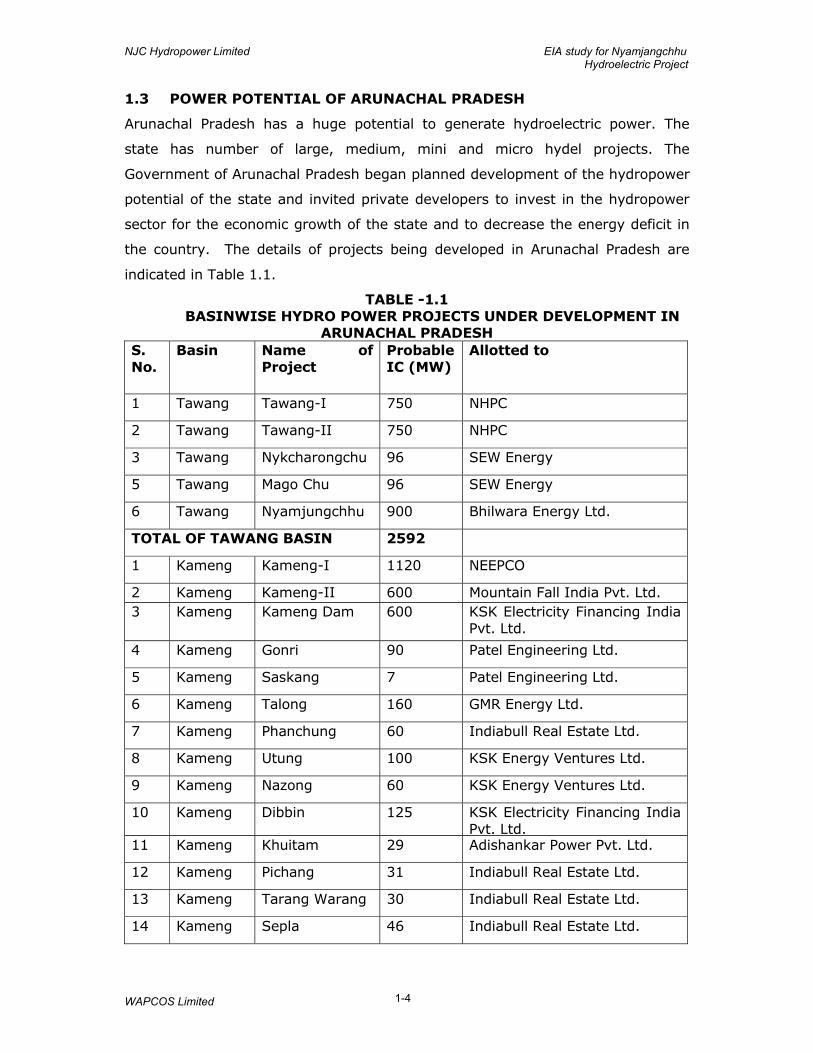
1.3 POWER POTENTIAL OF ARUNACHAL PRADESH
Arunachal Pradesh has a huge potential to generate hydroelectric power. The
state has number of large, medium, mini and micro hydel projects. The
Government of Arunachal Pradesh began planned development of the hydropower
potential of the state and invited private developers to invest in the hydropower
sector for the economic growth of the state and to decrease the energy deficit in
the country. The details of projects being developed in Arunachal Pradesh are
indicated in Table 1.1.
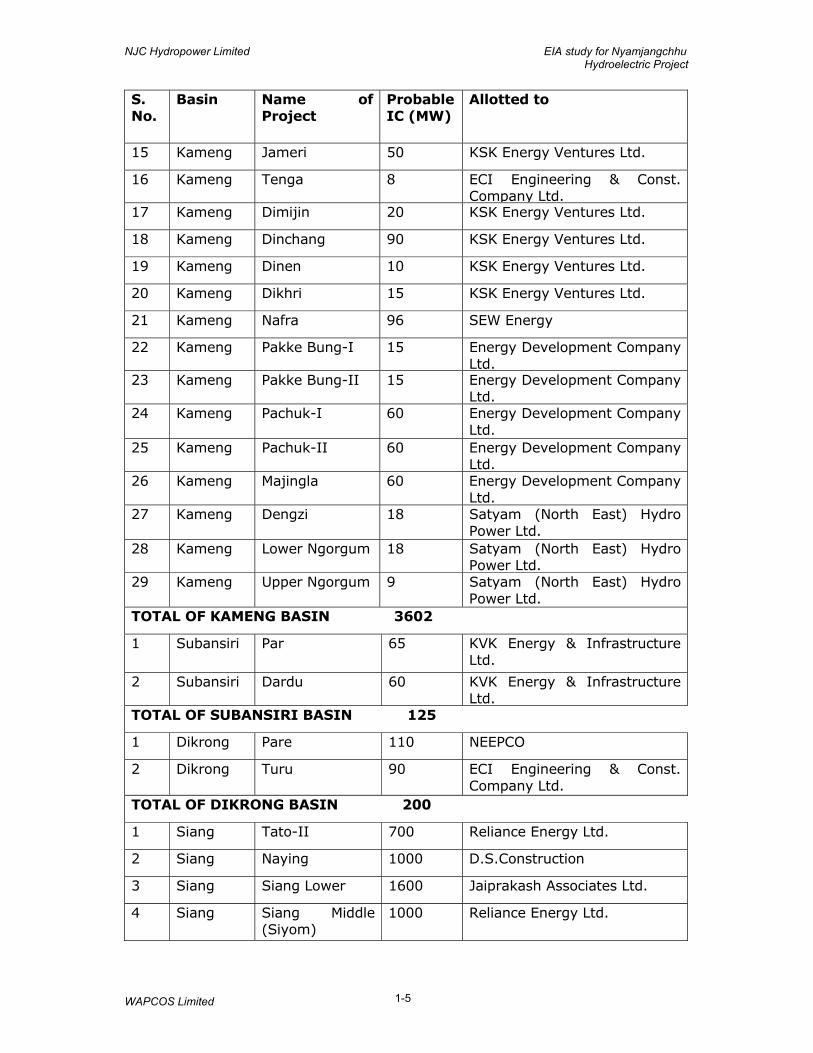
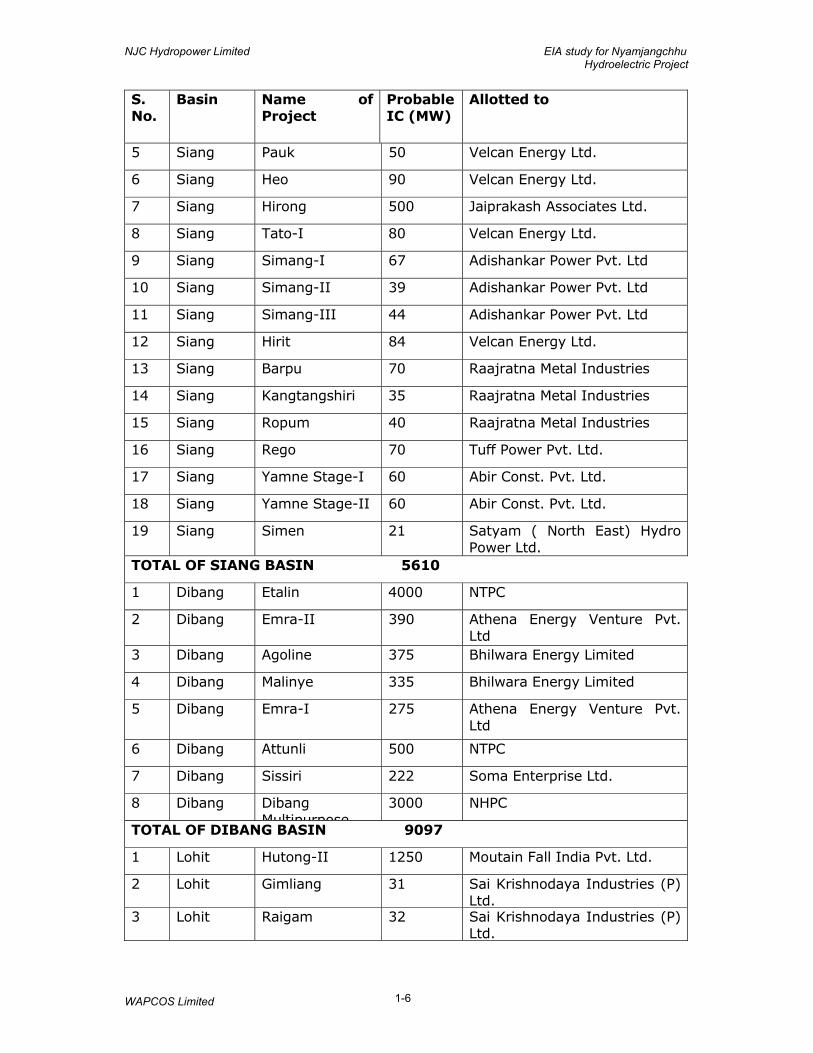
TABLE -1.1 BASINWISE HYDRO POWER PROJECTS UNDER DEVELOPMENT IN
ARUNACHAL PRADESH S. No.
Basin Name of Project
Probable IC (MW)
Allotted to
1 Tawang Tawang-I 750 NHPC
2 Tawang Tawang-II 750 NHPC
3 Tawang Nykcharongchu 96 SEW Energy
5 Tawang Mago Chu 96 SEW Energy
6 Tawang Nyamjungchhu 900 Bhilwara Energy Ltd.
TOTAL OF TAWANG BASIN 2592
1 Kameng Kameng-I 1120 NEEPCO
2 Kameng Kameng-II 600 Mountain Fall India Pvt. Ltd. 3 Kameng Kameng Dam 600 KSK Electricity Financing India
Pvt. Ltd.
4 Kameng Gonri 90 Patel Engineering Ltd.
5 Kameng Saskang 7 Patel Engineering Ltd.
6 Kameng Talong 160 GMR Energy Ltd.
7 Kameng Phanchung 60 Indiabull Real Estate Ltd.
8 Kameng Utung 100 KSK Energy Ventures Ltd.
9 Kameng Nazong 60 KSK Energy Ventures Ltd.
10 Kameng Dibbin 125 KSK Electricity Financing India Pvt. Ltd.
11 Kameng Khuitam 29 Adishankar Power Pvt. Ltd.
12 Kameng Pichang 31 Indiabull Real Estate Ltd.
13 Kameng Tarang Warang 30 Indiabull Real Estate Ltd.
14 Kameng Sepla 46 Indiabull Real Estate Ltd.
NJC Hydropower Limited EIA study for Nyamjangchhu Hydroelectric Project
WAPCOS Limited 1-5
S. No.
Basin Name of Project
Probable IC (MW)
Allotted to
15 Kameng Jameri 50 KSK Energy Ventures Ltd.
16 Kameng Tenga 8 ECI Engineering & Const. Company Ltd.
17 Kameng Dimijin 20 KSK Energy Ventures Ltd.
18 Kameng Dinchang 90 KSK Energy Ventures Ltd.
19 Kameng Dinen 10 KSK Energy Ventures Ltd.
20 Kameng Dikhri 15 KSK Energy Ventures Ltd.
21 Kameng Nafra 96 SEW Energy
22 Kameng Pakke Bung-I 15 Energy Development Company Ltd.
23 Kameng Pakke Bung-II 15 Energy Development Company Ltd.
24 Kameng Pachuk-I 60 Energy Development Company Ltd.
25 Kameng Pachuk-II 60 Energy Development Company Ltd.
26 Kameng Majingla 60 Energy Development Company Ltd.
27 Kameng Dengzi 18 Satyam (North East) Hydro Power Ltd.
28 Kameng Lower Ngorgum 18 Satyam (North East) Hydro Power Ltd.
29 Kameng Upper Ngorgum 9 Satyam (North East) Hydro Power Ltd.
TOTAL OF KAMENG BASIN 3602
1 Subansiri Par 65 KVK Energy & Infrastructure Ltd.
2 Subansiri Dardu 60 KVK Energy & Infrastructure Ltd.
TOTAL OF SUBANSIRI BASIN 125
1 Dikrong Pare 110 NEEPCO
2 Dikrong Turu 90 ECI Engineering & Const. Company Ltd.
TOTAL OF DIKRONG BASIN 200
1 Siang Tato-II 700 Reliance Energy Ltd.
2 Siang Naying 1000 D.S.Construction
3 Siang Siang Lower 1600 Jaiprakash Associates Ltd.
4 Siang Siang Middle (Siyom)
1000 Reliance Energy Ltd.
NJC Hydropower Limited EIA study for Nyamjangchhu Hydroelectric Project
WAPCOS Limited 1-6
S. No.
Basin Name of Project
Probable IC (MW)
Allotted to
5 Siang Pauk 50 Velcan Energy Ltd.
6 Siang Heo 90 Velcan Energy Ltd.
7 Siang Hirong 500 Jaiprakash Associates Ltd.
8 Siang Tato-I 80 Velcan Energy Ltd.
9 Siang Simang-I 67 Adishankar Power Pvt. Ltd
10 Siang Simang-II 39 Adishankar Power Pvt. Ltd
11 Siang Simang-III 44 Adishankar Power Pvt. Ltd
12 Siang Hirit 84 Velcan Energy Ltd.
13 Siang Barpu 70 Raajratna Metal Industries
14 Siang Kangtangshiri 35 Raajratna Metal Industries
15 Siang Ropum 40 Raajratna Metal Industries
16 Siang Rego 70 Tuff Power Pvt. Ltd.
17 Siang Yamne Stage-I 60 Abir Const. Pvt. Ltd.
18 Siang Yamne Stage-II 60 Abir Const. Pvt. Ltd.
19 Siang Simen 21 Satyam ( North East) Hydro Power Ltd.
TOTAL OF SIANG BASIN 5610
1 Dibang Etalin 4000 NTPC
2 Dibang Emra-II 390 Athena Energy Venture Pvt. Ltd
3 Dibang Agoline 375 Bhilwara Energy Limited
4 Dibang Malinye 335 Bhilwara Energy Limited
5 Dibang Emra-I 275 Athena Energy Venture Pvt. Ltd
6 Dibang Attunli 500 NTPC
7 Dibang Sissiri 222 Soma Enterprise Ltd.
8 Dibang Dibang Multipurpose
3000 NHPC
TOTAL OF DIBANG BASIN 9097
1 Lohit Hutong-II 1250 Moutain Fall India Pvt. Ltd.
2 Lohit Gimliang 31 Sai Krishnodaya Industries (P) Ltd.
3 Lohit Raigam 32 Sai Krishnodaya Industries (P) Ltd.
NJC Hydropower Limited EIA study for Nyamjangchhu Hydroelectric Project
WAPCOS Limited 1-7
S. No.
Basin Name of Project
Probable IC (MW)
Allotted to
4 Lohit Tidding-I 31 Sai Krishnodaya Industries (P) Ltd.
5 Lohit Kalai-I 1450 Mountain Fall India Pvt. Ltd.
6 Lohit Demwe 3000 Athena Energy Venture Pvt. Ltd.
7 Lohit Kamlang 22.50 Sai Krishnodaya Industries (P) Ltd.
TOTAL OF LOHIT BASIN 5816.5
GRAND TOTAL 26432.50
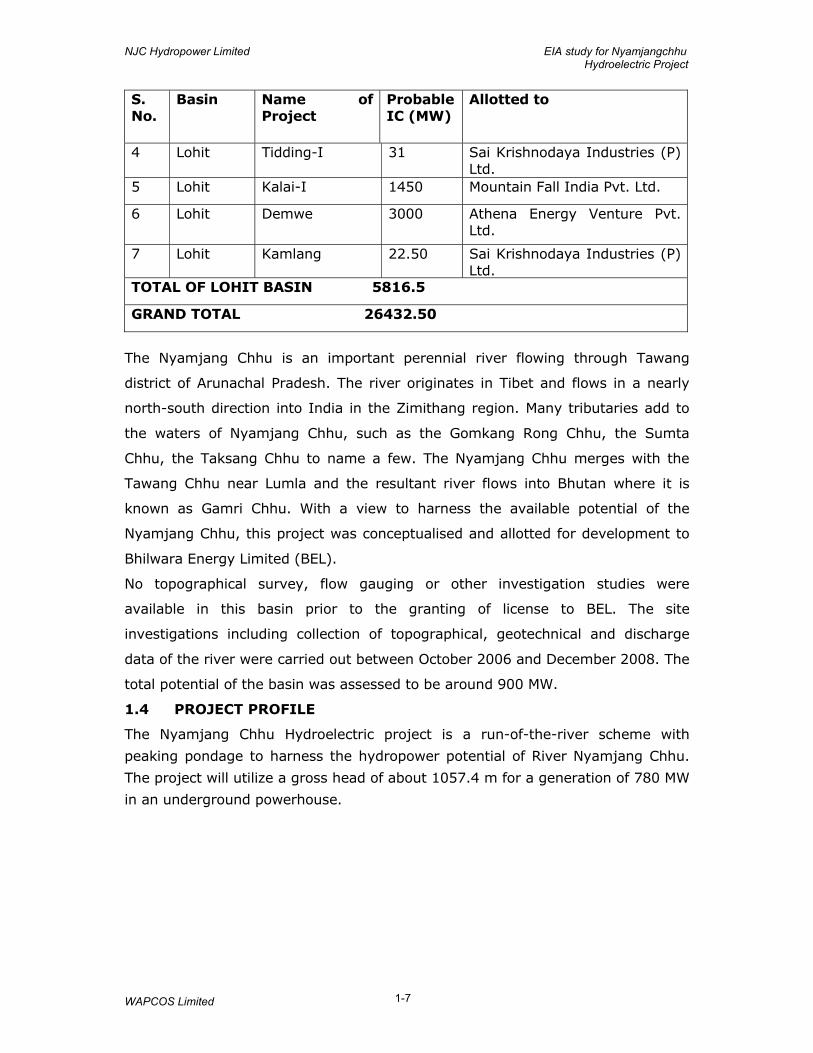
The Nyamjang Chhu is an important perennial river flowing through Tawang
district of Arunachal Pradesh. The river originates in Tibet and flows in a nearly
north-south direction into India in the Zimithang region. Many tributaries add to
the waters of Nyamjang Chhu, such as the Gomkang Rong Chhu, the Sumta
Chhu, the Taksang Chhu to name a few. The Nyamjang Chhu merges with the
Tawang Chhu near Lumla and the resultant river flows into Bhutan where it is
known as Gamri Chhu. With a view to harness the available potential of the
Nyamjang Chhu, this project was conceptualised and allotted for development to
Bhilwara Energy Limited (BEL).
No topographical survey, flow gauging or other investigation studies were
available in this basin prior to the granting of license to BEL. The site
investigations including collection of topographical, geotechnical and discharge
data of the river were carried out between October 2006 and December 2008. The
total potential of the basin was assessed to be around 900 MW.
1.4 PROJECT PROFILE
The Nyamjang Chhu Hydroelectric project is a run-of-the-river scheme with
peaking pondage to harness the hydropower potential of River Nyamjang Chhu.
The project will utilize a gross head of about 1057.4 m for a generation of 780 MW
in an underground powerhouse.
NJC Hydropower Limited EIA study for Nyamjangchhu Hydroelectric Project
WAPCOS Limited 1-8
The project is located in Tawang district of Arunachal Pradesh in north-western
part of State. Tawang is bordered by Tibet in the North, Bhutan in the south-west
and Sela ranges separate it from the West Kameng district in the East. Tawang
district has an area of about 2085 sq. km and for administrative purposes; it is
further sub-divided into the Lumla, Jang and Tawang sub-divisions. Elevations in
the area range between 3,000 to 22,000 feet and inhabitants are found in lower
altitudes, where there is cool temperate climate. In winter, Tawang frequently
experiences heavy snowfall. Tawang Chhu is the main river in the district and
flows mainly in the east-west direction. Nyamjang Chhu is a major right bank
tributary of Tawang Chhu. It originates in Tibet and enters India near the village
of Khinzemane and flows mostly in the north-south direction up to its confluence
with Tawang Chhu.
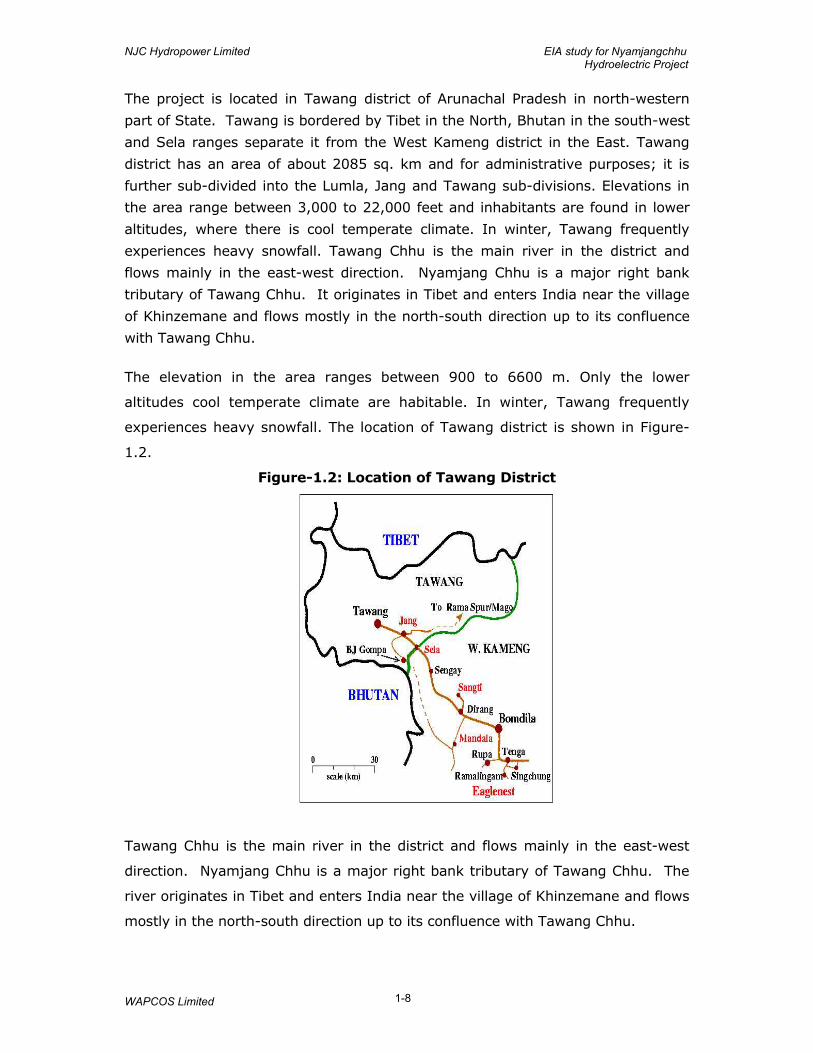
The elevation in the area ranges between 900 to 6600 m. Only the lower
altitudes cool temperate climate are habitable. In winter, Tawang frequently
experiences heavy snowfall. The location of Tawang district is shown in Figure-
1.2.
Figure-1.2: Location of Tawang District
Tawang Chhu is the main river in the district and flows mainly in the east-west
direction. Nyamjang Chhu is a major right bank tributary of Tawang Chhu. The
river originates in Tibet and enters India near the village of Khinzemane and flows
mostly in the north-south direction up to its confluence with Tawang Chhu.
NJC Hydropower Limited EIA study for Nyamjangchhu Hydroelectric Project
WAPCOS Limited 1-9
The Nyamjang Chhu Hydroelectric Project (NJCHEP) is located along the
Nyamjang Chhu between Zimithang and Lumla. The diversion site is located near
Zimithang having coordinates at latitude 27°43’06” N, longitude 91°43’37” E and
the powerhouse is located near confluence of Nyamjang Chhu and Tawang Chhu
at latitude 27°31’16” N , longitude 91°41’12” E. The project location map is
enclosed as Figure-1.3.
The project area is accessible by road and by helicopter. The powerhouse is
located about 590 km from Guwahati and 575 km from Itanagar, the capital of
Arunachal Pradesh. The nearest broad gauge rail head is at Naugaon in Assam
about 521 km from powerhouse. The nearest narrow gauge rail head is at
Bhalukpong about 380 km from the powerhouse. The nearest airports are at
Tezpur and Guwahati. The state government is providing regular helicopter
service from Itanagar and Guwahati to Tawang.
The district headquarters of Tawang district is at Tawang city and is connected
with Guwahati via National Highway NH 52 and 52 A. The barrage and
powerhouse are accessible from Tawang via the State highway between Tawang-
Lumla-Zimithang. From Lumla, a 22 km long gravel road is available to
powerhouse site. Lumla is located about 40 km from Tawang and Zimithang is
located about 48 km from Lumla and 93 km from Tawang.
1.5 PROJECT DEVELOPER - BHILWARA ENERGY LTD.
Bhilwara Energy Ltd. (BEL) is the flagship company of LNJ Bhilwara Group to
develop and operate power assets in India and overseas. The company has a
portfolio of 2487 MW in hydro power currently in various stages of
implementation. Bhilwara Energy Ltd. is the first hydropower developer with
100% merchant sale model.
The LNJ Bhilwara Group was among the first private sector company to venture
into power sector when the sector was opened for private participation in 1991.
In 1993 the Group entered into a Memorandum of Understanding with the State
of Himachal Pradesh for implementation of two hydroelectric projects in Kullu
district namely, 86 MW Malana Hydroelectric Project and 192 MW Allain Duhangan
Hydroelectric Project. The group commissioned its first hydro power plant - Tawa-
13.5 MW located in Madhya Pradesh in the year 1997. The Malana Hydroelectric
project was completed in July 2001 in 30 months. The Allain Duhangan Hydro
Electric Project in the State of Himachal Pradesh Project has been commissioned
form Allain side and the Duhangan side will be commissioned by July 2011.
NJC Hydropower Limited EIA study for Nyamjangchhu Hydroelectric Project
WAPCOS Limited 1-10
The Company also owns Indo Canadian Consultancy Services Limited, an
engineering consultancy company set up in collaboration with RSW International,
Canada for providing consultancy to power projects.
1.6 POLICY, LEGAL AND ADMINISTRATIVE FRAMEWORK
The principal Environmental Regulatory Agency in India is the Ministry of
Environment and Forests (MOEF), Government of India. MOEF formulates
environmental policies and accords environmental clearance for the projects. The
State Pollution Control Board (SPCB) accords No Objection Certificate (NOC)
Consent for Establishment and consent for Operation for the projects.
As per the guidelines pertaining to Environmental clearance issued by Ministry of
Environment and Forests (MoEF) dated September 14, 2006, the Terms of
Reference (TOR) for the EIA study is to be approved by MoEF. In this
connection, Form-I alongwith TOR in the prescribed format was submitted to
MoEF. The same was received by the Environmental Appraisal Committee of
River Valley Projects of MoEF. The TOR was approved by MoEF vide their letter
no. J-12011/87/2007/IA.I, dated 24.12.2009. A copy of the TOR approved by
MoEF is enclosed as Annexure-I.
1.7 SCOPE OF THE EIA STUDY
The brief scope of EIA study includes:
- Assessment of the existing status of physico-chemical, ecological and
socio-economic aspects of environment
- Identification of potential impacts on various environmental components
due to activities envisaged during construction and operation phases of
the proposed hydro-electric project.
- Prediction of significant impacts on various aspects of environment.
- Delineation of Environmental Management Plan (EMP) outlining measures
to minimize adverse impacts during construction and operational phases
of the proposed project.
- Formulation of Resettlement and Rehabilitation (R&R) Plan.
- Formulation of Catchment Area Treatment (CAT) Plan.
- Formulation of environmental quality monitoring programmes for
construction and operation phases.
- Estimation of Cost for implementation of Environmental Management Plan,
Resettlement and Rehabilitation Plan, Catchment Area Treatment Plan and
Environmental Monitoring Programme.
NJC Hydropower Limited EIA study for Nyamjangchhu Hydroelectric Project
WAPCOS Limited 1-11
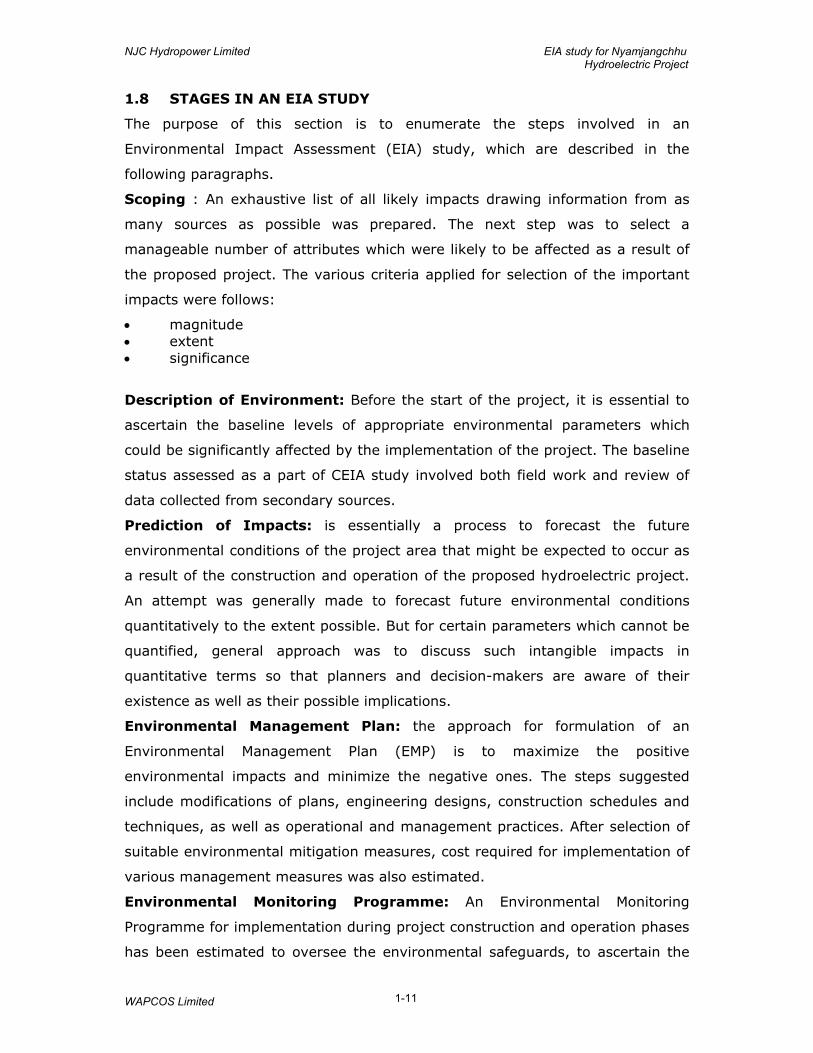
1.8 STAGES IN AN EIA STUDY
The purpose of this section is to enumerate the steps involved in an
Environmental Impact Assessment (EIA) study, which are described in the
following paragraphs.
Scoping : An exhaustive list of all likely impacts drawing information from as
many sources as possible was prepared. The next step was to select a
manageable number of attributes which were likely to be affected as a result of
the proposed project. The various criteria applied for selection of the important
impacts were follows:
• magnitude • extent • significance
Description of Environment: Before the start of the project, it is essential to
ascertain the baseline levels of appropriate environmental parameters which
could be significantly affected by the implementation of the project. The baseline
status assessed as a part of CEIA study involved both field work and review of
data collected from secondary sources.
Prediction of Impacts: is essentially a process to forecast the future
environmental conditions of the project area that might be expected to occur as
a result of the construction and operation of the proposed hydroelectric project.
An attempt was generally made to forecast future environmental conditions
quantitatively to the extent possible. But for certain parameters which cannot be
quantified, general approach was to discuss such intangible impacts in
quantitative terms so that planners and decision-makers are aware of their
existence as well as their possible implications.
Environmental Management Plan: the approach for formulation of an
Environmental Management Plan (EMP) is to maximize the positive
environmental impacts and minimize the negative ones. The steps suggested
include modifications of plans, engineering designs, construction schedules and
techniques, as well as operational and management practices. After selection of
suitable environmental mitigation measures, cost required for implementation of
various management measures was also estimated.
Environmental Monitoring Programme: An Environmental Monitoring
Programme for implementation during project construction and operation phases
has been estimated to oversee the environmental safeguards, to ascertain the
NJC Hydropower Limited EIA study for Nyamjangchhu Hydroelectric Project
WAPCOS Limited 1-12
agreement between prediction and reality and to suggest remedial measures not
foreseen during the planning stage but arising during operation and to generate
data for further use.
1.9 OUTLINE OF THE REPORT
The document for the Comprehensive EIA study for the proposed Nyamjangchhu
hydroelectric project has been presented in two volumes. Volume-I presents the
Environmental Impact Assessment (EIA) study and Volume-II delineates the
Environmental Management Plan. The present document (Volume 1) outlines the
findings of the EIA study for the proposed Nyamjangchhu hydroelectric project.
The contents of the document are organized as follows:
Chapter-1 The Chapter gives an overview of the need for the project. The
policy, legal and administrative framework for environmental clearance has been
summarized. The objectives and need for EIA study too have been covered.
Chapter-2 gives a brief description of the proposed Nyamjangchhu hydroelectric
project.
Chapter-3 outlines the methodology adopted for conducting the Comprehensive
EIA study for the proposed Nyamjangchhu hydroelectric project.
Chapter-4 covers the hydrological aspects of the proposed Nyamjangchhu
hydroelectric project. The data was mainly collected form the DPR prepared for
the proposed Nyamjangchhu hydroelectric project.
Chapter-5 covers the environmental baseline conditions covering physical
aspects of environment. The baseline study involved both field work and review
of existing documents, which is necessary for identification of data which may
already have been collected for other purposes.
Chapter-6 presents the biological aspects of environment. The study is based
on collection of data from various secondary data sources. As a part of the
Comprehensive EIA study, detailed ecological survey for was conducted for three
seasons. The findings of the survey were analysed and ecological characteristics
of the study area have been described in this Chapter.
Chapter-7 covers pre-project environmental baseline conditions covering socio-
economic aspects of environment. The baseline study involved data collection
using primary as well as secondary sources of data and public consultation.
Chapter-8 describes the anticipated positive and negative impacts as a result of
the construction and operation of the proposed Nyamjangchhu hydro-power
project. It is essentially a process to forecast the future environmental conditions
NJC Hydropower Limited EIA study for Nyamjangchhu Hydroelectric Project
WAPCOS Limited 1-13
of the project area that might be expected to occur as a result of the
construction and operation of the proposed project. An attempt was generally
made to forecast future environmental conditions quantitatively to the extent
possible. But for certain parameters, which cannot be quantified, general
approach has been to discuss such intangible impacts in qualitative terms so that
planners and decision-makers are aware of their existence as well as their
possible implications.
Chapter-9 gives a brief description of the methodology and schedule to adopted
for construction of the proposed Nyamjangchhu hydroelectric project.
NJC Hydropower Limited EIA study for Nyamjangchhu Hydroelectric Project
WAPCOS Limited 2-1
CHAPTER - 2
PROJECT DESCRIPTION
2.1 INTRODUCTION
The Nyamjang Chhu basin lies in the north-west area of Arunachal Pradesh
with its catchment spreading across international border covering part of Tibet.
Nyamjang Chhu originates from snow clad peaks in Tibet and flows in India
from north to south direction up to its confluence with Tawang Chhu. The total
catchment area of the Nyamjang Chhu up to the confluence with Tawang Chhu
is about 3170 km2. The catchment area up to diversion site near Zimithang is
about 2650 km2. The catchment area is mostly of tropical wet climate and
supports dense mixed forest. The area is characterized by hills with steep
gorges and deep rugged valleys with streams feeding Nyamjang Chhu River
system of which Takhsang Chhu and Sumta Chhu are major contributors.
Nyamjang Chhu Hydroelectric Project (HEP) is a run-of-the-river scheme with
reservoir having diurnal storage. The project is located in Tawang District of
Arunachal Pradesh. The project area is connected to other parts of the state
and Assam through road network and helicopter service.
The scheme envisages utilization of the available river flow at Zimithang and
gross head of about 1057.4 m between barrage and tailrace outfall near
confluence of Nyamjang Chhu with Tawang Chhu near Kumba village to
generate 780 MW in an underground power house. The Project is expected to
generate an annual energy of 3430.29 GWh, in 90% dependable year.
The diversion structure is proposed at Zimithang with FRL at El 2114.9 m.
Maximum Tail water level at the TRT outfall is El 1051.26 and the nozzle level
for Pelton turbines is proposed at El 1057.5 m providing a gross head for
power generation of 1057.4 m. The diversion of discharges from Taksang Chhu
to the water conductor system of Nyamjang Chhu HEP has been proposed at
an elevation EL.2151.4 m.
The total time schedule for the project construction is considered as 74-
months including 12-months for establishment of access roads,
infrastructural facilities and other pre-construction activities.
2.2 NYAMJANGCHHU RIVER BASIN
The Nyamjang Chhu basin lies in the north-west area of Arunachal Pradesh
with its catchment spreading across international border covering part of Tibet.
Nyamjang Chhu originates from snow clad peaks in Tibet and flows in India
NJC Hydropower Limited EIA study for Nyamjangchhu Hydroelectric Project
WAPCOS Limited 2-2
from north to south direction up to its confluence with Tawang Chhu. The total
catchment area of the Nyamjang Chhu up to the confluence with Tawang Chhu
is about 3170 km2. The catchment area intercepted up to diversion site near
Zimithang is about 2650 km2. The catchment area is mostly of tropical wet
climate and supports dense mixed forest. The area is characterized by hills
with steep gorges and deep rugged valleys with streams feeding Nyamjang
Chhu River system of which Takhsang Chhu and Sumta Chhu are major
contributors.
2.3 JUSTIFCIATION OF VARIOUS PROJECT ALTERNATIVES
Various aspects considered while selecting the scheme of Naymajangchhu HEP
are briefly described in the following paragraphs.
Topographical Aspects
Initial reconnaissance identified the suitable reach for project development
between Zimithang and Kumba villages. River bed Elevations at Zimithang and
at the confluence of Nyamjang Chhu with Tawang Chhu near Kumba village
are around El. 2106.2 m and El. 1041.4 m respectively. Topographical details
including physical features, villages, religious monuments and other structures
falling within the reach from Zimithang to the confluence were identified to
assess possible impacts of placing the project structures in development
alternatives.
Geomorphology of the area
The area is characterized by undulating dissected structural hills, which have
been denudated forming various features. The area near BTK Bridge is
characterized by massive landslides and a fault is located just upstream of the
Bridge. The area near Zimithang village is marked by flat river terraces and
flood plains. The river is about 200m wide at this location with very low
gradient making it suitable for the location of diversion structure.
Lithology
The general lithology observed in the area is as follows:
Phyllitic schist Schist with quartzitic bands Quartzite Gneiss with quartzitic bands Gneiss
NJC Hydropower Limited EIA study for Nyamjangchhu Hydroelectric Project
WAPCOS Limited 2-3
This is a metamorphic terrain and rock types are generally competent enough
for most project components. Major faults such as MCT, MBT are not traced in
the project area.
Social Aspects
The BTK Bridge is an important bridge linking the habitations in Zimithang and
other higher reaches of Lumla sub-division in Tawang district. Safety of this
bridge is required from adverse impact due to development of the project.
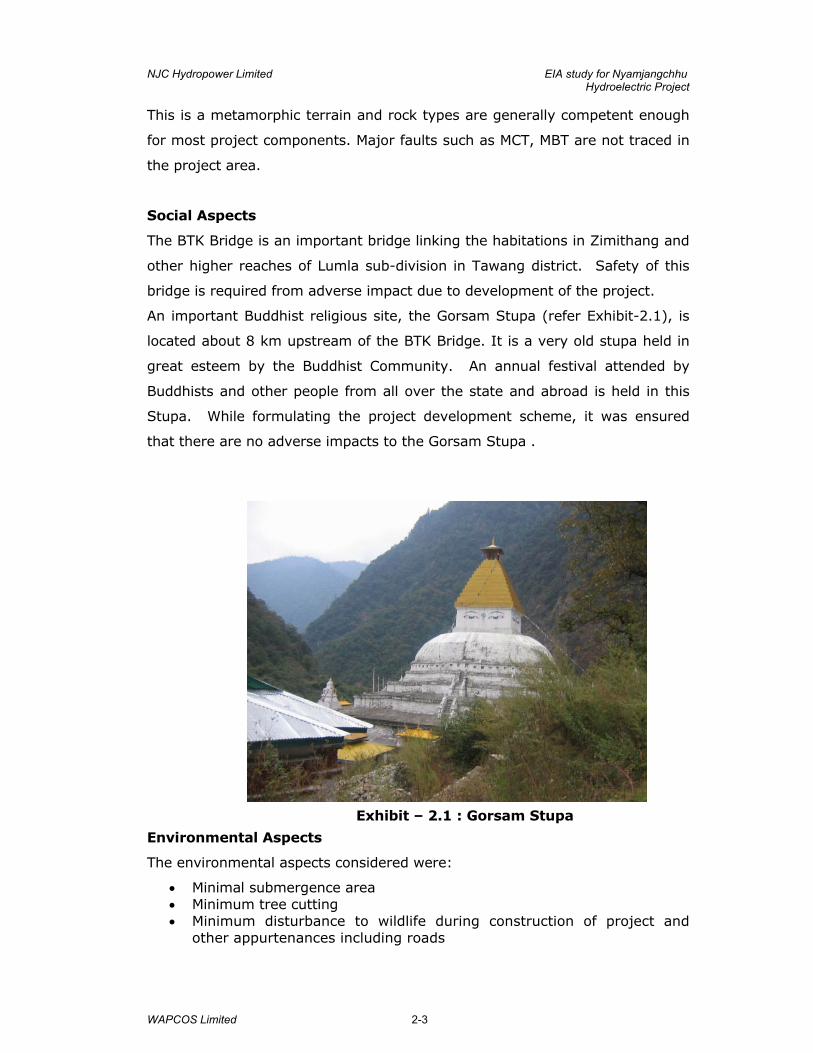
An important Buddhist religious site, the Gorsam Stupa (refer Exhibit-2.1), is
located about 8 km upstream of the BTK Bridge. It is a very old stupa held in
great esteem by the Buddhist Community. An annual festival attended by
Buddhists and other people from all over the state and abroad is held in this
Stupa. While formulating the project development scheme, it was ensured
that there are no adverse impacts to the Gorsam Stupa .
Exhibit – 2.1 : Gorsam Stupa
Environmental Aspects
The environmental aspects considered were:
• Minimal submergence area • Minimum tree cutting • Minimum disturbance to wildlife during construction of project and
other appurtenances including roads
NJC Hydropower Limited EIA study for Nyamjangchhu Hydroelectric Project
WAPCOS Limited 2-4
Alternatives Studied
The barrage site at Zimithang has been selected near Zimithang for the
following reasons:
provides the possibility for harnessing the highest feasible head
suitable for development in the Nyamjang Chhu.
height of the diversion structure is low as river gradient in this
reach is flat and the width of the river is sufficient to provide
peaking storage. The effect of seismicity on the diversion structure
will also be low.
minimal disturbance to the local population.
No impact on Gorsam stupa.
No adverse geological feature is observed in the vicinity of this
location.
Sufficient space for construction of barrage & desanding works
and for contractor’s facilities.
The study of geological features and field investigations suggest the depth of
rock available in this location varies from 60 to 90 m, as a result, barrage type
diversion structure is proposed.
As a part of DPR, four alternatives were studied. In all four alternatives,
barrage type diversion structure is proposed at Zimithang at river bed
elevation of 2106.2 m and Power House on the left Bank near Namstering
Village with tailrace discharging at EL. 1051.26 m.
Alternative – I
This alternative proposes the water conductor system and powerhouse on the
right bank of river Nyamjang Chhu. A Head regulator, feeder channel &
Surface Desilting Basin are planned on Right bank for diverting the design
discharge through a 31.44 km long Head Race Tunnel to a pressure shaft
leading to the turbines for power generation in underground power station.
The length of the TRT, MAT and Pressure Shaft are about 1800 m, 1090 m and
1335 m respectively.
The proposed project components on the right bank are approachable only to
the limited length of the river from the existing available road network. There
are about 11 first order streams on the right bank draining into Nyamjang
Chhu in the project reach under consideration. These further join to form
second and third order streams. It is also observed that tributaries to the
Nyamjang Chhu are more deeply incised on the right bank and therefore the
right bank alternative requires longer water conductor system and associated
NJC Hydropower Limited EIA study for Nyamjangchhu Hydroelectric Project
WAPCOS Limited 2-5
works within the development reach of the river. The length of road network
to be developed in the area for project development is about 75 km with
construction of two major bridges across Nyamjang Chhu.
Alternative – II
This alternative proposes the water conductor system and powerhouse on the
left bank of Nyamjang Chhu having the diversion structure at Zimithang and
power House near confluence of Nyamjang Chhu with Tawang Chhu. A
Barrage is proposed. The head regulator, feeder channel, surface desilting
chamber and HRT intake are proposed on left bank. Underground Power
House is proposed near Kumba Village. TRT level at the outfall is El 1045.12
m. The length of the TRT, MAT and Pressure Shaft are about 1546 m, 1080 m
and 2550 m respectively.
The HRT is aligned on left bank with 6 Nos. of adits. Surge shaft is located at
elevation El 2181.40 and is open to sky. The location of the surge shaft on the
left bank is fixed for all the alternatives due to topographical limitations. All the
main project components are approachable in this alternative. The length of
the pressure shaft in this alternative is maximum and will involve huge steel
cost. The length of HRT is 23.407km.
Alternative – III
This alternative is on the left bank of river Nyamjang Chhu, The diversion
structure is placed at Zimithang at the river bed elevation of El. 2106.20 m
and Power House on the Left Bank near Gispu Village just upstream of the
Gomkarang Chhu nala. The proposed gross storage required at Zimithang is
0.95 Mcum with FRL at El. 2114.90 m and MDDL at El. 2112.02 m
respectively. A gated barrage with overflow structure near Zimithang village
with head regulator & Surface Desilting Basin on Left bank is planned for
diverting the design discharge through a 19.607 km long Head Race Tunnel to
a pressure shaft leading to the turbines for power generation in underground
power station located near Gispu Village. The length of the TRT, MAT and
Pressure Shaft are about 5846 m, 1375 m and 1000 m respectively.
NJC Hydropower Limited EIA study for Nyamjangchhu Hydroelectric Project
WAPCOS Limited 2-6
The location of the HRT intake is near the desilting Chamber. The length of the
feeder Channel is reduced in this arrangement leading to increased length of
the silt flushing arrangement. The HRT is aligned on left bank with 5 No. adits.
Surge shaft is located at elevation El 2171.40 and is underground. All the main
project components are approachable in this alternative. The length of the HRT
and pressure shaft is minimum in this alternative; however power house is to
be located 100 m below the river bed for full utilisation of the available head
for power generation.
Alternative – IV
This alternative is on the left bank of river Nyamjang Chhu, The diversion
structure is placed at Zimithang at the river bed elevation of 2106.20 m and
Power House on the Left Bank near Kharteng Village just upstream of the
confluence of Nyamjang Chhu with Tawang Chhu. The proposed gross storage
required at Zimithang is 0.95 M cum with FRL at El 214.90 m and MDDL at El.
2112.02 m respectively. A gated barrage near Zimithang village with head
regulator, Surface Desilting Basin on Left bank is planned for diverting the
design discharge through a 23.450km long Head Race Tunnel to a pressure
shaft leading to the turbines for power generation in underground power
station located near Gispu Village. The length of the TRT, MAT and Pressure
Shaft are about 1965 m, 1010 m and 2530 m respectively.
The location of the HRT intake is near the desilting Chamber after 600 m long
feeder Channel from head regulator. The HRT is aligned on left bank with 6 No.
adits. Surge shaft is located at El 2171.40 and is open to sky. All the main
project components are approachable in this alternative. The length of the
pressure shaft and MAT is optimal in this alternative considering the overall
scheduling of the project.
Comparison of Alternatives
The selection of optimal alternatives for Nyamjang Chhu H.E. Project is based
on the comprehensive study of the four alternatives described above. The
assessment of each alternative is based on detailed investigations and studies
covering assessment of geology, topographical features, and possibility of
utilisation of maximum head, storage characteristics, alignment of water
conductor system and other relevant parameters. After considering the above
factors, alternative – IV is adopted.
The main consideration for selection of Alternative –IV included the following:
NJC Hydropower Limited EIA study for Nyamjangchhu Hydroelectric Project
WAPCOS Limited 2-7
Left bank is suitable for development of the project based on
accessibility and geological considerations.
Most of the project components are easily accessible in this
alternative.
Utilizes the total head available in the reach.
Length of the main access tunnel (MAT), Pressure Shaft is suitable
from construction point of view.
Alternative – I on the right bank requires large network of roads to
be developed besides longer length of water conductor system due
to presence of deeply incised streams. This alternative would have
some adverse impact on the old Buddhist stupa on right bank which
is held in great esteem by the local population.
Alternative – II has a very long length of the pressure shaft and
also involves heavy cutting of the river bed for the silt flushing
arrangement.
Alternative - III has the high risk of seepage problem in utilising
the full head as the power house is located about 100 m below the
river bed. The length of the TRT is also on a higher side; thus
leading to minor loss of head as well as construction problems.
As the location of the diversion structure is almost same in all the
alternatives, the considerations on the alignment of tunnel,
approach to adits, length of the pressure shaft and location of the
power house favours Alternative – IV techno-economically.
Considering complete utilisation of the drop available in the river and
economics of cost of power generation, in the DPR, scheme under Alternative –
IV has been selected.
During the project planning stage, it was earlier planned to commission the
project with a capacity of 900 MW with a rated discharge of 99 cumec. The
present proposal envisages project capacity as 780 MW, with rated discharge
as 87 cumec. The reduction in rated discharge will lead to increased flow to the
tune of 12 cumec in the river stretch between the barrage site and the tail race
disposal site. This is an added advantage of the present proposal, as it will
also increase the Environmental Flows.
NJC Hydropower Limited EIA study for Nyamjangchhu Hydroelectric Project
WAPCOS Limited 2-8
2.4 PROJECT DETAILS
Major Project Components
The project envisages construction of barrage across Nyamjang Chhu River, a
head regulator, Feeder Channel, desilting chamber with collection pool &
intake, a headrace tunnel, surge shaft, pressure shafts, underground
powerhouse and tailrace tunnel. The project layout plan is enclosed as Figure-
2.1. The project components are described in the following paragraphs.
Barrage
Average bed level at barrage site is El. 2106.2 m. FRL is fixed at EL 2114.9 m
and MDDL at EL 2112.2 m keeping in view peaking storage and the inflow of
water in Nyamjang Chhu during lean period. The top of the barrage has been
proposed at EL 2116.4 m. The barrage has been provided with spillway for
passing of Design flood with 11 bays each 10 m wide and 7.5 m high having
crest at elevation of EL 2107.4 m. The under sluice has been provided with 3
bays each of 5 m width and 6.3 m high having crest at elevation of EL
2105.9 m.
Intake and Desilting Arrangement
The head regulator, desilting basin and power intake systems are proposed on
the left bank of river Nyamjang Chhu. The Head regulator has 8 gates of 4 m x
6.5 m each. Feeder channel up to the desilting basin is 600 m long and 20 m
wide and is divided into four compartments. The flow depth in the feeder
channel is 3.55 m. Eight desilting basins are proposed each having a width of
10.5m and length of 150 m for removal of silt particle of size 0.2mm and
above. The invert level of the tunnel intake structure has been kept at
EL.2093.4 taking into consideration the water seal requirement to prevent
vortex formation and air entrainment. The intake structure has been provided
with trash racks to prevent entry of trash in the water conductor system.
Head Race Tunnel
A 23.450 km long, 6.2 m dia circular concrete lined HRT has been designed to
carry design discharge of 87 m3/sec of water. Six (6) intermediate adits are
provided to facilitate the construction of headrace tunnel.
Surge Shaft
A 240 m high, 4/10/12 m dia open to sky restricted orifice type surge shaft
has been designed to take care of the water hammer and mass oscillations due
to load variations.
NJC Hydropower Limited EIA study for Nyamjangchhu Hydroelectric Project
WAPCOS Limited 2-9
Butterfly Valve Chamber
Two (2) underground Butterfly valve chambers 12.5 m long, 12.5 m wide
and12.5 m high chambers have been provided to accommodate two Butterfly
valves of 3.3 m dia each. The chambers are inter-connected by a 5.0 m dia
connecting gallery.
Pressure Shaft
Two underground pressure shafts each of 3.3 m dia & 2103 m long steel lined
bifurcating into six shafts of 2.0 m diameter & 423 m long, are provided to
convey water to the six turbines in the power house.
Underground Power House Complex
An underground cavern of 166.3 m long x 20 m wide x 45 m high has been
provided to house 6 units of 130 MW Pelton turbines and spherical type main
inlet valves.
Transformer cavern 172.3 m long x 16.3 m wide x 24 m high has been
provided to accommodate 20 nos. single phase 13.8/ 420 kV transformers
including three spare transformers, each of 56 MVA capacity and 400 kV Gas
Insulated Switchgear (GIS).
Tail Race Tunnel (TRT)
A 1965 m long 7.0 m dia Circular shaped tunnel has been provided to carry a
total discharge from the turbines back to the river.
Transmission System
The power evacuation from the project would be carried out by the PGCIL as
per the recent regulation issued by CERC.
Project Benefits
The annual energy from the project has been assessed as 3430.29 GWh in
90% dependable year. The project would also provide peaking benefits of 780
MW round the year.
Project Cost
The Project is estimated to cost Rs 68522.8 million at December 2010 Price
Level. The details are given below:
a) Total direct charges including Civil and E&M works :Rs.5,0447.9 million b) Indirect Charges : Rs.71.1 million c) Escalation : Rs.5365.0 million d) IDC & Financial Charges : Rs.12638.8 million e) Total Complétion cost including IDC & Financing : Rs 68522.8 million
Charges
NJC Hydropower Limited EIA study for Nyamjangchhu Hydroelectric Project
WAPCOS Limited 2-10
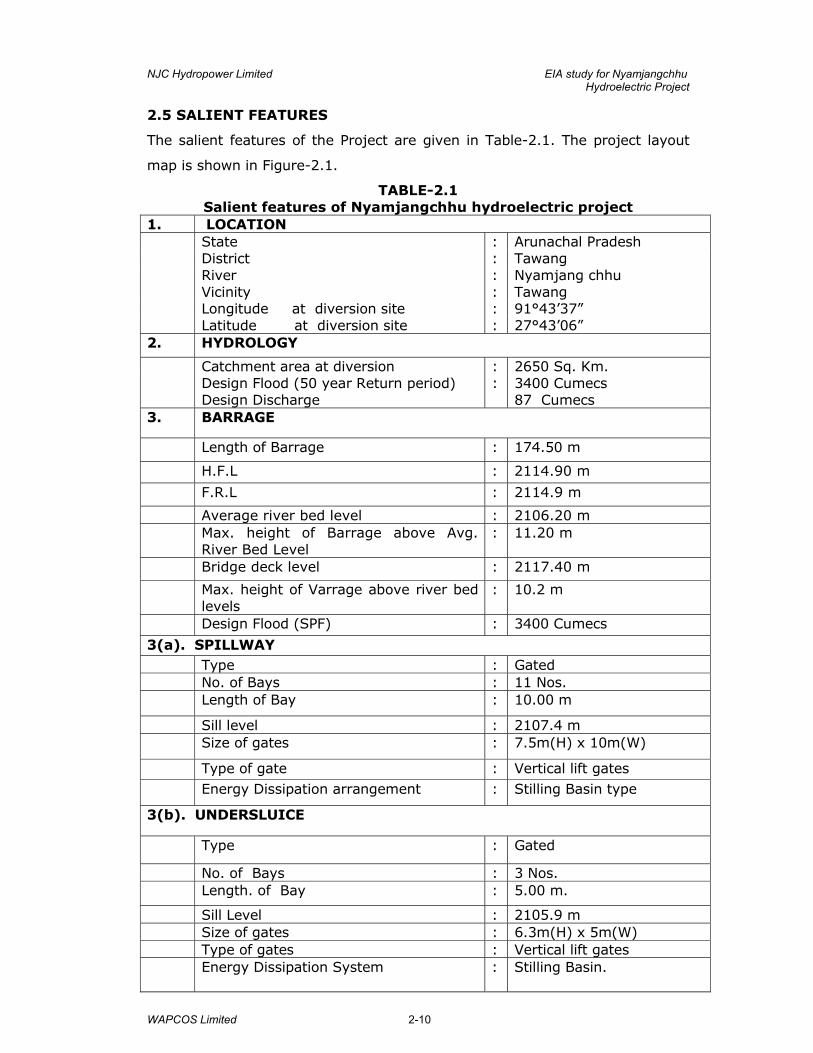
2.5 SALIENT FEATURES
The salient features of the Project are given in Table-2.1. The project layout
map is shown in Figure-2.1.
TABLE-2.1 Salient features of Nyamjangchhu hydroelectric project
1. LOCATION State : Arunachal Pradesh District : Tawang River : Nyamjang chhu Vicinity : Tawang Longitude at diversion site : 91°43’37” Latitude at diversion site : 27°43’06” 2. HYDROLOGY
Catchment area at diversion : 2650 Sq. Km. Design Flood (50 year Return period) : 3400 Cumecs Design Discharge 87 Cumecs 3. BARRAGE
Length of Barrage : 174.50 m
H.F.L : 2114.90 m
F.R.L : 2114.9 m
Average river bed level : 2106.20 m Max. height of Barrage above Avg.
River Bed Level : 11.20 m
Bridge deck level : 2117.40 m
Max. height of Varrage above river bed levels
: 10.2 m
Design Flood (SPF) : 3400 Cumecs
3(a). SPILLWAY Type : Gated No. of Bays : 11 Nos. Length of Bay : 10.00 m
Sill level : 2107.4 m Size of gates : 7.5m(H) x 10m(W)
Type of gate : Vertical lift gates Energy Dissipation arrangement : Stilling Basin type
3(b). UNDERSLUICE
Type : Gated
No. of Bays : 3 Nos. Length. of Bay : 5.00 m.
Sill Level : 2105.9 m Size of gates : 6.3m(H) x 5m(W) Type of gates : Vertical lift gates Energy Dissipation System : Stilling Basin.
NJC Hydropower Limited EIA study for Nyamjangchhu Hydroelectric Project
WAPCOS Limited 2-11
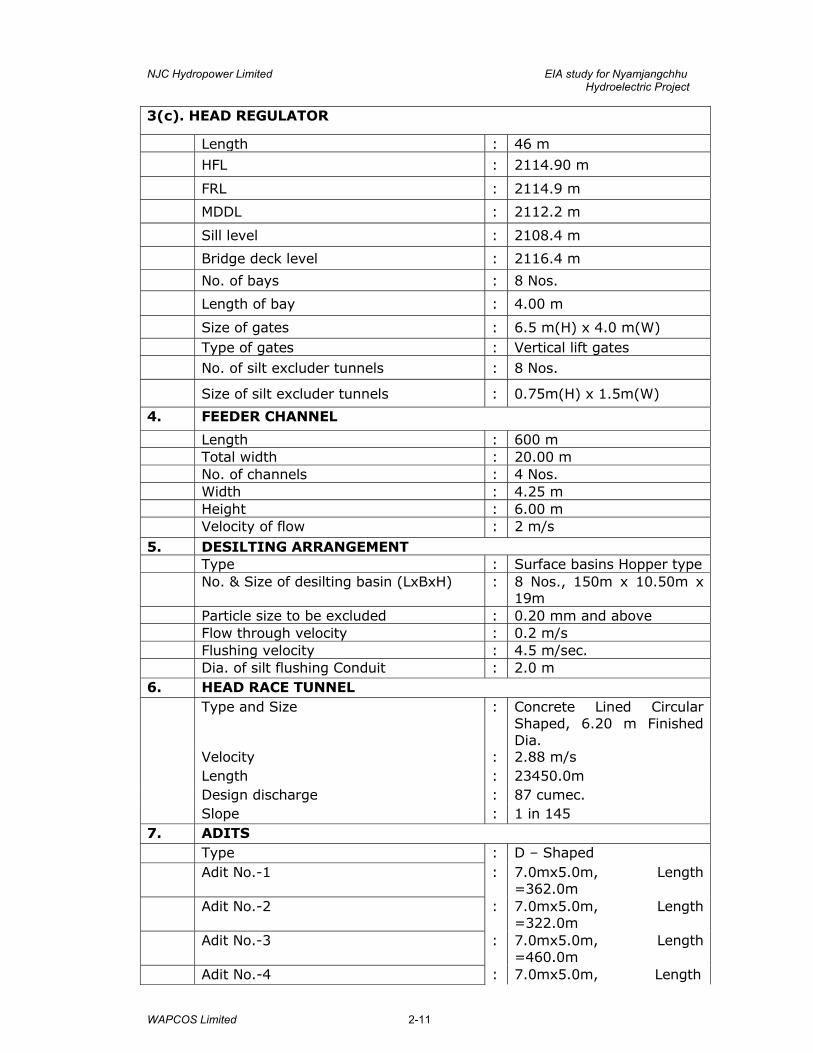
3(c). HEAD REGULATOR
Length : 46 m HFL : 2114.90 m
FRL : 2114.9 m MDDL : 2112.2 m Sill level : 2108.4 m Bridge deck level : 2116.4 m No. of bays : 8 Nos. Length of bay : 4.00 m
Size of gates : 6.5 m(H) x 4.0 m(W) Type of gates : Vertical lift gates No. of silt excluder tunnels : 8 Nos. Size of silt excluder tunnels : 0.75m(H) x 1.5m(W)
4. FEEDER CHANNEL
Length : 600 m Total width : 20.00 m No. of channels : 4 Nos. Width : 4.25 m Height : 6.00 m Velocity of flow : 2 m/s 5. DESILTING ARRANGEMENT Type : Surface basins Hopper type No. & Size of desilting basin (LxBxH) : 8 Nos., 150m x 10.50m x
19m Particle size to be excluded : 0.20 mm and above Flow through velocity : 0.2 m/s Flushing velocity : 4.5 m/sec. Dia. of silt flushing Conduit : 2.0 m 6. HEAD RACE TUNNEL Type and Size : Concrete Lined Circular
Shaped, 6.20 m Finished Dia.
Velocity : 2.88 m/s Length : 23450.0m Design discharge : 87 cumec. Slope : 1 in 145 7. ADITS Type : D – Shaped Adit No.-1 : 7.0mx5.0m, Length
=362.0m Adit No.-2 : 7.0mx5.0m, Length
=322.0m Adit No.-3 : 7.0mx5.0m, Length
=460.0m Adit No.-4 : 7.0mx5.0m, Length
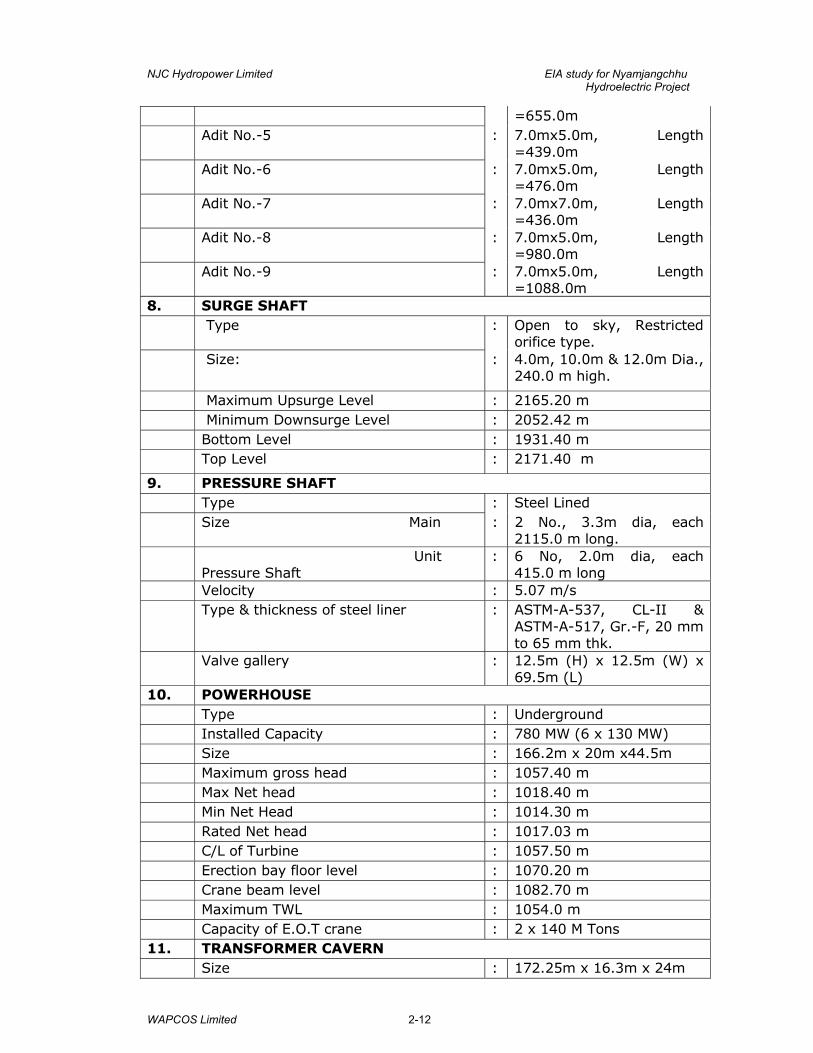
NJC Hydropower Limited EIA study for Nyamjangchhu Hydroelectric Project
WAPCOS Limited 2-12
=655.0m Adit No.-5 : 7.0mx5.0m, Length
=439.0m Adit No.-6 : 7.0mx5.0m, Length
=476.0m Adit No.-7 : 7.0mx7.0m, Length
=436.0m Adit No.-8 : 7.0mx5.0m, Length
=980.0m Adit No.-9 : 7.0mx5.0m, Length
=1088.0m 8. SURGE SHAFT Type : Open to sky, Restricted
orifice type. Size: : 4.0m, 10.0m & 12.0m Dia.,
240.0 m high.
Maximum Upsurge Level : 2165.20 m Minimum Downsurge Level : 2052.42 m Bottom Level : 1931.40 m Top Level : 2171.40 m
9. PRESSURE SHAFT Type : Steel Lined Size Main : 2 No., 3.3m dia, each
2115.0 m long. Unit
Pressure Shaft : 6 No, 2.0m dia, each
415.0 m long Velocity : 5.07 m/s Type & thickness of steel liner : ASTM-A-537, CL-II &
ASTM-A-517, Gr.-F, 20 mm to 65 mm thk.
Valve gallery : 12.5m (H) x 12.5m (W) x 69.5m (L)
10. POWERHOUSE Type : Underground Installed Capacity : 780 MW (6 x 130 MW) Size : 166.2m x 20m x44.5m Maximum gross head : 1057.40 m Max Net head : 1018.40 m Min Net Head : 1014.30 m Rated Net head : 1017.03 m C/L of Turbine : 1057.50 m Erection bay floor level : 1070.20 m Crane beam level : 1082.70 m Maximum TWL : 1054.0 m Capacity of E.O.T crane : 2 x 140 M Tons 11. TRANSFORMER CAVERN Size : 172.25m x 16.3m x 24m
NJC Hydropower Limited EIA study for Nyamjangchhu Hydroelectric Project
WAPCOS Limited 2-13
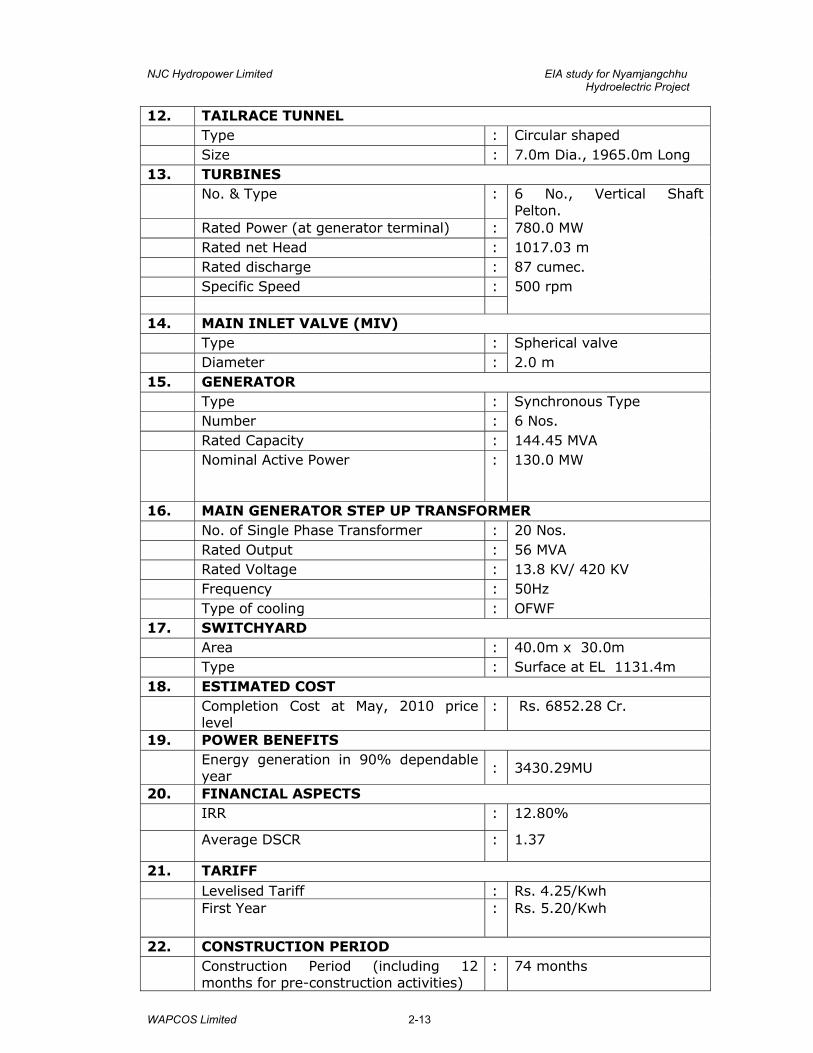
12. TAILRACE TUNNEL Type : Circular shaped Size : 7.0m Dia., 1965.0m Long 13. TURBINES No. & Type : 6 No., Vertical Shaft
Pelton. Rated Power (at generator terminal) : 780.0 MW Rated net Head : 1017.03 m Rated discharge : 87 cumec. Specific Speed : 500 rpm 14. MAIN INLET VALVE (MIV) Type : Spherical valve Diameter : 2.0 m 15. GENERATOR Type : Synchronous Type Number : 6 Nos. Rated Capacity : 144.45 MVA Nominal Active Power : 130.0 MW
16. MAIN GENERATOR STEP UP TRANSFORMER No. of Single Phase Transformer : 20 Nos. Rated Output : 56 MVA Rated Voltage : 13.8 KV/ 420 KV Frequency : 50Hz Type of cooling : OFWF 17. SWITCHYARD Area : 40.0m x 30.0m Type : Surface at EL 1131.4m 18. ESTIMATED COST Completion Cost at May, 2010 price
level : Rs. 6852.28 Cr.
19. POWER BENEFITS Energy generation in 90% dependable
year : 3430.29MU
20. FINANCIAL ASPECTS IRR : 12.80%
Average DSCR : 1.37
21. TARIFF Levelised Tariff : Rs. 4.25/Kwh First Year : Rs. 5.20/Kwh
22. CONSTRUCTION PERIOD Construction Period (including 12
months for pre-construction activities) : 74 months
NJC Hydropower Limited EIA study for Nyamjangchhu Hydroelectric Project
WAPCOS Limited 2-14
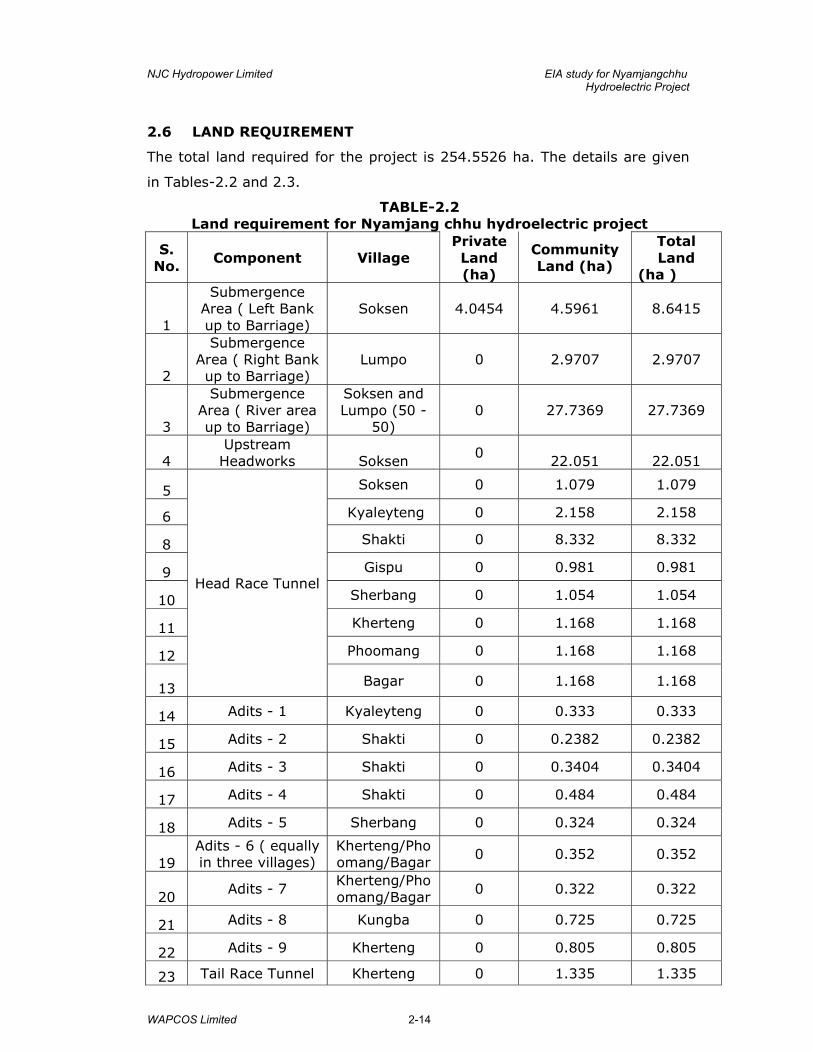
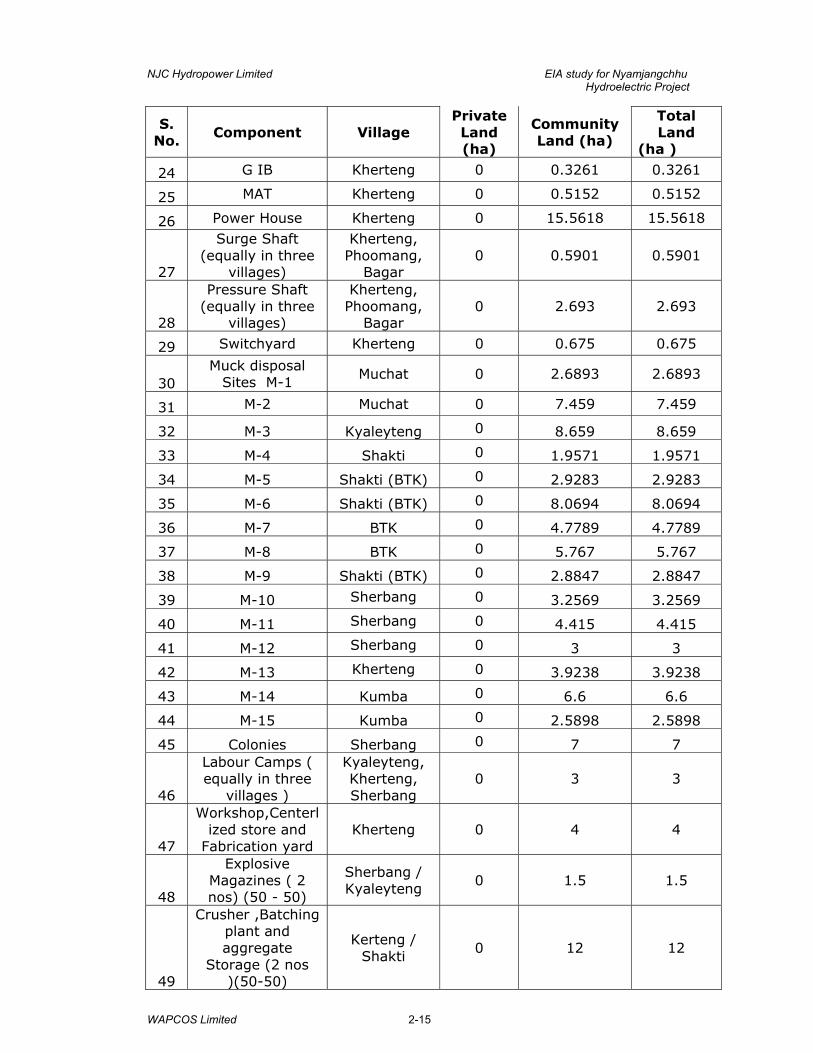
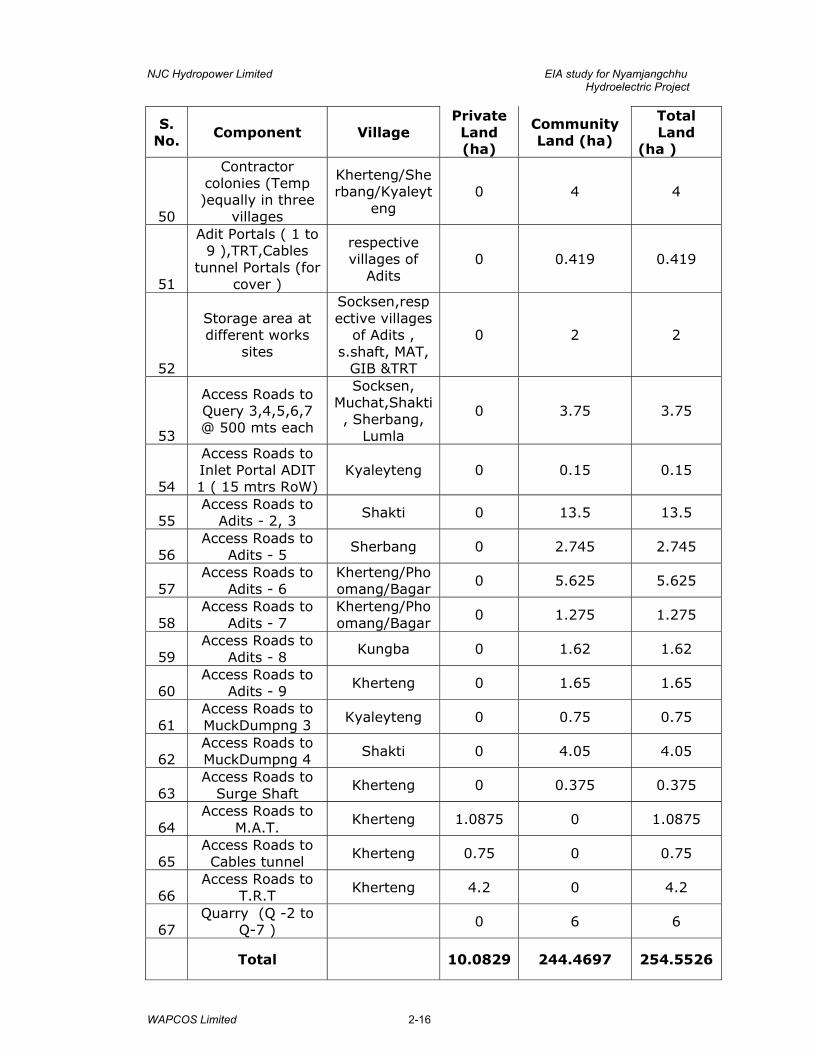
2.6 LAND REQUIREMENT
The total land required for the project is 254.5526 ha. The details are given
in Tables-2.2 and 2.3.
TABLE-2.2 Land requirement for Nyamjang chhu hydroelectric project
S. No. Component Village
Private Land (ha)
Community Land (ha)
Total Land
(ha )
1
Submergence Area ( Left Bank up to Barriage)
Soksen 4.0454 4.5961 8.6415
2
Submergence Area ( Right Bank up to Barriage)
Lumpo 0 2.9707 2.9707
3
Submergence Area ( River area up to Barriage)
Soksen and Lumpo (50 -
50) 0 27.7369 27.7369
4 Upstream Headworks Soksen
0 22.051 22.051
5
Head Race Tunnel
Soksen 0 1.079 1.079
6 Kyaleyteng 0 2.158 2.158
8 Shakti 0 8.332 8.332
9 Gispu 0 0.981 0.981
10 Sherbang 0 1.054 1.054
11 Kherteng 0 1.168 1.168
12 Phoomang 0 1.168 1.168
13 Bagar 0 1.168 1.168
14 Adits - 1 Kyaleyteng 0 0.333 0.333
15 Adits - 2 Shakti 0 0.2382 0.2382
16 Adits - 3 Shakti 0 0.3404 0.3404
17 Adits - 4 Shakti 0 0.484 0.484
18 Adits - 5 Sherbang 0 0.324 0.324
19 Adits - 6 ( equally in three villages)
Kherteng/Phoomang/Bagar
0 0.352 0.352
20 Adits - 7
Kherteng/Phoomang/Bagar
0 0.322 0.322
21 Adits - 8 Kungba 0 0.725 0.725
22 Adits - 9 Kherteng 0 0.805 0.805
23 Tail Race Tunnel Kherteng 0 1.335 1.335
NJC Hydropower Limited EIA study for Nyamjangchhu Hydroelectric Project
WAPCOS Limited 2-15
S. No. Component Village
Private Land (ha)
Community Land (ha)
Total Land
(ha )
24 G IB Kherteng 0 0.3261 0.3261
25 MAT Kherteng 0 0.5152 0.5152
26 Power House Kherteng 0 15.5618 15.5618
27
Surge Shaft (equally in three
villages)
Kherteng, Phoomang,
Bagar 0 0.5901 0.5901
28
Pressure Shaft (equally in three
villages)
Kherteng, Phoomang,
Bagar 0 2.693 2.693
29 Switchyard Kherteng 0 0.675 0.675
30 Muck disposal
Sites M-1 Muchat 0 2.6893 2.6893
31 M-2 Muchat 0 7.459 7.459
32 M-3 Kyaleyteng 0 8.659 8.659
33 M-4 Shakti 0 1.9571 1.9571
34 M-5 Shakti (BTK) 0 2.9283 2.9283
35 M-6 Shakti (BTK) 0 8.0694 8.0694
36 M-7 BTK 0 4.7789 4.7789
37 M-8 BTK 0 5.767 5.767
38 M-9 Shakti (BTK) 0 2.8847 2.8847
39 M-10 Sherbang 0 3.2569 3.2569
40 M-11 Sherbang 0 4.415 4.415
41 M-12 Sherbang 0 3 3
42 M-13 Kherteng 0 3.9238 3.9238
43 M-14 Kumba 0 6.6 6.6
44 M-15 Kumba 0 2.5898 2.5898
45 Colonies Sherbang 0 7 7
46
Labour Camps ( equally in three
villages )
Kyaleyteng, Kherteng, Sherbang
0 3 3
47
Workshop,Centerlized store and
Fabrication yard Kherteng 0 4 4
48
Explosive Magazines ( 2 nos) (50 - 50)
Sherbang / Kyaleyteng
0 1.5 1.5
49
Crusher ,Batching plant and aggregate
Storage (2 nos )(50-50)
Kerteng / Shakti
0 12 12
NJC Hydropower Limited EIA study for Nyamjangchhu Hydroelectric Project
WAPCOS Limited 2-16
S. No. Component Village
Private Land (ha)
Community Land (ha)
Total Land
(ha )
50
Contractor colonies (Temp )equally in three
villages
Kherteng/Sherbang/Kyaleyt
eng 0 4 4
51
Adit Portals ( 1 to 9 ),TRT,Cables
tunnel Portals (for cover )
respective villages of
Adits 0 0.419 0.419
52
Storage area at different works
sites
Socksen,respective villages
of Adits , s.shaft, MAT,
GIB &TRT
0 2 2
53
Access Roads to Query 3,4,5,6,7 @ 500 mts each
Socksen, Muchat,Shakti, Sherbang,
Lumla
0 3.75 3.75
54
Access Roads to Inlet Portal ADIT 1 ( 15 mtrs RoW)
Kyaleyteng 0 0.15 0.15
55 Access Roads to
Adits - 2, 3 Shakti 0 13.5 13.5
56 Access Roads to
Adits - 5 Sherbang 0 2.745 2.745
57 Access Roads to
Adits - 6 Kherteng/Phoomang/Bagar
0 5.625 5.625
58 Access Roads to
Adits - 7 Kherteng/Phoomang/Bagar
0 1.275 1.275
59 Access Roads to
Adits - 8 Kungba 0 1.62 1.62
60 Access Roads to
Adits - 9 Kherteng 0 1.65 1.65
61 Access Roads to MuckDumpng 3
Kyaleyteng 0 0.75 0.75
62 Access Roads to MuckDumpng 4
Shakti 0 4.05 4.05
63 Access Roads to
Surge Shaft Kherteng 0 0.375 0.375
64 Access Roads to
M.A.T. Kherteng 1.0875 0 1.0875
65 Access Roads to Cables tunnel
Kherteng 0.75 0 0.75
66 Access Roads to
T.R.T Kherteng 4.2 0 4.2
67 Quarry (Q -2 to
Q-7 ) 0 6 6
Total 10.0829 244.4697 254.5526
NJC Hydropower Limited EIA study for Nyamjangchhu Hydroelectric Project
WAPCOS Limited 2-17
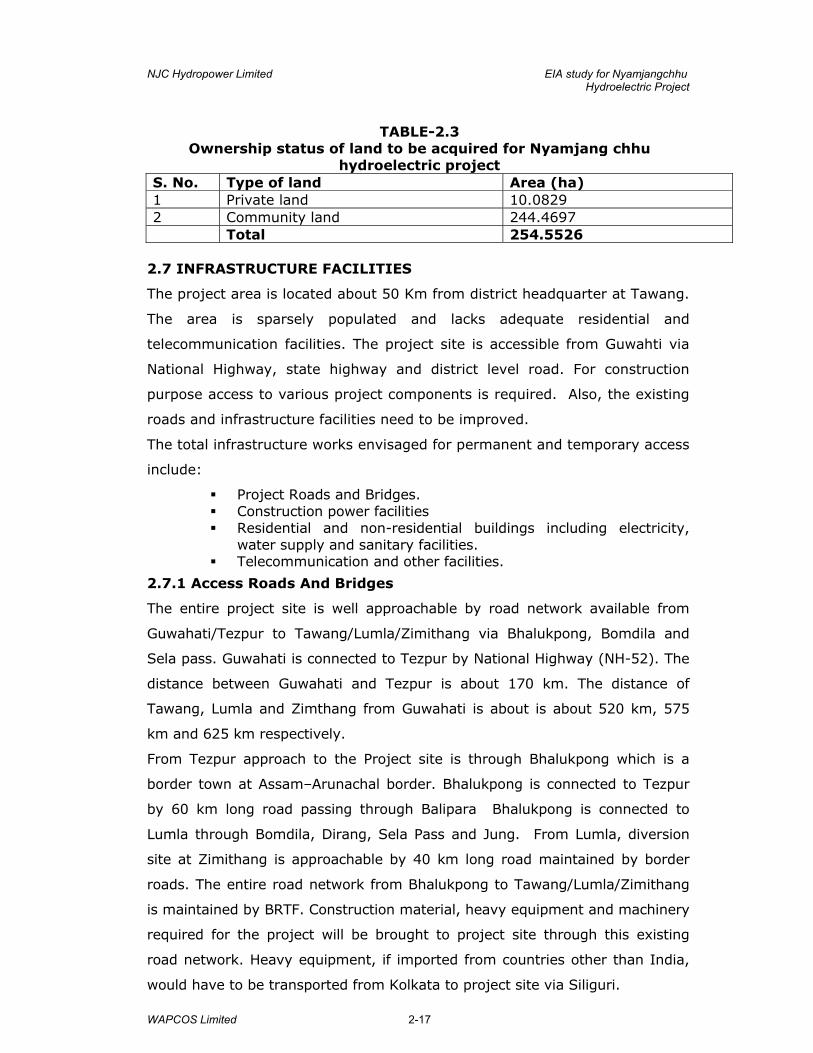
TABLE-2.3
Ownership status of land to be acquired for Nyamjang chhu hydroelectric project
S. No. Type of land Area (ha) 1 Private land 10.0829 2 Community land 244.4697 Total 254.5526
2.7 INFRASTRUCTURE FACILITIES
The project area is located about 50 Km from district headquarter at Tawang.
The area is sparsely populated and lacks adequate residential and
telecommunication facilities. The project site is accessible from Guwahti via
National Highway, state highway and district level road. For construction
purpose access to various project components is required. Also, the existing
roads and infrastructure facilities need to be improved.
The total infrastructure works envisaged for permanent and temporary access
include:
Project Roads and Bridges. Construction power facilities Residential and non-residential buildings including electricity,
water supply and sanitary facilities. Telecommunication and other facilities.
2.7.1 Access Roads And Bridges
The entire project site is well approachable by road network available from
Guwahati/Tezpur to Tawang/Lumla/Zimithang via Bhalukpong, Bomdila and
Sela pass. Guwahati is connected to Tezpur by National Highway (NH-52). The
distance between Guwahati and Tezpur is about 170 km. The distance of
Tawang, Lumla and Zimthang from Guwahati is about is about 520 km, 575
km and 625 km respectively.
From Tezpur approach to the Project site is through Bhalukpong which is a
border town at Assam–Arunachal border. Bhalukpong is connected to Tezpur
by 60 km long road passing through Balipara Bhalukpong is connected to
Lumla through Bomdila, Dirang, Sela Pass and Jung. From Lumla, diversion
site at Zimithang is approachable by 40 km long road maintained by border
roads. The entire road network from Bhalukpong to Tawang/Lumla/Zimithang
is maintained by BRTF. Construction material, heavy equipment and machinery
required for the project will be brought to project site through this existing
road network. Heavy equipment, if imported from countries other than India,
would have to be transported from Kolkata to project site via Siliguri.
NJC Hydropower Limited EIA study for Nyamjangchhu Hydroelectric Project
WAPCOS Limited 2-18
While going to project site along this road network Sela Pass is to be crossed,
which is located at an elevation of 14000 ft and most of the time in a year is
covered with snow. Existing road network passes through Bomdila town, which
is very congested and has a very steep gradient. Considering the above
constraints the project area is also proposed to be approached through
Trashigaon–Lumla road via Bhutan which is under construction and is likely to
be completed by the time the project is expected to be taken up for
construction. This road network is conncted to Guwahati via Rangiga
(Assam)–Samdrup Jongkhar (Bhutan)–Trashigaon route. The total length of
this route from Guwahati to Lumla is 575 km. It might therefore greatly benefit
the project construction as the distance between Guwahati to Lumla along this
oad would be further shortened.
The nearest airport is at Tezpur and Guwahati which are about 400 km and
570 km from site. Helicopter service is also available from Guwahati up to
Tawang on daily basis.
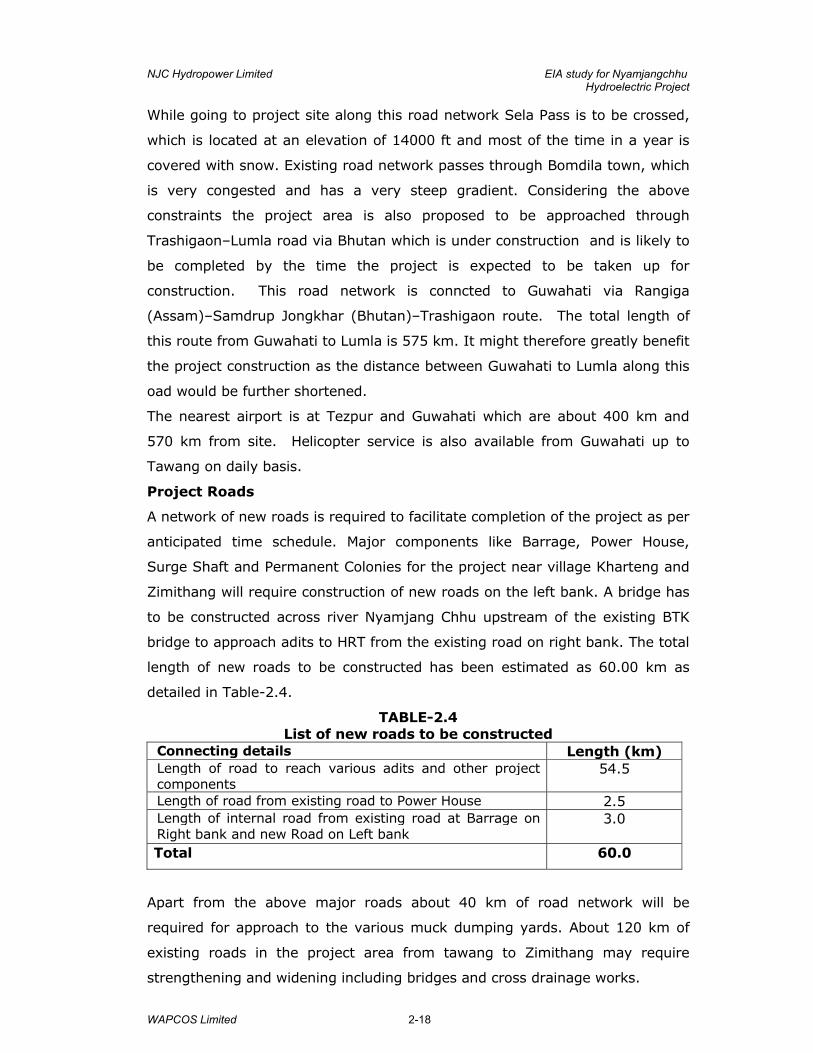
Project Roads
A network of new roads is required to facilitate completion of the project as per
anticipated time schedule. Major components like Barrage, Power House,
Surge Shaft and Permanent Colonies for the project near village Kharteng and
Zimithang will require construction of new roads on the left bank. A bridge has
to be constructed across river Nyamjang Chhu upstream of the existing BTK
bridge to approach adits to HRT from the existing road on right bank. The total
length of new roads to be constructed has been estimated as 60.00 km as
detailed in Table-2.4.
TABLE-2.4 List of new roads to be constructed
Connecting details Length (km) Length of road to reach various adits and other project components
54.5
Length of road from existing road to Power House 2.5 Length of internal road from existing road at Barrage on Right bank and new Road on Left bank
3.0
Total 60.0
Apart from the above major roads about 40 km of road network will be
required for approach to the various muck dumping yards. About 120 km of
existing roads in the project area from tawang to Zimithang may require
strengthening and widening including bridges and cross drainage works.
NJC Hydropower Limited EIA study for Nyamjangchhu Hydroelectric Project
WAPCOS Limited 2-19
Transportation And Transport Limitation
For transporting major equipment such as turbines, generators, main
transformers, spherical valves, etc, road link is available up to project site from
other locations of India through Assam State.
The National Highway in India is designed for class 70R loading as per Indian
Road Congress standard and is capable of carrying 70 ton load. The standard
further specifies that up to 100 tons can be transported by trailors with
multiple wheels.
The existing road from Tezpur to Lumla/Zimithang is of state highway
specifications. Beyond the present road upto – Tawang is of the class 9N. The
details are as follows:
Classification - 9 N (as per BRO standards) Culverts designed for - 18/24 Minimum Radius - 12.13m Carriage way - 3.66m Formation width - 6.10 m
This road also requires significant widening and strengthening along with
construction of new bridges and culverts designed to carry the load of heavy
machinery and equipment required for the project construction.
2.7.2 Construction Power
The maximum power required for constructions activities is estimated
considering capacity of electrically driven machines/equipment and
requirement of lighting, varies during the construction schedule and also
depends on construction methodology.
It is assessed that about 10 MW of power would be required during peak
construction period. However, construction power requirements during the
initial two years would be about 5 MW. The power requirement would be met
through installation and operation of dedicated DG sets.
2.7.3 Power Supply Facilities
Presently power requirements in the project area are being met through
33/11KV lines from Tawang. The project area experiences frequent power cuts
and break-downs. Power requirement for project construction is not suitable
to meet the existing system of power supply in the region. A new single circuit
33/11KV transmission line is also proposed from Tawang to Lumla and is under
planning stage. Even after up gradation the power supply system will not be
NJC Hydropower Limited EIA study for Nyamjangchhu Hydroelectric Project
WAPCOS Limited 2-20
suitable to meet the dedicated power demand from the project during
construction stage.
2.7.4 Telecommunication Facilities
The telecommunication facilities in the project area comprise of fixed line and
WLL services from BSNL. Mobile network is not available in the area and
nearest mobile network is available at Tawang and is served only by BSNL. For
effective coordination among various work sites, workshop, colonies, stores,
design office, head office, etc. and a reliable tele-communication network is
necessary. An electronic automatic telephone exchange with a capacity of
about 100 lines is proposed at project head quarters at Lumla. The internal
telephone system would be maintained by the project. Telecommunication link
outside the project area would be provided by upgrading the existing BSNL
network. A wireless V-Sat system is also proposed for linking the project site
with Zimithang, Namestring, Lumla, Tawang, Bhalukpong, Itanagar and Noida.
After completion of construction activities, the telecommunication network is
proposed to be continued so as to serve during operation and maintenance
stage.
A VHF wireless network is also proposed to be established to connect various
project sites, Guwahati and Tezpur. This will be mainly utilized for the
construction purpose and will be scaled down after commissioning.
It is also proposed that the project area may be connected by the mobile
network as available in other parts of the state.
2.7.5 Project Colonies/Buildings
The Residential and non-residential facilities are required during construction
and O&M phase of the project. The same will be met by constructing suitable
colonies near Lumla, Kharteng,and Zimithang villages.
Total area required for the permanent buildings has been estimated as 17000
m2 and for temporary buildings as 22500 m2.
The temporary colonies would be utilized during construction of the project and
permanent colonies would be utilized for both i.e, during construction and
maintenance of the project.
The water supply requirement shall be met with from the flow of near by
streams by gravity flow. The flow requirement sufficient to meet the likely
water demand is about 50lps.

NJC Hydropower Limited EIA study for Nyamjangchhu Hydroelectric Project
WAPCOS Limited 2-21
The entire building construction program would be suitably phased to match
with the construction activities. Priority would be given to the construction of
field hostel, stores and temporary residential and non-residential buildings.
It is also planned to have liaison facilities at Guwahati, Tezpur, Itanagar,
Bomdilla and at Bhalukpong. A suitable storage area would also be made in
Bhalukpong to keep the buffer for the stock of construction materials for the
monsoon period etc. Guest Houses are also planned at Bhalukpong & Dirang.
Residential Non-residential Stores Recreation facilities Construction
NJC Hydropower Limited EIA study for Nyamjangchhu Hydroelectric Project
WAPCOS Limited 3-1
CHAPTER-3
METHODOLOGY ADOPTED FOR THE EIA STUDY
3.1 INTRODUCTION
Standard methodologies of Environment Impact Assessment have been followed
for conducting the CEIA study for the proposed Nyamjangchhu hydroelectric
project. A brief description of the methodology adopted for conducting the CEIA
study for the proposed Nyamjangchhu hydroelectric project is outlined in the
present chapter. The information presented in this Chapter has been presented
through various primary as well as secondary sources.
3.2 STUDY AREA
The study area considered for the CEIA study is given as below:
• Submergence area • Area within 10 km of the periphery of the submergence area • Area to be acquired for siting of various project appurtenances. • Area within 10 km of various project appurtenances • Catchment area intercepted at the barrage site
The study area is shown in Figure-3.1.
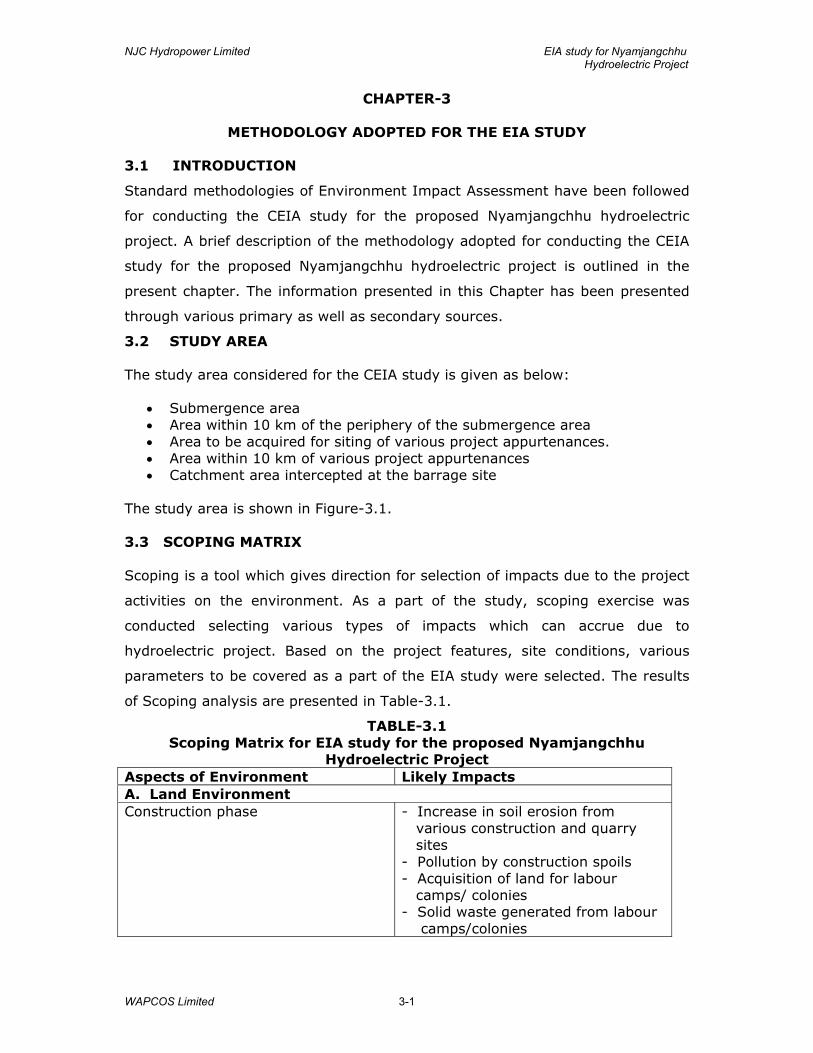
3.3 SCOPING MATRIX
Scoping is a tool which gives direction for selection of impacts due to the project
activities on the environment. As a part of the study, scoping exercise was
conducted selecting various types of impacts which can accrue due to
hydroelectric project. Based on the project features, site conditions, various
parameters to be covered as a part of the EIA study were selected. The results
of Scoping analysis are presented in Table-3.1.
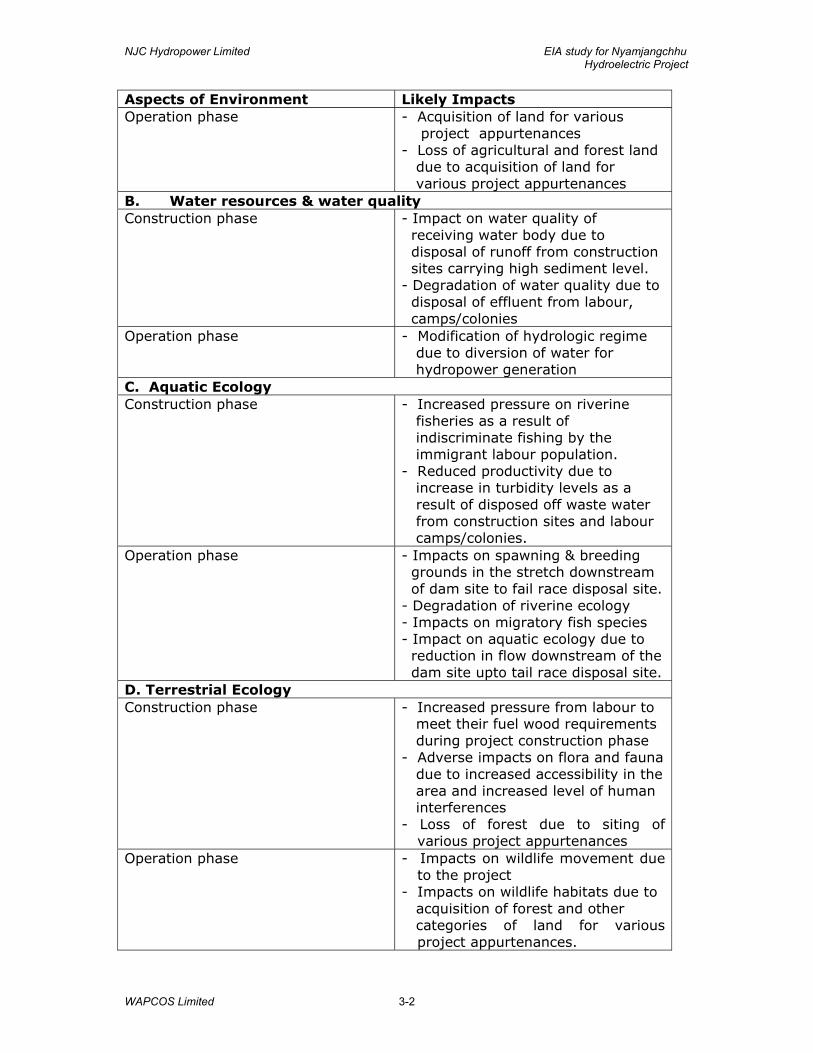
TABLE-3.1 Scoping Matrix for EIA study for the proposed Nyamjangchhu
Hydroelectric Project Aspects of Environment Likely Impacts A. Land Environment Construction phase - Increase in soil erosion from
various construction and quarry sites - Pollution by construction spoils - Acquisition of land for labour camps/ colonies - Solid waste generated from labour camps/colonies
NJC Hydropower Limited EIA study for Nyamjangchhu Hydroelectric Project
WAPCOS Limited 3-2
Aspects of Environment Likely Impacts Operation phase
- Acquisition of land for various project appurtenances - Loss of agricultural and forest land due to acquisition of land for various project appurtenances
B. Water resources & water quality Construction phase
- Impact on water quality of receiving water body due to disposal of runoff from construction sites carrying high sediment level. - Degradation of water quality due to disposal of effluent from labour, camps/colonies
Operation phase - Modification of hydrologic regime due to diversion of water for hydropower generation
C. Aquatic Ecology Construction phase - Increased pressure on riverine
fisheries as a result of indiscriminate fishing by the immigrant labour population. - Reduced productivity due to increase in turbidity levels as a result of disposed off waste water from construction sites and labour camps/colonies.
Operation phase - Impacts on spawning & breeding grounds in the stretch downstream of dam site to fail race disposal site. - Degradation of riverine ecology - Impacts on migratory fish species - Impact on aquatic ecology due to reduction in flow downstream of the dam site upto tail race disposal site.
D. Terrestrial Ecology Construction phase
- Increased pressure from labour to meet their fuel wood requirements during project construction phase - Adverse impacts on flora and fauna due to increased accessibility in the area and increased level of human interferences - Loss of forest due to siting of
various project appurtenances Operation phase
- Impacts on wildlife movement due to the project
- Impacts on wildlife habitats due to acquisition of forest and other categories of land for various
project appurtenances.

NJC Hydropower Limited EIA study for Nyamjangchhu Hydroelectric Project
WAPCOS Limited 3-3
Aspects of Environment Likely Impacts E. Socio-Economic Aspects Construction phase
- Increased employment potential during project construction phase - Development of allied sectors leading to greater employment - Pressure on existing infrastructure facilities. - Cultural conflicts and law and order
issues due to migration of labour population
Operation phase - Acquisition of private land, home- Stead and other private properties - Loss of community properties - Impacts on archaeological and cultural monuments, if any - Impacts on mineral reserves, if any
F. Air Pollution
Construction Phase - Impacts due to emission as a result of fuel combustion in various construction equipment
- Impacts due to emission as a result of increased vehicular movement for transportation of men and material during project construction phase
- Fugitive envisions from various sources
- Impacts due to emissions from DG set
G. Noise Pollution Construction Phase - Noise due to operation of various
construction equipment - Noise due to increased vehicular
movement - Impacts due to blasting - Increased noise levels due to
operation of DG set H. Public Health Construction Phase - Increased incidence of water
related diseases - Transmission of diseases by
immigrant labour population Operation phase - Increased incidence of vector-
borne diseases
Based on the Scoping matrix, the environmental baseline data has been
collected. The project details have been superimposed on environmental
baseline conditions to understand the beneficial and deleterious impacts due to
NJC Hydropower Limited EIA study for Nyamjangchhu Hydroelectric Project
WAPCOS Limited 3-4
the construction and operation of the proposed Nyamjangchhu hydroelectric
project.
3.4 DATA COLLECTION
3.4.1 Physico-Chemical Aspects
Primary surveys have been conducted for three seasons namely, monsoon ,
post-monsoon and pre-monsoon seasons. The data has been collected for flora,
fauna, forest types and ecological parameters, geological and soil features.
During these surveys data and information was collected on physico-chemical,
biological and socio-economic aspects of the study area. In addition, detailed
surveys and studies were also conducted for understanding bio-diversity in the
study area.
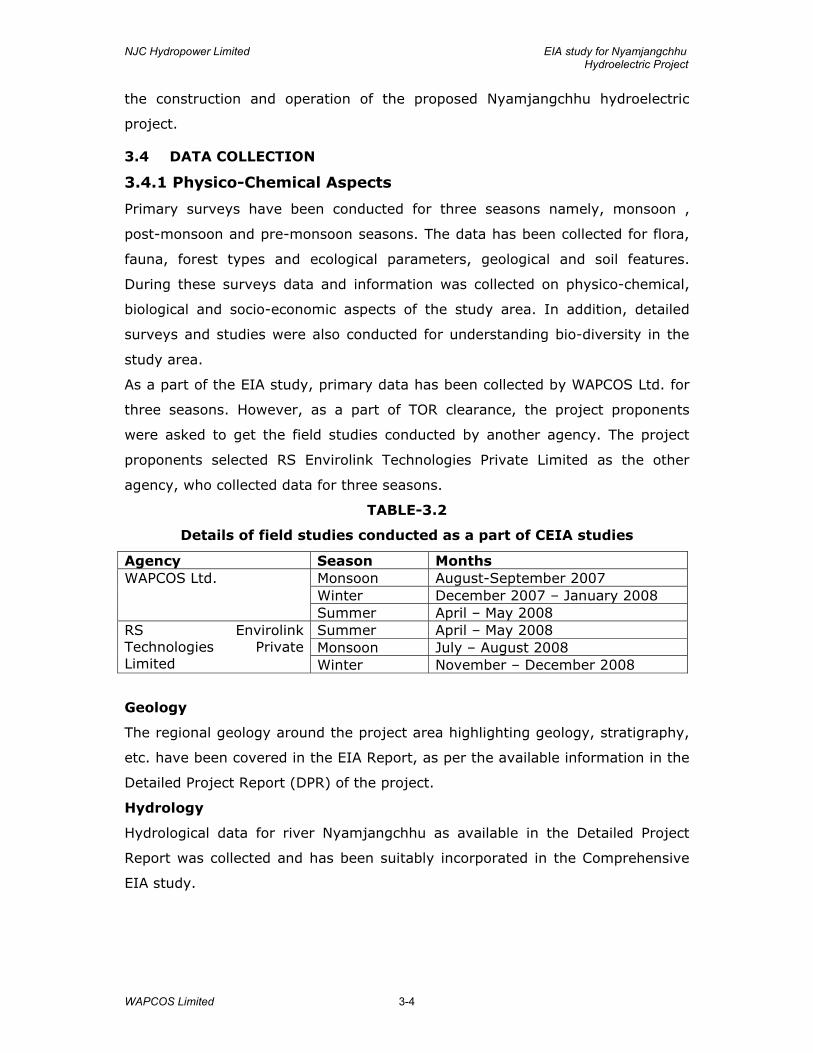
As a part of the EIA study, primary data has been collected by WAPCOS Ltd. for
three seasons. However, as a part of TOR clearance, the project proponents
were asked to get the field studies conducted by another agency. The project
proponents selected RS Envirolink Technologies Private Limited as the other
agency, who collected data for three seasons.
TABLE-3.2
Details of field studies conducted as a part of CEIA studies
Agency Season Months WAPCOS Ltd. Monsoon August-September 2007
Winter December 2007 – January 2008 Summer April – May 2008
RS Envirolink Technologies Private Limited
Summer April – May 2008 Monsoon July – August 2008 Winter November – December 2008
Geology
The regional geology around the project area highlighting geology, stratigraphy,
etc. have been covered in the EIA Report, as per the available information in the
Detailed Project Report (DPR) of the project.
Hydrology
Hydrological data for river Nyamjangchhu as available in the Detailed Project
Report was collected and has been suitably incorporated in the Comprehensive
EIA study.
NJC Hydropower Limited EIA study for Nyamjangchhu Hydroelectric Project
WAPCOS Limited 3-5
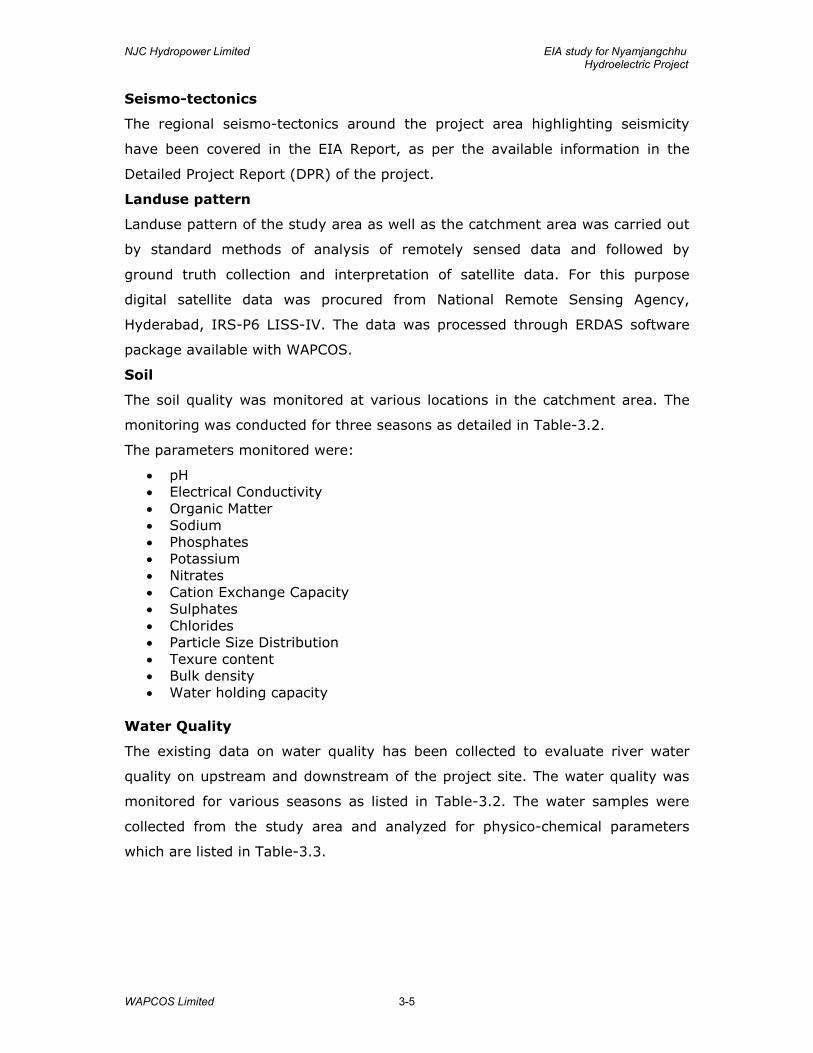
Seismo-tectonics
The regional seismo-tectonics around the project area highlighting seismicity
have been covered in the EIA Report, as per the available information in the
Detailed Project Report (DPR) of the project.
Landuse pattern
Landuse pattern of the study area as well as the catchment area was carried out
by standard methods of analysis of remotely sensed data and followed by
ground truth collection and interpretation of satellite data. For this purpose
digital satellite data was procured from National Remote Sensing Agency,
Hyderabad, IRS-P6 LISS-IV. The data was processed through ERDAS software
package available with WAPCOS.
Soil
The soil quality was monitored at various locations in the catchment area. The
monitoring was conducted for three seasons as detailed in Table-3.2.
The parameters monitored were:
• pH • Electrical Conductivity • Organic Matter • Sodium • Phosphates • Potassium • Nitrates • Cation Exchange Capacity • Sulphates • Chlorides • Particle Size Distribution • Texure content • Bulk density • Water holding capacity
Water Quality
The existing data on water quality has been collected to evaluate river water
quality on upstream and downstream of the project site. The water quality was
monitored for various seasons as listed in Table-3.2. The water samples were
collected from the study area and analyzed for physico-chemical parameters
which are listed in Table-3.3.
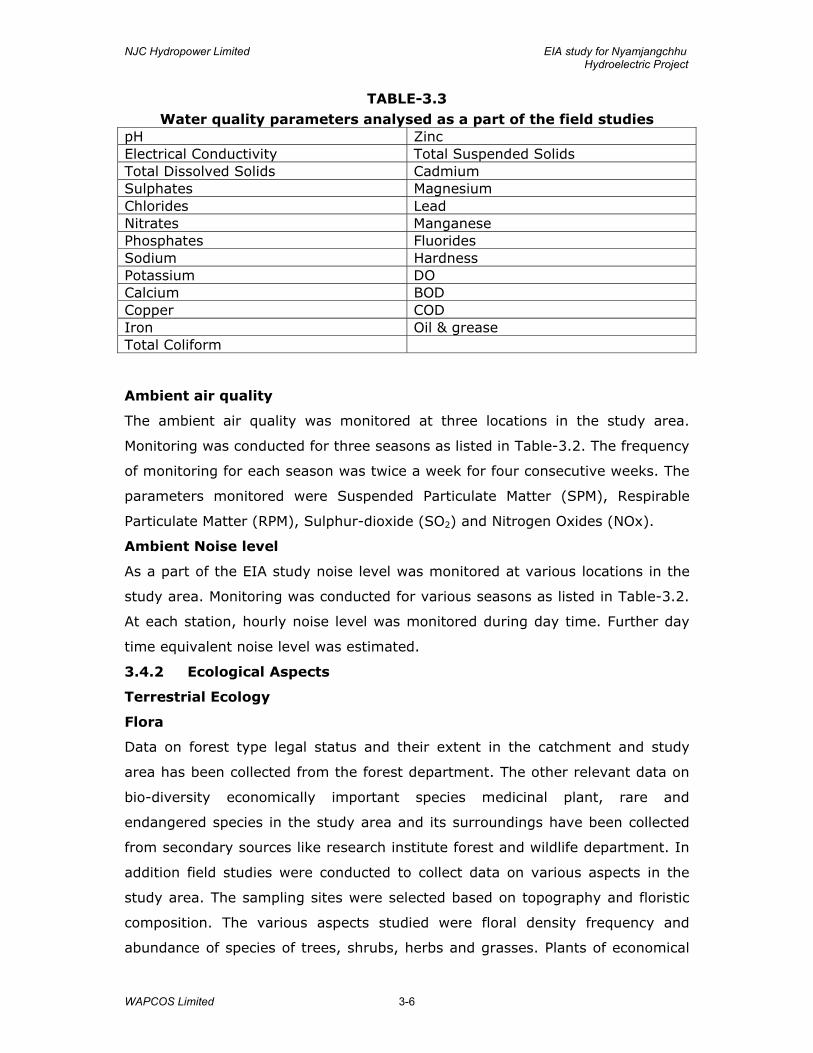
NJC Hydropower Limited EIA study for Nyamjangchhu Hydroelectric Project
WAPCOS Limited 3-6
TABLE-3.3 Water quality parameters analysed as a part of the field studies
pH Zinc Electrical Conductivity Total Suspended Solids Total Dissolved Solids Cadmium Sulphates Magnesium Chlorides Lead Nitrates Manganese Phosphates Fluorides Sodium Hardness Potassium DO Calcium BOD Copper COD Iron Oil & grease Total Coliform
Ambient air quality
The ambient air quality was monitored at three locations in the study area.
Monitoring was conducted for three seasons as listed in Table-3.2. The frequency
of monitoring for each season was twice a week for four consecutive weeks. The
parameters monitored were Suspended Particulate Matter (SPM), Respirable
Particulate Matter (RPM), Sulphur-dioxide (SO2) and Nitrogen Oxides (NOx).
Ambient Noise level
As a part of the EIA study noise level was monitored at various locations in the
study area. Monitoring was conducted for various seasons as listed in Table-3.2.
At each station, hourly noise level was monitored during day time. Further day
time equivalent noise level was estimated.
3.4.2 Ecological Aspects
Terrestrial Ecology
Flora
Data on forest type legal status and their extent in the catchment and study
area has been collected from the forest department. The other relevant data on
bio-diversity economically important species medicinal plant, rare and
endangered species in the study area and its surroundings have been collected
from secondary sources like research institute forest and wildlife department. In
addition field studies were conducted to collect data on various aspects in the
study area. The sampling sites were selected based on topography and floristic
composition. The various aspects studied were floral density frequency and
abundance of species of trees, shrubs, herbs and grasses. Plants of economical
NJC Hydropower Limited EIA study for Nyamjangchhu Hydroelectric Project
WAPCOS Limited 3-7
species and medicinal use and endangered species were also identified as a part
of the study. The monitoring was conducted for various seasons listed in Table-
3.2.
Fauna
The faunal assessment has been done on the basis secondary data collected
from different government offices like forest department, wildlife department,
fisheries department etc. The presence of wildlife was also confirmed from the
local inhabitants depending on the animal sightings and the frequency of their
visits in the catchment area. In addition review of secondary data was another
source of information for studying the fauna of the area. In addition, sightings of
faunal population during ecological survey and then field studies were also
recorded as a part of the data collection exercise.
Aquatic Ecology and Fisheries
Water samples from river Nyamjangchhu were also collected as a part of field
studies. The density and diversity of periphyton and phytoplanktons, species
diversity index and primary productivity etc. were also studied. The field studies
were conducted for various seasons as listed in Table-3.2.
The secondary data pertaining to fisheries in river Nyamjangchhu was collected
from Fisheries Department and through literature review as well. Fishing was
done at various sites in the project area and river stretches both upstream and
downstream of the dam site of proposed hydroelectric project to ascertain the
dispersal pattern of fish species. Identification and measurements of all the fish
catch was done and an inventory of the fish species was also prepared. Various
migratory species and the species to be affected due to conversion of lentic to
lotic conditions as a result of commissioning of the proposed project were also
identified.
3.4.3 Socio-economic Aspects
Demography
The demographic and socio-economic characteristics of the submergence area as
well as the study area have been studied through primary as well secondary
sources. Detailed socio-economic census survey was conducted in the project
affected villages due to the proposed project. Collection of data was completed
at two levels - at village/ block and individual household level. The socio-
economic survey at the village/ block level was aimed at finding out the status
and extent of amenities and resources at the disposal of villages/ blocks. The
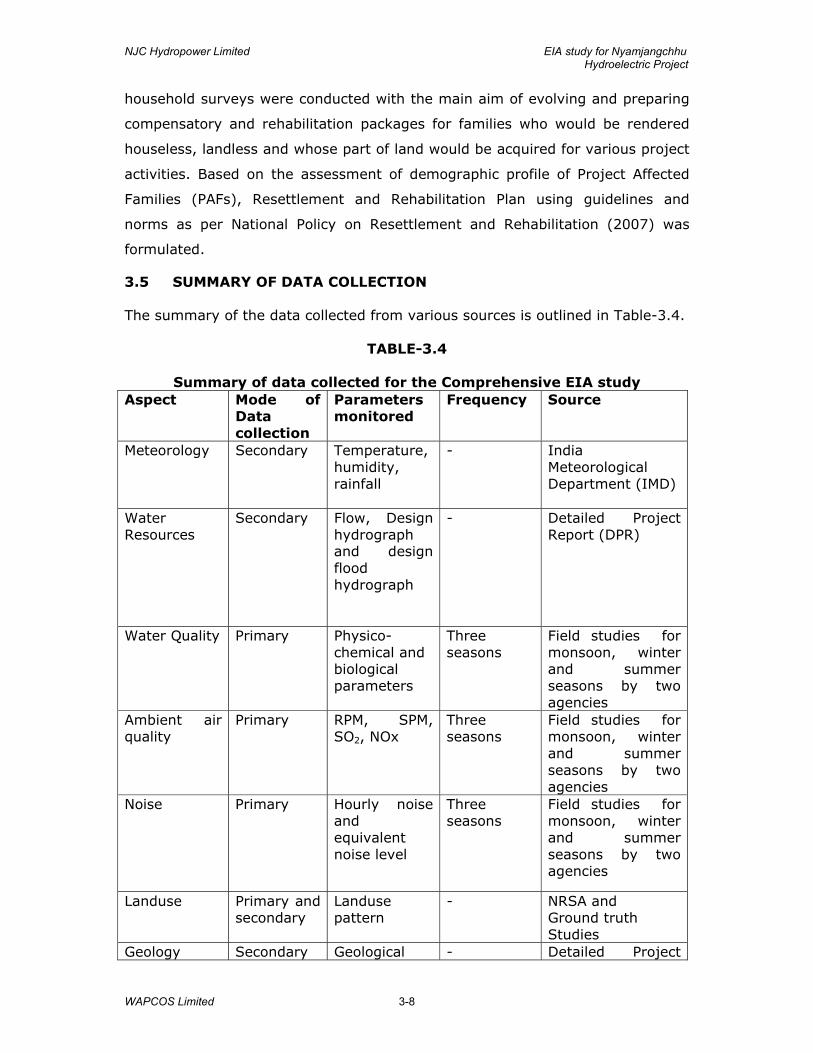
NJC Hydropower Limited EIA study for Nyamjangchhu Hydroelectric Project
WAPCOS Limited 3-8
household surveys were conducted with the main aim of evolving and preparing
compensatory and rehabilitation packages for families who would be rendered
houseless, landless and whose part of land would be acquired for various project
activities. Based on the assessment of demographic profile of Project Affected
Families (PAFs), Resettlement and Rehabilitation Plan using guidelines and
norms as per National Policy on Resettlement and Rehabilitation (2007) was
formulated.
3.5 SUMMARY OF DATA COLLECTION
The summary of the data collected from various sources is outlined in Table-3.4.
TABLE-3.4
Summary of data collected for the Comprehensive EIA study Aspect Mode of
Data collection
Parameters monitored
Frequency Source
Meteorology Secondary Temperature, humidity, rainfall
- India Meteorological Department (IMD)
Water Resources
Secondary Flow, Design hydrograph and design flood hydrograph
- Detailed Project Report (DPR)
Water Quality Primary Physico-chemical and biological parameters
Three seasons
Field studies for monsoon, winter and summer seasons by two agencies
Ambient air quality
Primary RPM, SPM, SO2, NOx
Three seasons
Field studies for monsoon, winter and summer seasons by two agencies
Noise Primary Hourly noise and equivalent noise level
Three seasons
Field studies for monsoon, winter and summer seasons by two agencies
Landuse Primary and secondary
Landuse pattern
- NRSA and Ground truth Studies
Geology Secondary Geological - Detailed Project
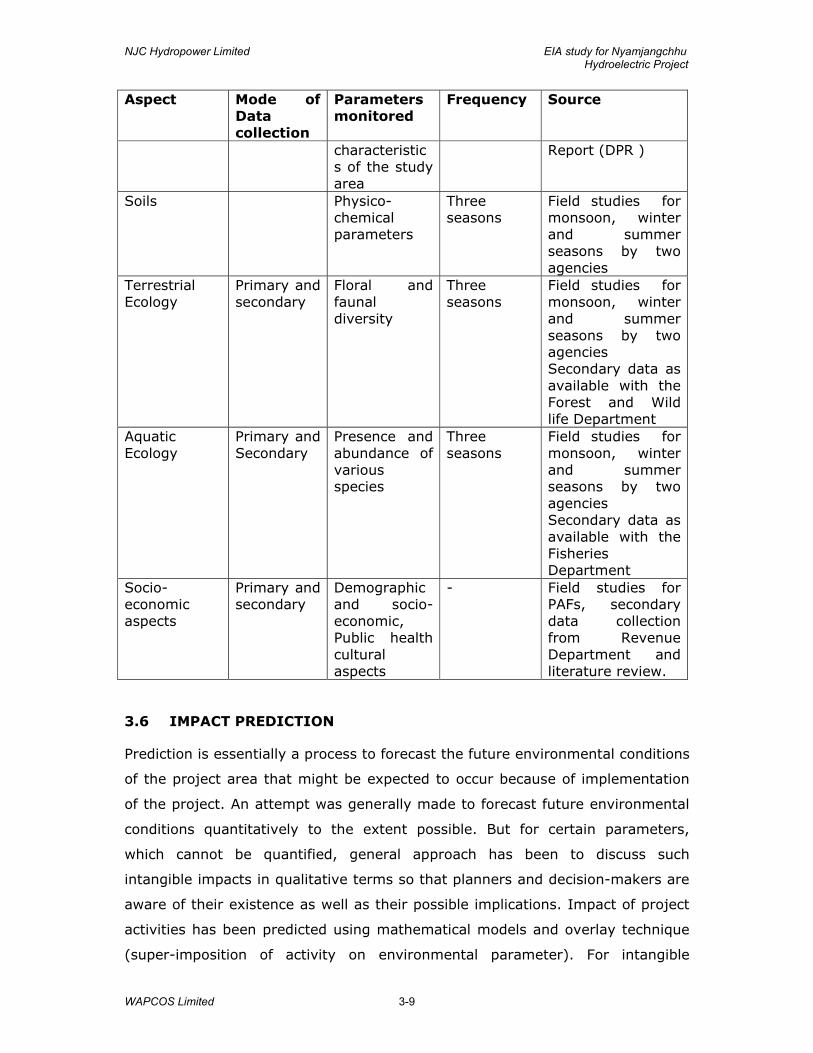
NJC Hydropower Limited EIA study for Nyamjangchhu Hydroelectric Project
WAPCOS Limited 3-9
Aspect Mode of Data collection
Parameters monitored
Frequency Source
characteristics of the study area
Report (DPR )
Soils Physico-chemical parameters
Three seasons
Field studies for monsoon, winter and summer seasons by two agencies
Terrestrial Ecology
Primary and secondary
Floral and faunal diversity
Three seasons
Field studies for monsoon, winter and summer seasons by two agencies Secondary data as available with the Forest and Wild life Department
Aquatic Ecology
Primary and Secondary
Presence and abundance of various species
Three seasons
Field studies for monsoon, winter and summer seasons by two agencies Secondary data as available with the Fisheries Department
Socio-economic aspects
Primary and secondary
Demographic and socio-economic, Public health cultural aspects
- Field studies for PAFs, secondary data collection from Revenue Department and literature review.
3.6 IMPACT PREDICTION
Prediction is essentially a process to forecast the future environmental conditions
of the project area that might be expected to occur because of implementation
of the project. An attempt was generally made to forecast future environmental
conditions quantitatively to the extent possible. But for certain parameters,
which cannot be quantified, general approach has been to discuss such
intangible impacts in qualitative terms so that planners and decision-makers are
aware of their existence as well as their possible implications. Impact of project
activities has been predicted using mathematical models and overlay technique
(super-imposition of activity on environmental parameter). For intangible

NJC Hydropower Limited EIA study for Nyamjangchhu Hydroelectric Project
WAPCOS Limited 3-10
impacts qualitative assessment has been done. The environmental impacts
predicted are listed as below:
- Loss of land. - Displacement of population due to acquisition of private and community
properties. - Impacts on hydrologic regime. - Impacts on water quality. - Increase in incidence of water-related diseases including water-borne and
vector-borne diseases. - Effect on riverine fisheries including migratory fish species. - Increase in air pollution and noise level during project construction phase - Impacts due to sewage generation from labour camps - Impacts due to acquisition of forest land - Impacts due to increase in terrestrial and aquatic ecology due to increased
human interferences during project construction and operation phases 3.7 ENVIRONMENTAL MANAGEMENT PLAN AND COST ESTIMATES
Based on the environmental baseline conditions and project inputs, the adverse
impacts were identified and a set of measures have been suggested as a part of
Environmental Management Plan (EMP) for their amelioration. The management
measures have been suggested for the following aspects:
- Compensatory afforestation and bio-diversity conservation plan - Catchment Area Treatment - Fisheries Management Plan - Public health delivery system - Environmental management in labour camp - Muck Management Plan - Restoration of quarry sites and landscaping of construction sites - Management of Impact due to construction of road - Greenbelt development plan - Control of Air Pollution - Measure for noise control - Water pollution control
The expenditure required for implementation of these management measures
has also been estimated as a part of the EMP study.
3.8 RESETTLEMENT AND REHABILITATION PLAN
As a part of the CEIA study, a socio-economic survey of project affected families
was conducted. As a part of the survey, information on family profile,
occupational profile, income, land holding, crop grown, assets owned, etc. was
collected. Based on the findings of the survey and the norms of outlined in
National Policy for Resettlement and Rehabilitation (NPRR) 2007, Resettlement
and Rehabilitation Plan for the project affected families has been formulated.
NJC Hydropower Limited EIA study for Nyamjangchhu Hydroelectric Project
WAPCOS Limited 3-11
3.9 CATCHMENT AREA TREATMENT PLAN
As a part of the CEIA study, a catchment area treatment plan for the catchment
area intercepted at the project site has been formulated. Various sub-
watersheds have been categorized into different erosion categories, as per Silt
Yield Index (SYI) method. For high and very high erosion categories, a
catchment area treatment plan comprising of engineering and biological
measures has been formulated.
3.10 TRIBAL DEVELOPMENT PLAN
In view of the Ministry of Tribal Affairs Strategy for development: the TSP
Approach and Plans/Programs of the ministry, various measures for Tribal
Development Plan has been suggested. These measures are in addition to the
measures outlined under Resettlement and Rehabilitation Plan and Area
Development Activities.
3.11 ENVIRONMENTAL MONITORING PROGRAMME
It is necessary to continue monitoring of certain parameters to verify the
adequacy of various measures outlined in the Environmental Management Plan
(EMP) and to assess the implementation of mitigative measures. An
Environmental Monitoring Programme for critical parameters has been suggested
for implementation during project construction and operation phases. The staff
along with necessary equipment and agencies to be involved for implementation
of the Environmental Monitoring Programme and costs have also been indicated.
NJC Hydropower Limited EIA study for Nyamjangchhu Hydroelectric Project
WAPCOS Limited
4-1
CHAPTER – 4
HYDROLOGY
4.1 BASIN DESCRIPTION
The river Nyamjang Chhu runs through north-western part of Arunachal Pradesh and flows mostly in
a North - South direction. It is a major tributary of the westerly flowing Tawang Chhu within the
State of Arunachal Pradesh. Nyamjang Chhu originates in China at an elevation of about ±6400 m
and flows through Tibet before entering India at Khinzemane. It flows southwards crossing into
Arunachal Pradesh and continues on a southerly course, parallel with the Indo-Bhutanese border, for
a distance of about 40 km to its confluence with the Tawang Chhu near Lumla, Kumba villages.
Tawang Chhu flows beyond Lumla village in a westerly direction into Bhutan as Gamri Chhu and
ultimately becomes a tributary of the Manas and Brahmaputra rivers. Major tributaries of river Manas
include Tawang Chhu, Nyamjang Chhu, Kuri Chhu, Khulong Chhu, Amri Chhu and Sheri Chhu.
Nyamjang Chhu is a perennial river with its main source of water being the south west monsoon and
snow melt contribution of Himalayan glaciers. The general pattern of river flow shows a large
variation with high flows in the months of June to September and lower flows in the remaining
months. The total length of Nyamjang Chhu from its origin in the Tibetan plateau at an elevation of
about 6400 m, to its confluence with the Tawang Chhu at an elevation of about about 1036 m is
about 125 km. The upper portion of the river, comprising about 85 km, is in Tibet and remaining 40
km is in India. In India, the Nyamjang Chhu flows through rugged mountainous terrain with an
average gradient of 1 in 30. The river enters India at approx. EL 2220 m near village Khinzemane
and covers a distance of about 10 km up to Zimithang. It meets Namka Chhu 2.41 km south of
Khinzemane and Sumta Chhu joins Nyamjang Chhu near Zimithang. The river is flat in the Zimithang
area for a stretch of almost 2.5 km. After this it again runs through steep slopes up to confluence
with Tawang Chhu. Eight nallas including Taksang Chhu and Gomkarang Chhu join Nyamjang Chhu
between Zimithang and its confluence with Tawang Chhu. These contribute to the discharges of the
Nyamjang Chhu all along this stretch.
The river bed elevation at Zimithang village is about EL 2106.0 m and that at the confluence is about
EL about 1036 m. A gross head of about 1057.4 m can therefore be exploited for development of
hydro power potential of the basin.
The total catchment area of the Nyamjang Chhu up to the confluence with Tawang Chhu is about
3170 km2. The catchment area upstream from Zimithang Village (barrage site) is about 2650 km2.
Out of this 2650 km2, about 1945 km2 of catchment area is above permanent snow line of EL 4500 m
and 705 km2 of catchment area receives precipitation in the form of rainfall. A Satellite image of the
Nyamjang Chhu catchment is shown in Figure 4.1.The catchment area map showing drainage
network is shown in Figure 4.2. The delineation of snow fed and rainfed areas in the catchment is
shown in Figure-4.3.
During its course from Zimithang to its confluence with Tawang Chhu, Nyamjang Chhu is joined by
eight major nallas. Two nallas namely Sumta Chhu and Taksang Chhu carry significant perennial
discharges and have catchment areas of 100 km2 and 154 km2 respectively. Sumta Chhu is a right
bank tributary of Nyamjang Chhu while Taksang Chhu is located on the left bank. It is proposed to
divert the perennial flow of Taksang Chhu into the headrace tunnel of Nyamjang Chhu HEP to utilise
the flow for power generation. The catchment area of Taksang Chhu upto the proposed diversion site
at EL 2156.4 m is 154 km2. Accordingly the flow in Nyamjang Chhu is computed including the
catchment area of Taksang Chhu upto the proposed diversion site. Thus, the total catchment area
including Taksang Chhu is 2804 km2.
NJC Hydropower Limited EIA study for Nyamjangchhu Hydroelectric Project
WAPCOS Limited
4-2
4.2 Water Availability Study
Hydrological data of Nyamjang Chhu is available for a period of only 18 months from December
2006. Discharge data of Tawang river located east of Nyamjang Chhu and Kuri Chhu located west of
Nyamjang Chhu is available for 7 years and 16 years respectively.
In the absence of long term discharge data for Nyamjang Chhu, the hydrological data of Tawang
Chhu and Kuri Chhu have been used in the DPR to estimate a long term flow series for Nyamjang
Chhu.
Confluence Point of Nyamjang Chhu & Tawang
Chhu
Barrage Location
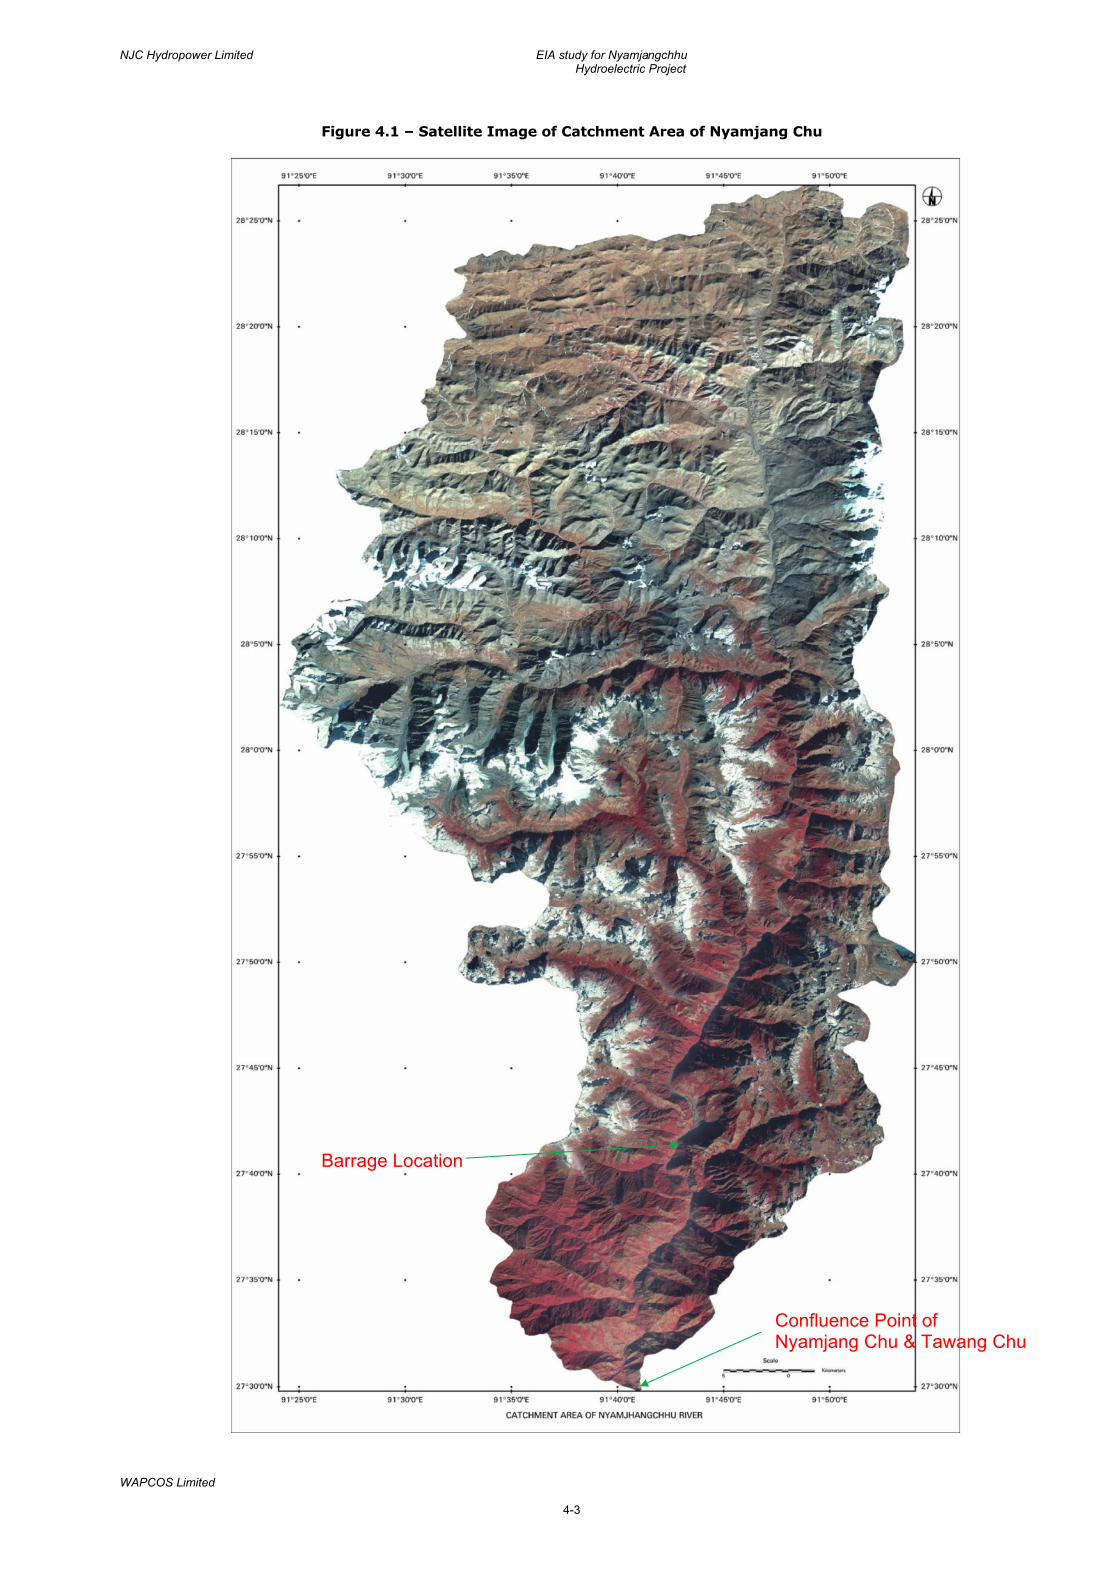
NJC Hydropower Limited EIA study for Nyamjangchhu Hydroelectric Project
WAPCOS Limited
4-3
Figure 4.1 – Satellite Image of Catchment Area of Nyamjang Chu
Confluence Point of Nyamjang Chu & Tawang Chu
Barrage Location
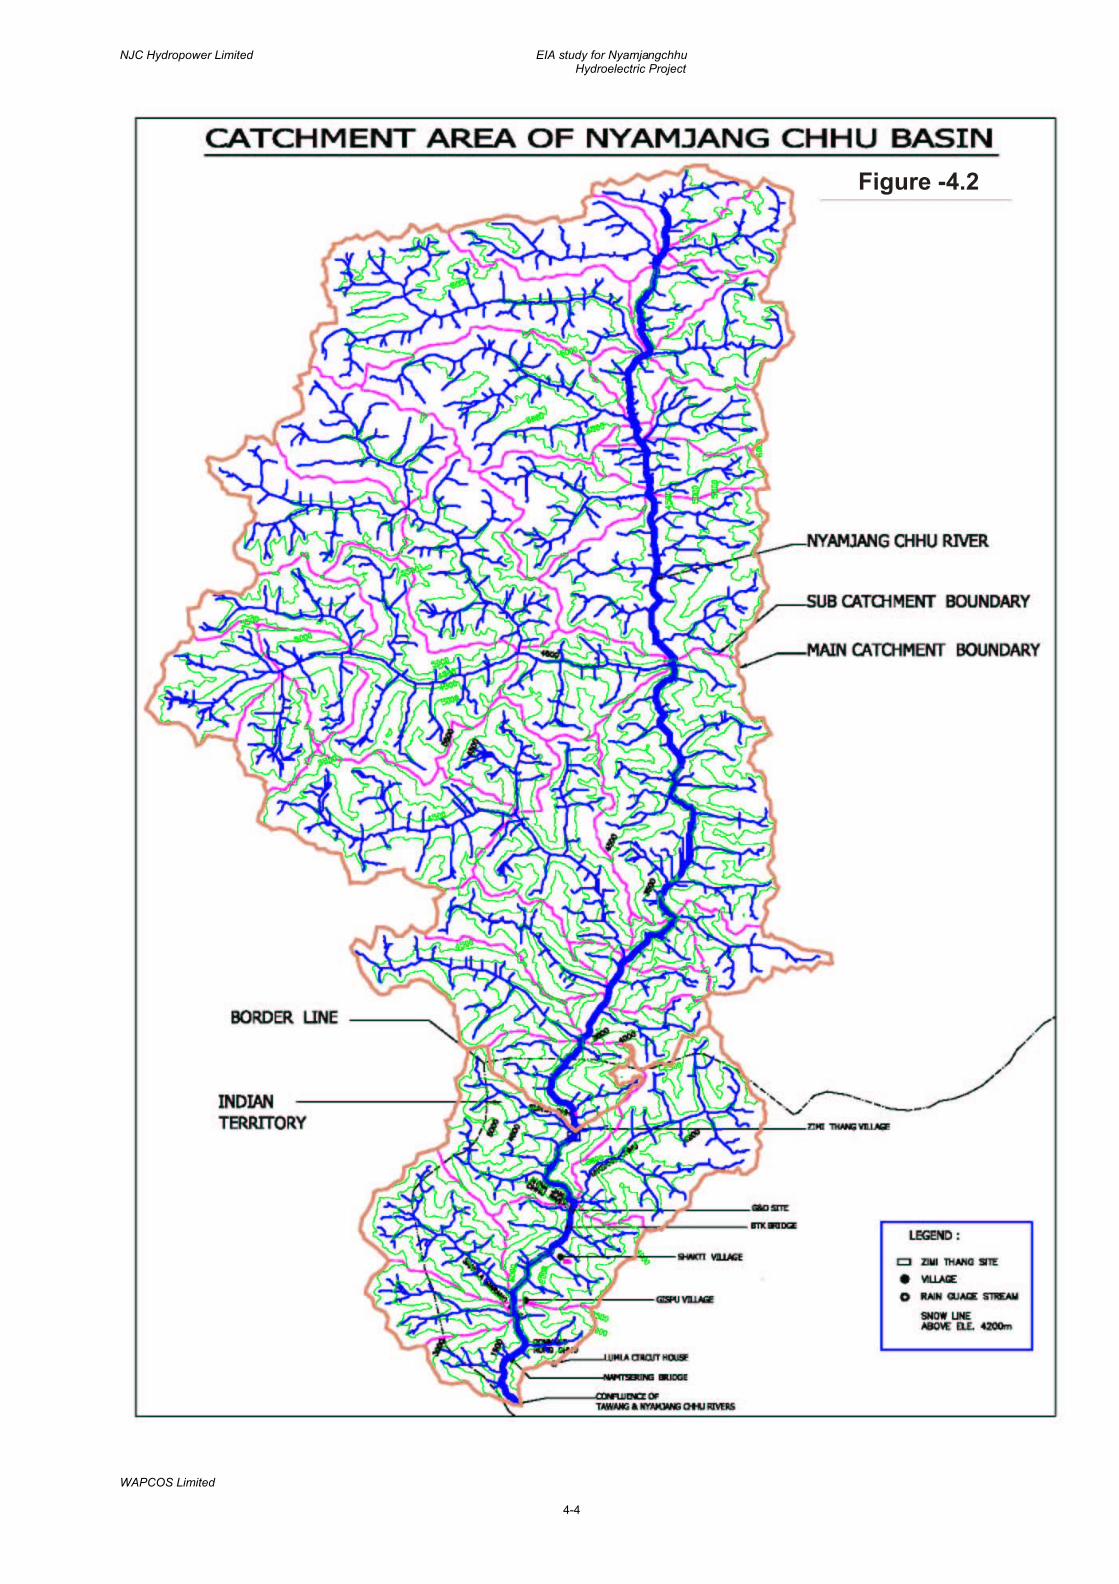
NJC Hydropower Limited EIA study for Nyamjangchhu Hydroelectric Project
WAPCOS Limited
4-4
Figure -4.2

NJC Hydropower Limited EIA study for Nyamjangchhu Hydroelectric Project
WAPCOS Limited
4-5
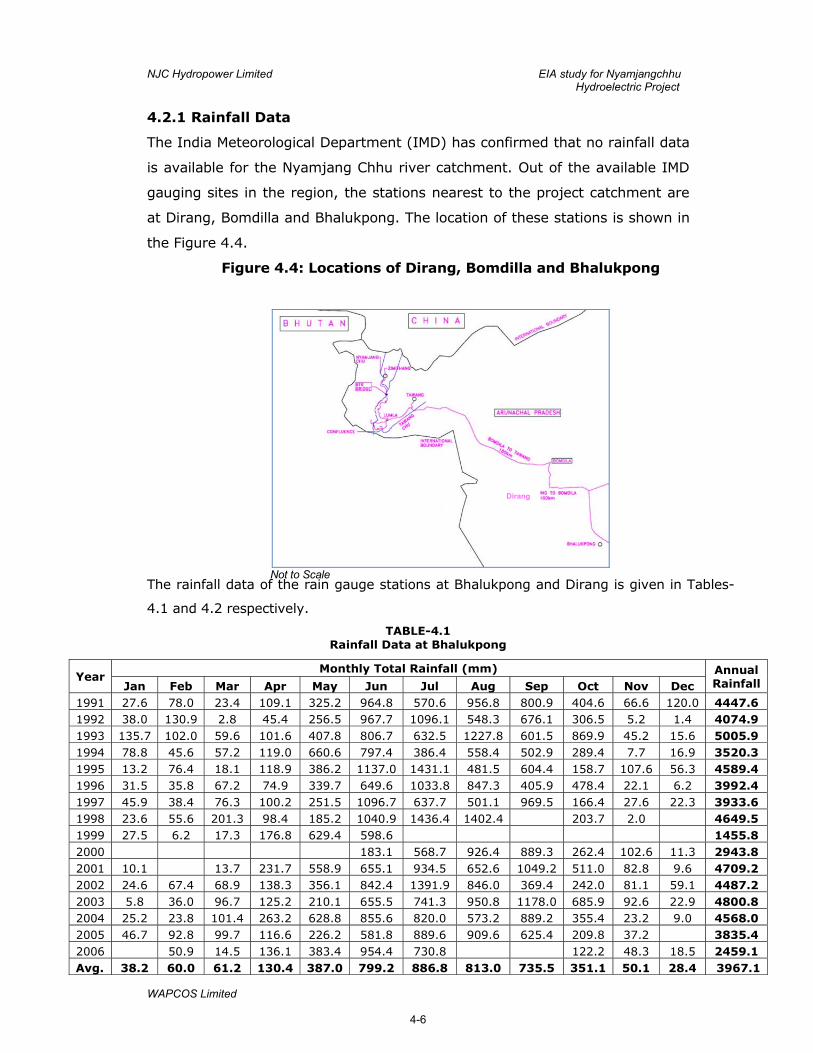
NJC Hydropower Limited EIA study for Nyamjangchhu Hydroelectric Project
WAPCOS Limited
4-6
4.2.1 Rainfall Data
The India Meteorological Department (IMD) has confirmed that no rainfall data
is available for the Nyamjang Chhu river catchment. Out of the available IMD
gauging sites in the region, the stations nearest to the project catchment are
at Dirang, Bomdilla and Bhalukpong. The location of these stations is shown in
the Figure 4.4.
Figure 4.4: Locations of Dirang, Bomdilla and Bhalukpong
The rainfall data of the rain gauge stations at Bhalukpong and Dirang is given in Tables-
4.1 and 4.2 respectively.
TABLE-4.1 Rainfall Data at Bhalukpong
Year Monthly Total Rainfall (mm) Annual
Rainfall Jan Feb Mar Apr May Jun Jul Aug Sep Oct Nov Dec 1991 27.6 78.0 23.4 109.1 325.2 964.8 570.6 956.8 800.9 404.6 66.6 120.0 4447.6 1992 38.0 130.9 2.8 45.4 256.5 967.7 1096.1 548.3 676.1 306.5 5.2 1.4 4074.9 1993 135.7 102.0 59.6 101.6 407.8 806.7 632.5 1227.8 601.5 869.9 45.2 15.6 5005.9 1994 78.8 45.6 57.2 119.0 660.6 797.4 386.4 558.4 502.9 289.4 7.7 16.9 3520.3 1995 13.2 76.4 18.1 118.9 386.2 1137.0 1431.1 481.5 604.4 158.7 107.6 56.3 4589.4 1996 31.5 35.8 67.2 74.9 339.7 649.6 1033.8 847.3 405.9 478.4 22.1 6.2 3992.4 1997 45.9 38.4 76.3 100.2 251.5 1096.7 637.7 501.1 969.5 166.4 27.6 22.3 3933.6 1998 23.6 55.6 201.3 98.4 185.2 1040.9 1436.4 1402.4 203.7 2.0 4649.5 1999 27.5 6.2 17.3 176.8 629.4 598.6 1455.8 2000 183.1 568.7 926.4 889.3 262.4 102.6 11.3 2943.8 2001 10.1 13.7 231.7 558.9 655.1 934.5 652.6 1049.2 511.0 82.8 9.6 4709.2 2002 24.6 67.4 68.9 138.3 356.1 842.4 1391.9 846.0 369.4 242.0 81.1 59.1 4487.2 2003 5.8 36.0 96.7 125.2 210.1 655.5 741.3 950.8 1178.0 685.9 92.6 22.9 4800.8 2004 25.2 23.8 101.4 263.2 628.8 855.6 820.0 573.2 889.2 355.4 23.2 9.0 4568.0 2005 46.7 92.8 99.7 116.6 226.2 581.8 889.6 909.6 625.4 209.8 37.2 3835.4 2006 50.9 14.5 136.1 383.4 954.4 730.8 122.2 48.3 18.5 2459.1 Avg. 38.2 60.0 61.2 130.4 387.0 799.2 886.8 813.0 735.5 351.1 50.1 28.4 3967.1
Dirang
Not to Scale
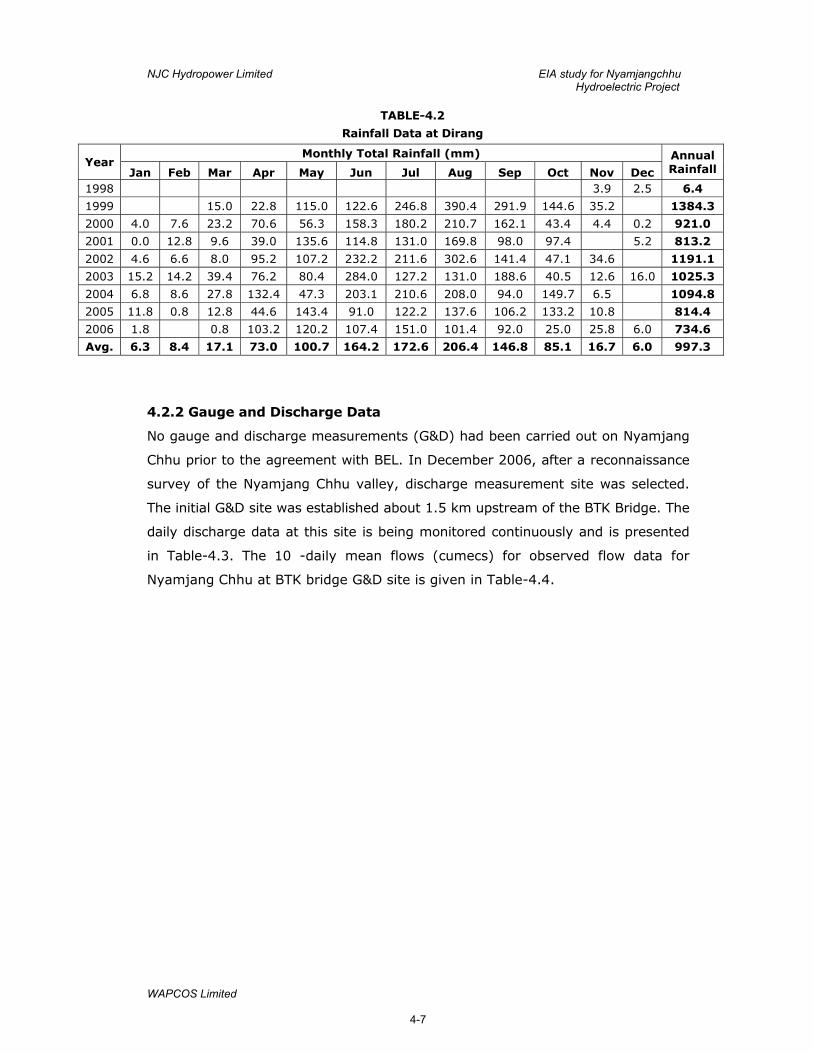
NJC Hydropower Limited EIA study for Nyamjangchhu Hydroelectric Project
WAPCOS Limited
4-7
TABLE-4.2
Rainfall Data at Dirang
Year Monthly Total Rainfall (mm) Annual
Rainfall Jan Feb Mar Apr May Jun Jul Aug Sep Oct Nov Dec 1998 3.9 2.5 6.4
1999 15.0 22.8 115.0 122.6 246.8 390.4 291.9 144.6 35.2 1384.3
2000 4.0 7.6 23.2 70.6 56.3 158.3 180.2 210.7 162.1 43.4 4.4 0.2 921.0
2001 0.0 12.8 9.6 39.0 135.6 114.8 131.0 169.8 98.0 97.4 5.2 813.2
2002 4.6 6.6 8.0 95.2 107.2 232.2 211.6 302.6 141.4 47.1 34.6 1191.1
2003 15.2 14.2 39.4 76.2 80.4 284.0 127.2 131.0 188.6 40.5 12.6 16.0 1025.3
2004 6.8 8.6 27.8 132.4 47.3 203.1 210.6 208.0 94.0 149.7 6.5 1094.8
2005 11.8 0.8 12.8 44.6 143.4 91.0 122.2 137.6 106.2 133.2 10.8 814.4
2006 1.8 0.8 103.2 120.2 107.4 151.0 101.4 92.0 25.0 25.8 6.0 734.6
Avg. 6.3 8.4 17.1 73.0 100.7 164.2 172.6 206.4 146.8 85.1 16.7 6.0 997.3
4.2.2 Gauge and Discharge Data
No gauge and discharge measurements (G&D) had been carried out on Nyamjang
Chhu prior to the agreement with BEL. In December 2006, after a reconnaissance
survey of the Nyamjang Chhu valley, discharge measurement site was selected.
The initial G&D site was established about 1.5 km upstream of the BTK Bridge. The
daily discharge data at this site is being monitored continuously and is presented
in Table-4.3. The 10 -daily mean flows (cumecs) for observed flow data for
Nyamjang Chhu at BTK bridge G&D site is given in Table-4.4.
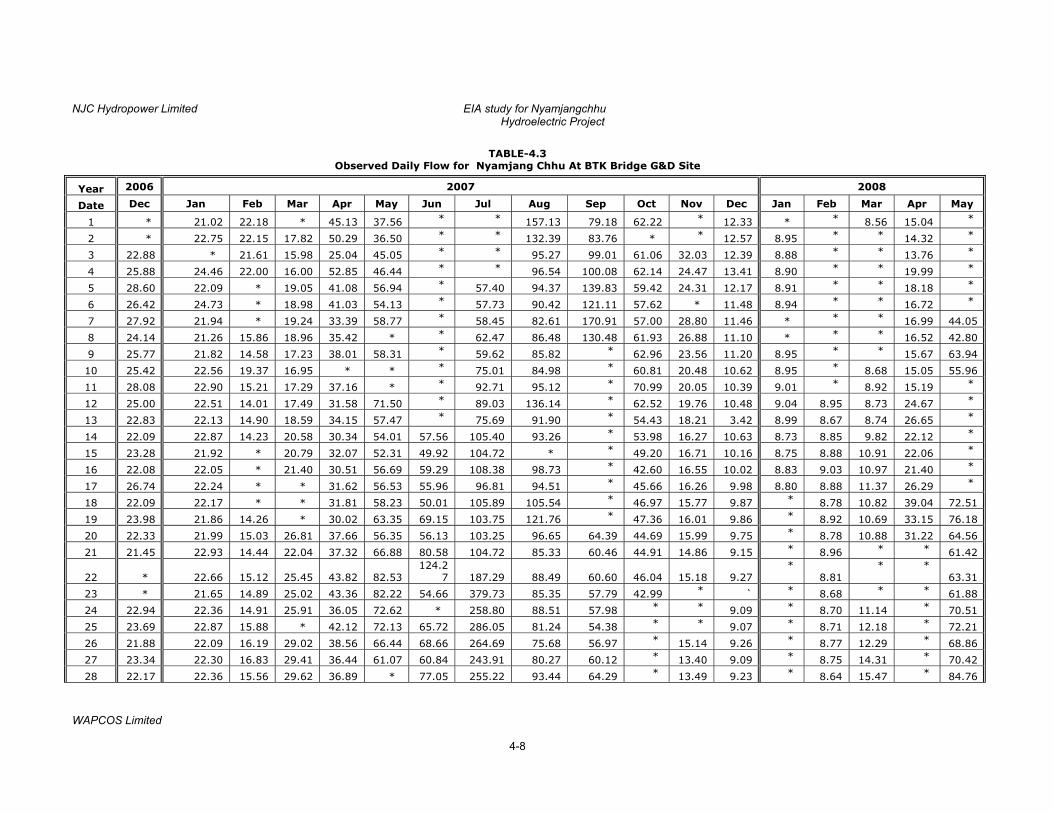
NJC Hydropower Limited EIA study for Nyamjangchhu Hydroelectric Project
WAPCOS Limited
4-8
TABLE-4.3 Observed Daily Flow for Nyamjang Chhu At BTK Bridge G&D Site
Year 2006 2007 2008
Date Dec Jan Feb Mar Apr May Jun Jul Aug Sep Oct Nov Dec Jan Feb Mar Apr May
1 * 21.02 22.18 * 45.13 37.56 * * 157.13 79.18 62.22 * 12.33 * * 8.56 15.04 *
2 * 22.75 22.15 17.82 50.29 36.50 * * 132.39 83.76 * * 12.57 8.95 * * 14.32 *
3 22.88 * 21.61 15.98 25.04 45.05 * * 95.27 99.01 61.06 32.03 12.39 8.88 * * 13.76 *
4 25.88 24.46 22.00 16.00 52.85 46.44 * * 96.54 100.08 62.14 24.47 13.41 8.90 * * 19.99 *
5 28.60 22.09 * 19.05 41.08 56.94 * 57.40 94.37 139.83 59.42 24.31 12.17 8.91 * * 18.18 *
6 26.42 24.73 * 18.98 41.03 54.13 * 57.73 90.42 121.11 57.62 * 11.48 8.94 * * 16.72 *
7 27.92 21.94 * 19.24 33.39 58.77 * 58.45 82.61 170.91 57.00 28.80 11.46 * * * 16.99 44.05
8 24.14 21.26 15.86 18.96 35.42 * * 62.47 86.48 130.48 61.93 26.88 11.10 * * * 16.52 42.80
9 25.77 21.82 14.58 17.23 38.01 58.31 * 59.62 85.82 * 62.96 23.56 11.20 8.95 * * 15.67 63.94
10 25.42 22.56 19.37 16.95 * * * 75.01 84.98 * 60.81 20.48 10.62 8.95 * 8.68 15.05 55.96
11 28.08 22.90 15.21 17.29 37.16 * * 92.71 95.12 * 70.99 20.05 10.39 9.01 * 8.92 15.19 *
12 25.00 22.51 14.01 17.49 31.58 71.50 * 89.03 136.14 * 62.52 19.76 10.48 9.04 8.95 8.73 24.67 *
13 22.83 22.13 14.90 18.59 34.15 57.47 * 75.69 91.90 * 54.43 18.21 3.42 8.99 8.67 8.74 26.65 *
14 22.09 22.87 14.23 20.58 30.34 54.01 57.56 105.40 93.26 * 53.98 16.27 10.63 8.73 8.85 9.82 22.12 *
15 23.28 21.92 * 20.79 32.07 52.31 49.92 104.72 * * 49.20 16.71 10.16 8.75 8.88 10.91 22.06 *
16 22.08 22.05 * 21.40 30.51 56.69 59.29 108.38 98.73 * 42.60 16.55 10.02 8.83 9.03 10.97 21.40 *
17 26.74 22.24 * * 31.62 56.53 55.96 96.81 94.51 * 45.66 16.26 9.98 8.80 8.88 11.37 26.29 *
18 22.09 22.17 * * 31.81 58.23 50.01 105.89 105.54 * 46.97 15.77 9.87 * 8.78 10.82 39.04 72.51
19 23.98 21.86 14.26 * 30.02 63.35 69.15 103.75 121.76 * 47.36 16.01 9.86 * 8.92 10.69 33.15 76.18
20 22.33 21.99 15.03 26.81 37.66 56.35 56.13 103.25 96.65 64.39 44.69 15.99 9.75 * 8.78 10.88 31.22 64.56
21 21.45 22.93 14.44 22.04 37.32 66.88 80.58 104.72 85.33 60.46 44.91 14.86 9.15 * 8.96 * * 61.42
22 * 22.66 15.12 25.45 43.82 82.53 124.2
7 187.29 88.49 60.60 46.04 15.18 9.27 *
8.81 * *
63.31
23 * 21.65 14.89 25.02 43.36 82.22 54.66 379.73 85.35 57.79 42.99 * ` * 8.68 * * 61.88
24 22.94 22.36 14.91 25.91 36.05 72.62 * 258.80 88.51 57.98 * * 9.09 * 8.70 11.14 * 70.51
25 23.69 22.87 15.88 * 42.12 72.13 65.72 286.05 81.24 54.38 * * 9.07 * 8.71 12.18 * 72.21
26 21.88 22.09 16.19 29.02 38.56 66.44 68.66 264.69 75.68 56.97 * 15.14 9.26 * 8.77 12.29 * 68.86
27 23.34 22.30 16.83 29.41 36.44 61.07 60.84 243.91 80.27 60.12 * 13.40 9.09 * 8.75 14.31 * 70.42
28 22.17 22.36 15.56 29.62 36.89 * 77.05 255.22 93.44 64.29 * 13.49 9.23 * 8.64 15.47 * 84.76
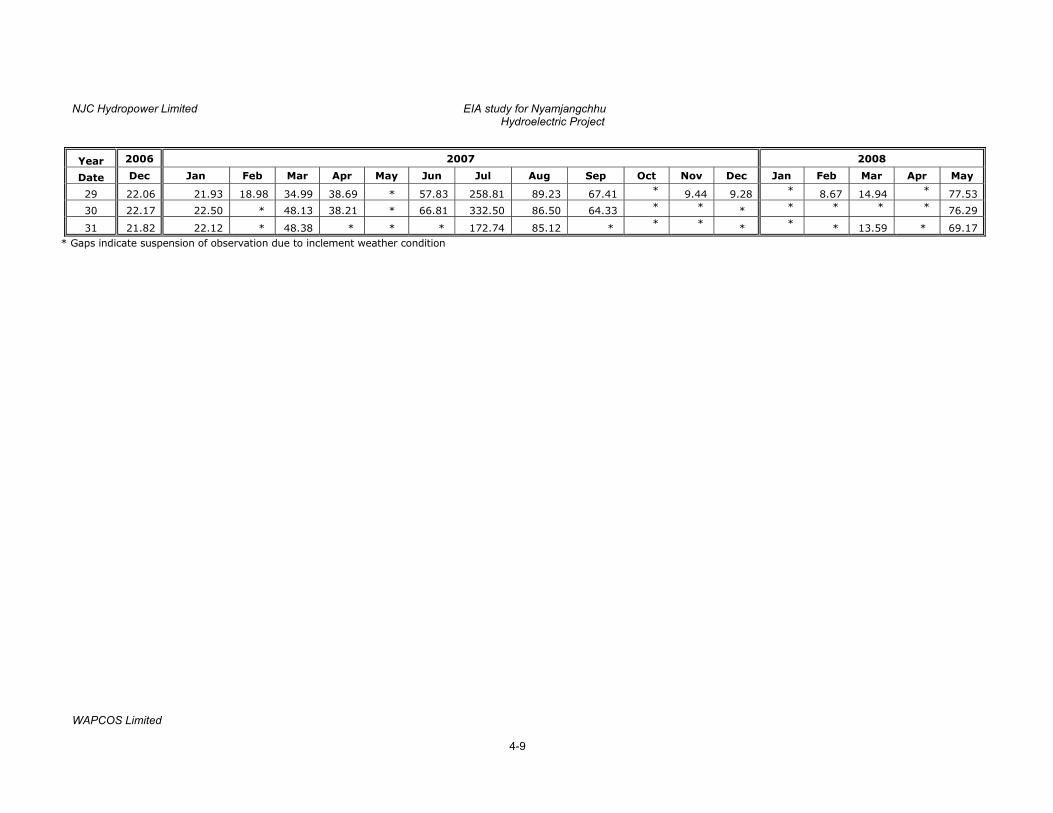
NJC Hydropower Limited EIA study for Nyamjangchhu Hydroelectric Project
WAPCOS Limited
4-9
Year 2006 2007 2008
Date Dec Jan Feb Mar Apr May Jun Jul Aug Sep Oct Nov Dec Jan Feb Mar Apr May
29 22.06 21.93 18.98 34.99 38.69 * 57.83 258.81 89.23 67.41 * 9.44 9.28 * 8.67 14.94 * 77.53
30 22.17 22.50 * 48.13 38.21 * 66.81 332.50 86.50 64.33 * * * * * * * 76.29
31 21.82 22.12 * 48.38 * * * 172.74 85.12 * * * * * * 13.59 * 69.17 * Gaps indicate suspension of observation due to inclement weather condition
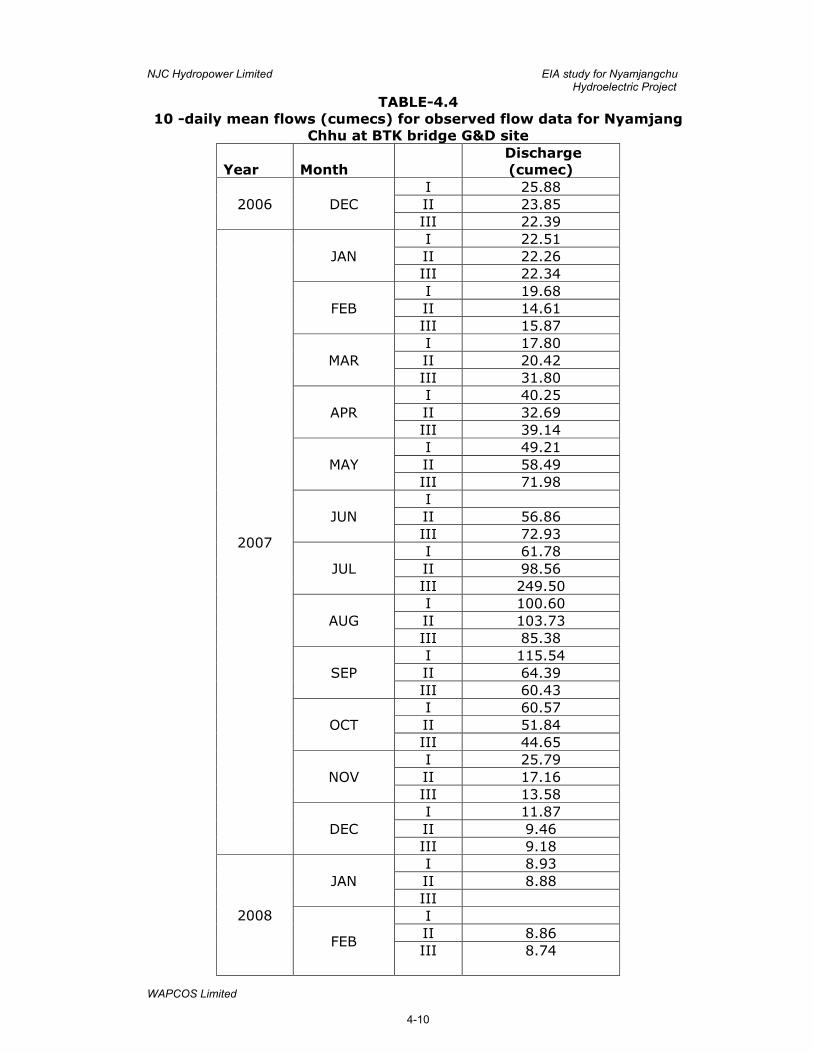
NJC Hydropower Limited EIA study for Nyamjangchu Hydroelectric Project
WAPCOS Limited
4-10
TABLE-4.4 10 -daily mean flows (cumecs) for observed flow data for Nyamjang
Chhu at BTK bridge G&D site
Year Month Discharge (cumec)
2006 DEC I 25.88 II 23.85 III 22.39
2007
JAN I 22.51 II 22.26 III 22.34
FEB I 19.68 II 14.61 III 15.87
MAR I 17.80 II 20.42 III 31.80
APR I 40.25 II 32.69 III 39.14
MAY I 49.21 II 58.49 III 71.98
JUN I II 56.86 III 72.93
JUL I 61.78 II 98.56 III 249.50
AUG I 100.60 II 103.73 III 85.38
SEP I 115.54 II 64.39 III 60.43
OCT I 60.57 II 51.84 III 44.65
NOV I 25.79 II 17.16 III 13.58
DEC I 11.87 II 9.46 III 9.18
2008
JAN I 8.93 II 8.88 III
FEB
I II 8.86 III 8.74
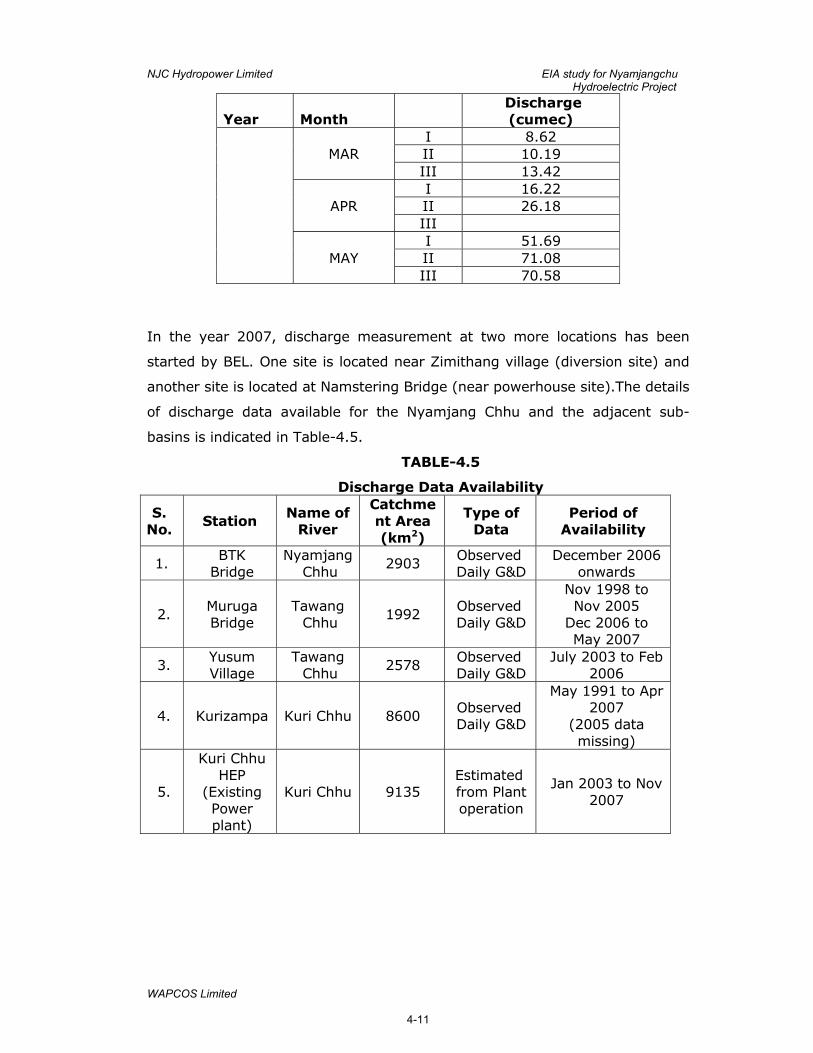
NJC Hydropower Limited EIA study for Nyamjangchu Hydroelectric Project
WAPCOS Limited
4-11
Year Month Discharge (cumec)
MAR I 8.62 II 10.19 III 13.42
APR I 16.22 II 26.18 III
MAY I 51.69 II 71.08 III 70.58
In the year 2007, discharge measurement at two more locations has been
started by BEL. One site is located near Zimithang village (diversion site) and
another site is located at Namstering Bridge (near powerhouse site).The details
of discharge data available for the Nyamjang Chhu and the adjacent sub-
basins is indicated in Table-4.5.
TABLE-4.5
Discharge Data Availability
S. No.
Station Name of River
Catchment Area (km2)
Type of Data
Period of Availability
1. BTK
Bridge Nyamjang
Chhu 2903
Observed Daily G&D
December 2006 onwards
2. Muruga Bridge
Tawang Chhu
1992 Observed Daily G&D
Nov 1998 to Nov 2005
Dec 2006 to May 2007
3. Yusum Village
Tawang Chhu
2578 Observed Daily G&D
July 2003 to Feb 2006
4. Kurizampa Kuri Chhu 8600 Observed Daily G&D
May 1991 to Apr 2007
(2005 data missing)
5.
Kuri Chhu HEP
(Existing Power plant)
Kuri Chhu 9135 Estimated from Plant operation
Jan 2003 to Nov 2007
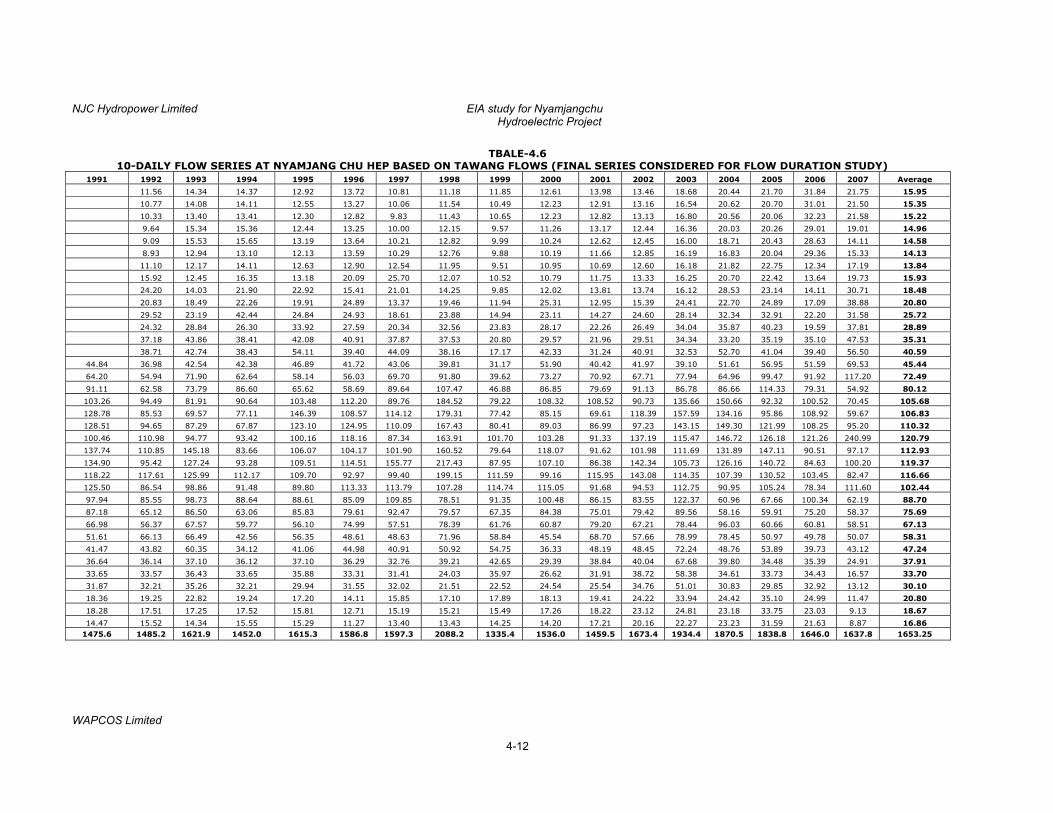
NJC Hydropower Limited EIA study for Nyamjangchu Hydroelectric Project
WAPCOS Limited
4-12
TBALE-4.6 10-DAILY FLOW SERIES AT NYAMJANG CHU HEP BASED ON TAWANG FLOWS (FINAL SERIES CONSIDERED FOR FLOW DURATION STUDY)
1991 1992 1993 1994 1995 1996 1997 1998 1999 2000 2001 2002 2003 2004 2005 2006 2007 Average
11.56 14.34 14.37 12.92 13.72 10.81 11.18 11.85 12.61 13.98 13.46 18.68 20.44 21.70 31.84 21.75 15.95
10.77 14.08 14.11 12.55 13.27 10.06 11.54 10.49 12.23 12.91 13.16 16.54 20.62 20.70 31.01 21.50 15.35
10.33 13.40 13.41 12.30 12.82 9.83 11.43 10.65 12.23 12.82 13.13 16.80 20.56 20.06 32.23 21.58 15.22
9.64 15.34 15.36 12.44 13.25 10.00 12.15 9.57 11.26 13.17 12.44 16.36 20.03 20.26 29.01 19.01 14.96
9.09 15.53 15.65 13.19 13.64 10.21 12.82 9.99 10.24 12.62 12.45 16.00 18.71 20.43 28.63 14.11 14.58
8.93 12.94 13.10 12.13 13.59 10.29 12.76 9.88 10.19 11.66 12.85 16.19 16.83 20.04 29.36 15.33 14.13
11.10 12.17 14.11 12.63 12.90 12.54 11.95 9.51 10.95 10.69 12.60 16.18 21.82 22.75 12.34 17.19 13.84
15.92 12.45 16.35 13.18 20.09 25.70 12.07 10.52 10.79 11.75 13.33 16.25 20.70 22.42 13.64 19.73 15.93
24.20 14.03 21.90 22.92 15.41 21.01 14.25 9.85 12.02 13.81 13.74 16.12 28.53 23.14 14.11 30.71 18.48
20.83 18.49 22.26 19.91 24.89 13.37 19.46 11.94 25.31 12.95 15.39 24.41 22.70 24.89 17.09 38.88 20.80
29.52 23.19 42.44 24.84 24.93 18.61 23.88 14.94 23.11 14.27 24.60 28.14 32.34 32.91 22.20 31.58 25.72
24.32 28.84 26.30 33.92 27.59 20.34 32.56 23.83 28.17 22.26 26.49 34.04 35.87 40.23 19.59 37.81 28.89
37.18 43.86 38.41 42.08 40.91 37.87 37.53 20.80 29.57 21.96 29.51 34.34 33.20 35.19 35.10 47.53 35.31
38.71 42.74 38.43 54.11 39.40 44.09 38.16 17.17 42.33 31.24 40.91 32.53 52.70 41.04 39.40 56.50 40.59
44.84 36.98 42.54 42.38 46.89 41.72 43.06 39.81 31.17 51.90 40.42 41.97 39.10 51.61 56.95 51.59 69.53 45.44
64.20 54.94 71.90 62.64 58.14 56.03 69.70 91.80 39.62 73.27 70.92 67.71 77.94 64.96 99.47 91.92 117.20 72.49
91.11 62.58 73.79 86.60 65.62 58.69 89.64 107.47 46.88 86.85 79.69 91.13 86.78 86.66 114.33 79.31 54.92 80.12
103.26 94.49 81.91 90.64 103.48 112.20 89.76 184.52 79.22 108.32 108.52 90.73 135.66 150.66 92.32 100.52 70.45 105.68
128.78 85.53 69.57 77.11 146.39 108.57 114.12 179.31 77.42 85.15 69.61 118.39 157.59 134.16 95.86 108.92 59.67 106.83
128.51 94.65 87.29 67.87 123.10 124.95 110.09 167.43 80.41 89.03 86.99 97.23 143.15 149.30 121.99 108.25 95.20 110.32
100.46 110.98 94.77 93.42 100.16 118.16 87.34 163.91 101.70 103.28 91.33 137.19 115.47 146.72 126.18 121.26 240.99 120.79
137.74 110.85 145.18 83.66 106.07 104.17 101.90 160.52 79.64 118.07 91.62 101.98 111.69 131.89 147.11 90.51 97.17 112.93
134.90 95.42 127.24 93.28 109.51 114.51 155.77 217.43 87.95 107.10 86.38 142.34 105.73 126.16 140.72 84.63 100.20 119.37
118.22 117.61 125.99 112.17 109.70 92.97 99.40 199.15 111.59 99.16 115.95 143.08 114.35 107.39 130.52 103.45 82.47 116.66
125.50 86.54 98.86 91.48 89.80 113.33 113.79 107.28 114.74 115.05 91.68 94.53 112.75 90.95 105.24 78.34 111.60 102.44
97.94 85.55 98.73 88.64 88.61 85.09 109.85 78.51 91.35 100.48 86.15 83.55 122.37 60.96 67.66 100.34 62.19 88.70
87.18 65.12 86.50 63.06 85.83 79.61 92.47 79.57 67.35 84.38 75.01 79.42 89.56 58.16 59.91 75.20 58.37 75.69
66.98 56.37 67.57 59.77 56.10 74.99 57.51 78.39 61.76 60.87 79.20 67.21 78.44 96.03 60.66 60.81 58.51 67.13
51.61 66.13 66.49 42.56 56.35 48.61 48.63 71.96 58.84 45.54 68.70 57.66 78.99 78.45 50.97 49.78 50.07 58.31
41.47 43.82 60.35 34.12 41.06 44.98 40.91 50.92 54.75 36.33 48.19 48.45 72.24 48.76 53.89 39.73 43.12 47.24
36.64 36.14 37.10 36.12 37.10 36.29 32.76 39.21 42.65 29.39 38.84 40.04 67.68 39.80 34.48 35.39 24.91 37.91
33.65 33.57 36.43 33.65 35.88 33.31 31.41 24.03 35.97 26.62 31.91 38.72 58.38 34.61 33.73 34.43 16.57 33.70
31.87 32.21 35.26 32.21 29.94 31.55 32.02 21.51 22.52 24.54 25.54 34.76 51.01 30.83 29.85 32.92 13.12 30.10
18.36 19.25 22.82 19.24 17.20 14.11 15.85 17.10 17.89 18.13 19.41 24.22 33.94 24.42 35.10 24.99 11.47 20.80
18.28 17.51 17.25 17.52 15.81 12.71 15.19 15.21 15.49 17.26 18.22 23.12 24.81 23.18 33.75 23.03 9.13 18.67
14.47 15.52 14.34 15.55 15.29 11.27 13.40 13.43 14.25 14.20 17.21 20.16 22.27 23.23 31.59 21.63 8.87 16.86 1475.6 1485.2 1621.9 1452.0 1615.3 1586.8 1597.3 2088.2 1335.4 1536.0 1459.5 1673.4 1934.4 1870.5 1838.8 1646.0 1637.8 1653.25
NJC Hydropower Limited EIA study for Nyamjangchu Hydroelectric Project
WAPCOS Limited 4-13
4.2.3 Sedimentation Data
Site specific observed sediment data is not available. However, sedimentation
rate at Muruga Bridge and Yusum Site in the adjacent Tawang Chhu sub basin
has been reported as 0.004 and 0.01 ha-m/km2/year respectively in the Pre
Feasibility Report for Tawang HEP prepared by National Hydro Power Corporation
(NHPC). The above sedimentation rates are based on analysis of observed silt data
for the period of May 2001 to May 2005 at Muruga Bridge and Aug 2002 to May
2005 at Yusum Site.
The above silt rates are based on data of limited period and appear to be on the
lower side when compared to other Himalayan projects. Therefore, these silt rates
may not be considered to represent long term average annual silt rate. However,
Central Water Commission recommends an average annual rate of siltation of
0.1765 ha-m/km2 for the Himalayan Region (Indus, Ganges and Brahmaputra
Basin). Ref – Compendium of Silting of Reservoirs of India, Central Water
Commission, New Delhi, January 2001.
4.2.4 Methodology and Calculations for Long Term Series of Nyamjang
Chhu
The hydrological observation at the project catchment has been started in Dec’
2006. IMD has reported that no rainfall data is available for the Nyamjang Chhu
catchment. In such cases, standard practice is to attempt various alternative
approaches utilising all available hydrometeorological information of the
neighbouring sub-basins in order to assess design hydrological parameters of the
project basin. Long term flow data is available on the Kuri Chhu in the west
and on the Tawang Chhu in the east of the project basin. In order to generate
a continuous long term flow series for Nyamjang Chhu basin, studies have
been carried out based on catchment area proportion and runoff-runoff
correlation among the available concurrent flow series of Rivers Kuri Chhu,
Tawang Chhu and Nyamjang Chhu. The 10 daily flow series at Nyamjangchu
HEP site based on Tawang discharge data is given in Table-4.6.
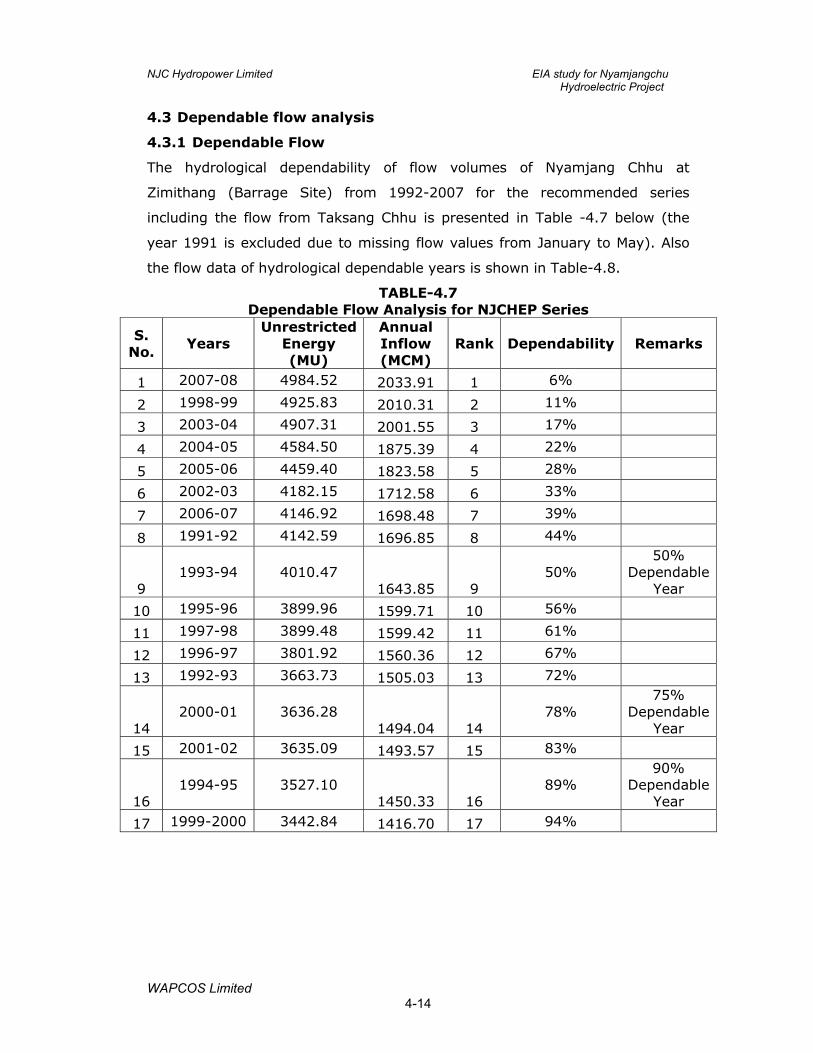
NJC Hydropower Limited EIA study for Nyamjangchu Hydroelectric Project
WAPCOS Limited 4-14
4.3 Dependable flow analysis
4.3.1 Dependable Flow
The hydrological dependability of flow volumes of Nyamjang Chhu at
Zimithang (Barrage Site) from 1992-2007 for the recommended series
including the flow from Taksang Chhu is presented in Table -4.7 below (the
year 1991 is excluded due to missing flow values from January to May). Also
the flow data of hydrological dependable years is shown in Table-4.8.
TABLE-4.7 Dependable Flow Analysis for NJCHEP Series
S. No.
Years Unrestricted
Energy (MU)
Annual Inflow (MCM)
Rank Dependability Remarks
1 2007-08 4984.52 2033.91 1 6%
2 1998-99 4925.83 2010.31 2 11%
3 2003-04 4907.31 2001.55 3 17%
4 2004-05 4584.50 1875.39 4 22%
5 2005-06 4459.40 1823.58 5 28%
6 2002-03 4182.15 1712.58 6 33%
7 2006-07 4146.92 1698.48 7 39%
8 1991-92 4142.59 1696.85 8 44%
9 1993-94 4010.47
1643.85 9 50%
50% Dependable
Year
10 1995-96 3899.96 1599.71 10 56%
11 1997-98 3899.48 1599.42 11 61%
12 1996-97 3801.92 1560.36 12 67%
13 1992-93 3663.73 1505.03 13 72%
14 2000-01 3636.28
1494.04 14 78%
75% Dependable
Year
15 2001-02 3635.09 1493.57 15 83%
16 1994-95 3527.10
1450.33 16 89%
90% Dependable
Year
17 1999-2000 3442.84 1416.70 17 94%
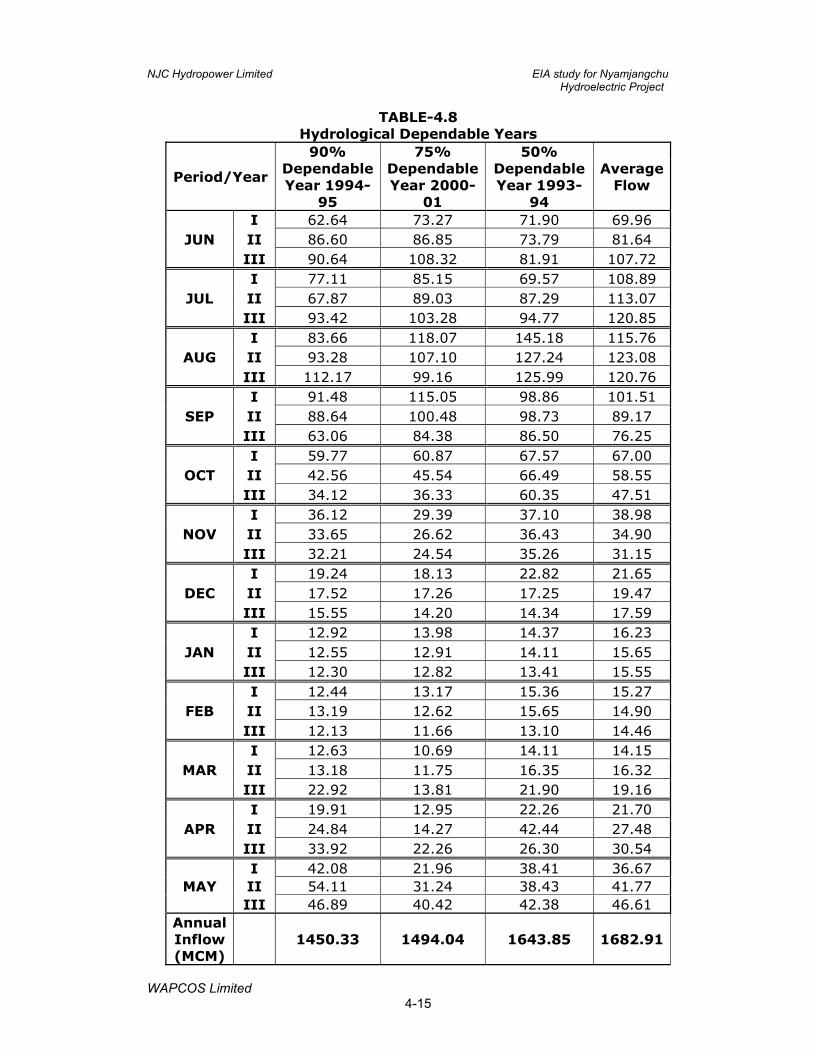
NJC Hydropower Limited EIA study for Nyamjangchu Hydroelectric Project
WAPCOS Limited 4-15
TABLE-4.8 Hydrological Dependable Years
Period/Year
90% Dependable Year 1994-
95
75% Dependable Year 2000-
01
50% Dependable Year 1993-
94
Average Flow
JUN I 62.64 73.27 71.90 69.96 II 86.60 86.85 73.79 81.64 III 90.64 108.32 81.91 107.72
JUL I 77.11 85.15 69.57 108.89 II 67.87 89.03 87.29 113.07 III 93.42 103.28 94.77 120.85
AUG I 83.66 118.07 145.18 115.76 II 93.28 107.10 127.24 123.08 III 112.17 99.16 125.99 120.76
SEP I 91.48 115.05 98.86 101.51 II 88.64 100.48 98.73 89.17 III 63.06 84.38 86.50 76.25
OCT I 59.77 60.87 67.57 67.00 II 42.56 45.54 66.49 58.55 III 34.12 36.33 60.35 47.51
NOV I 36.12 29.39 37.10 38.98 II 33.65 26.62 36.43 34.90 III 32.21 24.54 35.26 31.15
DEC I 19.24 18.13 22.82 21.65 II 17.52 17.26 17.25 19.47 III 15.55 14.20 14.34 17.59
JAN I 12.92 13.98 14.37 16.23 II 12.55 12.91 14.11 15.65 III 12.30 12.82 13.41 15.55
FEB I 12.44 13.17 15.36 15.27 II 13.19 12.62 15.65 14.90 III 12.13 11.66 13.10 14.46
MAR I 12.63 10.69 14.11 14.15 II 13.18 11.75 16.35 16.32 III 22.92 13.81 21.90 19.16
APR I 19.91 12.95 22.26 21.70 II 24.84 14.27 42.44 27.48 III 33.92 22.26 26.30 30.54
MAY I 42.08 21.96 38.41 36.67 II 54.11 31.24 38.43 41.77 III 46.89 40.42 42.38 46.61
Annual Inflow (MCM)
1450.33 1494.04 1643.85 1682.91
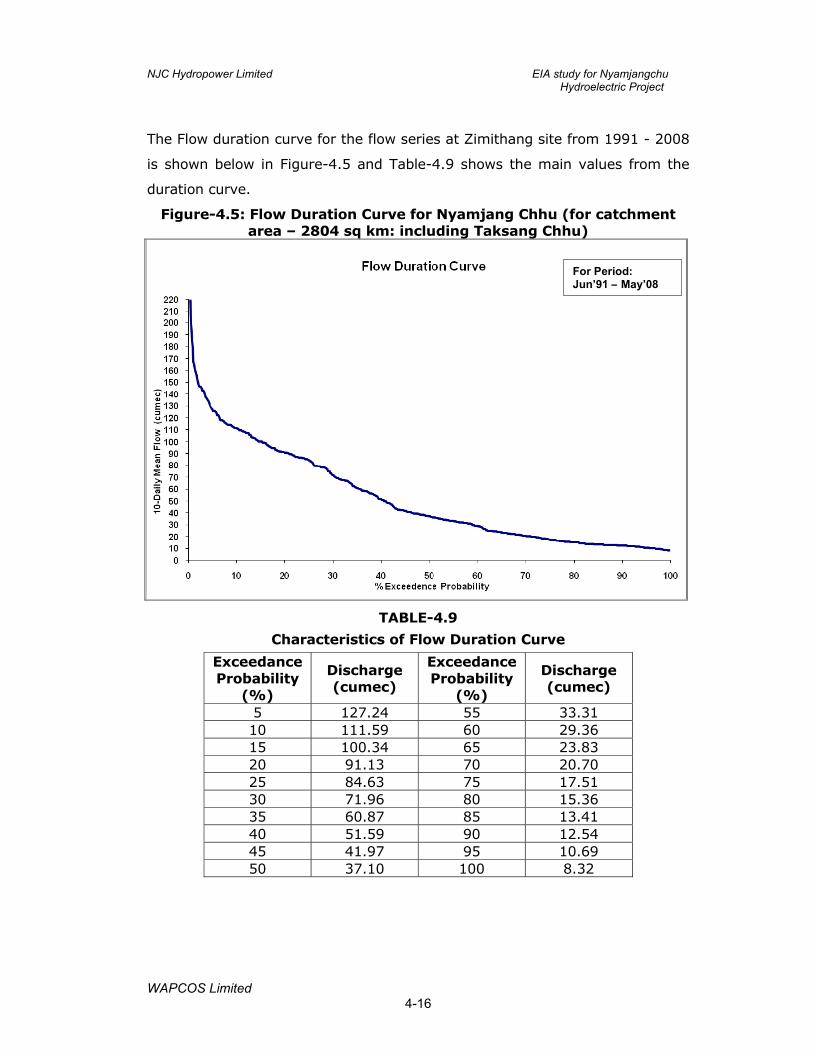
NJC Hydropower Limited EIA study for Nyamjangchu Hydroelectric Project
WAPCOS Limited 4-16
The Flow duration curve for the flow series at Zimithang site from 1991 - 2008
is shown below in Figure-4.5 and Table-4.9 shows the main values from the
duration curve.
Figure-4.5: Flow Duration Curve for Nyamjang Chhu (for catchment area – 2804 sq km: including Taksang Chhu)
TABLE-4.9
Characteristics of Flow Duration Curve
Exceedance Probability
(%)
Discharge (cumec)
Exceedance Probability
(%)
Discharge (cumec)
5 127.24 55 33.31 10 111.59 60 29.36 15 100.34 65 23.83 20 91.13 70 20.70 25 84.63 75 17.51 30 71.96 80 15.36 35 60.87 85 13.41 40 51.59 90 12.54 45 41.97 95 10.69 50 37.10 100 8.32
For Period: Jun’91 – May’08
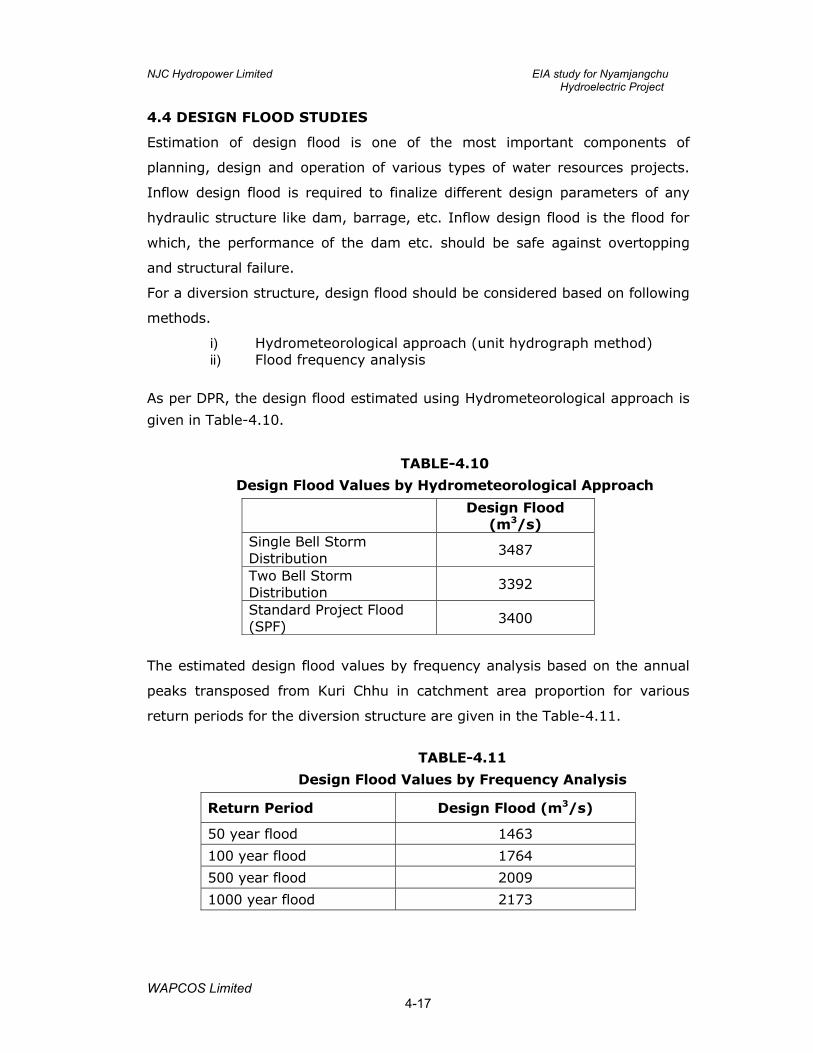
NJC Hydropower Limited EIA study for Nyamjangchu Hydroelectric Project
WAPCOS Limited 4-17
4.4 DESIGN FLOOD STUDIES
Estimation of design flood is one of the most important components of
planning, design and operation of various types of water resources projects.
Inflow design flood is required to finalize different design parameters of any
hydraulic structure like dam, barrage, etc. Inflow design flood is the flood for
which, the performance of the dam etc. should be safe against overtopping
and structural failure.
For a diversion structure, design flood should be considered based on following
methods.
i) Hydrometeorological approach (unit hydrograph method) ii) Flood frequency analysis
As per DPR, the design flood estimated using Hydrometeorological approach is
given in Table-4.10.
TABLE-4.10
Design Flood Values by Hydrometeorological Approach
Design Flood (m3/s)
Single Bell Storm Distribution
3487
Two Bell Storm Distribution
3392
Standard Project Flood (SPF)
3400
The estimated design flood values by frequency analysis based on the annual
peaks transposed from Kuri Chhu in catchment area proportion for various
return periods for the diversion structure are given in the Table-4.11.
TABLE-4.11
Design Flood Values by Frequency Analysis
Return Period Design Flood (m3/s)
50 year flood 1463
100 year flood 1764
500 year flood 2009
1000 year flood 2173
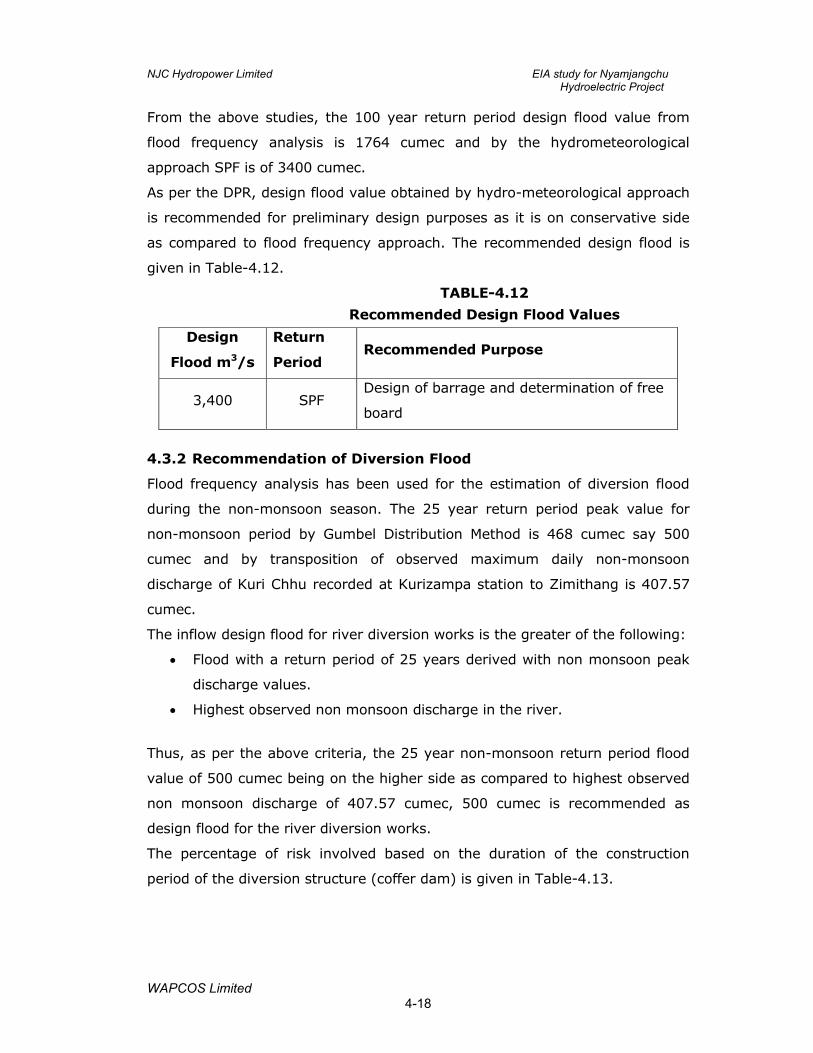
NJC Hydropower Limited EIA study for Nyamjangchu Hydroelectric Project
WAPCOS Limited 4-18
From the above studies, the 100 year return period design flood value from
flood frequency analysis is 1764 cumec and by the hydrometeorological
approach SPF is of 3400 cumec.
As per the DPR, design flood value obtained by hydro-meteorological approach
is recommended for preliminary design purposes as it is on conservative side
as compared to flood frequency approach. The recommended design flood is
given in Table-4.12.
TABLE-4.12
Recommended Design Flood Values
Design
Flood m3/s
Return
Period Recommended Purpose
3,400 SPF Design of barrage and determination of free
board
4.3.2 Recommendation of Diversion Flood
Flood frequency analysis has been used for the estimation of diversion flood
during the non-monsoon season. The 25 year return period peak value for
non-monsoon period by Gumbel Distribution Method is 468 cumec say 500
cumec and by transposition of observed maximum daily non-monsoon
discharge of Kuri Chhu recorded at Kurizampa station to Zimithang is 407.57
cumec.
The inflow design flood for river diversion works is the greater of the following:
• Flood with a return period of 25 years derived with non monsoon peak
discharge values.
• Highest observed non monsoon discharge in the river.
Thus, as per the above criteria, the 25 year non-monsoon return period flood
value of 500 cumec being on the higher side as compared to highest observed
non monsoon discharge of 407.57 cumec, 500 cumec is recommended as
design flood for the river diversion works.
The percentage of risk involved based on the duration of the construction
period of the diversion structure (coffer dam) is given in Table-4.13.
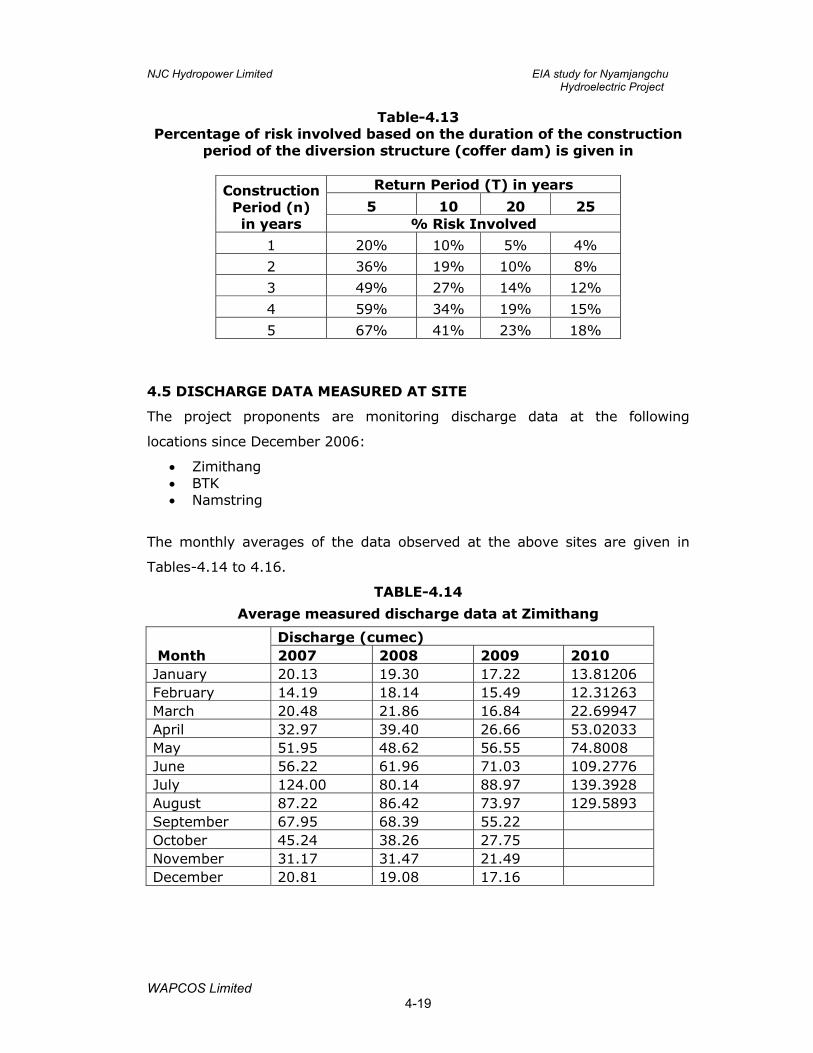
NJC Hydropower Limited EIA study for Nyamjangchu Hydroelectric Project
WAPCOS Limited 4-19
Table-4.13 Percentage of risk involved based on the duration of the construction
period of the diversion structure (coffer dam) is given in
Construction Period (n) in years
Return Period (T) in years
5 10 20 25 % Risk Involved
1 20% 10% 5% 4%
2 36% 19% 10% 8%
3 49% 27% 14% 12%
4 59% 34% 19% 15%
5 67% 41% 23% 18%
4.5 DISCHARGE DATA MEASURED AT SITE
The project proponents are monitoring discharge data at the following
locations since December 2006:
• Zimithang • BTK • Namstring
The monthly averages of the data observed at the above sites are given in
Tables-4.14 to 4.16.
TABLE-4.14
Average measured discharge data at Zimithang
Month Discharge (cumec) 2007 2008 2009 2010
January 20.13 19.30 17.22 13.81206 February 14.19 18.14 15.49 12.31263 March 20.48 21.86 16.84 22.69947 April 32.97 39.40 26.66 53.02033 May 51.95 48.62 56.55 74.8008 June 56.22 61.96 71.03 109.2776 July 124.00 80.14 88.97 139.3928 August 87.22 86.42 73.97 129.5893 September 67.95 68.39 55.22 October 45.24 38.26 27.75 November 31.17 31.47 21.49 December 20.81 19.08 17.16
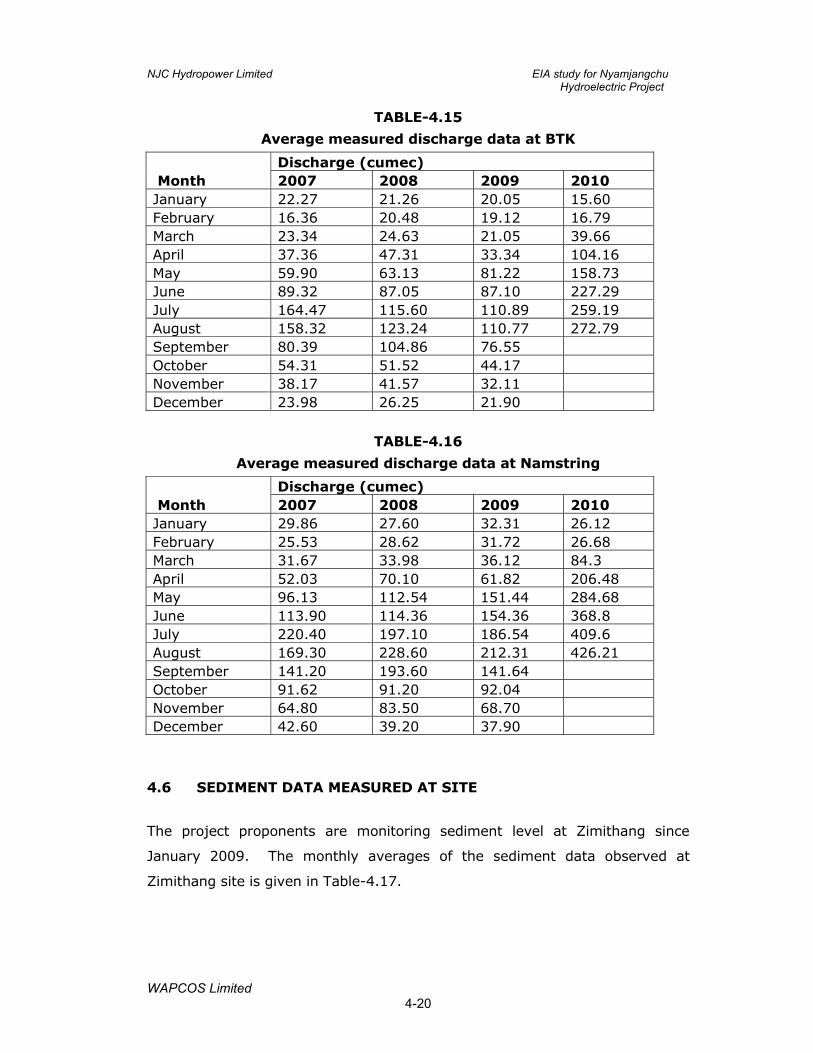
NJC Hydropower Limited EIA study for Nyamjangchu Hydroelectric Project
WAPCOS Limited 4-20
TABLE-4.15
Average measured discharge data at BTK
Month Discharge (cumec) 2007 2008 2009 2010
January 22.27 21.26 20.05 15.60 February 16.36 20.48 19.12 16.79 March 23.34 24.63 21.05 39.66 April 37.36 47.31 33.34 104.16 May 59.90 63.13 81.22 158.73 June 89.32 87.05 87.10 227.29 July 164.47 115.60 110.89 259.19 August 158.32 123.24 110.77 272.79 September 80.39 104.86 76.55 October 54.31 51.52 44.17 November 38.17 41.57 32.11 December 23.98 26.25 21.90
TABLE-4.16
Average measured discharge data at Namstring
Month Discharge (cumec) 2007 2008 2009 2010
January 29.86 27.60 32.31 26.12 February 25.53 28.62 31.72 26.68 March 31.67 33.98 36.12 84.3 April 52.03 70.10 61.82 206.48 May 96.13 112.54 151.44 284.68 June 113.90 114.36 154.36 368.8 July 220.40 197.10 186.54 409.6 August 169.30 228.60 212.31 426.21 September 141.20 193.60 141.64 October 91.62 91.20 92.04 November 64.80 83.50 68.70 December 42.60 39.20 37.90
4.6 SEDIMENT DATA MEASURED AT SITE
The project proponents are monitoring sediment level at Zimithang since
January 2009. The monthly averages of the sediment data observed at
Zimithang site is given in Table-4.17.
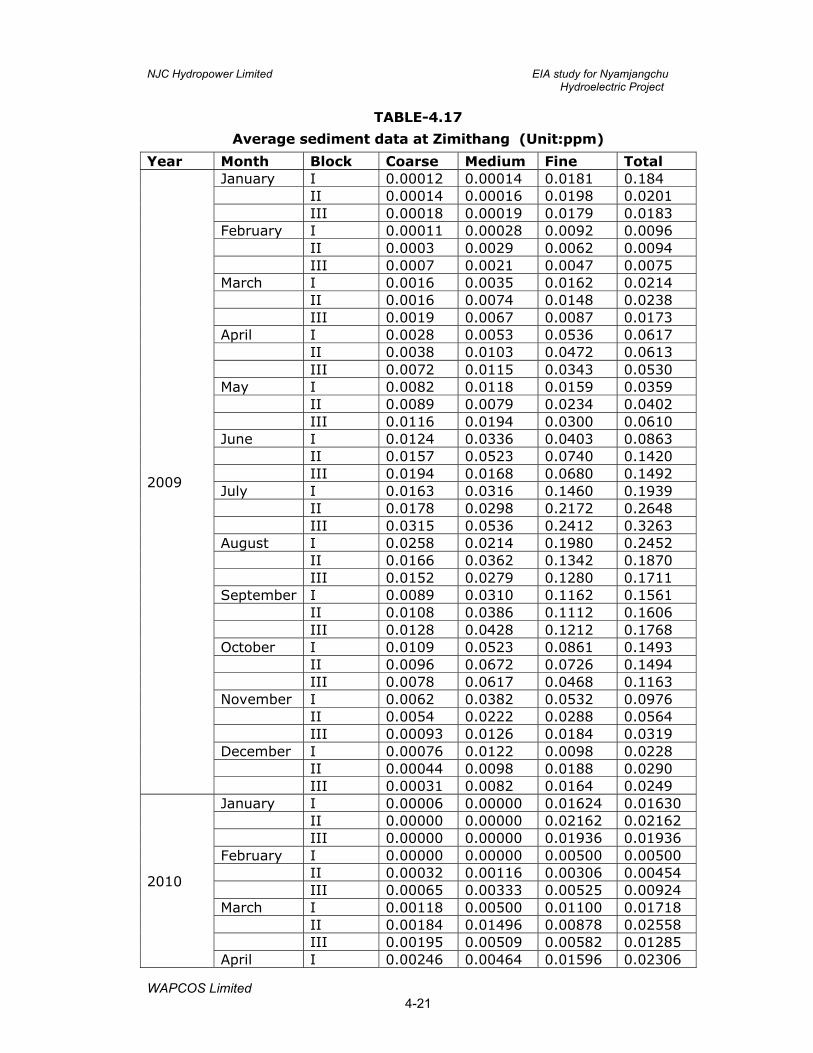
NJC Hydropower Limited EIA study for Nyamjangchu Hydroelectric Project
WAPCOS Limited 4-21
TABLE-4.17
Average sediment data at Zimithang (Unit:ppm)
Year Month Block Coarse Medium Fine Total
2009
January I 0.00012 0.00014 0.0181 0.184 II 0.00014 0.00016 0.0198 0.0201 III 0.00018 0.00019 0.0179 0.0183 February I 0.00011 0.00028 0.0092 0.0096 II 0.0003 0.0029 0.0062 0.0094 III 0.0007 0.0021 0.0047 0.0075 March I 0.0016 0.0035 0.0162 0.0214 II 0.0016 0.0074 0.0148 0.0238 III 0.0019 0.0067 0.0087 0.0173 April I 0.0028 0.0053 0.0536 0.0617 II 0.0038 0.0103 0.0472 0.0613 III 0.0072 0.0115 0.0343 0.0530 May I 0.0082 0.0118 0.0159 0.0359 II 0.0089 0.0079 0.0234 0.0402 III 0.0116 0.0194 0.0300 0.0610 June I 0.0124 0.0336 0.0403 0.0863 II 0.0157 0.0523 0.0740 0.1420 III 0.0194 0.0168 0.0680 0.1492 July I 0.0163 0.0316 0.1460 0.1939 II 0.0178 0.0298 0.2172 0.2648 III 0.0315 0.0536 0.2412 0.3263 August I 0.0258 0.0214 0.1980 0.2452 II 0.0166 0.0362 0.1342 0.1870 III 0.0152 0.0279 0.1280 0.1711 September I 0.0089 0.0310 0.1162 0.1561 II 0.0108 0.0386 0.1112 0.1606 III 0.0128 0.0428 0.1212 0.1768 October I 0.0109 0.0523 0.0861 0.1493 II 0.0096 0.0672 0.0726 0.1494 III 0.0078 0.0617 0.0468 0.1163 November I 0.0062 0.0382 0.0532 0.0976 II 0.0054 0.0222 0.0288 0.0564 III 0.00093 0.0126 0.0184 0.0319 December I 0.00076 0.0122 0.0098 0.0228 II 0.00044 0.0098 0.0188 0.0290 III 0.00031 0.0082 0.0164 0.0249
2010
January I 0.00006 0.00000 0.01624 0.01630 II 0.00000 0.00000 0.02162 0.02162 III 0.00000 0.00000 0.01936 0.01936 February I 0.00000 0.00000 0.00500 0.00500 II 0.00032 0.00116 0.00306 0.00454 III 0.00065 0.00333 0.00525 0.00924 March I 0.00118 0.00500 0.01100 0.01718 II 0.00184 0.01496 0.00878 0.02558 III 0.00195 0.00509 0.00582 0.01285 April I 0.00246 0.00464 0.01596 0.02306
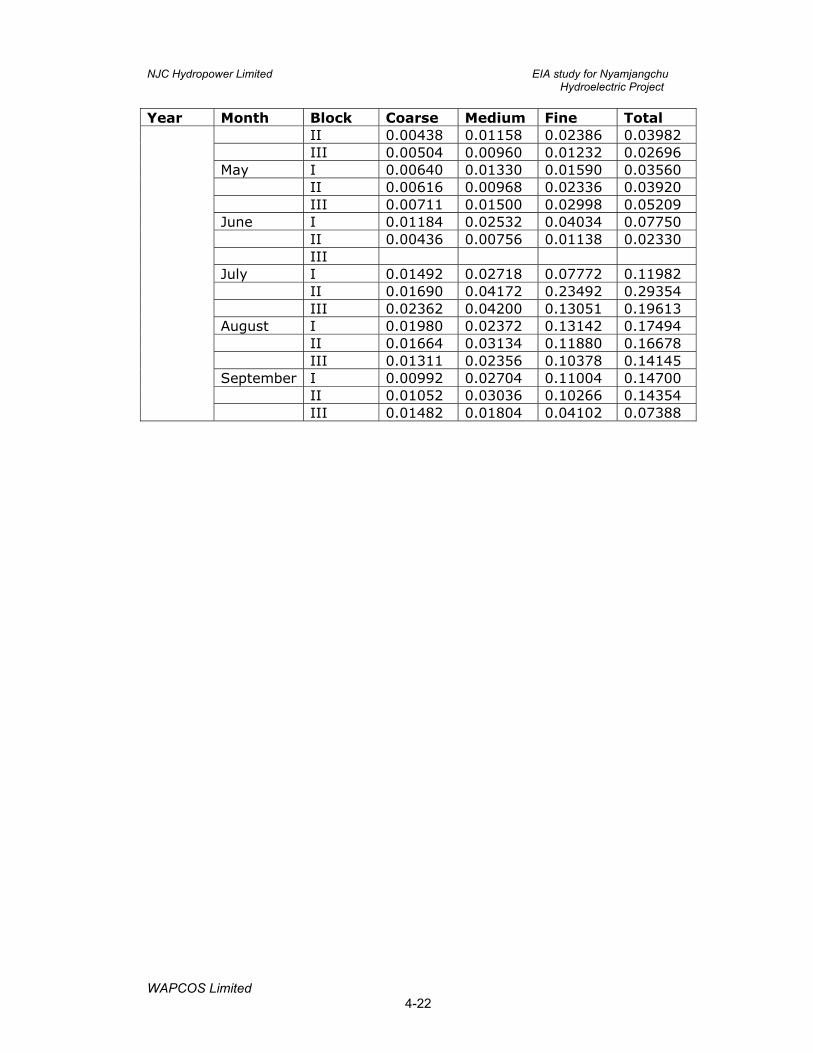
NJC Hydropower Limited EIA study for Nyamjangchu Hydroelectric Project
WAPCOS Limited 4-22
Year Month Block Coarse Medium Fine Total II 0.00438 0.01158 0.02386 0.03982 III 0.00504 0.00960 0.01232 0.02696 May I 0.00640 0.01330 0.01590 0.03560 II 0.00616 0.00968 0.02336 0.03920 III 0.00711 0.01500 0.02998 0.05209 June I 0.01184 0.02532 0.04034 0.07750 II 0.00436 0.00756 0.01138 0.02330 III July I 0.01492 0.02718 0.07772 0.11982 II 0.01690 0.04172 0.23492 0.29354 III 0.02362 0.04200 0.13051 0.19613 August I 0.01980 0.02372 0.13142 0.17494 II 0.01664 0.03134 0.11880 0.16678 III 0.01311 0.02356 0.10378 0.14145 September I 0.00992 0.02704 0.11004 0.14700 II 0.01052 0.03036 0.10266 0.14354 III 0.01482 0.01804 0.04102 0.07388
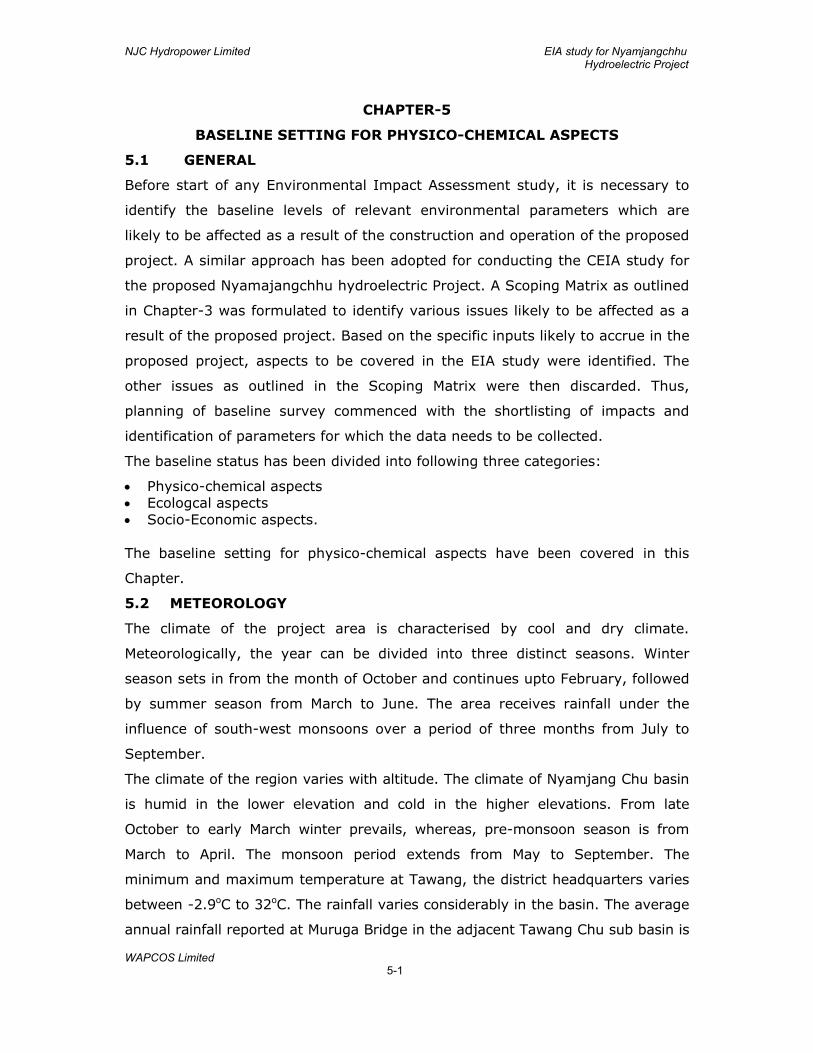
NJC Hydropower Limited EIA study for Nyamjangchhu Hydroelectric Project
WAPCOS Limited 5-1
CHAPTER-5
BASELINE SETTING FOR PHYSICO-CHEMICAL ASPECTS
5.1 GENERAL
Before start of any Environmental Impact Assessment study, it is necessary to
identify the baseline levels of relevant environmental parameters which are
likely to be affected as a result of the construction and operation of the proposed
project. A similar approach has been adopted for conducting the CEIA study for
the proposed Nyamajangchhu hydroelectric Project. A Scoping Matrix as outlined
in Chapter-3 was formulated to identify various issues likely to be affected as a
result of the proposed project. Based on the specific inputs likely to accrue in the
proposed project, aspects to be covered in the EIA study were identified. The
other issues as outlined in the Scoping Matrix were then discarded. Thus,
planning of baseline survey commenced with the shortlisting of impacts and
identification of parameters for which the data needs to be collected.
The baseline status has been divided into following three categories:
• Physico-chemical aspects • Ecologcal aspects • Socio-Economic aspects. The baseline setting for physico-chemical aspects have been covered in this
Chapter.
5.2 METEOROLOGY
The climate of the project area is characterised by cool and dry climate.
Meteorologically, the year can be divided into three distinct seasons. Winter
season sets in from the month of October and continues upto February, followed
by summer season from March to June. The area receives rainfall under the
influence of south-west monsoons over a period of three months from July to
September.
The climate of the region varies with altitude. The climate of Nyamjang Chu basin
is humid in the lower elevation and cold in the higher elevations. From late
October to early March winter prevails, whereas, pre-monsoon season is from
March to April. The monsoon period extends from May to September. The
minimum and maximum temperature at Tawang, the district headquarters varies
between -2.9oC to 32oC. The rainfall varies considerably in the basin. The average
annual rainfall reported at Muruga Bridge in the adjacent Tawang Chu sub basin is
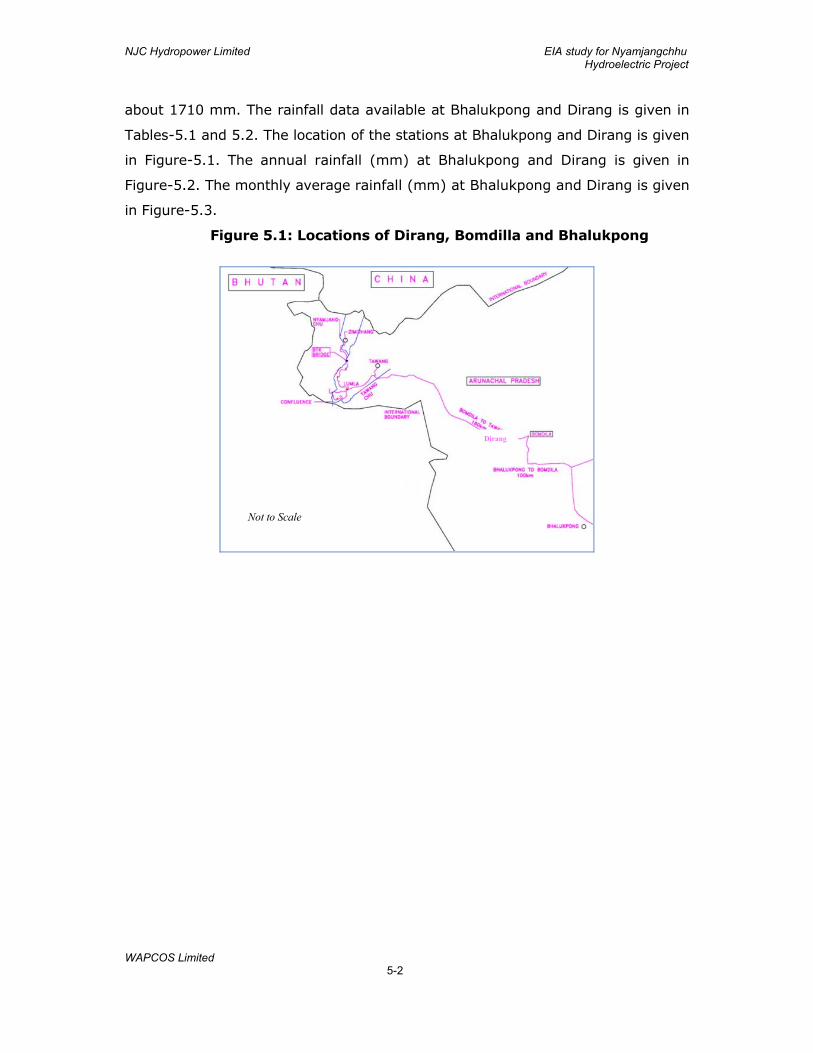
NJC Hydropower Limited EIA study for Nyamjangchhu Hydroelectric Project
WAPCOS Limited 5-2
about 1710 mm. The rainfall data available at Bhalukpong and Dirang is given in
Tables-5.1 and 5.2. The location of the stations at Bhalukpong and Dirang is given
in Figure-5.1. The annual rainfall (mm) at Bhalukpong and Dirang is given in
Figure-5.2. The monthly average rainfall (mm) at Bhalukpong and Dirang is given
in Figure-5.3.
Figure 5.1: Locations of Dirang, Bomdilla and Bhalukpong
Dirang
Not to Scale
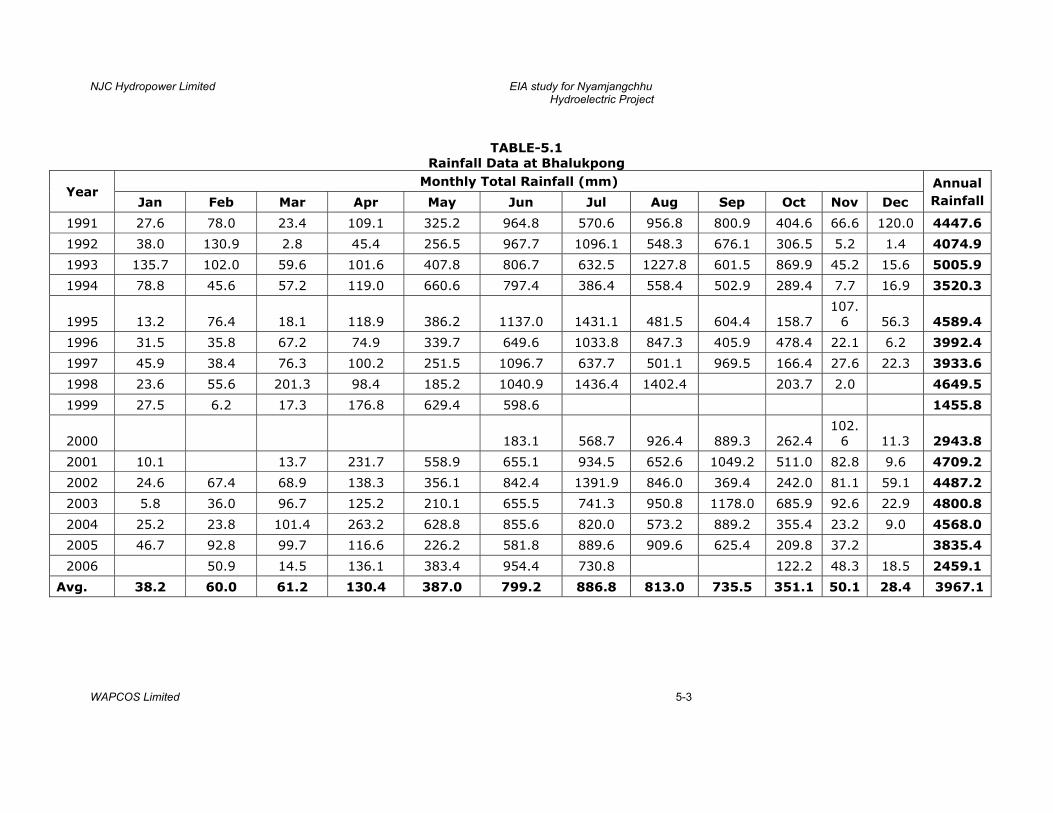
NJC Hydropower Limited EIA study for Nyamjangchhu Hydroelectric Project
WAPCOS Limited 5-3
TABLE-5.1 Rainfall Data at Bhalukpong
Year Monthly Total Rainfall (mm) Annual
Rainfall Jan Feb Mar Apr May Jun Jul Aug Sep Oct Nov Dec
1991 27.6 78.0 23.4 109.1 325.2 964.8 570.6 956.8 800.9 404.6 66.6 120.0 4447.6
1992 38.0 130.9 2.8 45.4 256.5 967.7 1096.1 548.3 676.1 306.5 5.2 1.4 4074.9
1993 135.7 102.0 59.6 101.6 407.8 806.7 632.5 1227.8 601.5 869.9 45.2 15.6 5005.9
1994 78.8 45.6 57.2 119.0 660.6 797.4 386.4 558.4 502.9 289.4 7.7 16.9 3520.3
1995 13.2 76.4 18.1 118.9 386.2 1137.0 1431.1 481.5 604.4 158.7 107.
6 56.3 4589.4
1996 31.5 35.8 67.2 74.9 339.7 649.6 1033.8 847.3 405.9 478.4 22.1 6.2 3992.4
1997 45.9 38.4 76.3 100.2 251.5 1096.7 637.7 501.1 969.5 166.4 27.6 22.3 3933.6
1998 23.6 55.6 201.3 98.4 185.2 1040.9 1436.4 1402.4 203.7 2.0 4649.5
1999 27.5 6.2 17.3 176.8 629.4 598.6 1455.8
2000 183.1 568.7 926.4 889.3 262.4 102.
6 11.3 2943.8
2001 10.1 13.7 231.7 558.9 655.1 934.5 652.6 1049.2 511.0 82.8 9.6 4709.2
2002 24.6 67.4 68.9 138.3 356.1 842.4 1391.9 846.0 369.4 242.0 81.1 59.1 4487.2
2003 5.8 36.0 96.7 125.2 210.1 655.5 741.3 950.8 1178.0 685.9 92.6 22.9 4800.8
2004 25.2 23.8 101.4 263.2 628.8 855.6 820.0 573.2 889.2 355.4 23.2 9.0 4568.0
2005 46.7 92.8 99.7 116.6 226.2 581.8 889.6 909.6 625.4 209.8 37.2 3835.4
2006 50.9 14.5 136.1 383.4 954.4 730.8 122.2 48.3 18.5 2459.1
Avg. 38.2 60.0 61.2 130.4 387.0 799.2 886.8 813.0 735.5 351.1 50.1 28.4 3967.1
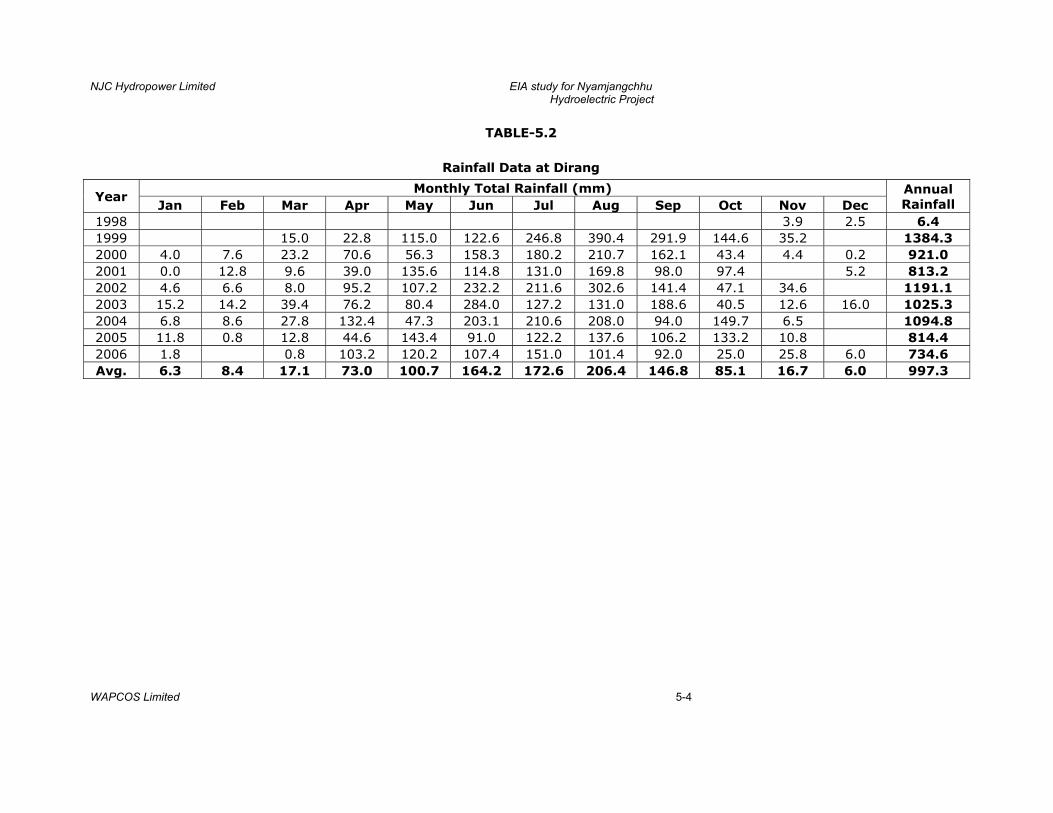
NJC Hydropower Limited EIA study for Nyamjangchhu Hydroelectric Project
WAPCOS Limited 5-4
TABLE-5.2
Rainfall Data at Dirang
Year Monthly Total Rainfall (mm) Annual
Rainfall Jan Feb Mar Apr May Jun Jul Aug Sep Oct Nov Dec 1998 3.9 2.5 6.4 1999 15.0 22.8 115.0 122.6 246.8 390.4 291.9 144.6 35.2 1384.3 2000 4.0 7.6 23.2 70.6 56.3 158.3 180.2 210.7 162.1 43.4 4.4 0.2 921.0 2001 0.0 12.8 9.6 39.0 135.6 114.8 131.0 169.8 98.0 97.4 5.2 813.2 2002 4.6 6.6 8.0 95.2 107.2 232.2 211.6 302.6 141.4 47.1 34.6 1191.1 2003 15.2 14.2 39.4 76.2 80.4 284.0 127.2 131.0 188.6 40.5 12.6 16.0 1025.3 2004 6.8 8.6 27.8 132.4 47.3 203.1 210.6 208.0 94.0 149.7 6.5 1094.8 2005 11.8 0.8 12.8 44.6 143.4 91.0 122.2 137.6 106.2 133.2 10.8 814.4 2006 1.8 0.8 103.2 120.2 107.4 151.0 101.4 92.0 25.0 25.8 6.0 734.6 Avg. 6.3 8.4 17.1 73.0 100.7 164.2 172.6 206.4 146.8 85.1 16.7 6.0 997.3
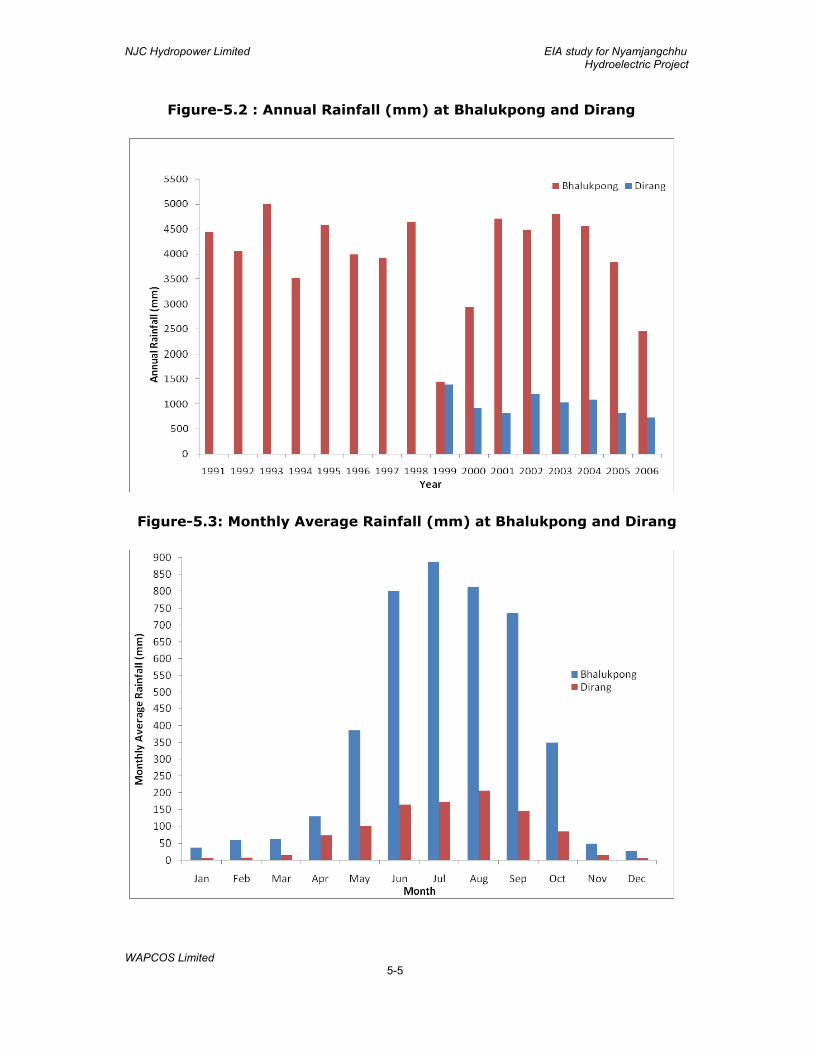
NJC Hydropower Limited EIA study for Nyamjangchhu Hydroelectric Project
WAPCOS Limited 5-5
Figure-5.2 : Annual Rainfall (mm) at Bhalukpong and Dirang
Figure-5.3: Monthly Average Rainfall (mm) at Bhalukpong and Dirang
NJC Hydropower Limited EIA study for Nyamjangchhu Hydroelectric Project
WAPCOS Limited
5-6
5.3 GEOLOGY
Regional Geology
Arunachal Pradesh occupies the Northeastern part of the Himalayas and is a hilly
state. In general, the southern limit of Arunachal Pradesh is marked by
Brahmaputra plains. The state can be divided into four major physiographic units:
The Brahmaputra Plains
The Naga-Patkoi Ranges
The Mishmi Hills
The Himalayan Ranges
The Brahmaputra Plains are at an average elevation of 100 m. The Himalayan
Ranges attain an elevation of 7089m and are divided into different physio-tectonic
divisions, separated by thrusts that, in general, run parallel to each other. From
south to north, the following tectonic units have been identified:
The sub-Himalayan zone, known as the Siwalik Hills, rises abruptly
from the Brahmaputra Plains from which it is separated by a fault –
the Foot Hill Fault. It is 10 to 20 km wide but narrows down to 1-2
km in the Dibang valley.
The Lesser Himalayas, show elevations from 2500 m to 4000 m and
are 80-90 km wide. This zone abuts against the Mishmi Hills in the
eastern Arunachal Pradesh. While its southern limit is marked by
the Main Boundary Fault (MBT), its northern limit is defined by the
Main Central Thrust.
The Greater Himalayas, the zone of highest relief, with elevations
greater than 6000 m, show steep slopes and deep gorges. Their
southern limit is defined by Main Central Thrust (MCT). High grade
metamorphic rocks, gneisses and granites generally form these
high mountains.
Trans-Himalayas is the northern most zone. It is about 30-40 km
wide and shows elevation lower than that of Greater Himalayas,
from about 3000 m to 6000 m.
The metamorphic belts of Arunachal Pradesh display evidence of multiple phases
of deformation, metamorphism and granitic activity. Volcanic activity is of
platform type and is associated with sedimentary rocks. The main metamorphic
rock types are hornblende schist, garnetiferous biotite gneiss, kyanite-sillimanite-
NJC Hydropower Limited EIA study for Nyamjangchhu Hydroelectric Project
WAPCOS Limited
5-7
garnet-biotite gneiss, biotite gneiss, augen gneiss, quartzo-felspathic gneiss,
dioritic gneiss, granodiorite, leuco-gneiss and amphibolites. A number of quartz,
aplite and pegmatite veins of variable thickness are seen cutting across these
rocks. Most of them are following the dominant foliation direction. Pegmatite
mainly consists of quartz, feldspar and subordinate amount of muscovite. Some of
these veins contain specks of pyrite. Foliation planes are recognized in Sherbang
area in the form of colour banding, mainly in quartzite, besides colour banding
layering in the ultramafic rocks in the form of primary layers.
The region is tectonically very active. The rocks of the area have undergone
repeated intense folding, faulting and thrusting in a highly complex fashion. The
drainage pattern is typically structurally controlled, rivers following the zone of
relative weakness, along faults or fractures. This pattern is generally aligned along
E.N.E.-W.S.W. to N.E.-S.W. directions, but many transverse structural features
have modified them.
The rocks encountered from the Bhalukpong foot hills in the South to Tawang in
the Northwest range in age from Tertiaries to Precambrian and are represented by
the Siwalik Supergroup, Gondwana Group, Bichom Group, Lumla/ Dirang
Formations, Bomdila Group and Sela Group (Plate-1, Volume-IV). The regional
foliation trend of these rocks varies from NE-SW to NNE-SSW with a regional
moderate northward dip. Major tectonic features viz., Main Frontal Thrust, Main
Boundary Fault and Main Central Thrust are located away from the project area.
While the Main Boundary Fault is disposed close to Bhalukpong, the gateway to
Bomdila-Dirang-Sela-Tawang areas of the State, the Main Central Thrust passes
through Rama Camp village, near Dirang. These main tectonic belts lie about 150
and 250 km from the project area, respectively.
The rock formations in Tawang area belong to Sela Group (Palaeoproterozoic) and
Lumla Formation (Mesoproterozoic) (Gopendra Kumar, 1997).
Geology of the Project Area
The rocks can be grouped into two main classes, viz gneiss and quartzite’s with
schist bands. While the gneisses occupy the upstream half of the site, the
quartzite’s occur in the downstream half.
The gneisses are generally medium to coarse grained and consist of quartz,
feldspar and biotite. Augen gneisses also occur occasionally. The biotite content
varies and mica rich gneisses are common.
NJC Hydropower Limited EIA study for Nyamjangchhu Hydroelectric Project
WAPCOS Limited
5-8
Quartzite is fine to medium grained and invariably contains mica that makes it
micaceous quartzite. Schist band of 1-5 m thickness are found associated with
the quartzite. There are a few exposures of carbonaceous schist in the vicinity of
the proposed area of surge shaft.
The geology of different components of the project is given in following
paragraphs.
Barrage
At the barrage site, the river is flat and very wide up to 200m, with high discharge
and low velocity. River bed exposes black fine silty sand with high content of
micaceous minerals. Boulders, composed mostly of quartzite and gneiss, and
ranging in size from a few centimeters to a few meters, are seen in the river bed
area. Gneissic rocks are best exposed on the right bank. General dip of Gneissic
rock foliation is N 009°/46°, i.e. in the upstream direction. The prominent joint set
is developed along the foliation. On the left bank, gneisses are exposed only along
the deeply incised nallahs near the Zimithang village.
Desilting Basin and Intake
The Desilting Basin is proposed to be placed over the river terrace on the left
bank of the river. Four bore holes have been drilled on the left bank of barrage
area that includes two each in desilting and intake areas at the base of the left
bank slopes. In the desilting basin holes, the top layer comprises boulders of
Biotite Gneiss of 4.5 to 7.0 m thickness, followed by 50 to 55 m thick blackish
medium to fine silty sand with bedrock of Gneiss at the base. Although the rocks
are fractured, the core recovery has been good. In the intake area holes, the
bedrock of Biotite Gneiss is encountered at shallower depth.
Head Race Tunnel
The 23.99 km long and 6.7 m dia Head Race Tunnel has been proposed on the
left bank of the Nyamjang Chu. From its intake near Zimithang Village to the
Surge Shaft, the HRT descends from El 2102m to 1940m at an average gradient
of 1 in 148. The site is located in the rugged terrain of the Nyamjang Chu valley
with ground elevations varying between El 1050m and 3800m. The site location
on the left bank has been preferred mainly on considerations of adequate ground
cover, exposed rock and development of infrastructure. The long section suggests
that the vertical rock cover along the HRT varies from 100 m to about 990 m. The
valley slopes on the left flank of the river tend to be much steeper than on the
NJC Hydropower Limited EIA study for Nyamjangchhu Hydroelectric Project
WAPCOS Limited
5-9
right side where the slopes are flatter and has number of streams cutting it
deeply. The left bank in this stretch is covered with dense forest on the left bank.
Large tracts along the HRT alignment are covered with thick overburden. These
account for about 50% of the alignment. The HRT cuts across four major
drainages, viz Taksang Chu at RD 5110m, BTK nala at RD 10810m, Shakti nala at
RD 13700m and Gomkang Rong Chu at RD 20470m. For want of adequate ground
cover, the HRT alignment has been pushed into the hill across the BTK and
Gomkang Rong Chu, more prominently for the latter where the shift has been as
much as 2.7 km leading to a rectangular kink in the HRT. Post realignment, the
available ground cover over the HRT at drainage crossings is in excess of 150m.
The area is characterized by the absence of springs. In general, entire project
area is dry excepting ground moisture in Shakti-Gispu area that is attributed to
well cultivated and irrigated landuse practices. The drilling at Surge Shaft site
down to 125m depth has not encountered water table and has seen complete
water loss during drilling.
Surge Shaft
The proposed 10/12m diameter Surge Shaft is located over quartzite with schist
bands and occasional carbonaceous schist bands. The rocks have steep dips
oriented in N178/35. The strata are highly jointed & occasionally sheared.
Foliation joints are the most prominent ones. A slide debris also occurs at the site.
Thin bands of carbonaceous schist dipping N 178/35 are found in the road cutting
near the surge shaft area. Thickness of this band varies between 1 to 2 m.
Pressure Shaft
A two steps branched pressure shaft is proposed to take water from the surge
shaft to the underground powerhouse. Three branches of the pressure shaft of
dia. 2.9 m will carry water from the surge shaft and each of these branches will be
subdivided into two branches of dia. 2.0 m to provide water to six machines in the
powerhouse. Jointed quartzite with schistose bands is exposed in the area. Rock
foliation dips N178/35. On surface, bedrock appears to be affected by closely
spaced joints, foliation joints being prominent.
As the geology of the area suggests that the zone consists of quartzite which are
highly fractured requires steel liners and adequate support for stabilization of
structure during the construction.
NJC Hydropower Limited EIA study for Nyamjangchhu Hydroelectric Project
WAPCOS Limited
5-10
Powerhouse
An underground powerhouse complex is proposed in the downstream of
Namtsering Bridge. The proposed size of the powerhouse cavity is about 20 m x
42 m x 166 m, with vertical cover of about 530 m and lateral cover of nearly 1200
m. Two parallel cavities, one for the powerhouse and one for the transformer hall
are planned. The dimension of transformer hall is 172.25m X 16.3 m X 24m.
5.4 GEOMORPHOLOGY OF THE PROJECT AREA
The project sites lie in a well dissected mountain terrain drained by the glacial fed
Nyamjang Chu and the Tawang Chu. The ground elevations range between
1030m and 3800m. The slopes are mostly steep to very steep. The Nyamjang
Chu flows at a general gradient of about 1 in 25. However, past river blockades
have resulted into silted up lakes leading to sections of the river having very
gentle gradients and wider river beds. Two such sections were found at Zimithang
and BTK Bridge.
The river section at the proposed barrage site near Zimithang is wide and
characteristically flat in a stretch of about 2.5 km. It presents a classic case of
silted up lake formed due to river blockade that, as per local reports, may not be
very old. By implication, the lake deposits may not be much consolidated. The
sudden drop in the river bed from a gradient of 1:280 at the barrage site to 1:10
immediately d/s of the lake deposit, suggests that its maximum thickness may be
about 100m. At the barrage axis, it is found to be over 91m thick. A similar type
of blockade with the presence of another lake deposit is found in BTK bridge area
that is reported to have occurred as recently as July 2006.
The drainage pattern is structurally controlled. Streams are typically seen to be
taking sharp bends. Tributary streams are meeting the main river at about right
angle. There are a number of first, second and third order streams joining the
main river. The number of first order streams on the right bank is much more
than that on the left bank. There are about 11 first order streams on the right
bank of the river to which several second and third order streams are joining. On
the left bank, there are only three major nallahs cutting across the area,
important ones being Taksang Chu and Gomkang Rong Chu.
Geomorphic Units Based on Satellite Imagery Interpretation
Geomorphologically the study area is characterized by undulating dissected
structural hills, which have been denudated and formed various features. The
dissected hills have been denudated with Intermountain valley. Different
NJC Hydropower Limited EIA study for Nyamjangchhu Hydroelectric Project
WAPCOS Limited
5-11
geomorphic units were delineated based on their denudational, depositional,
topographical and structural characteristics. The geomorphic units have followed a
standard classification scheme. Homogeneous geomorphological terrain units were
delineated and mapped as individual polygons. The main types of
geomorphological units were distinguished as following:
Highly dissected structural hill: With high density of drainage & lineaments.
Moderate dissected structural hill: With moderate drainage density.
Low dissected structural hill: With low drainage density.
Hill terraces: In the study area hill terraces are developed on the gentle slopping
area, especially nearby main river valley. These terraces are mainly under
cultivation for agricultural crops.
Flood plain: In the study area narrow floodplain is developed in upper reaches of
Nyamjang Chu river. These flood plains are occupied with agricultural field.
Sand bars: In the study area these landforms are developed near to river and
are subjected to flooding in the monsoon period due to rise and fall of floodwater.
Denudation hills: These are formed due to differential erosion and weathering.
These are low hills with sparse vegetation cover and are subjected to high erosion
rate. In the study area these landforms are found in the surge shaft area near
Lumla village as well as in between Gispu and Shakti village.
Intermountain valley: The intermountain valleys are developed in between the
high sloping hills because of structural disturbances. In the study area these are
the broad depressions between mountains normally filled with colluvial deposits.
5.5 SEISMICITY
The north eastern part of the Himalayas is seismically very active. It is located at
the junction of three tectonic plates: the Indian plate, the Eurasian plate and the
Indo-Burmese plate. These are in constant collision and thus the region is under
high tectonic stresses, which are released in the form of earthquakes. Neo-
tectonic activity has rejuvenated the existing tectonic lineaments and developed
new cross-faults. These cross-faults have controlled the sedimentation of Older
(Mid to Lower Pleistocene) and Newer (Holocene) Alluvium. This has off-set the
major thrusts (MCT, MBF, FHF). Epicenters of almost all the faults are located
along the major cross-faults, whereas no activity is observed in the above said
major thrusts. Major concentration of seismic events is restricted to north eastern
part of the area with two main clusters around Po Chu fault zone. Besides these,
some events scattered around Bame, Siang, Lohit and Tiding faults have also
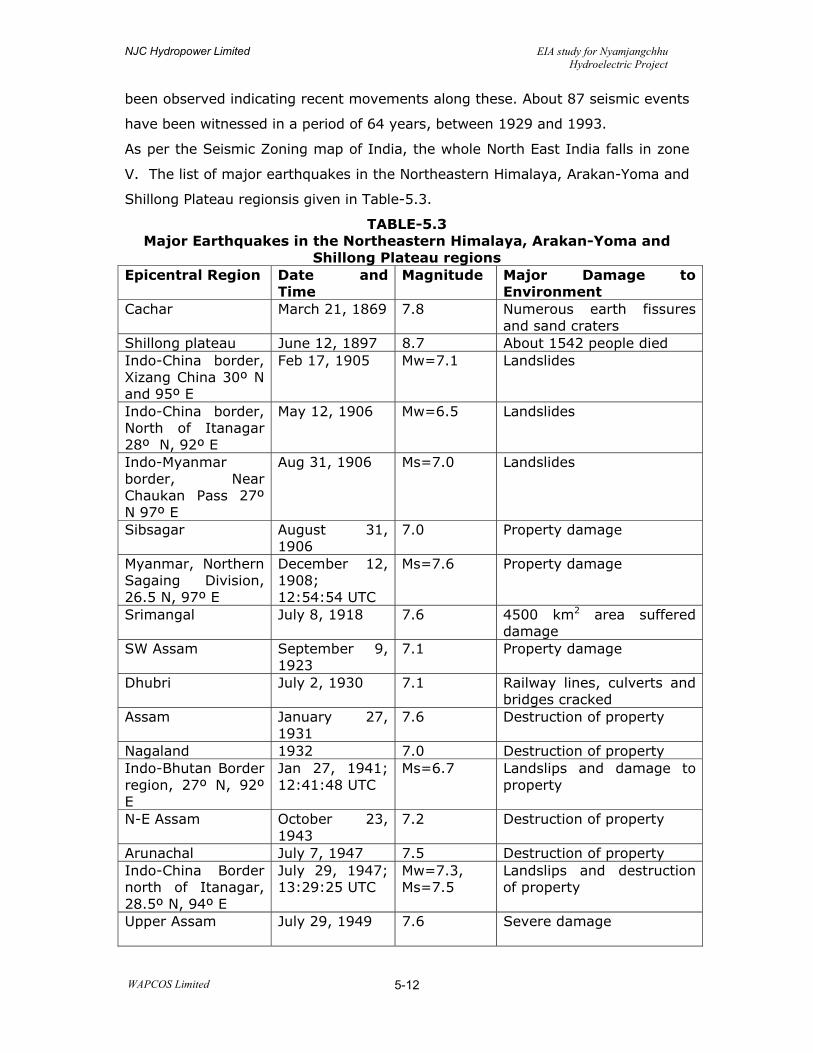
NJC Hydropower Limited EIA study for Nyamjangchhu Hydroelectric Project
WAPCOS Limited
5-12
been observed indicating recent movements along these. About 87 seismic events
have been witnessed in a period of 64 years, between 1929 and 1993.
As per the Seismic Zoning map of India, the whole North East India falls in zone
V. The list of major earthquakes in the Northeastern Himalaya, Arakan-Yoma and
Shillong Plateau regionsis given in Table-5.3.
TABLE-5.3 Major Earthquakes in the Northeastern Himalaya, Arakan-Yoma and
Shillong Plateau regions Epicentral Region Date and
Time Magnitude Major Damage to
Environment Cachar March 21, 1869 7.8 Numerous earth fissures
and sand craters Shillong plateau June 12, 1897 8.7 About 1542 people died Indo-China border, Xizang China 30º N and 95º E
Feb 17, 1905 Mw=7.1 Landslides
Indo-China border, North of Itanagar 28º N, 92º E
May 12, 1906 Mw=6.5 Landslides
Indo-Myanmar border, Near Chaukan Pass 27º N 97º E
Aug 31, 1906 Ms=7.0 Landslides
Sibsagar August 31, 1906
7.0 Property damage
Myanmar, Northern Sagaing Division, 26.5 N, 97º E
December 12, 1908; 12:54:54 UTC
Ms=7.6 Property damage
Srimangal July 8, 1918 7.6 4500 km2 area suffered damage
SW Assam September 9, 1923
7.1 Property damage
Dhubri July 2, 1930 7.1 Railway lines, culverts and bridges cracked
Assam January 27, 1931
7.6 Destruction of property
Nagaland 1932 7.0 Destruction of property Indo-Bhutan Border region, 27º N, 92º E
Jan 27, 1941; 12:41:48 UTC
Ms=6.7 Landslips and damage to property
N-E Assam October 23, 1943
7.2 Destruction of property
Arunachal July 7, 1947 7.5 Destruction of property Indo-China Border north of Itanagar, 28.5º N, 94º E
July 29, 1947; 13:29:25 UTC
Mw=7.3, Ms=7.5
Landslips and destruction of property
Upper Assam July 29, 1949 7.6 Severe damage
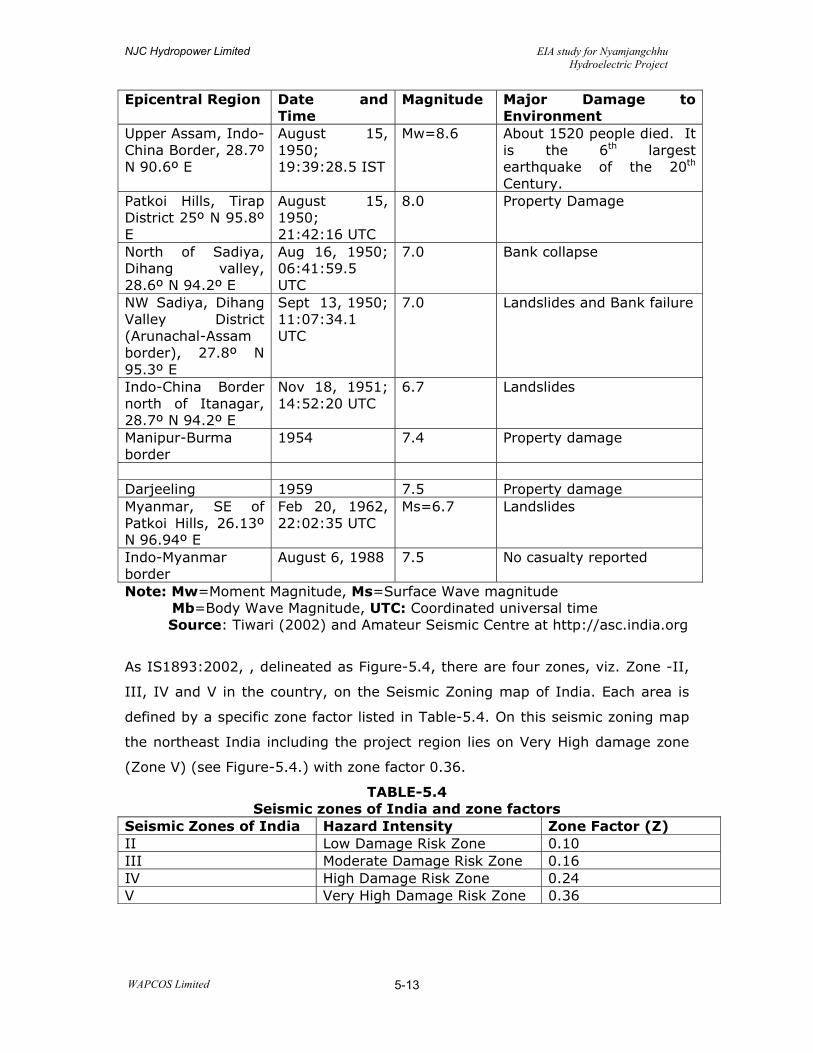
NJC Hydropower Limited EIA study for Nyamjangchhu Hydroelectric Project
WAPCOS Limited
5-13
Epicentral Region Date and Time
Magnitude Major Damage to Environment
Upper Assam, Indo-China Border, 28.7º N 90.6º E
August 15, 1950; 19:39:28.5 IST
Mw=8.6 About 1520 people died. It is the 6th largest earthquake of the 20th Century.
Patkoi Hills, Tirap District 25º N 95.8º E
August 15, 1950; 21:42:16 UTC
8.0 Property Damage
North of Sadiya, Dihang valley, 28.6º N 94.2º E
Aug 16, 1950; 06:41:59.5 UTC
7.0 Bank collapse
NW Sadiya, Dihang Valley District (Arunachal-Assam border), 27.8º N 95.3º E
Sept 13, 1950; 11:07:34.1 UTC
7.0 Landslides and Bank failure
Indo-China Border north of Itanagar, 28.7º N 94.2º E
Nov 18, 1951; 14:52:20 UTC
6.7 Landslides
Manipur-Burma border
1954 7.4 Property damage
Darjeeling 1959 7.5 Property damage Myanmar, SE of Patkoi Hills, 26.13º N 96.94º E
Feb 20, 1962, 22:02:35 UTC
Ms=6.7 Landslides
Indo-Myanmar border
August 6, 1988 7.5 No casualty reported
Note: Mw=Moment Magnitude, Ms=Surface Wave magnitude Mb=Body Wave Magnitude, UTC: Coordinated universal time Source: Tiwari (2002) and Amateur Seismic Centre at http://asc.india.org
As IS1893:2002, , delineated as Figure-5.4, there are four zones, viz. Zone -II,
III, IV and V in the country, on the Seismic Zoning map of India. Each area is
defined by a specific zone factor listed in Table-5.4. On this seismic zoning map
the northeast India including the project region lies on Very High damage zone
(Zone V) (see Figure-5.4.) with zone factor 0.36.
TABLE-5.4 Seismic zones of India and zone factors
Seismic Zones of India Hazard Intensity Zone Factor (Z) II Low Damage Risk Zone 0.10 III Moderate Damage Risk Zone 0.16 IV High Damage Risk Zone 0.24 V Very High Damage Risk Zone 0.36
NJC Hydropower Limited EIA study for Nyamjangchhu Hydroelectric Project
WAPCOS Limited
5-14
A site specific study for design earthquake parameters for Nyamjang chhu HE
Project has been conducted by IIT Roorkee and is enclosed as Annexure-II. The
key findings of this report are given in the following paragraphs.
The project lies in seismic Zone V as per the seismic zoning map of India
incorporated in Indian Standard Criteria for Earthquake Resistant Design of
Structures (IS : 1893 (Part 1): 2002). The recommendations for the site specific
earthquake design parameters for the site are based on the studies carried out
related to the tectonics, regional geology, local geology around the site,
earthquake occurrences in the region around the site and the seismotectonic
setup of the area.
The site specific design earthquake parameter for MCE condition is estimated to
Ms=8.0 magnitude earthquake occurring at MCT. The PGA values for MCE and
DBE conditions and estimated to 0.36g and 0.18g respectively.
Data for time history of earthquake ground motion for the dynamic analysis of
the barrage was normalised to peak ground accelerations of 1.0 g. For MCE and
DBE time history analysis ground motion will have to be multiplied by 0.36g and
0.18g respectively. Vertical spectral acceleration values may be taken as two
third of the corresponding horizontal values. Similarly acceleration ordinates for
the time history of vertical ground motion may be assumed as two third of the
corresponding horizontal value. The site specific design acceleration spectra shall
be used in place of the design response spectra, given in IS: 1893 (Part 1).
The horizontal design seismic coefficient for preliminary design of Dam (primary
structure) is evaluated as
αh= (Z/6)* (Sa/g)
where,
Z is taken as the estimated PGA coefficient for MCE (0.36 in this case)
Sa/g is obtained from normalized horizontal acceleration spectra) corresponding
to the fundamental time period of the dam ‘T’. For other (secondary structures),
appropriate Reduction Factor R, as specified in IS: 1893 may be used along with
Importance factor I=1.
For calculating the horizontal seismic design coefficient as:
Ah=(Z/2)* (Sa/g)*(I/R)

NJC Hydropower Limited EIA study for Nyamjangchhu Hydroelectric Project
WAPCOS Limited
5-15
5.6 LAND USE PATTERN
Landuse describes how a patch of land is used (e.g. for agriculture, settlement,
forest), whereas land cover describes the materials (such as vegetation, rocks or
buildings) that are present on the surface. Accurate land use and land cover
identification is the key to most of the planning processes.
The land use pattern of the study area has been studied through digital satellite
imagery data. Digital IRS-P6, LISS-III satellite imagery (Path: 095, Row: 048)
dated 9th May,2007 was procured from National Remote Sensing Agency
(NRSA), Hyderabad. The data was processed through ERDAS software package
available with WAPCOS.
Multi-variate statistics have been used for the analysis of multi-spectral data. As
a first step, clustering algorithms was established to a set of multi-variate class
statistics against which each pixel measurement vector in the scene was
compared. Then a classification decision rule, such as the probability of
maximum likelihood that the pixel belongs to a particular class amongst the
statistics set was calculated and the pixel was assigned to the particular class.
The information classes most often considered include both cover type or
community type descriptors as well as limited structural categories, such as
crown cover and size class: of the trees.
Although two different approaches to the development of the multi-variate
statistics are used, unsupervised and supervised, their combination gives better
results. In the unsupervised classification, the radiance values of the image data
set were submitted to clustering algorithms that generate statistics until the
stopping rule i.e. minimum number of points per cluster, was reached and the
minimum distance between clusters and separability measure was established.
Another approach is to 'seed' spectral space with starting points to establish
candidate mean value for clusters, and then iterate the clustering procedure
until minimization criteria is achieved. In the supervised method, training sites
with known properties were used to extract spectral statistics from the image
data by interactively identifying the sites in the imagery. Ground truthing was
done for site identification. In the unsupervised method, identification of the
cluster was done after completing the classification by comparing the spatial
distribution of the mapped classes with ground reference data.
The wide geographic distribution and the range of sites and climates occupied by
forests complicates the understanding of the interaction of forests with solar
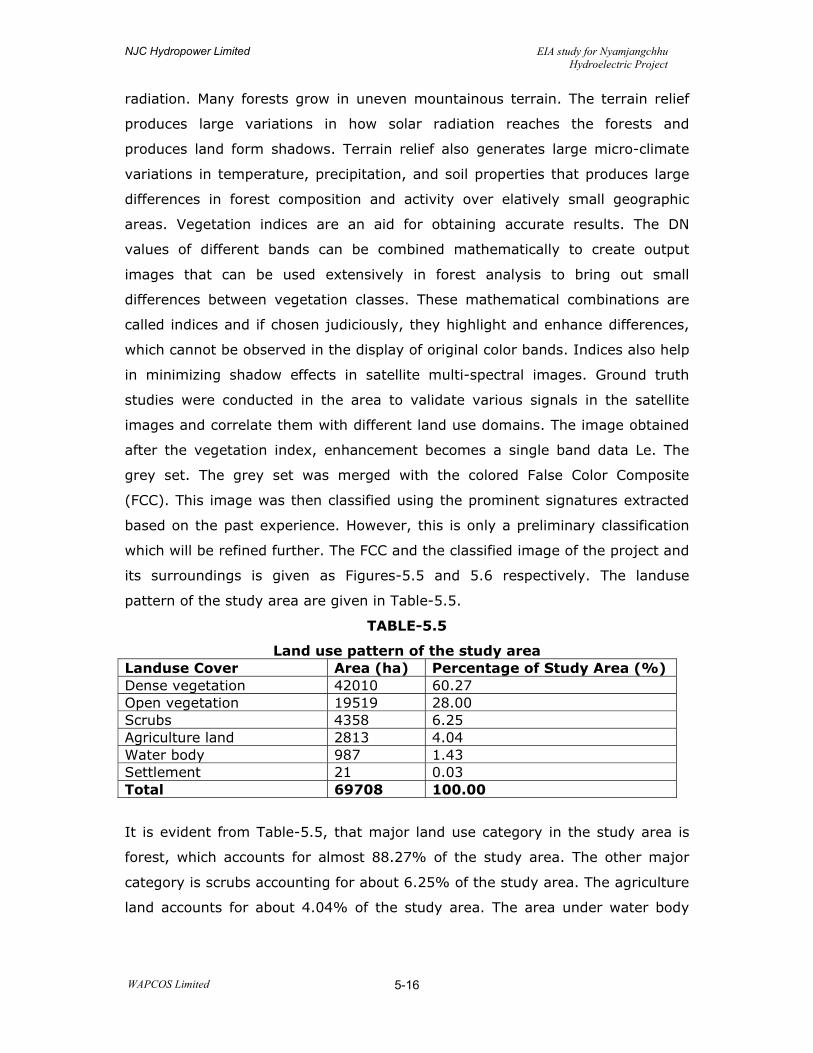
NJC Hydropower Limited EIA study for Nyamjangchhu Hydroelectric Project
WAPCOS Limited
5-16
radiation. Many forests grow in uneven mountainous terrain. The terrain relief
produces large variations in how solar radiation reaches the forests and
produces land form shadows. Terrain relief also generates large micro-climate
variations in temperature, precipitation, and soil properties that produces large
differences in forest composition and activity over elatively small geographic
areas. Vegetation indices are an aid for obtaining accurate results. The DN
values of different bands can be combined mathematically to create output
images that can be used extensively in forest analysis to bring out small
differences between vegetation classes. These mathematical combinations are
called indices and if chosen judiciously, they highlight and enhance differences,
which cannot be observed in the display of original color bands. Indices also help
in minimizing shadow effects in satellite multi-spectral images. Ground truth
studies were conducted in the area to validate various signals in the satellite
images and correlate them with different land use domains. The image obtained
after the vegetation index, enhancement becomes a single band data Le. The
grey set. The grey set was merged with the colored False Color Composite
(FCC). This image was then classified using the prominent signatures extracted
based on the past experience. However, this is only a preliminary classification
which will be refined further. The FCC and the classified image of the project and
its surroundings is given as Figures-5.5 and 5.6 respectively. The landuse
pattern of the study area are given in Table-5.5.
TABLE-5.5
Land use pattern of the study area Landuse Cover Area (ha) Percentage of Study Area (%) Dense vegetation 42010 60.27 Open vegetation 19519 28.00 Scrubs 4358 6.25 Agriculture land 2813 4.04 Water body 987 1.43 Settlement 21 0.03 Total 69708 100.00
It is evident from Table-5.5, that major land use category in the study area is
forest, which accounts for almost 88.27% of the study area. The other major
category is scrubs accounting for about 6.25% of the study area. The agriculture
land accounts for about 4.04% of the study area. The area under water body
NJC Hydropower Limited EIA study for Nyamjangchhu Hydroelectric Project
WAPCOS Limited
5-17
account for about 1.42% of the study area. The area under settlement is about
0.03% of the study area.
5.7 SOILS
Soil is the product of geological, chemical and biological interactions. The soils in
the region vary according to altitude and climate. The soil in the project area
and study area are young like any other region of Himalayas. The vegetal cover
is one of the most important influencing factors characterizing the soil types in a
region. Soil on the slope above 30o, due to erosion and mass wasting
processing, are generally shallow and usually have very thin surface horizons.
Such soils have medium to coarse texture. Residual soils are well developed on
level summits of lesser Himalayas, Sub-soil are deep and heavily textured.
The soil quality was monitored at various locations in the catchment area. The
monitoring was conducted by WAPCOS for three seasons namely Monsoon
(August 2007), Post-Monsoon (December 2007) and Pre-Monsoon (March 2008).
As a part of field studies, soil samples have been collected at various locations in
the catchment area. The sampling stations are shown in Figure- 5.7. The results
of Monsoon (August 2007), Post-Monsoon (December 2007) and Pre-Monsoon
(March 2008). seasons are given in Tables 5.6 to 5.8 respectively.
The pH of soil at various sites lies within neutral range. The levels of NPK
indicate moderate to high soil productivity. The sodium levels do not indicate
any potential for soil salinization or adverse impacts on soil productivity.
In a hydroelectric project, no significant impact on soil quality is expected
barring, soil pollution at local level due to disposal of construction waste. For
amelioration of such impacts appropriate management measures are
recommended.
R. S. Envirolink Technologies Pvt. Ltd. monitored soil quality at various locations
for three seasons namely, Pre-monsoon (March 2008), Monsoon (August 2008)
and Post-monsoon (December 2008).The results are given in Tables-5.9 to 5.11.

NJC Hydropower Limited EIA study for Nyamjangchhu Hydroelectric Project
WAPCOS Limited
5-18
TABLE-5.6
Results of soil sampling analysis of study area (Monsoon season)
Parameter Unit S1 S2 S3 S4 S5 S6 S7 S8 S9 S10
pH - 7.4 7.2 7.3 7.3 7.2 7.1 7.1 7.55 6.8 7.0 Electrical Conductivity
µmhos/ cm
18.2 28.2 18.1 20.0 22.3 19.0 25.4 22.1 24.3 26.5
Available Nitrogen
kg/ha 310 380 320 340 410 250 280 310 320 350
Available Potassium
kg/ha 12 16 12 12 17 20 25 22 20 19
Available Phosphorus
kg/ha 140 220 260 210 140 220 190 250 260 180
Cation Exchange Capacity
meq/ 100 gm
15.0 11.6 11.1 11.4 13.2 13.0 12.2 11.0 11.3 11.1
Sulphates (as SO4)
mg/kg <1 <1 <1 <1 <1 <1 <1 <1 <1 <1
Chlorides (as cl)
mg/kg 220 355 320 250 291 254 320 354 211 254
Sand %w/w 60.9 70.4 68.2 64.6 70.1 79.1 58.1 61.9 77.8 67.2 Clay %w/w 5.5 5.6 5.0 6.6 10.2 8.4 16.3 15.9 14.4 13.0 Silt %w/w 34.6 24.0 26.8 28.8 19.7 12.5 25.6 22.2 8.8 19.8 Texture Sandy Sandy Sandy Sandy Sandy Sandy Sandy Sandy Sandy Sandy Source: Field Studies, WAPCOS Limited
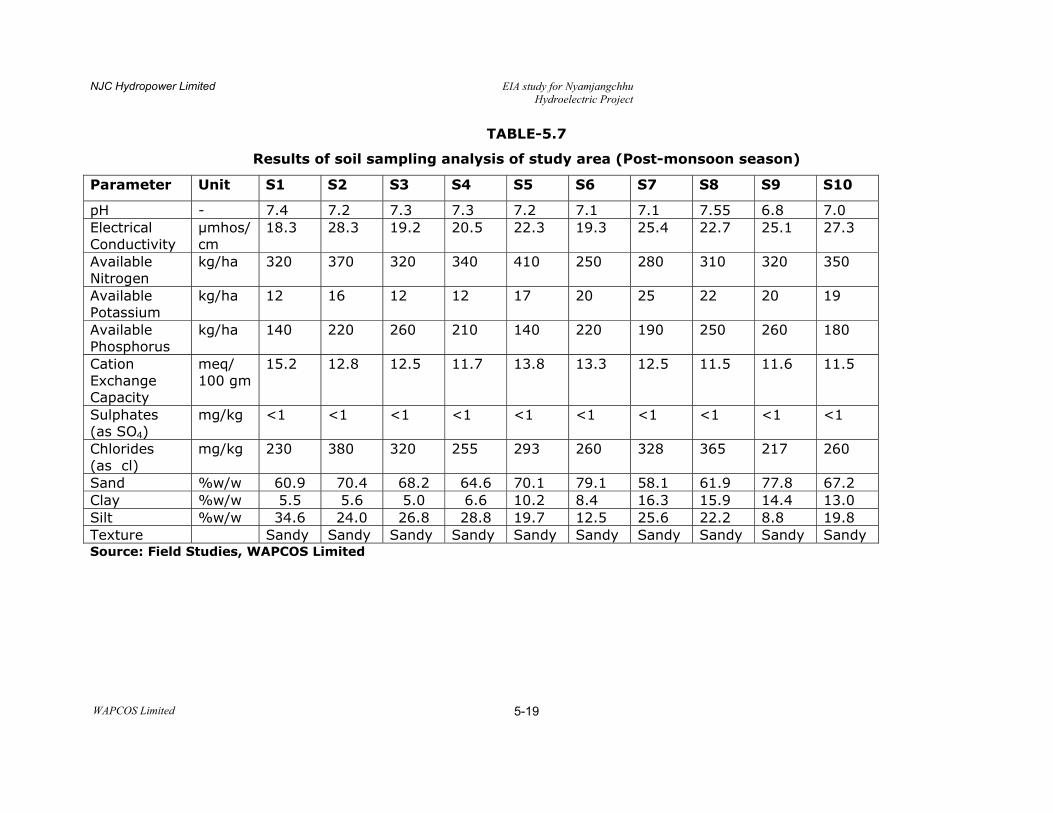
NJC Hydropower Limited EIA study for Nyamjangchhu Hydroelectric Project
WAPCOS Limited
5-19
TABLE-5.7
Results of soil sampling analysis of study area (Post-monsoon season)
Parameter Unit S1 S2 S3 S4 S5 S6 S7 S8 S9 S10
pH - 7.4 7.2 7.3 7.3 7.2 7.1 7.1 7.55 6.8 7.0 Electrical Conductivity
µmhos/ cm
18.3 28.3 19.2 20.5 22.3 19.3 25.4 22.7 25.1 27.3
Available Nitrogen
kg/ha 320 370 320 340 410 250 280 310 320 350
Available Potassium
kg/ha 12 16 12 12 17 20 25 22 20 19
Available Phosphorus
kg/ha 140 220 260 210 140 220 190 250 260 180
Cation Exchange Capacity
meq/ 100 gm
15.2 12.8 12.5 11.7 13.8 13.3 12.5 11.5 11.6 11.5
Sulphates (as SO4)
mg/kg <1 <1 <1 <1 <1 <1 <1 <1 <1 <1
Chlorides (as cl)
mg/kg 230 380 320 255 293 260 328 365 217 260
Sand %w/w 60.9 70.4 68.2 64.6 70.1 79.1 58.1 61.9 77.8 67.2 Clay %w/w 5.5 5.6 5.0 6.6 10.2 8.4 16.3 15.9 14.4 13.0 Silt %w/w 34.6 24.0 26.8 28.8 19.7 12.5 25.6 22.2 8.8 19.8 Texture Sandy Sandy Sandy Sandy Sandy Sandy Sandy Sandy Sandy Sandy Source: Field Studies, WAPCOS Limited

NJC Hydropower Limited EIA study for Nyamjangchhu Hydroelectric Project
WAPCOS Limited
5-20
TABLE-5.8
Results of soil sampling analysis of study area (Pre-monsoon season)
Parameter Unit S1 S2 S3 S4 S5 S6 S7 S8 S9 S10
pH - 7.4 7.2 7.3 7.3 7.2 7.1 7.1 7.55 6.8 7.0 Electrical Conductivity
µmhos/ cm
18.3 28.3 19.2 20.5 22.3 19.3 25.4 22.7 25.1 27.3
Available Nitrogen
kg/ha 310 380 320 340 410 250 280 310 320 350
Available Potassium
kg/ha 12 16 12 12 17 20 25 22 20 19
Available Phosphorus
kg/ha 140 220 260 210 140 220 190 250 260 180
Cation Exchange Capacity
meq/ 100 gm
15.2 12.8 12.5 11.7 13.8 13.3 12.5 11.5 11.6 11.5
Sulphates (as SO4)
mg/kg <1 <1 <1 <1 <1 <1 <1 <1 <1 <1
Chlorides (as cl)
mg/kg 230 380 320 255 293 260 328 365 217 260
Sand %w/w 60.9 70.4 68.2 64.6 70.1 79.1 58.1 61.9 77.8 67.2 Clay %w/w 5.5 5.6 5.0 6.6 10.2 8.4 16.3 15.9 14.4 13.0 Silt %w/w 34.6 24.0 26.8 28.8 19.7 12.5 25.6 22.2 8.8 19.8 Texture Sandy Sandy Sandy Sandy Sandy Sandy Sandy Sandy Sandy Sandy Source: Field Studies, WAPCOS Limited
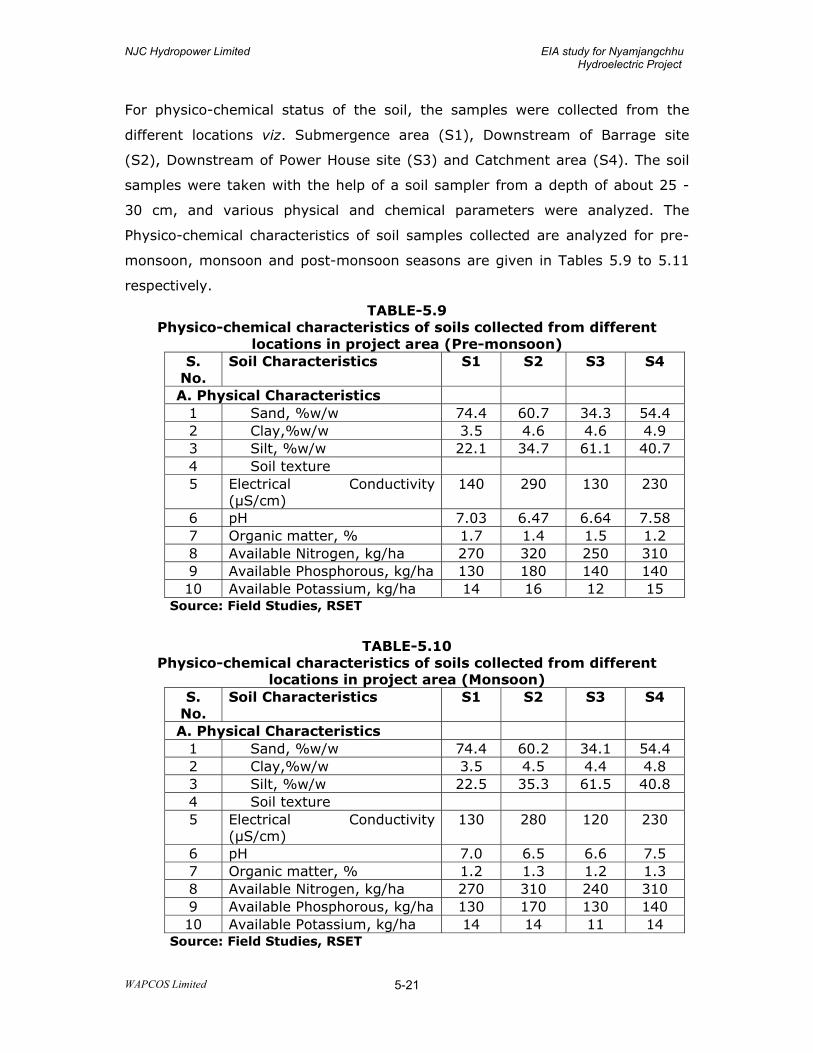
NJC Hydropower Limited EIA study for Nyamjangchhu Hydroelectric Project
WAPCOS Limited
5-21
For physico-chemical status of the soil, the samples were collected from the
different locations viz. Submergence area (S1), Downstream of Barrage site
(S2), Downstream of Power House site (S3) and Catchment area (S4). The soil
samples were taken with the help of a soil sampler from a depth of about 25 -
30 cm, and various physical and chemical parameters were analyzed. The
Physico-chemical characteristics of soil samples collected are analyzed for pre-
monsoon, monsoon and post-monsoon seasons are given in Tables 5.9 to 5.11
respectively.
TABLE-5.9 Physico-chemical characteristics of soils collected from different
locations in project area (Pre-monsoon) S.
No. Soil Characteristics S1 S2 S3 S4
A. Physical Characteristics 1 Sand, %w/w 74.4 60.7 34.3 54.4 2 Clay,%w/w 3.5 4.6 4.6 4.9 3 Silt, %w/w 22.1 34.7 61.1 40.7 4 Soil texture 5 Electrical Conductivity
(µS/cm) 140 290 130 230
6 pH 7.03 6.47 6.64 7.58 7 Organic matter, % 1.7 1.4 1.5 1.2 8 Available Nitrogen, kg/ha 270 320 250 310 9 Available Phosphorous, kg/ha 130 180 140 140 10 Available Potassium, kg/ha 14 16 12 15
Source: Field Studies, RSET
TABLE-5.10
Physico-chemical characteristics of soils collected from different locations in project area (Monsoon)
S. No.
Soil Characteristics S1 S2 S3 S4
A. Physical Characteristics 1 Sand, %w/w 74.4 60.2 34.1 54.4 2 Clay,%w/w 3.5 4.5 4.4 4.8 3 Silt, %w/w 22.5 35.3 61.5 40.8 4 Soil texture 5 Electrical Conductivity
(µS/cm) 130 280 120 230
6 pH 7.0 6.5 6.6 7.5 7 Organic matter, % 1.2 1.3 1.2 1.3 8 Available Nitrogen, kg/ha 270 310 240 310 9 Available Phosphorous, kg/ha 130 170 130 140 10 Available Potassium, kg/ha 14 14 11 14
Source: Field Studies, RSET
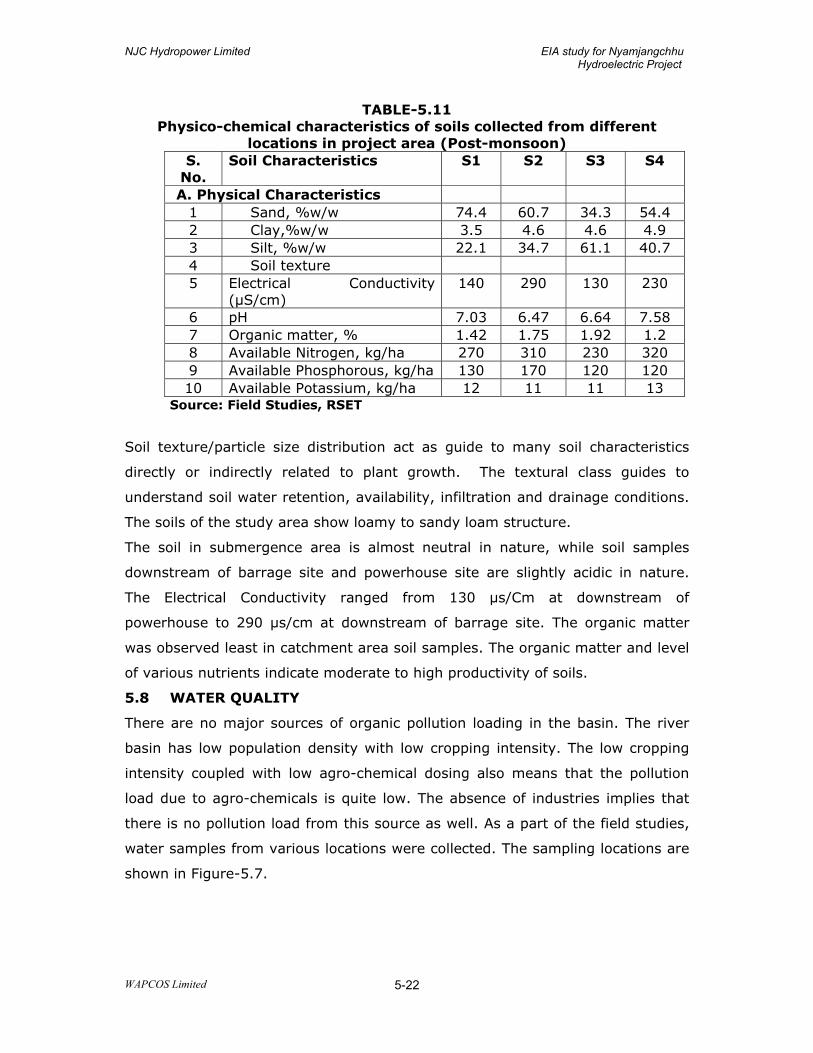
NJC Hydropower Limited EIA study for Nyamjangchhu Hydroelectric Project
WAPCOS Limited
5-22
TABLE-5.11 Physico-chemical characteristics of soils collected from different
locations in project area (Post-monsoon) S.
No. Soil Characteristics S1 S2 S3 S4
A. Physical Characteristics 1 Sand, %w/w 74.4 60.7 34.3 54.4 2 Clay,%w/w 3.5 4.6 4.6 4.9 3 Silt, %w/w 22.1 34.7 61.1 40.7 4 Soil texture 5 Electrical Conductivity
(µS/cm) 140 290 130 230
6 pH 7.03 6.47 6.64 7.58 7 Organic matter, % 1.42 1.75 1.92 1.2 8 Available Nitrogen, kg/ha 270 310 230 320 9 Available Phosphorous, kg/ha 130 170 120 120 10 Available Potassium, kg/ha 12 11 11 13
Source: Field Studies, RSET
Soil texture/particle size distribution act as guide to many soil characteristics
directly or indirectly related to plant growth. The textural class guides to
understand soil water retention, availability, infiltration and drainage conditions.
The soils of the study area show loamy to sandy loam structure.
The soil in submergence area is almost neutral in nature, while soil samples
downstream of barrage site and powerhouse site are slightly acidic in nature.
The Electrical Conductivity ranged from 130 µs/Cm at downstream of
powerhouse to 290 µs/cm at downstream of barrage site. The organic matter
was observed least in catchment area soil samples. The organic matter and level
of various nutrients indicate moderate to high productivity of soils.
5.8 WATER QUALITY
There are no major sources of organic pollution loading in the basin. The river
basin has low population density with low cropping intensity. The low cropping
intensity coupled with low agro-chemical dosing also means that the pollution
load due to agro-chemicals is quite low. The absence of industries implies that
there is no pollution load from this source as well. As a part of the field studies,
water samples from various locations were collected. The sampling locations are
shown in Figure-5.7.
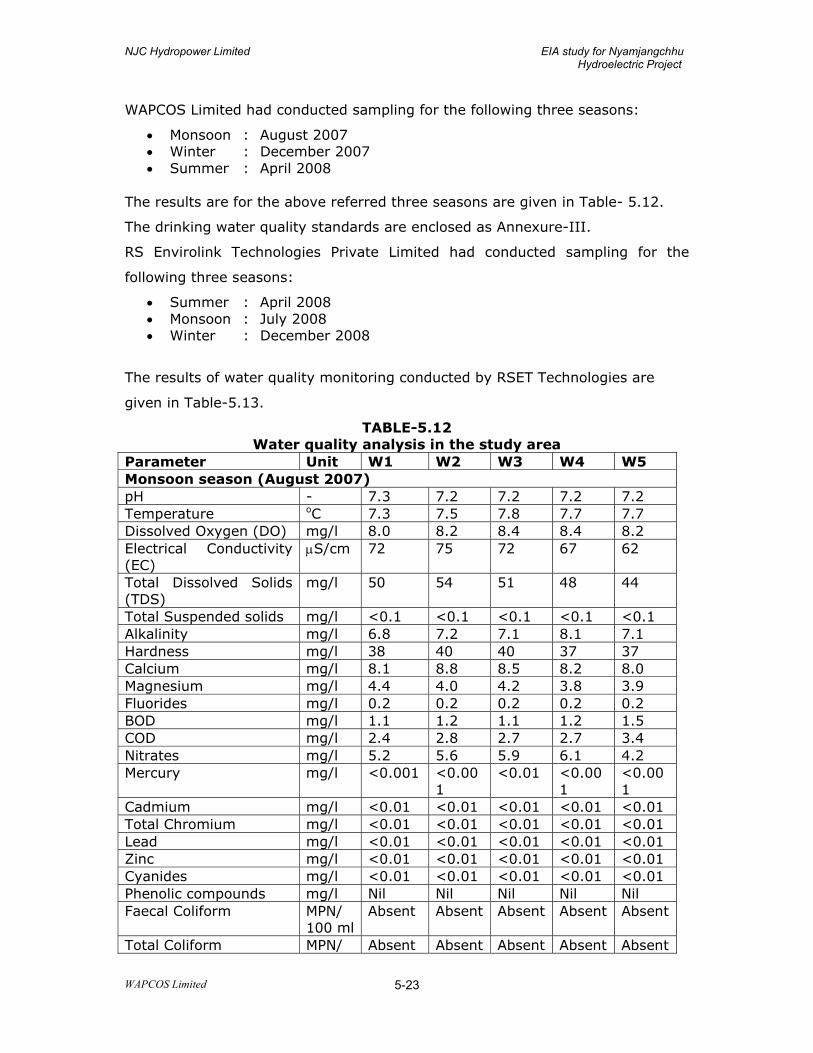
NJC Hydropower Limited EIA study for Nyamjangchhu Hydroelectric Project
WAPCOS Limited
5-23
WAPCOS Limited had conducted sampling for the following three seasons:
• Monsoon : August 2007 • Winter : December 2007 • Summer : April 2008
The results are for the above referred three seasons are given in Table- 5.12.
The drinking water quality standards are enclosed as Annexure-III.
RS Envirolink Technologies Private Limited had conducted sampling for the
following three seasons:
• Summer : April 2008 • Monsoon : July 2008 • Winter : December 2008
The results of water quality monitoring conducted by RSET Technologies are
given in Table-5.13.
TABLE-5.12 Water quality analysis in the study area
Parameter Unit W1 W2 W3 W4 W5 Monsoon season (August 2007) pH - 7.3 7.2 7.2 7.2 7.2 Temperature oC 7.3 7.5 7.8 7.7 7.7 Dissolved Oxygen (DO) mg/l 8.0 8.2 8.4 8.4 8.2 Electrical Conductivity (EC)
µS/cm 72 75 72 67 62
Total Dissolved Solids (TDS)
mg/l 50 54 51 48 44
Total Suspended solids mg/l <0.1 <0.1 <0.1 <0.1 <0.1 Alkalinity mg/l 6.8 7.2 7.1 8.1 7.1 Hardness mg/l 38 40 40 37 37 Calcium mg/l 8.1 8.8 8.5 8.2 8.0 Magnesium mg/l 4.4 4.0 4.2 3.8 3.9 Fluorides mg/l 0.2 0.2 0.2 0.2 0.2 BOD mg/l 1.1 1.2 1.1 1.2 1.5 COD mg/l 2.4 2.8 2.7 2.7 3.4 Nitrates mg/l 5.2 5.6 5.9 6.1 4.2 Mercury mg/l <0.001 <0.00
1 <0.01 <0.00
1 <0.001
Cadmium mg/l <0.01 <0.01 <0.01 <0.01 <0.01 Total Chromium mg/l <0.01 <0.01 <0.01 <0.01 <0.01 Lead mg/l <0.01 <0.01 <0.01 <0.01 <0.01 Zinc mg/l <0.01 <0.01 <0.01 <0.01 <0.01 Cyanides mg/l <0.01 <0.01 <0.01 <0.01 <0.01 Phenolic compounds mg/l Nil Nil Nil Nil Nil Faecal Coliform MPN/
100 ml Absent Absent Absent Absent Absent
Total Coliform MPN/ Absent Absent Absent Absent Absent
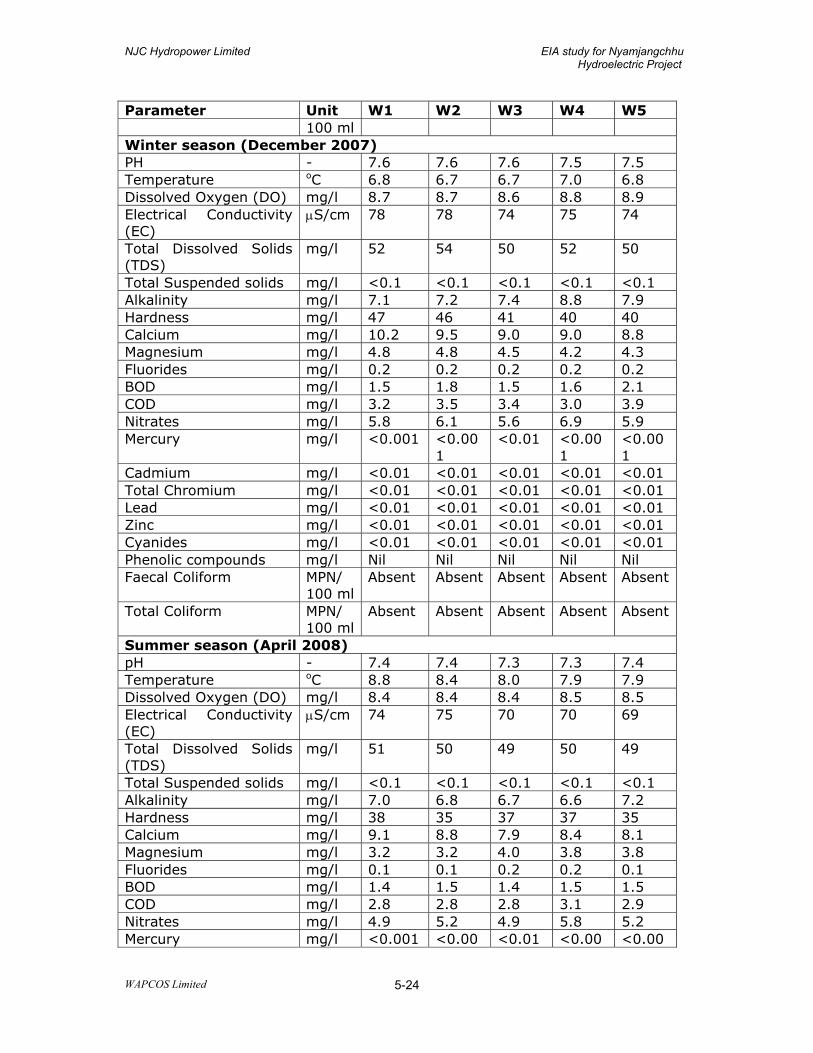
NJC Hydropower Limited EIA study for Nyamjangchhu Hydroelectric Project
WAPCOS Limited
5-24
Parameter Unit W1 W2 W3 W4 W5 100 ml
Winter season (December 2007) PH - 7.6 7.6 7.6 7.5 7.5 Temperature oC 6.8 6.7 6.7 7.0 6.8 Dissolved Oxygen (DO) mg/l 8.7 8.7 8.6 8.8 8.9 Electrical Conductivity (EC)
µS/cm 78 78 74 75 74
Total Dissolved Solids (TDS)
mg/l 52 54 50 52 50
Total Suspended solids mg/l <0.1 <0.1 <0.1 <0.1 <0.1 Alkalinity mg/l 7.1 7.2 7.4 8.8 7.9 Hardness mg/l 47 46 41 40 40 Calcium mg/l 10.2 9.5 9.0 9.0 8.8 Magnesium mg/l 4.8 4.8 4.5 4.2 4.3 Fluorides mg/l 0.2 0.2 0.2 0.2 0.2 BOD mg/l 1.5 1.8 1.5 1.6 2.1 COD mg/l 3.2 3.5 3.4 3.0 3.9 Nitrates mg/l 5.8 6.1 5.6 6.9 5.9 Mercury mg/l <0.001 <0.00
1 <0.01 <0.00
1 <0.001
Cadmium mg/l <0.01 <0.01 <0.01 <0.01 <0.01 Total Chromium mg/l <0.01 <0.01 <0.01 <0.01 <0.01 Lead mg/l <0.01 <0.01 <0.01 <0.01 <0.01 Zinc mg/l <0.01 <0.01 <0.01 <0.01 <0.01 Cyanides mg/l <0.01 <0.01 <0.01 <0.01 <0.01 Phenolic compounds mg/l Nil Nil Nil Nil Nil Faecal Coliform MPN/
100 ml Absent Absent Absent Absent Absent
Total Coliform MPN/ 100 ml
Absent Absent Absent Absent Absent
Summer season (April 2008) pH - 7.4 7.4 7.3 7.3 7.4 Temperature oC 8.8 8.4 8.0 7.9 7.9 Dissolved Oxygen (DO) mg/l 8.4 8.4 8.4 8.5 8.5 Electrical Conductivity (EC)
µS/cm 74 75 70 70 69
Total Dissolved Solids (TDS)
mg/l 51 50 49 50 49
Total Suspended solids mg/l <0.1 <0.1 <0.1 <0.1 <0.1 Alkalinity mg/l 7.0 6.8 6.7 6.6 7.2 Hardness mg/l 38 35 37 37 35 Calcium mg/l 9.1 8.8 7.9 8.4 8.1 Magnesium mg/l 3.2 3.2 4.0 3.8 3.8 Fluorides mg/l 0.1 0.1 0.2 0.2 0.1 BOD mg/l 1.4 1.5 1.4 1.5 1.5 COD mg/l 2.8 2.8 2.8 3.1 2.9 Nitrates mg/l 4.9 5.2 4.9 5.8 5.2 Mercury mg/l <0.001 <0.00 <0.01 <0.00 <0.00
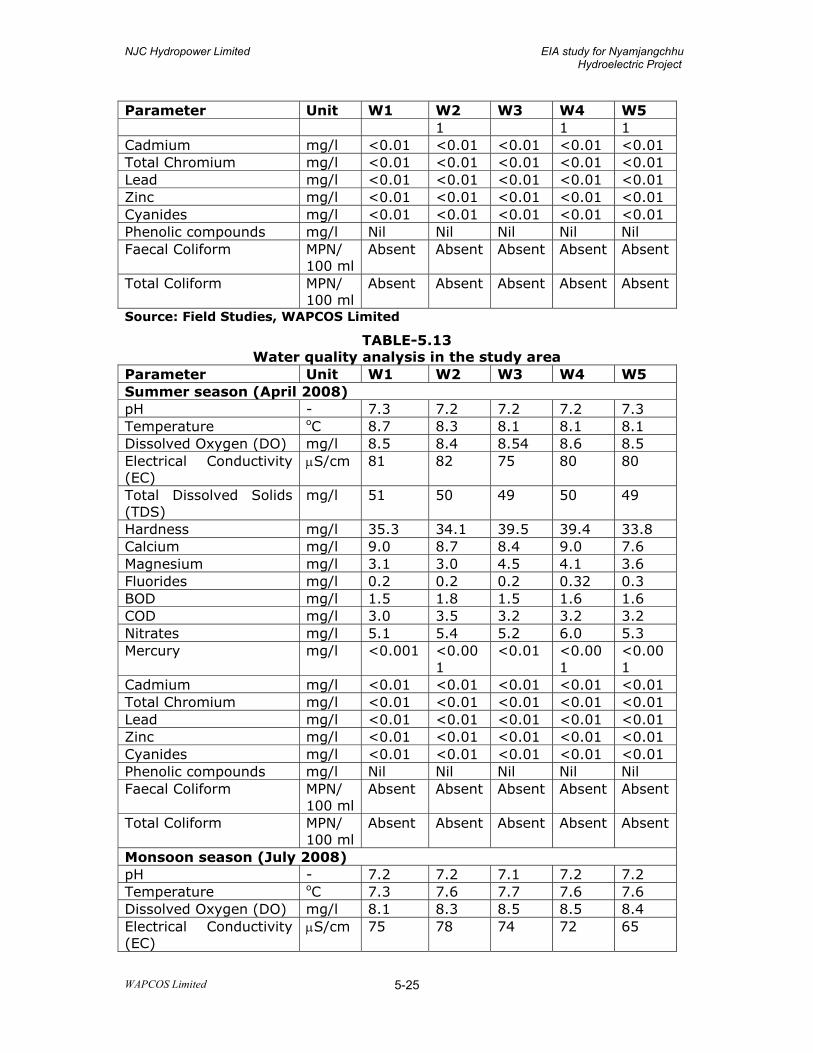
NJC Hydropower Limited EIA study for Nyamjangchhu Hydroelectric Project
WAPCOS Limited
5-25
Parameter Unit W1 W2 W3 W4 W5 1 1 1
Cadmium mg/l <0.01 <0.01 <0.01 <0.01 <0.01 Total Chromium mg/l <0.01 <0.01 <0.01 <0.01 <0.01 Lead mg/l <0.01 <0.01 <0.01 <0.01 <0.01 Zinc mg/l <0.01 <0.01 <0.01 <0.01 <0.01 Cyanides mg/l <0.01 <0.01 <0.01 <0.01 <0.01 Phenolic compounds mg/l Nil Nil Nil Nil Nil Faecal Coliform MPN/
100 ml Absent Absent Absent Absent Absent
Total Coliform MPN/ 100 ml
Absent Absent Absent Absent Absent
Source: Field Studies, WAPCOS Limited
TABLE-5.13 Water quality analysis in the study area
Parameter Unit W1 W2 W3 W4 W5 Summer season (April 2008) pH - 7.3 7.2 7.2 7.2 7.3 Temperature oC 8.7 8.3 8.1 8.1 8.1 Dissolved Oxygen (DO) mg/l 8.5 8.4 8.54 8.6 8.5 Electrical Conductivity (EC)
µS/cm 81 82 75 80 80
Total Dissolved Solids (TDS)
mg/l 51 50 49 50 49
Hardness mg/l 35.3 34.1 39.5 39.4 33.8 Calcium mg/l 9.0 8.7 8.4 9.0 7.6 Magnesium mg/l 3.1 3.0 4.5 4.1 3.6 Fluorides mg/l 0.2 0.2 0.2 0.32 0.3 BOD mg/l 1.5 1.8 1.5 1.6 1.6 COD mg/l 3.0 3.5 3.2 3.2 3.2 Nitrates mg/l 5.1 5.4 5.2 6.0 5.3 Mercury mg/l <0.001 <0.00
1 <0.01 <0.00
1 <0.001
Cadmium mg/l <0.01 <0.01 <0.01 <0.01 <0.01 Total Chromium mg/l <0.01 <0.01 <0.01 <0.01 <0.01 Lead mg/l <0.01 <0.01 <0.01 <0.01 <0.01 Zinc mg/l <0.01 <0.01 <0.01 <0.01 <0.01 Cyanides mg/l <0.01 <0.01 <0.01 <0.01 <0.01 Phenolic compounds mg/l Nil Nil Nil Nil Nil Faecal Coliform MPN/
100 ml Absent Absent Absent Absent Absent
Total Coliform MPN/ 100 ml
Absent Absent Absent Absent Absent
Monsoon season (July 2008) pH - 7.2 7.2 7.1 7.2 7.2 Temperature oC 7.3 7.6 7.7 7.6 7.6 Dissolved Oxygen (DO) mg/l 8.1 8.3 8.5 8.5 8.4 Electrical Conductivity (EC)
µS/cm 75 78 74 72 65
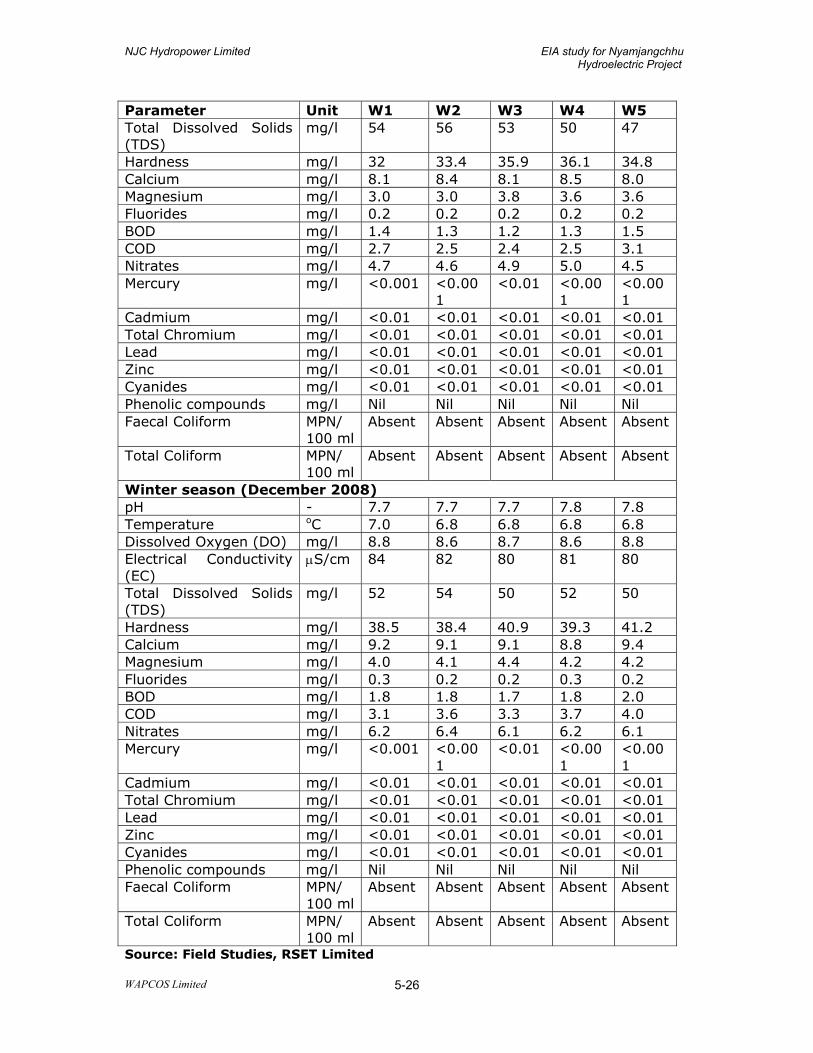
NJC Hydropower Limited EIA study for Nyamjangchhu Hydroelectric Project
WAPCOS Limited
5-26
Parameter Unit W1 W2 W3 W4 W5 Total Dissolved Solids (TDS)
mg/l 54 56 53 50 47
Hardness mg/l 32 33.4 35.9 36.1 34.8 Calcium mg/l 8.1 8.4 8.1 8.5 8.0 Magnesium mg/l 3.0 3.0 3.8 3.6 3.6 Fluorides mg/l 0.2 0.2 0.2 0.2 0.2 BOD mg/l 1.4 1.3 1.2 1.3 1.5 COD mg/l 2.7 2.5 2.4 2.5 3.1 Nitrates mg/l 4.7 4.6 4.9 5.0 4.5 Mercury mg/l <0.001 <0.00
1 <0.01 <0.00
1 <0.001
Cadmium mg/l <0.01 <0.01 <0.01 <0.01 <0.01 Total Chromium mg/l <0.01 <0.01 <0.01 <0.01 <0.01 Lead mg/l <0.01 <0.01 <0.01 <0.01 <0.01 Zinc mg/l <0.01 <0.01 <0.01 <0.01 <0.01 Cyanides mg/l <0.01 <0.01 <0.01 <0.01 <0.01 Phenolic compounds mg/l Nil Nil Nil Nil Nil Faecal Coliform MPN/
100 ml Absent Absent Absent Absent Absent
Total Coliform MPN/ 100 ml
Absent Absent Absent Absent Absent
Winter season (December 2008) pH - 7.7 7.7 7.7 7.8 7.8 Temperature oC 7.0 6.8 6.8 6.8 6.8 Dissolved Oxygen (DO) mg/l 8.8 8.6 8.7 8.6 8.8 Electrical Conductivity (EC)
µS/cm 84 82 80 81 80
Total Dissolved Solids (TDS)
mg/l 52 54 50 52 50
Hardness mg/l 38.5 38.4 40.9 39.3 41.2 Calcium mg/l 9.2 9.1 9.1 8.8 9.4 Magnesium mg/l 4.0 4.1 4.4 4.2 4.2 Fluorides mg/l 0.3 0.2 0.2 0.3 0.2 BOD mg/l 1.8 1.8 1.7 1.8 2.0 COD mg/l 3.1 3.6 3.3 3.7 4.0 Nitrates mg/l 6.2 6.4 6.1 6.2 6.1 Mercury mg/l <0.001 <0.00
1 <0.01 <0.00
1 <0.001
Cadmium mg/l <0.01 <0.01 <0.01 <0.01 <0.01 Total Chromium mg/l <0.01 <0.01 <0.01 <0.01 <0.01 Lead mg/l <0.01 <0.01 <0.01 <0.01 <0.01 Zinc mg/l <0.01 <0.01 <0.01 <0.01 <0.01 Cyanides mg/l <0.01 <0.01 <0.01 <0.01 <0.01 Phenolic compounds mg/l Nil Nil Nil Nil Nil Faecal Coliform MPN/
100 ml Absent Absent Absent Absent Absent
Total Coliform MPN/ 100 ml
Absent Absent Absent Absent Absent
Source: Field Studies, RSET Limited
NJC Hydropower Limited EIA study for Nyamjangchhu Hydroelectric Project
WAPCOS Limited
5-27
The total hardness in various water samples ranged from 32-40 mg/l, 40-47
mg/l and 34.1-39.5 mg/l in post-monsoon, winter and summer seasons
respectively. The low calcium and magnesium levels are responsible for soft
nature of water. The carbonate hardness (for water with alkalinity level as
observed in the study area) is equal to the alkalinity level. The non-carbonate
hardness accounts for the balance hardness. Normally non-carbonate hardness
can be removed by boiling. However, hardness level in the area do not warrant
any treatment.
The low EC and TDS values indicate the lower concentration of cations and
anions. This is also reflected by the fact that the concentration of most of the
cations and anions are well within the permissible limit. The fluorides level was
lower than the permissible limit (1 mg/l) for drinking purposes.
The BOD and COD values are well within the permissible limits, which indicates
the absence of organic pollution loading. This is mainly due to the low population
density and absence of industries in the area. The marginal quantity of pollution
load which enters river Nyamhjangchhu gets diluted. In fact, even for the
minimum flow, there is more than adequate water available for dilution.
The Total Coliform and Fecal coliform are also low. Thus, It can be concluded
that, water quality was observed to be quite good. The concentration of various
heavy metals was below the permissible limit specified for domestic use.
It can be concluded that water quality was observed to be quite good, as various
parameters are well below the permissible limit specified for meeting domestic
requirements.
5.9 AMBIENT AIR QUALITY
The ambient air quality with respect to the study area around the proposed site
forms the baseline information. The study area represents rural environment.
The sources of air pollution in the region are vehicular traffic, dust arising from
unpaved village roads and domestic fuel burning. The prime objective of the
baseline air quality study was to establish the existing ambient air quality of the
area. This section describes the identification of sampling locations, methodology
adopted for monitoring, frequency of sampling.
NJC Hydropower Limited EIA study for Nyamjangchhu Hydroelectric Project
WAPCOS Limited
5-28
Selection of Sampling Locations
The baseline status of the ambient air quality has been established through a
scientifically designed ambient air quality monitoring network and is based on
the following considerations:
- Meteorological conditions on synoptic scale; - Representatives of regional background air quality for obtaining baseline
status - Representation of likely affected area.
Three Ambient Air Quality Monitoring (AAQM) locations were selected taking care
of above-mentioned points. The location of Ambient Air Quality Monitoring
station is shown in Figure-5.7.
Frequency and Parameters for Sampling
Ambient air quality monitoring has been carried out with a frequency of two
samples per week at three locations for three seasons. The monitoring was
conducted by WAPCOS for the following seasons:
• Post-Monsoon : October 2007 • Winter : December 2007 – January 2008 • Summer : April – May 2008
RS Envirolink Technologies Private Limited had conducted sampling for the
following three seasons:
• Summer : April – May 2008 • Monsoon : July – August 2008 • Winter : November – December 2008
The baseline data of ambient air environment has been generated for the
mentioned parameters as given below:
• Respirable Particulate Matter (RSPM) • Sulphur dioxide (SO2) • Oxides of Nitrogen (NO2).
Result of Ambient Air Quality Monitoring
The result of ambient air quality monitoring conducted by WAPCOS Limited for
various seasons are given in Tables-5.14 to 5.16. The ambient air quality
standards are given in Annexure-IV.

NJC Hydropower Limited EIA study for Nyamjangchhu Hydroelectric Project
WAPCOS Limited
5-29
TABLE-5.14 Results of ambient air quality monitoring in the study area
(Post- Monsoon season) (Unit: µg/m3)
Station
RPM SO2 NOx
Zemithang
31 BDL 9.1 28 BDL 13.8 22 BDL 6.3 25 BDL 11.6 22 BDL 8.9 31 BDL 8.3 31 BDL 8.9 38 BDL 7.6
Ghorsham
32 BDL 13.5 24 BDL 14.5 30 BDL 16.7 26 BDL 8.5 31 BDL 6.3 21 BDL 15.4 25 BDL 8.5 29 BDL 13.8
Lumla
31 BDL 7.5 29 BDL 6.8 22 BDL 9.0 29 BDL 9.6 31 BDL 8.3 24 BDL 6.2 24 BDL 8.4 31 BDL 9.5
Namstring
30 BDL 6.8 25 BDL 6.5 20 BDL 7.8 21 BDL 6.4 25 BDL 7.1 23 BDL 6.5 25 BDL 6.6 24 BDL 7.2
BDL: Below Detectable Limit(6µg/m3) Source: Field Studies, WAPCOS Limited

NJC Hydropower Limited EIA study for Nyamjangchhu Hydroelectric Project
WAPCOS Limited
5-30
TABLE-5.15 Results of ambient air quality monitoring in the study area
(Winter season)(Unit: µg/m3)
Station
RPM SO2 NOx
Zemithang
25 BDL 8.7 29 BDL 11.6 30 BDL 11.4 33 BDL 13.2 23 BDL 13.0 30 BDL 11.8 36 BDL 9.9 28 BDL 10.6
Ghorsham
25 BDL 12.4 38 BDL 13.1 31 BDL 8.9 28 BDL 10.2 32 BDL 12.6 25 BDL 13.2 30 BDL 11.6 36 BDL 12.1
Lumla
29 BDL 8.4 32 BDL 8.9 37 BDL 11.7 34 BDL 9.8 31 BDL 10.3 26 BDL 10.2 34 BDL 8.9 30 BDL 10.4
Namstring
30 BDL 8.9 30 BDL 7.5 25 BDL 6.8 25 BDL 6.9 22 BDL 7.4 22 BDL 7.0 24 BDL 6.5 28 BDL 7.1
BDL: Below Detectable Limit(6µg/m3) Source: Field Studies, WAPCOS Limited
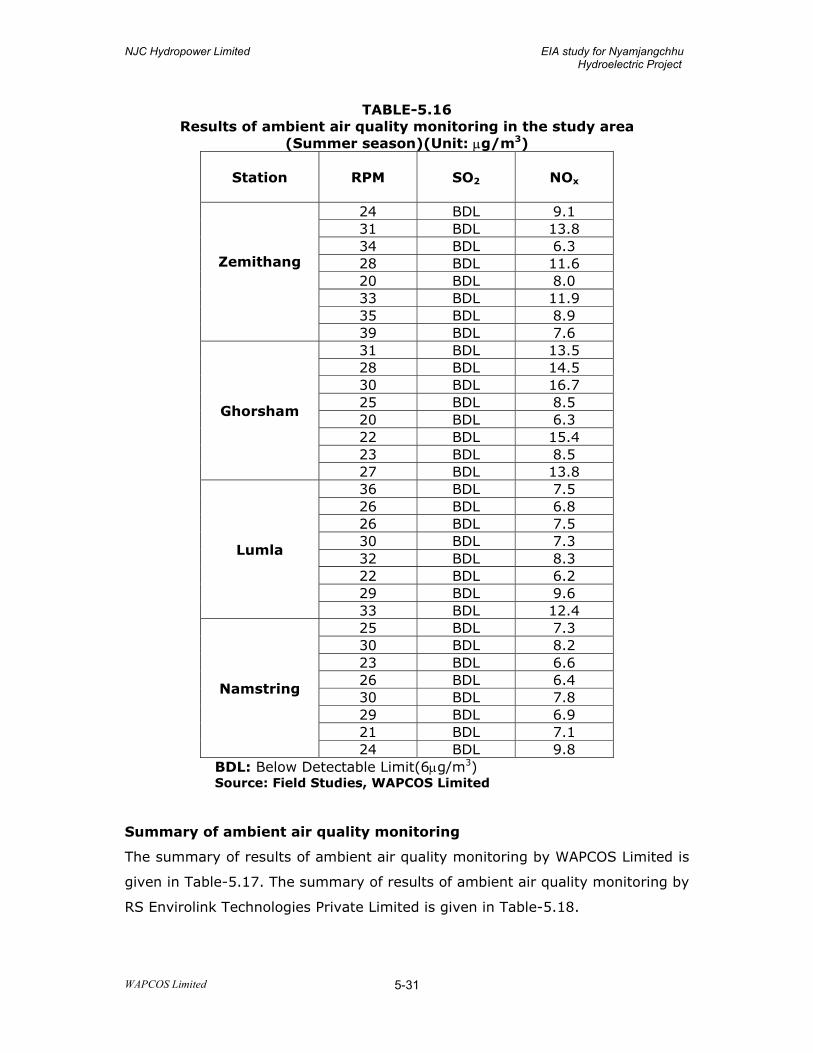
NJC Hydropower Limited EIA study for Nyamjangchhu Hydroelectric Project
WAPCOS Limited
5-31
TABLE-5.16 Results of ambient air quality monitoring in the study area
(Summer season)(Unit: µg/m3)
Station
RPM SO2 NOx
Zemithang
24 BDL 9.1 31 BDL 13.8 34 BDL 6.3 28 BDL 11.6 20 BDL 8.0 33 BDL 11.9 35 BDL 8.9 39 BDL 7.6
Ghorsham
31 BDL 13.5 28 BDL 14.5 30 BDL 16.7 25 BDL 8.5 20 BDL 6.3 22 BDL 15.4 23 BDL 8.5 27 BDL 13.8
Lumla
36 BDL 7.5 26 BDL 6.8 26 BDL 7.5 30 BDL 7.3 32 BDL 8.3 22 BDL 6.2 29 BDL 9.6 33 BDL 12.4
Namstring
25 BDL 7.3 30 BDL 8.2 23 BDL 6.6 26 BDL 6.4 30 BDL 7.8 29 BDL 6.9 21 BDL 7.1 24 BDL 9.8
BDL: Below Detectable Limit(6µg/m3) Source: Field Studies, WAPCOS Limited
Summary of ambient air quality monitoring
The summary of results of ambient air quality monitoring by WAPCOS Limited is
given in Table-5.17. The summary of results of ambient air quality monitoring by
RS Envirolink Technologies Private Limited is given in Table-5.18.
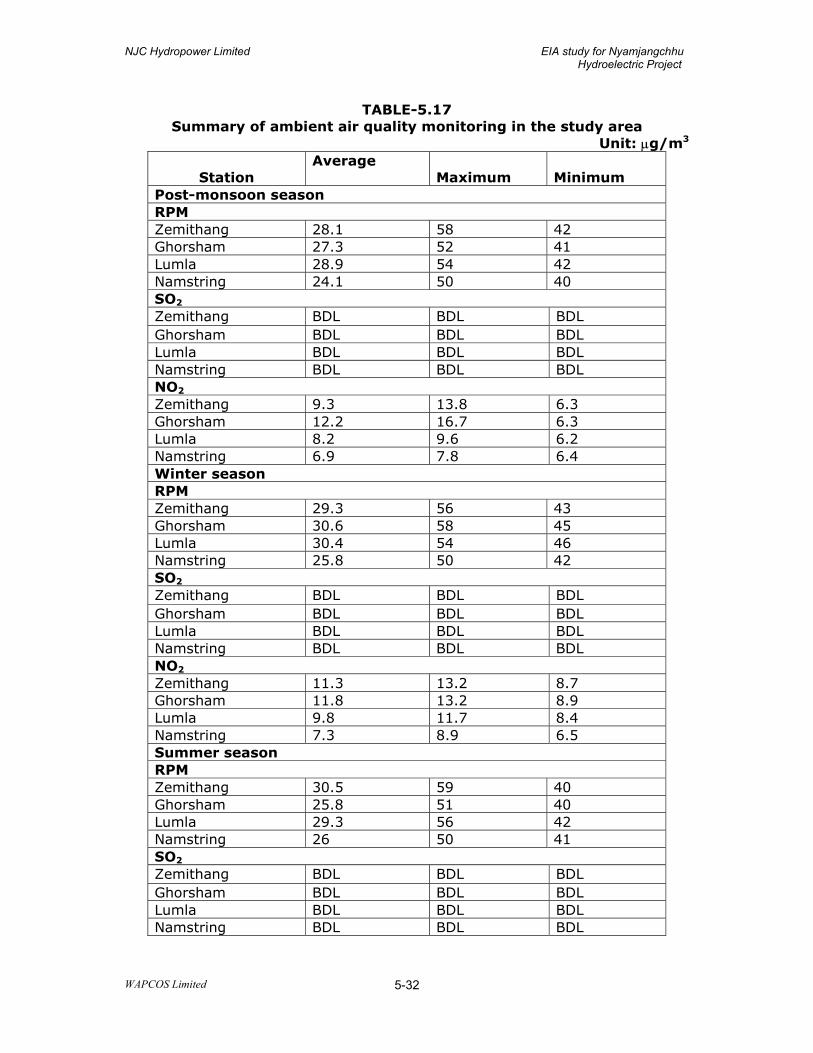
NJC Hydropower Limited EIA study for Nyamjangchhu Hydroelectric Project
WAPCOS Limited
5-32
TABLE-5.17 Summary of ambient air quality monitoring in the study area
Unit: µg/m3
Station Average
Maximum Minimum
Post-monsoon season RPM Zemithang 28.1 58 42 Ghorsham 27.3 52 41 Lumla 28.9 54 42 Namstring 24.1 50 40 SO2 Zemithang BDL BDL BDL Ghorsham BDL BDL BDL Lumla BDL BDL BDL Namstring BDL BDL BDL NO2 Zemithang 9.3 13.8 6.3 Ghorsham 12.2 16.7 6.3 Lumla 8.2 9.6 6.2 Namstring 6.9 7.8 6.4 Winter season RPM Zemithang 29.3 56 43 Ghorsham 30.6 58 45 Lumla 30.4 54 46 Namstring 25.8 50 42 SO2 Zemithang BDL BDL BDL Ghorsham BDL BDL BDL Lumla BDL BDL BDL Namstring BDL BDL BDL NO2 Zemithang 11.3 13.2 8.7 Ghorsham 11.8 13.2 8.9 Lumla 9.8 11.7 8.4 Namstring 7.3 8.9 6.5 Summer season RPM Zemithang 30.5 59 40 Ghorsham 25.8 51 40 Lumla 29.3 56 42 Namstring 26 50 41 SO2 Zemithang BDL BDL BDL Ghorsham BDL BDL BDL Lumla BDL BDL BDL Namstring BDL BDL BDL
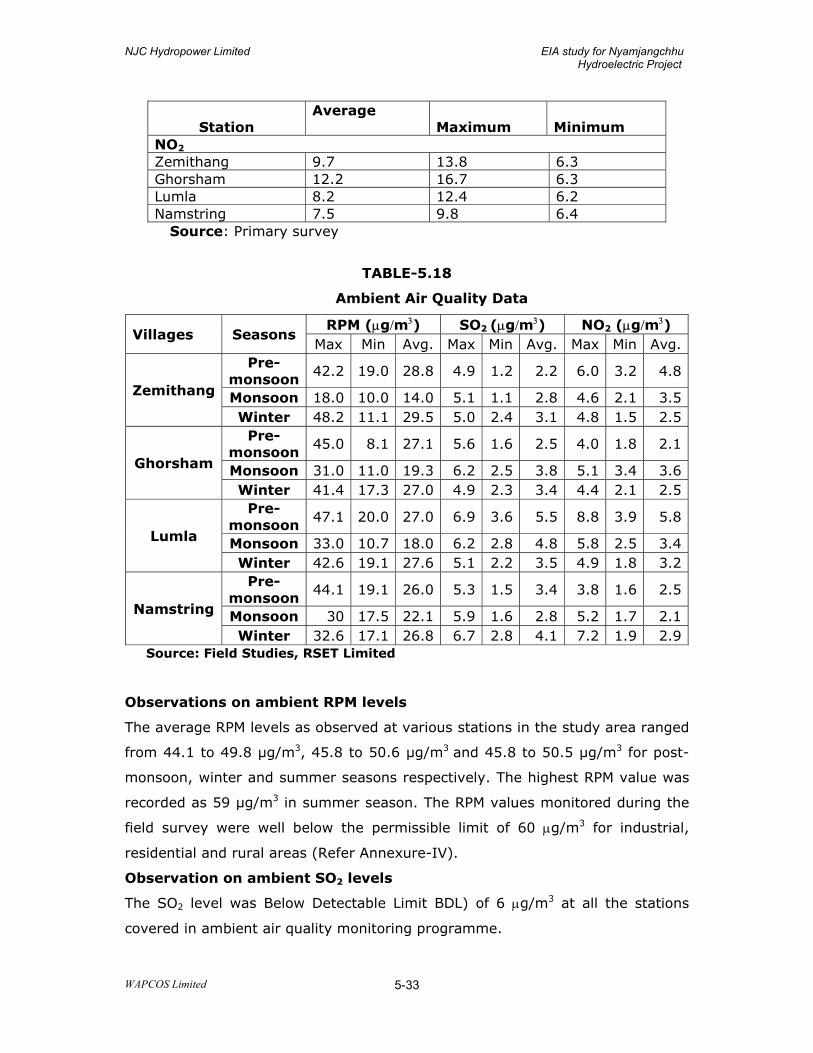
NJC Hydropower Limited EIA study for Nyamjangchhu Hydroelectric Project
WAPCOS Limited
5-33
Station
Average Maximum
Minimum
NO2 Zemithang 9.7 13.8 6.3 Ghorsham 12.2 16.7 6.3 Lumla 8.2 12.4 6.2 Namstring 7.5 9.8 6.4
Source: Primary survey
TABLE-5.18
Ambient Air Quality Data
Villages Seasons RPM (µg/m3) SO2 (µg/m3) NO2 (µg/m3)
Max Min Avg. Max Min Avg. Max Min Avg.
Zemithang
Pre-monsoon
42.2 19.0 28.8 4.9 1.2 2.2 6.0 3.2 4.8
Monsoon 18.0 10.0 14.0 5.1 1.1 2.8 4.6 2.1 3.5 Winter 48.2 11.1 29.5 5.0 2.4 3.1 4.8 1.5 2.5
Ghorsham
Pre-monsoon
45.0 8.1 27.1 5.6 1.6 2.5 4.0 1.8 2.1
Monsoon 31.0 11.0 19.3 6.2 2.5 3.8 5.1 3.4 3.6 Winter 41.4 17.3 27.0 4.9 2.3 3.4 4.4 2.1 2.5
Lumla
Pre-monsoon 47.1 20.0 27.0 6.9 3.6 5.5 8.8 3.9 5.8
Monsoon 33.0 10.7 18.0 6.2 2.8 4.8 5.8 2.5 3.4 Winter 42.6 19.1 27.6 5.1 2.2 3.5 4.9 1.8 3.2
Namstring
Pre-monsoon
44.1 19.1 26.0 5.3 1.5 3.4 3.8 1.6 2.5
Monsoon 30 17.5 22.1 5.9 1.6 2.8 5.2 1.7 2.1 Winter 32.6 17.1 26.8 6.7 2.8 4.1 7.2 1.9 2.9
Source: Field Studies, RSET Limited
Observations on ambient RPM levels
The average RPM levels as observed at various stations in the study area ranged
from 44.1 to 49.8 µg/m3, 45.8 to 50.6 µg/m3 and 45.8 to 50.5 µg/m3 for post-
monsoon, winter and summer seasons respectively. The highest RPM value was
recorded as 59 µg/m3 in summer season. The RPM values monitored during the
field survey were well below the permissible limit of 60 µg/m3 for industrial,
residential and rural areas (Refer Annexure-IV).
Observation on ambient SO2 levels
The SO2 level was Below Detectable Limit BDL) of 6 µg/m3 at all the stations
covered in ambient air quality monitoring programme.
NJC Hydropower Limited EIA study for Nyamjangchhu Hydroelectric Project
WAPCOS Limited
5-34
Observations on NO2 levels
The highest average NOx values of 12.2 µg/m3 were observed in the summer
and post-monsoon seasons respectively. The highest value observed was 16.7
µg/m3. The NO2 level observed at various sampling stations was much lower
than the permissible limit of 40 µg/m3 for industrial, residential and rural areas
are given in Annexure-IV.
Conclusions
Based on the findings of the ambient air quality survey, conducted for the
summer, post-monsoon and winter seasons, it can be concluded that the
ambient air quality is quite good in the area. The values of these parameters
were well below the permissible limits specified for residential, rural and other
areas. The absence of industries, low vehicular traffic and low population density
can be attributed for good ambient air quality in the project area.
5.10 NOISE ENVIRONMENT
Baseline noise data has been measured using a weighted sound pressure level
meter. The survey was carried out in calm surrounding. Sound Pressure Level
(SPL) measurement in the outside environment was made using sound pressure
level meter. Hourly noise meter readings were taken at different sites.
The monitoring was conducted by WAPCOS for the following seasons:
• Post-Monsoon : October 2007 • Winter : December 2007 – January 2008 • Summer : April – May 2008
The hourly ambient noise levels monitored for summer, post-monsoon and
winter seasons are given in Tables-5.19 to 5.21 respectively. The day time
equivalent noise levels estimated are given in Table-5.22.
RS Envirolink Technologies Private Limited had conducted sampling for the
following three seasons:
• Summer : April – May 2008 • Monsoon : July – August 2008 • Winter : November – December 2008
.
The location of various noise monitoring stations is shown in Figure-5.6. The
noise levels were monitored continuously from 6 AM to 9 PM at each location
and hourly equivalent noise level was measured. Sound Pressure Level (SPL)

NJC Hydropower Limited EIA study for Nyamjangchhu Hydroelectric Project
WAPCOS Limited
5-35
measurement in the ambient environment was made using sound pressure level
meter. The noise standards for various categories is given in Annexure-V.
TABLE-5.19 Hourly equivalent noise levels in the study area in Post-monsoon season
(Unit: dB(A)) Time Barrage
site Zimithang Ghorsam Lumla Namstring
6 -7 AM 32 33 32 32 32 7 -8 AM 33 33 33 33 33 8 -9 AM 34 35 37 37 35 9-10 AM 34 35 37 38 36 10-11 AM 40 42 40 42 39 11 AM - 12 Noon
40 40 44 42 40
12 Noon–1 PM
40 40 41 41 41
1 –2 PM 40 42 40 41 41 2 – 3 PM 41 42 40 40 42 3 – 4 PM 41 42 42 42 42 4 – 5 PM 43 42 42 42 40 5 – 6 PM 44 43 41 42 38 6 – 7 PM 38 40 39 40 37 7 – 8 PM 36 36 37 35 35 8 – 9PM 36 36 36 35 34 Source: Field Studies, WAPCOS Limited
TABLE-5.20 Hourly equivalent noise levels in the study area (Winter season )
(Unit: dB(A)) Time Barrage
site Zimithang Ghorsam Lumla Namstring
6 -7 AM 32 32 32 33 32 7 -8 AM 32 33 33 33 33 8 -9 AM 34 34 35 36 34 9-10 AM 34 34 36 37 35 10-11 AM 38 38 38 40 38 11 AM - 12 Noon
39 39 40 41 39
12 Noon–1 PM
40 40 42 42 40
1 –2 PM 41 41 44 42 42 2 – 3 PM 41 41 44 41 42 3 – 4 PM 42 42 43 41 41 4 – 5 PM 44 43 42 40 41 5 – 6 PM 42 42 41 39 39 6 – 7 PM 40 39 40 39 38 7 – 8 PM 38 38 38 38 36 8 – 9PM 38 36 35 35 35 Source: Field Studies, WAPCOS Limited
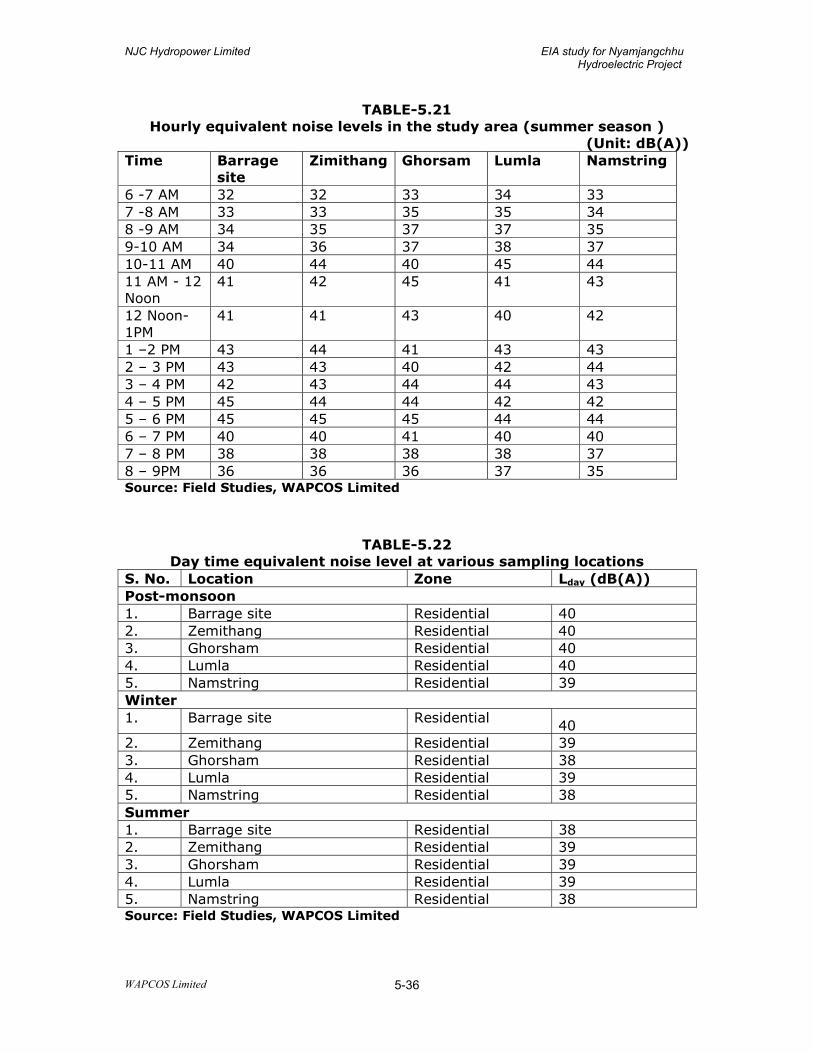
NJC Hydropower Limited EIA study for Nyamjangchhu Hydroelectric Project
WAPCOS Limited
5-36
TABLE-5.21 Hourly equivalent noise levels in the study area (summer season )
(Unit: dB(A)) Time Barrage
site Zimithang Ghorsam Lumla Namstring
6 -7 AM 32 32 33 34 33 7 -8 AM 33 33 35 35 34 8 -9 AM 34 35 37 37 35 9-10 AM 34 36 37 38 37 10-11 AM 40 44 40 45 44 11 AM - 12 Noon
41 42 45 41 43
12 Noon-1PM
41 41 43 40 42
1 –2 PM 43 44 41 43 43 2 – 3 PM 43 43 40 42 44 3 – 4 PM 42 43 44 44 43 4 – 5 PM 45 44 44 42 42 5 – 6 PM 45 45 45 44 44 6 – 7 PM 40 40 41 40 40 7 – 8 PM 38 38 38 38 37 8 – 9PM 36 36 36 37 35 Source: Field Studies, WAPCOS Limited
TABLE-5.22 Day time equivalent noise level at various sampling locations
S. No. Location Zone Lday (dB(A)) Post-monsoon 1. Barrage site Residential 40 2. Zemithang Residential 40 3. Ghorsham Residential 40 4. Lumla Residential 40 5. Namstring Residential 39 Winter 1. Barrage site Residential 40 2. Zemithang Residential 39 3. Ghorsham Residential 38 4. Lumla Residential 39 5. Namstring Residential 38 Summer 1. Barrage site Residential 38 2. Zemithang Residential 39 3. Ghorsham Residential 39 4. Lumla Residential 39 5. Namstring Residential 38 Source: Field Studies, WAPCOS Limited
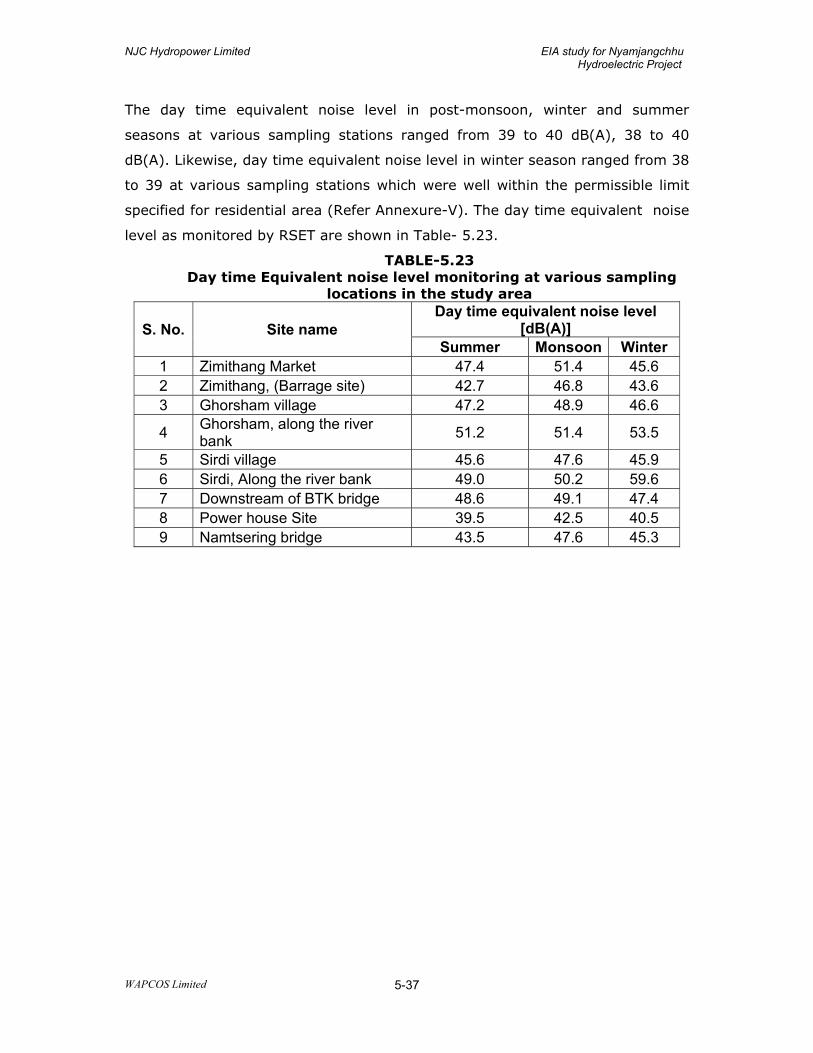
NJC Hydropower Limited EIA study for Nyamjangchhu Hydroelectric Project
WAPCOS Limited
5-37
The day time equivalent noise level in post-monsoon, winter and summer
seasons at various sampling stations ranged from 39 to 40 dB(A), 38 to 40
dB(A). Likewise, day time equivalent noise level in winter season ranged from 38
to 39 at various sampling stations which were well within the permissible limit
specified for residential area (Refer Annexure-V). The day time equivalent noise
level as monitored by RSET are shown in Table- 5.23.
TABLE-5.23 Day time Equivalent noise level monitoring at various sampling
locations in the study area
S. No. Site name Day time equivalent noise level
[dB(A)] Summer Monsoon Winter
1 Zimithang Market 47.4 51.4 45.6 2 Zimithang, (Barrage site) 42.7 46.8 43.6 3 Ghorsham village 47.2 48.9 46.6
4 Ghorsham, along the river bank 51.2 51.4 53.5
5 Sirdi village 45.6 47.6 45.9 6 Sirdi, Along the river bank 49.0 50.2 59.6 7 Downstream of BTK bridge 48.6 49.1 47.4 8 Power house Site 39.5 42.5 40.5 9 Namtsering bridge 43.5 47.6 45.3
NJC Hydropower Limited EIA study for Nyamjangchhu Hydroelectric Project
WAPCOS Limited 6-1
CHAPTER-6
BASELINE SETTING FOR ECOLOGICAL ASPECTS
6.1 GENERAL
The baseline status has been divided into following three categories:
• Physico-chemical aspects • Ecological aspects • Socio-Economic aspects.
The baseline setting for ecological aspects are outlined in the present Chapter.
The study area represents diverse biological assemblages unique in structure,
composition, and spatial pattern. These have been under a long influence of local
communities. The following section highlights floral and faunal diversity, based
on a review of available information and followed by primary data collection.
6.2 TERRESTRIAL ECOLOGY
6.2.1 Forest type
The forest type observed in the Study Area are breifly described in the following
paragraphs.
Champion and Seth (1968); Rao and Panigrahi (1961); Sahni (1981); Rao and
Hajra (1986), etc are the prominent workers who studied forest and vegetation
of the region. The forest types observed in the study area are as follows which is
based on altitudinal and climatic factors.
Sub- Tropical Forest
These forests occur between 1200m and 1800m. The dominant species are Pinus
wallichiana, Alnus nepalensis, Betula alnoides, etc. These type of forest mainly
found near the Brokan Thang village on the left bank of the river in the
catchment area.
Temperate Forest
These forests occur in the form continuous belt between 1800m and 3500 m
altitudes. The forest is comparatively open and is further divided into temperate
broad leaved and temperate conifer forests.
Temperate Broad Leaved Forest
Temperate broad leaved forest occur between 1800m and 2800 m altitudes.
Tresses like Alnus nepalensis, Rhododendron arboreum, Lyonia ovalifolia,
Mallotus philippensis, etc. are dominant. Climbers are rare where as various
epiphytic species of Agapetes sp., Rhododendron sp., Vaccinium sp. are common
with several lichens and ferns.
NJC Hydropower Limited EIA study for Nyamjangchhu Hydroelectric Project
WAPCOS Limited 6-2
Temperate Conifer Forest
These forests are confined to 2800- 3500 m altitude and experience regular
snowfall during winter. The top canopy is dominated by mixed coniferous type
that includes Abies pindrow, Pinus wallichiana, etc with some broad leaved
species of Rhododendron arboreum, Lyonia ovalifolia, Engelhardtia spicata,
Juglans regia, etc. This type of forest is observed on the right bank of the river
near Ghorsham village and in the catchment area.
Subalpine and Alpine Forest
These forests occur at high altitudes i.e. 3500m - 5500 m and generally lack tree
species and mostly observed in the catchment area and on the top of the hills.
Subalpine forest is characterized by tree species like Abies pindrow,
Rhododendron sp. The common shrubs are Berberis angulosa, Gaultheria
nummularis, Rubus sp., Primula macrophylla, etc and with some herbaceous
species Arenaria sp., Inula cuspidata, Sedum sp., Trigonella corniculata, etc.
The alpine zone is above the altitude of 4000 m and remains mostly covered
with snow for the major part of the year. The vegetation is very scarce and
comprise of shruby Rhododendron sp., and herbs like Aconitum sp., Arenaria
sp., Ranunculus sp., Primula sikkimensis, Polygonum capitatum, Rumex
nepalensis, etc are common.
Secondary Forests
The secondary forests are found along the banks of the rivers where primary
forests have been cleared in the past for timber and nearby the villages. The
secondary forests are dominated by trees belonging to species Macaranga
denticulata, Alnus nepalensis, Lyonia ovalifolia, Morus alba, Ficus semicordata
and Schima khasiana. At many places vegetation is very sparse and shows rock
outcrops that are devoid of any plant species.
Grasslands
The grasslands are common near the Nyamstring area on both the banks of the
river. Lemon grass (Cymbopogon flexuosus) is dominant in this area with some
trees like Ficus semicordata, Toona ciliata, Salix karelinii, etc. Emblica officinalis
and Woodfordia fruticosa are frequent on both the banks of river.
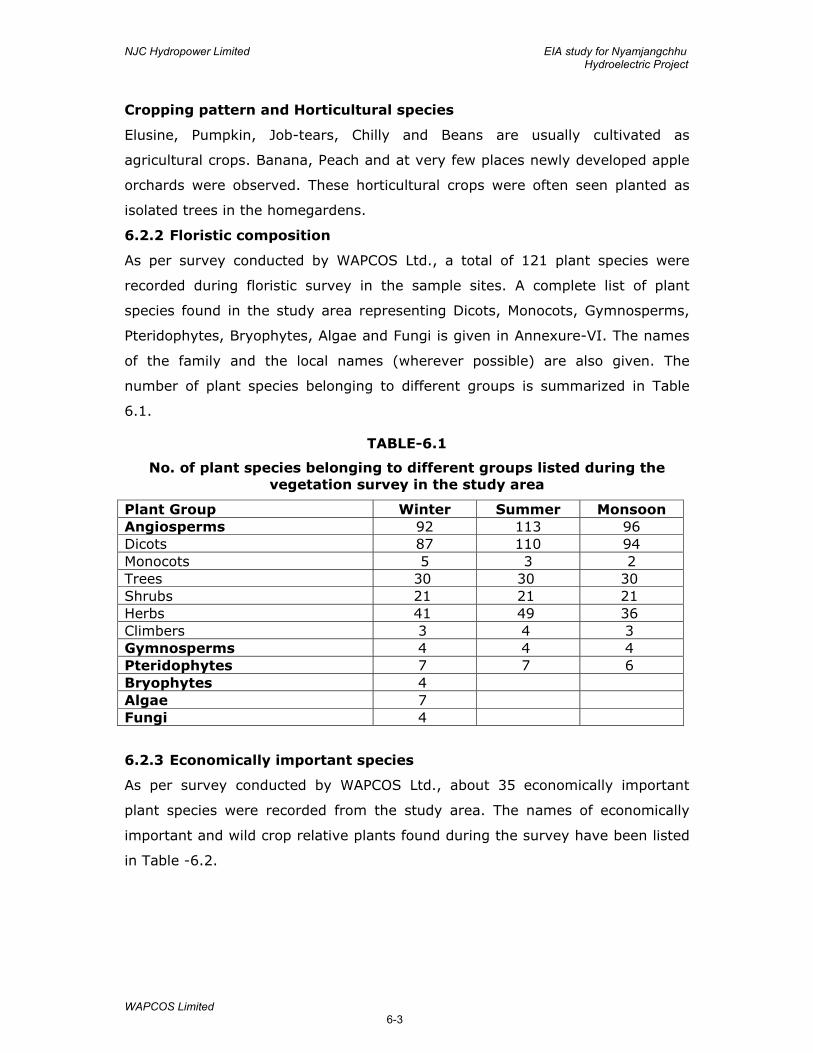
NJC Hydropower Limited EIA study for Nyamjangchhu Hydroelectric Project
WAPCOS Limited 6-3
Cropping pattern and Horticultural species
Elusine, Pumpkin, Job-tears, Chilly and Beans are usually cultivated as
agricultural crops. Banana, Peach and at very few places newly developed apple
orchards were observed. These horticultural crops were often seen planted as
isolated trees in the homegardens.
6.2.2 Floristic composition
As per survey conducted by WAPCOS Ltd., a total of 121 plant species were
recorded during floristic survey in the sample sites. A complete list of plant
species found in the study area representing Dicots, Monocots, Gymnosperms,
Pteridophytes, Bryophytes, Algae and Fungi is given in Annexure-VI. The names
of the family and the local names (wherever possible) are also given. The
number of plant species belonging to different groups is summarized in Table
6.1.
TABLE-6.1
No. of plant species belonging to different groups listed during the vegetation survey in the study area
Plant Group Winter Summer Monsoon Angiosperms 92 113 96 Dicots 87 110 94 Monocots 5 3 2 Trees 30 30 30 Shrubs 21 21 21 Herbs 41 49 36 Climbers 3 4 3 Gymnosperms 4 4 4 Pteridophytes 7 7 6 Bryophytes 4 Algae 7 Fungi 4
6.2.3 Economically important species
As per survey conducted by WAPCOS Ltd., about 35 economically important
plant species were recorded from the study area. The names of economically
important and wild crop relative plants found during the survey have been listed
in Table -6.2.

NJC Hydropower Limited EIA study for Nyamjangchhu Hydroelectric Project
WAPCOS Limited 6-4
TABLE-6.2 Economically important and wild crop relative plant species
found in the study area S.No. Species Uses
2 Alnus nepalensis Fuel wood, timber 3 Artemisia nilagirica Medicine 1 Betula alnoides Timber 4 Bidens pilosa Edible 6 Cannabis sativa Medicinal 5 Centella asiatica Medicinal 7 Cryptomeria japonica Timber 8 Cupressus torulosa Ethnobotanical importance, Timber 11 Elaeagnus sp. Medicinal 10 Engelhardtia spicata Fuel wood 9 Erythrina arborescens Fencing 13 Fagopyrum dibotrys Vegetables, fodder 14 Ficus roxburghii Fodder 15 Fragaria indica Fruit edible 16 Gerardinia heterophylla Edible 17 Houttuynia cordata Medicinal 18 Juglans regia Timber 19 Lycopodium clavatum Medicinal 20 Lyonia ovalifolia Medicinal and fuel wood 21 Macaranga denticulate Fuel 22 Morus serrata Fodder 26 Pinus wallichiana Timber, fuel and for light 27 Plantago major Medicinal 12 Populus gamblei Avenue tree 28 Quercus griffithii Timber 23 Rhododendron
campanulatum Fuel wood, ornamental 24 Rhododendron maddeni Fuel wood, ornamental 25 Rhododendron nerifolium Fuel wood, ornamental 29 Rubia cordifolia Dye 30 Rubus ellipticus Fruit edible 31 Rumex nepalensis Medicinal 32 Schima khasiana Timber 33 Solanum viarum Medicinal 34 Urtica dioca Edible 35 Zanthoxylum armatum Medicinal
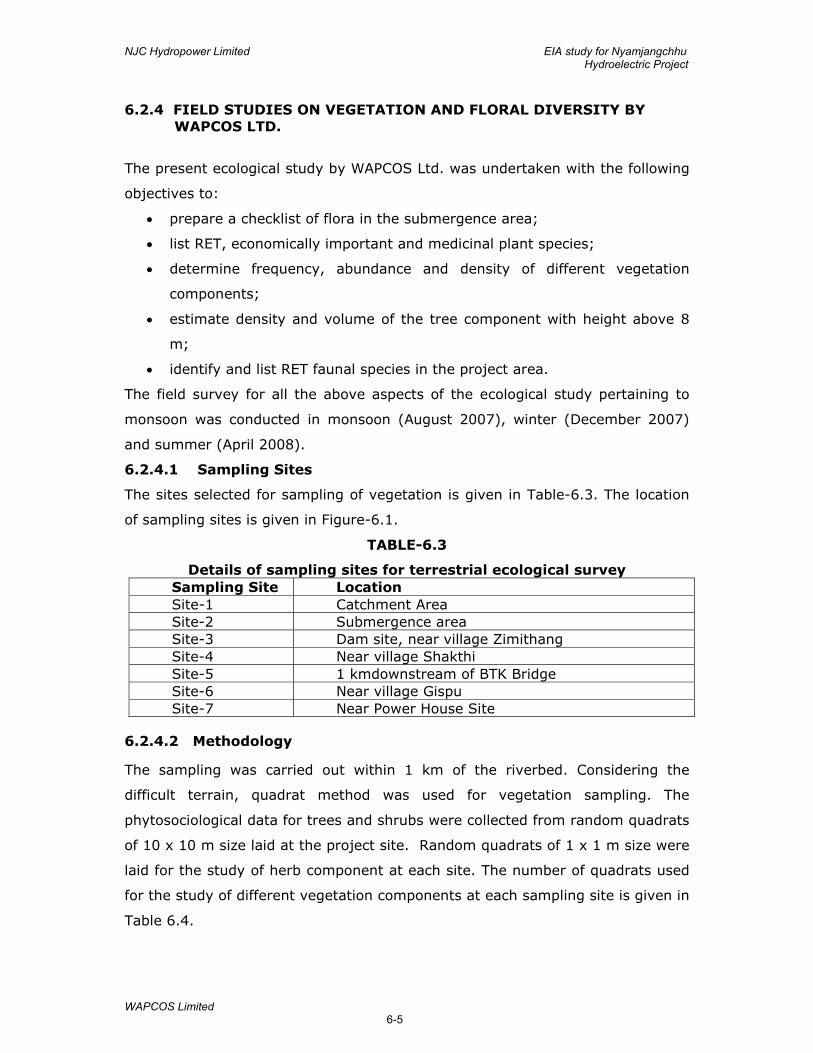
NJC Hydropower Limited EIA study for Nyamjangchhu Hydroelectric Project
WAPCOS Limited 6-5
6.2.4 FIELD STUDIES ON VEGETATION AND FLORAL DIVERSITY BY WAPCOS LTD.
The present ecological study by WAPCOS Ltd. was undertaken with the following
objectives to:
• prepare a checklist of flora in the submergence area;
• list RET, economically important and medicinal plant species;
• determine frequency, abundance and density of different vegetation
components;
• estimate density and volume of the tree component with height above 8
m;
• identify and list RET faunal species in the project area.
The field survey for all the above aspects of the ecological study pertaining to
monsoon was conducted in monsoon (August 2007), winter (December 2007)
and summer (April 2008).
6.2.4.1 Sampling Sites
The sites selected for sampling of vegetation is given in Table-6.3. The location
of sampling sites is given in Figure-6.1.
TABLE-6.3
Details of sampling sites for terrestrial ecological survey Sampling Site Location Site-1 Catchment Area Site-2 Submergence area Site-3 Dam site, near village Zimithang Site-4 Near village Shakthi Site-5 1 kmdownstream of BTK Bridge Site-6 Near village Gispu Site-7 Near Power House Site
6.2.4.2 Methodology
The sampling was carried out within 1 km of the riverbed. Considering the
difficult terrain, quadrat method was used for vegetation sampling. The
phytosociological data for trees and shrubs were collected from random quadrats
of 10 x 10 m size laid at the project site. Random quadrats of 1 x 1 m size were
laid for the study of herb component at each site. The number of quadrats used
for the study of different vegetation components at each sampling site is given in
Table 6.4.
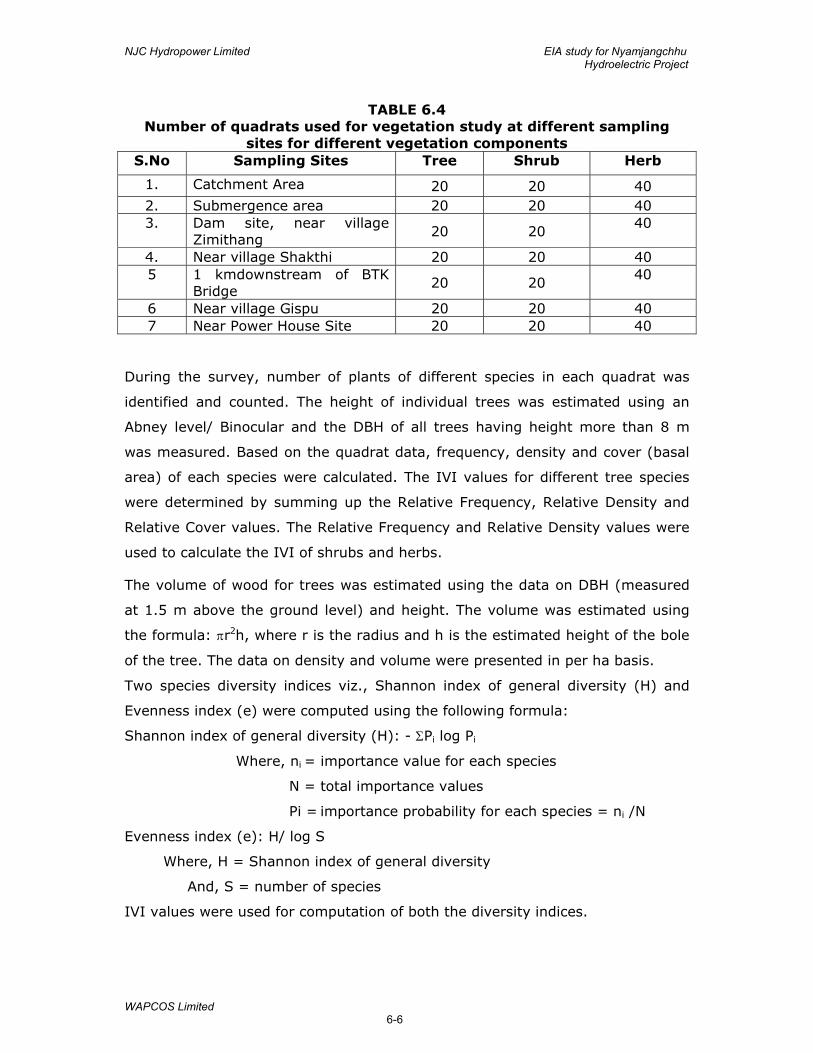
NJC Hydropower Limited EIA study for Nyamjangchhu Hydroelectric Project
WAPCOS Limited 6-6
TABLE 6.4 Number of quadrats used for vegetation study at different sampling
sites for different vegetation components S.No Sampling Sites Tree Shrub Herb
1. Catchment Area 20 20 40 2. Submergence area 20 20 40 3. Dam site, near village
Zimithang 20 20
40
4. Near village Shakthi 20 20 40 5 1 kmdownstream of BTK
Bridge 20 20
40
6 Near village Gispu 20 20 40 7 Near Power House Site 20 20 40
During the survey, number of plants of different species in each quadrat was
identified and counted. The height of individual trees was estimated using an
Abney level/ Binocular and the DBH of all trees having height more than 8 m
was measured. Based on the quadrat data, frequency, density and cover (basal
area) of each species were calculated. The IVI values for different tree species
were determined by summing up the Relative Frequency, Relative Density and
Relative Cover values. The Relative Frequency and Relative Density values were
used to calculate the IVI of shrubs and herbs.
The volume of wood for trees was estimated using the data on DBH (measured
at 1.5 m above the ground level) and height. The volume was estimated using
the formula: πr2h, where r is the radius and h is the estimated height of the bole
of the tree. The data on density and volume were presented in per ha basis.
Two species diversity indices viz., Shannon index of general diversity (H) and
Evenness index (e) were computed using the following formula:
Shannon index of general diversity (H): - ΣPi log Pi
Where, ni = importance value for each species
N = total importance values
Pi = importance probability for each species = ni /N
Evenness index (e): H/ log S
Where, H = Shannon index of general diversity
And, S = number of species
IVI values were used for computation of both the diversity indices.
NJC Hydropower Limited EIA study for Nyamjangchhu Hydroelectric Project
WAPCOS Limited 6-7
During the vegetation survey, herbaria were prepared for the plants those had
flowers. Rare and endangered species were identified referring to the Red Data
Book of India, Flora of Meghalaya and other available literature, flora and
herbarium pertaining to the rare/ endangered species of Arunchal Pradesh.
6.2.4.3 Results
The community characteristics and species diversity indices at various sampling
sites is given in Tables-5.5 and 5.6 respectively.
Site-1: Catchment Area
There were 10 tree species recorded from this site. The tree density was 455
individuals/ha (Table-5.5). Pinus wallichiana (160 individuals/ha) and Alnus
nepalensis (125 individuals /ha) were the dominant and co-dominant tree
species in this forests. This two species together accounted for about 55% of the
total density. Ten shrubs were recorded from the site. Rhus javanica and
Eleagnus sp. were the dominant shrub species. Eighteen, Twenty three and
thirty nine herbaceous species were recorded during monsoon, winter and
summer respectively. Polygonum capitatum, Oxalis corniculata and Hydrocotyl
javanica were the dominant species.
Shannon’s diversity index ranged from 1.95 to 3.55 for tree, shrub and herb
component. The evenness index was high having values more than 0.85 (Table
5.6).
The project site was not found to have any rare and endangered plants of the
region. Plants of other economic importance such as timber, medicinal and
edible fruits were common.
Site-2 : Submergence Area
Twelve tree species were recorded from this site. The tree density was 270
individuals/ha (Refer Table-6.5). Alnus nepalensis with 70 individuals/ha was the
dominant species and alone contributed to about 26% of the total density
followed by Erythrina arboresence (45 individuals ha-1) and Macaranga
denticulata (35 individuals ha-1). Ten shrubs were recorded from the site.
Eleagnus sp. and Rubus ellipticus were the dominant shrub species. Twenty four
species of herbs were recorded during winter and monsoon and thirty nine
species during summer season. Polygonum capitatum, Anaphilis triplinervis and
Oxalis corniculata were the dominant herbaceous species.
NJC Hydropower Limited EIA study for Nyamjangchhu Hydroelectric Project
WAPCOS Limited 6-8
Shannon’s diversity index ranged between 2.18 and 3.55 for all for all three
components i.e., tree, shrub and herb. The evenness index was also high having
values more than 0.9 (Table 6.6).
The project site was not found to have many rare and endangered plants. Plants
of other economic importance such as timber, medicinal and edible fruits were
common.
Site-3 : Dam Site
Eight tree species were recorded from the dam site. The tree density was low
(250 individuals ha-1) (Table-6.5). Alnus nepalensis was the dominant species
with 137 individuals ha-1 and alone accounted for about 48% of the total density
followed by Rhododendron medini. However, the Alnus nepalensis individuals
were found as cut stumps. Seven species of shrub were recorded from the site.
Rubus ellipticus and Elaegnus sp. were the dominant shrubs. Twenty one
herbaceous species were recorded during winter and monsoon season and
twenty seven species during summer season. Galinsoga parviflora and
Polygonum capitatum were dominant during winter and Pteridium aquilinum and
Galinsoga parviflora during summer season.
In general, species diversity and the Shannon’s Index were low for the trees
(1.71) and shrubs (1.68). However, it was higher in case of herbaceous
components (2.85 - 3.17) in the forests. The evenness index was also high
having values more than 0.8 for all the three components (Table 6.6). Rare and
endangered categories of plant species was not recorded in the dam site.
However, plants of economic importance such as timber, medicinal and edible
fruits were common.
Site-4 : Near village Shakti
There were eleven tree species recorded from this site. The tree density was 475
individuals/ha (Table-6.5). Alnus nepalensis with 160 individuals/ha was the
dominant tree species followed by Schima wallichii (80 individuals /ha) were the
dominant and co-dominant tree species in this forests. This two species together
accounted for about 41% of the total density. Fourteen shrubs were recorded
from the site; Ribes glaciale and Maesa indica were dominant. Twenty eight
herbs species were recorded during winter and monsoon and thirty two herbs
species were recorded during summer. Drymaria cordata and Nicandra
NJC Hydropower Limited EIA study for Nyamjangchhu Hydroelectric Project
WAPCOS Limited 6-9
physaloides were the dominant herb species during winter and Rumex
nepalensis and Gnaphalium sp. dominated during summer season.
Shannon’s diversity index was high and ranged from 1 to 2.15 for tree, shrub
and herb component. The evenness index was also high having values more
than 0.8 (Table-6.6).
Site-5 : 1 km downstream of BTK Brridge
Nine tree species were recorded from the dam site. The tree density was low
(410 individuals /ha) (Table -6.5). Macaranga denticulata was the dominant
species with 210 individuals/ha followed by Albizzia lucida (40 individuals/ha)
constituting 61% of the total density. Thirteen shrubs were recorded from the
site and Artemesia nilagirica and Rubus ellipticus were dominant. Twenty six
herbs species were recorded during winter and monsoon season and twenty five
species during summer season. Galinsoga parviflora and Fagopurum dibotrys
were dominant during winter and Polygonum hydropiper and Galinsoga
parviflora during summer season. In general, species diversity and the
Shannon’s Index were low for the tree component (1.78) as compared to shrub
(2.33) and herb (1.28 and 1.33) components in the forests. The evenness index
was also high having values more than 0.8 for all the three components (Table
6.6).
Rare and endangered categories of plant species was not recorded in the at this
site. However, plants of economic importance such as timber, medicinal and
edible fruits were common.
Site-6 : Near village Gispu
Seven tree species were recorded from this site. The tree density was 345
individuals/ha (Table-6.5). Alnus nepalensis with 180 individuals/ha was the
dominant species and alone contributed to about 52% of the total density
followed by Schima khasiana (60 individuals /ha). Twelve shrub species were
recorded from the site. Elaegnus sp., Artemesia nilagirica, Mesea indica were the
dominant shrub species. Nineteen species of herbs were recorded during winter
and monsoon and twenty four recorded during summer season. Pouzolzia hirta
and Bidens pilosa were dominant during winter while Fagopyrum dibotrys and
Anaphalis triplinervis were the dominant herb species.
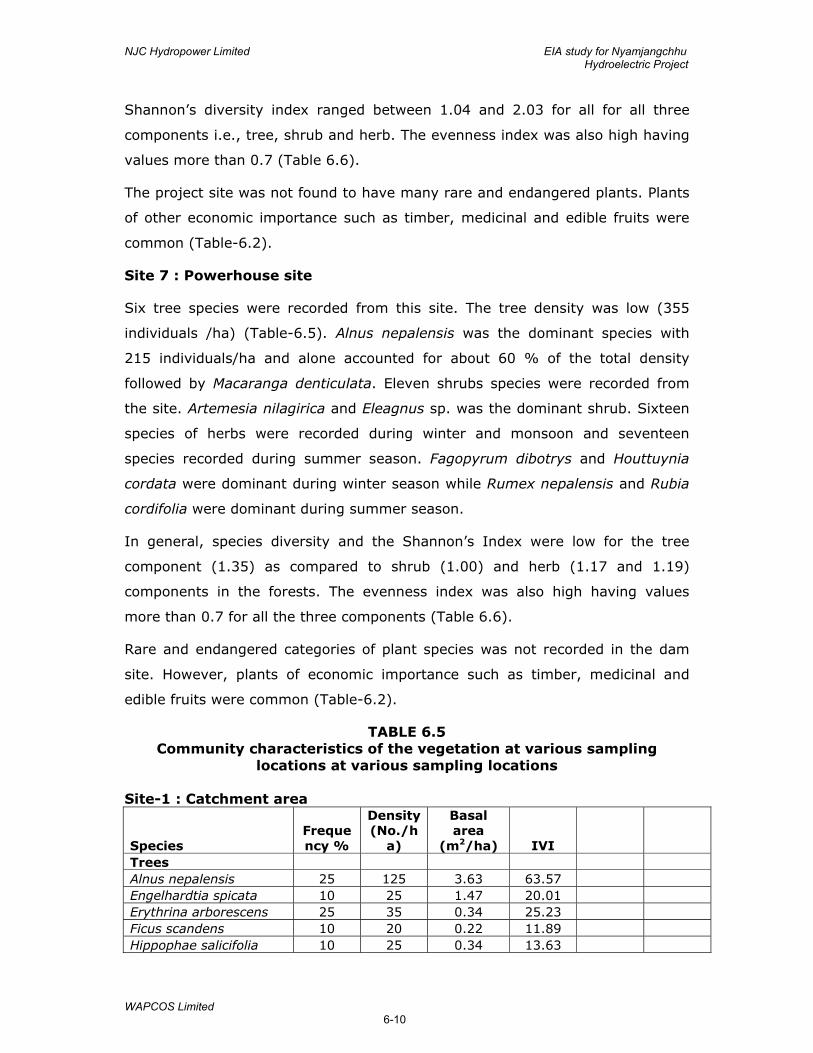
NJC Hydropower Limited EIA study for Nyamjangchhu Hydroelectric Project
WAPCOS Limited 6-10
Shannon’s diversity index ranged between 1.04 and 2.03 for all for all three
components i.e., tree, shrub and herb. The evenness index was also high having
values more than 0.7 (Table 6.6).
The project site was not found to have many rare and endangered plants. Plants
of other economic importance such as timber, medicinal and edible fruits were
common (Table-6.2).
Site 7 : Powerhouse site
Six tree species were recorded from this site. The tree density was low (355
individuals /ha) (Table-6.5). Alnus nepalensis was the dominant species with
215 individuals/ha and alone accounted for about 60 % of the total density
followed by Macaranga denticulata. Eleven shrubs species were recorded from
the site. Artemesia nilagirica and Eleagnus sp. was the dominant shrub. Sixteen
species of herbs were recorded during winter and monsoon and seventeen
species recorded during summer season. Fagopyrum dibotrys and Houttuynia
cordata were dominant during winter season while Rumex nepalensis and Rubia
cordifolia were dominant during summer season.
In general, species diversity and the Shannon’s Index were low for the tree
component (1.35) as compared to shrub (1.00) and herb (1.17 and 1.19)
components in the forests. The evenness index was also high having values
more than 0.7 for all the three components (Table 6.6).
Rare and endangered categories of plant species was not recorded in the dam
site. However, plants of economic importance such as timber, medicinal and
edible fruits were common (Table-6.2).
TABLE 6.5 Community characteristics of the vegetation at various sampling
locations at various sampling locations
Site-1 : Catchment area
Species Frequency %
Density (No./h
a)
Basal area
(m2/ha) IVI
Trees Alnus nepalensis 25 125 3.63 63.57 Engelhardtia spicata 10 25 1.47 20.01 Erythrina arborescens 25 35 0.34 25.23 Ficus scandens 10 20 0.22 11.89 Hippophae salicifolia 10 25 0.34 13.63
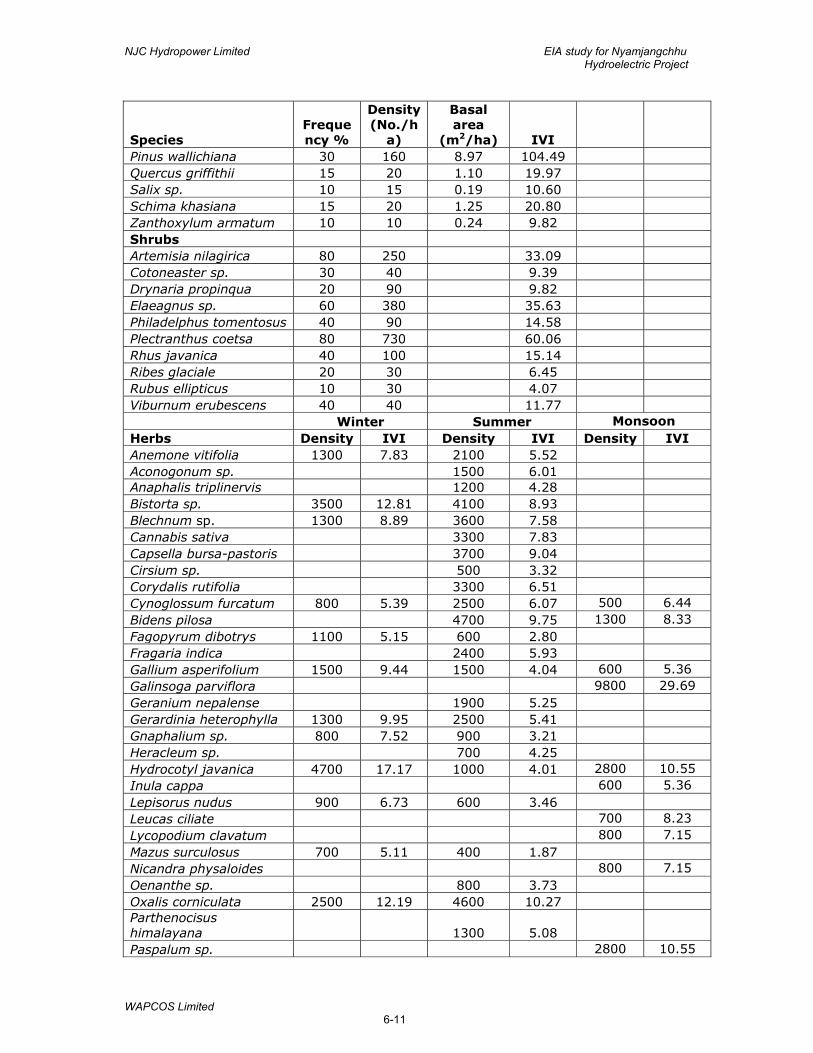
NJC Hydropower Limited EIA study for Nyamjangchhu Hydroelectric Project
WAPCOS Limited 6-11
Species Frequency %
Density (No./h
a)
Basal area
(m2/ha) IVI
Pinus wallichiana 30 160 8.97 104.49 Quercus griffithii 15 20 1.10 19.97 Salix sp. 10 15 0.19 10.60 Schima khasiana 15 20 1.25 20.80 Zanthoxylum armatum 10 10 0.24 9.82 Shrubs Artemisia nilagirica 80 250 33.09 Cotoneaster sp. 30 40 9.39 Drynaria propinqua 20 90 9.82 Elaeagnus sp. 60 380 35.63 Philadelphus tomentosus 40 90 14.58 Plectranthus coetsa 80 730 60.06 Rhus javanica 40 100 15.14 Ribes glaciale 20 30 6.45 Rubus ellipticus 10 30 4.07 Viburnum erubescens 40 40 11.77 Winter Summer Monsoon Herbs Density IVI Density IVI Density IVI Anemone vitifolia 1300 7.83 2100 5.52 Aconogonum sp. 1500 6.01 Anaphalis triplinervis 1200 4.28 Bistorta sp. 3500 12.81 4100 8.93 Blechnum sp. 1300 8.89 3600 7.58 Cannabis sativa 3300 7.83 Capsella bursa-pastoris 3700 9.04 Cirsium sp. 500 3.32 Corydalis rutifolia 3300 6.51 Cynoglossum furcatum 800 5.39 2500 6.07 500 6.44 Bidens pilosa 4700 9.75 1300 8.33 Fagopyrum dibotrys 1100 5.15 600 2.80 Fragaria indica 2400 5.93 Gallium asperifolium 1500 9.44 1500 4.04 600 5.36 Galinsoga parviflora 9800 29.69 Geranium nepalense 1900 5.25 Gerardinia heterophylla 1300 9.95 2500 5.41 Gnaphalium sp. 800 7.52 900 3.21 Heracleum sp. 700 4.25 Hydrocotyl javanica 4700 17.17 1000 4.01 2800 10.55 Inula cappa 600 5.36 Lepisorus nudus 900 6.73 600 3.46 Leucas ciliate 700 8.23 Lycopodium clavatum 800 7.15 Mazus surculosus 700 5.11 400 1.87 Nicandra physaloides 800 7.15 Oenanthe sp. 800 3.73 Oxalis corniculata 2500 12.19 4600 10.27 Parthenocisus himalayana 1300 5.08
Paspalum sp. 2800 10.55
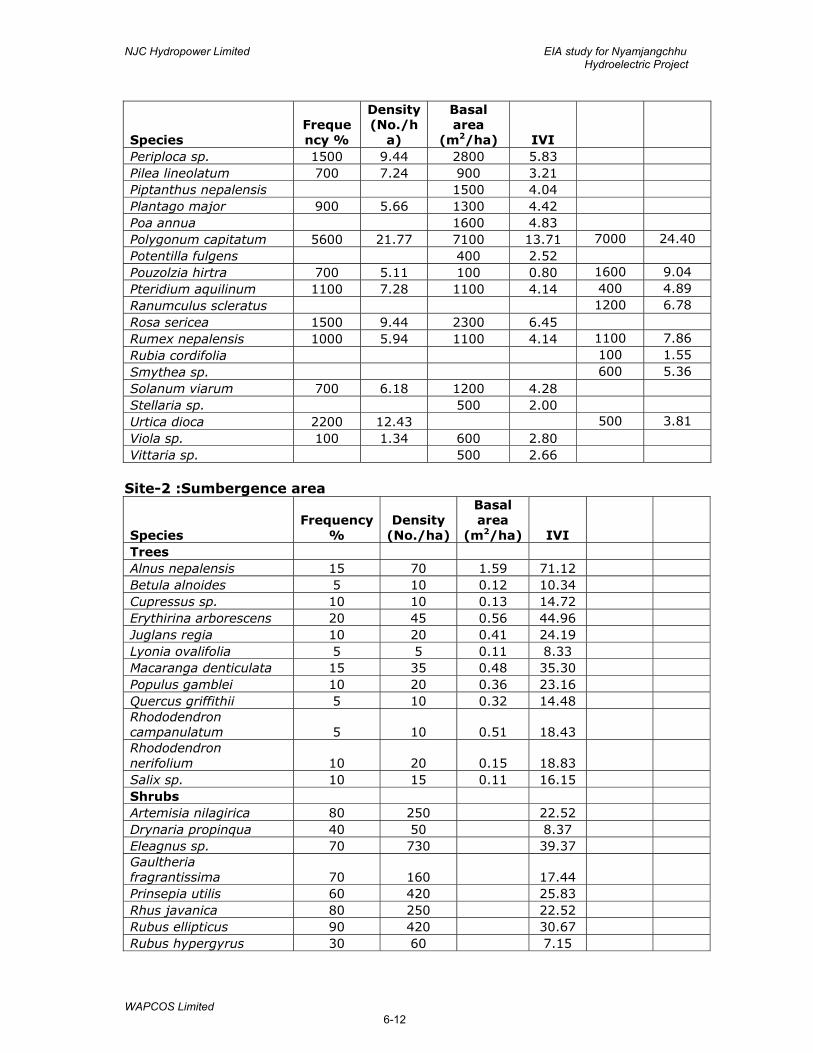
NJC Hydropower Limited EIA study for Nyamjangchhu Hydroelectric Project
WAPCOS Limited 6-12
Species Frequency %
Density (No./h
a)
Basal area
(m2/ha) IVI
Periploca sp. 1500 9.44 2800 5.83 Pilea lineolatum 700 7.24 900 3.21 Piptanthus nepalensis 1500 4.04 Plantago major 900 5.66 1300 4.42 Poa annua 1600 4.83 Polygonum capitatum 5600 21.77 7100 13.71 7000 24.40 Potentilla fulgens 400 2.52 Pouzolzia hirtra 700 5.11 100 0.80 1600 9.04 Pteridium aquilinum 1100 7.28 1100 4.14 400 4.89 Ranumculus scleratus 1200 6.78 Rosa sericea 1500 9.44 2300 6.45 Rumex nepalensis 1000 5.94 1100 4.14 1100 7.86 Rubia cordifolia 100 1.55 Smythea sp. 600 5.36 Solanum viarum 700 6.18 1200 4.28 Stellaria sp. 500 2.00 Urtica dioca 2200 12.43 500 3.81 Viola sp. 100 1.34 600 2.80 Vittaria sp. 500 2.66
Site-2 :Sumbergence area
Species Frequency
% Density
(No./ha)
Basal area
(m2/ha) IVI
Trees Alnus nepalensis 15 70 1.59 71.12 Betula alnoides 5 10 0.12 10.34 Cupressus sp. 10 10 0.13 14.72 Erythirina arborescens 20 45 0.56 44.96 Juglans regia 10 20 0.41 24.19 Lyonia ovalifolia 5 5 0.11 8.33 Macaranga denticulata 15 35 0.48 35.30 Populus gamblei 10 20 0.36 23.16 Quercus griffithii 5 10 0.32 14.48 Rhododendron campanulatum 5 10 0.51 18.43
Rhododendron nerifolium 10 20 0.15 18.83
Salix sp. 10 15 0.11 16.15 Shrubs Artemisia nilagirica 80 250 22.52 Drynaria propinqua 40 50 8.37 Eleagnus sp. 70 730 39.37 Gaultheria fragrantissima 70 160 17.44
Prinsepia utilis 60 420 25.83 Rhus javanica 80 250 22.52 Rubus ellipticus 90 420 30.67 Rubus hypergyrus 30 60 7.15
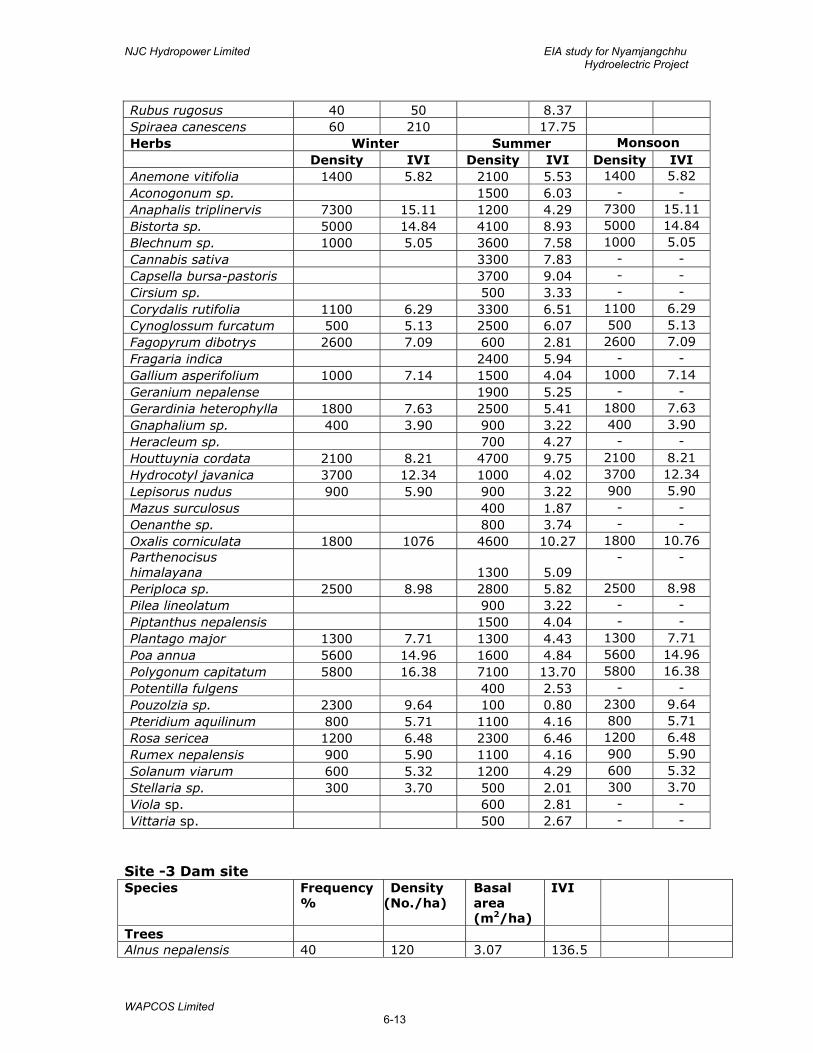
NJC Hydropower Limited EIA study for Nyamjangchhu Hydroelectric Project
WAPCOS Limited 6-13
Rubus rugosus 40 50 8.37 Spiraea canescens 60 210 17.75 Herbs Winter Summer Monsoon Density IVI Density IVI Density IVI Anemone vitifolia 1400 5.82 2100 5.53 1400 5.82 Aconogonum sp. 1500 6.03 - - Anaphalis triplinervis 7300 15.11 1200 4.29 7300 15.11 Bistorta sp. 5000 14.84 4100 8.93 5000 14.84 Blechnum sp. 1000 5.05 3600 7.58 1000 5.05 Cannabis sativa 3300 7.83 - - Capsella bursa-pastoris 3700 9.04 - - Cirsium sp. 500 3.33 - - Corydalis rutifolia 1100 6.29 3300 6.51 1100 6.29 Cynoglossum furcatum 500 5.13 2500 6.07 500 5.13 Fagopyrum dibotrys 2600 7.09 600 2.81 2600 7.09 Fragaria indica 2400 5.94 - - Gallium asperifolium 1000 7.14 1500 4.04 1000 7.14 Geranium nepalense 1900 5.25 - - Gerardinia heterophylla 1800 7.63 2500 5.41 1800 7.63 Gnaphalium sp. 400 3.90 900 3.22 400 3.90 Heracleum sp. 700 4.27 - - Houttuynia cordata 2100 8.21 4700 9.75 2100 8.21 Hydrocotyl javanica 3700 12.34 1000 4.02 3700 12.34 Lepisorus nudus 900 5.90 900 3.22 900 5.90 Mazus surculosus 400 1.87 - - Oenanthe sp. 800 3.74 - - Oxalis corniculata 1800 1076 4600 10.27 1800 10.76 Parthenocisus himalayana 1300 5.09
- -
Periploca sp. 2500 8.98 2800 5.82 2500 8.98 Pilea lineolatum 900 3.22 - - Piptanthus nepalensis 1500 4.04 - - Plantago major 1300 7.71 1300 4.43 1300 7.71 Poa annua 5600 14.96 1600 4.84 5600 14.96 Polygonum capitatum 5800 16.38 7100 13.70 5800 16.38 Potentilla fulgens 400 2.53 - - Pouzolzia sp. 2300 9.64 100 0.80 2300 9.64 Pteridium aquilinum 800 5.71 1100 4.16 800 5.71 Rosa sericea 1200 6.48 2300 6.46 1200 6.48 Rumex nepalensis 900 5.90 1100 4.16 900 5.90 Solanum viarum 600 5.32 1200 4.29 600 5.32 Stellaria sp. 300 3.70 500 2.01 300 3.70 Viola sp. 600 2.81 - - Vittaria sp. 500 2.67 - -
Site -3 Dam site Species Frequency
% Density
(No./ha) Basal area (m2/ha)
IVI
Trees Alnus nepalensis 40 120 3.07 136.5
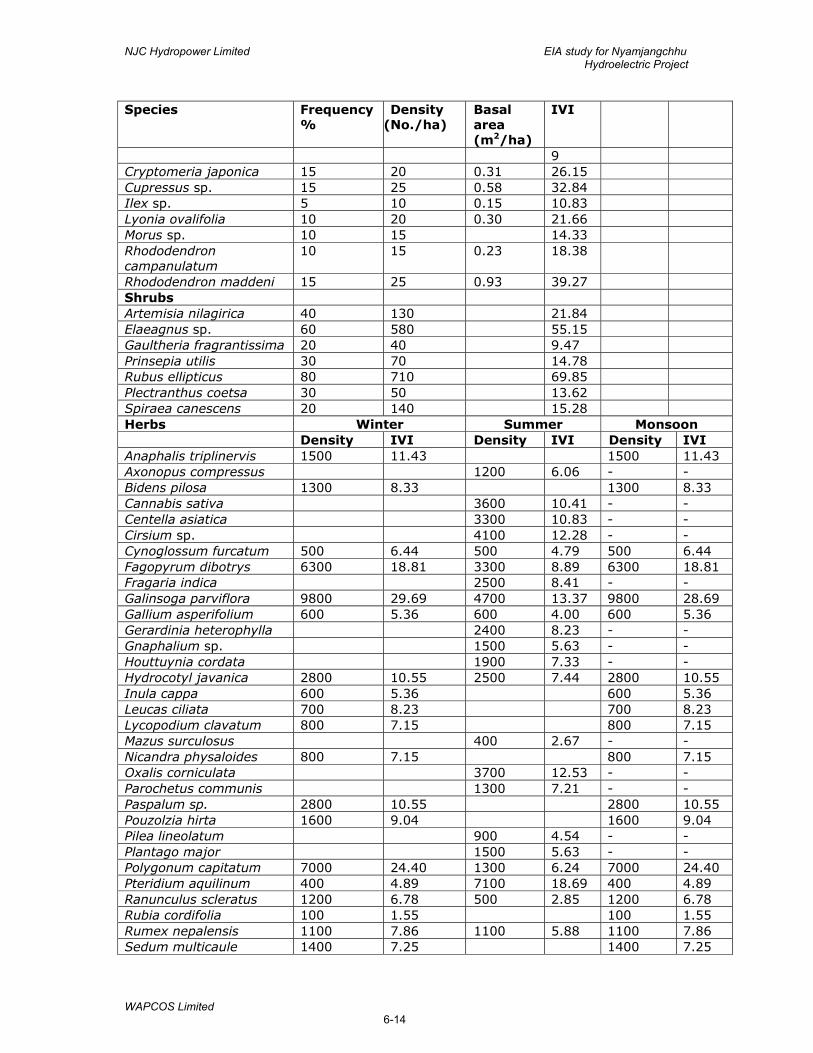
NJC Hydropower Limited EIA study for Nyamjangchhu Hydroelectric Project
WAPCOS Limited 6-14
Species Frequency %
Density (No./ha)
Basal area (m2/ha)
IVI
9 Cryptomeria japonica 15 20 0.31 26.15 Cupressus sp. 15 25 0.58 32.84 Ilex sp. 5 10 0.15 10.83 Lyonia ovalifolia 10 20 0.30 21.66 Morus sp. 10 15 14.33 Rhododendron campanulatum
10 15 0.23 18.38
Rhododendron maddeni 15 25 0.93 39.27 Shrubs Artemisia nilagirica 40 130 21.84 Elaeagnus sp. 60 580 55.15 Gaultheria fragrantissima 20 40 9.47 Prinsepia utilis 30 70 14.78 Rubus ellipticus 80 710 69.85 Plectranthus coetsa 30 50 13.62 Spiraea canescens 20 140 15.28 Herbs Winter Summer Monsoon Density IVI Density IVI Density IVI Anaphalis triplinervis 1500 11.43 1500 11.43 Axonopus compressus 1200 6.06 - - Bidens pilosa 1300 8.33 1300 8.33 Cannabis sativa 3600 10.41 - - Centella asiatica 3300 10.83 - - Cirsium sp. 4100 12.28 - - Cynoglossum furcatum 500 6.44 500 4.79 500 6.44 Fagopyrum dibotrys 6300 18.81 3300 8.89 6300 18.81 Fragaria indica 2500 8.41 - - Galinsoga parviflora 9800 29.69 4700 13.37 9800 28.69 Gallium asperifolium 600 5.36 600 4.00 600 5.36 Gerardinia heterophylla 2400 8.23 - - Gnaphalium sp. 1500 5.63 - - Houttuynia cordata 1900 7.33 - - Hydrocotyl javanica 2800 10.55 2500 7.44 2800 10.55 Inula cappa 600 5.36 600 5.36 Leucas ciliata 700 8.23 700 8.23 Lycopodium clavatum 800 7.15 800 7.15 Mazus surculosus 400 2.67 - - Nicandra physaloides 800 7.15 800 7.15 Oxalis corniculata 3700 12.53 - - Parochetus communis 1300 7.21 - - Paspalum sp. 2800 10.55 2800 10.55 Pouzolzia hirta 1600 9.04 1600 9.04 Pilea lineolatum 900 4.54 - - Plantago major 1500 5.63 - - Polygonum capitatum 7000 24.40 1300 6.24 7000 24.40 Pteridium aquilinum 400 4.89 7100 18.69 400 4.89 Ranunculus scleratus 1200 6.78 500 2.85 1200 6.78 Rubia cordifolia 100 1.55 100 1.55 Rumex nepalensis 1100 7.86 1100 5.88 1100 7.86 Sedum multicaule 1400 7.25 1400 7.25
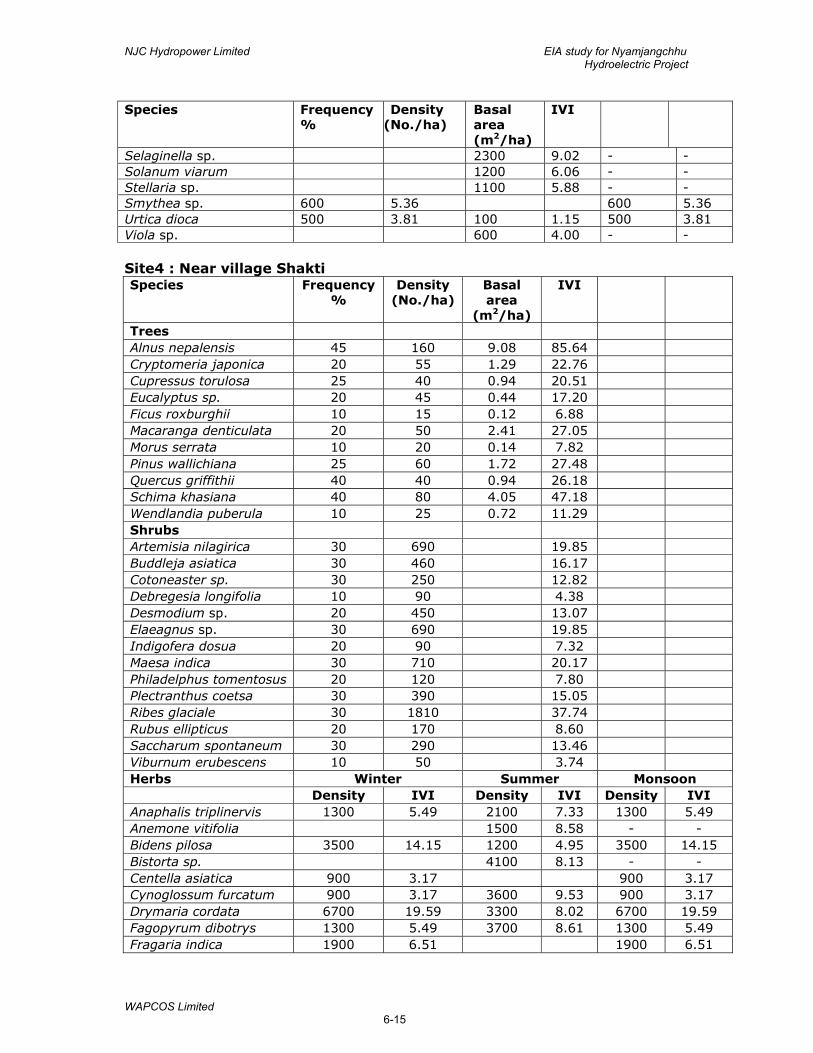
NJC Hydropower Limited EIA study for Nyamjangchhu Hydroelectric Project
WAPCOS Limited 6-15
Species Frequency %
Density (No./ha)
Basal area (m2/ha)
IVI
Selaginella sp. 2300 9.02 - - Solanum viarum 1200 6.06 - - Stellaria sp. 1100 5.88 - - Smythea sp. 600 5.36 600 5.36 Urtica dioca 500 3.81 100 1.15 500 3.81 Viola sp. 600 4.00 - - Site4 : Near village Shakti Species Frequency
% Density
(No./ha) Basal area
(m2/ha)
IVI
Trees Alnus nepalensis 45 160 9.08 85.64 Cryptomeria japonica 20 55 1.29 22.76 Cupressus torulosa 25 40 0.94 20.51 Eucalyptus sp. 20 45 0.44 17.20 Ficus roxburghii 10 15 0.12 6.88 Macaranga denticulata 20 50 2.41 27.05 Morus serrata 10 20 0.14 7.82 Pinus wallichiana 25 60 1.72 27.48 Quercus griffithii 40 40 0.94 26.18 Schima khasiana 40 80 4.05 47.18 Wendlandia puberula 10 25 0.72 11.29 Shrubs Artemisia nilagirica 30 690 19.85 Buddleja asiatica 30 460 16.17 Cotoneaster sp. 30 250 12.82 Debregesia longifolia 10 90 4.38 Desmodium sp. 20 450 13.07 Elaeagnus sp. 30 690 19.85 Indigofera dosua 20 90 7.32 Maesa indica 30 710 20.17 Philadelphus tomentosus 20 120 7.80 Plectranthus coetsa 30 390 15.05 Ribes glaciale 30 1810 37.74 Rubus ellipticus 20 170 8.60 Saccharum spontaneum 30 290 13.46 Viburnum erubescens 10 50 3.74 Herbs Winter Summer Monsoon Density IVI Density IVI Density IVI Anaphalis triplinervis 1300 5.49 2100 7.33 1300 5.49 Anemone vitifolia 1500 8.58 - - Bidens pilosa 3500 14.15 1200 4.95 3500 14.15 Bistorta sp. 4100 8.13 - - Centella asiatica 900 3.17 900 3.17 Cynoglossum furcatum 900 3.17 3600 9.53 900 3.17 Drymaria cordata 6700 19.59 3300 8.02 6700 19.59 Fagopyrum dibotrys 1300 5.49 3700 8.61 1300 5.49 Fragaria indica 1900 6.51 1900 6.51
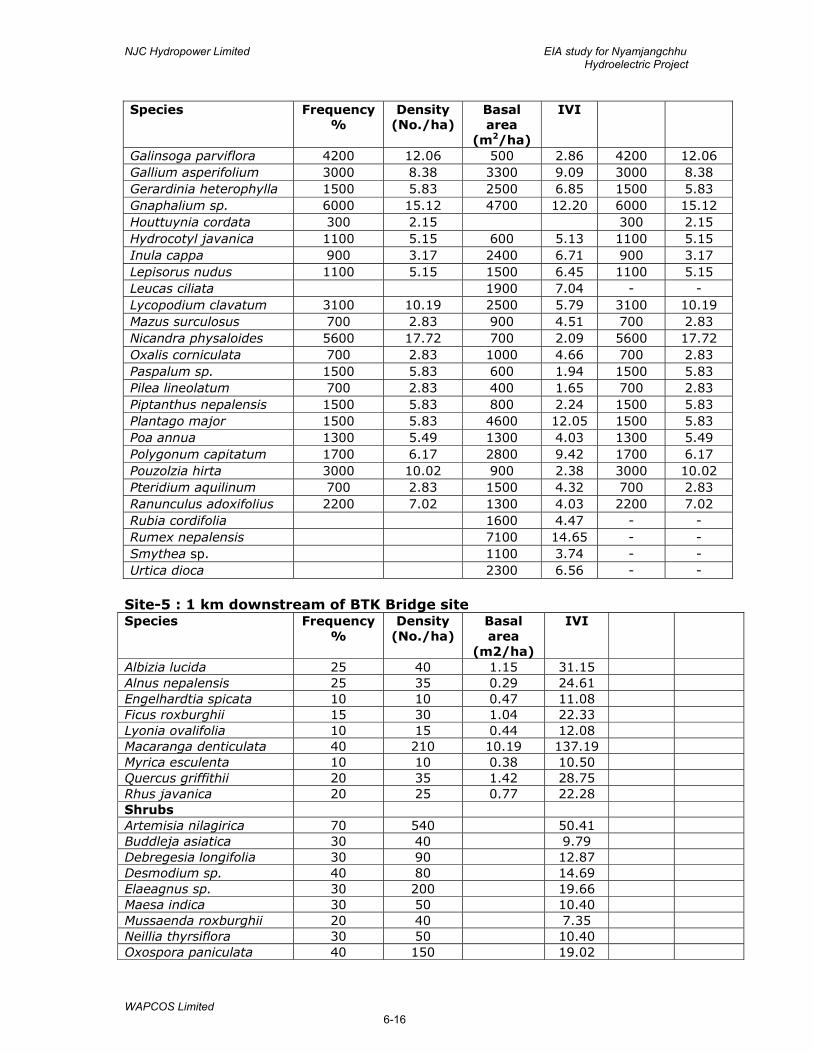
NJC Hydropower Limited EIA study for Nyamjangchhu Hydroelectric Project
WAPCOS Limited 6-16
Species Frequency %
Density (No./ha)
Basal area
(m2/ha)
IVI
Galinsoga parviflora 4200 12.06 500 2.86 4200 12.06 Gallium asperifolium 3000 8.38 3300 9.09 3000 8.38 Gerardinia heterophylla 1500 5.83 2500 6.85 1500 5.83 Gnaphalium sp. 6000 15.12 4700 12.20 6000 15.12 Houttuynia cordata 300 2.15 300 2.15 Hydrocotyl javanica 1100 5.15 600 5.13 1100 5.15 Inula cappa 900 3.17 2400 6.71 900 3.17 Lepisorus nudus 1100 5.15 1500 6.45 1100 5.15 Leucas ciliata 1900 7.04 - - Lycopodium clavatum 3100 10.19 2500 5.79 3100 10.19 Mazus surculosus 700 2.83 900 4.51 700 2.83 Nicandra physaloides 5600 17.72 700 2.09 5600 17.72 Oxalis corniculata 700 2.83 1000 4.66 700 2.83 Paspalum sp. 1500 5.83 600 1.94 1500 5.83 Pilea lineolatum 700 2.83 400 1.65 700 2.83 Piptanthus nepalensis 1500 5.83 800 2.24 1500 5.83 Plantago major 1500 5.83 4600 12.05 1500 5.83 Poa annua 1300 5.49 1300 4.03 1300 5.49 Polygonum capitatum 1700 6.17 2800 9.42 1700 6.17 Pouzolzia hirta 3000 10.02 900 2.38 3000 10.02 Pteridium aquilinum 700 2.83 1500 4.32 700 2.83 Ranunculus adoxifolius 2200 7.02 1300 4.03 2200 7.02 Rubia cordifolia 1600 4.47 - - Rumex nepalensis 7100 14.65 - - Smythea sp. 1100 3.74 - - Urtica dioca 2300 6.56 - -
Site-5 : 1 km downstream of BTK Bridge site Species Frequency
% Density
(No./ha) Basal area
(m2/ha)
IVI
Albizia lucida 25 40 1.15 31.15 Alnus nepalensis 25 35 0.29 24.61 Engelhardtia spicata 10 10 0.47 11.08 Ficus roxburghii 15 30 1.04 22.33 Lyonia ovalifolia 10 15 0.44 12.08 Macaranga denticulata 40 210 10.19 137.19 Myrica esculenta 10 10 0.38 10.50 Quercus griffithii 20 35 1.42 28.75 Rhus javanica 20 25 0.77 22.28 Shrubs Artemisia nilagirica 70 540 50.41 Buddleja asiatica 30 40 9.79 Debregesia longifolia 30 90 12.87 Desmodium sp. 40 80 14.69 Elaeagnus sp. 30 200 19.66 Maesa indica 30 50 10.40 Mussaenda roxburghii 20 40 7.35 Neillia thyrsiflora 30 50 10.40 Oxospora paniculata 40 150 19.02
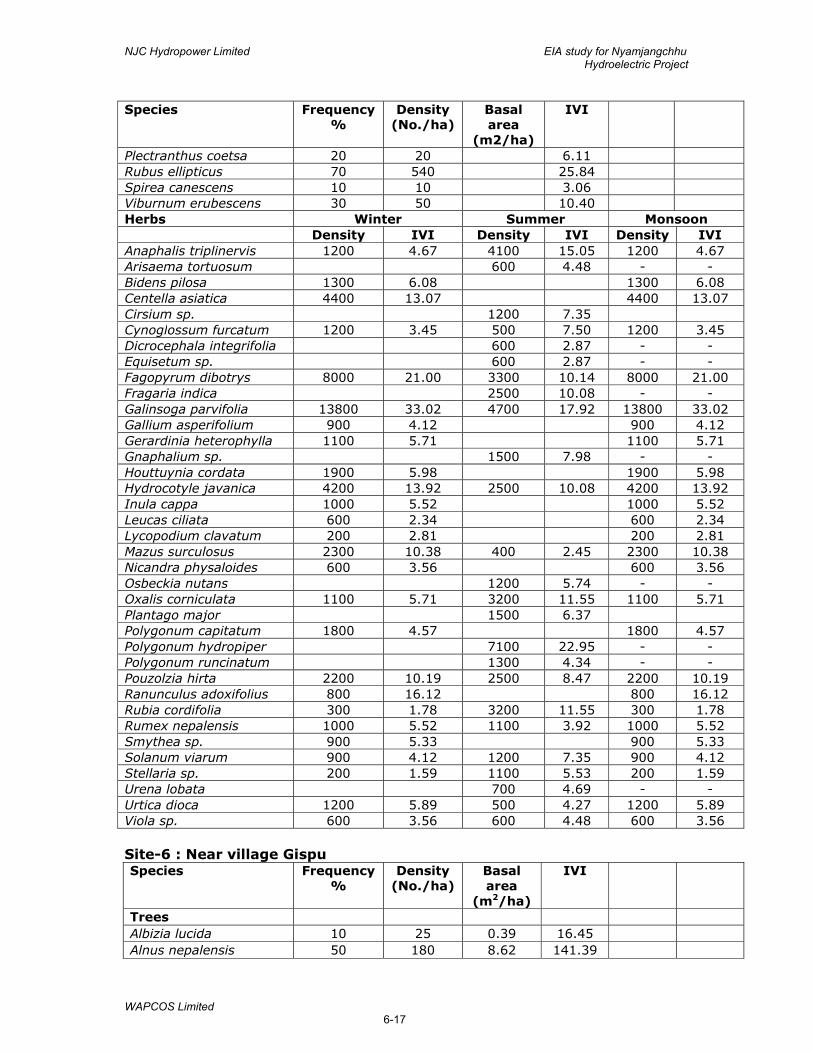
NJC Hydropower Limited EIA study for Nyamjangchhu Hydroelectric Project
WAPCOS Limited 6-17
Species Frequency %
Density (No./ha)
Basal area
(m2/ha)
IVI
Plectranthus coetsa 20 20 6.11 Rubus ellipticus 70 540 25.84 Spirea canescens 10 10 3.06 Viburnum erubescens 30 50 10.40 Herbs Winter Summer Monsoon Density IVI Density IVI Density IVI Anaphalis triplinervis 1200 4.67 4100 15.05 1200 4.67 Arisaema tortuosum 600 4.48 - - Bidens pilosa 1300 6.08 1300 6.08 Centella asiatica 4400 13.07 4400 13.07 Cirsium sp. 1200 7.35 Cynoglossum furcatum 1200 3.45 500 7.50 1200 3.45 Dicrocephala integrifolia 600 2.87 - - Equisetum sp. 600 2.87 - - Fagopyrum dibotrys 8000 21.00 3300 10.14 8000 21.00 Fragaria indica 2500 10.08 - - Galinsoga parvifolia 13800 33.02 4700 17.92 13800 33.02 Gallium asperifolium 900 4.12 900 4.12 Gerardinia heterophylla 1100 5.71 1100 5.71 Gnaphalium sp. 1500 7.98 - - Houttuynia cordata 1900 5.98 1900 5.98 Hydrocotyle javanica 4200 13.92 2500 10.08 4200 13.92 Inula cappa 1000 5.52 1000 5.52 Leucas ciliata 600 2.34 600 2.34 Lycopodium clavatum 200 2.81 200 2.81 Mazus surculosus 2300 10.38 400 2.45 2300 10.38 Nicandra physaloides 600 3.56 600 3.56 Osbeckia nutans 1200 5.74 - - Oxalis corniculata 1100 5.71 3200 11.55 1100 5.71 Plantago major 1500 6.37 Polygonum capitatum 1800 4.57 1800 4.57 Polygonum hydropiper 7100 22.95 - - Polygonum runcinatum 1300 4.34 - - Pouzolzia hirta 2200 10.19 2500 8.47 2200 10.19 Ranunculus adoxifolius 800 16.12 800 16.12 Rubia cordifolia 300 1.78 3200 11.55 300 1.78 Rumex nepalensis 1000 5.52 1100 3.92 1000 5.52 Smythea sp. 900 5.33 900 5.33 Solanum viarum 900 4.12 1200 7.35 900 4.12 Stellaria sp. 200 1.59 1100 5.53 200 1.59 Urena lobata 700 4.69 - - Urtica dioca 1200 5.89 500 4.27 1200 5.89 Viola sp. 600 3.56 600 4.48 600 3.56 Site-6 : Near village Gispu Species Frequency
% Density
(No./ha) Basal area
(m2/ha)
IVI
Trees Albizia lucida 10 25 0.39 16.45 Alnus nepalensis 50 180 8.62 141.39
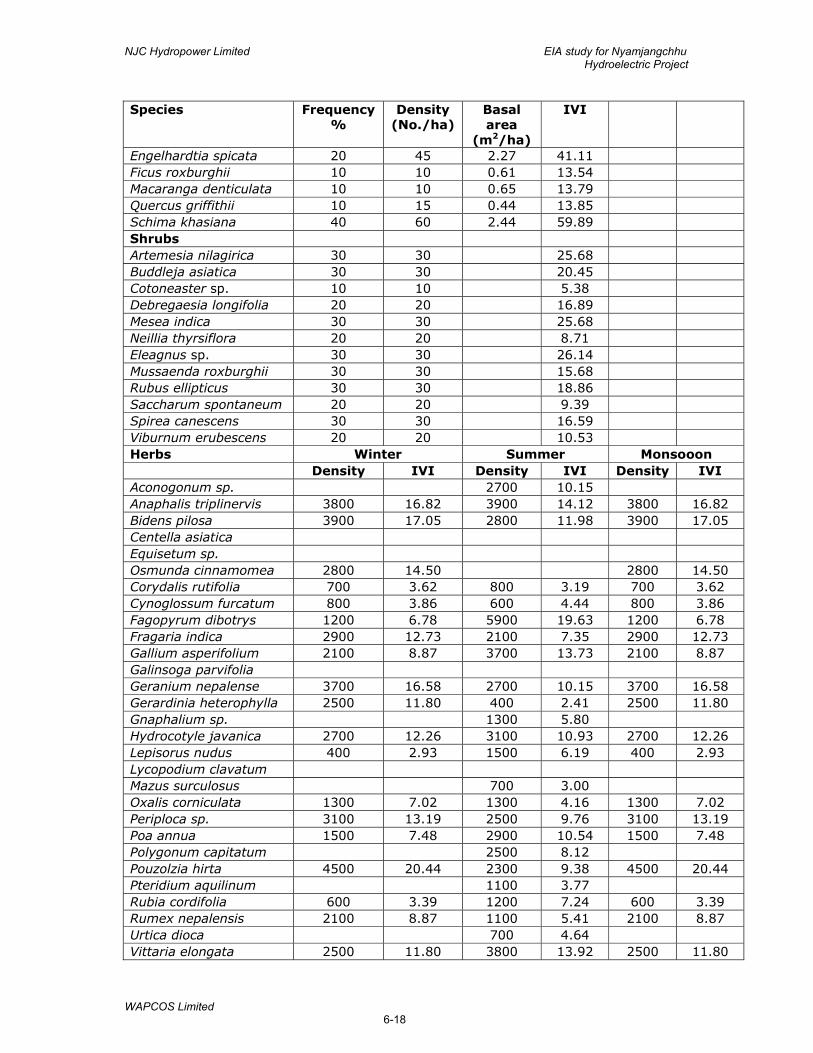
NJC Hydropower Limited EIA study for Nyamjangchhu Hydroelectric Project
WAPCOS Limited 6-18
Species Frequency %
Density (No./ha)
Basal area
(m2/ha)
IVI
Engelhardtia spicata 20 45 2.27 41.11 Ficus roxburghii 10 10 0.61 13.54 Macaranga denticulata 10 10 0.65 13.79 Quercus griffithii 10 15 0.44 13.85 Schima khasiana 40 60 2.44 59.89 Shrubs Artemesia nilagirica 30 30 25.68 Buddleja asiatica 30 30 20.45 Cotoneaster sp. 10 10 5.38 Debregaesia longifolia 20 20 16.89 Mesea indica 30 30 25.68 Neillia thyrsiflora 20 20 8.71 Eleagnus sp. 30 30 26.14 Mussaenda roxburghii 30 30 15.68 Rubus ellipticus 30 30 18.86 Saccharum spontaneum 20 20 9.39 Spirea canescens 30 30 16.59 Viburnum erubescens 20 20 10.53 Herbs Winter Summer Monsooon Density IVI Density IVI Density IVI Aconogonum sp. 2700 10.15 Anaphalis triplinervis 3800 16.82 3900 14.12 3800 16.82 Bidens pilosa 3900 17.05 2800 11.98 3900 17.05 Centella asiatica Equisetum sp. Osmunda cinnamomea 2800 14.50 2800 14.50 Corydalis rutifolia 700 3.62 800 3.19 700 3.62 Cynoglossum furcatum 800 3.86 600 4.44 800 3.86 Fagopyrum dibotrys 1200 6.78 5900 19.63 1200 6.78 Fragaria indica 2900 12.73 2100 7.35 2900 12.73 Gallium asperifolium 2100 8.87 3700 13.73 2100 8.87 Galinsoga parvifolia Geranium nepalense 3700 16.58 2700 10.15 3700 16.58 Gerardinia heterophylla 2500 11.80 400 2.41 2500 11.80 Gnaphalium sp. 1300 5.80 Hydrocotyle javanica 2700 12.26 3100 10.93 2700 12.26 Lepisorus nudus 400 2.93 1500 6.19 400 2.93 Lycopodium clavatum Mazus surculosus 700 3.00 Oxalis corniculata 1300 7.02 1300 4.16 1300 7.02 Periploca sp. 3100 13.19 2500 9.76 3100 13.19 Poa annua 1500 7.48 2900 10.54 1500 7.48 Polygonum capitatum 2500 8.12 Pouzolzia hirta 4500 20.44 2300 9.38 4500 20.44 Pteridium aquilinum 1100 3.77 Rubia cordifolia 600 3.39 1200 7.24 600 3.39 Rumex nepalensis 2100 8.87 1100 5.41 2100 8.87 Urtica dioca 700 4.64 Vittaria elongata 2500 11.80 3800 13.92 2500 11.80
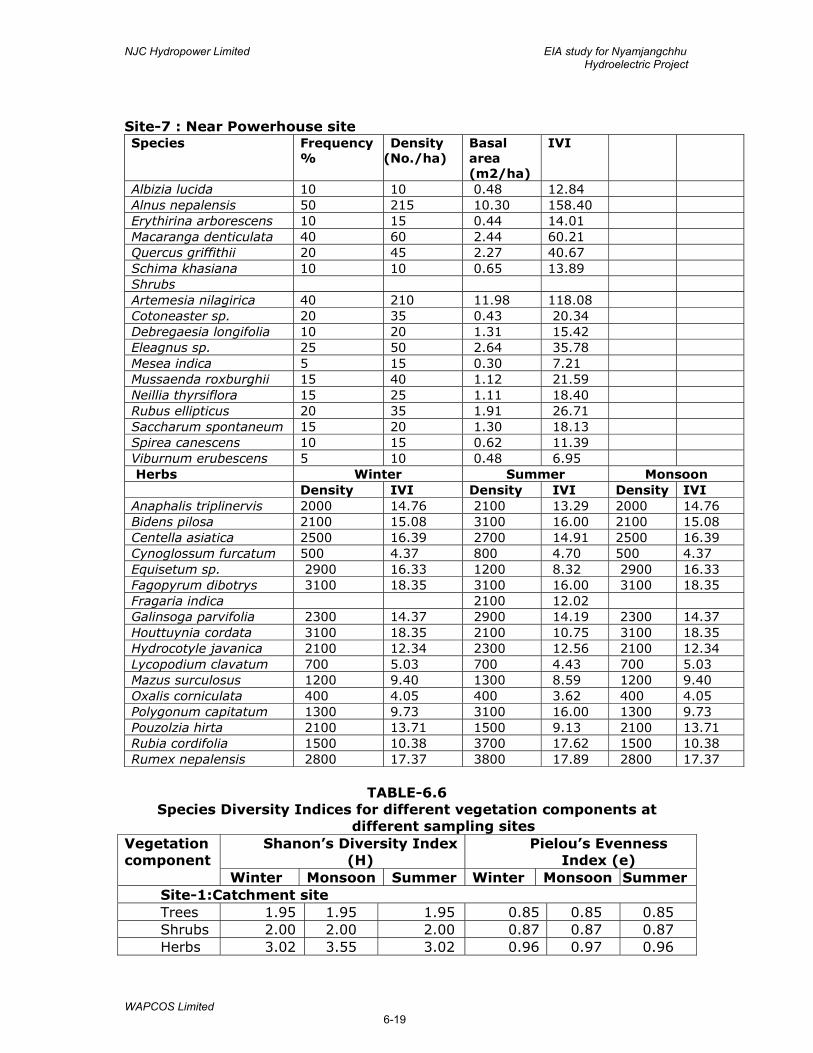
NJC Hydropower Limited EIA study for Nyamjangchhu Hydroelectric Project
WAPCOS Limited 6-19
Site-7 : Near Powerhouse site Species Frequency
% Density
(No./ha) Basal area (m2/ha)
IVI
Albizia lucida 10 10 0.48 12.84 Alnus nepalensis 50 215 10.30 158.40 Erythirina arborescens 10 15 0.44 14.01 Macaranga denticulata 40 60 2.44 60.21 Quercus griffithii 20 45 2.27 40.67 Schima khasiana 10 10 0.65 13.89 Shrubs Artemesia nilagirica 40 210 11.98 118.08 Cotoneaster sp. 20 35 0.43 20.34 Debregaesia longifolia 10 20 1.31 15.42 Eleagnus sp. 25 50 2.64 35.78 Mesea indica 5 15 0.30 7.21 Mussaenda roxburghii 15 40 1.12 21.59 Neillia thyrsiflora 15 25 1.11 18.40 Rubus ellipticus 20 35 1.91 26.71 Saccharum spontaneum 15 20 1.30 18.13 Spirea canescens 10 15 0.62 11.39 Viburnum erubescens 5 10 0.48 6.95 Herbs Winter Summer Monsoon
Density IVI Density IVI Density IVI Anaphalis triplinervis 2000 14.76 2100 13.29 2000 14.76 Bidens pilosa 2100 15.08 3100 16.00 2100 15.08 Centella asiatica 2500 16.39 2700 14.91 2500 16.39 Cynoglossum furcatum 500 4.37 800 4.70 500 4.37 Equisetum sp. 2900 16.33 1200 8.32 2900 16.33 Fagopyrum dibotrys 3100 18.35 3100 16.00 3100 18.35 Fragaria indica 2100 12.02 Galinsoga parvifolia 2300 14.37 2900 14.19 2300 14.37 Houttuynia cordata 3100 18.35 2100 10.75 3100 18.35 Hydrocotyle javanica 2100 12.34 2300 12.56 2100 12.34 Lycopodium clavatum 700 5.03 700 4.43 700 5.03 Mazus surculosus 1200 9.40 1300 8.59 1200 9.40 Oxalis corniculata 400 4.05 400 3.62 400 4.05 Polygonum capitatum 1300 9.73 3100 16.00 1300 9.73 Pouzolzia hirta 2100 13.71 1500 9.13 2100 13.71 Rubia cordifolia 1500 10.38 3700 17.62 1500 10.38 Rumex nepalensis 2800 17.37 3800 17.89 2800 17.37
TABLE-6.6
Species Diversity Indices for different vegetation components at different sampling sites
Vegetation component
Shanon’s Diversity Index (H)
Pielou’s Evenness Index (e)
Winter Monsoon Summer Winter Monsoon Summer Site-1:Catchment site Trees 1.95 1.95 1.95 0.85 0.85 0.85 Shrubs 2.00 2.00 2.00 0.87 0.87 0.87 Herbs 3.02 3.55 3.02 0.96 0.97 0.96
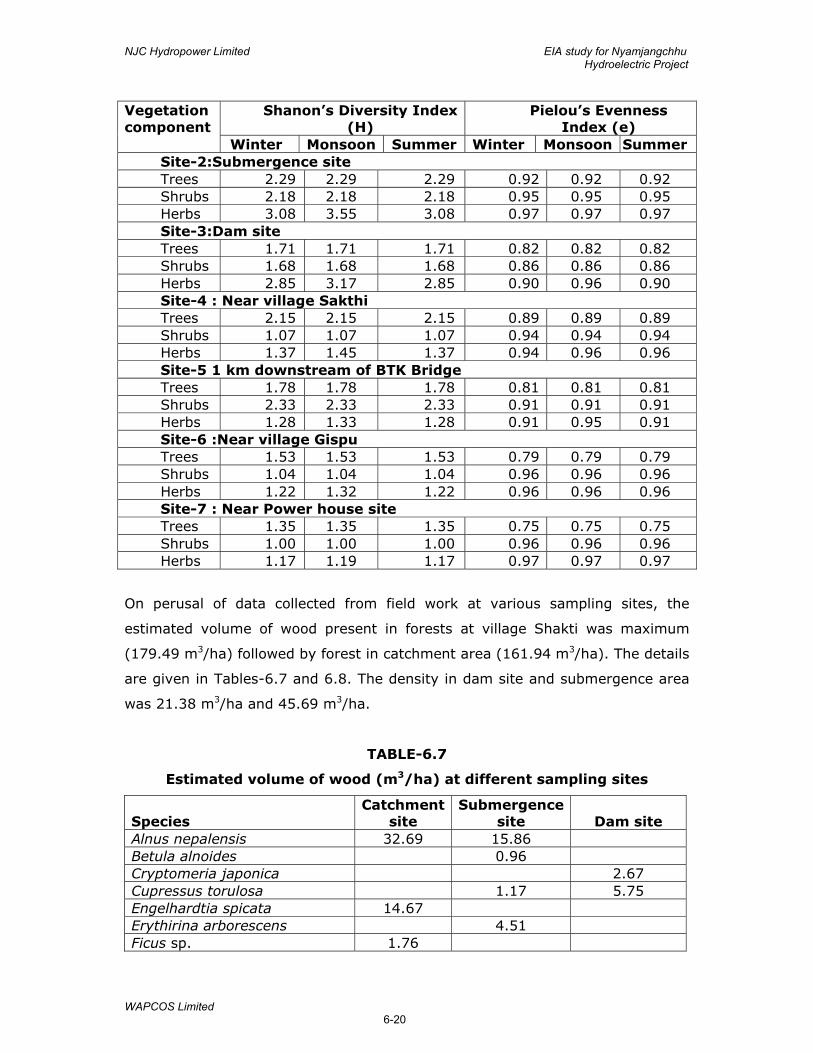
NJC Hydropower Limited EIA study for Nyamjangchhu Hydroelectric Project
WAPCOS Limited 6-20
Vegetation component
Shanon’s Diversity Index (H)
Pielou’s Evenness Index (e)
Winter Monsoon Summer Winter Monsoon Summer Site-2:Submergence site Trees 2.29 2.29 2.29 0.92 0.92 0.92 Shrubs 2.18 2.18 2.18 0.95 0.95 0.95 Herbs 3.08 3.55 3.08 0.97 0.97 0.97 Site-3:Dam site Trees 1.71 1.71 1.71 0.82 0.82 0.82 Shrubs 1.68 1.68 1.68 0.86 0.86 0.86 Herbs 2.85 3.17 2.85 0.90 0.96 0.90 Site-4 : Near village Sakthi Trees 2.15 2.15 2.15 0.89 0.89 0.89 Shrubs 1.07 1.07 1.07 0.94 0.94 0.94 Herbs 1.37 1.45 1.37 0.94 0.96 0.96 Site-5 1 km downstream of BTK Bridge Trees 1.78 1.78 1.78 0.81 0.81 0.81 Shrubs 2.33 2.33 2.33 0.91 0.91 0.91 Herbs 1.28 1.33 1.28 0.91 0.95 0.91 Site-6 :Near village Gispu Trees 1.53 1.53 1.53 0.79 0.79 0.79 Shrubs 1.04 1.04 1.04 0.96 0.96 0.96 Herbs 1.22 1.32 1.22 0.96 0.96 0.96 Site-7 : Near Power house site Trees 1.35 1.35 1.35 0.75 0.75 0.75 Shrubs 1.00 1.00 1.00 0.96 0.96 0.96 Herbs 1.17 1.19 1.17 0.97 0.97 0.97
On perusal of data collected from field work at various sampling sites, the
estimated volume of wood present in forests at village Shakti was maximum
(179.49 m3/ha) followed by forest in catchment area (161.94 m3/ha). The details
are given in Tables-6.7 and 6.8. The density in dam site and submergence area
was 21.38 m3/ha and 45.69 m3/ha.
TABLE-6.7
Estimated volume of wood (m3/ha) at different sampling sites
Species Catchment
site Submergence
site Dam site Alnus nepalensis 32.69 15.86 Betula alnoides 0.96 Cryptomeria japonica 2.67 Cupressus torulosa 1.17 5.75 Engelhardtia spicata 14.67 Erythirina arborescens 4.51 Ficus sp. 1.76
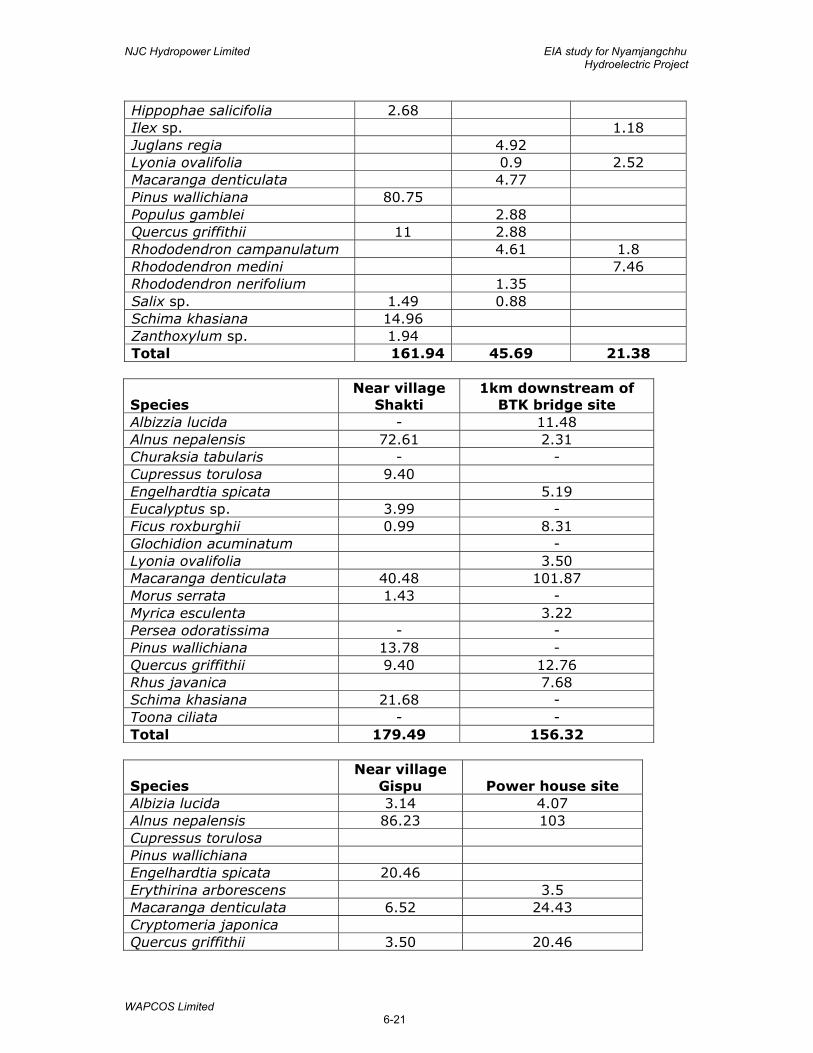
NJC Hydropower Limited EIA study for Nyamjangchhu Hydroelectric Project
WAPCOS Limited 6-21
Hippophae salicifolia 2.68 Ilex sp. 1.18 Juglans regia 4.92 Lyonia ovalifolia 0.9 2.52 Macaranga denticulata 4.77 Pinus wallichiana 80.75 Populus gamblei 2.88 Quercus griffithii 11 2.88 Rhododendron campanulatum 4.61 1.8 Rhododendron medini 7.46 Rhododendron nerifolium 1.35 Salix sp. 1.49 0.88 Schima khasiana 14.96 Zanthoxylum sp. 1.94 Total 161.94 45.69 21.38
Species Near village
Shakti 1km downstream of
BTK bridge site Albizzia lucida - 11.48 Alnus nepalensis 72.61 2.31 Churaksia tabularis - - Cupressus torulosa 9.40 Engelhardtia spicata 5.19 Eucalyptus sp. 3.99 - Ficus roxburghii 0.99 8.31 Glochidion acuminatum - Lyonia ovalifolia 3.50 Macaranga denticulata 40.48 101.87 Morus serrata 1.43 - Myrica esculenta 3.22 Persea odoratissima - - Pinus wallichiana 13.78 - Quercus griffithii 9.40 12.76 Rhus javanica 7.68 Schima khasiana 21.68 - Toona ciliata - - Total 179.49 156.32
Species Near village
Gispu Power house site Albizia lucida 3.14 4.07 Alnus nepalensis 86.23 103 Cupressus torulosa Pinus wallichiana Engelhardtia spicata 20.46 Erythirina arborescens 3.5 Macaranga denticulata 6.52 24.43 Cryptomeria japonica Quercus griffithii 3.50 20.46
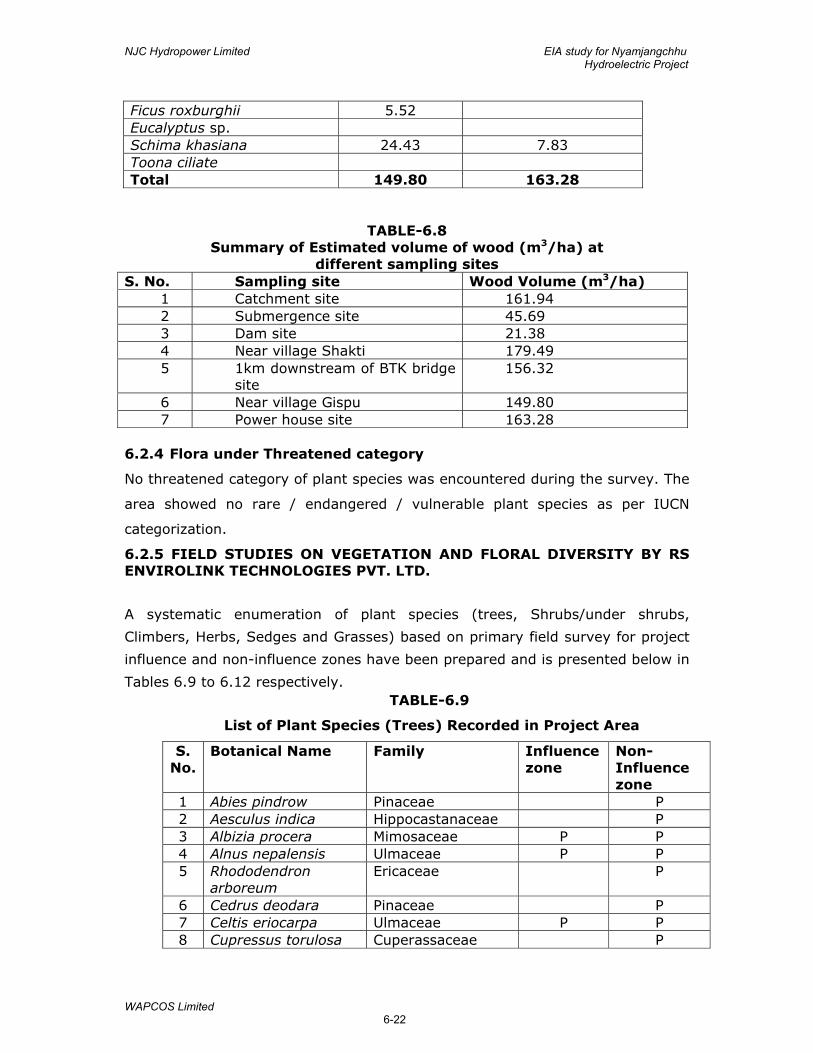
NJC Hydropower Limited EIA study for Nyamjangchhu Hydroelectric Project
WAPCOS Limited 6-22
Ficus roxburghii 5.52 Eucalyptus sp. Schima khasiana 24.43 7.83 Toona ciliate Total 149.80 163.28
TABLE-6.8 Summary of Estimated volume of wood (m3/ha) at
different sampling sites S. No. Sampling site Wood Volume (m3/ha)
1 Catchment site 161.94 2 Submergence site 45.69 3 Dam site 21.38 4 Near village Shakti 179.49 5 1km downstream of BTK bridge
site 156.32
6 Near village Gispu 149.80 7 Power house site 163.28
6.2.4 Flora under Threatened category
No threatened category of plant species was encountered during the survey. The
area showed no rare / endangered / vulnerable plant species as per IUCN
categorization.
6.2.5 FIELD STUDIES ON VEGETATION AND FLORAL DIVERSITY BY RS ENVIROLINK TECHNOLOGIES PVT. LTD.
A systematic enumeration of plant species (trees, Shrubs/under shrubs,
Climbers, Herbs, Sedges and Grasses) based on primary field survey for project
influence and non-influence zones have been prepared and is presented below in
Tables 6.9 to 6.12 respectively. TABLE-6.9
List of Plant Species (Trees) Recorded in Project Area
S. No.
Botanical Name Family Influence zone
Non-Influence zone
1 Abies pindrow Pinaceae P 2 Aesculus indica Hippocastanaceae P 3 Albizia procera Mimosaceae P P 4 Alnus nepalensis Ulmaceae P P 5 Rhododendron
arboreum Ericaceae P
6 Cedrus deodara Pinaceae P 7 Celtis eriocarpa Ulmaceae P P 8 Cupressus torulosa Cuperassaceae P
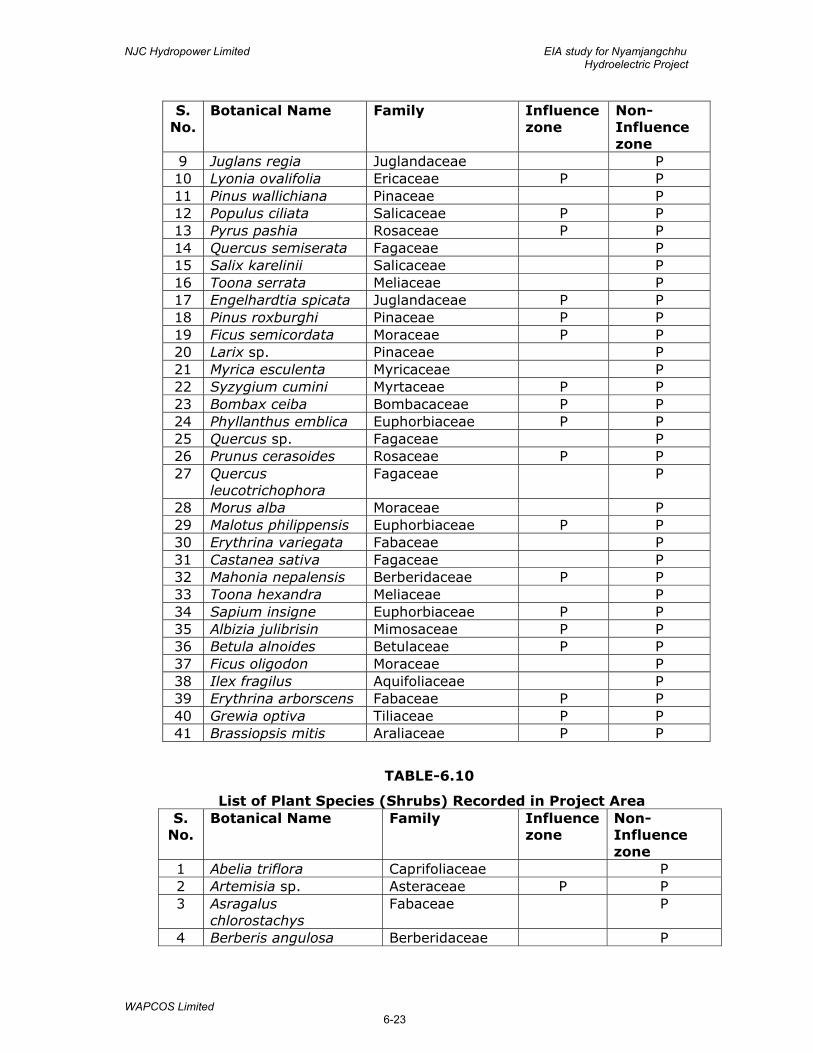
NJC Hydropower Limited EIA study for Nyamjangchhu Hydroelectric Project
WAPCOS Limited 6-23
S. No.
Botanical Name Family Influence zone
Non-Influence zone
9 Juglans regia Juglandaceae P 10 Lyonia ovalifolia Ericaceae P P 11 Pinus wallichiana Pinaceae P 12 Populus ciliata Salicaceae P P 13 Pyrus pashia Rosaceae P P 14 Quercus semiserata Fagaceae P 15 Salix karelinii Salicaceae P 16 Toona serrata Meliaceae P 17 Engelhardtia spicata Juglandaceae P P 18 Pinus roxburghi Pinaceae P P 19 Ficus semicordata Moraceae P P 20 Larix sp. Pinaceae P 21 Myrica esculenta Myricaceae P 22 Syzygium cumini Myrtaceae P P 23 Bombax ceiba Bombacaceae P P 24 Phyllanthus emblica Euphorbiaceae P P 25 Quercus sp. Fagaceae P 26 Prunus cerasoides Rosaceae P P 27 Quercus
leucotrichophora Fagaceae P
28 Morus alba Moraceae P 29 Malotus philippensis Euphorbiaceae P P 30 Erythrina variegata Fabaceae P 31 Castanea sativa Fagaceae P 32 Mahonia nepalensis Berberidaceae P P 33 Toona hexandra Meliaceae P 34 Sapium insigne Euphorbiaceae P P 35 Albizia julibrisin Mimosaceae P P 36 Betula alnoides Betulaceae P P 37 Ficus oligodon Moraceae P 38 Ilex fragilus Aquifoliaceae P 39 Erythrina arborscens Fabaceae P P 40 Grewia optiva Tiliaceae P P 41 Brassiopsis mitis Araliaceae P P
TABLE-6.10
List of Plant Species (Shrubs) Recorded in Project Area S.
No. Botanical Name Family Influence
zone Non-Influence zone
1 Abelia triflora Caprifoliaceae P 2 Artemisia sp. Asteraceae P P 3 Asragalus
chlorostachys Fabaceae P
4 Berberis angulosa Berberidaceae P
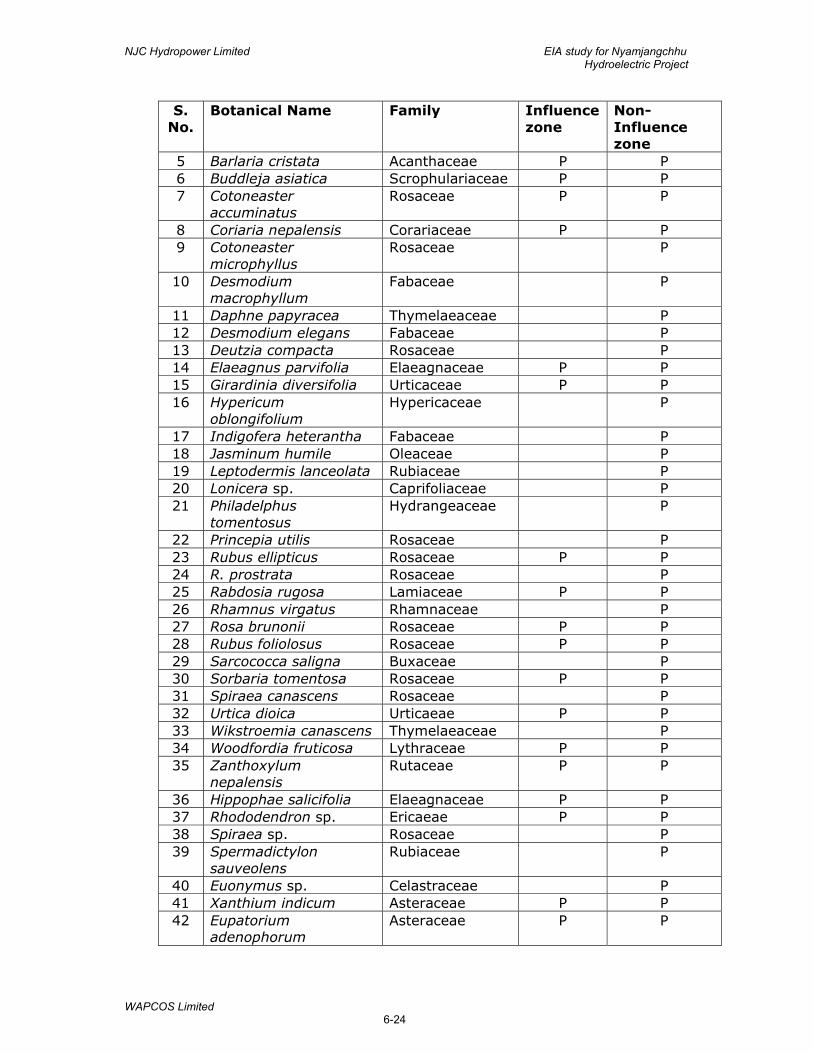
NJC Hydropower Limited EIA study for Nyamjangchhu Hydroelectric Project
WAPCOS Limited 6-24
S. No.
Botanical Name Family Influence zone
Non-Influence zone
5 Barlaria cristata Acanthaceae P P 6 Buddleja asiatica Scrophulariaceae P P 7 Cotoneaster
accuminatus Rosaceae P P
8 Coriaria nepalensis Corariaceae P P 9 Cotoneaster
microphyllus Rosaceae P
10 Desmodium macrophyllum
Fabaceae P
11 Daphne papyracea Thymelaeaceae P 12 Desmodium elegans Fabaceae P 13 Deutzia compacta Rosaceae P 14 Elaeagnus parvifolia Elaeagnaceae P P 15 Girardinia diversifolia Urticaceae P P 16 Hypericum
oblongifolium Hypericaceae P
17 Indigofera heterantha Fabaceae P 18 Jasminum humile Oleaceae P 19 Leptodermis lanceolata Rubiaceae P 20 Lonicera sp. Caprifoliaceae P 21 Philadelphus
tomentosus Hydrangeaceae P
22 Princepia utilis Rosaceae P 23 Rubus ellipticus Rosaceae P P 24 R. prostrata Rosaceae P 25 Rabdosia rugosa Lamiaceae P P 26 Rhamnus virgatus Rhamnaceae P 27 Rosa brunonii Rosaceae P P 28 Rubus foliolosus Rosaceae P P 29 Sarcococca saligna Buxaceae P 30 Sorbaria tomentosa Rosaceae P P 31 Spiraea canascens Rosaceae P 32 Urtica dioica Urticaeae P P 33 Wikstroemia canascens Thymelaeaceae P 34 Woodfordia fruticosa Lythraceae P P 35 Zanthoxylum
nepalensis Rutaceae P P
36 Hippophae salicifolia Elaeagnaceae P P 37 Rhododendron sp. Ericaeae P P 38 Spiraea sp. Rosaceae P 39 Spermadictylon
sauveolens Rubiaceae P
40 Euonymus sp. Celastraceae P 41 Xanthium indicum Asteraceae P P 42 Eupatorium
adenophorum Asteraceae P P
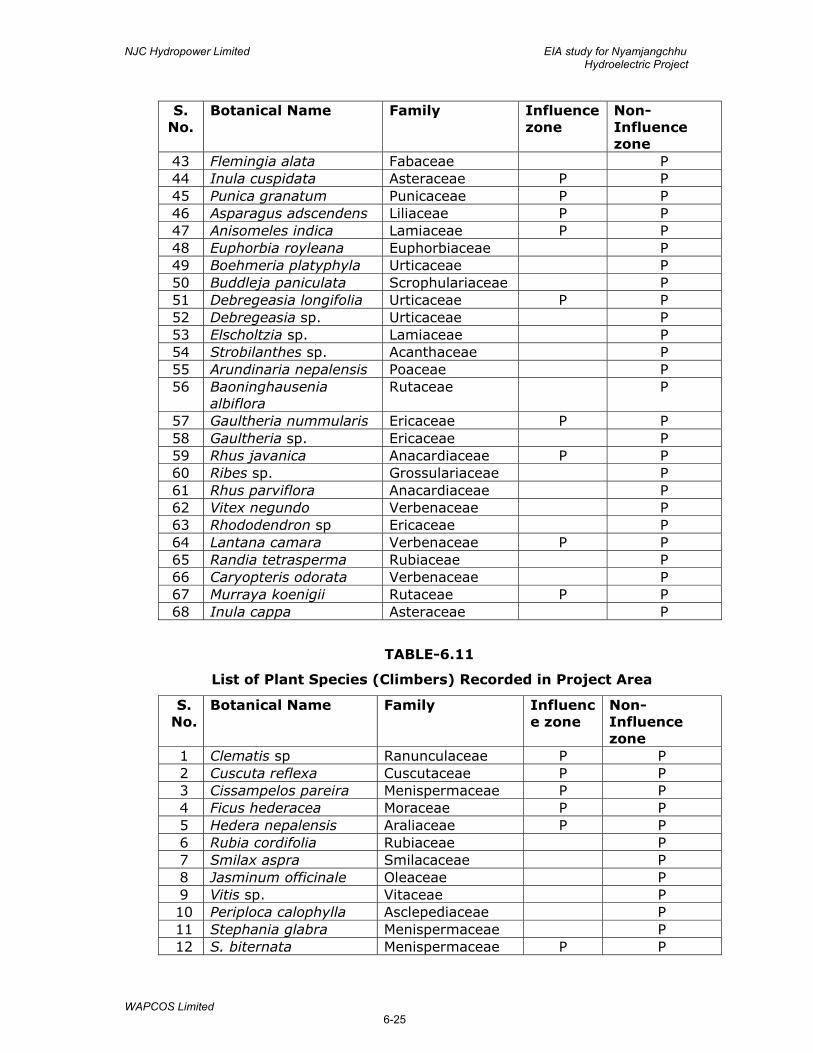
NJC Hydropower Limited EIA study for Nyamjangchhu Hydroelectric Project
WAPCOS Limited 6-25
S. No.
Botanical Name Family Influence zone
Non-Influence zone
43 Flemingia alata Fabaceae P 44 Inula cuspidata Asteraceae P P 45 Punica granatum Punicaceae P P 46 Asparagus adscendens Liliaceae P P 47 Anisomeles indica Lamiaceae P P 48 Euphorbia royleana Euphorbiaceae P 49 Boehmeria platyphyla Urticaceae P 50 Buddleja paniculata Scrophulariaceae P 51 Debregeasia longifolia Urticaceae P P 52 Debregeasia sp. Urticaceae P 53 Elscholtzia sp. Lamiaceae P 54 Strobilanthes sp. Acanthaceae P 55 Arundinaria nepalensis Poaceae P 56 Baoninghausenia
albiflora Rutaceae P
57 Gaultheria nummularis Ericaceae P P 58 Gaultheria sp. Ericaceae P 59 Rhus javanica Anacardiaceae P P 60 Ribes sp. Grossulariaceae P 61 Rhus parviflora Anacardiaceae P 62 Vitex negundo Verbenaceae P 63 Rhododendron sp Ericaceae P 64 Lantana camara Verbenaceae P P 65 Randia tetrasperma Rubiaceae P 66 Caryopteris odorata Verbenaceae P 67 Murraya koenigii Rutaceae P P 68 Inula cappa Asteraceae P
TABLE-6.11
List of Plant Species (Climbers) Recorded in Project Area
S. No.
Botanical Name Family Influence zone
Non-Influence zone
1 Clematis sp Ranunculaceae P P 2 Cuscuta reflexa Cuscutaceae P P 3 Cissampelos pareira Menispermaceae P P 4 Ficus hederacea Moraceae P P 5 Hedera nepalensis Araliaceae P P 6 Rubia cordifolia Rubiaceae P 7 Smilax aspra Smilacaceae P 8 Jasminum officinale Oleaceae P 9 Vitis sp. Vitaceae P 10 Periploca calophylla Asclepediaceae P 11 Stephania glabra Menispermaceae P 12 S. biternata Menispermaceae P P
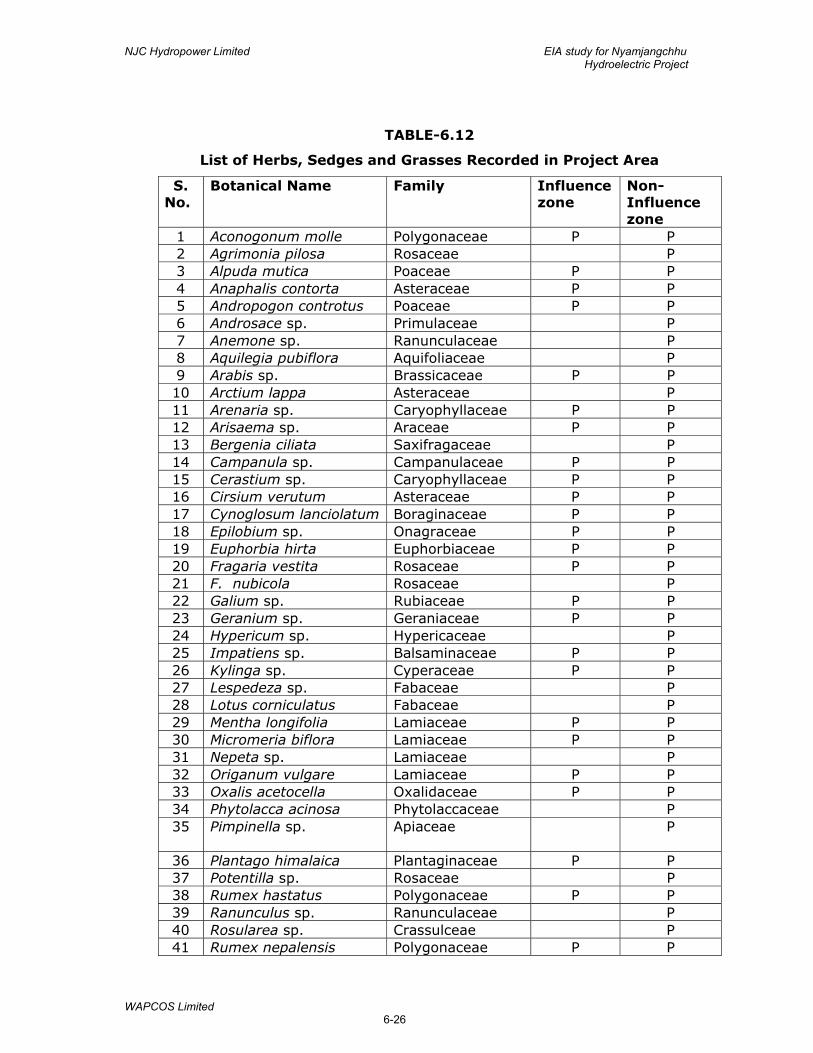
NJC Hydropower Limited EIA study for Nyamjangchhu Hydroelectric Project
WAPCOS Limited 6-26
TABLE-6.12
List of Herbs, Sedges and Grasses Recorded in Project Area
S. No.
Botanical Name Family Influence zone
Non-Influence zone
1 Aconogonum molle Polygonaceae P P 2 Agrimonia pilosa Rosaceae P 3 Alpuda mutica Poaceae P P 4 Anaphalis contorta Asteraceae P P 5 Andropogon controtus Poaceae P P 6 Androsace sp. Primulaceae P 7 Anemone sp. Ranunculaceae P 8 Aquilegia pubiflora Aquifoliaceae P 9 Arabis sp. Brassicaceae P P 10 Arctium lappa Asteraceae P 11 Arenaria sp. Caryophyllaceae P P 12 Arisaema sp. Araceae P P 13 Bergenia ciliata Saxifragaceae P 14 Campanula sp. Campanulaceae P P 15 Cerastium sp. Caryophyllaceae P P 16 Cirsium verutum Asteraceae P P 17 Cynoglosum lanciolatum Boraginaceae P P 18 Epilobium sp. Onagraceae P P 19 Euphorbia hirta Euphorbiaceae P P 20 Fragaria vestita Rosaceae P P 21 F. nubicola Rosaceae P 22 Galium sp. Rubiaceae P P 23 Geranium sp. Geraniaceae P P 24 Hypericum sp. Hypericaceae P 25 Impatiens sp. Balsaminaceae P P 26 Kylinga sp. Cyperaceae P P 27 Lespedeza sp. Fabaceae P 28 Lotus corniculatus Fabaceae P 29 Mentha longifolia Lamiaceae P P 30 Micromeria biflora Lamiaceae P P 31 Nepeta sp. Lamiaceae P 32 Origanum vulgare Lamiaceae P P 33 Oxalis acetocella Oxalidaceae P P 34 Phytolacca acinosa Phytolaccaceae P 35 Pimpinella sp. Apiaceae P
36 Plantago himalaica Plantaginaceae P P 37 Potentilla sp. Rosaceae P 38 Rumex hastatus Polygonaceae P P 39 Ranunculus sp. Ranunculaceae P 40 Rosularea sp. Crassulceae P 41 Rumex nepalensis Polygonaceae P P
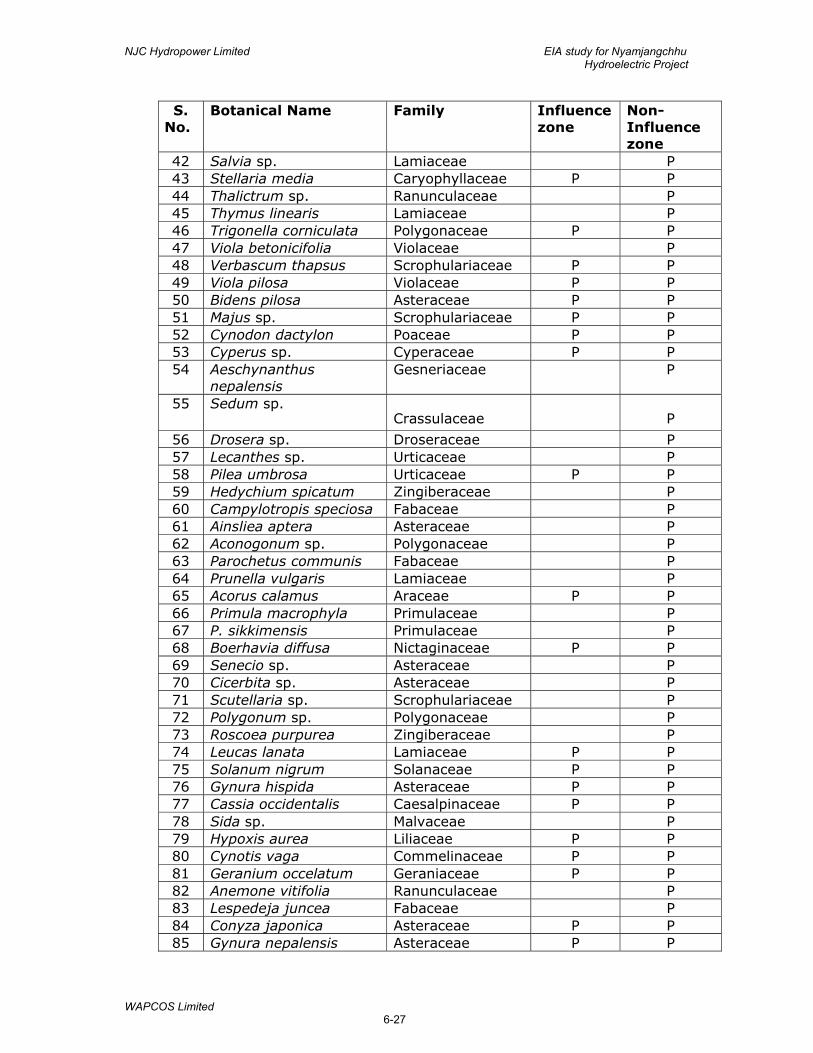
NJC Hydropower Limited EIA study for Nyamjangchhu Hydroelectric Project
WAPCOS Limited 6-27
S. No.
Botanical Name Family Influence zone
Non-Influence zone
42 Salvia sp. Lamiaceae P 43 Stellaria media Caryophyllaceae P P 44 Thalictrum sp. Ranunculaceae P 45 Thymus linearis Lamiaceae P 46 Trigonella corniculata Polygonaceae P P 47 Viola betonicifolia Violaceae P 48 Verbascum thapsus Scrophulariaceae P P 49 Viola pilosa Violaceae P P 50 Bidens pilosa Asteraceae P P 51 Majus sp. Scrophulariaceae P P 52 Cynodon dactylon Poaceae P P 53 Cyperus sp. Cyperaceae P P 54 Aeschynanthus
nepalensis Gesneriaceae P
55 Sedum sp. Crassulaceae P
56 Drosera sp. Droseraceae P 57 Lecanthes sp. Urticaceae P 58 Pilea umbrosa Urticaceae P P 59 Hedychium spicatum Zingiberaceae P 60 Campylotropis speciosa Fabaceae P 61 Ainsliea aptera Asteraceae P 62 Aconogonum sp. Polygonaceae P 63 Parochetus communis Fabaceae P 64 Prunella vulgaris Lamiaceae P 65 Acorus calamus Araceae P P 66 Primula macrophyla Primulaceae P 67 P. sikkimensis Primulaceae P 68 Boerhavia diffusa Nictaginaceae P P 69 Senecio sp. Asteraceae P 70 Cicerbita sp. Asteraceae P 71 Scutellaria sp. Scrophulariaceae P 72 Polygonum sp. Polygonaceae P 73 Roscoea purpurea Zingiberaceae P 74 Leucas lanata Lamiaceae P P 75 Solanum nigrum Solanaceae P P 76 Gynura hispida Asteraceae P P 77 Cassia occidentalis Caesalpinaceae P P 78 Sida sp. Malvaceae P 79 Hypoxis aurea Liliaceae P P 80 Cynotis vaga Commelinaceae P P 81 Geranium occelatum Geraniaceae P P 82 Anemone vitifolia Ranunculaceae P 83 Lespedeja juncea Fabaceae P 84 Conyza japonica Asteraceae P P 85 Gynura nepalensis Asteraceae P P
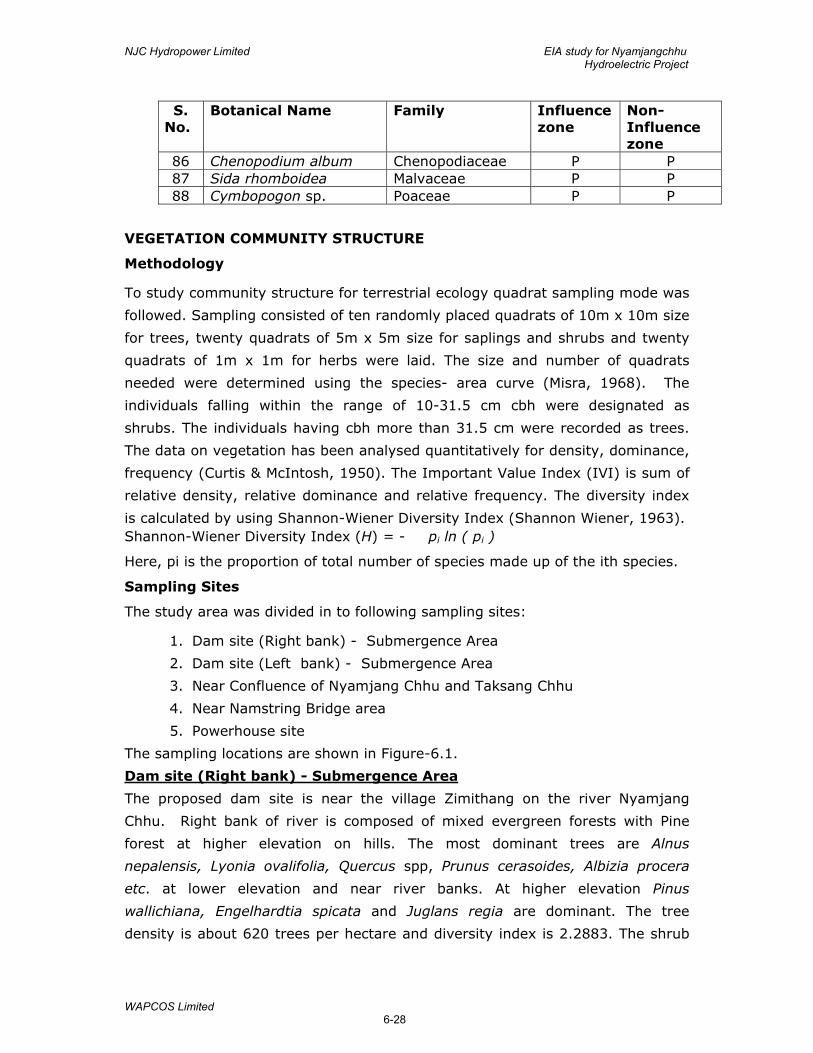
NJC Hydropower Limited EIA study for Nyamjangchhu Hydroelectric Project
WAPCOS Limited 6-28
S. No.
Botanical Name Family Influence zone
Non-Influence zone
86 Chenopodium album Chenopodiaceae P P 87 Sida rhomboidea Malvaceae P P 88 Cymbopogon sp. Poaceae P P
VEGETATION COMMUNITY STRUCTURE
Methodology
To study community structure for terrestrial ecology quadrat sampling mode was
followed. Sampling consisted of ten randomly placed quadrats of 10m x 10m size
for trees, twenty quadrats of 5m x 5m size for saplings and shrubs and twenty
quadrats of 1m x 1m for herbs were laid. The size and number of quadrats
needed were determined using the species- area curve (Misra, 1968). The
individuals falling within the range of 10-31.5 cm cbh were designated as
shrubs. The individuals having cbh more than 31.5 cm were recorded as trees.
The data on vegetation has been analysed quantitatively for density, dominance,
frequency (Curtis & McIntosh, 1950). The Important Value Index (IVI) is sum of
relative density, relative dominance and relative frequency. The diversity index
is calculated by using Shannon-Wiener Diversity Index (Shannon Wiener, 1963). Shannon-Wiener Diversity Index (H) = - � pi ln ( pi )
Here, pi is the proportion of total number of species made up of the ith species.
Sampling Sites
The study area was divided in to following sampling sites:
1. Dam site (Right bank) - Submergence Area
2. Dam site (Left bank) - Submergence Area
3. Near Confluence of Nyamjang Chhu and Taksang Chhu
4. Near Namstring Bridge area
5. Powerhouse site
The sampling locations are shown in Figure-6.1.
Dam site (Right bank) - Submergence Area
The proposed dam site is near the village Zimithang on the river Nyamjang
Chhu. Right bank of river is composed of mixed evergreen forests with Pine
forest at higher elevation on hills. The most dominant trees are Alnus
nepalensis, Lyonia ovalifolia, Quercus spp, Prunus cerasoides, Albizia procera
etc. at lower elevation and near river banks. At higher elevation Pinus
wallichiana, Engelhardtia spicata and Juglans regia are dominant. The tree
density is about 620 trees per hectare and diversity index is 2.2883. The shrub

NJC Hydropower Limited EIA study for Nyamjangchhu Hydroelectric Project
WAPCOS Limited 6-29
layer is composed of Elaeagnus parviflora the most dominanting nearby the river
basin. Other common shrub species are Artemisia nilagirica, Indigofera
heterantha, Rhus javanica, Rubus ellipticus, Zanthoxylum nepalensis,
Rhododendron sp. Hippophae salicifolia, Gaultheria fragrantissima, Rubus sp.
The most common shrubs on hill are Rhododendron sp., Gultheria
fragrantissima, Deberegeasia longifolia, Arundinaria nepalensis, etc. On the right
bank among herbs Impatiens sp,. Gallium sp., Chenopodium album and
Polygonum sp. show high dominance. Arenaia sp., Bidens pilosa, Euphorbia
hirta, Verbascum thapsus, etc are found with moderate dominance. Dam site (Left bank) - Submergence Area
The left bank of river is scrub land on the hills and degraded vegetation is found
near by the river basin. Elaeagnus parviflora also dominantes the left bank of
the river followed by shrubs like Artemisia nilagirica, Indigofera heterantha, Rhus
javanica, Rubus ellipticus, Zanthoxylum nepalensis and Rhododendron sp.
Hippophae salicifolia, Gaultheria fragrantissima, Rubus sp. etc.
The herbs layer is prominent on the left bank of the river. Acorus calamus is
most dominant with Agrimonia pilosa, Arenaria sp, Fragaria vestita, Gallium sp,
Parocheus communis, Rumex nepalensis, Viola betonicifolia, etc.
Near Confluence of Nyamjang Chhu and Taksang Chhu
The area is with mixed moist deciduous forests on both the sides of the River
bank. The study was carried out on the left bank of the Nyamjang Chhu river. In
tree composition Lyonia ovalifolia, and Alnus nepalensis are most frequent with
Engelhardtia spicata, Albizia procera, Juglans regia, Mahonia alba and Toona
serrata are found with moderate dominance.
In shrub layer Aconogonum sp. is present with maximum dominance and
frequently found on the right bank of the Nyamjang Chhu River, in association
with Artemisia nilagirica which is frequent on road side, agricultural boundary
and near human habitat. Debregeasia longifolia, Gaultheria fragrantissima,
Rubus sp., Spiraea sp., and Xanthium indicum are moderately present. Near Namstring Bridge Area
The hills are with grasses and sparse shrubs and trees near by the ridges. The
shrub layer is only prominent near the river banks. The dominant shrubs are
Artemisia nilagirica, Lantana camara on river bank because of human habitation.
The other common shrubs are Woodfordia fructicosa, Murraya koenigii,
Zanthoxylum nepalensis, Punica granatum and Rubus ellipticus. The most
dominant Sedges on the hills are Lemon grass (Cymbopogon flexuosus) with
small trees of aonla (Phyllanthus emblica).
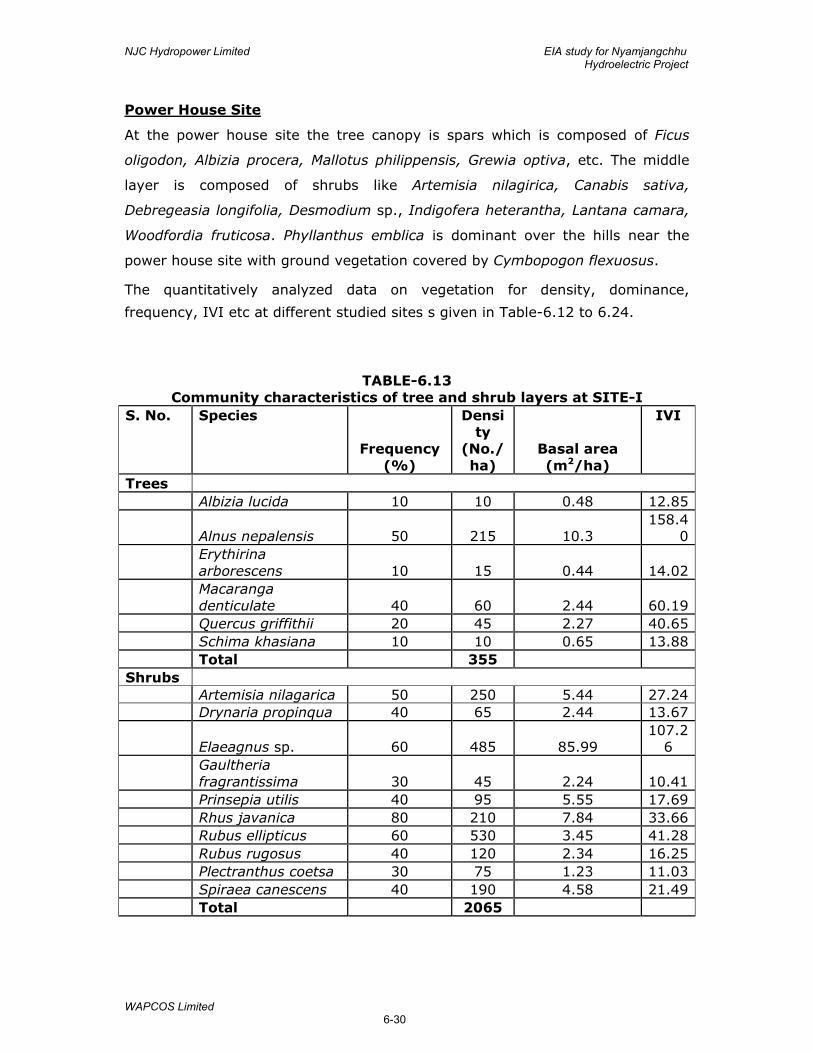
NJC Hydropower Limited EIA study for Nyamjangchhu Hydroelectric Project
WAPCOS Limited 6-30
Power House Site
At the power house site the tree canopy is spars which is composed of Ficus
oligodon, Albizia procera, Mallotus philippensis, Grewia optiva, etc. The middle
layer is composed of shrubs like Artemisia nilagirica, Canabis sativa,
Debregeasia longifolia, Desmodium sp., Indigofera heterantha, Lantana camara,
Woodfordia fruticosa. Phyllanthus emblica is dominant over the hills near the
power house site with ground vegetation covered by Cymbopogon flexuosus.
The quantitatively analyzed data on vegetation for density, dominance,
frequency, IVI etc at different studied sites s given in Table-6.12 to 6.24.
TABLE-6.13 Community characteristics of tree and shrub layers at SITE-I
S. No. Species
Frequency (%)
Density
(No./ha)
Basal area (m2/ha)
IVI
Trees Albizia lucida 10 10 0.48 12.85
Alnus nepalensis 50 215 10.3 158.4
0 Erythirina
arborescens 10 15 0.44 14.02 Macaranga
denticulate 40 60 2.44 60.19 Quercus griffithii 20 45 2.27 40.65 Schima khasiana 10 10 0.65 13.88 Total 355 Shrubs Artemisia nilagarica 50 250 5.44 27.24 Drynaria propinqua 40 65 2.44 13.67
Elaeagnus sp. 60 485 85.99 107.2
6 Gaultheria
fragrantissima 30 45 2.24 10.41 Prinsepia utilis 40 95 5.55 17.69 Rhus javanica 80 210 7.84 33.66 Rubus ellipticus 60 530 3.45 41.28 Rubus rugosus 40 120 2.34 16.25 Plectranthus coetsa 30 75 1.23 11.03 Spiraea canescens 40 190 4.58 21.49 Total 2065

NJC Hydropower Limited EIA study for Nyamjangchhu Hydroelectric Project
WAPCOS Limited 6-31
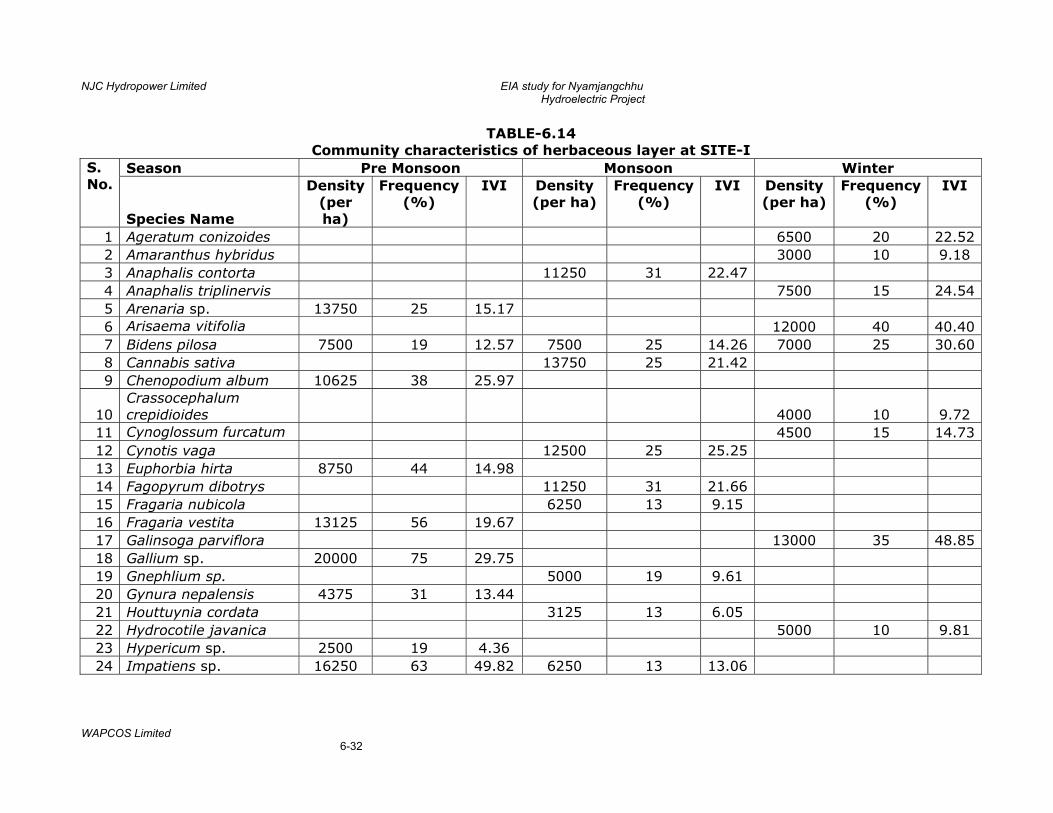
NJC Hydropower Limited EIA study for Nyamjangchhu Hydroelectric Project
WAPCOS Limited 6-32
TABLE-6.14 Community characteristics of herbaceous layer at SITE-I
S. No.
Season Pre Monsoon Monsoon Winter
Species Name
Density (per ha)
Frequency (%)
IVI Density (per ha)
Frequency (%)
IVI Density (per ha)
Frequency (%)
IVI
1 Ageratum conizoides 6500 20 22.52 2 Amaranthus hybridus 3000 10 9.18 3 Anaphalis contorta 11250 31 22.47 4 Anaphalis triplinervis 7500 15 24.54 5 Arenaria sp. 13750 25 15.17 6 Arisaema vitifolia 12000 40 40.40 7 Bidens pilosa 7500 19 12.57 7500 25 14.26 7000 25 30.60 8 Cannabis sativa 13750 25 21.42 9 Chenopodium album 10625 38 25.97
10 Crassocephalum crepidioides 4000 10 9.72
11 Cynoglossum furcatum 4500 15 14.73 12 Cynotis vaga 12500 25 25.25 13 Euphorbia hirta 8750 44 14.98 14 Fagopyrum dibotrys 11250 31 21.66 15 Fragaria nubicola 6250 13 9.15 16 Fragaria vestita 13125 56 19.67 17 Galinsoga parviflora 13000 35 48.85 18 Gallium sp. 20000 75 29.75 19 Gnephlium sp. 5000 19 9.61 20 Gynura nepalensis 4375 31 13.44 21 Houttuynia cordata 3125 13 6.05 22 Hydrocotile javanica 5000 10 9.81 23 Hypericum sp. 2500 19 4.36 24 Impatiens sp. 16250 63 49.82 6250 13 13.06
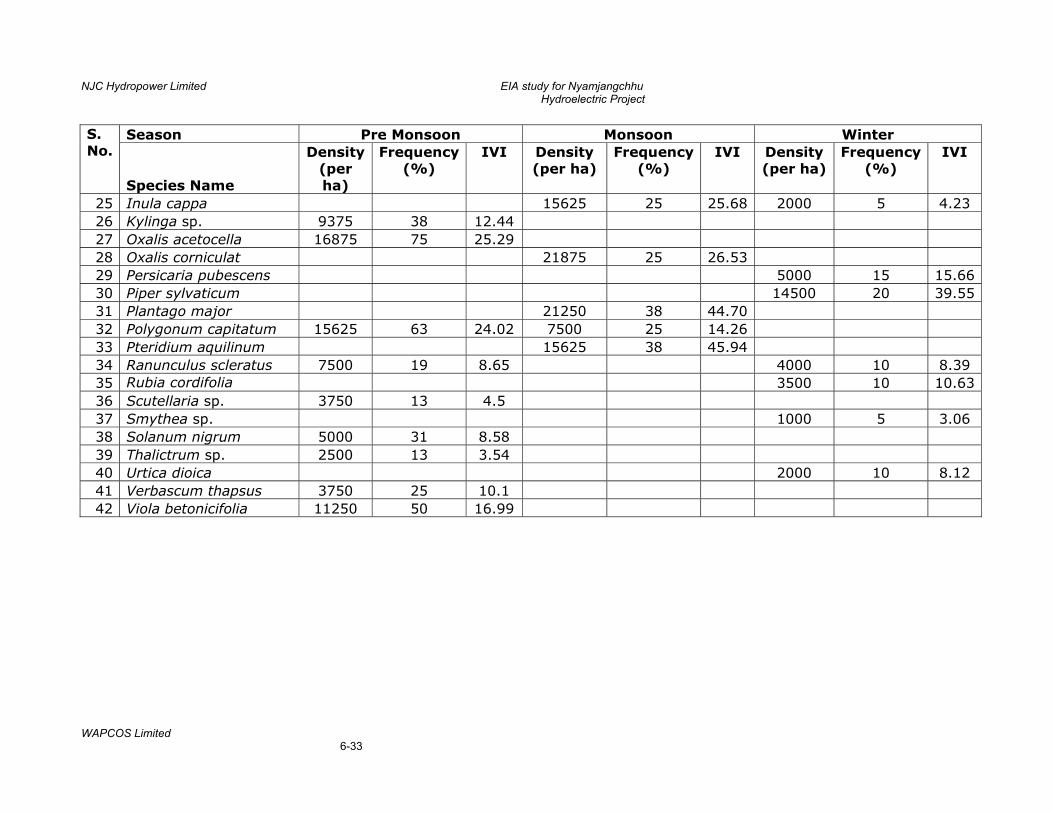
NJC Hydropower Limited EIA study for Nyamjangchhu Hydroelectric Project
WAPCOS Limited 6-33
S. No.
Season Pre Monsoon Monsoon Winter
Species Name
Density (per ha)
Frequency (%)
IVI Density (per ha)
Frequency (%)
IVI Density (per ha)
Frequency (%)
IVI
25 Inula cappa 15625 25 25.68 2000 5 4.23 26 Kylinga sp. 9375 38 12.44 27 Oxalis acetocella 16875 75 25.29 28 Oxalis corniculat 21875 25 26.53 29 Persicaria pubescens 5000 15 15.66 30 Piper sylvaticum 14500 20 39.55 31 Plantago major 21250 38 44.70 32 Polygonum capitatum 15625 63 24.02 7500 25 14.26 33 Pteridium aquilinum 15625 38 45.94 34 Ranunculus scleratus 7500 19 8.65 4000 10 8.39 35 Rubia cordifolia 3500 10 10.63 36 Scutellaria sp. 3750 13 4.5 37 Smythea sp. 1000 5 3.06 38 Solanum nigrum 5000 31 8.58 39 Thalictrum sp. 2500 13 3.54 40 Urtica dioica 2000 10 8.12 41 Verbascum thapsus 3750 25 10.1 42 Viola betonicifolia 11250 50 16.99
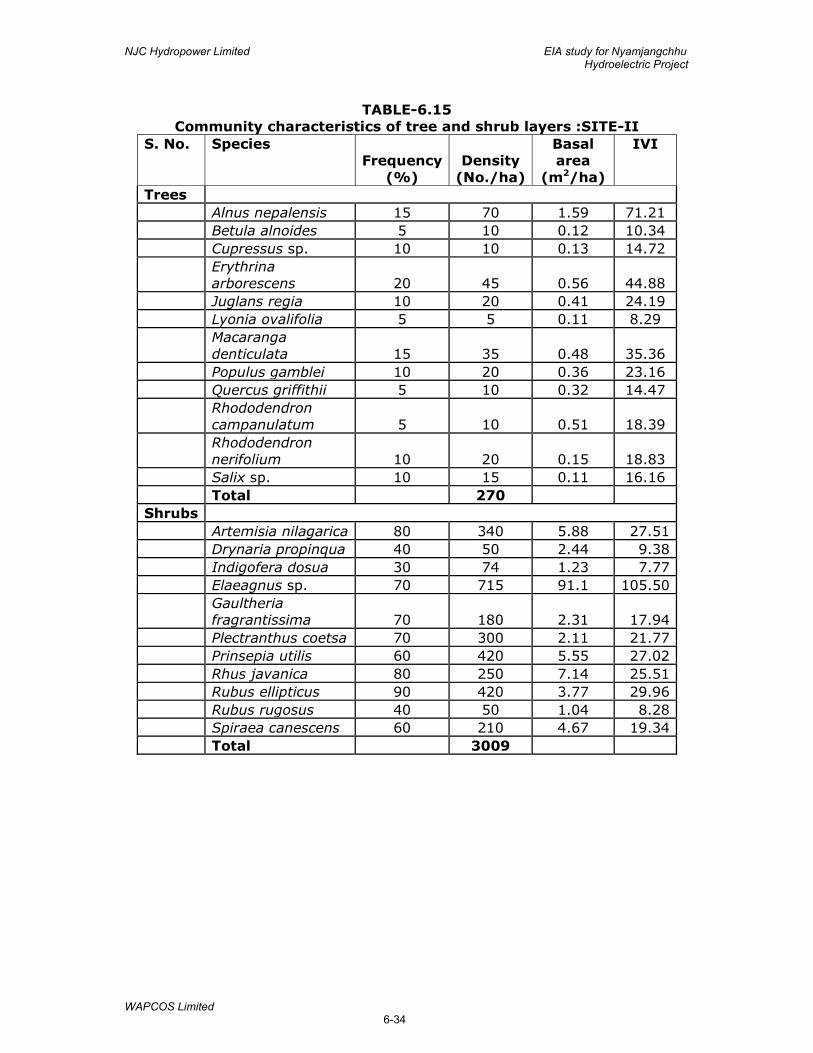
NJC Hydropower Limited EIA study for Nyamjangchhu Hydroelectric Project
WAPCOS Limited 6-34
TABLE-6.15 Community characteristics of tree and shrub layers :SITE-II
S. No. Species Frequency
(%) Density
(No./ha)
Basal area
(m2/ha)
IVI
Trees Alnus nepalensis 15 70 1.59 71.21 Betula alnoides 5 10 0.12 10.34 Cupressus sp. 10 10 0.13 14.72 Erythrina
arborescens 20 45 0.56 44.88 Juglans regia 10 20 0.41 24.19 Lyonia ovalifolia 5 5 0.11 8.29 Macaranga
denticulata 15 35 0.48 35.36 Populus gamblei 10 20 0.36 23.16 Quercus griffithii 5 10 0.32 14.47 Rhododendron
campanulatum 5 10 0.51 18.39 Rhododendron
nerifolium 10 20 0.15 18.83 Salix sp. 10 15 0.11 16.16 Total 270 Shrubs Artemisia nilagarica 80 340 5.88 27.51 Drynaria propinqua 40 50 2.44 9.38 Indigofera dosua 30 74 1.23 7.77 Elaeagnus sp. 70 715 91.1 105.50 Gaultheria
fragrantissima 70 180 2.31 17.94 Plectranthus coetsa 70 300 2.11 21.77 Prinsepia utilis 60 420 5.55 27.02 Rhus javanica 80 250 7.14 25.51 Rubus ellipticus 90 420 3.77 29.96 Rubus rugosus 40 50 1.04 8.28 Spiraea canescens 60 210 4.67 19.34 Total 3009
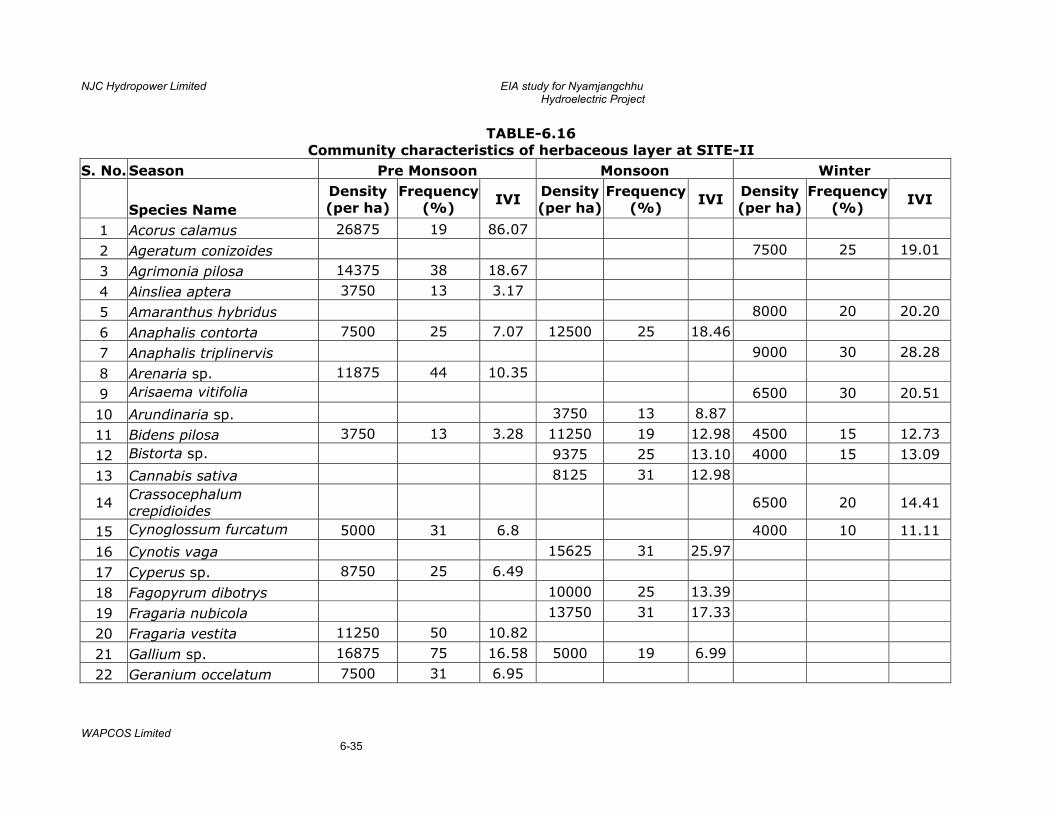
NJC Hydropower Limited EIA study for Nyamjangchhu Hydroelectric Project
WAPCOS Limited 6-35
TABLE-6.16 Community characteristics of herbaceous layer at SITE-II
S. No.Season Pre Monsoon Monsoon Winter
Species Name Density (per ha)
Frequency(%)
IVI Density (per ha)
Frequency (%)
IVI Density (per ha)
Frequency(%)
IVI
1 Acorus calamus 26875 19 86.07
2 Ageratum conizoides 7500 25 19.01
3 Agrimonia pilosa 14375 38 18.67
4 Ainsliea aptera 3750 13 3.17
5 Amaranthus hybridus 8000 20 20.20
6 Anaphalis contorta 7500 25 7.07 12500 25 18.46
7 Anaphalis triplinervis 9000 30 28.28
8 Arenaria sp. 11875 44 10.35
9 Arisaema vitifolia 6500 30 20.51
10 Arundinaria sp. 3750 13 8.87
11 Bidens pilosa 3750 13 3.28 11250 19 12.98 4500 15 12.73
12 Bistorta sp. 9375 25 13.10 4000 15 13.09
13 Cannabis sativa 8125 31 12.98
14 Crassocephalum crepidioides
6500 20 14.41
15 Cynoglossum furcatum 5000 31 6.8 4000 10 11.11
16 Cynotis vaga 15625 31 25.97
17 Cyperus sp. 8750 25 6.49
18 Fagopyrum dibotrys 10000 25 13.39
19 Fragaria nubicola 13750 31 17.33
20 Fragaria vestita 11250 50 10.82
21 Gallium sp. 16875 75 16.58 5000 19 6.99
22 Geranium occelatum 7500 31 6.95
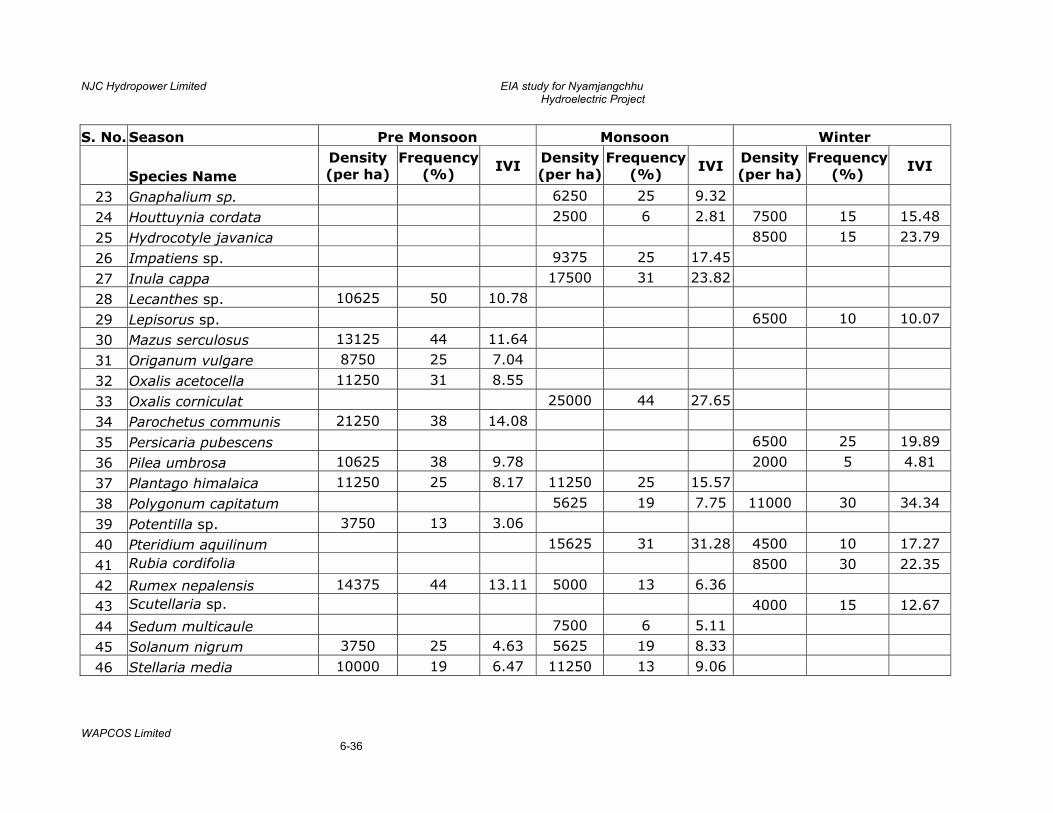
NJC Hydropower Limited EIA study for Nyamjangchhu Hydroelectric Project
WAPCOS Limited 6-36
S. No.Season Pre Monsoon Monsoon Winter
Species Name Density (per ha)
Frequency(%)
IVI Density (per ha)
Frequency (%)
IVI Density (per ha)
Frequency(%)
IVI
23 Gnaphalium sp. 6250 25 9.32
24 Houttuynia cordata 2500 6 2.81 7500 15 15.48
25 Hydrocotyle javanica 8500 15 23.79
26 Impatiens sp. 9375 25 17.45
27 Inula cappa 17500 31 23.82
28 Lecanthes sp. 10625 50 10.78
29 Lepisorus sp. 6500 10 10.07
30 Mazus serculosus 13125 44 11.64
31 Origanum vulgare 8750 25 7.04
32 Oxalis acetocella 11250 31 8.55
33 Oxalis corniculat 25000 44 27.65
34 Parochetus communis 21250 38 14.08
35 Persicaria pubescens 6500 25 19.89
36 Pilea umbrosa 10625 38 9.78 2000 5 4.81
37 Plantago himalaica 11250 25 8.17 11250 25 15.57
38 Polygonum capitatum 5625 19 7.75 11000 30 34.34
39 Potentilla sp. 3750 13 3.06
40 Pteridium aquilinum 15625 31 31.28 4500 10 17.27
41 Rubia cordifolia 8500 30 22.35
42 Rumex nepalensis 14375 44 13.11 5000 13 6.36
43 Scutellaria sp. 4000 15 12.67
44 Sedum multicaule 7500 6 5.11
45 Solanum nigrum 3750 25 4.63 5625 19 8.33
46 Stellaria media 10000 19 6.47 11250 13 9.06
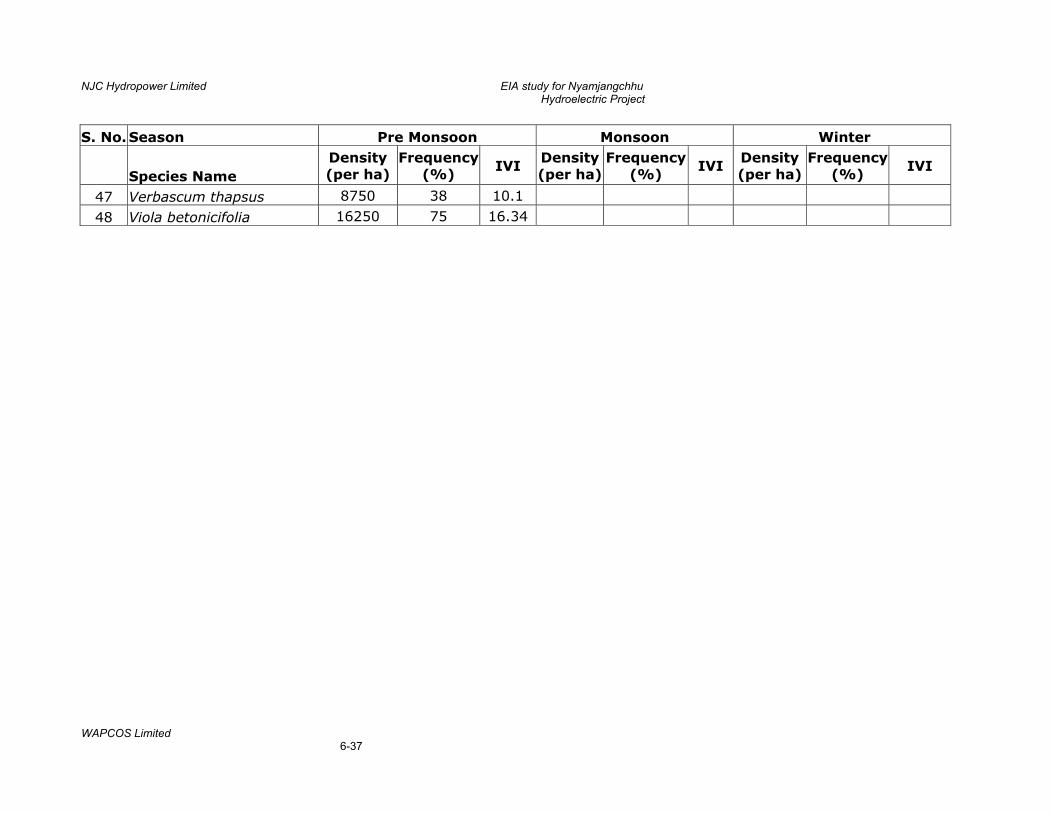
NJC Hydropower Limited EIA study for Nyamjangchhu Hydroelectric Project
WAPCOS Limited 6-37
S. No.Season Pre Monsoon Monsoon Winter
Species Name Density (per ha)
Frequency(%)
IVI Density (per ha)
Frequency (%)
IVI Density (per ha)
Frequency(%)
IVI
47 Verbascum thapsus 8750 38 10.1
48 Viola betonicifolia 16250 75 16.34

NJC Hydropower Limited EIA study for Nyamjangchhu Hydroelectric Project
WAPCOS Limited 6-38
TABLE-6.17 Community characteristics of tree and shrub layers: Site-III
Species Frequency (%)
Density (No./ha)
Basal area (m2/ha)
IVI
Trees Albizia lucida 25 40 1.15 31.16 Alnus nepalensis 25 35 0.29 24.62 Engelhardtia spicata 10 10 0.47 11.06 Ficus roxburghii 15 30 1.04 22.33 Lyonia ovalifolia 10 15 0.44 12.10 Macaranga denticulata 40 210 10.19 137.17 Myrica esculenta 10 10 0.38 10.51 Quercus griffithii 20 35 1.42 28.76 Rhus javanica 20 25 0.77 22.29 Shrubs Artemisia nilagirica 60 1190 7.22 49.99 Buddleja asiatica 60 720 2.14 31.62 Debregesia longifolia 20 20 1.01 4.74 Desmodium sp. 80 410 45.55 71.61 Elaeagnus sp. 40 30 2.01 9.19 Indigofera dosua 30 80 2.11 9.12 Measa indica 40 40 3.15 10.66 Neillia thyrsiflora 30 70 5.23 12.11 Plectranthus coetsa 70 300 3.77 23.22 Rubus ellipticus 40 390 2.14 19.33 Saccharum spontaneum 50 90 4.02 14.52 Schefflera venulosa 30 80 8.43 15.74 Spiraea canescens 30 40 3.93 9.92 Thysanolaena maxima 30 40 3.56 9.53 Viburnum erubescens 30 100 1.19 8.71
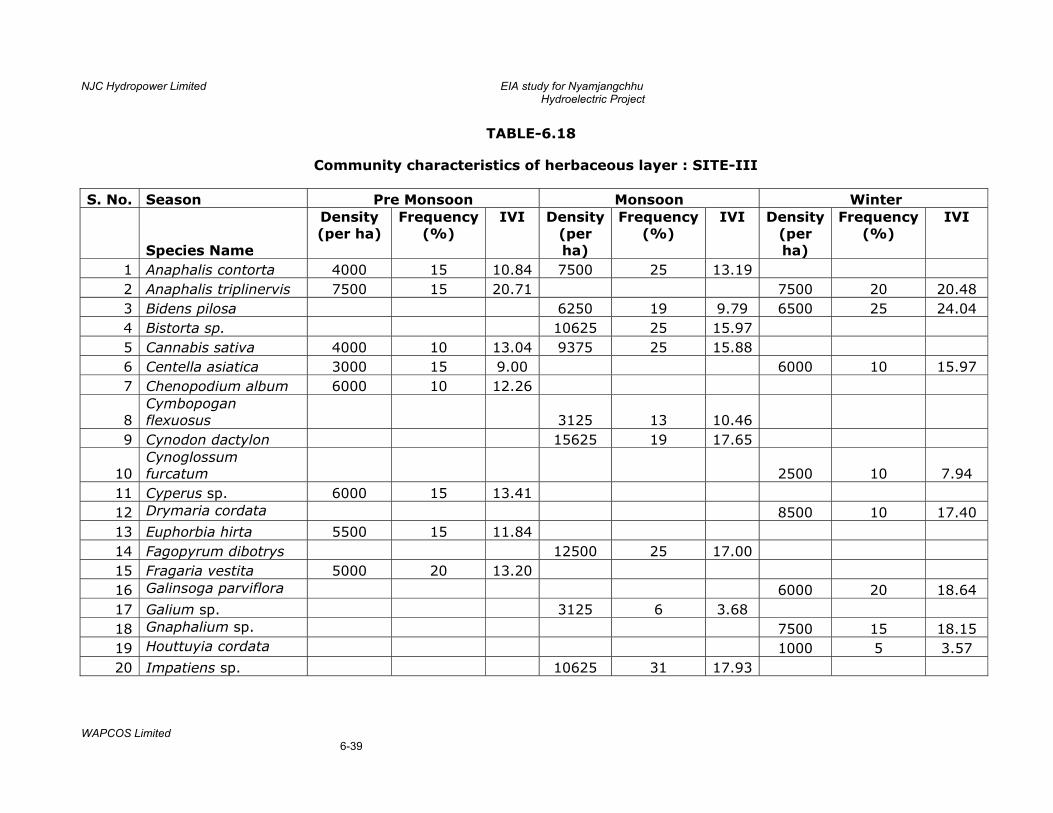
NJC Hydropower Limited EIA study for Nyamjangchhu Hydroelectric Project
WAPCOS Limited 6-39
TABLE-6.18
Community characteristics of herbaceous layer : SITE-III
S. No. Season Pre Monsoon Monsoon Winter
Species Name
Density (per ha)
Frequency (%)
IVI Density (per ha)
Frequency (%)
IVI Density (per ha)
Frequency (%)
IVI
1 Anaphalis contorta 4000 15 10.84 7500 25 13.19 2 Anaphalis triplinervis 7500 15 20.71 7500 20 20.48 3 Bidens pilosa 6250 19 9.79 6500 25 24.04 4 Bistorta sp. 10625 25 15.97 5 Cannabis sativa 4000 10 13.04 9375 25 15.88 6 Centella asiatica 3000 15 9.00 6000 10 15.97 7 Chenopodium album 6000 10 12.26
8 Cymbopogan flexuosus 3125 13 10.46
9 Cynodon dactylon 15625 19 17.65
10 Cynoglossum furcatum 2500 10 7.94
11 Cyperus sp. 6000 15 13.41 12 Drymaria cordata 8500 10 17.40 13 Euphorbia hirta 5500 15 11.84 14 Fagopyrum dibotrys 12500 25 17.00 15 Fragaria vestita 5000 20 13.20 16 Galinsoga parviflora 6000 20 18.64 17 Galium sp. 3125 6 3.68 18 Gnaphalium sp. 7500 15 18.15 19 Houttuyia cordata 1000 5 3.57 20 Impatiens sp. 10625 31 17.93
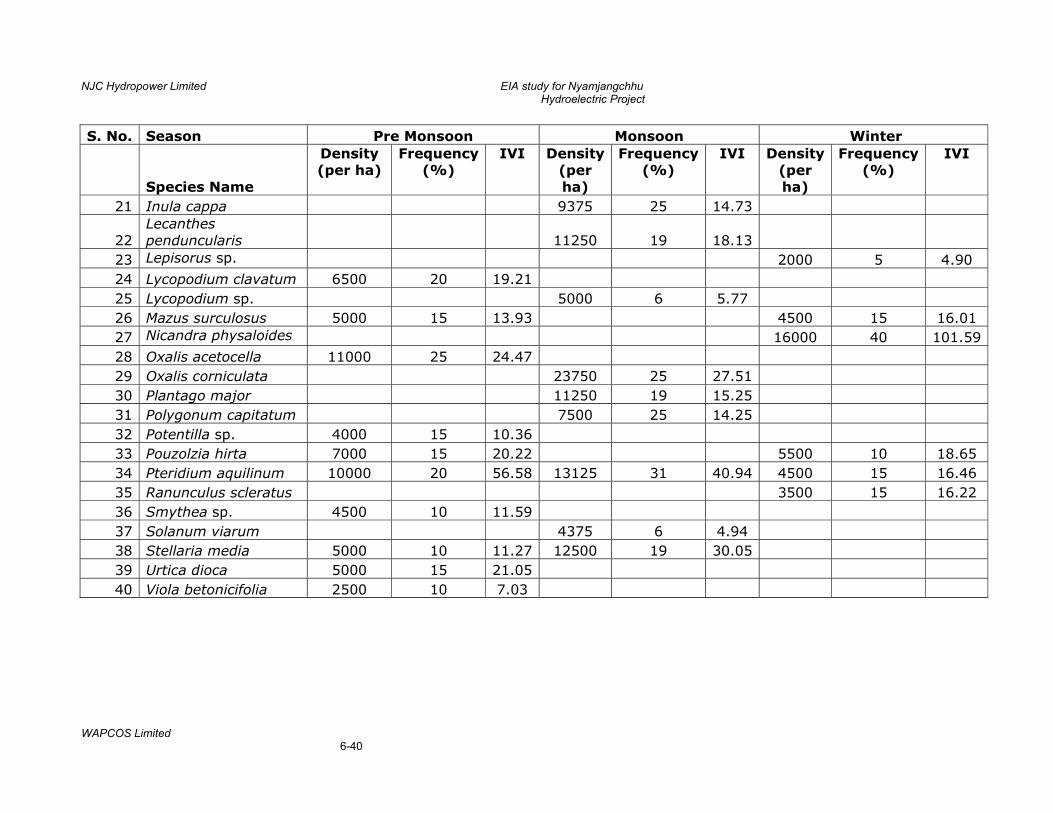
NJC Hydropower Limited EIA study for Nyamjangchhu Hydroelectric Project
WAPCOS Limited 6-40
S. No. Season Pre Monsoon Monsoon Winter
Species Name
Density (per ha)
Frequency (%)
IVI Density (per ha)
Frequency (%)
IVI Density (per ha)
Frequency (%)
IVI
21 Inula cappa 9375 25 14.73
22 Lecanthes penduncularis 11250 19 18.13
23 Lepisorus sp. 2000 5 4.90 24 Lycopodium clavatum 6500 20 19.21 25 Lycopodium sp. 5000 6 5.77 26 Mazus surculosus 5000 15 13.93 4500 15 16.01 27 Nicandra physaloides 16000 40 101.59 28 Oxalis acetocella 11000 25 24.47 29 Oxalis corniculata 23750 25 27.51 30 Plantago major 11250 19 15.25 31 Polygonum capitatum 7500 25 14.25 32 Potentilla sp. 4000 15 10.36 33 Pouzolzia hirta 7000 15 20.22 5500 10 18.65 34 Pteridium aquilinum 10000 20 56.58 13125 31 40.94 4500 15 16.46 35 Ranunculus scleratus 3500 15 16.22 36 Smythea sp. 4500 10 11.59 37 Solanum viarum 4375 6 4.94 38 Stellaria media 5000 10 11.27 12500 19 30.05 39 Urtica dioca 5000 15 21.05 40 Viola betonicifolia 2500 10 7.03
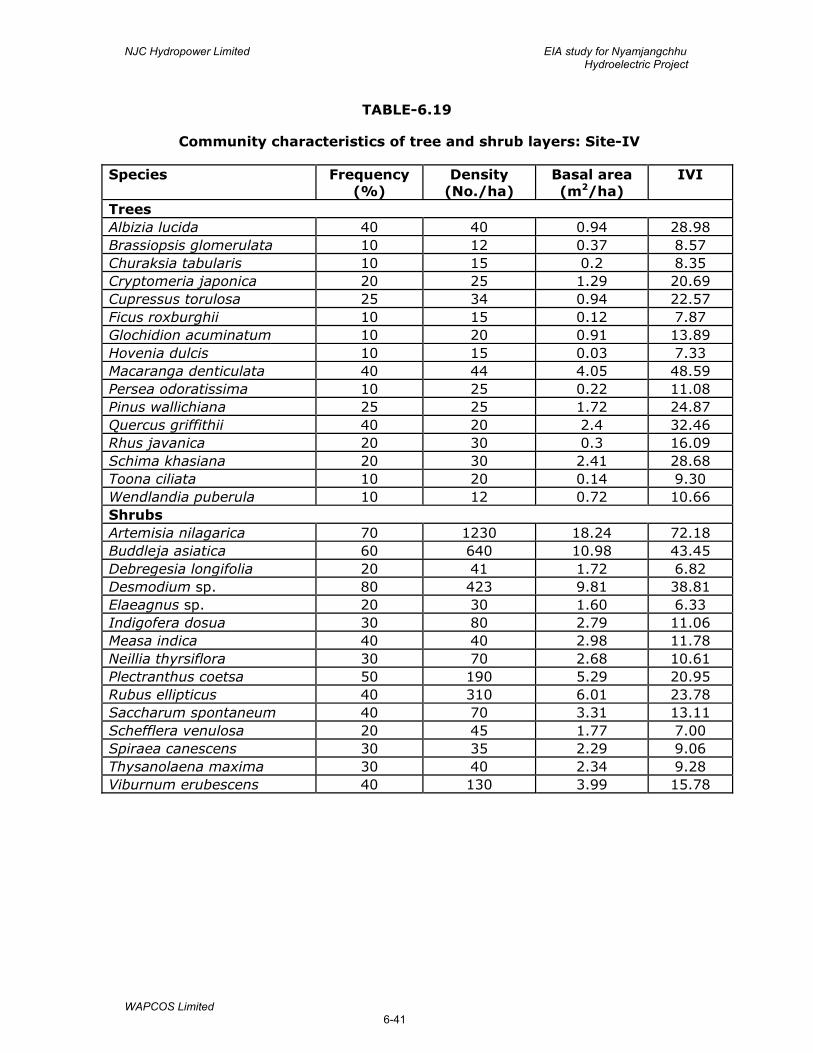
NJC Hydropower Limited EIA study for Nyamjangchhu Hydroelectric Project
WAPCOS Limited 6-41
TABLE-6.19
Community characteristics of tree and shrub layers: Site-IV
Species Frequency (%)
Density (No./ha)
Basal area (m2/ha)
IVI
Trees Albizia lucida 40 40 0.94 28.98 Brassiopsis glomerulata 10 12 0.37 8.57 Churaksia tabularis 10 15 0.2 8.35 Cryptomeria japonica 20 25 1.29 20.69 Cupressus torulosa 25 34 0.94 22.57 Ficus roxburghii 10 15 0.12 7.87 Glochidion acuminatum 10 20 0.91 13.89 Hovenia dulcis 10 15 0.03 7.33 Macaranga denticulata 40 44 4.05 48.59 Persea odoratissima 10 25 0.22 11.08 Pinus wallichiana 25 25 1.72 24.87 Quercus griffithii 40 20 2.4 32.46 Rhus javanica 20 30 0.3 16.09 Schima khasiana 20 30 2.41 28.68 Toona ciliata 10 20 0.14 9.30 Wendlandia puberula 10 12 0.72 10.66 Shrubs Artemisia nilagarica 70 1230 18.24 72.18 Buddleja asiatica 60 640 10.98 43.45 Debregesia longifolia 20 41 1.72 6.82 Desmodium sp. 80 423 9.81 38.81 Elaeagnus sp. 20 30 1.60 6.33 Indigofera dosua 30 80 2.79 11.06 Measa indica 40 40 2.98 11.78 Neillia thyrsiflora 30 70 2.68 10.61 Plectranthus coetsa 50 190 5.29 20.95 Rubus ellipticus 40 310 6.01 23.78 Saccharum spontaneum 40 70 3.31 13.11 Schefflera venulosa 20 45 1.77 7.00 Spiraea canescens 30 35 2.29 9.06 Thysanolaena maxima 30 40 2.34 9.28 Viburnum erubescens 40 130 3.99 15.78
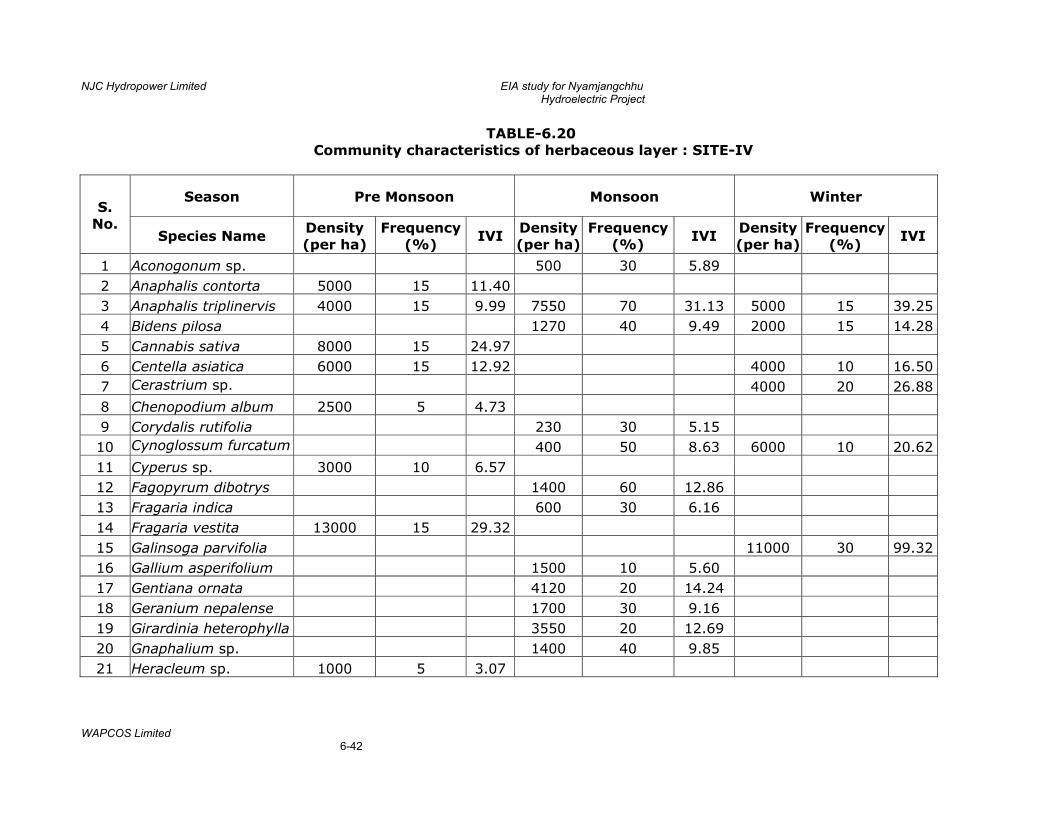
NJC Hydropower Limited EIA study for Nyamjangchhu Hydroelectric Project
WAPCOS Limited 6-42
TABLE-6.20 Community characteristics of herbaceous layer : SITE-IV
S. No.
Season Pre Monsoon Monsoon Winter
Species Name Density (per ha)
Frequency (%)
IVI Density (per ha)
Frequency (%)
IVI Density (per ha)
Frequency (%)
IVI
1 Aconogonum sp. 500 30 5.89 2 Anaphalis contorta 5000 15 11.40 3 Anaphalis triplinervis 4000 15 9.99 7550 70 31.13 5000 15 39.25 4 Bidens pilosa 1270 40 9.49 2000 15 14.28 5 Cannabis sativa 8000 15 24.97 6 Centella asiatica 6000 15 12.92 4000 10 16.50 7 Cerastrium sp. 4000 20 26.88 8 Chenopodium album 2500 5 4.73 9 Corydalis rutifolia 230 30 5.15 10 Cynoglossum furcatum 400 50 8.63 6000 10 20.62 11 Cyperus sp. 3000 10 6.57 12 Fagopyrum dibotrys 1400 60 12.86 13 Fragaria indica 600 30 6.16 14 Fragaria vestita 13000 15 29.32 15 Galinsoga parvifolia 11000 30 99.32 16 Gallium asperifolium 1500 10 5.60 17 Gentiana ornata 4120 20 14.24 18 Geranium nepalense 1700 30 9.16 19 Girardinia heterophylla 3550 20 12.69 20 Gnaphalium sp. 1400 40 9.85 21 Heracleum sp. 1000 5 3.07
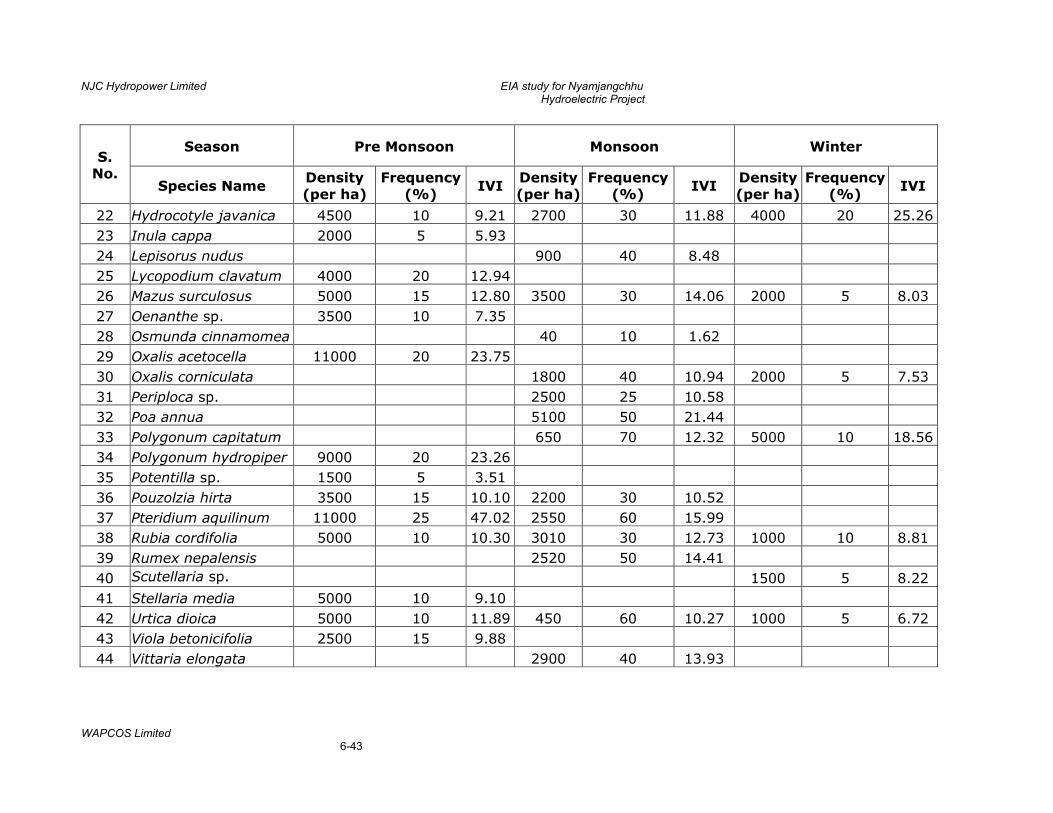
NJC Hydropower Limited EIA study for Nyamjangchhu Hydroelectric Project
WAPCOS Limited 6-43
S. No.
Season Pre Monsoon Monsoon Winter
Species Name Density (per ha)
Frequency (%) IVI
Density (per ha)
Frequency (%) IVI
Density (per ha)
Frequency (%) IVI
22 Hydrocotyle javanica 4500 10 9.21 2700 30 11.88 4000 20 25.26 23 Inula cappa 2000 5 5.93 24 Lepisorus nudus 900 40 8.48 25 Lycopodium clavatum 4000 20 12.94 26 Mazus surculosus 5000 15 12.80 3500 30 14.06 2000 5 8.03 27 Oenanthe sp. 3500 10 7.35 28 Osmunda cinnamomea 40 10 1.62 29 Oxalis acetocella 11000 20 23.75 30 Oxalis corniculata 1800 40 10.94 2000 5 7.53 31 Periploca sp. 2500 25 10.58 32 Poa annua 5100 50 21.44 33 Polygonum capitatum 650 70 12.32 5000 10 18.56 34 Polygonum hydropiper 9000 20 23.26 35 Potentilla sp. 1500 5 3.51 36 Pouzolzia hirta 3500 15 10.10 2200 30 10.52 37 Pteridium aquilinum 11000 25 47.02 2550 60 15.99 38 Rubia cordifolia 5000 10 10.30 3010 30 12.73 1000 10 8.81 39 Rumex nepalensis 2520 50 14.41 40 Scutellaria sp. 1500 5 8.22 41 Stellaria media 5000 10 9.10 42 Urtica dioica 5000 10 11.89 450 60 10.27 1000 5 6.72 43 Viola betonicifolia 2500 15 9.88 44 Vittaria elongata 2900 40 13.93
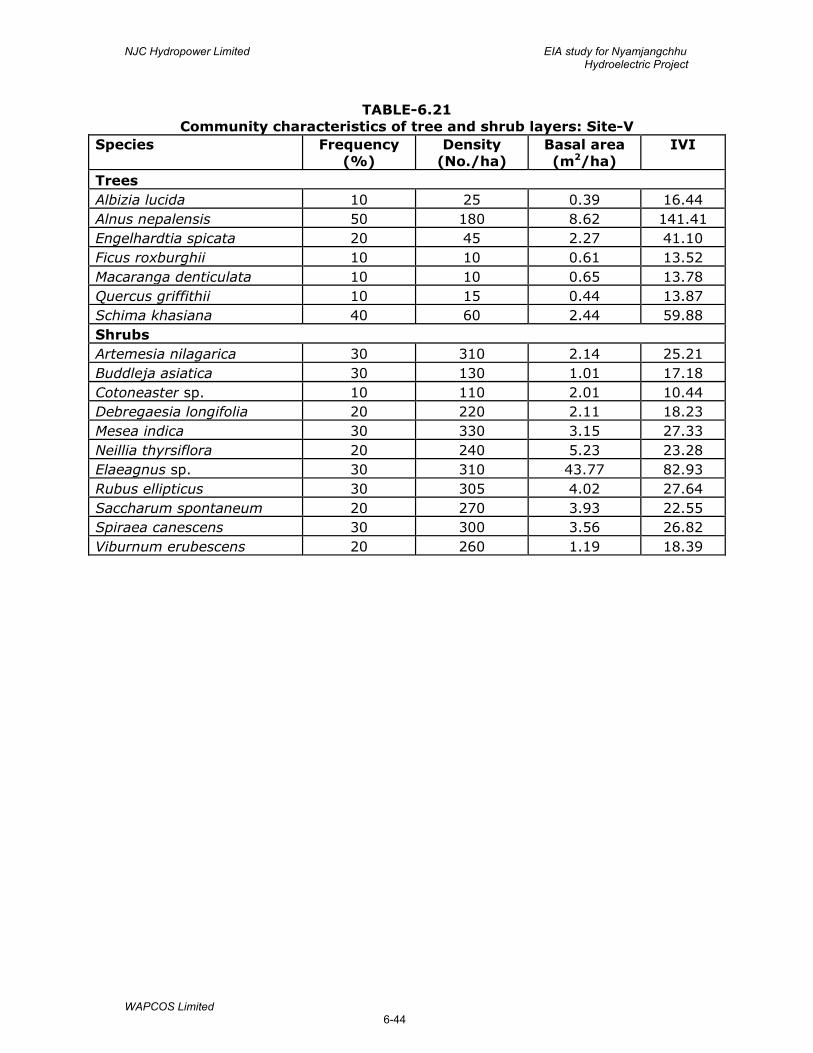
NJC Hydropower Limited EIA study for Nyamjangchhu Hydroelectric Project
WAPCOS Limited 6-44
TABLE-6.21 Community characteristics of tree and shrub layers: Site-V
Species Frequency (%)
Density (No./ha)
Basal area (m2/ha)
IVI
Trees Albizia lucida 10 25 0.39 16.44 Alnus nepalensis 50 180 8.62 141.41 Engelhardtia spicata 20 45 2.27 41.10 Ficus roxburghii 10 10 0.61 13.52 Macaranga denticulata 10 10 0.65 13.78 Quercus griffithii 10 15 0.44 13.87 Schima khasiana 40 60 2.44 59.88 Shrubs Artemesia nilagarica 30 310 2.14 25.21 Buddleja asiatica 30 130 1.01 17.18 Cotoneaster sp. 10 110 2.01 10.44 Debregaesia longifolia 20 220 2.11 18.23 Mesea indica 30 330 3.15 27.33 Neillia thyrsiflora 20 240 5.23 23.28 Elaeagnus sp. 30 310 43.77 82.93 Rubus ellipticus 30 305 4.02 27.64 Saccharum spontaneum 20 270 3.93 22.55 Spiraea canescens 30 300 3.56 26.82 Viburnum erubescens 20 260 1.19 18.39
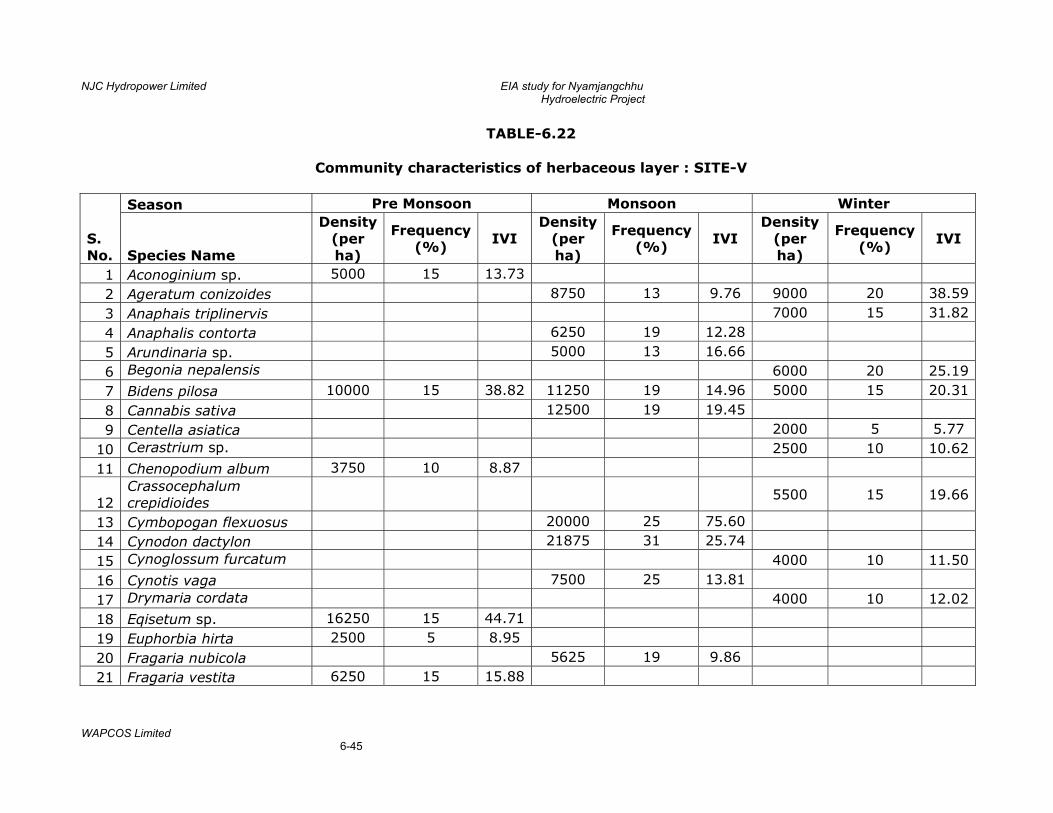
NJC Hydropower Limited EIA study for Nyamjangchhu Hydroelectric Project
WAPCOS Limited 6-45
TABLE-6.22
Community characteristics of herbaceous layer : SITE-V
S. No.
Season Pre Monsoon Monsoon Winter
Species Name
Density (per ha)
Frequency (%)
IVI Density
(per ha)
Frequency (%)
IVI Density
(per ha)
Frequency (%)
IVI
1 Aconoginium sp. 5000 15 13.73 2 Ageratum conizoides 8750 13 9.76 9000 20 38.59 3 Anaphais triplinervis 7000 15 31.82 4 Anaphalis contorta 6250 19 12.28 5 Arundinaria sp. 5000 13 16.66 6 Begonia nepalensis 6000 20 25.19 7 Bidens pilosa 10000 15 38.82 11250 19 14.96 5000 15 20.31 8 Cannabis sativa 12500 19 19.45 9 Centella asiatica 2000 5 5.77
10 Cerastrium sp. 2500 10 10.62 11 Chenopodium album 3750 10 8.87
12 Crassocephalum crepidioides
5500 15 19.66
13 Cymbopogan flexuosus 20000 25 75.60 14 Cynodon dactylon 21875 31 25.74 15 Cynoglossum furcatum 4000 10 11.50 16 Cynotis vaga 7500 25 13.81 17 Drymaria cordata 4000 10 12.02 18 Eqisetum sp. 16250 15 44.71 19 Euphorbia hirta 2500 5 8.95 20 Fragaria nubicola 5625 19 9.86 21 Fragaria vestita 6250 15 15.88
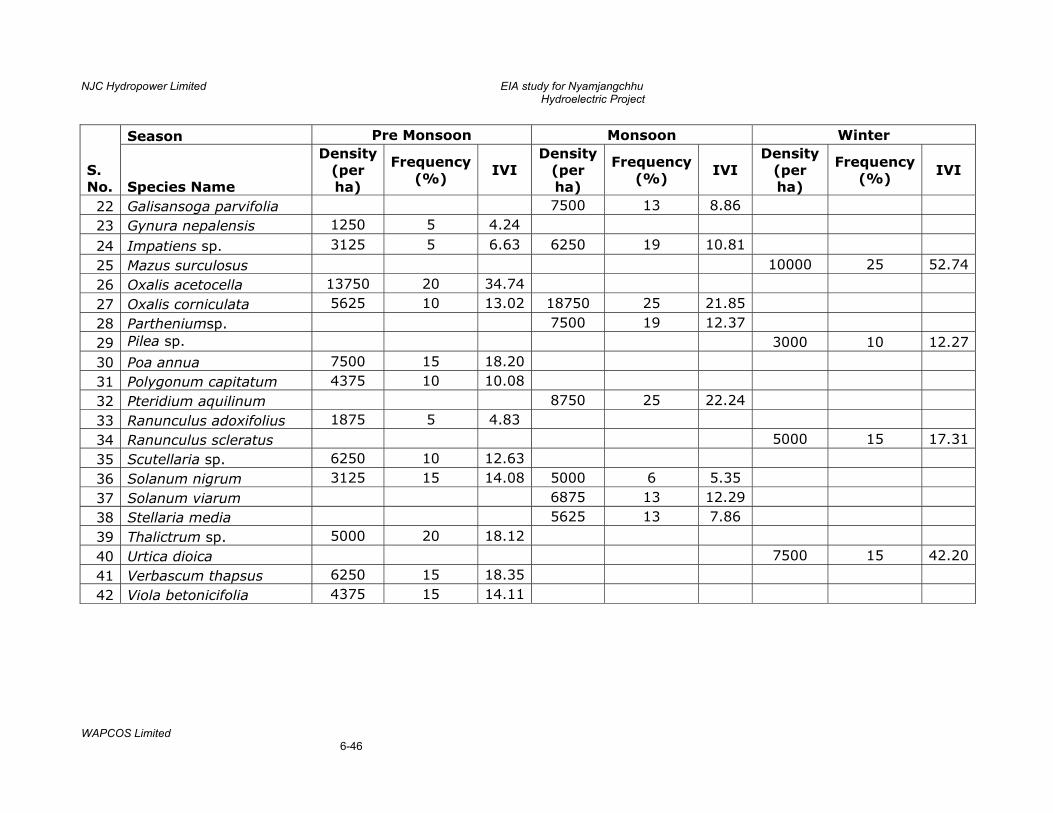
NJC Hydropower Limited EIA study for Nyamjangchhu Hydroelectric Project
WAPCOS Limited 6-46
S. No.
Season Pre Monsoon Monsoon Winter
Species Name
Density (per ha)
Frequency (%)
IVI Density
(per ha)
Frequency (%)
IVI Density
(per ha)
Frequency (%)
IVI
22 Galisansoga parvifolia 7500 13 8.86 23 Gynura nepalensis 1250 5 4.24
24 Impatiens sp. 3125 5 6.63 6250 19 10.81
25 Mazus surculosus 10000 25 52.74 26 Oxalis acetocella 13750 20 34.74 27 Oxalis corniculata 5625 10 13.02 18750 25 21.85 28 Partheniumsp. 7500 19 12.37 29 Pilea sp. 3000 10 12.27 30 Poa annua 7500 15 18.20 31 Polygonum capitatum 4375 10 10.08 32 Pteridium aquilinum 8750 25 22.24 33 Ranunculus adoxifolius 1875 5 4.83 34 Ranunculus scleratus 5000 15 17.31 35 Scutellaria sp. 6250 10 12.63 36 Solanum nigrum 3125 15 14.08 5000 6 5.35 37 Solanum viarum 6875 13 12.29 38 Stellaria media 5625 13 7.86 39 Thalictrum sp. 5000 20 18.12 40 Urtica dioica 7500 15 42.20 41 Verbascum thapsus 6250 15 18.35 42 Viola betonicifolia 4375 15 14.11
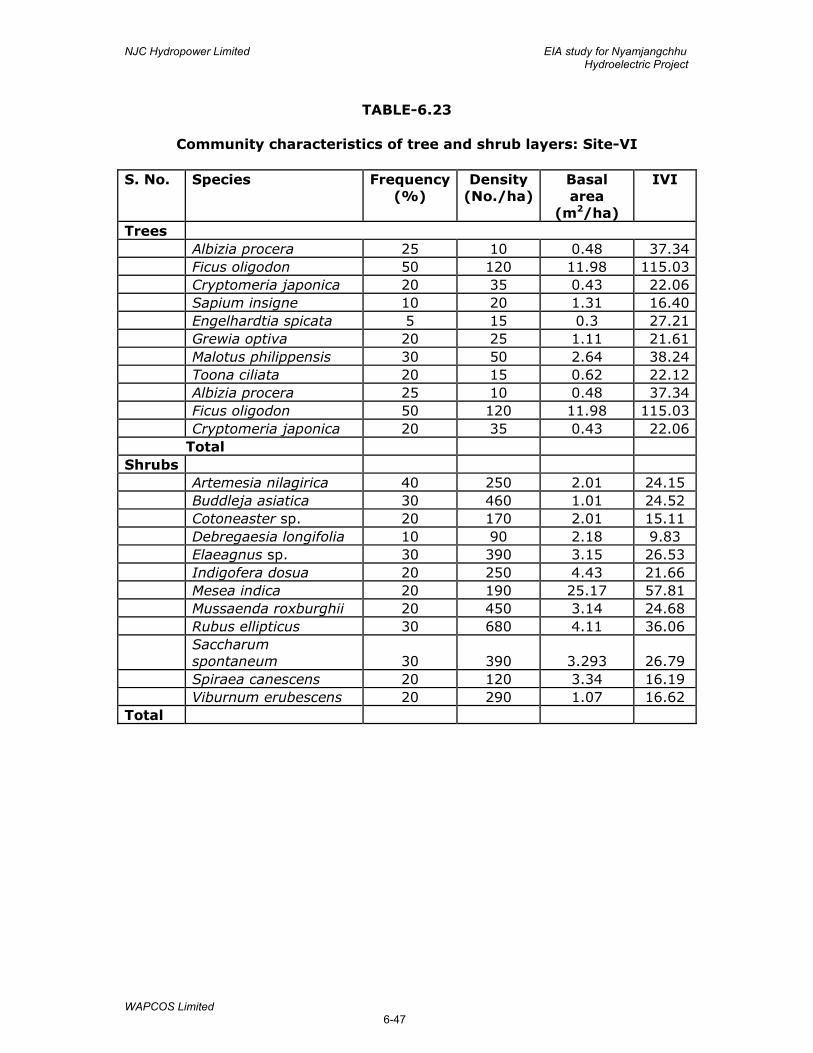
NJC Hydropower Limited EIA study for Nyamjangchhu Hydroelectric Project
WAPCOS Limited 6-47
TABLE-6.23
Community characteristics of tree and shrub layers: Site-VI
S. No. Species Frequency (%)
Density (No./ha)
Basal area
(m2/ha)
IVI
Trees Albizia procera 25 10 0.48 37.34 Ficus oligodon 50 120 11.98 115.03 Cryptomeria japonica 20 35 0.43 22.06 Sapium insigne 10 20 1.31 16.40 Engelhardtia spicata 5 15 0.3 27.21 Grewia optiva 20 25 1.11 21.61 Malotus philippensis 30 50 2.64 38.24 Toona ciliata 20 15 0.62 22.12 Albizia procera 25 10 0.48 37.34 Ficus oligodon 50 120 11.98 115.03 Cryptomeria japonica 20 35 0.43 22.06 Total Shrubs Artemesia nilagirica 40 250 2.01 24.15 Buddleja asiatica 30 460 1.01 24.52 Cotoneaster sp. 20 170 2.01 15.11 Debregaesia longifolia 10 90 2.18 9.83 Elaeagnus sp. 30 390 3.15 26.53 Indigofera dosua 20 250 4.43 21.66 Mesea indica 20 190 25.17 57.81 Mussaenda roxburghii 20 450 3.14 24.68 Rubus ellipticus 30 680 4.11 36.06 Saccharum
spontaneum 30 390 3.293 26.79 Spiraea canescens 20 120 3.34 16.19 Viburnum erubescens 20 290 1.07 16.62 Total
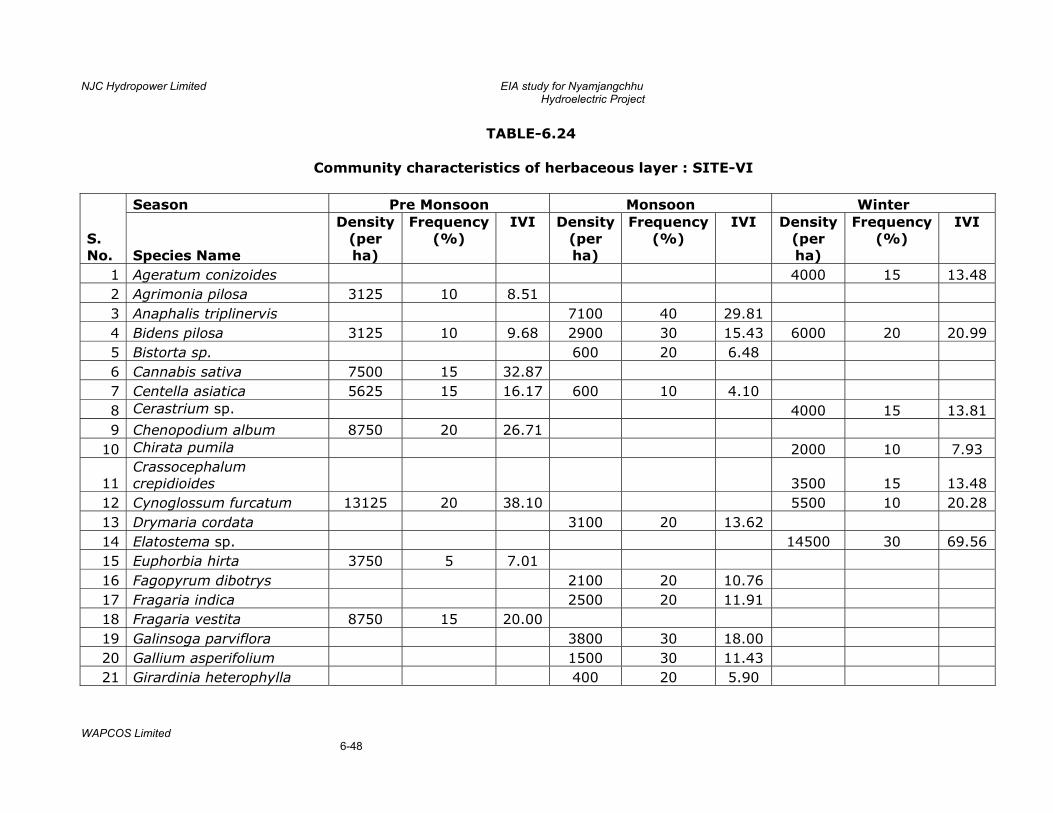
NJC Hydropower Limited EIA study for Nyamjangchhu Hydroelectric Project
WAPCOS Limited 6-48
TABLE-6.24
Community characteristics of herbaceous layer : SITE-VI
S. No.
Season Pre Monsoon Monsoon Winter
Species Name
Density (per ha)
Frequency (%)
IVI Density (per ha)
Frequency (%)
IVI Density (per ha)
Frequency (%)
IVI
1 Ageratum conizoides 4000 15 13.48 2 Agrimonia pilosa 3125 10 8.51 3 Anaphalis triplinervis 7100 40 29.81 4 Bidens pilosa 3125 10 9.68 2900 30 15.43 6000 20 20.99 5 Bistorta sp. 600 20 6.48 6 Cannabis sativa 7500 15 32.87 7 Centella asiatica 5625 15 16.17 600 10 4.10 8 Cerastrium sp. 4000 15 13.81 9 Chenopodium album 8750 20 26.71
10 Chirata pumila 2000 10 7.93
11 Crassocephalum crepidioides 3500 15 13.48
12 Cynoglossum furcatum 13125 20 38.10 5500 10 20.28 13 Drymaria cordata 3100 20 13.62 14 Elatostema sp. 14500 30 69.56 15 Euphorbia hirta 3750 5 7.01 16 Fagopyrum dibotrys 2100 20 10.76 17 Fragaria indica 2500 20 11.91 18 Fragaria vestita 8750 15 20.00 19 Galinsoga parviflora 3800 30 18.00 20 Gallium asperifolium 1500 30 11.43 21 Girardinia heterophylla 400 20 5.90
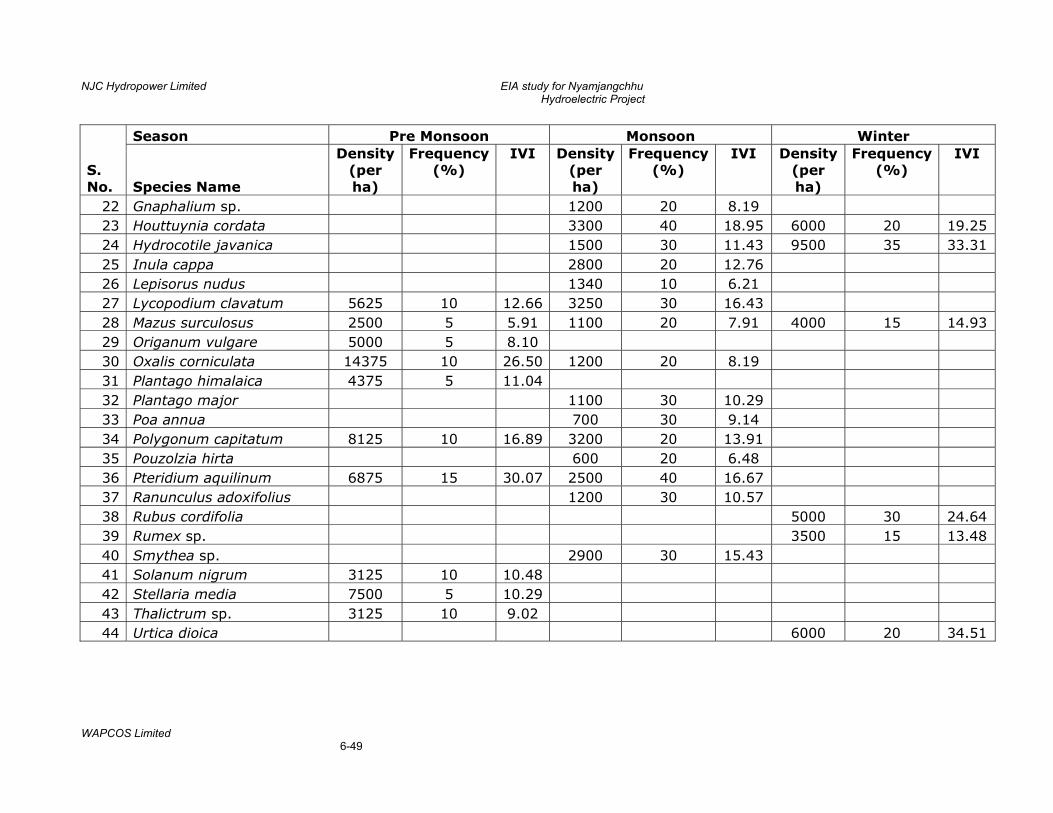
NJC Hydropower Limited EIA study for Nyamjangchhu Hydroelectric Project
WAPCOS Limited 6-49
S. No.
Season Pre Monsoon Monsoon Winter
Species Name
Density (per ha)
Frequency (%)
IVI Density (per ha)
Frequency (%)
IVI Density (per ha)
Frequency (%)
IVI
22 Gnaphalium sp. 1200 20 8.19 23 Houttuynia cordata 3300 40 18.95 6000 20 19.25 24 Hydrocotile javanica 1500 30 11.43 9500 35 33.31 25 Inula cappa 2800 20 12.76 26 Lepisorus nudus 1340 10 6.21 27 Lycopodium clavatum 5625 10 12.66 3250 30 16.43 28 Mazus surculosus 2500 5 5.91 1100 20 7.91 4000 15 14.93 29 Origanum vulgare 5000 5 8.10 30 Oxalis corniculata 14375 10 26.50 1200 20 8.19 31 Plantago himalaica 4375 5 11.04 32 Plantago major 1100 30 10.29 33 Poa annua 700 30 9.14 34 Polygonum capitatum 8125 10 16.89 3200 20 13.91 35 Pouzolzia hirta 600 20 6.48 36 Pteridium aquilinum 6875 15 30.07 2500 40 16.67 37 Ranunculus adoxifolius 1200 30 10.57 38 Rubus cordifolia 5000 30 24.64 39 Rumex sp. 3500 15 13.48 40 Smythea sp. 2900 30 15.43 41 Solanum nigrum 3125 10 10.48 42 Stellaria media 7500 5 10.29 43 Thalictrum sp. 3125 10 9.02 44 Urtica dioica 6000 20 34.51
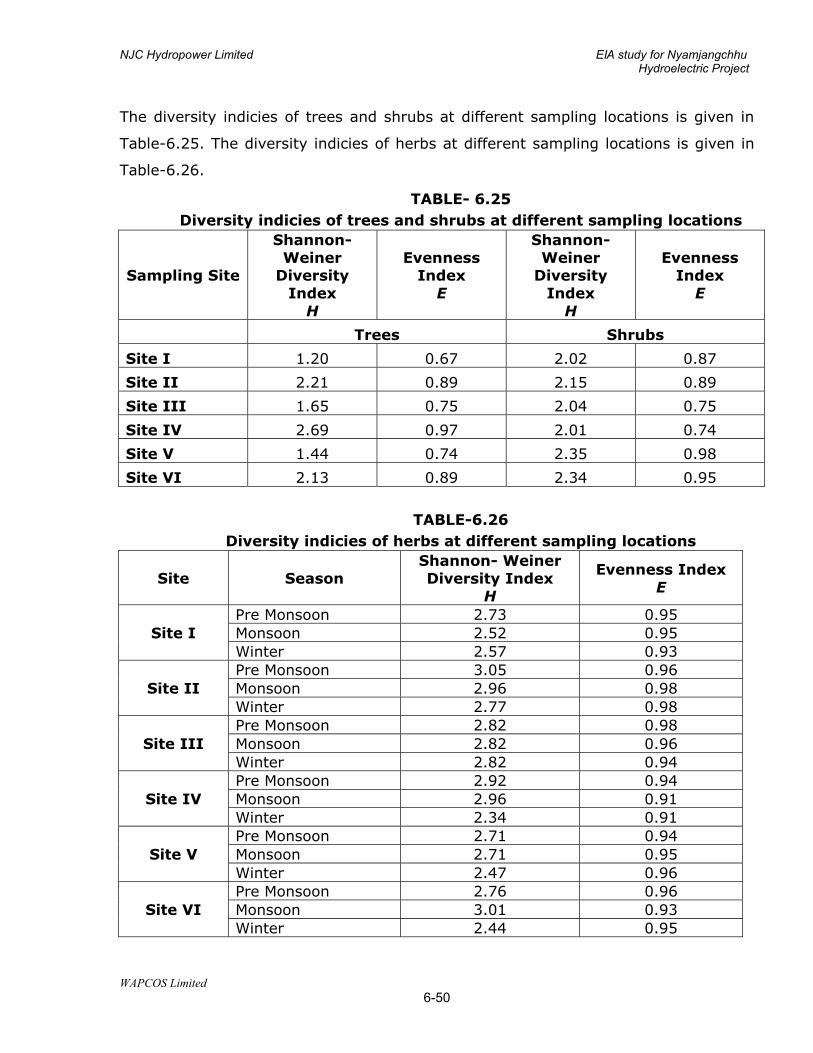
NJC Hydropower Limited EIA study for Nyamjangchhu Hydroelectric Project
WAPCOS Limited 6-50
The diversity indicies of trees and shrubs at different sampling locations is given in
Table-6.25. The diversity indicies of herbs at different sampling locations is given in
Table-6.26.
TABLE- 6.25 Diversity indicies of trees and shrubs at different sampling locations
Sampling Site
Shannon- Weiner
Diversity Index
H
Evenness Index
E
Shannon- Weiner
Diversity Index
H
Evenness Index
E
Trees Shrubs
Site I 1.20 0.67 2.02 0.87
Site II 2.21 0.89 2.15 0.89
Site III 1.65 0.75 2.04 0.75
Site IV 2.69 0.97 2.01 0.74
Site V 1.44 0.74 2.35 0.98
Site VI 2.13 0.89 2.34 0.95
TABLE-6.26 Diversity indicies of herbs at different sampling locations
Site Season Shannon- Weiner Diversity Index
H
Evenness Index E
Site I Pre Monsoon 2.73 0.95 Monsoon 2.52 0.95 Winter 2.57 0.93
Site II Pre Monsoon 3.05 0.96 Monsoon 2.96 0.98 Winter 2.77 0.98
Site III Pre Monsoon 2.82 0.98 Monsoon 2.82 0.96 Winter 2.82 0.94
Site IV Pre Monsoon 2.92 0.94 Monsoon 2.96 0.91 Winter 2.34 0.91
Site V Pre Monsoon 2.71 0.94 Monsoon 2.71 0.95 Winter 2.47 0.96
Site VI Pre Monsoon 2.76 0.96 Monsoon 3.01 0.93 Winter 2.44 0.95
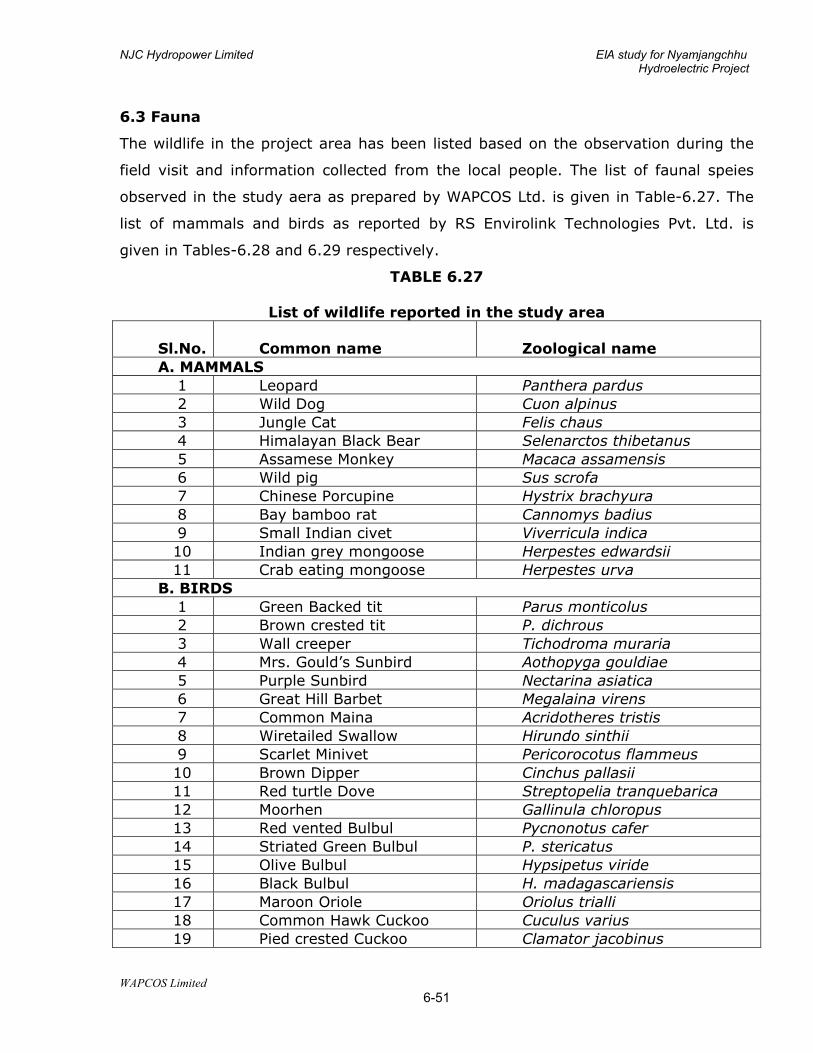
NJC Hydropower Limited EIA study for Nyamjangchhu Hydroelectric Project
WAPCOS Limited 6-51
6.3 Fauna
The wildlife in the project area has been listed based on the observation during the
field visit and information collected from the local people. The list of faunal speies
observed in the study aera as prepared by WAPCOS Ltd. is given in Table-6.27. The
list of mammals and birds as reported by RS Envirolink Technologies Pvt. Ltd. is
given in Tables-6.28 and 6.29 respectively.
TABLE 6.27
List of wildlife reported in the study area Sl.No.
Common name
Zoological name
A. MAMMALS 1 Leopard Panthera pardus 2 Wild Dog Cuon alpinus 3 Jungle Cat Felis chaus 4 Himalayan Black Bear Selenarctos thibetanus 5 Assamese Monkey Macaca assamensis 6 Wild pig Sus scrofa 7 Chinese Porcupine Hystrix brachyura 8 Bay bamboo rat Cannomys badius 9 Small Indian civet Viverricula indica 10 Indian grey mongoose Herpestes edwardsii 11 Crab eating mongoose Herpestes urva
B. BIRDS 1 Green Backed tit Parus monticolus 2 Brown crested tit P. dichrous 3 Wall creeper Tichodroma muraria 4 Mrs. Gould’s Sunbird Aothopyga gouldiae 5 Purple Sunbird Nectarina asiatica 6 Great Hill Barbet Megalaina virens 7 Common Maina Acridotheres tristis 8 Wiretailed Swallow Hirundo sinthii 9 Scarlet Minivet Pericorocotus flammeus 10 Brown Dipper Cinchus pallasii 11 Red turtle Dove Streptopelia tranquebarica 12 Moorhen Gallinula chloropus 13 Red vented Bulbul Pycnonotus cafer 14 Striated Green Bulbul P. stericatus 15 Olive Bulbul Hypsipetus viride 16 Black Bulbul H. madagascariensis 17 Maroon Oriole Oriolus trialli 18 Common Hawk Cuckoo Cuculus varius 19 Pied crested Cuckoo Clamator jacobinus
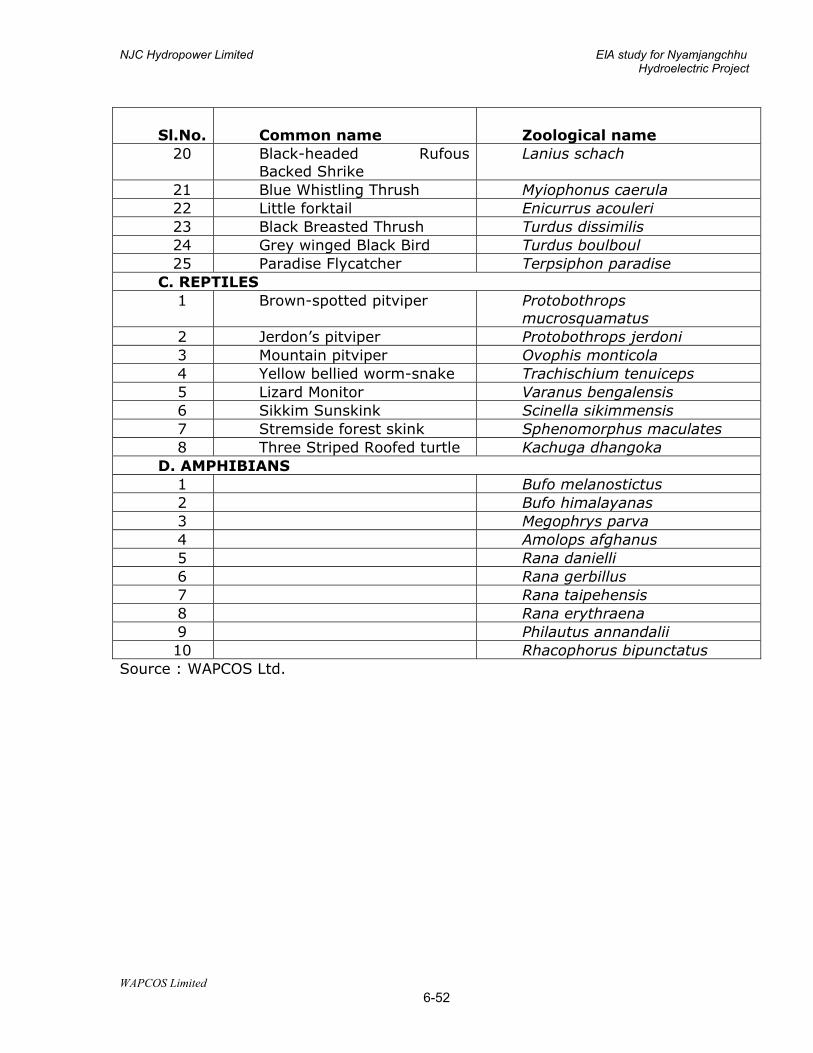
NJC Hydropower Limited EIA study for Nyamjangchhu Hydroelectric Project
WAPCOS Limited 6-52
Sl.No.
Common name
Zoological name
20 Black-headed Rufous Backed Shrike
Lanius schach
21 Blue Whistling Thrush Myiophonus caerula 22 Little forktail Enicurrus acouleri 23 Black Breasted Thrush Turdus dissimilis 24 Grey winged Black Bird Turdus boulboul 25 Paradise Flycatcher Terpsiphon paradise
C. REPTILES 1 Brown-spotted pitviper Protobothrops
mucrosquamatus 2 Jerdon’s pitviper Protobothrops jerdoni 3 Mountain pitviper Ovophis monticola 4 Yellow bellied worm-snake Trachischium tenuiceps 5 Lizard Monitor Varanus bengalensis 6 Sikkim Sunskink Scinella sikimmensis 7 Stremside forest skink Sphenomorphus maculates 8 Three Striped Roofed turtle Kachuga dhangoka
D. AMPHIBIANS 1 Bufo melanostictus 2 Bufo himalayanas 3 Megophrys parva 4 Amolops afghanus 5 Rana danielli 6 Rana gerbillus 7 Rana taipehensis 8 Rana erythraena 9 Philautus annandalii 10 Rhacophorus bipunctatus
Source : WAPCOS Ltd.

NJC Hydropower Limited EIA study for Nyamjangchhu Hydroelectric Project
WAPCOS Limited 6-53
TABLE 6.28 List of mammals reported in the study area
Source: RS Envirolink Technologies Pvt. Ltd.
TABLE 6.29
List of birds reported in the study area
Sl. No. Common Name Zoological Name Family
1 Crested Serpent Eagle Spilornis cheela Accipitridae 2 Eurasian Griffon Gyps fulvus Accipitridae 3 Golden Eagle Aquila chrysaetos Accipitridae 4 Himalayan Griffon Gyps himalayensis Accipitridae 5 Black-lored Tit Parus xanthogenys Aegithalidae 6 Black-throated Tit Aegithalos concinnus Aegithalidae 7 Great Tit Parus major Aegithalidae 8 Green-backed Tit Parus monticolus Aegithalidae 9 Grey-crested Tit Parus dichrous Aegithalidae
10 House Swift Apus affinis Apodidae 11 Winter Wren Troglodytes troglodytes Certhiidae 12 Rusty-flanked Treecreeper Certhia nipalensis Certhiidae 13 Black-faced Warbler Abroscopus schisticeps Cisticolidae 14 Blyth's Leaf Warbler Phylloscopus reguloides Cisticolidae 15 Broad-billed Warbler Tickellia hodgsoni Cisticolidae
Sl. No. Common Name Zoological Name
1 Barking Deer Muntiacus muntjac 2 Arunachal macaque Macaca munzala 3 Hoary-bellied Squirrel Callosciurus pygerythrus 4 Hog Deer Axis porcinus 5 Leopard Cat Felis bengalis 6 Common Palm Civet Paradoxurus hermaphroditus 7 Porcupine Hystrix indica 8 Wild Pig Sus scrofa 9 Himalayan Black Bear Selenarcods thibetanus
10 Hairy Footed Flying Squirrel Belomys pearsoni 11 Himalayan or Masked Palm civet Paguma larvata 12 Himalayan Goral Nemorhaedus goral 13 Musk Deer Moschus moschiferus 14 Red Panda Ailurus fulgens 15 Snow Leopard Panthera uncial 16 Takin Budorcas taxicolor 17 Sambar Cervus unicolor
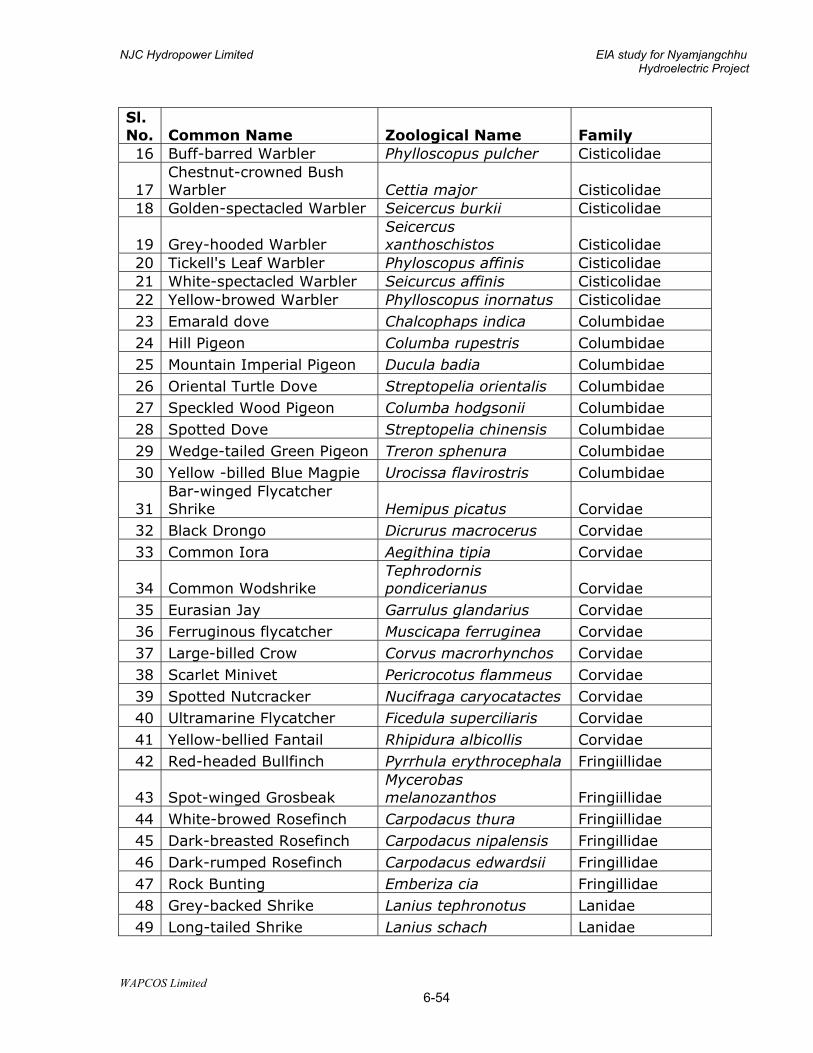
NJC Hydropower Limited EIA study for Nyamjangchhu Hydroelectric Project
WAPCOS Limited 6-54
Sl. No. Common Name Zoological Name Family 16 Buff-barred Warbler Phylloscopus pulcher Cisticolidae
17 Chestnut-crowned Bush Warbler Cettia major Cisticolidae
18 Golden-spectacled Warbler Seicercus burkii Cisticolidae
19 Grey-hooded Warbler Seicercus xanthoschistos Cisticolidae
20 Tickell's Leaf Warbler Phyloscopus affinis Cisticolidae 21 White-spectacled Warbler Seicurcus affinis Cisticolidae 22 Yellow-browed Warbler Phylloscopus inornatus Cisticolidae 23 Emarald dove Chalcophaps indica Columbidae 24 Hill Pigeon Columba rupestris Columbidae 25 Mountain Imperial Pigeon Ducula badia Columbidae 26 Oriental Turtle Dove Streptopelia orientalis Columbidae 27 Speckled Wood Pigeon Columba hodgsonii Columbidae 28 Spotted Dove Streptopelia chinensis Columbidae 29 Wedge-tailed Green Pigeon Treron sphenura Columbidae 30 Yellow -billed Blue Magpie Urocissa flavirostris Columbidae
31 Bar-winged Flycatcher Shrike Hemipus picatus Corvidae
32 Black Drongo Dicrurus macrocerus Corvidae 33 Common Iora Aegithina tipia Corvidae
34 Common Wodshrike Tephrodornis pondicerianus Corvidae
35 Eurasian Jay Garrulus glandarius Corvidae 36 Ferruginous flycatcher Muscicapa ferruginea Corvidae 37 Large-billed Crow Corvus macrorhynchos Corvidae 38 Scarlet Minivet Pericrocotus flammeus Corvidae 39 Spotted Nutcracker Nucifraga caryocatactes Corvidae 40 Ultramarine Flycatcher Ficedula superciliaris Corvidae 41 Yellow-bellied Fantail Rhipidura albicollis Corvidae 42 Red-headed Bullfinch Pyrrhula erythrocephala Fringiillidae
43 Spot-winged Grosbeak Mycerobas melanozanthos Fringiillidae
44 White-browed Rosefinch Carpodacus thura Fringiillidae 45 Dark-breasted Rosefinch Carpodacus nipalensis Fringillidae 46 Dark-rumped Rosefinch Carpodacus edwardsii Fringillidae 47 Rock Bunting Emberiza cia Fringillidae 48 Grey-backed Shrike Lanius tephronotus Lanidae 49 Long-tailed Shrike Lanius schach Lanidae
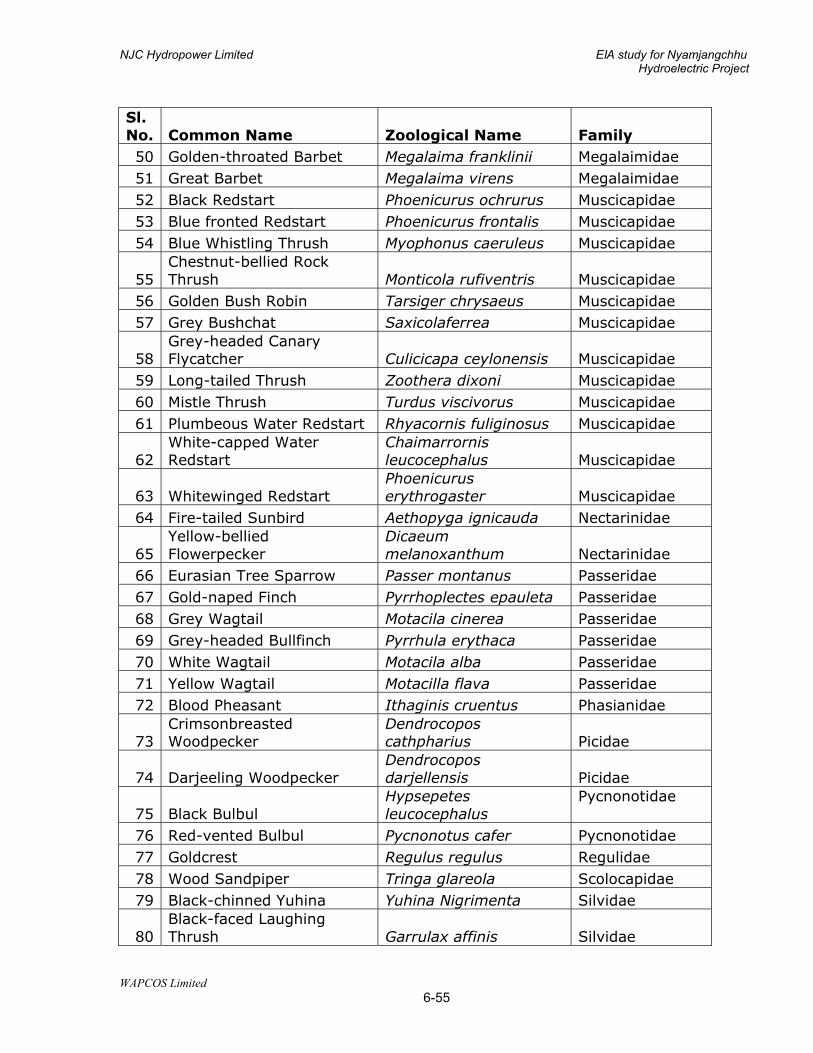
NJC Hydropower Limited EIA study for Nyamjangchhu Hydroelectric Project
WAPCOS Limited 6-55
Sl. No. Common Name Zoological Name Family 50 Golden-throated Barbet Megalaima franklinii Megalaimidae 51 Great Barbet Megalaima virens Megalaimidae 52 Black Redstart Phoenicurus ochrurus Muscicapidae 53 Blue fronted Redstart Phoenicurus frontalis Muscicapidae 54 Blue Whistling Thrush Myophonus caeruleus Muscicapidae
55 Chestnut-bellied Rock Thrush Monticola rufiventris Muscicapidae
56 Golden Bush Robin Tarsiger chrysaeus Muscicapidae 57 Grey Bushchat Saxicolaferrea Muscicapidae
58 Grey-headed Canary Flycatcher Culicicapa ceylonensis Muscicapidae
59 Long-tailed Thrush Zoothera dixoni Muscicapidae 60 Mistle Thrush Turdus viscivorus Muscicapidae 61 Plumbeous Water Redstart Rhyacornis fuliginosus Muscicapidae
62 White-capped Water Redstart
Chaimarrornis leucocephalus Muscicapidae
63 Whitewinged Redstart Phoenicurus erythrogaster Muscicapidae
64 Fire-tailed Sunbird Aethopyga ignicauda Nectarinidae
65 Yellow-bellied Flowerpecker
Dicaeum melanoxanthum Nectarinidae
66 Eurasian Tree Sparrow Passer montanus Passeridae 67 Gold-naped Finch Pyrrhoplectes epauleta Passeridae 68 Grey Wagtail Motacila cinerea Passeridae 69 Grey-headed Bullfinch Pyrrhula erythaca Passeridae 70 White Wagtail Motacila alba Passeridae 71 Yellow Wagtail Motacilla flava Passeridae 72 Blood Pheasant Ithaginis cruentus Phasianidae
73 Crimsonbreasted Woodpecker
Dendrocopos cathpharius Picidae
74 Darjeeling Woodpecker Dendrocopos darjellensis Picidae
75 Black Bulbul Hypsepetes leucocephalus
Pycnonotidae
76 Red-vented Bulbul Pycnonotus cafer Pycnonotidae 77 Goldcrest Regulus regulus Regulidae 78 Wood Sandpiper Tringa glareola Scolocapidae 79 Black-chinned Yuhina Yuhina Nigrimenta Silvidae
80 Black-faced Laughing Thrush Garrulax affinis Silvidae
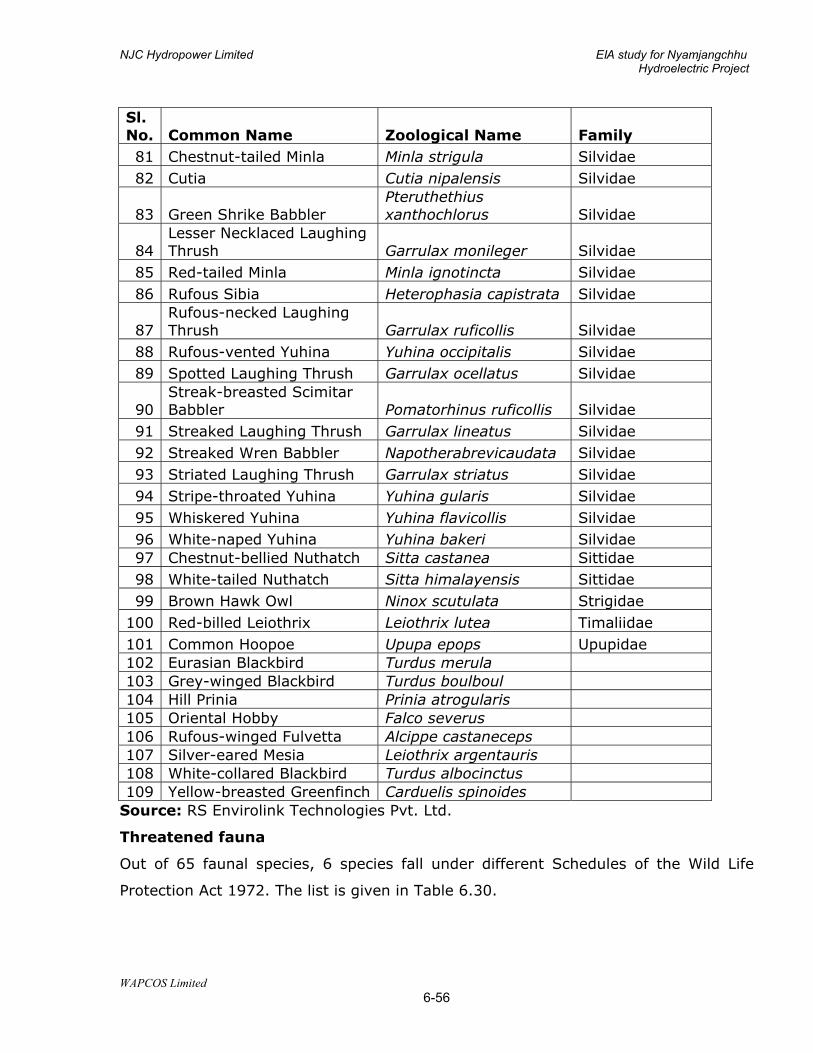
NJC Hydropower Limited EIA study for Nyamjangchhu Hydroelectric Project
WAPCOS Limited 6-56
Sl. No. Common Name Zoological Name Family 81 Chestnut-tailed Minla Minla strigula Silvidae 82 Cutia Cutia nipalensis Silvidae
83 Green Shrike Babbler Pteruthethius xanthochlorus Silvidae
84 Lesser Necklaced Laughing Thrush Garrulax monileger Silvidae
85 Red-tailed Minla Minla ignotincta Silvidae 86 Rufous Sibia Heterophasia capistrata Silvidae
87 Rufous-necked Laughing Thrush Garrulax ruficollis Silvidae
88 Rufous-vented Yuhina Yuhina occipitalis Silvidae 89 Spotted Laughing Thrush Garrulax ocellatus Silvidae
90 Streak-breasted Scimitar Babbler Pomatorhinus ruficollis Silvidae
91 Streaked Laughing Thrush Garrulax lineatus Silvidae 92 Streaked Wren Babbler Napotherabrevicaudata Silvidae 93 Striated Laughing Thrush Garrulax striatus Silvidae 94 Stripe-throated Yuhina Yuhina gularis Silvidae 95 Whiskered Yuhina Yuhina flavicollis Silvidae 96 White-naped Yuhina Yuhina bakeri Silvidae 97 Chestnut-bellied Nuthatch Sitta castanea Sittidae 98 White-tailed Nuthatch Sitta himalayensis Sittidae 99 Brown Hawk Owl Ninox scutulata Strigidae
100 Red-billed Leiothrix Leiothrix lutea Timaliidae 101 Common Hoopoe Upupa epops Upupidae 102 Eurasian Blackbird Turdus merula 103 Grey-winged Blackbird Turdus boulboul 104 Hill Prinia Prinia atrogularis 105 Oriental Hobby Falco severus 106 Rufous-winged Fulvetta Alcippe castaneceps 107 Silver-eared Mesia Leiothrix argentauris 108 White-collared Blackbird Turdus albocinctus 109 Yellow-breasted Greenfinch Carduelis spinoides
Source: RS Envirolink Technologies Pvt. Ltd.
Threatened fauna
Out of 65 faunal species, 6 species fall under different Schedules of the Wild Life
Protection Act 1972. The list is given in Table 6.30.
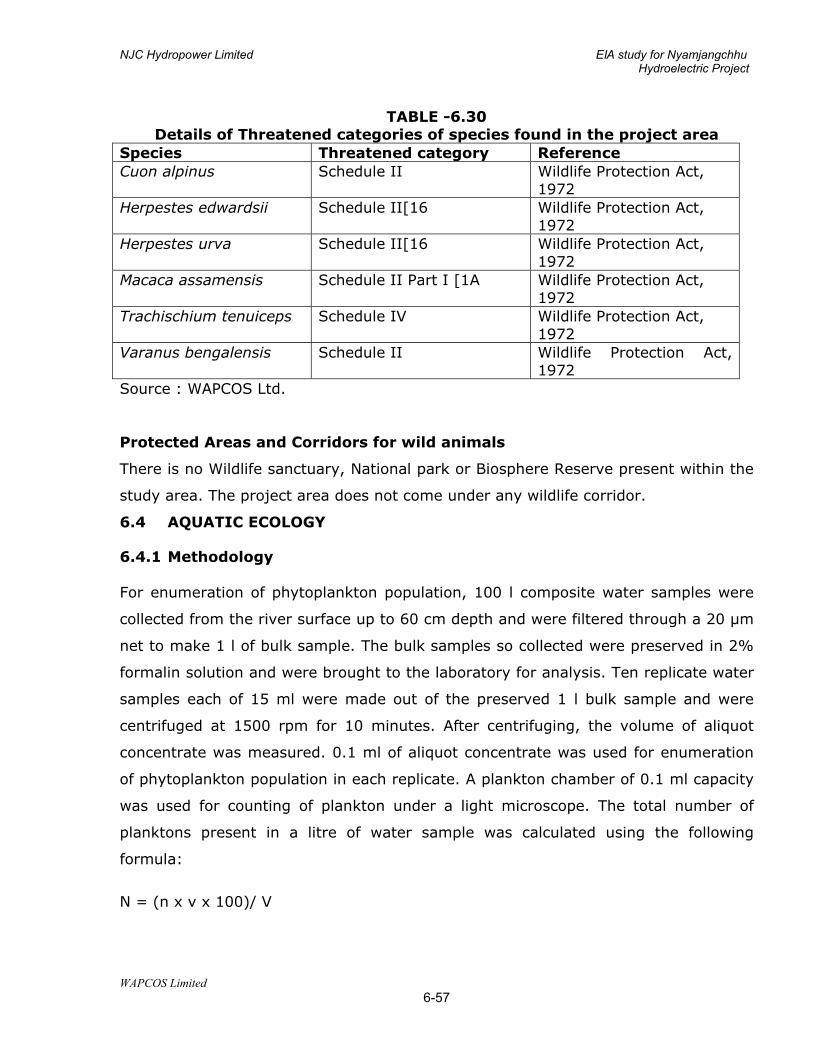
NJC Hydropower Limited EIA study for Nyamjangchhu Hydroelectric Project
WAPCOS Limited 6-57
TABLE -6.30 Details of Threatened categories of species found in the project area
Species Threatened category Reference Cuon alpinus Schedule II Wildlife Protection Act,
1972 Herpestes edwardsii Schedule II[16 Wildlife Protection Act,
1972 Herpestes urva Schedule II[16 Wildlife Protection Act,
1972 Macaca assamensis Schedule II Part I [1A Wildlife Protection Act,
1972 Trachischium tenuiceps Schedule IV Wildlife Protection Act,
1972 Varanus bengalensis Schedule II Wildlife Protection Act,
1972 Source : WAPCOS Ltd. Protected Areas and Corridors for wild animals
There is no Wildlife sanctuary, National park or Biosphere Reserve present within the
study area. The project area does not come under any wildlife corridor.
6.4 AQUATIC ECOLOGY
6.4.1 Methodology
For enumeration of phytoplankton population, 100 l composite water samples were
collected from the river surface up to 60 cm depth and were filtered through a 20 µm
net to make 1 l of bulk sample. The bulk samples so collected were preserved in 2%
formalin solution and were brought to the laboratory for analysis. Ten replicate water
samples each of 15 ml were made out of the preserved 1 l bulk sample and were
centrifuged at 1500 rpm for 10 minutes. After centrifuging, the volume of aliquot
concentrate was measured. 0.1 ml of aliquot concentrate was used for enumeration
of phytoplankton population in each replicate. A plankton chamber of 0.1 ml capacity
was used for counting of plankton under a light microscope. The total number of
planktons present in a litre of water sample was calculated using the following
formula:
N = (n x v x 100)/ V
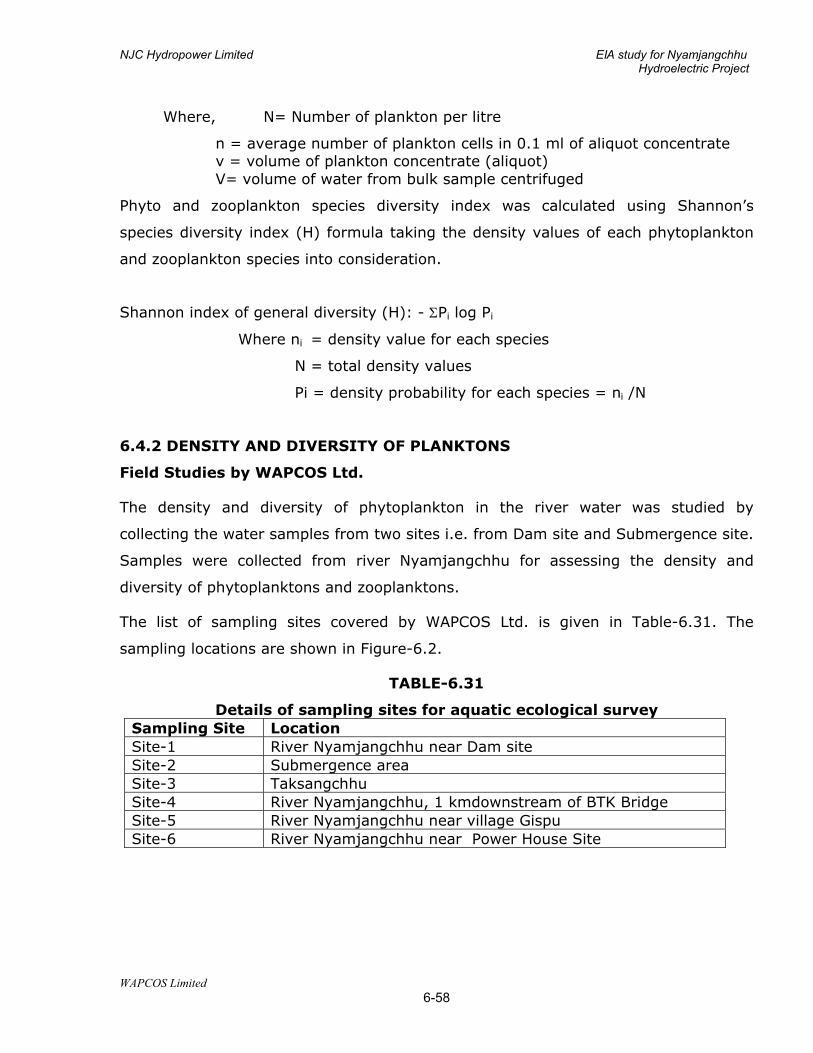
NJC Hydropower Limited EIA study for Nyamjangchhu Hydroelectric Project
WAPCOS Limited 6-58
Where, N= Number of plankton per litre
n = average number of plankton cells in 0.1 ml of aliquot concentrate v = volume of plankton concentrate (aliquot) V= volume of water from bulk sample centrifuged
Phyto and zooplankton species diversity index was calculated using Shannon’s
species diversity index (H) formula taking the density values of each phytoplankton
and zooplankton species into consideration.
Shannon index of general diversity (H): - ΣPi log Pi
Where ni = density value for each species
N = total density values
Pi = density probability for each species = ni /N
6.4.2 DENSITY AND DIVERSITY OF PLANKTONS
Field Studies by WAPCOS Ltd.
The density and diversity of phytoplankton in the river water was studied by
collecting the water samples from two sites i.e. from Dam site and Submergence site.
Samples were collected from river Nyamjangchhu for assessing the density and
diversity of phytoplanktons and zooplanktons.
The list of sampling sites covered by WAPCOS Ltd. is given in Table-6.31. The
sampling locations are shown in Figure-6.2.
TABLE-6.31
Details of sampling sites for aquatic ecological survey Sampling Site Location Site-1 River Nyamjangchhu near Dam site Site-2 Submergence area Site-3 Taksangchhu Site-4 River Nyamjangchhu, 1 kmdownstream of BTK Bridge Site-5 River Nyamjangchhu near village Gispu Site-6 River Nyamjangchhu near Power House Site
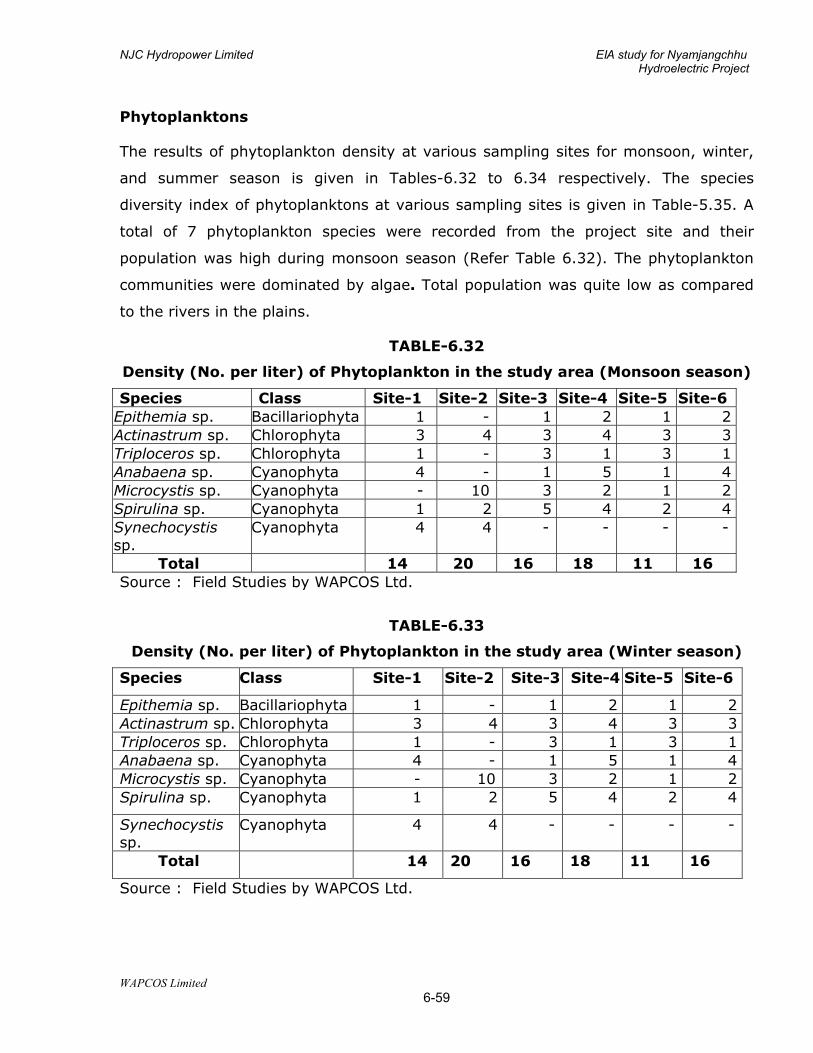
NJC Hydropower Limited EIA study for Nyamjangchhu Hydroelectric Project
WAPCOS Limited 6-59
Phytoplanktons
The results of phytoplankton density at various sampling sites for monsoon, winter,
and summer season is given in Tables-6.32 to 6.34 respectively. The species
diversity index of phytoplanktons at various sampling sites is given in Table-5.35. A
total of 7 phytoplankton species were recorded from the project site and their
population was high during monsoon season (Refer Table 6.32). The phytoplankton
communities were dominated by algae. Total population was quite low as compared
to the rivers in the plains.
TABLE-6.32
Density (No. per liter) of Phytoplankton in the study area (Monsoon season)
Species Class Site-1 Site-2 Site-3 Site-4 Site-5 Site-6 Epithemia sp. Bacillariophyta 1 - 1 2 1 2 Actinastrum sp. Chlorophyta 3 4 3 4 3 3 Triploceros sp. Chlorophyta 1 - 3 1 3 1 Anabaena sp. Cyanophyta 4 - 1 5 1 4 Microcystis sp. Cyanophyta - 10 3 2 1 2 Spirulina sp. Cyanophyta 1 2 5 4 2 4 Synechocystis sp.
Cyanophyta 4 4 - - - -
Total 14 20 16 18 11 16 Source : Field Studies by WAPCOS Ltd.
TABLE-6.33
Density (No. per liter) of Phytoplankton in the study area (Winter season)
Species Class Site-1 Site-2 Site-3 Site-4 Site-5 Site-6
Epithemia sp. Bacillariophyta 1 - 1 2 1 2 Actinastrum sp. Chlorophyta 3 4 3 4 3 3 Triploceros sp. Chlorophyta 1 - 3 1 3 1 Anabaena sp. Cyanophyta 4 - 1 5 1 4 Microcystis sp. Cyanophyta - 10 3 2 1 2 Spirulina sp. Cyanophyta 1 2 5 4 2 4
Synechocystis sp.
Cyanophyta 4 4 - - - -
Total 14 20 16 18 11 16
Source : Field Studies by WAPCOS Ltd.
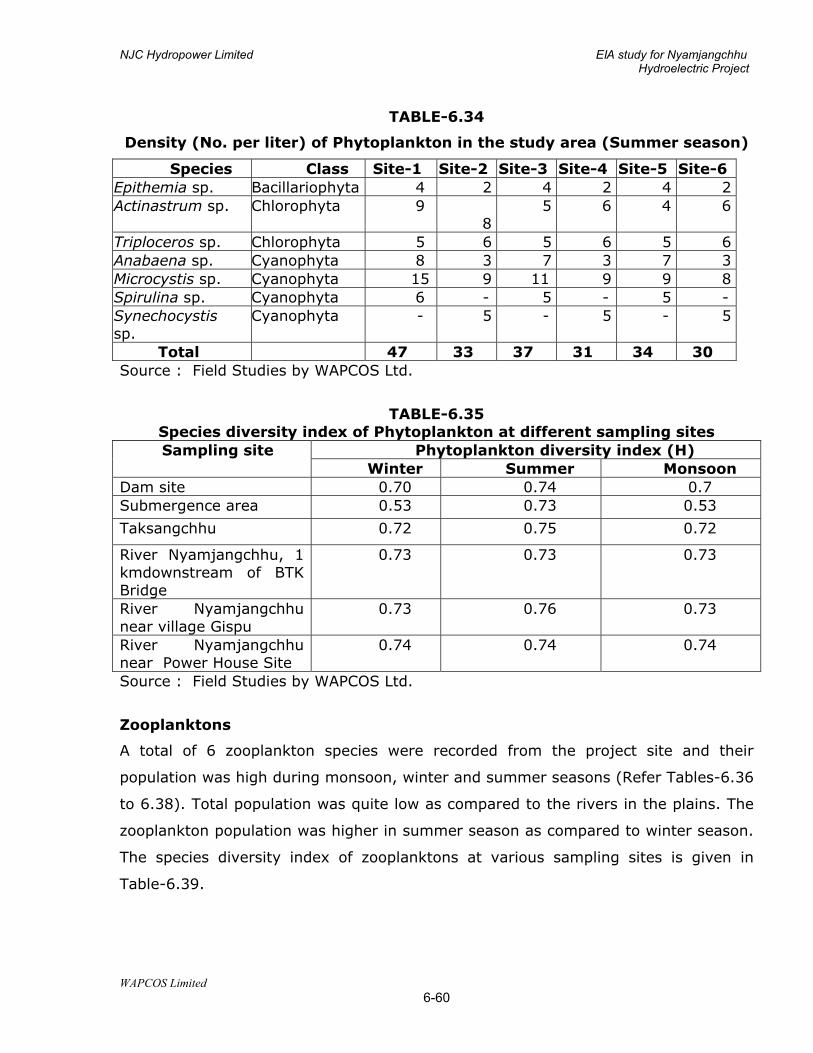
NJC Hydropower Limited EIA study for Nyamjangchhu Hydroelectric Project
WAPCOS Limited 6-60
TABLE-6.34
Density (No. per liter) of Phytoplankton in the study area (Summer season)
Species Class Site-1 Site-2 Site-3 Site-4 Site-5 Site-6 Epithemia sp. Bacillariophyta 4 2 4 2 4 2 Actinastrum sp. Chlorophyta 9
8 5 6 4 6
Triploceros sp. Chlorophyta 5 6 5 6 5 6 Anabaena sp. Cyanophyta 8 3 7 3 7 3 Microcystis sp. Cyanophyta 15 9 11 9 9 8 Spirulina sp. Cyanophyta 6 - 5 - 5 - Synechocystis sp.
Cyanophyta - 5 - 5 - 5
Total 47 33 37 31 34 30 Source : Field Studies by WAPCOS Ltd.
TABLE-6.35 Species diversity index of Phytoplankton at different sampling sites Sampling site Phytoplankton diversity index (H)
Winter Summer Monsoon Dam site 0.70 0.74 0.7 Submergence area 0.53 0.73 0.53
Taksangchhu 0.72 0.75 0.72
River Nyamjangchhu, 1 kmdownstream of BTK Bridge
0.73 0.73 0.73
River Nyamjangchhu near village Gispu
0.73 0.76 0.73
River Nyamjangchhu near Power House Site
0.74 0.74 0.74
Source : Field Studies by WAPCOS Ltd.
Zooplanktons
A total of 6 zooplankton species were recorded from the project site and their
population was high during monsoon, winter and summer seasons (Refer Tables-6.36
to 6.38). Total population was quite low as compared to the rivers in the plains. The
zooplankton population was higher in summer season as compared to winter season.
The species diversity index of zooplanktons at various sampling sites is given in
Table-6.39.
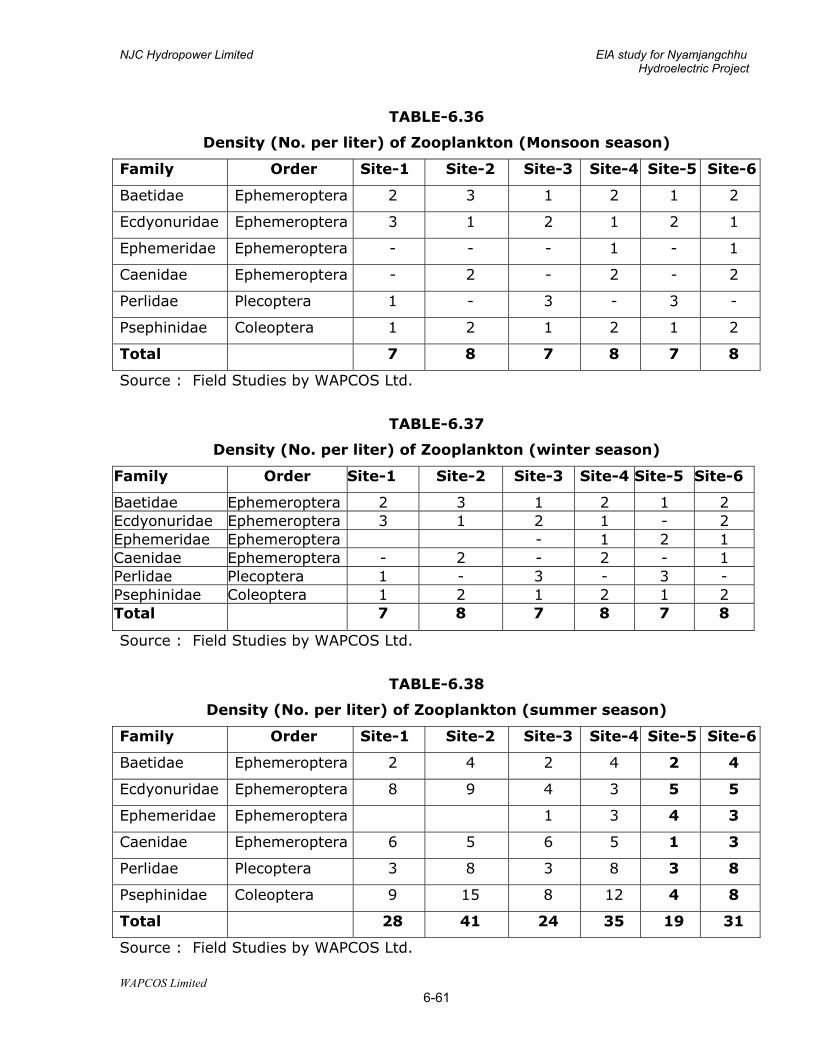
NJC Hydropower Limited EIA study for Nyamjangchhu Hydroelectric Project
WAPCOS Limited 6-61
TABLE-6.36
Density (No. per liter) of Zooplankton (Monsoon season)
Family Order Site-1 Site-2 Site-3 Site-4 Site-5 Site-6
Baetidae Ephemeroptera 2 3 1 2 1 2
Ecdyonuridae Ephemeroptera 3 1 2 1 2 1
Ephemeridae Ephemeroptera - - - 1 - 1
Caenidae Ephemeroptera - 2 - 2 - 2
Perlidae Plecoptera 1 - 3 - 3 -
Psephinidae Coleoptera 1 2 1 2 1 2
Total 7 8 7 8 7 8
Source : Field Studies by WAPCOS Ltd.
TABLE-6.37
Density (No. per liter) of Zooplankton (winter season)
Family Order Site-1 Site-2 Site-3 Site-4 Site-5 Site-6
Baetidae Ephemeroptera 2 3 1 2 1 2 Ecdyonuridae Ephemeroptera 3 1 2 1 - 2 Ephemeridae Ephemeroptera - 1 2 1 Caenidae Ephemeroptera - 2 - 2 - 1 Perlidae Plecoptera 1 - 3 - 3 - Psephinidae Coleoptera 1 2 1 2 1 2 Total 7 8 7 8 7 8
Source : Field Studies by WAPCOS Ltd.
TABLE-6.38
Density (No. per liter) of Zooplankton (summer season)
Family Order Site-1 Site-2 Site-3 Site-4 Site-5 Site-6
Baetidae Ephemeroptera 2 4 2 4 2 4
Ecdyonuridae Ephemeroptera 8 9 4 3 5 5
Ephemeridae Ephemeroptera 1 3 4 3
Caenidae Ephemeroptera 6 5 6 5 1 3
Perlidae Plecoptera 3 8 3 8 3 8
Psephinidae Coleoptera 9 15 8 12 4 8
Total 28 41 24 35 19 31
Source : Field Studies by WAPCOS Ltd.
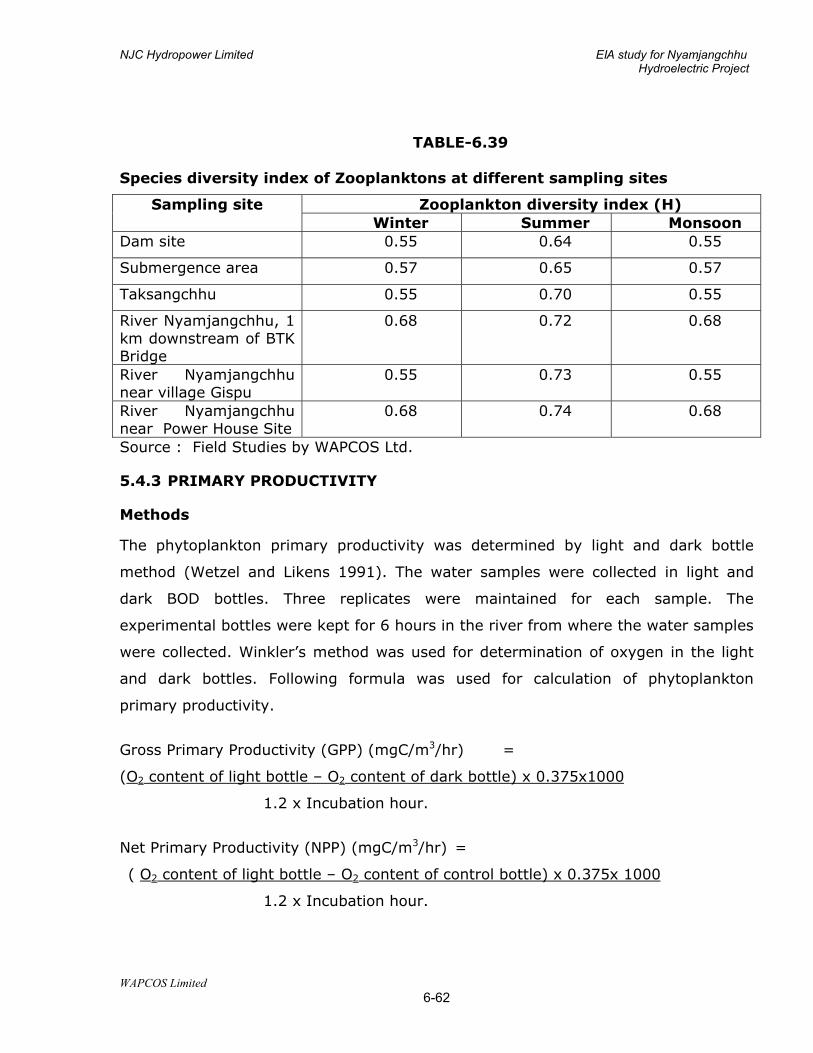
NJC Hydropower Limited EIA study for Nyamjangchhu Hydroelectric Project
WAPCOS Limited 6-62
TABLE-6.39
Species diversity index of Zooplanktons at different sampling sites
Sampling site Zooplankton diversity index (H) Winter Summer Monsoon
Dam site 0.55 0.64 0.55
Submergence area 0.57 0.65 0.57
Taksangchhu 0.55 0.70 0.55
River Nyamjangchhu, 1 km downstream of BTK Bridge
0.68 0.72 0.68
River Nyamjangchhu near village Gispu
0.55 0.73 0.55
River Nyamjangchhu near Power House Site
0.68 0.74 0.68
Source : Field Studies by WAPCOS Ltd.
5.4.3 PRIMARY PRODUCTIVITY
Methods
The phytoplankton primary productivity was determined by light and dark bottle
method (Wetzel and Likens 1991). The water samples were collected in light and
dark BOD bottles. Three replicates were maintained for each sample. The
experimental bottles were kept for 6 hours in the river from where the water samples
were collected. Winkler’s method was used for determination of oxygen in the light
and dark bottles. Following formula was used for calculation of phytoplankton
primary productivity.
Gross Primary Productivity (GPP) (mgC/m3/hr) =
(O2 content of light bottle – O2 content of dark bottle) x 0.375x1000
1.2 x Incubation hour.
Net Primary Productivity (NPP) (mgC/m3/hr) =
( O2 content of light bottle – O2 content of control bottle) x 0.375x 1000
1.2 x Incubation hour.
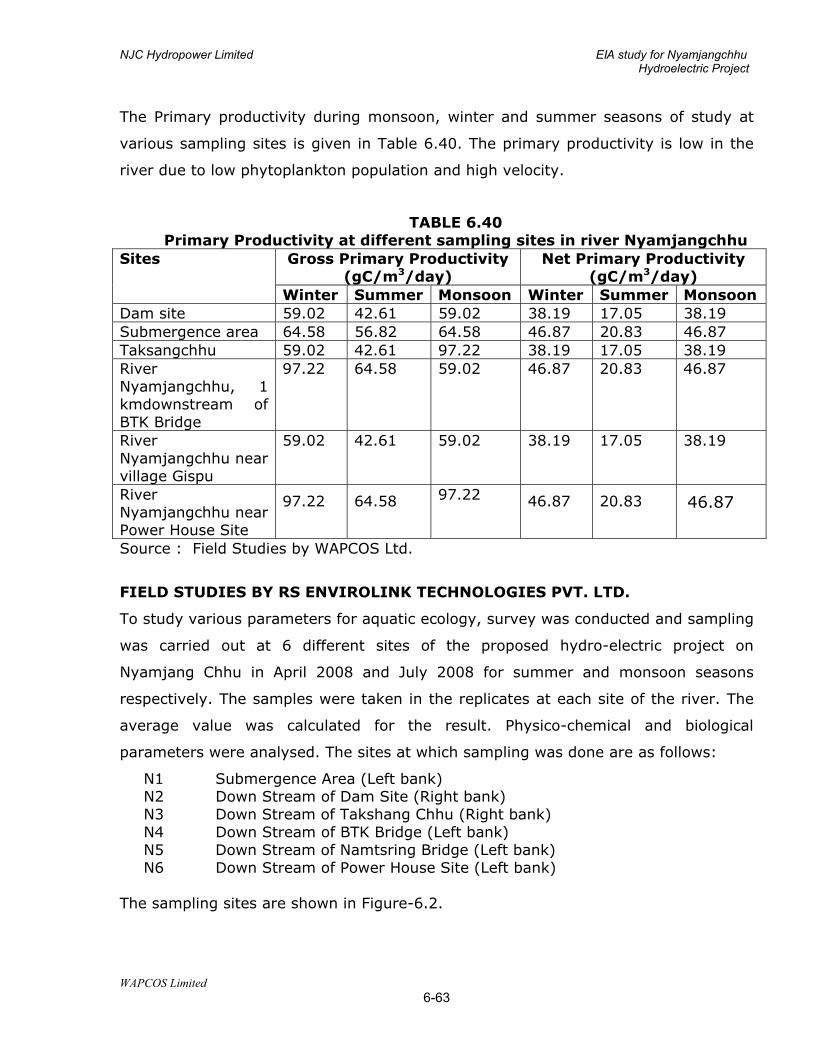
NJC Hydropower Limited EIA study for Nyamjangchhu Hydroelectric Project
WAPCOS Limited 6-63
The Primary productivity during monsoon, winter and summer seasons of study at
various sampling sites is given in Table 6.40. The primary productivity is low in the
river due to low phytoplankton population and high velocity.
TABLE 6.40
Primary Productivity at different sampling sites in river Nyamjangchhu Sites Gross Primary Productivity
(gC/m3/day) Net Primary Productivity
(gC/m3/day) Winter Summer Monsoon Winter Summer Monsoon
Dam site 59.02 42.61 59.02 38.19 17.05 38.19 Submergence area 64.58 56.82 64.58 46.87 20.83 46.87 Taksangchhu 59.02 42.61 97.22 38.19 17.05 38.19 River Nyamjangchhu, 1 kmdownstream of BTK Bridge
97.22 64.58 59.02 46.87 20.83 46.87
River Nyamjangchhu near village Gispu
59.02 42.61 59.02 38.19 17.05 38.19
River Nyamjangchhu near Power House Site
97.22 64.58 97.22 46.87 20.83 46.87
Source : Field Studies by WAPCOS Ltd.
FIELD STUDIES BY RS ENVIROLINK TECHNOLOGIES PVT. LTD.
To study various parameters for aquatic ecology, survey was conducted and sampling
was carried out at 6 different sites of the proposed hydro-electric project on
Nyamjang Chhu in April 2008 and July 2008 for summer and monsoon seasons
respectively. The samples were taken in the replicates at each site of the river. The
average value was calculated for the result. Physico-chemical and biological
parameters were analysed. The sites at which sampling was done are as follows:
N1 Submergence Area (Left bank) N2 Down Stream of Dam Site (Right bank) N3 Down Stream of Takshang Chhu (Right bank) N4 Down Stream of BTK Bridge (Left bank) N5 Down Stream of Namtsring Bridge (Left bank) N6 Down Stream of Power House Site (Left bank)
The sampling sites are shown in Figure-6.2.
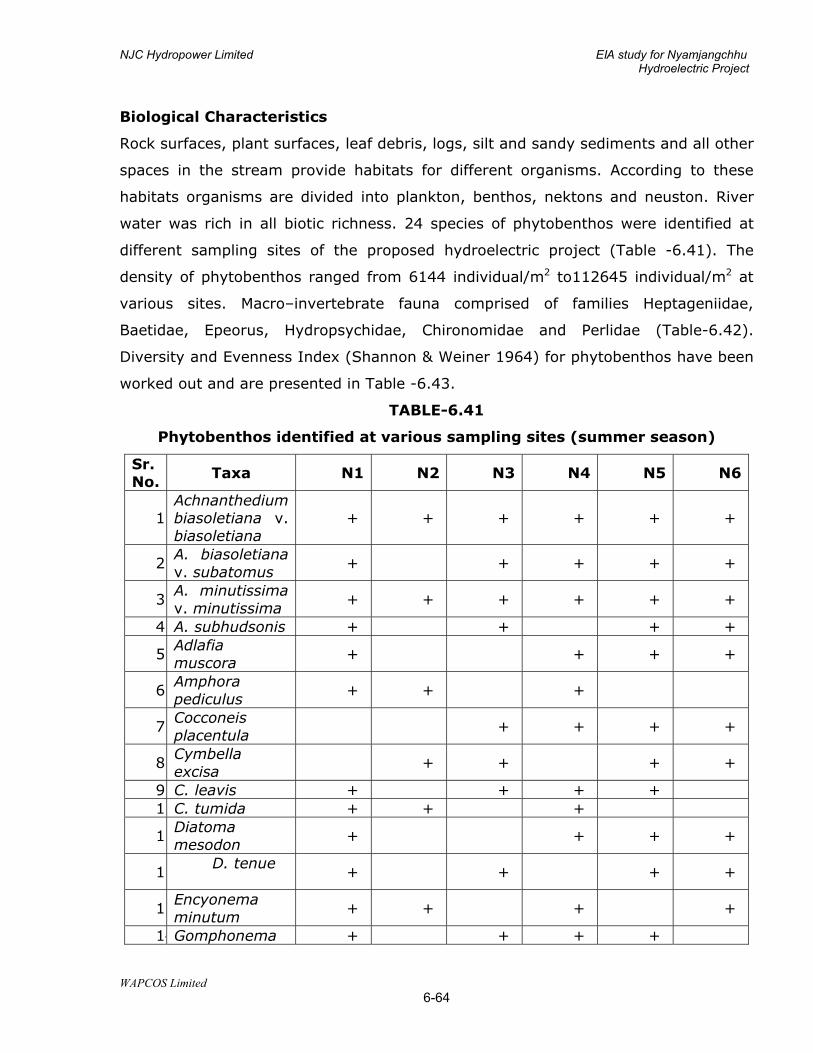
NJC Hydropower Limited EIA study for Nyamjangchhu Hydroelectric Project
WAPCOS Limited 6-64
Biological Characteristics
Rock surfaces, plant surfaces, leaf debris, logs, silt and sandy sediments and all other
spaces in the stream provide habitats for different organisms. According to these
habitats organisms are divided into plankton, benthos, nektons and neuston. River
water was rich in all biotic richness. 24 species of phytobenthos were identified at
different sampling sites of the proposed hydroelectric project (Table -6.41). The
density of phytobenthos ranged from 6144 individual/m2 to112645 individual/m2 at
various sites. Macro–invertebrate fauna comprised of families Heptageniidae,
Baetidae, Epeorus, Hydropsychidae, Chironomidae and Perlidae (Table-6.42).
Diversity and Evenness Index (Shannon & Weiner 1964) for phytobenthos have been
worked out and are presented in Table -6.43.
TABLE-6.41
Phytobenthos identified at various sampling sites (summer season)
Sr. No.
Taxa N1 N2 N3 N4 N5 N6
1Achnanthedium biasoletiana v. biasoletiana
+ + + + + +
2A. biasoletiana v. subatomus
+ + + + +
3A. minutissima v. minutissima
+ + + + + +
4 A. subhudsonis + + + +
5Adlafia muscora
+ + + +
6Amphora pediculus
+ + +
7Cocconeis placentula
+ + + +
8Cymbella excisa
+ + + +
9 C. leavis + + + + 10C. tumida + + +
1Diatoma mesodon
+ + + +
12D. tenue
+ + + +
13Encyonema minutum
+ + + +
14Gomphonema + + + +
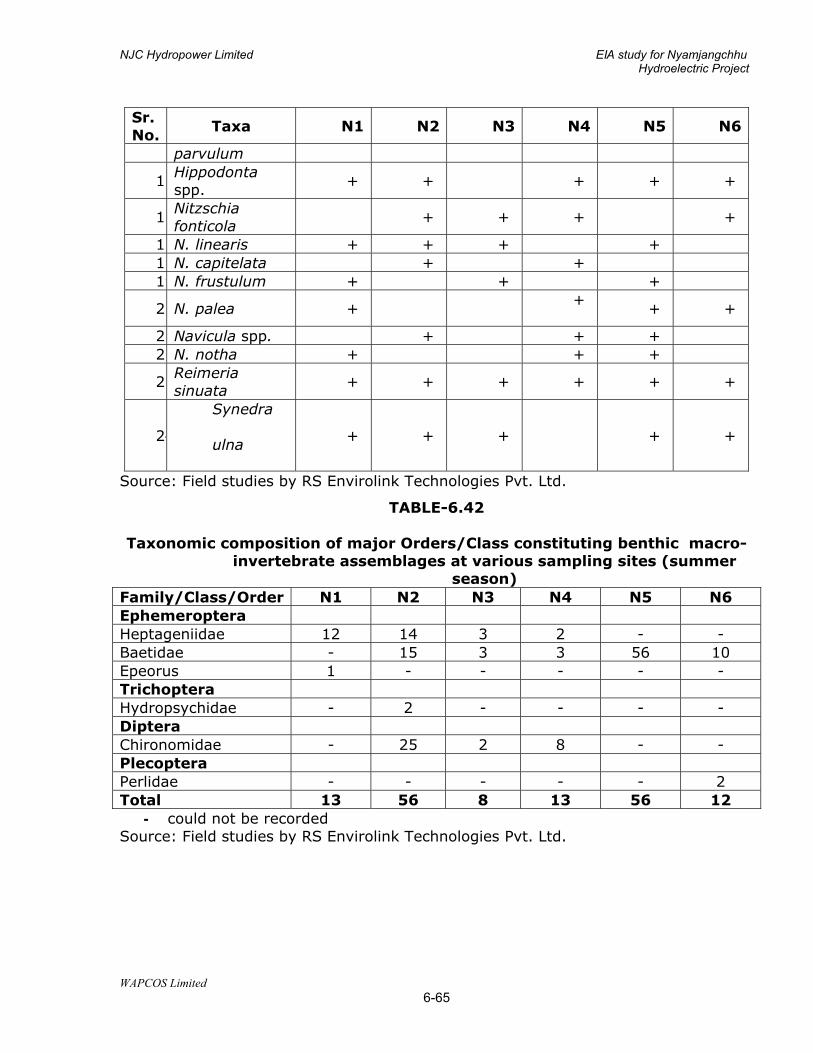
NJC Hydropower Limited EIA study for Nyamjangchhu Hydroelectric Project
WAPCOS Limited 6-65
Sr. No.
Taxa N1 N2 N3 N4 N5 N6
parvulum
15Hippodonta spp.
+ + + + +
16Nitzschia fonticola
+ + + +
17N. linearis + + + + 18N. capitelata + + 19N. frustulum + + +
20N. palea + +
+ +
2 Navicula spp. + + + 22N. notha + + +
23Reimeria sinuata
+ + + + + +
24
Synedra
ulna + + + + +
Source: Field studies by RS Envirolink Technologies Pvt. Ltd.
TABLE-6.42
Taxonomic composition of major Orders/Class constituting benthic macro-invertebrate assemblages at various sampling sites (summer
season) Family/Class/Order N1 N2 N3 N4 N5 N6 Ephemeroptera Heptageniidae 12 14 3 2 - - Baetidae - 15 3 3 56 10 Epeorus 1 - - - - - Trichoptera Hydropsychidae - 2 - - - - Diptera Chironomidae - 25 2 8 - - Plecoptera Perlidae - - - - - 2 Total 13 56 8 13 56 12
- could not be recorded Source: Field studies by RS Envirolink Technologies Pvt. Ltd.
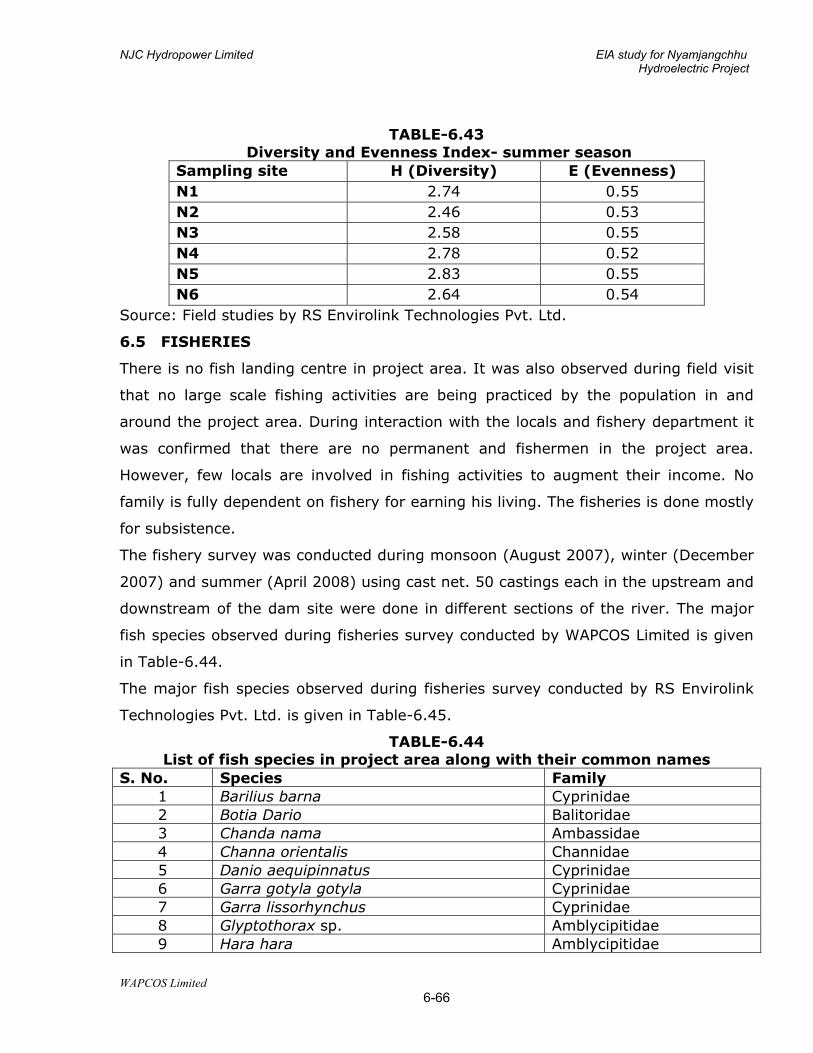
NJC Hydropower Limited EIA study for Nyamjangchhu Hydroelectric Project
WAPCOS Limited 6-66
TABLE-6.43
Diversity and Evenness Index- summer season Sampling site H (Diversity) E (Evenness) N1 2.74 0.55 N2 2.46 0.53 N3 2.58 0.55 N4 2.78 0.52 N5 2.83 0.55 N6 2.64 0.54
Source: Field studies by RS Envirolink Technologies Pvt. Ltd.
6.5 FISHERIES
There is no fish landing centre in project area. It was also observed during field visit
that no large scale fishing activities are being practiced by the population in and
around the project area. During interaction with the locals and fishery department it
was confirmed that there are no permanent and fishermen in the project area.
However, few locals are involved in fishing activities to augment their income. No
family is fully dependent on fishery for earning his living. The fisheries is done mostly
for subsistence.
The fishery survey was conducted during monsoon (August 2007), winter (December
2007) and summer (April 2008) using cast net. 50 castings each in the upstream and
downstream of the dam site were done in different sections of the river. The major
fish species observed during fisheries survey conducted by WAPCOS Limited is given
in Table-6.44.
The major fish species observed during fisheries survey conducted by RS Envirolink
Technologies Pvt. Ltd. is given in Table-6.45.
TABLE-6.44 List of fish species in project area along with their common names
S. No. Species Family 1 Barilius barna Cyprinidae 2 Botia Dario Balitoridae 3 Chanda nama Ambassidae 4 Channa orientalis Channidae 5 Danio aequipinnatus Cyprinidae 6 Garra gotyla gotyla Cyprinidae 7 Garra lissorhynchus Cyprinidae 8 Glyptothorax sp. Amblycipitidae 9 Hara hara Amblycipitidae
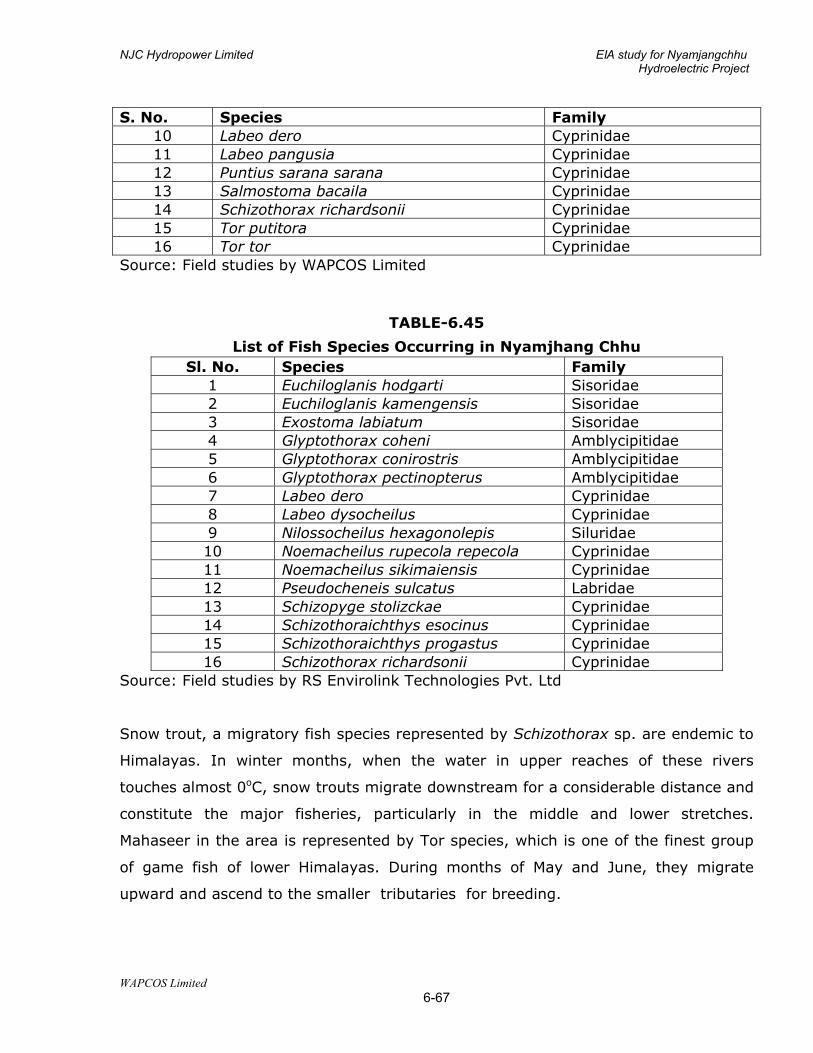
NJC Hydropower Limited EIA study for Nyamjangchhu Hydroelectric Project
WAPCOS Limited 6-67
S. No. Species Family 10 Labeo dero Cyprinidae 11 Labeo pangusia Cyprinidae 12 Puntius sarana sarana Cyprinidae 13 Salmostoma bacaila Cyprinidae 14 Schizothorax richardsonii Cyprinidae 15 Tor putitora Cyprinidae 16 Tor tor Cyprinidae
Source: Field studies by WAPCOS Limited
TABLE-6.45
List of Fish Species Occurring in Nyamjhang Chhu Sl. No. Species Family
1 Euchiloglanis hodgarti Sisoridae 2 Euchiloglanis kamengensis Sisoridae 3 Exostoma labiatum Sisoridae 4 Glyptothorax coheni Amblycipitidae 5 Glyptothorax conirostris Amblycipitidae 6 Glyptothorax pectinopterus Amblycipitidae 7 Labeo dero Cyprinidae 8 Labeo dysocheilus Cyprinidae 9 Nilossocheilus hexagonolepis Siluridae 10 Noemacheilus rupecola repecola Cyprinidae 11 Noemacheilus sikimaiensis Cyprinidae 12 Pseudocheneis sulcatus Labridae 13 Schizopyge stolizckae Cyprinidae 14 Schizothoraichthys esocinus Cyprinidae 15 Schizothoraichthys progastus Cyprinidae 16 Schizothorax richardsonii Cyprinidae
Source: Field studies by RS Envirolink Technologies Pvt. Ltd
Snow trout, a migratory fish species represented by Schizothorax sp. are endemic to
Himalayas. In winter months, when the water in upper reaches of these rivers
touches almost 0oC, snow trouts migrate downstream for a considerable distance and
constitute the major fisheries, particularly in the middle and lower stretches.
Mahaseer in the area is represented by Tor species, which is one of the finest group
of game fish of lower Himalayas. During months of May and June, they migrate
upward and ascend to the smaller tributaries for breeding.

NJC Hydropower Limited EIA study for Nyamjangchhu Hydroelectric Project
WAPCOS Limited 6-68
The proposed barrage may obstruct the migration route of the Mahaseer and Snow
trout which can be termed as one of the adverse impacts. The Mahaseer species
undertake upstream migration in river Nyamjangchhu during summer and monsoon
months for feeding and breeding. As the winter sets in the upper reaches, the
species takes a downstream journey.
NJC Hydropower Limited EIA study for Nyamjangchhu Hydroelectric Project
WAPCOS Limited
7-1
CHAPTER – 7
BASELINE SETTING FOR SOCIO-ECONOMIC ASPECTS
7.1 GENERAL
Most often, development projects are planned based on the availability of
exploitable natural resources. Upon commissioning these act on growth foci. This
attracts flow of finances, investments, jobs and other livelihood opportunities,
which brings in people from different cultural and social background. Such
planned activities not only provide impetus to the local economy but also bring
about a multi-dimensional economic, social and cultural change. Most often it
has been observed that such development projects are commissioned in
economically and socially backward areas, which are inhabited by some of the
indigenous populations. Commissioning of development project invariably brings
about a number of desired and undesired impacts along with it. The baseline
status has been divided into following three categories:
• Physico-chemical aspects • Ecological aspects • Socio-Economic aspects.
As part of the comprehensive EIA study, a comprehensive assessment of socio-
economic aspects was undertaken. The objective of this study was to ascertain
the overall socio-economic conditions prevailing in the study area, as well as
among the project affected families. Further, impacts, both positive as well as
negative, that are likely to occur during the construction and operation phase of
the proposed project on the socio-economic aspects of the environment have
also been assessed, which has been described in Chapter 8 of this report. A
Resettlement and Rehabilitation (R&R) plan has been devised for the Project
Affected Families (PAFs) who are likely to lose land, homestead or both due to
land acquisition for various project appurtenances as a part of the present
studies. The same has been outlined in Chapter 13 of the Environmental
Management Plan (EMP) report, which is a separate volume of this report.
The baseline setting for socio-economic aspects are outlined in the present
Chapter.
7.2 DEMOGRAPHIC PROFILE OF ARUNACHAL PRADESH
The demographic profile of Arunachal Pradesh is summarized in Table-7.1.
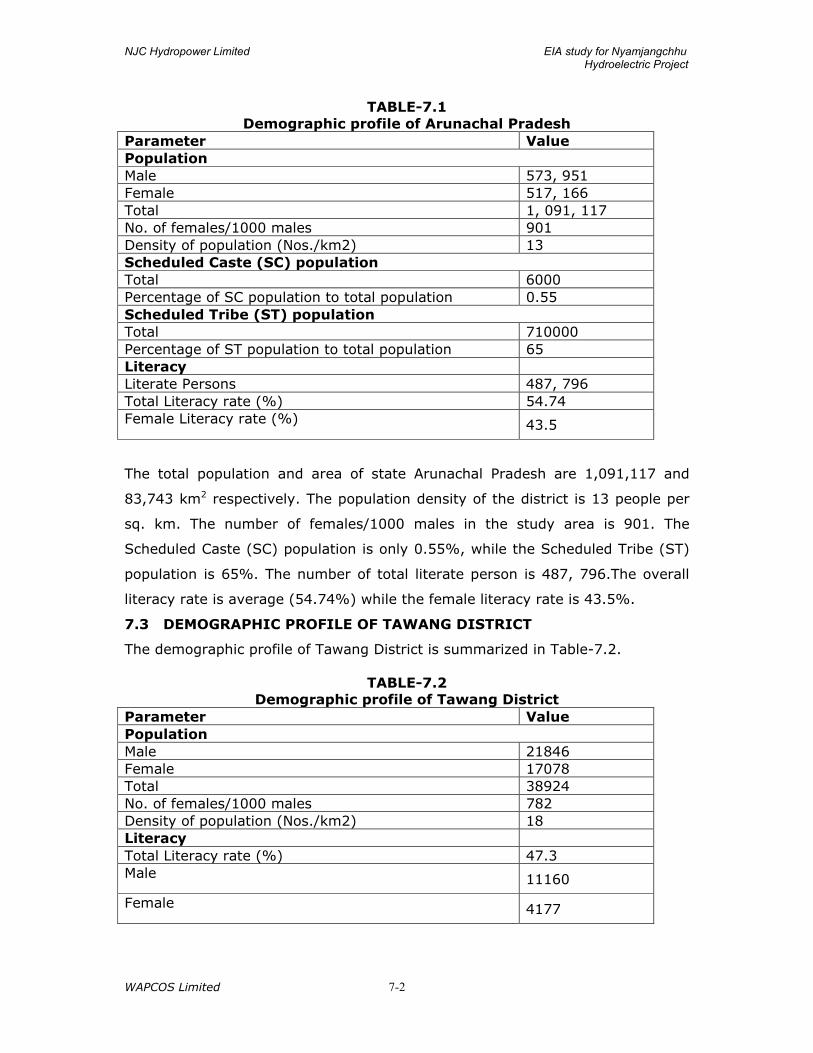
NJC Hydropower Limited EIA study for Nyamjangchhu Hydroelectric Project
WAPCOS Limited
7-2
TABLE-7.1 Demographic profile of Arunachal Pradesh
Parameter Value Population Male 573, 951 Female 517, 166 Total 1, 091, 117 No. of females/1000 males 901 Density of population (Nos./km2) 13 Scheduled Caste (SC) population Total 6000 Percentage of SC population to total population 0.55 Scheduled Tribe (ST) population Total 710000 Percentage of ST population to total population 65 Literacy Literate Persons 487, 796 Total Literacy rate (%) 54.74 Female Literacy rate (%) 43.5
The total population and area of state Arunachal Pradesh are 1,091,117 and
83,743 km2 respectively. The population density of the district is 13 people per
sq. km. The number of females/1000 males in the study area is 901. The
Scheduled Caste (SC) population is only 0.55%, while the Scheduled Tribe (ST)
population is 65%. The number of total literate person is 487, 796.The overall
literacy rate is average (54.74%) while the female literacy rate is 43.5%.
7.3 DEMOGRAPHIC PROFILE OF TAWANG DISTRICT
The demographic profile of Tawang District is summarized in Table-7.2.
TABLE-7.2 Demographic profile of Tawang District
Parameter Value Population Male 21846 Female 17078 Total 38924 No. of females/1000 males 782 Density of population (Nos./km2) 18 Literacy Total Literacy rate (%) 47.3 Male 11160
Female 4177
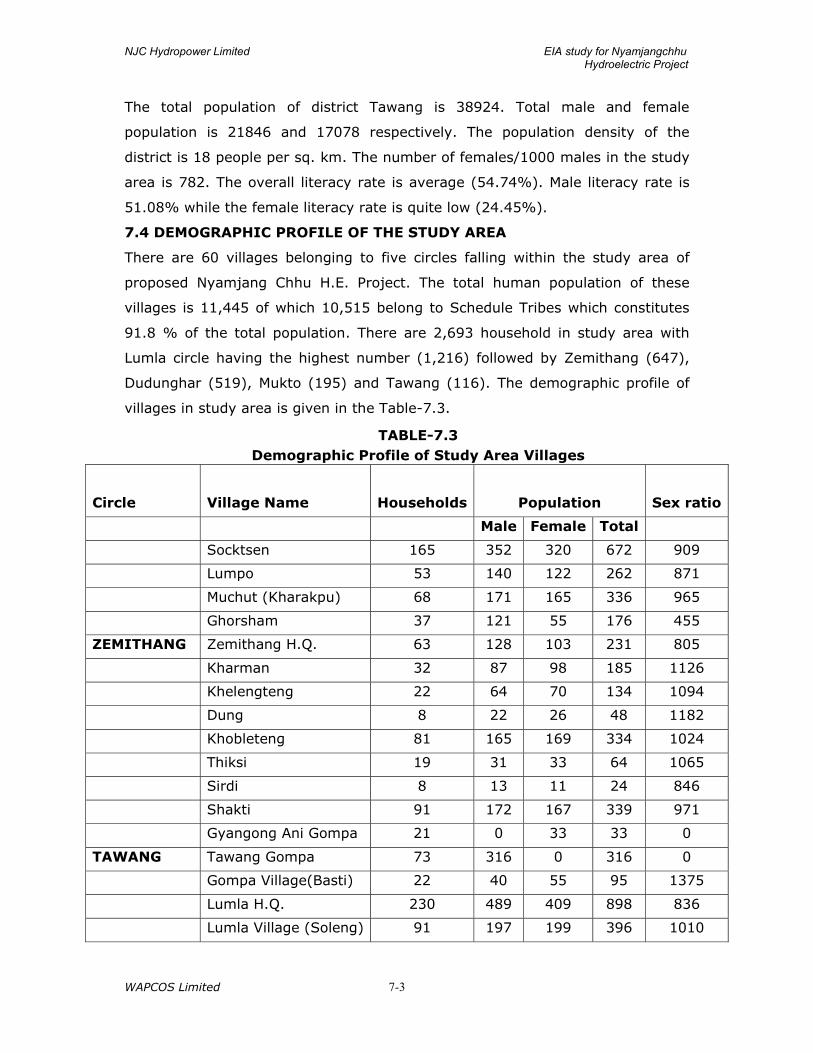
NJC Hydropower Limited EIA study for Nyamjangchhu Hydroelectric Project
WAPCOS Limited
7-3
The total population of district Tawang is 38924. Total male and female
population is 21846 and 17078 respectively. The population density of the
district is 18 people per sq. km. The number of females/1000 males in the study
area is 782. The overall literacy rate is average (54.74%). Male literacy rate is
51.08% while the female literacy rate is quite low (24.45%).
7.4 DEMOGRAPHIC PROFILE OF THE STUDY AREA
There are 60 villages belonging to five circles falling within the study area of
proposed Nyamjang Chhu H.E. Project. The total human population of these
villages is 11,445 of which 10,515 belong to Schedule Tribes which constitutes
91.8 % of the total population. There are 2,693 household in study area with
Lumla circle having the highest number (1,216) followed by Zemithang (647),
Dudunghar (519), Mukto (195) and Tawang (116). The demographic profile of
villages in study area is given in the Table-7.3.
TABLE-7.3 Demographic Profile of Study Area Villages
Circle Village Name Households Population Sex ratio
Male Female Total
Socktsen 165 352 320 672 909
Lumpo 53 140 122 262 871
Muchut (Kharakpu) 68 171 165 336 965
Ghorsham 37 121 55 176 455
ZEMITHANG Zemithang H.Q. 63 128 103 231 805
Kharman 32 87 98 185 1126
Khelengteng 22 64 70 134 1094
Dung 8 22 26 48 1182
Khobleteng 81 165 169 334 1024
Thiksi 19 31 33 64 1065
Sirdi 8 13 11 24 846
Shakti 91 172 167 339 971
Gyangong Ani Gompa 21 0 33 33 0
TAWANG Tawang Gompa 73 316 0 316 0
Gompa Village(Basti) 22 40 55 95 1375
Lumla H.Q. 230 489 409 898 836
Lumla Village (Soleng) 91 197 199 396 1010
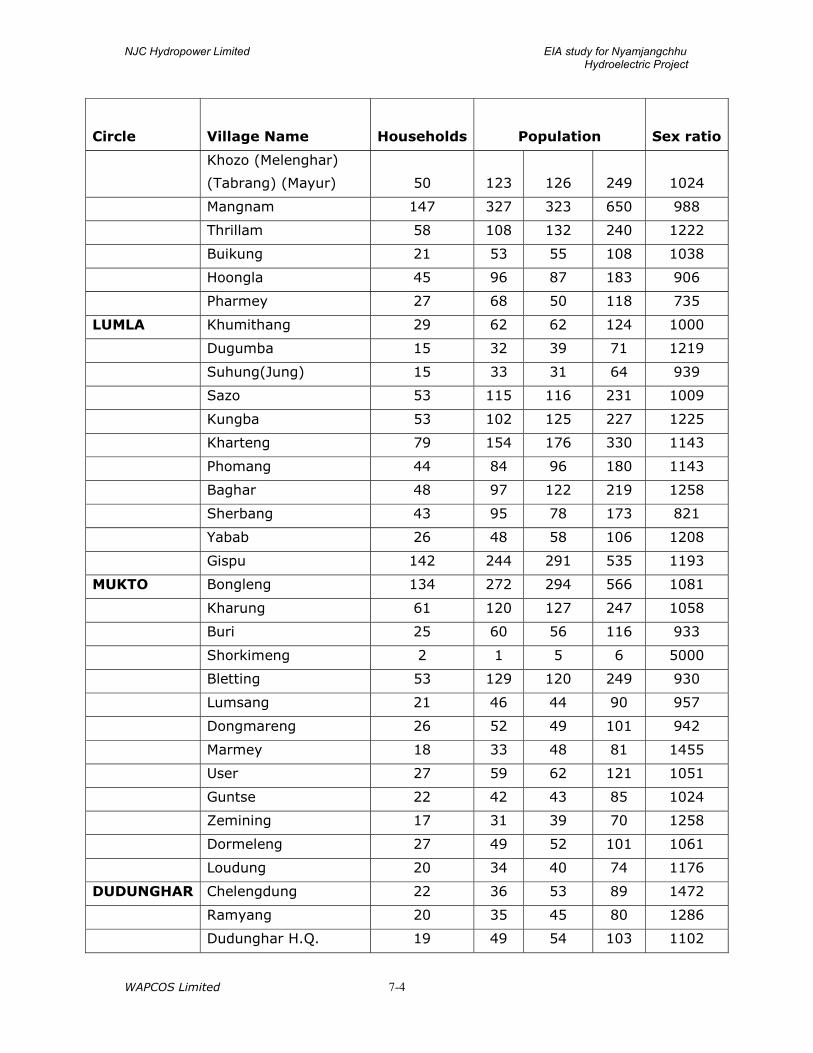
NJC Hydropower Limited EIA study for Nyamjangchhu Hydroelectric Project
WAPCOS Limited
7-4
Circle Village Name Households Population Sex ratio
Khozo (Melenghar)
(Tabrang) (Mayur) 50 123 126 249 1024
Mangnam 147 327 323 650 988
Thrillam 58 108 132 240 1222
Buikung 21 53 55 108 1038
Hoongla 45 96 87 183 906
Pharmey 27 68 50 118 735
LUMLA Khumithang 29 62 62 124 1000
Dugumba 15 32 39 71 1219
Suhung(Jung) 15 33 31 64 939
Sazo 53 115 116 231 1009
Kungba 53 102 125 227 1225
Kharteng 79 154 176 330 1143
Phomang 44 84 96 180 1143
Baghar 48 97 122 219 1258
Sherbang 43 95 78 173 821
Yabab 26 48 58 106 1208
Gispu 142 244 291 535 1193
MUKTO Bongleng 134 272 294 566 1081
Kharung 61 120 127 247 1058
Buri 25 60 56 116 933
Shorkimeng 2 1 5 6 5000
Bletting 53 129 120 249 930
Lumsang 21 46 44 90 957
Dongmareng 26 52 49 101 942
Marmey 18 33 48 81 1455
User 27 59 62 121 1051
Guntse 22 42 43 85 1024
Zemining 17 31 39 70 1258
Dormeleng 27 49 52 101 1061
Loudung 20 34 40 74 1176
DUDUNGHAR Chelengdung 22 36 53 89 1472
Ramyang 20 35 45 80 1286
Dudunghar H.Q. 19 49 54 103 1102
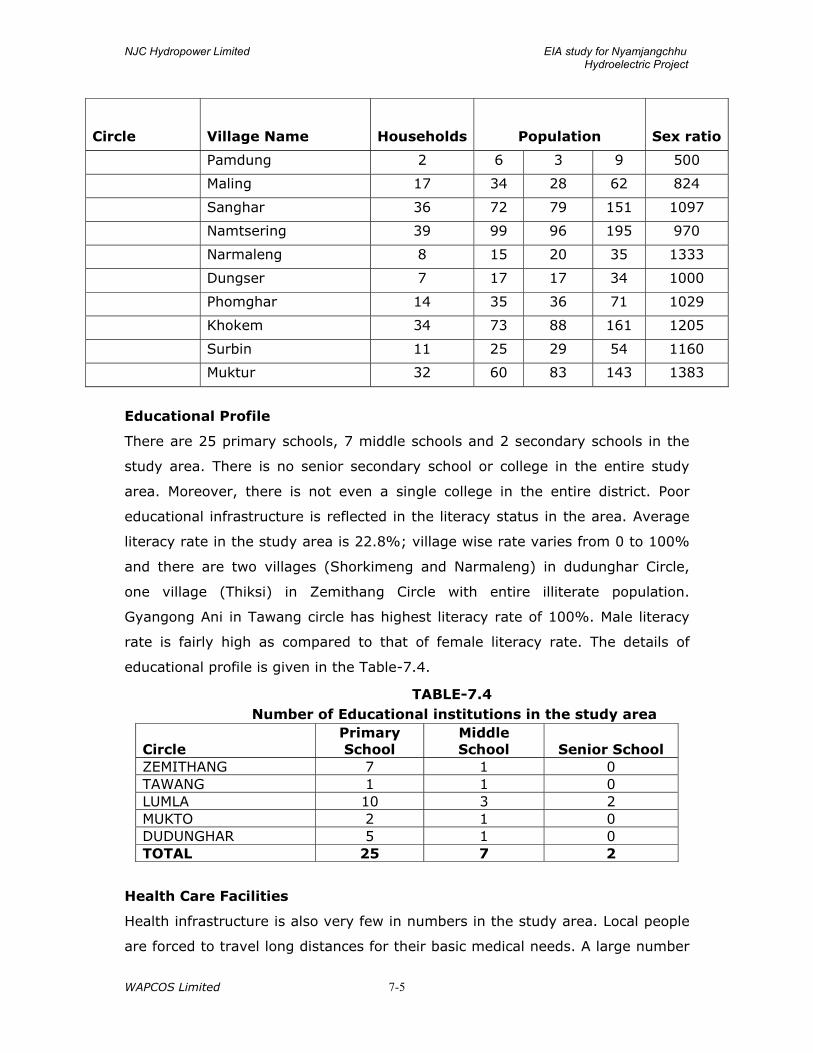
NJC Hydropower Limited EIA study for Nyamjangchhu Hydroelectric Project
WAPCOS Limited
7-5
Circle Village Name Households Population Sex ratio
Pamdung 2 6 3 9 500
Maling 17 34 28 62 824
Sanghar 36 72 79 151 1097
Namtsering 39 99 96 195 970
Narmaleng 8 15 20 35 1333
Dungser 7 17 17 34 1000
Phomghar 14 35 36 71 1029
Khokem 34 73 88 161 1205
Surbin 11 25 29 54 1160
Muktur 32 60 83 143 1383
Educational Profile
There are 25 primary schools, 7 middle schools and 2 secondary schools in the
study area. There is no senior secondary school or college in the entire study
area. Moreover, there is not even a single college in the entire district. Poor
educational infrastructure is reflected in the literacy status in the area. Average
literacy rate in the study area is 22.8%; village wise rate varies from 0 to 100%
and there are two villages (Shorkimeng and Narmaleng) in dudunghar Circle,
one village (Thiksi) in Zemithang Circle with entire illiterate population.
Gyangong Ani in Tawang circle has highest literacy rate of 100%. Male literacy
rate is fairly high as compared to that of female literacy rate. The details of
educational profile is given in the Table-7.4.
TABLE-7.4 Number of Educational institutions in the study area
Circle Primary School
Middle School Senior School
ZEMITHANG 7 1 0 TAWANG 1 1 0 LUMLA 10 3 2 MUKTO 2 1 0 DUDUNGHAR 5 1 0 TOTAL 25 7 2
Health Care Facilities
Health infrastructure is also very few in numbers in the study area. Local people
are forced to travel long distances for their basic medical needs. A large number
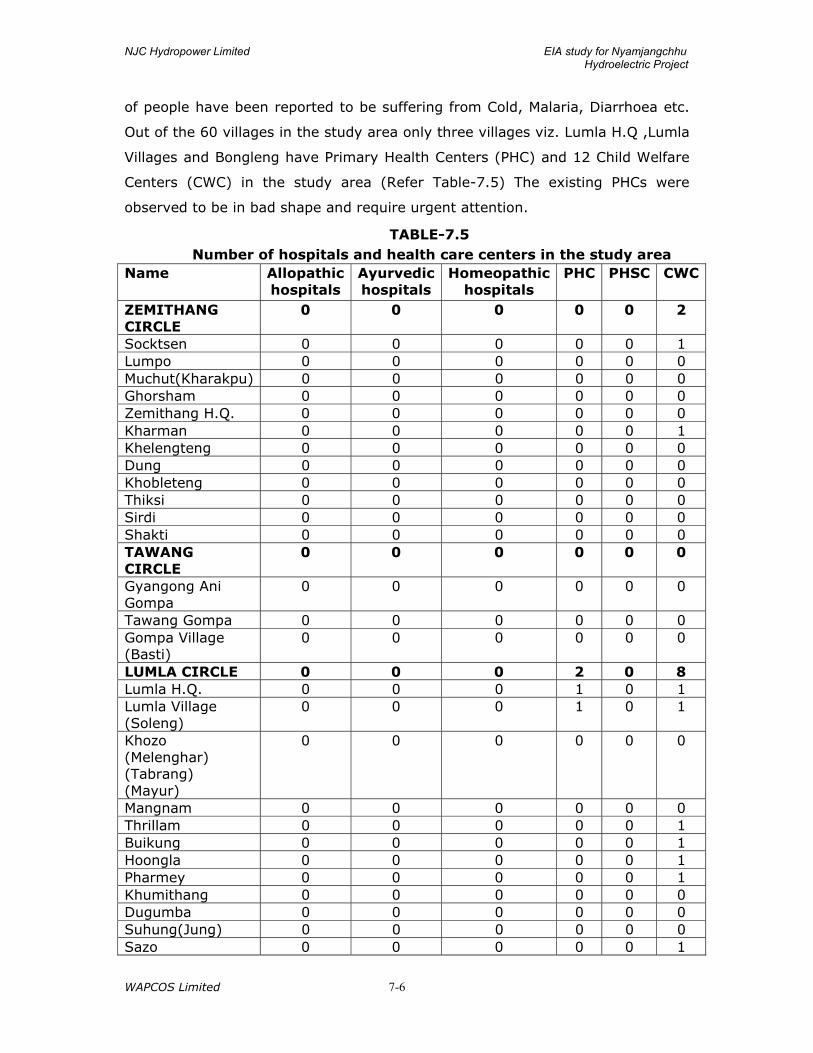
NJC Hydropower Limited EIA study for Nyamjangchhu Hydroelectric Project
WAPCOS Limited
7-6
of people have been reported to be suffering from Cold, Malaria, Diarrhoea etc.
Out of the 60 villages in the study area only three villages viz. Lumla H.Q ,Lumla
Villages and Bongleng have Primary Health Centers (PHC) and 12 Child Welfare
Centers (CWC) in the study area (Refer Table-7.5) The existing PHCs were
observed to be in bad shape and require urgent attention.
TABLE-7.5 Number of hospitals and health care centers in the study area
Name Allopathic hospitals
Ayurvedic hospitals
Homeopathic hospitals
PHC PHSC CWC
ZEMITHANG CIRCLE
0 0 0 0 0 2
Socktsen 0 0 0 0 0 1 Lumpo 0 0 0 0 0 0 Muchut(Kharakpu) 0 0 0 0 0 0 Ghorsham 0 0 0 0 0 0 Zemithang H.Q. 0 0 0 0 0 0 Kharman 0 0 0 0 0 1 Khelengteng 0 0 0 0 0 0 Dung 0 0 0 0 0 0 Khobleteng 0 0 0 0 0 0 Thiksi 0 0 0 0 0 0 Sirdi 0 0 0 0 0 0 Shakti 0 0 0 0 0 0 TAWANG CIRCLE
0 0 0 0 0 0
Gyangong Ani Gompa
0 0 0 0 0 0
Tawang Gompa 0 0 0 0 0 0 Gompa Village (Basti)
0 0 0 0 0 0
LUMLA CIRCLE 0 0 0 2 0 8 Lumla H.Q. 0 0 0 1 0 1 Lumla Village (Soleng)
0 0 0 1 0 1
Khozo (Melenghar) (Tabrang) (Mayur)
0 0 0 0 0 0
Mangnam 0 0 0 0 0 0 Thrillam 0 0 0 0 0 1 Buikung 0 0 0 0 0 1 Hoongla 0 0 0 0 0 1 Pharmey 0 0 0 0 0 1 Khumithang 0 0 0 0 0 0 Dugumba 0 0 0 0 0 0 Suhung(Jung) 0 0 0 0 0 0 Sazo 0 0 0 0 0 1

NJC Hydropower Limited EIA study for Nyamjangchhu Hydroelectric Project
WAPCOS Limited
7-7
Name Allopathic hospitals
Ayurvedic hospitals
Homeopathic hospitals
PHC PHSC CWC
Kungba 0 0 0 0 0 0 Kharteng 0 0 0 0 0 0 Phomang 0 0 0 0 0 0 Baghar 0 0 0 0 0 0 Sherbang 0 0 0 0 0 0 Yabab 0 0 0 0 0 0 Gispu 0 0 0 0 0 1 MUKTO CIRCLE 0 0 0 1 0 1 Bongleng 0 0 0 1 0 1 Kharung 0 0 0 0 0 0 DUDUNGHAR CIRCLE
0 0 0 0 0 1
Buri 0 0 0 0 0 0 Shorkimeng 0 0 0 0 0 0 Bletting 0 0 0 0 0 0 Lumsang 0 0 0 0 0 0 Dongmareng 0 0 0 0 0 0 Marmey 0 0 0 0 0 0 User 0 0 0 0 0 0 Guntse 0 0 0 0 0 0 Zemining 0 0 0 0 0 0 Dormeleng 0 0 0 0 0 0 Loudung 0 0 0 0 0 0 Chelengdung 0 0 0 0 0 0 Ramyang 0 0 0 0 0 1 Dudunghar H.Q. 0 0 0 0 0 0 Pamdung 0 0 0 0 0 0 Maling 0 0 0 0 0 0 Sanghar 0 0 0 0 0 0 Namtsering 0 0 0 0 0 0 Narmaleng 0 0 0 0 0 0 Dungser 0 0 0 0 0 0 Phomghar 0 0 0 0 0 0 Khokem 0 0 0 0 0 0 Surbin 0 0 0 0 0 0 Muktur 0 0 0 0 0 0 TOTAL 0 0 0 3 0 12 Note: PHC= Primary Health Centre, PHSC=Primary Health Sub Centre CWC=Child Welfare Centre
Occupational Profile
Distribution of the working population among the five circles in the study area
show that Lumla has the highest percentage of working population, whereas
Seppa and Pipu has the lowest percentage of working population.
NJC Hydropower Limited EIA study for Nyamjangchhu Hydroelectric Project
WAPCOS Limited
7-8
Occupational status of the main, marginal and non workers of the vicinity
villages in the project area show that there is nearly an equal distribution of the
males and females workers in the marginal worker population. However, 56% of
the male population and 44% of the female population constitutes the total
population of main workers. 53%t of the female population and 47 percent of
the male population constitutes the total non workers population
Other Amenities
The current status of transport in the villages is highly unsatisfactory. Among the
total 60 villages, only 12 have bus service, only 2 villages have the postal and
banking facility.
7.5 SOCIO-ECONOMIC SURVEY FOR PROJECT AFFECTED FAMILIES
The socio-economic assessment has also been carried-out in those villages
where land is proposed to be acquired for the proposed Nyanjangchhu hydro-
electric project.
Most of the information required to assess the socio-economic profile and
property enumeration for preparation of Resettlement and Rehabilitation Master
Plan was collected with the help of a detailed quantitative 100% survey of the
PAFs in the affected villages. The information on the following socio-economic
parameters was collected:
• Transhumance • Demographic profile • Educational levels • Occupational Profile • Land holding pattern • Cropping pattern • Assets owned • Livestock and other socio-economic parameters etc.
Based on our preliminary field investigations, and through literature review, a
household level survey schedule was devised, to capture the overall socio-
economic status of the PAFs. The survey schedule was formulated as a series of
prompts, rather than a structured questionnaire, to allow the investigators to
phrase queries according to the circumstance during interpersonal interviews
with PAFs. This survey schedule was pre-tested in the field, prior to start of the
socio-economic survey.
For the process of primary data collection, a survey team comprising of local
investigators was put together. Members of the survey team (investigators/
NJC Hydropower Limited EIA study for Nyamjangchhu Hydroelectric Project
WAPCOS Limited
7-9
surveyors) were local educated youths. Training was imparted to the members
of the survey team, wherein they are appraised about the purpose of the survey
and on the method of interaction with the PAFs and to elicit required information
and how to filled-in the survey schedules. The survey team traversed the entire
project area, including submergence area, barrage alignment and sites of other
project appurtenances in each of the project affected villages. The survey team
visited 3 villages in which private land is proposed to be acquired, namely,
Khaleteng, Kharteng and Soksen. As per our assessment, based on ROR, about
47 project affected persons are expected to lose land (agricultural/non-
agricultural/homestead) in varying proportion. This list was verified during the
survey work, and by the end of the work, the survey team had covered all the
47 project affected families. The survey team coordinator scrutinized the filled-in
survey schedules for internal discrepancies and missing information; which were
eliminated in the field, in some cases by either going back to the concerned
families, before it was coded for computerization.
The filled-in survey schedules were scrutinized at WAPCOS headquarters (Delhi)
as well, before they were coded and computerized using database computer
software. The raw data was then compiled and systematized before it was
analyzed for various socio-economic parameters. Data analysis was undertaken
using Statistical Package for Social Sciences (SPSS) computer software. The
analyzed outputs have been used in reporting the findings of the socio-economic
survey.
The state of Arunachal Pradesh has its own state-level resettlement and
rehabilitation policy/guidelines. As per Notification No LM – 20/2005 dated
20th Sep. 2008 has adopted the State Rehabilitation and Resettlement
Policy, 2008 for Project Affected Families in the state of Arunachal
Pradesh. The National Policy on Resettlement and Rehabilitation for
Project Affected Families – 2007 (NRRP – 2007) has also been used to
prepare the resettlement and rehabilitation plan for the PAFs of
Nyamjangchhu hydro-electric project.
7.6 SOCIO-ECONOMIC PROFILE OF THE PROJECT AFFECTED FAMILIES
Commissioning of development projects invariably brings about a number of
desired and undesired impacts along with it. Most often, development projects
are planned based on the availability of exploitable natural resources. Upon

NJC Hydropower Limited EIA study for Nyamjangchhu Hydroelectric Project
WAPCOS Limited
7-10
commissioning, these areas act as growth foci. This attracts flow of finances,
investments, job and other livelihood opportunities, which brings in people from
different cultural and social backgrounds. Such planned activities not only
provide impetus to the local economy but also bring about a multi-dimensional
social and cultural change in the once dormant area. Most often it has been
observed, such development projects are commissioned in economically and
socially backward areas, which are inhabited by some of the most indigenous
populations.
The Nyamjangchhu hydro-electric project is located in one of the backward
regions of Arunachal Pradesh, which thrives on the tourism industry. A detailed
socio-economic study was undertaken in mid-June 2009. The study was taken
up to understand the overall social and economic status of the project affected
families (PAFs) of this project, their life-style and to assess the likely impacts of
the project in terms of loss of personal and community property of the PAFs.
This Chapter outlines the overall socio-economic status of the PAFs residing in
the project area. A total of 5 hamlets/villages are likely to get affected as a
result of land acquisition due to the proposed project. All these villages are
located in district Tawang. The list of project affected villages, affected due to
the process of land acquisition is outlined in Table 7.6.
TABLE 7.6
Project affected hamlets/villages due to the process of land acquisition S.
No. Name of Project
Affected hamlets/ villages
1 Khaleteng 2 Kharteng 3 Soksen
7.6.1 Demographic Profile of Affected Population
The detailed description of the socio-economic profile is highlighted in the
following sub-sections, which gives an overall summary of the socio-economic
conditions of the affected population residing in the project study area. Census
survey covering 100% of the PAFs were conducted in the 3 project affected
villages/hamlets that reckoned about 47 families. Amongst these 47 families, a
total population of 209 persons was covered.
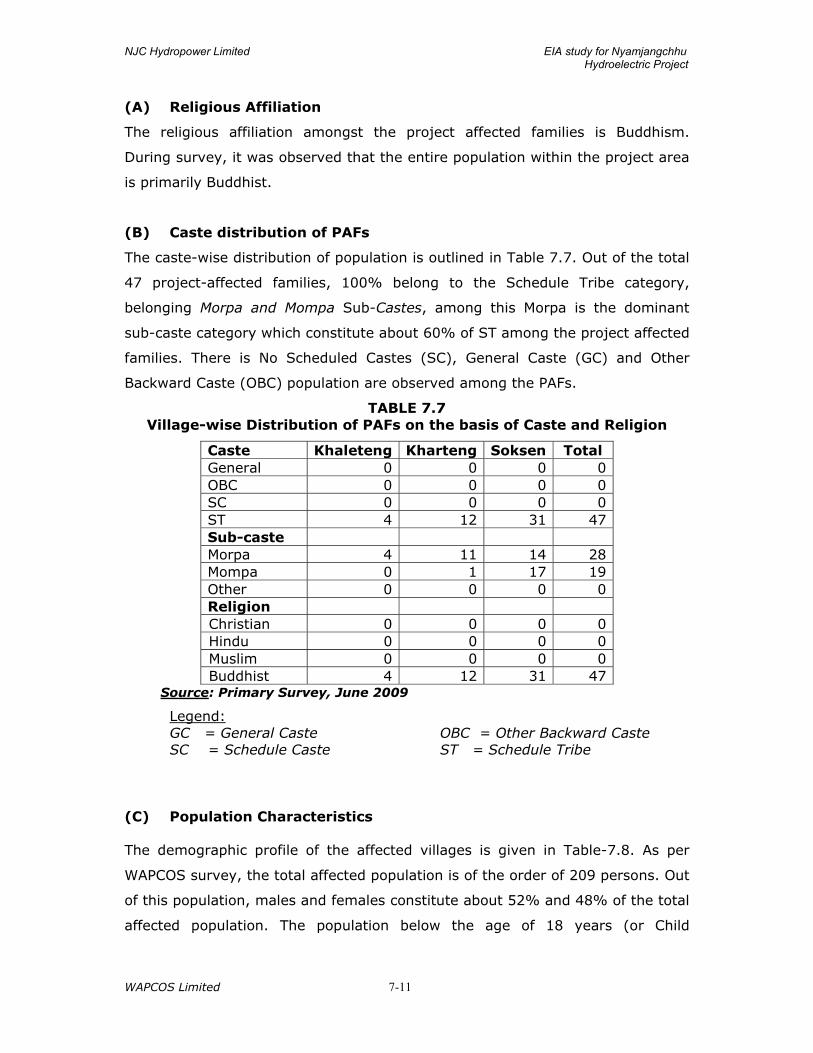
NJC Hydropower Limited EIA study for Nyamjangchhu Hydroelectric Project
WAPCOS Limited
7-11
(A) Religious Affiliation
The religious affiliation amongst the project affected families is Buddhism.
During survey, it was observed that the entire population within the project area
is primarily Buddhist.
(B) Caste distribution of PAFs
The caste-wise distribution of population is outlined in Table 7.7. Out of the total
47 project-affected families, 100% belong to the Schedule Tribe category,
belonging Morpa and Mompa Sub-Castes, among this Morpa is the dominant
sub-caste category which constitute about 60% of ST among the project affected
families. There is No Scheduled Castes (SC), General Caste (GC) and Other
Backward Caste (OBC) population are observed among the PAFs.
TABLE 7.7 Village-wise Distribution of PAFs on the basis of Caste and Religion
Caste Khaleteng Kharteng Soksen Total General 0 0 0 0 OBC 0 0 0 0 SC 0 0 0 0 ST 4 12 31 47 Sub-caste Morpa 4 11 14 28 Mompa 0 1 17 19 Other 0 0 0 0 Religion Christian 0 0 0 0 Hindu 0 0 0 0 Muslim 0 0 0 0 Buddhist 4 12 31 47
Source: Primary Survey, June 2009
Legend: GC = General Caste OBC = Other Backward Caste SC = Schedule Caste ST = Schedule Tribe
(C) Population Characteristics
The demographic profile of the affected villages is given in Table-7.8. As per
WAPCOS survey, the total affected population is of the order of 209 persons. Out
of this population, males and females constitute about 52% and 48% of the total
affected population. The population below the age of 18 years (or Child
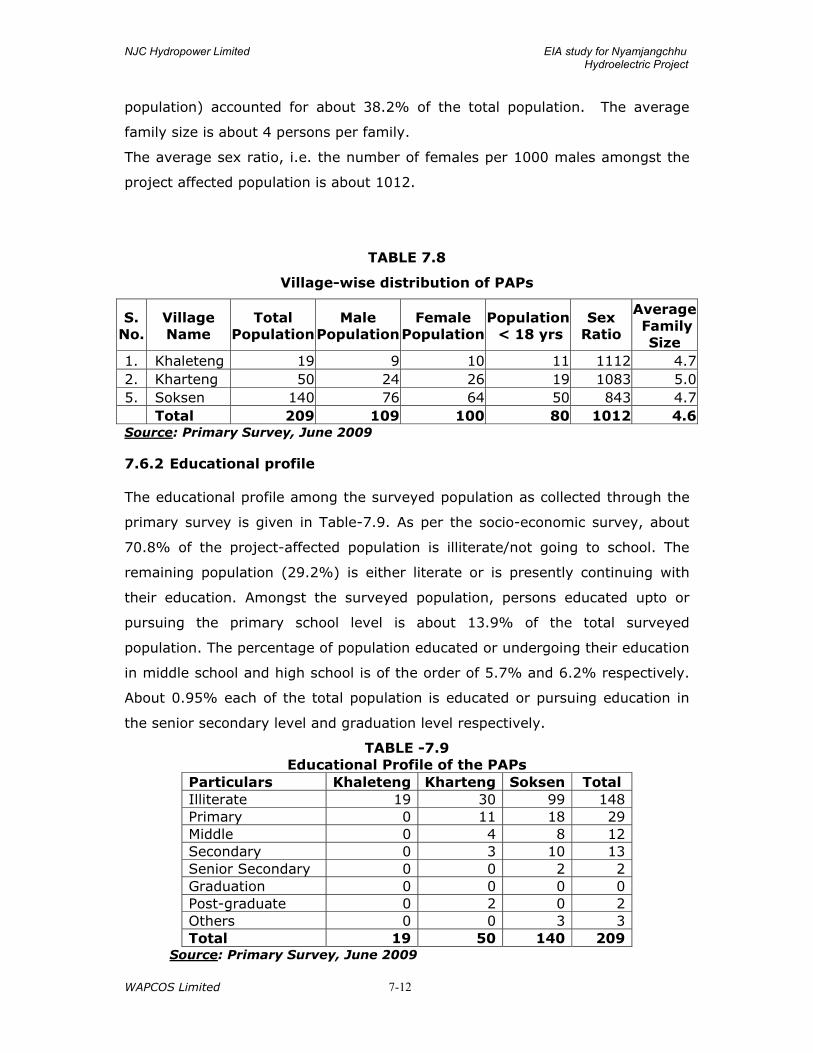
NJC Hydropower Limited EIA study for Nyamjangchhu Hydroelectric Project
WAPCOS Limited
7-12
population) accounted for about 38.2% of the total population. The average
family size is about 4 persons per family.
The average sex ratio, i.e. the number of females per 1000 males amongst the
project affected population is about 1012.
TABLE 7.8
Village-wise distribution of PAPs
S. No.
Village Name
Total Population
Male Population
Female Population
Population < 18 yrs
Sex Ratio
Average Family
Size 1. Khaleteng 19 9 10 11 1112 4.72. Kharteng 50 24 26 19 1083 5.05. Soksen 140 76 64 50 843 4.7 Total 209 109 100 80 1012 4.6
Source: Primary Survey, June 2009
7.6.2 Educational profile
The educational profile among the surveyed population as collected through the
primary survey is given in Table-7.9. As per the socio-economic survey, about
70.8% of the project-affected population is illiterate/not going to school. The
remaining population (29.2%) is either literate or is presently continuing with
their education. Amongst the surveyed population, persons educated upto or
pursuing the primary school level is about 13.9% of the total surveyed
population. The percentage of population educated or undergoing their education
in middle school and high school is of the order of 5.7% and 6.2% respectively.
About 0.95% each of the total population is educated or pursuing education in
the senior secondary level and graduation level respectively.
TABLE -7.9 Educational Profile of the PAPs
Particulars Khaleteng Kharteng Soksen Total Illiterate 19 30 99 148 Primary 0 11 18 29 Middle 0 4 8 12 Secondary 0 3 10 13 Senior Secondary 0 0 2 2 Graduation 0 0 0 0 Post-graduate 0 2 0 2 Others 0 0 3 3 Total 19 50 140 209
Source: Primary Survey, June 2009
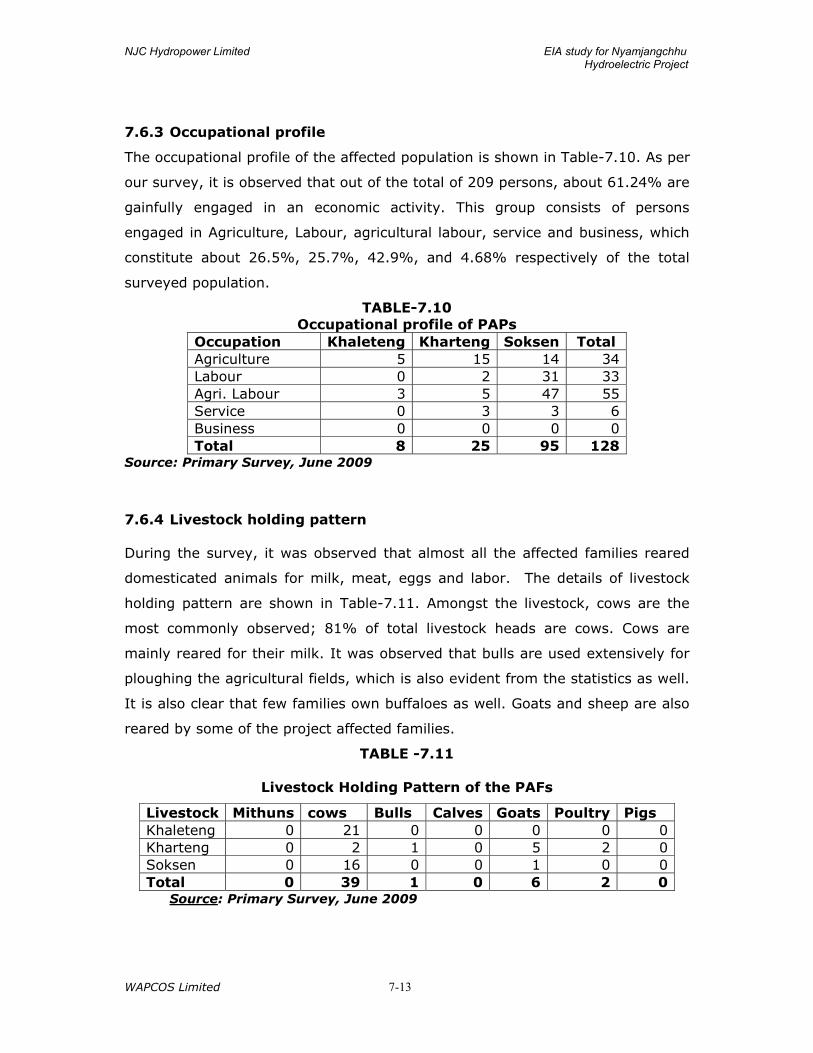
NJC Hydropower Limited EIA study for Nyamjangchhu Hydroelectric Project
WAPCOS Limited
7-13
7.6.3 Occupational profile
The occupational profile of the affected population is shown in Table-7.10. As per
our survey, it is observed that out of the total of 209 persons, about 61.24% are
gainfully engaged in an economic activity. This group consists of persons
engaged in Agriculture, Labour, agricultural labour, service and business, which
constitute about 26.5%, 25.7%, 42.9%, and 4.68% respectively of the total
surveyed population.
TABLE-7.10 Occupational profile of PAPs
Occupation Khaleteng Kharteng Soksen Total Agriculture 5 15 14 34 Labour 0 2 31 33 Agri. Labour 3 5 47 55 Service 0 3 3 6 Business 0 0 0 0 Total 8 25 95 128
Source: Primary Survey, June 2009
7.6.4 Livestock holding pattern
During the survey, it was observed that almost all the affected families reared
domesticated animals for milk, meat, eggs and labor. The details of livestock
holding pattern are shown in Table-7.11. Amongst the livestock, cows are the
most commonly observed; 81% of total livestock heads are cows. Cows are
mainly reared for their milk. It was observed that bulls are used extensively for
ploughing the agricultural fields, which is also evident from the statistics as well.
It is also clear that few families own buffaloes as well. Goats and sheep are also
reared by some of the project affected families.
TABLE -7.11
Livestock Holding Pattern of the PAFs
Livestock Mithuns cows Bulls Calves Goats Poultry Pigs Khaleteng 0 21 0 0 0 0 0 Kharteng 0 2 1 0 5 2 0 Soksen 0 16 0 0 1 0 0 Total 0 39 1 0 6 2 0
Source: Primary Survey, June 2009
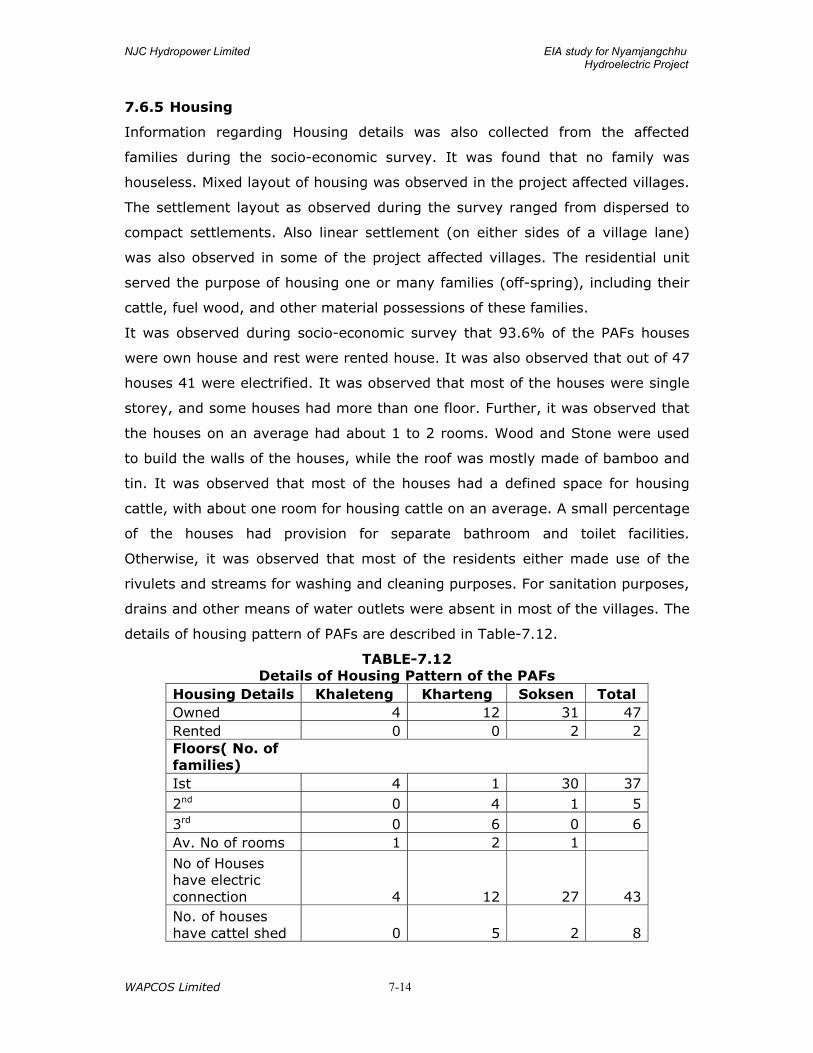
NJC Hydropower Limited EIA study for Nyamjangchhu Hydroelectric Project
WAPCOS Limited
7-14
7.6.5 Housing
Information regarding Housing details was also collected from the affected
families during the socio-economic survey. It was found that no family was
houseless. Mixed layout of housing was observed in the project affected villages.
The settlement layout as observed during the survey ranged from dispersed to
compact settlements. Also linear settlement (on either sides of a village lane)
was also observed in some of the project affected villages. The residential unit
served the purpose of housing one or many families (off-spring), including their
cattle, fuel wood, and other material possessions of these families.
It was observed during socio-economic survey that 93.6% of the PAFs houses
were own house and rest were rented house. It was also observed that out of 47
houses 41 were electrified. It was observed that most of the houses were single
storey, and some houses had more than one floor. Further, it was observed that
the houses on an average had about 1 to 2 rooms. Wood and Stone were used
to build the walls of the houses, while the roof was mostly made of bamboo and
tin. It was observed that most of the houses had a defined space for housing
cattle, with about one room for housing cattle on an average. A small percentage
of the houses had provision for separate bathroom and toilet facilities.
Otherwise, it was observed that most of the residents either made use of the
rivulets and streams for washing and cleaning purposes. For sanitation purposes,
drains and other means of water outlets were absent in most of the villages. The
details of housing pattern of PAFs are described in Table-7.12.
TABLE-7.12 Details of Housing Pattern of the PAFs
Housing Details Khaleteng Kharteng Soksen Total Owned 4 12 31 47 Rented 0 0 2 2 Floors( No. of families) Ist 4 1 30 37 2nd 0 4 1 5 3rd 0 6 0 6 Av. No of rooms 1 2 1
No of Houses have electric connection 4 12 27 43 No. of houses have cattel shed 0 5 2 8
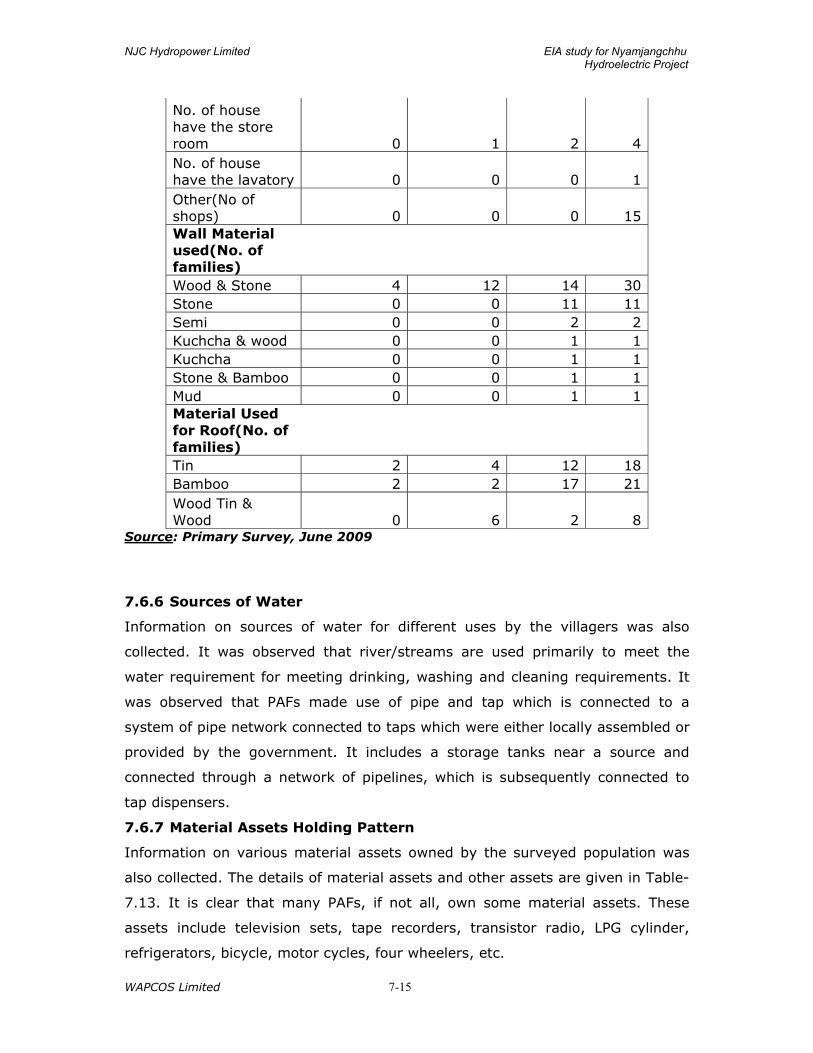
NJC Hydropower Limited EIA study for Nyamjangchhu Hydroelectric Project
WAPCOS Limited
7-15
No. of house have the store room 0 1 2 4 No. of house have the lavatory 0 0 0 1 Other(No of shops) 0 0 0 15 Wall Material used(No. of families) Wood & Stone 4 12 14 30 Stone 0 0 11 11 Semi 0 0 2 2 Kuchcha & wood 0 0 1 1 Kuchcha 0 0 1 1 Stone & Bamboo 0 0 1 1 Mud 0 0 1 1 Material Used for Roof(No. of families) Tin 2 4 12 18 Bamboo 2 2 17 21 Wood Tin & Wood 0 6 2 8
Source: Primary Survey, June 2009
7.6.6 Sources of Water
Information on sources of water for different uses by the villagers was also
collected. It was observed that river/streams are used primarily to meet the
water requirement for meeting drinking, washing and cleaning requirements. It
was observed that PAFs made use of pipe and tap which is connected to a
system of pipe network connected to taps which were either locally assembled or
provided by the government. It includes a storage tanks near a source and
connected through a network of pipelines, which is subsequently connected to
tap dispensers.
7.6.7 Material Assets Holding Pattern
Information on various material assets owned by the surveyed population was
also collected. The details of material assets and other assets are given in Table-
7.13. It is clear that many PAFs, if not all, own some material assets. These
assets include television sets, tape recorders, transistor radio, LPG cylinder,
refrigerators, bicycle, motor cycles, four wheelers, etc.
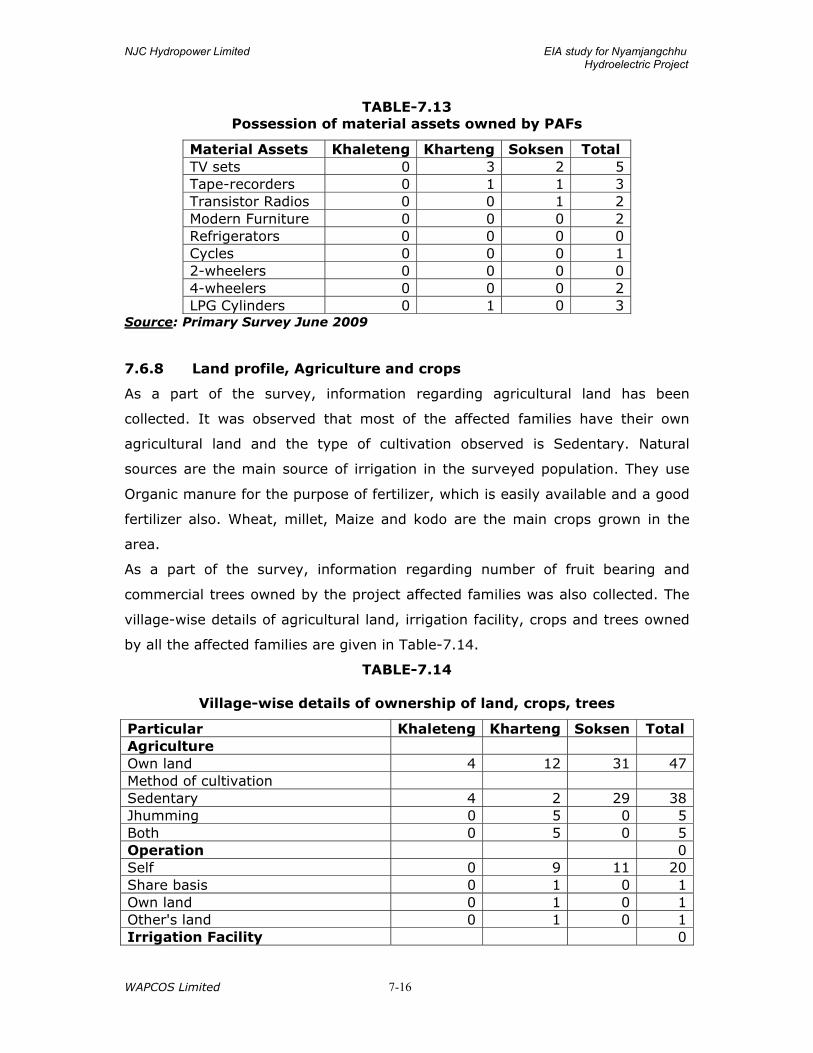
NJC Hydropower Limited EIA study for Nyamjangchhu Hydroelectric Project
WAPCOS Limited
7-16
TABLE-7.13 Possession of material assets owned by PAFs
Material Assets Khaleteng Kharteng Soksen Total TV sets 0 3 2 5 Tape-recorders 0 1 1 3 Transistor Radios 0 0 1 2 Modern Furniture 0 0 0 2 Refrigerators 0 0 0 0 Cycles 0 0 0 1 2-wheelers 0 0 0 0 4-wheelers 0 0 0 2 LPG Cylinders 0 1 0 3
Source: Primary Survey June 2009
7.6.8 Land profile, Agriculture and crops
As a part of the survey, information regarding agricultural land has been
collected. It was observed that most of the affected families have their own
agricultural land and the type of cultivation observed is Sedentary. Natural
sources are the main source of irrigation in the surveyed population. They use
Organic manure for the purpose of fertilizer, which is easily available and a good
fertilizer also. Wheat, millet, Maize and kodo are the main crops grown in the
area.
As a part of the survey, information regarding number of fruit bearing and
commercial trees owned by the project affected families was also collected. The
village-wise details of agricultural land, irrigation facility, crops and trees owned
by all the affected families are given in Table-7.14.
TABLE-7.14
Village-wise details of ownership of land, crops, trees
Particular Khaleteng Kharteng Soksen Total Agriculture Own land 4 12 31 47 Method of cultivation Sedentary 4 2 29 38 Jhumming 0 5 0 5 Both 0 5 0 5 Operation 0 Self 0 9 11 20 Share basis 0 1 0 1 Own land 0 1 0 1 Other's land 0 1 0 1 Irrigation Facility 0
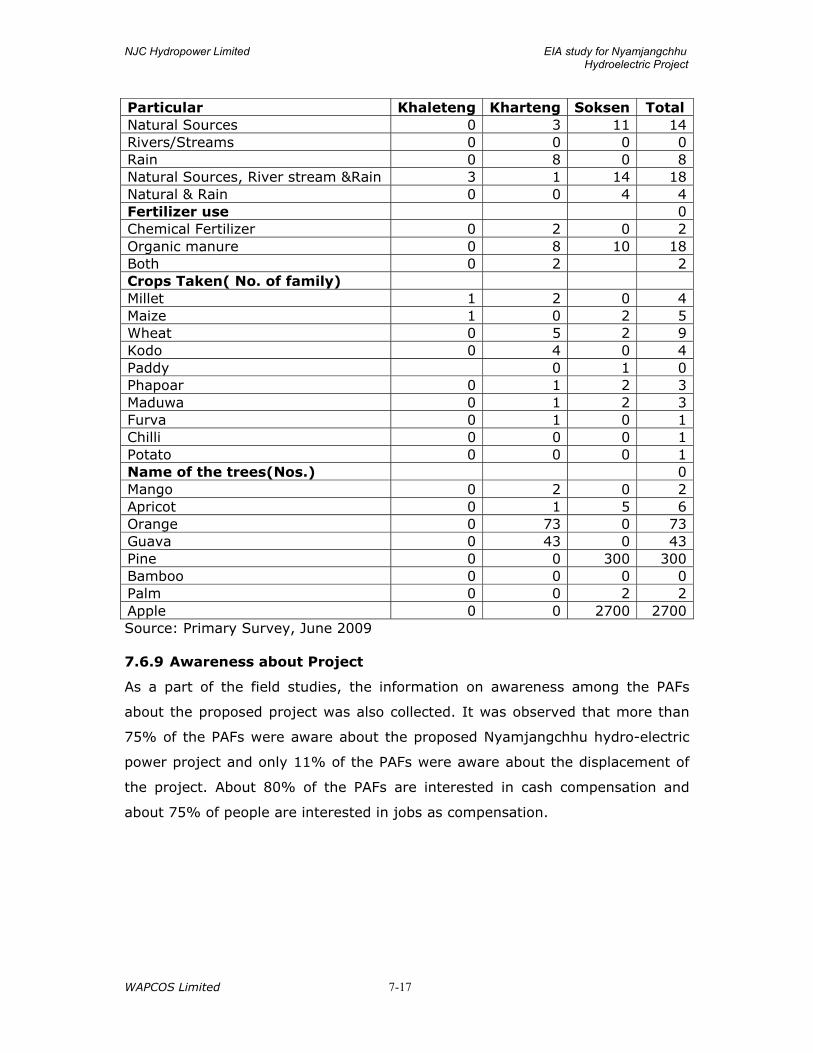
NJC Hydropower Limited EIA study for Nyamjangchhu Hydroelectric Project
WAPCOS Limited
7-17
Particular Khaleteng Kharteng Soksen Total Natural Sources 0 3 11 14 Rivers/Streams 0 0 0 0 Rain 0 8 0 8 Natural Sources, River stream &Rain 3 1 14 18 Natural & Rain 0 0 4 4 Fertilizer use 0 Chemical Fertilizer 0 2 0 2 Organic manure 0 8 10 18 Both 0 2 2 Crops Taken( No. of family) Millet 1 2 0 4 Maize 1 0 2 5 Wheat 0 5 2 9 Kodo 0 4 0 4 Paddy 0 1 0 Phapoar 0 1 2 3 Maduwa 0 1 2 3 Furva 0 1 0 1 Chilli 0 0 0 1 Potato 0 0 0 1 Name of the trees(Nos.) 0 Mango 0 2 0 2 Apricot 0 1 5 6 Orange 0 73 0 73 Guava 0 43 0 43 Pine 0 0 300 300 Bamboo 0 0 0 0 Palm 0 0 2 2 Apple 0 0 2700 2700 Source: Primary Survey, June 2009
7.6.9 Awareness about Project
As a part of the field studies, the information on awareness among the PAFs
about the proposed project was also collected. It was observed that more than
75% of the PAFs were aware about the proposed Nyamjangchhu hydro-electric
power project and only 11% of the PAFs were aware about the displacement of
the project. About 80% of the PAFs are interested in cash compensation and
about 75% of people are interested in jobs as compensation.
NJC Hydropower Limited EIA study for Nyamjangchhu Hydroelectric Project
WAPCOS Limited
8-1
CHAPTER-8
PREDICTION OF IMPACTS
8.1 GENERAL
Based on the project details and the baseline environmental status, potential
impacts as a result of the construction and operation of the proposed
Nyamjangchhu hydroelectric project have been identified. This Chapter
addresses the basic concepts and methodological approach for conducting a
scientifically based analysis of the potential impacts likely to accrue as a result of
the proposed project. The Environmental Impact Assessment (EIA) for quite a
few disciplines is subjective in nature and cannot be quantified. Wherever
possible, the impacts have been quantified and otherwise, qualitative
assessment has been undertaken. This Chapter deals with the anticipated
positive as well as negative impacts due to construction and operation of the
proposed project. The construction and operation phase comprises of various
activities each of which is likely to have an impact on environment. Thus, it is
important to understand and analyze each activity so as to assess its impact on
environment. The key activities have been categorized for construction and
operation phases.
Construction Phase Activities
• Site preparation • Earthwork and excavation including controlled blasting and drilling • Construction of a diversion barrage • Undersluice, head regulator, feeder channel, desilting arrangement • HRT of 23.45 km length with an underground surge shaft • Underground power house to generate (6x130) 780 MW of power • Tail Race Tunnel of 7.0 m diameter and 1965 m length to discharge flow
into river Nyamjangchhu • Construction of new roads and upgradation of existing roads • Construction of a temporary bridge over river Nyamjangchhu • Project headquarter, offices and colonies • Disposal of muck and construction wastes • Transportation of construction material • Operation and maintenance of construction equipment • Civil and mechanical fabrication works for construction of various project
components. • Operation of DG sets • Disposal of pollutants from workshops, etc. • Disposal of effluents and solid waste from labour camps and colonies

NJC Hydropower Limited EIA study for Nyamjangchhu Hydroelectric Project
WAPCOS Limited
8-2
Operation Phase Activities
• Diversion of water from river Nyamjangchhu for hydropower generation • Equipment maintenance and equipment restoration • Sewage and solid waste generation from project colonies
The various project activities and associated potential environmental impacts on
various environmental parameters have been identified and summarized in a
matrix and the same is outlined in Table-8.1.
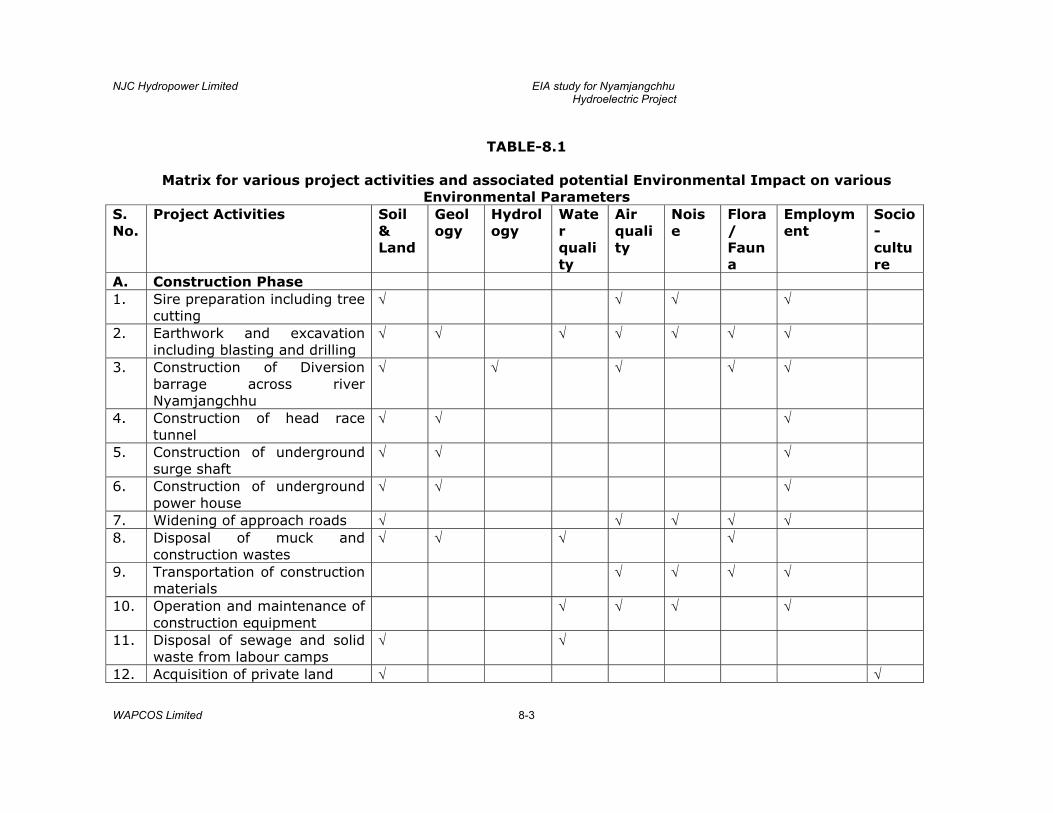
NJC Hydropower Limited EIA study for Nyamjangchhu Hydroelectric Project
WAPCOS Limited
8-3
TABLE-8.1
Matrix for various project activities and associated potential Environmental Impact on various Environmental Parameters
S. No.
Project Activities Soil & Land
Geology
Hydrology
Water quality
Air quality
Noise
Flora/ Fauna
Employment
Socio-culture
A. Construction Phase 1. Sire preparation including tree
cutting √ √ √ √
2. Earthwork and excavation including blasting and drilling
√ √ √ √ √ √ √
3. Construction of Diversion barrage across river Nyamjangchhu
√ √ √ √ √
4. Construction of head race tunnel
√ √ √
5. Construction of underground surge shaft
√ √ √
6. Construction of underground power house
√ √ √
7. Widening of approach roads √ √ √ √ √ 8. Disposal of muck and
construction wastes √ √ √ √
9. Transportation of construction materials
√ √ √ √
10. Operation and maintenance of construction equipment
√ √ √ √
11. Disposal of sewage and solid waste from labour camps
√ √
12. Acquisition of private land √ √
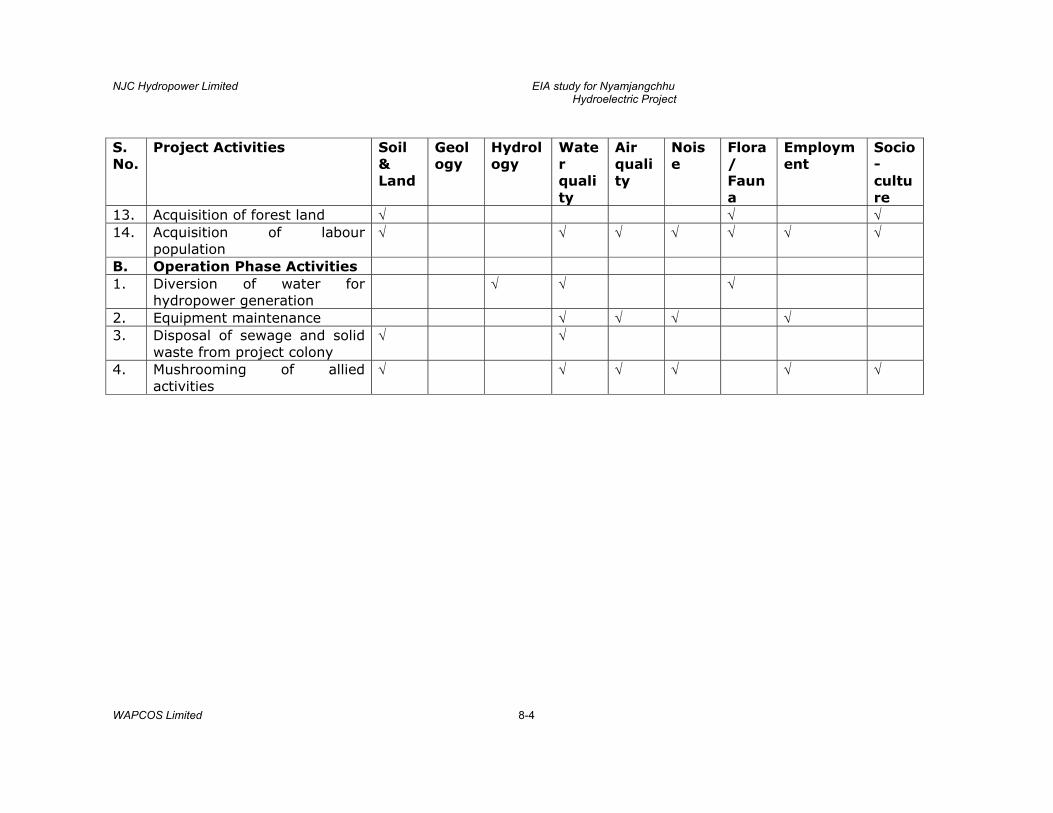
NJC Hydropower Limited EIA study for Nyamjangchhu Hydroelectric Project
WAPCOS Limited
8-4
S. No.
Project Activities Soil & Land
Geology
Hydrology
Water quality
Air quality
Noise
Flora/ Fauna
Employment
Socio-culture
13. Acquisition of forest land √ √ √ 14. Acquisition of labour
population √ √ √ √ √ √ √
B. Operation Phase Activities 1. Diversion of water for
hydropower generation √ √ √
2. Equipment maintenance √ √ √ √ 3. Disposal of sewage and solid
waste from project colony √ √
4. Mushrooming of allied activities
√ √ √ √ √ √

NJC Hydropower Limited EIA study for Nyamjangchhu Hydroelectric Project
WAPCOS Limited
8-5
The impacts which have been covered in the present Chapter are categorized as
below:
- Impacts on Water Environment - Impacts on Air Environment - Impacts on Noise Environment - Impacts on Land Environment - Impacts on Biological Environment - Impacts on Socio-Economic Environment
8.2 IMPACTS ON WATER ENVIRONMENT
The various aspects covered under water environment are:
- Water quality - Sediments - Water resources and downstream users
8.2.1 Water quality
a) Construction phase
The major sources of surface water pollution during project construction phase
are as follows:
• Sewage from labour camps/colonies • Effluent from crushers • Pollution due to muck disposal • Effluents from other sources
i) Sewage from labour camps
The project construction is likely to last for a period of 6 years (74 months). The
peak labour strength likely to be employed during project construction phase is
about 3000 workers and 500 technical staff. The employment opportunities in
the area are limited. Thus, during the project construction phase, some of the
locals may get employment. It has been observed during construction phase of
many of the projects; the major works are contracted out, who bring their own
skilled labour. However, it is only in the unskilled category, that locals get
employment.
The construction phase, also leads to mushrooming of various allied activities to
meet the demands of the immigrant labour population in the project area.
NJC Hydropower Limited EIA study for Nyamjangchhu Hydroelectric Project
WAPCOS Limited
8-6
The following assumptions have been made for assessing the emigrating
population in the area:
• 80% of workers and technical staff emigrating into the area are married. • In 80% of the family of workers both the husband and wife will work. • In 100% of the family of technical staff, only husband will work. • 2% of total migrating population has been assumed as service providers. • 50% of service providers will have families. • Family size has been assumed as 5. Based on experience of similar projects and above referred assumptions, the
increase in the population as a result of migration of labour population during
construction phase is expected to be of the order of 11200.
The domestic water requirement has been estimated as 70 lpcd. Thus, total
water requirements work out to 0.78 mld. It is assumed that about 80% of the
water supplied will be generated as sewage. Thus, total quantum of sewage
generated is expected to be of the order of 0.63 mld. The BOD load contributed
by domestic sources will be about 504 kg/day. It is assumed that the sewage is
discharged without any treatment for which, the minimum flow required for
dilution of sewage is about 2.2 cumec.
Detailed DO modelling was done using Streeter Phelp’s model. The D.O. level
was estimated using the following equation:
K1LA [10-K1t – 10-K2t ] Dt = ------------------------------- + DA 10-K2t
K2 – K1 Dt = D.O. deficit downstream at time t. K1 = Deoxygenation rate K2 = Reaeration rate LA = Ultimate upstream BOD DA = D.O. deficit upstream t = Time of stream flow upstream to point at which D.O. level is to be
estimated
The D.O. level in the river Nyamjangchhu was taken as 8.0 mg/l. The minimum
flow in the river Nyamjangchhu was taken as 12.3 cumec (minimum flow
estimated for 90% dependable year in the month of January-from Table-4.8).
The results of D.O. model are summarized in Table-8.2.
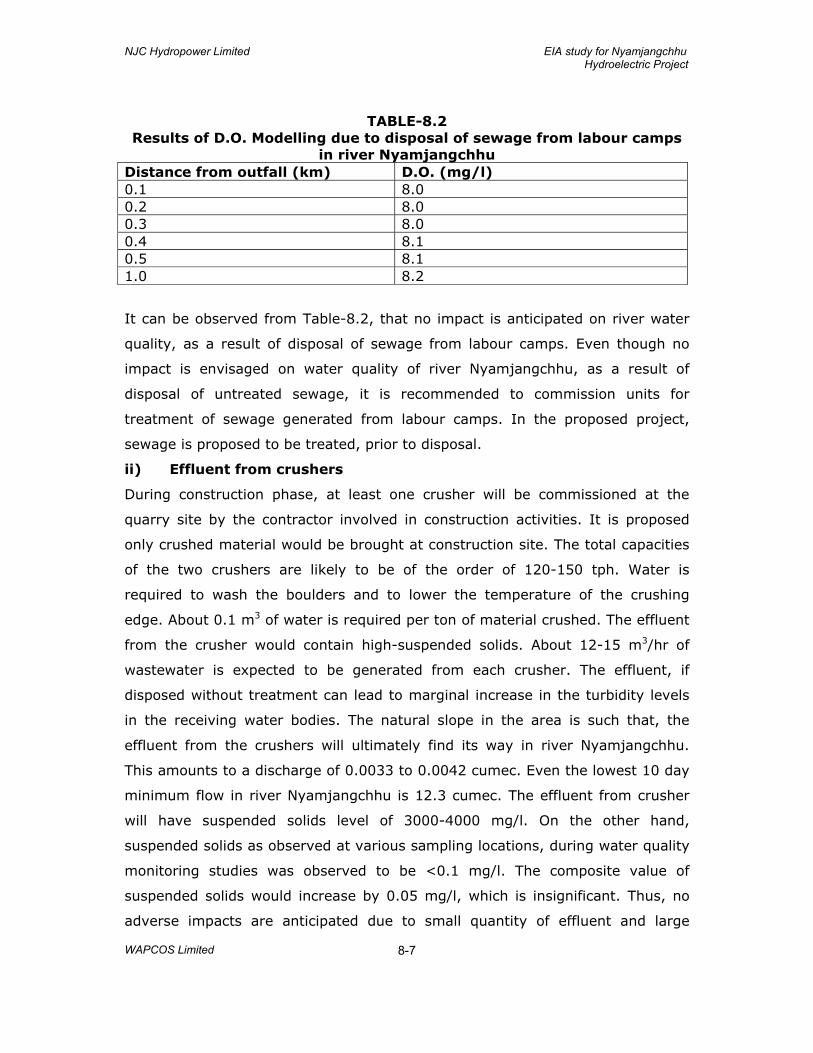
NJC Hydropower Limited EIA study for Nyamjangchhu Hydroelectric Project
WAPCOS Limited
8-7
TABLE-8.2 Results of D.O. Modelling due to disposal of sewage from labour camps
in river Nyamjangchhu Distance from outfall (km) D.O. (mg/l) 0.1 8.0 0.2 8.0 0.3 8.0 0.4 8.1 0.5 8.1 1.0 8.2
It can be observed from Table-8.2, that no impact is anticipated on river water
quality, as a result of disposal of sewage from labour camps. Even though no
impact is envisaged on water quality of river Nyamjangchhu, as a result of
disposal of untreated sewage, it is recommended to commission units for
treatment of sewage generated from labour camps. In the proposed project,
sewage is proposed to be treated, prior to disposal.
ii) Effluent from crushers
During construction phase, at least one crusher will be commissioned at the
quarry site by the contractor involved in construction activities. It is proposed
only crushed material would be brought at construction site. The total capacities
of the two crushers are likely to be of the order of 120-150 tph. Water is
required to wash the boulders and to lower the temperature of the crushing
edge. About 0.1 m3 of water is required per ton of material crushed. The effluent
from the crusher would contain high-suspended solids. About 12-15 m3/hr of
wastewater is expected to be generated from each crusher. The effluent, if
disposed without treatment can lead to marginal increase in the turbidity levels
in the receiving water bodies. The natural slope in the area is such that, the
effluent from the crushers will ultimately find its way in river Nyamjangchhu.
This amounts to a discharge of 0.0033 to 0.0042 cumec. Even the lowest 10 day
minimum flow in river Nyamjangchhu is 12.3 cumec. The effluent from crusher
will have suspended solids level of 3000-4000 mg/l. On the other hand,
suspended solids as observed at various sampling locations, during water quality
monitoring studies was observed to be <0.1 mg/l. The composite value of
suspended solids would increase by 0.05 mg/l, which is insignificant. Thus, no
adverse impacts are anticipated due to small quantity of effluent and large
NJC Hydropower Limited EIA study for Nyamjangchhu Hydroelectric Project
WAPCOS Limited
8-8
volume of water available in river Nyamjangchhu for dilution. Even then, it is
proposed to treat the effluent from crushers in settling tank before disposal so as
to ameliorate even the marginal impacts likely to accrue on this account.
iii) Pollution due to muck disposal
The major impact on the water quality arises when the muck is disposed along the
river bank. The project authorities have identified suitable muck disposal sites
which are located near the river channel. The muck will essentially come from the
road-building activity, tunneling and other excavation works. The unsorted waste
going into the river channel will greatly contribute to the turbidity of water
continuously for long time periods. The high turbidity is known to reduce the
photosynthetic efficiency of primary producers in the river and as a result, the
biological productivity will be greatly reduced. Therefore, the prolonged turbid
conditions would have negative impact on the aquatic life. Therefore, muck
disposal has to be done in line with the Muck Disposal Plan given in EMP to avoid
any negative impact.
iv) Effluent from other sources
Substantial quantities of water would be used in the construction activities. With
regard to water quality, waste water from construction activities and runoff from
construction site would mostly contain suspended impurities. Adequate care
should be taken so that excess suspended solids in the wastewater are removed
before discharge into water body. The effluent is proposed to be treated by
collecting the waste water and runoff from construction sites and treating the
same in settling tanks.
b) Operation phase
The major sources of water pollution during project operation phase include:
• Effluent from project colony. • Impacts on reservoir water quality. • Eutrophication risks • Sediments i) Effluent from project colony
During project operation phase, due to absence of any large-scale construction
activity, the cause and source of water pollution will be much different. Since,
NJC Hydropower Limited EIA study for Nyamjangchhu Hydroelectric Project
WAPCOS Limited
8-9
only a small number of O&M staff will reside in the area in a well-designed
colony with sewage treatment plant and other infrastructure facilities, the
problems of water pollution due to disposal of sewage are not anticipated.
In the operation phase, about 100 families (total population of 500) will be
residing in the project colony proposed to be developed at Lumla, Khartang and
Zimithang. About 0.23 to 0.27 mld of sewage will be generated. The total BOD
loading will be order of 68 to 81 kg/day. It is proposed to provide biological
treatment facilities including secondary treatment units for sewage so generated
from the BOD load after treatment will reduce to 10 to 12 kg/day. It shall be
ensured that sewage from the project colony be treated in a sewage treatment
plant so as to meet the disposal standards for effluent. Thus, with
commissioning of facilities for sewage treatment, no impact on receiving water
body is anticipated. Thus, no impacts are anticipated as a result of disposal of
effluents from the project colony.
ii) Impacts on reservoir water quality
The flooding of previously forest and agricultural land in the submergence area
will increase the availability of nutrients resulting from decomposition of
vegetative matter. Phytoplankton productivity can supersaturate the euphotic
zone with oxygen before contributing to the accommodation of organic matter in
the sediments. Enrichment of impounded water with organic and inorganic
nutrients will be the main water quality problem immediately on commencement
of the operation. However, this phenomenon is likely to last for a short duration
of few years from the filling up of the reservoir. In the proposed project, most of
the land coming under reservoir submergence is barren, with few patches of
trees. These trees too are likely to be cleared before filling up of the reservoir.
The proposed project is envisaged as a runoff the river scheme, with significant
diurnal variations in reservoir water level. In such a scenario, significant re-
aeration from natural atmosphere takes place, which maintains Dissolved
Oxygen in the water body. Thus, in the proposed project, no significant
reduction in D.O. level in reservoir water is anticipated.
iii) Eutrophication risks
Another significant impact observed in the reservoir is the problem of
eutrophication, which occurs mainly due to the disposal of nutrient rich effluents
NJC Hydropower Limited EIA study for Nyamjangchhu Hydroelectric Project
WAPCOS Limited
8-10
from the agricultural fields. However, in the present case, fertilizer use in the
project area is negligible, hence, the runoff at present does not contain
significant amount of nutrients. Even in the post-project phase, use of fertilizers
in the project catchment area is not expected to rise significantly. Another factor
to be considered that the proposed project is envisaged as a run off the river
scheme, with significant diurnal variations in reservoir water level. Thus,
residence time would be of the order of few days, which is too small to cause
any eutrophication. Thus, in project operation phase, problems of eutrophication,
which is primarily caused by enrichment of nutrients in water, are not
anticipated.
8.2.2 Sediments
When a river flows along a steep gradient, it could carry a significant amount of
sediment load, depending on the degradation status of the catchment. When a
hydraulic structure is built across the river, it creates a reservoir, which tends to
accumulate the sediment, as the suspended load settles down due to decrease in
flow velocity. The proposed project is envisaged as a runoff the river scheme,
with a barrage. At regular intervals, the gates of the barrage shall be opened to
flush out the sediments. Thus, in the proposed project, sedimentation problems
are not anticipated.
8.2.3 Water resources and downstream users
The Nyamjangchhu Hydro Electric Project is a run of river scheme project on
river Nyamjangchhu. The diversion of water for hydropower generation will lead
to drying or reduction of flow river stretch of about 32 km. The effect will be
more pronounced in the lean season. There are no major users of water in the
intervening stretches, as river flows through a gorge and requires pumping for
use at point of consumption. As a result, there are no major users of water of
river Nymjangchhu in the intervening stretch. Thus, no major adverse impacts
are anticipated on downstream water users. However, there will be significant
adverse impacts on riverine ecology, which needs to be ameliorated through the
release of minimum flow.
NJC Hydropower Limited EIA study for Nyamjangchhu Hydroelectric Project
WAPCOS Limited
8-11
8.2.4 Impacts on river bed stability
During the construction phase a large quantity of construction material like
stones, pebbles, gravel and sand would be needed. Significant amount of
material is available in the river bed. It is proposed to extract construction
material from borrow areas in the river bed. The extraction of construction
material will lead to formation of pits. Normally, deposition of material takes
place at sites where velocity reduces on account of flattening of slopes, increase
in cross-sectional area. Such sites are used for extraction of construction
material. The pits at sites after extraction of construction material will be under
constant action on account of erosion in high flows and deposition under low
flows. These pits with passage of time will be stabilized due to settlement of silt
and sediments in the pits created on the river bed. Thus, no major impacts are
anticipated o this account.
8.3 IMPACTS ON AIR ENVIRONMENT
In a water resources project, air pollution occurs mainly during project construction
phase. The major sources of air pollution during construction phase are:
• Pollution due to fuel combustion in various equipment • Emission from various crushers • Fugitive emissions from various sources. • Blasting Operations • Pollution due to increased vehicular movement • Dust emission from muck disposal
Pollution due to fuel combustion in various equipment
The operation of various construction equipment requires combustion of fuel.
Normally, diesel is used in such equipment. The major pollutant which gets emitted
as a result of combustion of diesel is SO2. The SPM emissions are minimal due to
low ash content in diesel. The short-term increase in SO2, even assuming that all
the equipment are operating at a common point, is quite low, i.e. of the order of
less than 1µg/m3. Hence, no major impact is anticipated on this account on
ambient air quality.
Emissions from crushers
The operation of the crusher during the construction phase is likely to generate
fugitive emissions, which can move even up to 1 km in predominant wind
direction. During construction phase, one crusher each is likely to be commissioned
NJC Hydropower Limited EIA study for Nyamjangchhu Hydroelectric Project
WAPCOS Limited
8-12
near proposed dam and proposed power house sites. During crushing operations,
fugitive emissions comprising mainly the suspended particulate will be generated.
Since, there are no major settlements close to the dam and power house, hence,
no major adverse impacts on this account are anticipated. However, during the
layout design, care should be taken to ensure that the labour camps, colonies, etc.
are located on the leeward side and outside the impact zone (say about 2 km on
the wind direction) of the crushers.
Fugitive Emissions from various sources
During construction phase, there will be increased vehicular movement. Lot of
construction material like sand, fine aggregate are stored at various sites, during
the project construction phase. Normally, due to blowing of winds, especially when
the environment is dry, some of the stored material can get entrained in the
atmosphere. However, such impacts are visible only in and around the storage
sites. The impacts on this account are generally, insignificant in nature.
Blasting Operations
Blasting will result in vibration, which shall propagate through the rocks to
various degrees and may cause loosening of rocks/boulders. The overall impact
due to blasting operations will be restricted well below the surface and no major
impacts are envisaged at the ground level.
During tunneling operations, dust will be generated during blasting. ID blowers
will be provided with dust handling system to capture and generated dust. The
dust will settle on vegetation, in the predominant down wind direction.
Appropriate control measures have been recommended to minimize the adverse
impacts on this account.
Pollution due to increased vehicular movement
During construction phase, there will be increased vehicular movement for
transportation of various construction materials to the project site. Similarly,
these will be increased traffic movement on account of disposal of muck or
construction waste at the dumping site. The maximum increase in vehicle is
expected to 50 vehicles per hour. Large quantity of dust is likely to be entrained
due to the movement of trucks and other heavy vehicles. Similarly, marginal
increase in Hydrocarbons, SO2 and NOx levels are anticipated for a short
NJC Hydropower Limited EIA study for Nyamjangchhu Hydroelectric Project
WAPCOS Limited
8-13
duration. Modelling studies for hydrocarbon emissions were conducted and the
results are given in Table-8.3.
TABLE-8.3 Increase in hydrocarbon concentration due to vehicular movement
Distance (m) Increase in HC concentration (µg/m3) 10 5 20 2.50 30 1.67 40 1.25 50 1.00 60 0.83 70 0.71 80 0.63 90 0.56 100 0.50 The increase in vehicular density is not expected to significant. In addition, these
ground level emissions do not travel for long distances. Thus, no major adverse
impacts are anticipated on this account.
Dust emission from muck disposal
The loading and unloading of muck is one of the source of dust generation. Since,
muck will be mainly in form of small rock pieces, stone, etc., with very little dust
particles. Significant amount of dust is not expected to be generated on this
account. Thus, adverse impacts due to dust generation during muck disposal are
not expected.
8.4 IMPACTS ON NOISE ENVIRONMENT
a) Construction phase
In a water resource projects, the impacts on ambient noise levels are expected
only during the project construction phase, due to earth moving machinery, etc.
Likewise, noise due to quarrying, blasting, vehicular movement will have some
adverse impacts on the ambient noise levels in the area.
i) Impacts due to operation of construction equipment
The noise level due to operation of various construction equipment is given in
Table-8.4.
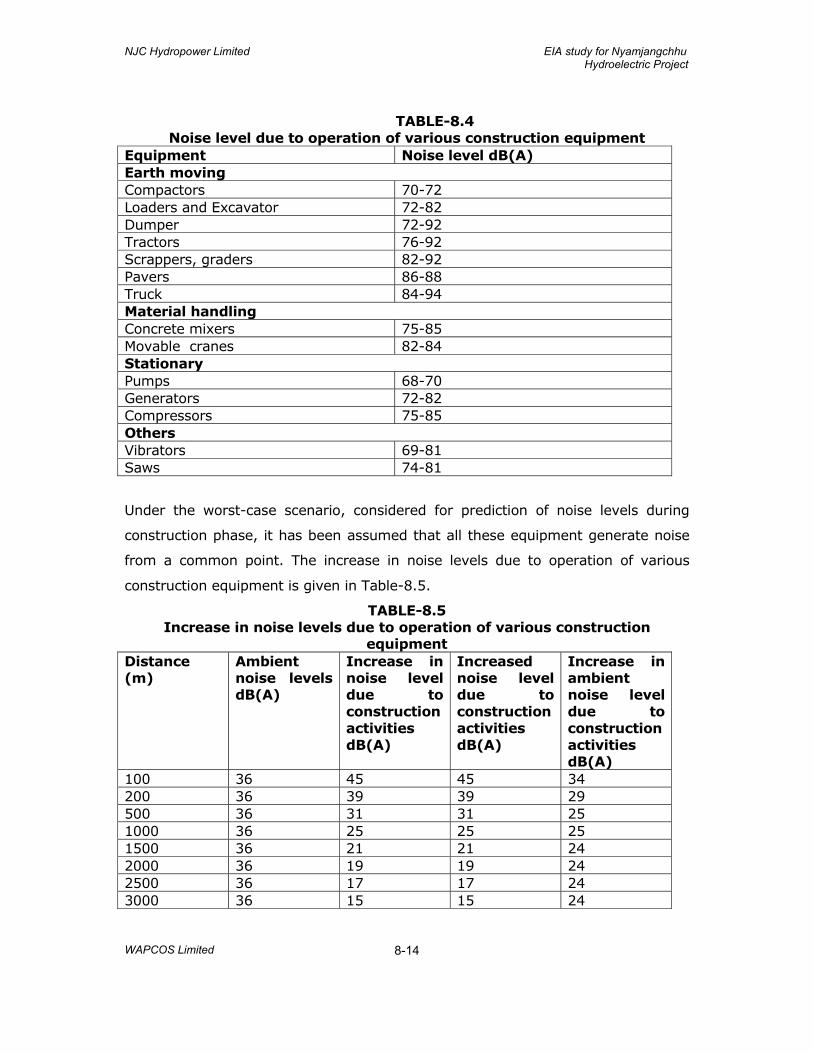
NJC Hydropower Limited EIA study for Nyamjangchhu Hydroelectric Project
WAPCOS Limited
8-14
TABLE-8.4 Noise level due to operation of various construction equipment
Equipment Noise level dB(A) Earth moving Compactors 70-72 Loaders and Excavator 72-82 Dumper 72-92 Tractors 76-92 Scrappers, graders 82-92 Pavers 86-88 Truck 84-94 Material handling Concrete mixers 75-85 Movable cranes 82-84 Stationary Pumps 68-70 Generators 72-82 Compressors 75-85 Others Vibrators 69-81 Saws 74-81
Under the worst-case scenario, considered for prediction of noise levels during
construction phase, it has been assumed that all these equipment generate noise
from a common point. The increase in noise levels due to operation of various
construction equipment is given in Table-8.5.
TABLE-8.5 Increase in noise levels due to operation of various construction
equipment Distance (m)
Ambient noise levels dB(A)
Increase in noise level due to construction activities dB(A)
Increased noise level due to construction activities dB(A)
Increase in ambient noise level due to construction activities dB(A)
100 36 45 45 34 200 36 39 39 29 500 36 31 31 25 1000 36 25 25 25 1500 36 21 21 24 2000 36 19 19 24 2500 36 17 17 24 3000 36 15 15 24
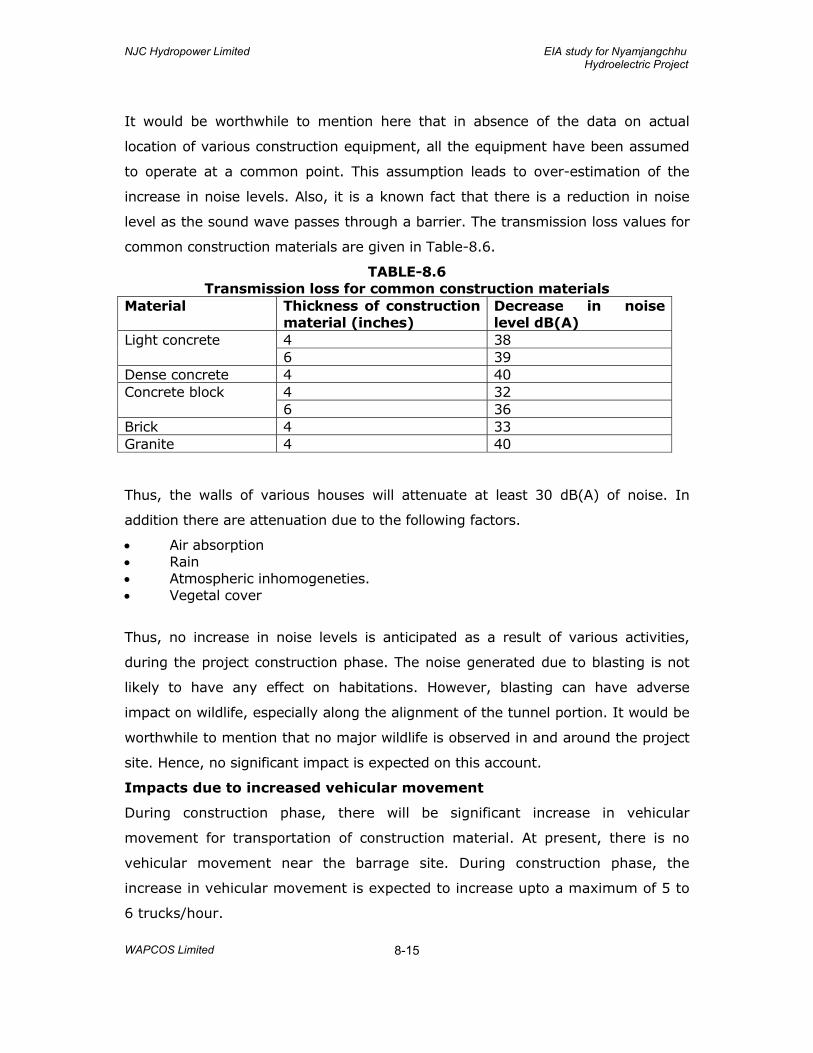
NJC Hydropower Limited EIA study for Nyamjangchhu Hydroelectric Project
WAPCOS Limited
8-15
It would be worthwhile to mention here that in absence of the data on actual
location of various construction equipment, all the equipment have been assumed
to operate at a common point. This assumption leads to over-estimation of the
increase in noise levels. Also, it is a known fact that there is a reduction in noise
level as the sound wave passes through a barrier. The transmission loss values for
common construction materials are given in Table-8.6.
TABLE-8.6 Transmission loss for common construction materials
Material Thickness of construction material (inches)
Decrease in noise level dB(A)
Light concrete 4 38 6 39
Dense concrete 4 40 Concrete block 4 32
6 36 Brick 4 33 Granite 4 40
Thus, the walls of various houses will attenuate at least 30 dB(A) of noise. In
addition there are attenuation due to the following factors.
• Air absorption • Rain • Atmospheric inhomogeneties. • Vegetal cover
Thus, no increase in noise levels is anticipated as a result of various activities,
during the project construction phase. The noise generated due to blasting is not
likely to have any effect on habitations. However, blasting can have adverse
impact on wildlife, especially along the alignment of the tunnel portion. It would be
worthwhile to mention that no major wildlife is observed in and around the project
site. Hence, no significant impact is expected on this account.
Impacts due to increased vehicular movement
During construction phase, there will be significant increase in vehicular
movement for transportation of construction material. At present, there is no
vehicular movement near the barrage site. During construction phase, the
increase in vehicular movement is expected to increase upto a maximum of 5 to
6 trucks/hour.
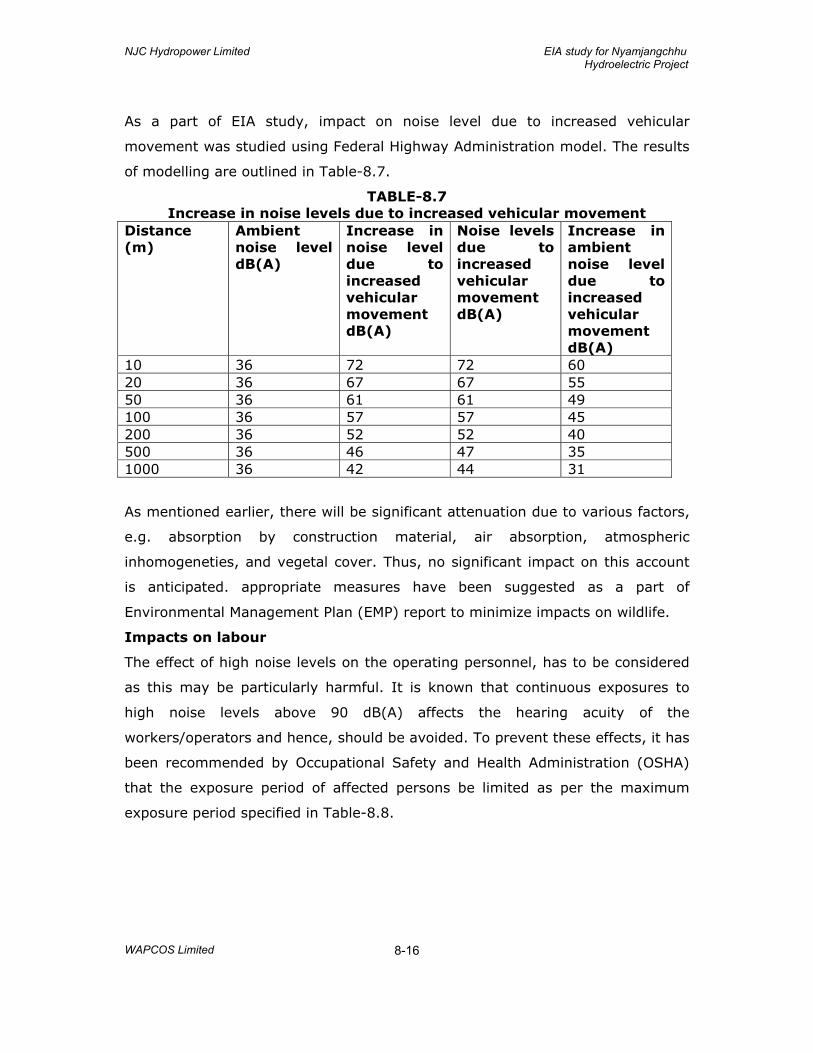
NJC Hydropower Limited EIA study for Nyamjangchhu Hydroelectric Project
WAPCOS Limited
8-16
As a part of EIA study, impact on noise level due to increased vehicular
movement was studied using Federal Highway Administration model. The results
of modelling are outlined in Table-8.7.
TABLE-8.7 Increase in noise levels due to increased vehicular movement
Distance (m)
Ambient noise level dB(A)
Increase in noise level due to increased vehicular movement dB(A)
Noise levels due to increased vehicular movement dB(A)
Increase in ambient noise level due to increased vehicular movement dB(A)
10 36 72 72 60 20 36 67 67 55 50 36 61 61 49 100 36 57 57 45 200 36 52 52 40 500 36 46 47 35 1000 36 42 44 31
As mentioned earlier, there will be significant attenuation due to various factors,
e.g. absorption by construction material, air absorption, atmospheric
inhomogeneties, and vegetal cover. Thus, no significant impact on this account
is anticipated. appropriate measures have been suggested as a part of
Environmental Management Plan (EMP) report to minimize impacts on wildlife.
Impacts on labour
The effect of high noise levels on the operating personnel, has to be considered
as this may be particularly harmful. It is known that continuous exposures to
high noise levels above 90 dB(A) affects the hearing acuity of the
workers/operators and hence, should be avoided. To prevent these effects, it has
been recommended by Occupational Safety and Health Administration (OSHA)
that the exposure period of affected persons be limited as per the maximum
exposure period specified in Table-8.8.
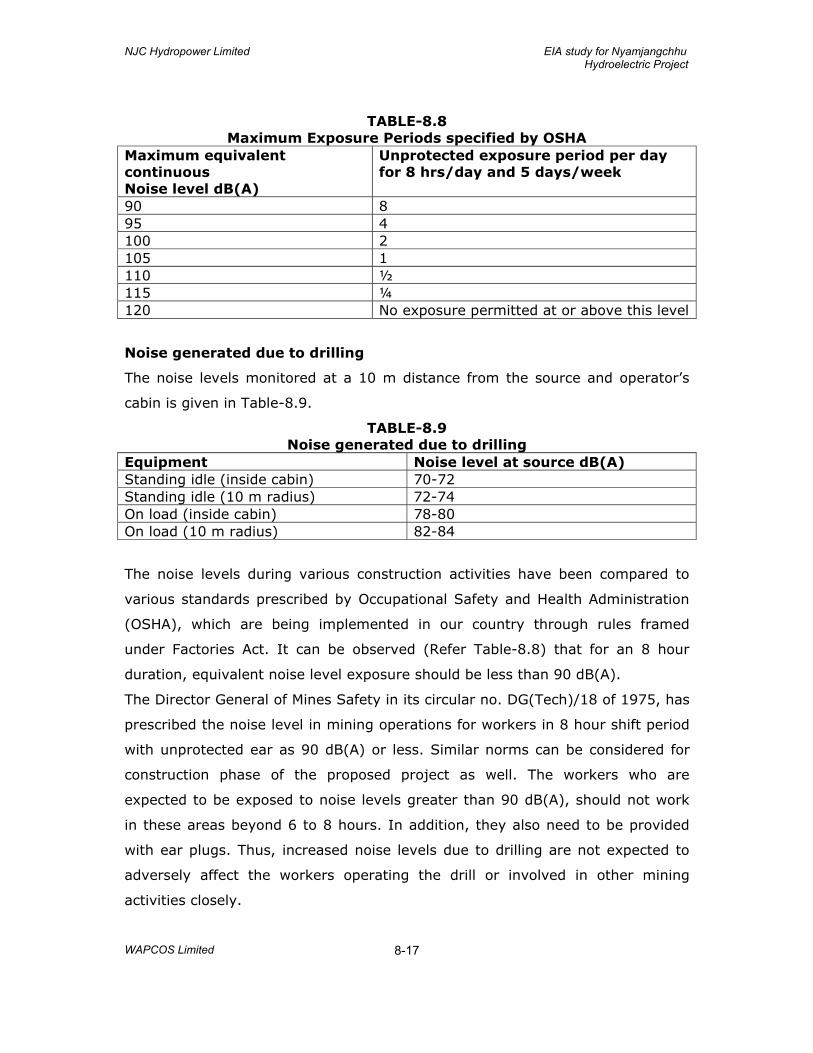
NJC Hydropower Limited EIA study for Nyamjangchhu Hydroelectric Project
WAPCOS Limited
8-17
TABLE-8.8 Maximum Exposure Periods specified by OSHA
Maximum equivalent continuous Noise level dB(A)
Unprotected exposure period per day for 8 hrs/day and 5 days/week
90 8 95 4 100 2 105 1 110 ½ 115 ¼ 120 No exposure permitted at or above this level
Noise generated due to drilling
The noise levels monitored at a 10 m distance from the source and operator’s
cabin is given in Table-8.9.
TABLE-8.9 Noise generated due to drilling
Equipment Noise level at source dB(A) Standing idle (inside cabin) 70-72 Standing idle (10 m radius) 72-74 On load (inside cabin) 78-80 On load (10 m radius) 82-84
The noise levels during various construction activities have been compared to
various standards prescribed by Occupational Safety and Health Administration
(OSHA), which are being implemented in our country through rules framed
under Factories Act. It can be observed (Refer Table-8.8) that for an 8 hour
duration, equivalent noise level exposure should be less than 90 dB(A).
The Director General of Mines Safety in its circular no. DG(Tech)/18 of 1975, has
prescribed the noise level in mining operations for workers in 8 hour shift period
with unprotected ear as 90 dB(A) or less. Similar norms can be considered for
construction phase of the proposed project as well. The workers who are
expected to be exposed to noise levels greater than 90 dB(A), should not work
in these areas beyond 6 to 8 hours. In addition, they also need to be provided
with ear plugs. Thus, increased noise levels due to drilling are not expected to
adversely affect the workers operating the drill or involved in other mining
activities closely.
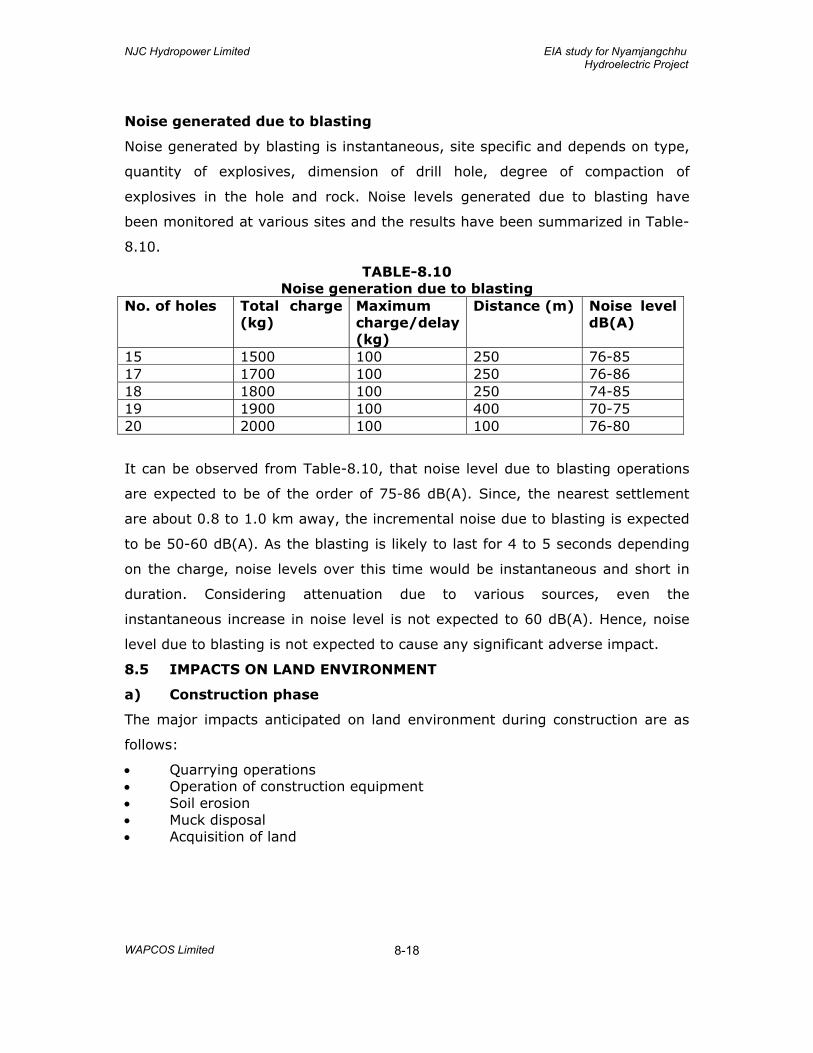
NJC Hydropower Limited EIA study for Nyamjangchhu Hydroelectric Project
WAPCOS Limited
8-18
Noise generated due to blasting
Noise generated by blasting is instantaneous, site specific and depends on type,
quantity of explosives, dimension of drill hole, degree of compaction of
explosives in the hole and rock. Noise levels generated due to blasting have
been monitored at various sites and the results have been summarized in Table-
8.10.
TABLE-8.10 Noise generation due to blasting
No. of holes Total charge (kg)
Maximum charge/delay (kg)
Distance (m) Noise level dB(A)
15 1500 100 250 76-85 17 1700 100 250 76-86 18 1800 100 250 74-85 19 1900 100 400 70-75 20 2000 100 100 76-80
It can be observed from Table-8.10, that noise level due to blasting operations
are expected to be of the order of 75-86 dB(A). Since, the nearest settlement
are about 0.8 to 1.0 km away, the incremental noise due to blasting is expected
to be 50-60 dB(A). As the blasting is likely to last for 4 to 5 seconds depending
on the charge, noise levels over this time would be instantaneous and short in
duration. Considering attenuation due to various sources, even the
instantaneous increase in noise level is not expected to 60 dB(A). Hence, noise
level due to blasting is not expected to cause any significant adverse impact.
8.5 IMPACTS ON LAND ENVIRONMENT
a) Construction phase
The major impacts anticipated on land environment during construction are as
follows:
• Quarrying operations • Operation of construction equipment • Soil erosion • Muck disposal • Acquisition of land
NJC Hydropower Limited EIA study for Nyamjangchhu Hydroelectric Project
WAPCOS Limited
8-19
Quarrying operations
The total quantities required for the construction of civil components of the
Nyamjang Chhu HEP are as follows:
Concrete and Shotcrete Volume : 8,75,000 m3 Fine Aggregate : 2,75,000 m3 Coarse Aggregate : 5,25,000 m3
The above construction material shall be arranged from the identified quarry site
near Gorsam and major portion from the excavated muck of the HRT between
Zimithang and BTK. The quantities from the HRT excavated muck and quarry site
is estimated to contribute about 10,00,000 m3 and 5,00,000 m3 (30% swelling
factor) respectively for the requirement of coarse aggregate. Fine aggregate
requirement shall be met locally from the river bed and crushed sand. The
quantity of aggregate in the Gneissic terrain would be more than the required
quantities and the test report also suggests the suitability of the same.
River Bed Material for Aggregates
For the construction purpose river bed materials shall be utilized and for that two
locations are identified on the downstream of the barrage. One location is near to
the Zimithang village where there is a natural blockade of river due to previous
floods. There big sized boulders of gneiss of about 30-40m length are observed.
These boulders can be used for the construction material. Another location is near
to the BTK nala and it is also a natural blockade which is formed in past few years.
The boulders are larger in the river bed and can be utilized for construction
material. The rocks from the quarries were found to be suitable for the use as
coarse aggregate and crushed sand in concrete for non-wearing and wearing
surfaces.
Sand quarries
In the project area there are few locations from where sand of coarse and fine
segments can be extracted. Tests have been done to assess the suitability of sand
in the Zimithang area, BTK area & Namtsering area. All the locations are in the
river banks and nearby. The quantity of the river borne sand is not sufficient for
the construction of the project and thus to be collected or transported from other
locations.
NJC Hydropower Limited EIA study for Nyamjangchhu Hydroelectric Project
WAPCOS Limited
8-20
Opening of the quarries will cause visual impacts because they remove a
significant part of the hills. Other impacts will be the noise generated during
aggregate acquisition through explosive and crushing, which could affect wildlife
in the area, dust produced during the crushing operation to get the aggregates
to the appropriate size and transport of the aggregates, and transport of
materials.
The quarrying operations are semi-mechanized in nature. Normally, in a hilly
terrain like Arunachal Pradesh, quarrying is normally done by cutting a face of
the hill. A permanent scar is likely to be left, once quarrying activities are over.
With the passage of time, the rock from the exposed face of the quarry under
the action of wind and other erosion forces, get slowly weathered and after some
time, they become a potential source of landslide. Thus it is necessary to
implement appropriate slope stabilization measures to prevent the possibility of
soil erosion and landslides in the quarry sites.
ii) Operation of construction equipment
During construction phase, various types of equipment will be brought to the
site. These include crushers, batching plant, drillers, earthmovers, rock bolters,
etc. The siting of this construction equipment would require significant amount of
space. Similarly, space will be required for storing of various other construction
equipment. In addition, land will also be temporarily acquired, i.e. for the
duration of project construction for storage of quarried material before crushing,
crushed material, cement, rubble, etc. Efforts must be made for proper siting of
these facilities.
Various criteria for selection of these sites would be:
• Proximity to the site of use • Sensitivity of forests in the nearby areas • Proximity from habitations • Proximity to drinking water source Efforts must be made to site the contractor’s working space in such a way that
the adverse impacts on environment are minimal, i.e. to locate the construction
equipment, so that impacts on human and faunal population is minimal.
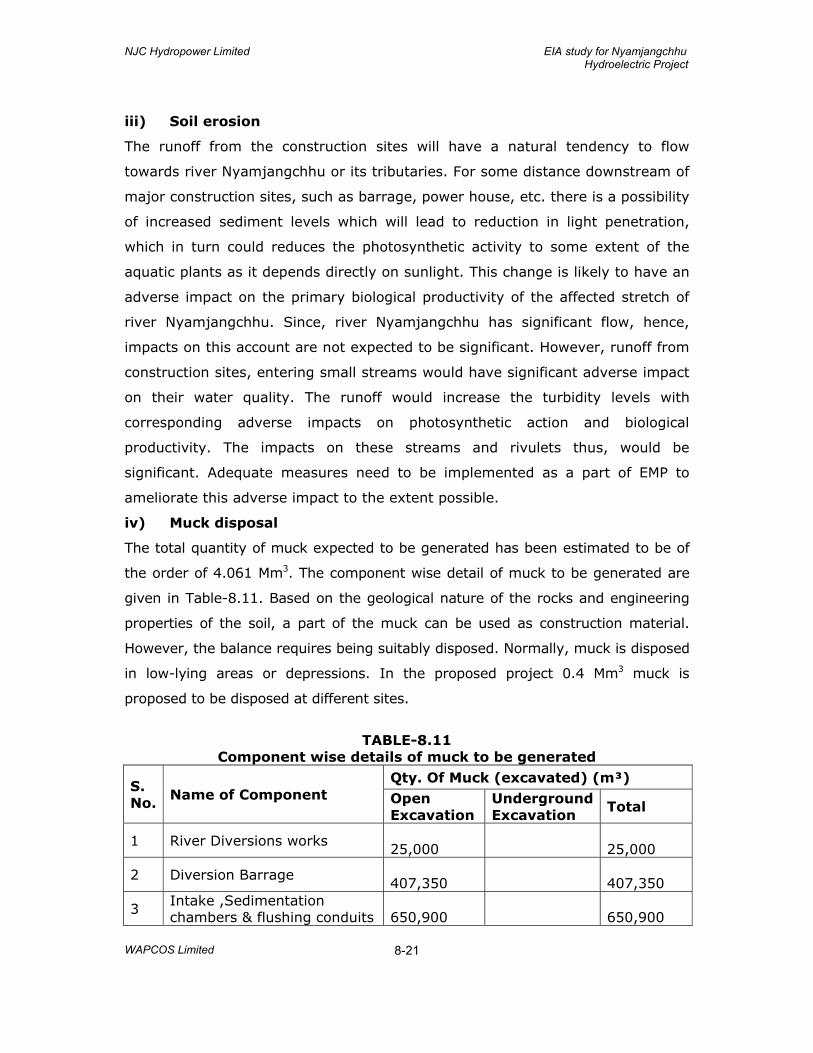
NJC Hydropower Limited EIA study for Nyamjangchhu Hydroelectric Project
WAPCOS Limited
8-21
iii) Soil erosion
The runoff from the construction sites will have a natural tendency to flow
towards river Nyamjangchhu or its tributaries. For some distance downstream of
major construction sites, such as barrage, power house, etc. there is a possibility
of increased sediment levels which will lead to reduction in light penetration,
which in turn could reduces the photosynthetic activity to some extent of the
aquatic plants as it depends directly on sunlight. This change is likely to have an
adverse impact on the primary biological productivity of the affected stretch of
river Nyamjangchhu. Since, river Nyamjangchhu has significant flow, hence,
impacts on this account are not expected to be significant. However, runoff from
construction sites, entering small streams would have significant adverse impact
on their water quality. The runoff would increase the turbidity levels with
corresponding adverse impacts on photosynthetic action and biological
productivity. The impacts on these streams and rivulets thus, would be
significant. Adequate measures need to be implemented as a part of EMP to
ameliorate this adverse impact to the extent possible.
iv) Muck disposal
The total quantity of muck expected to be generated has been estimated to be of
the order of 4.061 Mm3. The component wise detail of muck to be generated are
given in Table-8.11. Based on the geological nature of the rocks and engineering
properties of the soil, a part of the muck can be used as construction material.
However, the balance requires being suitably disposed. Normally, muck is disposed
in low-lying areas or depressions. In the proposed project 0.4 Mm3 muck is
proposed to be disposed at different sites.
TABLE-8.11
Component wise details of muck to be generated
S. No. Name of Component
Qty. Of Muck (excavated) (m³) Open Excavation
Underground Excavation
Total
1 River Diversions works 25,000
25,000
2 Diversion Barrage 407,350
407,350
3 Intake ,Sedimentation chambers & flushing conduits
650,900
650,900
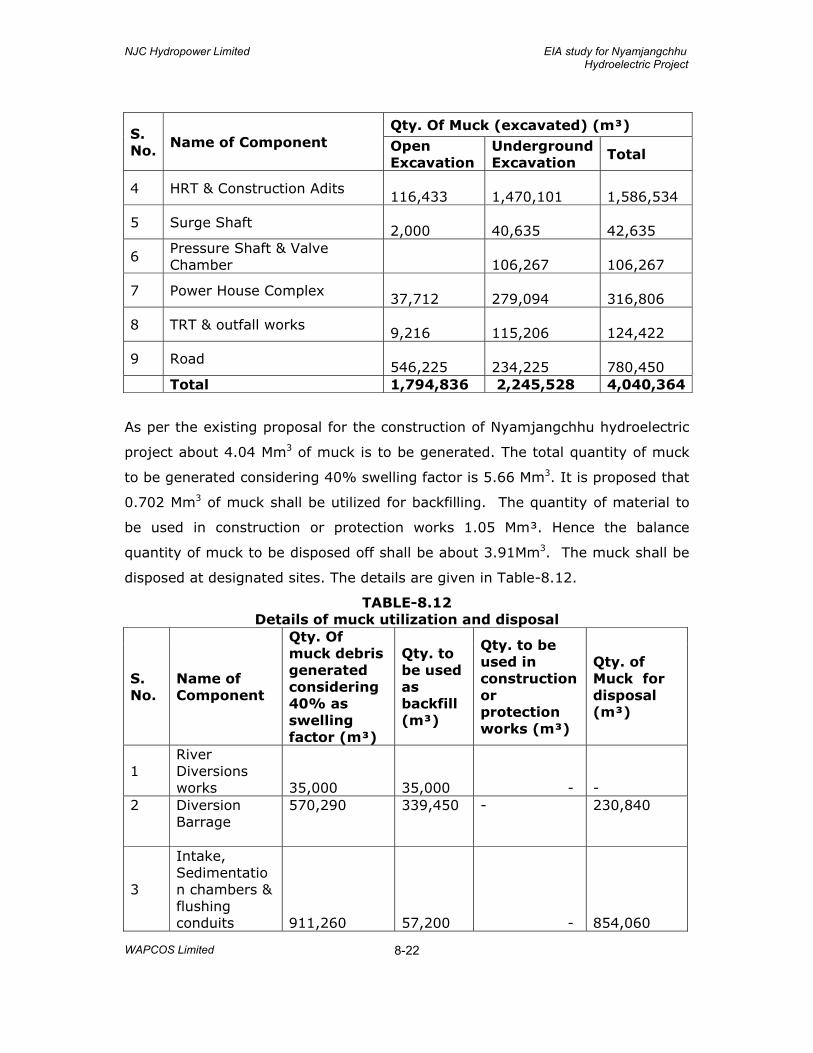
NJC Hydropower Limited EIA study for Nyamjangchhu Hydroelectric Project
WAPCOS Limited
8-22
S. No.
Name of Component Qty. Of Muck (excavated) (m³)
Open Excavation
Underground Excavation
Total
4 HRT & Construction Adits 116,433
1,470,101
1,586,534
5 Surge Shaft 2,000
40,635
42,635
6 Pressure Shaft & Valve Chamber
106,267
106,267
7 Power House Complex 37,712
279,094
316,806
8 TRT & outfall works 9,216
115,206
124,422
9 Road 546,225
234,225
780,450
Total 1,794,836 2,245,528 4,040,364
As per the existing proposal for the construction of Nyamjangchhu hydroelectric
project about 4.04 Mm3 of muck is to be generated. The total quantity of muck
to be generated considering 40% swelling factor is 5.66 Mm3. It is proposed that
0.702 Mm3 of muck shall be utilized for backfilling. The quantity of material to
be used in construction or protection works 1.05 Mm³. Hence the balance
quantity of muck to be disposed off shall be about 3.91Mm3. The muck shall be
disposed at designated sites. The details are given in Table-8.12.
TABLE-8.12 Details of muck utilization and disposal
S. No.
Name of Component
Qty. Of muck debris generated considering 40% as swelling factor (m³)
Qty. to be used as backfill (m³)
Qty. to be used in construction or protection works (m³)
Qty. of Muck for disposal (m³)
1 River Diversions works
35,000
35,000 -
-
2 Diversion Barrage
570,290 339,450 - 230,840
3
Intake, Sedimentation chambers & flushing conduits
911,260
57,200 -
854,060
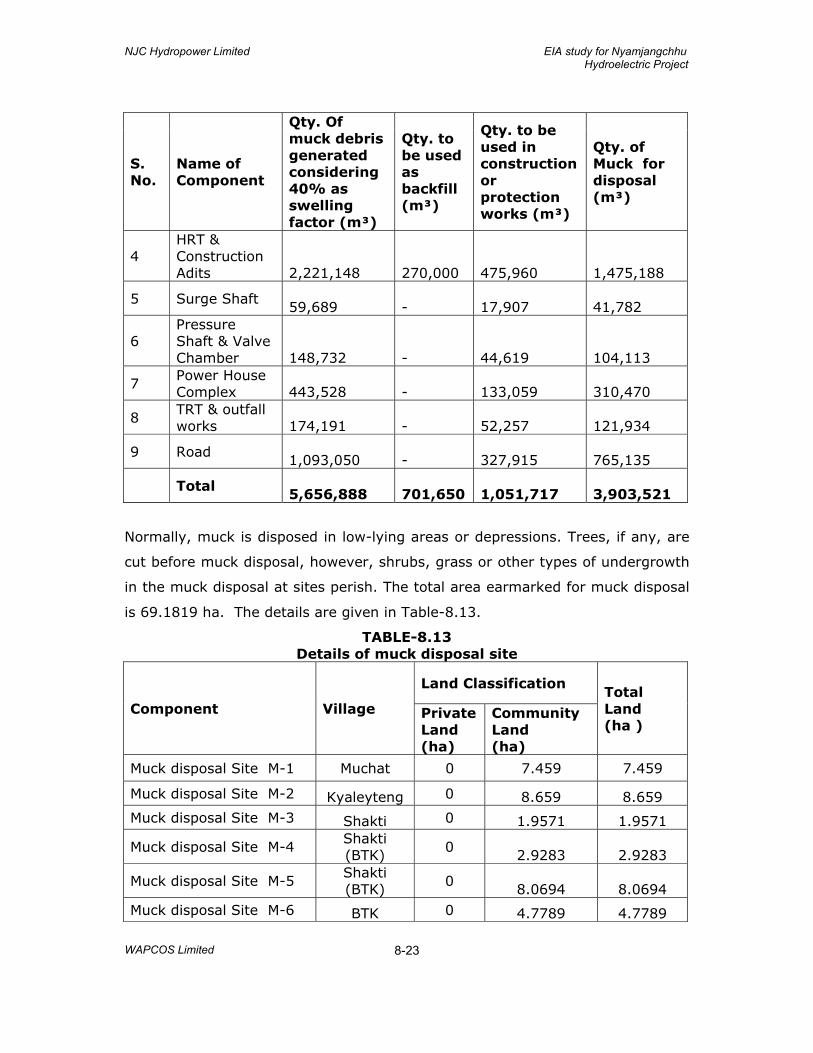
NJC Hydropower Limited EIA study for Nyamjangchhu Hydroelectric Project
WAPCOS Limited
8-23
S. No.
Name of Component
Qty. Of muck debris generated considering 40% as swelling factor (m³)
Qty. to be used as backfill (m³)
Qty. to be used in construction or protection works (m³)
Qty. of Muck for disposal (m³)
4 HRT & Construction Adits
2,221,148
270,000
475,960
1,475,188
5 Surge Shaft 59,689
-
17,907
41,782
6 Pressure Shaft & Valve Chamber
148,732
-
44,619
104,113
7 Power House Complex
443,528
-
133,059
310,470
8 TRT & outfall works
174,191
-
52,257
121,934
9 Road 1,093,050
-
327,915
765,135
Total
5,656,888 701,650
1,051,717
3,903,521
Normally, muck is disposed in low-lying areas or depressions. Trees, if any, are
cut before muck disposal, however, shrubs, grass or other types of undergrowth
in the muck disposal at sites perish. The total area earmarked for muck disposal
is 69.1819 ha. The details are given in Table-8.13.
TABLE-8.13 Details of muck disposal site
Component Village
Land Classification Total Land (ha )
Private Land (ha)
Community Land (ha)
Muck disposal Site M-1 Muchat 0 7.459 7.459
Muck disposal Site M-2 Kyaleyteng 0 8.659 8.659 Muck disposal Site M-3 Shakti 0 1.9571 1.9571
Muck disposal Site M-4 Shakti (BTK)
0 2.9283 2.9283
Muck disposal Site M-5 Shakti (BTK)
0 8.0694 8.0694
Muck disposal Site M-6 BTK 0 4.7789 4.7789
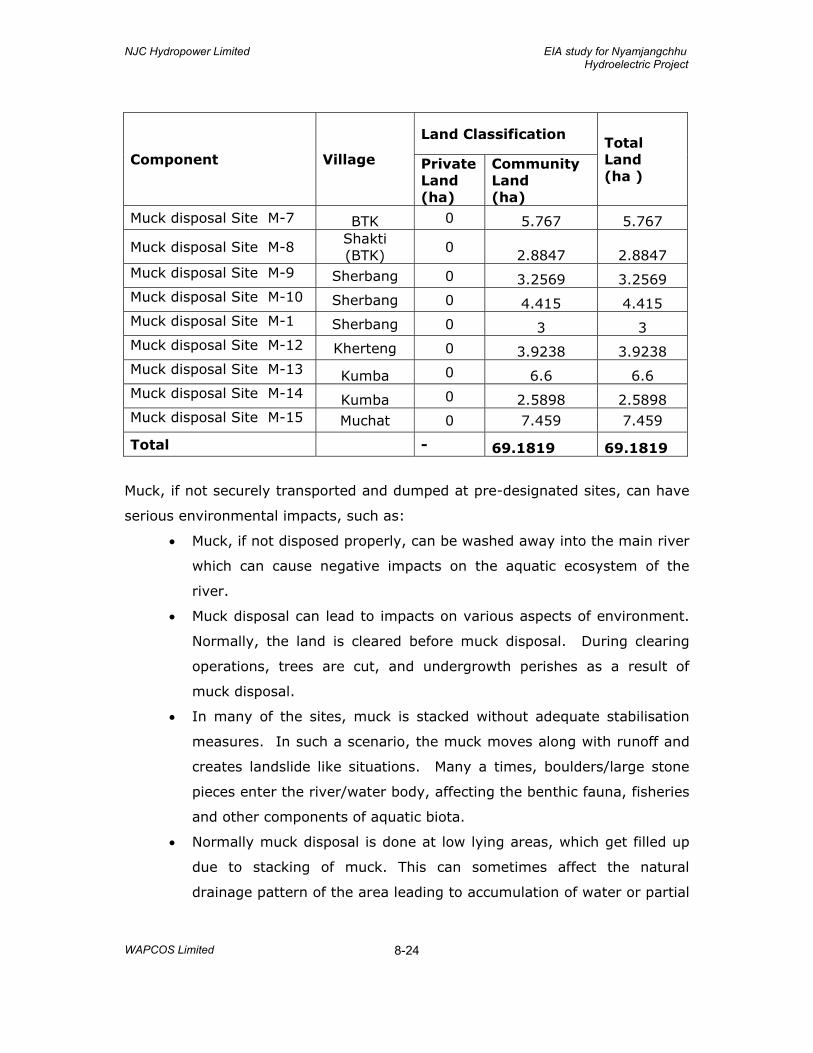
NJC Hydropower Limited EIA study for Nyamjangchhu Hydroelectric Project
WAPCOS Limited
8-24
Component Village
Land Classification Total Land (ha )
Private Land (ha)
Community Land (ha)
Muck disposal Site M-7 BTK 0 5.767 5.767
Muck disposal Site M-8 Shakti (BTK)
0 2.8847 2.8847
Muck disposal Site M-9 Sherbang 0 3.2569 3.2569 Muck disposal Site M-10 Sherbang 0 4.415 4.415 Muck disposal Site M-1 Sherbang 0 3 3 Muck disposal Site M-12 Kherteng 0 3.9238 3.9238 Muck disposal Site M-13 Kumba 0 6.6 6.6 Muck disposal Site M-14 Kumba 0 2.5898 2.5898 Muck disposal Site M-15 Muchat 0 7.459 7.459
Total - 69.1819 69.1819
Muck, if not securely transported and dumped at pre-designated sites, can have
serious environmental impacts, such as:
• Muck, if not disposed properly, can be washed away into the main river
which can cause negative impacts on the aquatic ecosystem of the
river.
• Muck disposal can lead to impacts on various aspects of environment.
Normally, the land is cleared before muck disposal. During clearing
operations, trees are cut, and undergrowth perishes as a result of
muck disposal.
• In many of the sites, muck is stacked without adequate stabilisation
measures. In such a scenario, the muck moves along with runoff and
creates landslide like situations. Many a times, boulders/large stone
pieces enter the river/water body, affecting the benthic fauna, fisheries
and other components of aquatic biota.
• Normally muck disposal is done at low lying areas, which get filled up
due to stacking of muck. This can sometimes affect the natural
drainage pattern of the area leading to accumulation of water or partial
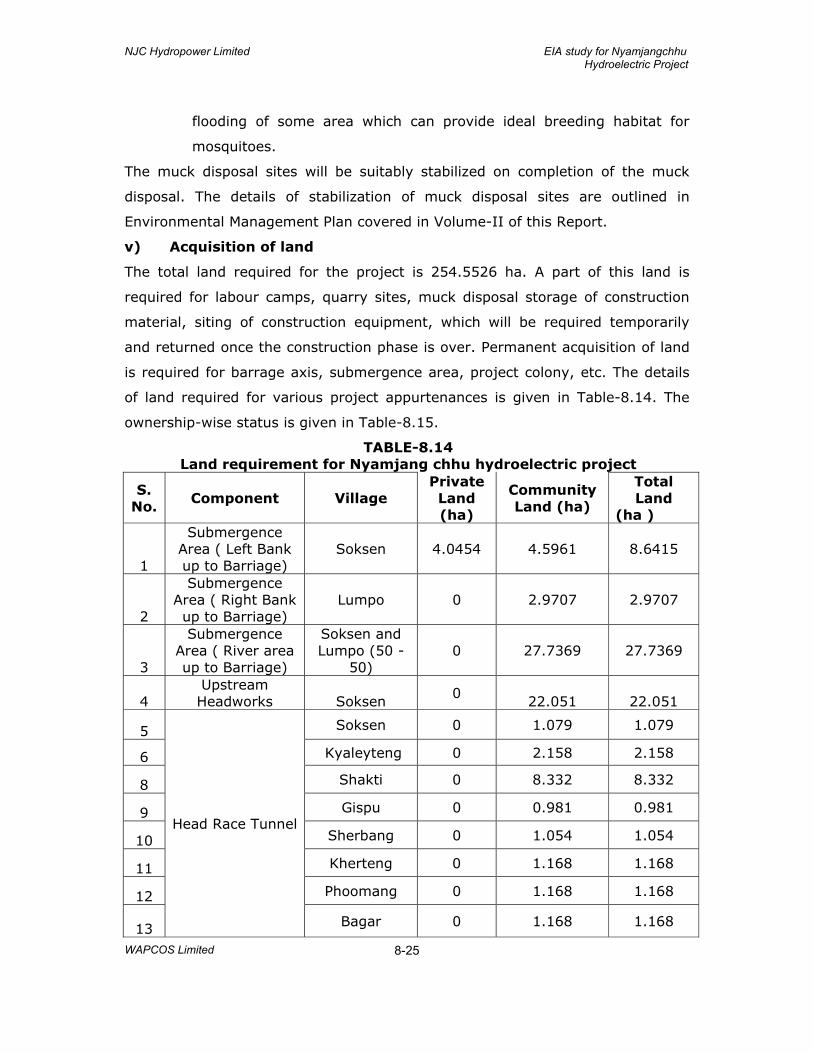
NJC Hydropower Limited EIA study for Nyamjangchhu Hydroelectric Project
WAPCOS Limited
8-25
flooding of some area which can provide ideal breeding habitat for
mosquitoes.
The muck disposal sites will be suitably stabilized on completion of the muck
disposal. The details of stabilization of muck disposal sites are outlined in
Environmental Management Plan covered in Volume-II of this Report.
v) Acquisition of land
The total land required for the project is 254.5526 ha. A part of this land is
required for labour camps, quarry sites, muck disposal storage of construction
material, siting of construction equipment, which will be required temporarily
and returned once the construction phase is over. Permanent acquisition of land
is required for barrage axis, submergence area, project colony, etc. The details
of land required for various project appurtenances is given in Table-8.14. The
ownership-wise status is given in Table-8.15.
TABLE-8.14 Land requirement for Nyamjang chhu hydroelectric project
S. No.
Component Village Private Land (ha)
Community Land (ha)
Total Land
(ha )
1
Submergence Area ( Left Bank up to Barriage)
Soksen 4.0454 4.5961 8.6415
2
Submergence Area ( Right Bank up to Barriage)
Lumpo 0 2.9707 2.9707
3
Submergence Area ( River area up to Barriage)
Soksen and Lumpo (50 -
50) 0 27.7369 27.7369
4 Upstream Headworks Soksen
0 22.051 22.051
5
Head Race Tunnel
Soksen 0 1.079 1.079
6 Kyaleyteng 0 2.158 2.158
8 Shakti 0 8.332 8.332
9 Gispu 0 0.981 0.981
10 Sherbang 0 1.054 1.054
11 Kherteng 0 1.168 1.168
12 Phoomang 0 1.168 1.168
13 Bagar 0 1.168 1.168
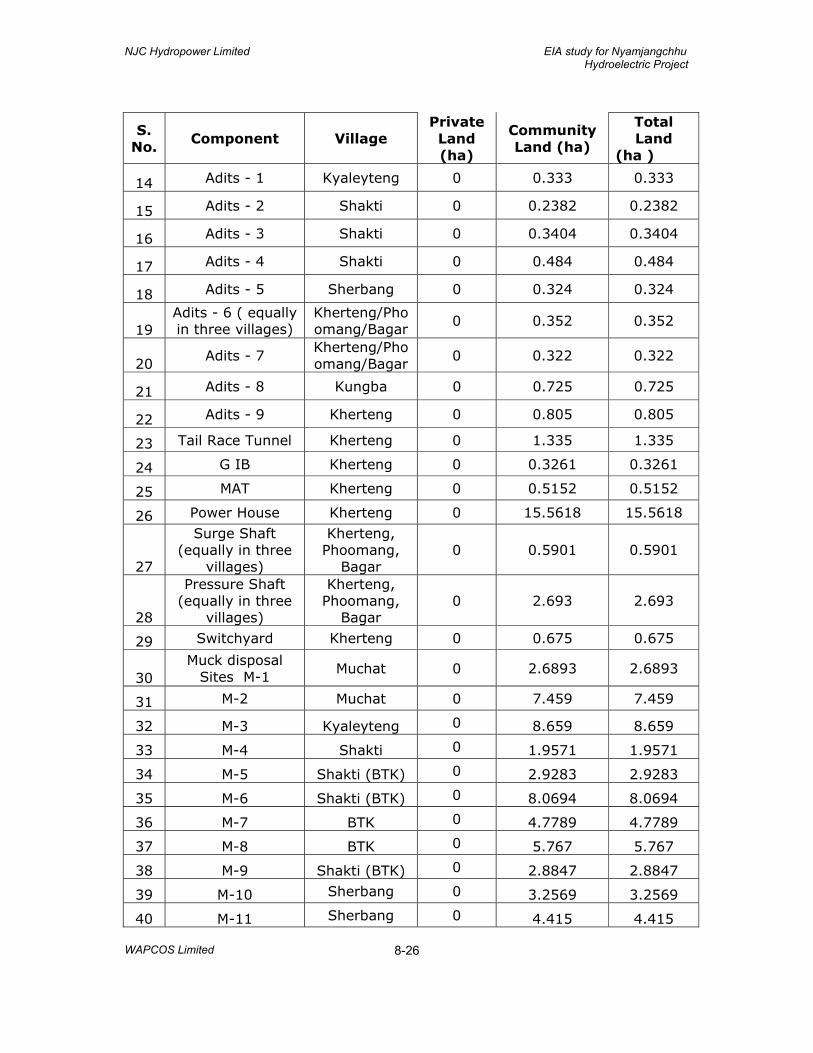
NJC Hydropower Limited EIA study for Nyamjangchhu Hydroelectric Project
WAPCOS Limited
8-26
S. No.
Component Village Private Land (ha)
Community Land (ha)
Total Land
(ha )
14 Adits - 1 Kyaleyteng 0 0.333 0.333
15 Adits - 2 Shakti 0 0.2382 0.2382
16 Adits - 3 Shakti 0 0.3404 0.3404
17 Adits - 4 Shakti 0 0.484 0.484
18 Adits - 5 Sherbang 0 0.324 0.324
19 Adits - 6 ( equally in three villages)
Kherteng/Phoomang/Bagar
0 0.352 0.352
20 Adits - 7
Kherteng/Phoomang/Bagar
0 0.322 0.322
21 Adits - 8 Kungba 0 0.725 0.725
22 Adits - 9 Kherteng 0 0.805 0.805
23 Tail Race Tunnel Kherteng 0 1.335 1.335
24 G IB Kherteng 0 0.3261 0.3261
25 MAT Kherteng 0 0.5152 0.5152
26 Power House Kherteng 0 15.5618 15.5618
27
Surge Shaft (equally in three
villages)
Kherteng, Phoomang,
Bagar 0 0.5901 0.5901
28
Pressure Shaft (equally in three
villages)
Kherteng, Phoomang,
Bagar 0 2.693 2.693
29 Switchyard Kherteng 0 0.675 0.675
30 Muck disposal
Sites M-1 Muchat 0 2.6893 2.6893
31 M-2 Muchat 0 7.459 7.459
32 M-3 Kyaleyteng 0 8.659 8.659
33 M-4 Shakti 0 1.9571 1.9571
34 M-5 Shakti (BTK) 0 2.9283 2.9283
35 M-6 Shakti (BTK) 0 8.0694 8.0694
36 M-7 BTK 0 4.7789 4.7789
37 M-8 BTK 0 5.767 5.767
38 M-9 Shakti (BTK) 0 2.8847 2.8847
39 M-10 Sherbang 0 3.2569 3.2569
40 M-11 Sherbang 0 4.415 4.415
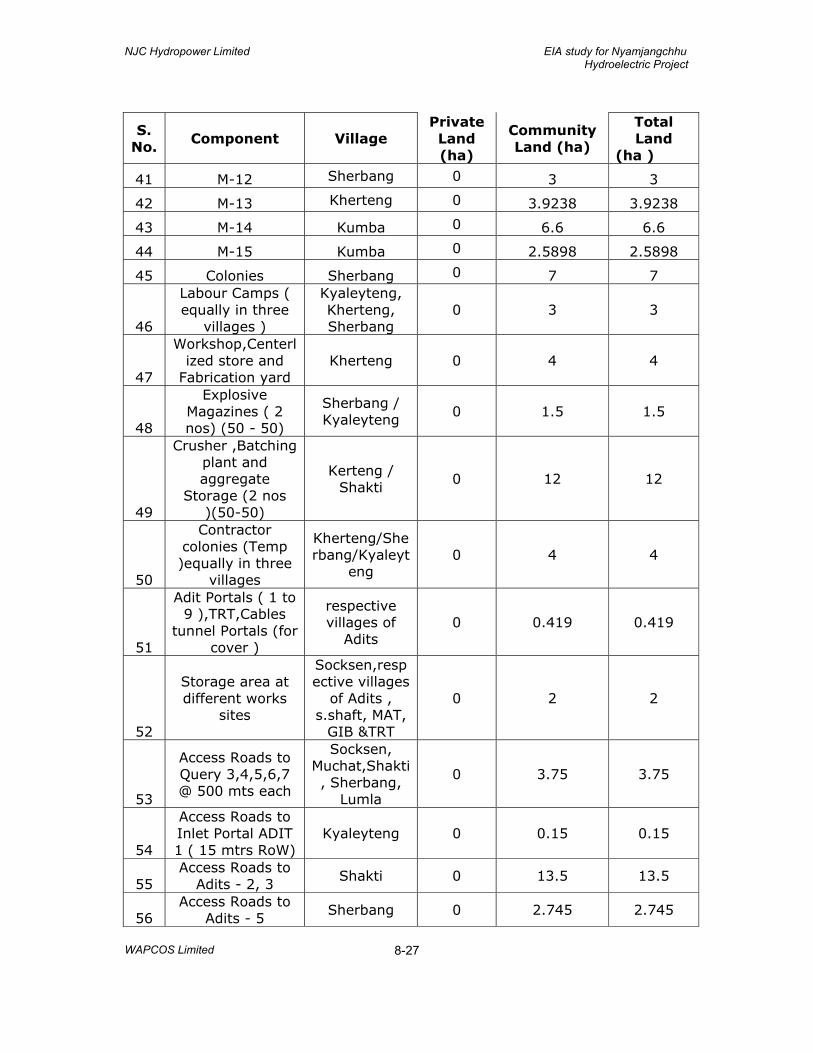
NJC Hydropower Limited EIA study for Nyamjangchhu Hydroelectric Project
WAPCOS Limited
8-27
S. No.
Component Village Private Land (ha)
Community Land (ha)
Total Land
(ha )
41 M-12 Sherbang 0 3 3
42 M-13 Kherteng 0 3.9238 3.9238
43 M-14 Kumba 0 6.6 6.6
44 M-15 Kumba 0 2.5898 2.5898
45 Colonies Sherbang 0 7 7
46
Labour Camps ( equally in three
villages )
Kyaleyteng, Kherteng, Sherbang
0 3 3
47
Workshop,Centerlized store and
Fabrication yard Kherteng 0 4 4
48
Explosive Magazines ( 2 nos) (50 - 50)
Sherbang / Kyaleyteng
0 1.5 1.5
49
Crusher ,Batching plant and aggregate
Storage (2 nos )(50-50)
Kerteng / Shakti
0 12 12
50
Contractor colonies (Temp )equally in three
villages
Kherteng/Sherbang/Kyaleyt
eng 0 4 4
51
Adit Portals ( 1 to 9 ),TRT,Cables
tunnel Portals (for cover )
respective villages of
Adits 0 0.419 0.419
52
Storage area at different works
sites
Socksen,respective villages
of Adits , s.shaft, MAT,
GIB &TRT
0 2 2
53
Access Roads to Query 3,4,5,6,7 @ 500 mts each
Socksen, Muchat,Shakti, Sherbang,
Lumla
0 3.75 3.75
54
Access Roads to Inlet Portal ADIT 1 ( 15 mtrs RoW)
Kyaleyteng 0 0.15 0.15
55 Access Roads to
Adits - 2, 3 Shakti 0 13.5 13.5
56 Access Roads to
Adits - 5 Sherbang 0 2.745 2.745
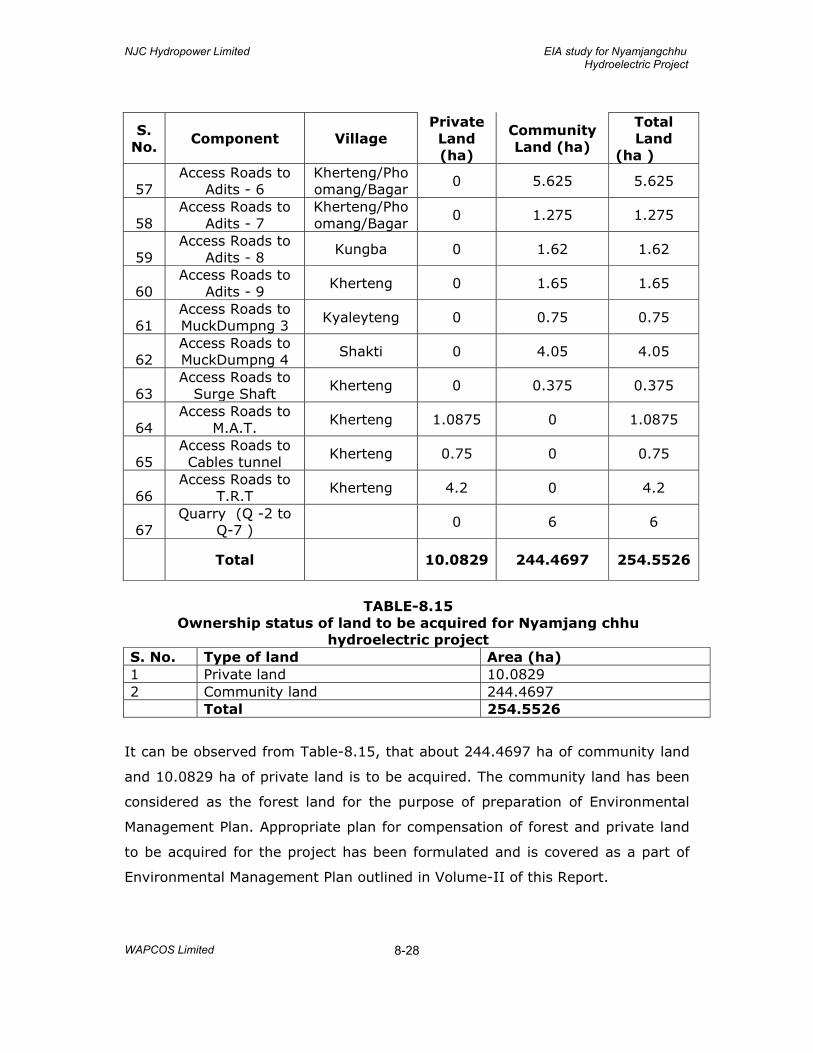
NJC Hydropower Limited EIA study for Nyamjangchhu Hydroelectric Project
WAPCOS Limited
8-28
S. No.
Component Village Private Land (ha)
Community Land (ha)
Total Land
(ha )
57 Access Roads to
Adits - 6 Kherteng/Phoomang/Bagar
0 5.625 5.625
58 Access Roads to
Adits - 7 Kherteng/Phoomang/Bagar
0 1.275 1.275
59 Access Roads to
Adits - 8 Kungba 0 1.62 1.62
60 Access Roads to
Adits - 9 Kherteng 0 1.65 1.65
61 Access Roads to MuckDumpng 3
Kyaleyteng 0 0.75 0.75
62 Access Roads to MuckDumpng 4
Shakti 0 4.05 4.05
63 Access Roads to
Surge Shaft Kherteng 0 0.375 0.375
64 Access Roads to
M.A.T. Kherteng 1.0875 0 1.0875
65 Access Roads to Cables tunnel
Kherteng 0.75 0 0.75
66 Access Roads to
T.R.T Kherteng 4.2 0 4.2
67 Quarry (Q -2 to
Q-7 ) 0 6 6
Total 10.0829 244.4697 254.5526
TABLE-8.15
Ownership status of land to be acquired for Nyamjang chhu hydroelectric project
S. No. Type of land Area (ha) 1 Private land 10.0829 2 Community land 244.4697 Total 254.5526
It can be observed from Table-8.15, that about 244.4697 ha of community land
and 10.0829 ha of private land is to be acquired. The community land has been
considered as the forest land for the purpose of preparation of Environmental
Management Plan. Appropriate plan for compensation of forest and private land
to be acquired for the project has been formulated and is covered as a part of
Environmental Management Plan outlined in Volume-II of this Report.

NJC Hydropower Limited EIA study for Nyamjangchhu Hydroelectric Project
WAPCOS Limited
8-29
vi) Impacts due to roads
A network of new roads is required to facilitate completion of the project as per
anticipated time schedule. Major components like Barrage, Power House, Surge
Shaft and Permanent Colonies for the project near village Kharteng and Zimithang
will require construction of new roads on the left bank. A bridge has to be
constructed across river Nyamjang Chhu upstream of the existing BTK bridge to
approach adits to HRT from the existing road on right bank. The total length of
new roads to be constructed has been estimated as 60.00 km as detailed in
Table-8.16.
TABLE-8.16 List of new roads to be constructed
Connecting details Length (km) Length of road to reach various adits and other project components
54.5
Length of road from existing road to Power House
2.5
Length of internal road from existing road at Barrage on Right bank and new Road on Left bank.
3.0
Total 60.0
Apart from the above major roads about 40 km of road network will be required
for approach to the various muck dumping yards. About 120 km of existing roads
in the project area from Tawang to Zimithang may require strengthening and
widening including bridges and cross drainage works.
The construction of roads can lead to the following impacts:
• The topography of the project area has steep to precipitatuous slope,
which descends rapidly into narrow valleys. The conditions can give rise to
erosion hazards due to net downhill movement of soil aggregates.
• Removal of trees on slopes and re-working of the slopes in the immediate
vicinity of roads can encourage landslides, erosion gullies, etc. With the
removal of vegetal cover, erosive action of water gets pronounced and
accelerates the process of soil erosion and formation of deep gullies.
Consequently, the hill faces are bared of soil vegetative cover and
enormous quantities of soil and rock can move down the rivers, and in
some cases, the road itself may get washed out.
NJC Hydropower Limited EIA study for Nyamjangchhu Hydroelectric Project
WAPCOS Limited
8-30
• Construction of new roads increases the accessibility of a hitherto
undisturbed areas resulting in greater human interferences and
subsequent adverse impacts on the ecosystem.
• Increased air pollution during construction phase.
8.6 IMPACTS ON BIOLOGICAL ENVIRONMENT
a) Construction phase
8.6.1 Impacts on Terrestrial flora
i) Increased human interferences
The direct impact of construction activity of any water resource project in a
Himalayan terrain is generally limited in the vicinity of the construction sites
only. As mentioned earlier, a large population (11,200) including technical staff,
workers and other group of people are likely to congregate in the area during
the project construction phase. It can be assumed that the technical staff will be
of higher economic status and will live in a more urbanized habitat, and will not
use wood as fuel, if adequate alternate sources of fuel are provided. However,
workers and other population groups residing in the area may use fuel wood, if
no alternate fuel is provided for whom alternate fuel could be provided. There
will be an increase in population by about 11200 of which about 9000 are likely
to use fuel wood. On an average, the fuel wood requirements will be of the order
of (1.0 x 365 x 9000 x 10-3) 3785 m3. The wood generated by cutting tree is
about 2 to 3 m3. Thus every year fuel wood equivalent to bout 1000-1500 trees
will be cut, which means every year on an average about 2-3 ha of forest area
will be cleared for meeting fuel wood requirements, if no alternate sources of
fuel are provided. Hence to minimize impacts, community kitchens have been
recommended. These community kitchens shall use LPG or diesel as fuel. The
details are covered in Environmental Management Plan covered in Volume-II of
this Report.
The other major impact on the flora in and around the project area would be due
to increased level of human interferences. The workers may also cut trees to
meet their requirements for construction of houses and other needs. Thus, if
proper measures are not undertaken, adverse impacts on terrestrial flora is
NJC Hydropower Limited EIA study for Nyamjangchhu Hydroelectric Project
WAPCOS Limited
8-31
anticipated. Since, labour camps are proposed to be constructed by the
contractor along with necessary facilities, such impacts are not envisaged.
During construction of various components of the project, e.g., road, colony,
dam axis, muck disposal, etc. trees will have to be cleared. The tree felling or
clearing shall be done by the Forest Department.
Impacts due to Vehicular movement and blasting
Dust is expected to be generated during blasting, vehicle movement for
transportation of construction material or construction waste. The dust particles
shall settle on the foliage of trees and plants, thereby reduction in amount of
sunlight falling on tree foliage. This will reduce the photosynthetic activity. Based
on experience in similar settings, the impact is expected to be localized upto a
maximum of 50 to 100 m from the source. In addition, the area experiences
rainfall for almost 8 to 9 months in a year. Thus, minimal deposition of dust is
expected on flora. Thus, no significant impact is expected on this account.
Acquisition of forest land
During project construction phase, land will be required for location of
construction equipment, storage of construction material, muck disposal,
widening of existing roads and construction of new project roads. The total land
requirement for the project is 254.5526 ha of which 244.4697 ha is the
community land. A part of the community land also includes forest land as well.
For EMP purposes, the entire community land has been considered as the forest
land.
The forest in the area has already been degraded due to a large-scale human
interference. Though the project area is located in an ecologically sensitive area,
the forests in and around the project area are quite degraded. The tree density
in the dam site and submergence area is about 250 and 270 trees/ha
respectively. Normally in a dense forest, tree density is of the order of 1000-
1200 trees/ha. Thus, in land to be acquired for the project, the tree density is
low to moderate. Likewise, no rare and endangered species are observed in the
forest to be acquired for the project. Thus, no adverse impacts are anticipated
on this account.
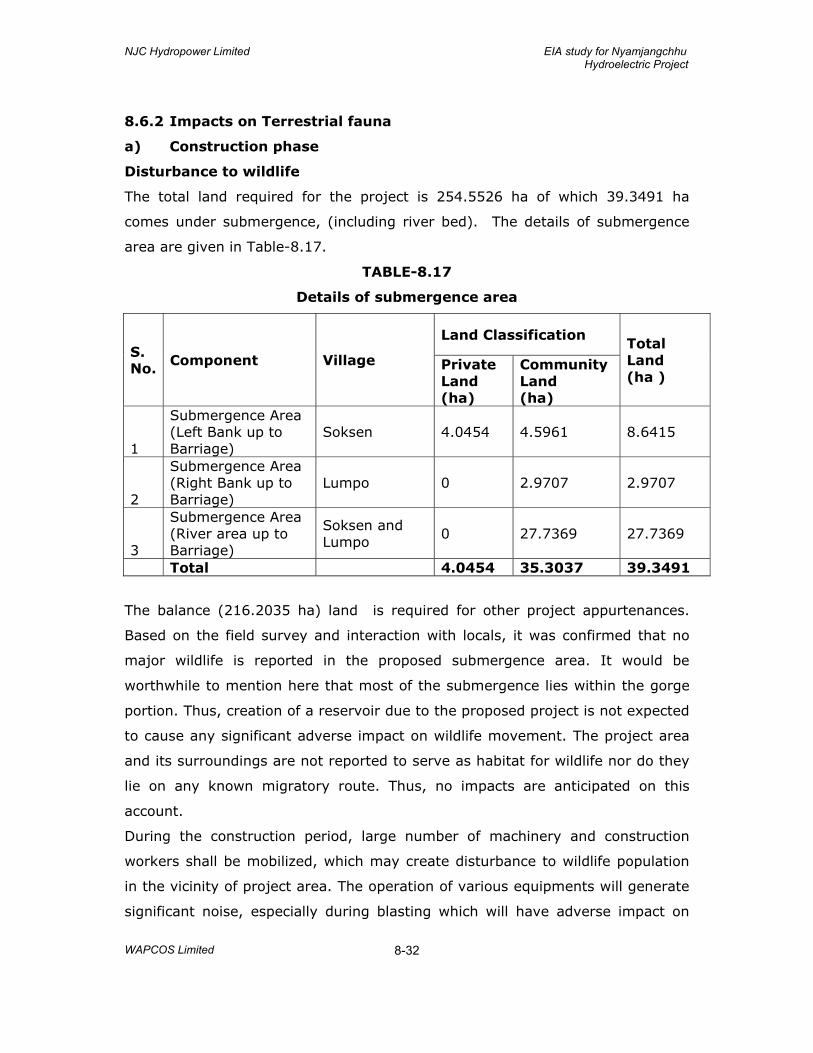
NJC Hydropower Limited EIA study for Nyamjangchhu Hydroelectric Project
WAPCOS Limited
8-32
8.6.2 Impacts on Terrestrial fauna
a) Construction phase
Disturbance to wildlife
The total land required for the project is 254.5526 ha of which 39.3491 ha
comes under submergence, (including river bed). The details of submergence
area are given in Table-8.17.
TABLE-8.17
Details of submergence area
S. No. Component Village
Land Classification Total Land (ha )
Private Land (ha)
Community Land (ha)
1
Submergence Area (Left Bank up to Barriage)
Soksen 4.0454 4.5961 8.6415
2
Submergence Area (Right Bank up to Barriage)
Lumpo 0 2.9707 2.9707
3
Submergence Area (River area up to Barriage)
Soksen and Lumpo
0 27.7369 27.7369
Total 4.0454 35.3037 39.3491
The balance (216.2035 ha) land is required for other project appurtenances.
Based on the field survey and interaction with locals, it was confirmed that no
major wildlife is reported in the proposed submergence area. It would be
worthwhile to mention here that most of the submergence lies within the gorge
portion. Thus, creation of a reservoir due to the proposed project is not expected
to cause any significant adverse impact on wildlife movement. The project area
and its surroundings are not reported to serve as habitat for wildlife nor do they
lie on any known migratory route. Thus, no impacts are anticipated on this
account.
During the construction period, large number of machinery and construction
workers shall be mobilized, which may create disturbance to wildlife population
in the vicinity of project area. The operation of various equipments will generate
significant noise, especially during blasting which will have adverse impact on
NJC Hydropower Limited EIA study for Nyamjangchhu Hydroelectric Project
WAPCOS Limited
8-33
fauna of the area. The noise may scare the fauna and force them to migrate to
other areas. Likewise siting of construction plants, workshops, stores, labour
camps etc. could also lead to adverse impact on fauna of the area. During the
construction phase, accessibility to area will lead to influx of workers and the
people associated with the allied activities from outside will also increase.
Increase in human interference could have an impact on terrestrial ecosystem.
The other major impact could be the blasting to be carried out during
construction phase. This impact needs to be mitigated by adopting controlled
blasting and strict surveillance regime and the same is proposed to be used in
the project. This will reduce the noise level and vibrations due to blasting to a
great extent.
Likewise, siting of construction equipment, godowns, stores, labour camps, etc.
may generally disturb the fauna in the area. However, no large-scale fauna is
observed in the area. Thus, impacts on this account are not expected to be
significant. However, few stray animals sometimes venture in and around the
project site. Thus, to minimize any harm due to poaching activities from
immigrant labour population, strict anti-poaching surveillance measures need to
be implemented, especially during project construction phase. The same have
been suggested as a part of the Environmental Management Plan (EMP).
Impacts on migratory routes
The faunal species observed in the project area are not migratory in nature. The
proposed submergence area is not the migratory route of wild animals. The
construction of the proposed Nyamjangchhu H.E. project will form a reservoir of
about 41.268 ha, which is also not reported to be on the migratory route of any
major faunal species.
Impacts on avi-fauna
The project area and its surroundings are quite rich in avi-fauna. However, water
birds are not very common in the area. The main reason for this phenomenon is
that water birds generally require quiescent or slow moving water environment.
However, in the proposed project area and its surroundings due to terrain
conditions, water flow is swift, which does not provide suitable habitat for the
growth of water birds. With the damming of the river, a reservoir of an area of
NJC Hydropower Limited EIA study for Nyamjangchhu Hydroelectric Project
WAPCOS Limited
8-34
about 39.3491 ha will be created, with quiescent/tranquil conditions. The
reservoir banks will have wet environment throughout the year which can lead to
proliferation of vegetation e.g. grass, etc. along the reservoir banks. Such
conditions are generally ideal for various kinds of birds, especially, water birds.
This is expected to increase the avi-faunal population of the area.
b) Operation phase
i) Increased accessibility
During the project operation phase, the accessibility to the area will improve due
to construction of roads, which in turn may increase human interferences leading
to marginal adverse impacts on the terrestrial ecosystem. The increased
accessibility to the area can lead to increased human interferences in the form of
illegal logging, lopping of trees, collection of non-timber forest produce, etc.
Since significant wildlife population is not found in the region, adverse impacts of
such interferences are likely to be marginal. The details of measures to improve
the terrestrial ecology of the area are covered in separate volume of this Report.
8.6.3 Aquatic Flora
a) Construction phase
During construction phase wastewater mostly from domestic source will be
discharged mostly from various camps of workers actively engaged in the
project area. Around 0.78 mld of water is required for the workers during the
peak construction phase out of which 80% (i.e. about 0.63 mld) will be
discharged back to the river as wastes, more or less as a point sources from
various congregation sites where workers will reside. The average minimum flow
during lean season is about 12.3 cumec. However, sufficient water for dilution
will be available in Nyamjangchhu to keep the DO of the river to significantly
high levels.
b) Operation phase
The completion of Nyamjangchhu hydroelectric Project would bring about
significant changes in the riverine ecology, as the river transforms from a fast-
flowing water system to a quiescent lacustrine environment. Such an alteration
of the habitat would bring changes in physical, chemical and biotic life. Among
the biotic communities, certain species can survive the transitional phase and
NJC Hydropower Limited EIA study for Nyamjangchhu Hydroelectric Project
WAPCOS Limited
8-35
can adapt to the changed riverine habitat. There are other species amongst the
biotic communities, which, however, for varied reasons related to feeding and
reproductive characteristics cannot acclimatize to the changed environment, and
may disappear in the early years of impoundment of water. The micro-biotic
organisms especially diatoms, blue-green and green algae before the operation
of project, have their habitats beneath boulders, stones, fallen logs along the
river, where depth is such that light penetration can take place. But with the
damming of river, these organisms may perish as a result of increase in depth.
8.6.4 Impacts on Aquatic Fauna
Construction phase
Impacts due to excavation of construction material from river bed
During the construction phase a large quantity of construction material like
stones, pebbles, gravel and sand would be needed. Significant amount of
material is available in the river bed. It is proposed to extract construction
material from borrow areas in the river bed. The extraction of construction
material may affects the river water quality due to increase in the turbidity
levels. This is mainly because the dredged material gets released during one or
all the operations mentioned below:
• excavation of material from the river bed. • loss of material during transport to the surface. • overflow from the dredger while loading • loss of material from the dredger during transportation.
The cumulative impact of all the above operations is increase in turbidity levels.
Good dredging practices can however, minimize turbidity. It has also been
observed that slope collapse is the major factor responsible for increase in the
turbidity levels. If the depth of cut is too high, there is possibility of slope collapse,
which releases a sediment cloud. This will further move outside the suction radius
of dredged head. In order to avoid this typical situation, the depth of cut be
restricted to:
γ H/C < 5.5
where, γ - unit weight of the soil H - depth of soil C - Cohesive strength of soil
NJC Hydropower Limited EIA study for Nyamjangchhu Hydroelectric Project
WAPCOS Limited
8-36
The dredging and deposition of dredged material may affect the survival and
propagation of benthic organisms. The macro-benthic life which remains attached
to the stones, boulders etc. gets dislodged and is carried away downstream by
turbulent flow. The areas from where construction material is excavated, benthic
fauna gets destroyed. In due course of time, however, the area gets recolonized,
with fresh benthic fauna. The density and diversity of benthic fauna, will however,
be less as compared with the pre-dredging levels.
The second important impact is on the spawning areas of fishes. Almost all the
cold water fish breed in the flowing waters. The spawning areas of these fish
species are found amongst pebbles, gravel, sand etc. The eggs are sticky in
nature and remain embedded in the gravel and subsequently hatch. Any
disturbance of stream bottom will result in adverse impacts on fish eggs. Even
increase in fine solids beyond 25 ppm will result in deposition of silt over the
eggs, which would result in asphyxiation of developing embryo and also choking
of gills of young newly emerged fry. Thus, if adequate precautions during
dredging operations are not undertaken, then significant adverse impacts on
aquatic ecology are anticipated.
Impacts due to discharge of sewage from labour camp/colony
The proposed hydro-power project envisages construction of a project colony at
village Sherbang. The labour camp and colonies are proposed at Kyaleyteng,
Kherteng, Sherbang. This would result in emergence of domestic waste water
which is usually discharged into the river. However, it is proposed to commission
appropriate units for treatment of domestic sewage before its disposal in to the
river. Due to perennial nature of river Nyamjangchhu, it maintains sufficient flow
throughout the year which is sufficient to dilute the treated sewage from
residential colonies. Therefore, as mentioned earlier, no adverse impacts on
water quality are anticipated due to discharge of sewage from labour
camp/colony.
Impacts due to human activities
Accumulation of labour force in the project area might result in enhancement in
indiscriminate fishing including use of explosives. The use of explosive material
NJC Hydropower Limited EIA study for Nyamjangchhu Hydroelectric Project
WAPCOS Limited
8-37
to kill fishes in the river in the project area would result in complete loss of
fishes and other aquatic life making a river stretch completely barren.
Indiscriminate fishing will reduce fish stock availability for commercial and sport
fishermen. These aspects have been adequately covered in the Environmental
Management Plan (EMP) outlined Separate Volume of this Report.
(b) Operation Phase
Impacts due to damming of river
The damming of river Nyamjanghhu due to the proposed hydroelectric project in
creation of 39.3491 ha of submergence area. The dam will change the fast flowing
river to a quiscent lacustrine environment. The creation of a pond will bring about
a number of alterations in physical, abiotic and biotic parameters both in upstream
and downstream directions of the proposed barrage site. The micro and macro
benthic biota is likely to be most severely affected as a result of the proposed
project.
The positive impact of the project will be the formation of a water body which can
be used for fish stocks on commercial basis to meet the protein requirement of
region. The commercial fishing in the proposed reservoir would be successful,
provided all tree stumps and other undesirable objects are removed before
submergence. The existence of tree stumps and other objects will hinder the
operation of deep water nets. The nets will get entangled in the tree stumps and
may be damaged.
The reduction in flow rate of river Nyamjanghhu especially during lean period is
likely to increase turbidity levels downstream of the dam. Further reduction in
rate of flow may even create condition of semi-dessication in certain stretches of
the river. This would result in loss of fish life by poaching. Hence, it is essential
to maintain minimum flow required for well being of fish life till the disposal point
of the tail race discharge.
Impacts on migratory fish species
The obstruction created by the dam would hinder migration of species especially
the Mahseers (from downstream to upper reaches) and Schizothorax sp. (from
upper reaches to the lower reaches). These fishes undertake annual migration for
feeding and breeding. Therefore, fish migration path may be obstructed due to

NJC Hydropower Limited EIA study for Nyamjangchhu Hydroelectric Project
WAPCOS Limited
8-38
high dam and fishes are expected to congregate below the dam wall. Under this
situation poaching activities may increase in the area. Most of the species will shift
to the section of the river where they find favourable environment for breeding
since the dam is 11.5 m high construction of fish ladders is a feasible option.
However, it is also proposed that the artificial seed production in hatchery may be
adopted which can be stocked in the river stretches downstream and upstream of
the proposed barrage.
8.7 IMPACTS ON SOCIO-ECONOMIC ENVIRONMENT
A project of this magnitude is likely to entail both positive as well as negative
impacts on the socio-cultural fabric of the area. During construction and
operation phases, a lot of allied activities will mushroom in the project area.
8.7.1 Impacts due to influx of labour force
During the construction phase a large labour force, including skilled, semi-skilled
and un-skilled labour force of the order of about 3500 persons, is expected to
immigrate into the project area. It is felt that most of the labour force would
come from other parts of the country. However, some of the locals would also be
employed to work in the project. The labour force would stay near to the project
construction sites.
The project will also lead to certain negative impacts. The most important
negative impact would be during the construction phase. The labour force that
would work in the construction site would settle around the site. They would
temporarily reside there. This may lead to filth, in terms of domestic
wastewater, human waste, etc. Besides, other deleterious impacts are likely to
emerge due to inter-mixing of the local communities with the labour force.
Differences in social, cultural and economic conditions among the locals and
labour force could also lead to friction between the migrant labour population
and the total population.
8.7.2 Economic impacts of the project
Apart from direct employment, the opportunities for indirect employment will
also be generated which would provide great impetus to the economy of the
local area. Various types of business like shops, food-stall, tea stalls, etc.
besides a variety of suppliers, traders, transporters will concentrate here and
benefit immensely as demand will increase significantly for almost all types of

NJC Hydropower Limited EIA study for Nyamjangchhu Hydroelectric Project
WAPCOS Limited
8-39
goods and services. The business community as a whole will be benefited. The
locals will avail these opportunities arising from the project and increase their
income levels. With the increase in the income levels, there will be an
improvement in the infrastructure facilities in the area.
8.7.3 Impacts due to land acquisition
Another most important deleterious impact during construction phase will be
that, pertaining to land acquisition. About 254.5526 ha of land proposed to be
acquired for the proposed Nyamjangchhu hydro-electric project. Of this about
10.0829 ha is private land. The details of land acquisition, project
appurtenances-wise and ownership-wise, are depicted in Tables – 8.14 and 8.15
of this Chapter.
It is observed that about 10.0829 ha of private land is proposed to be acquired
from -5 hamlets/villages. It is observed that about 47 PAFs are likely to lose land
in varying proportions. No family is likely to lose homestead on accouont of land
acquisition for the project. The list of Project affected hamlets/villages is
depicted in Table – 8.18.
TABLE – 8.18 Project affected hamlets/villages due to
the process of land acquisition S. No. Name of Project Affected hamlets/
villages 1 Khaleteng 2 Kharteng 3 Kungba 4 Lumla 5 Soksen
8.7.4 Impacts on cultural/religious/historical monuments
Apart from village temple in the study area, monuments of cultural, religious,
historical or archaeological importance are not reported in the project as well as
the study area. Thus, no impact on such structures is envisaged.
8.8 INCREASED INCIDENCE OF WATER-RELATED DISEASES
8.8.1 Increased incidence of water-related diseases
The construction of a barrage would convert riverine ecosystem into a lacustrine
ecosystem. The vectors of various diseases may breed in shallow parts of the
NJC Hydropower Limited EIA study for Nyamjangchhu Hydroelectric Project
WAPCOS Limited
8-40
impounded water. The magnitude of breeding sites for mosquitoes and other
vectors in the impounded water is in direct proportion to the length of the
shoreline. Since, this is a run-of river project in a mountainous region, increase in
water spread area will be marginal and it would remain mostly confined in the
gorge of the river, the increase in the incidence of water borne disease is not
expected. Further, mosquitoes are normally observed upto a maximum elevation
of about 2000 m above sea level. The proposed project is located just above this
elevation. , Hence, increase in incidence of mosquitoes is not expected at the
barrage site. The power house is located at an elevation of about 1000 m above
men sea level. Thus at this site and at the location of other project appurtenances,
which are at a lower elevation could face increased incidence of malaria as a result
of various factors like aggregation of labour, formation of stagnant pools near
labour camps, colonies, etc. may lead to the increased incidence of such diseases
around the project area.
Labour camps located at lower elevations, especially close to the power house site
could be vulnerable to increased incidence of water-borne diseases, if adequate
measures are not undertaken.
8.8.2 Aggregation of labour
About 3500 labourers and technical staff will congregate in the project area during
peak construction phase. The total increase in population is expected to be of the
order of 11200. Most of the labour would come from various parts of the country.
The labourer would live in dormitories provided by the Contractor. Proper sanitary
facilities are generally provided. Hence, a proper surveillance and immunization
schedule needs to be developed for the labour population migrating into the
project area.
8.8.3 Excavations
The excavation of earth from borrow pits etc. is one of the major factor for the
increase in prevalence of malaria. After excavation of construction material, the
depressions are generally left without treatment where water gets collected. These
pools of water, then serves as breeding grounds for mosquitoes. However, in the
present case, the borrow areas are within the river bed, which in any case remain
under water. Thus, no additional habitat for mosquito breeding is created due to
excavation. The flight of mosquito is generally limited up to 1 to 2 km from the
NJC Hydropower Limited EIA study for Nyamjangchhu Hydroelectric Project
WAPCOS Limited
8-41
breeding sites. Since, no residential areas are located within 1 km from the
reservoir, periphery, increased incidences of malaria are not anticipated. However,
labour camps, etc. could be vulnerable to increased incidence of malaria, if proper
control measures are not undertaken.
8.8.4 Inadequate facilities in labour camps
Improperly planned labour camps generally tend to become slums, with
inadequate facilities for potable water supply and sewage treatment and disposal.
This could lead to outbreak of epidemics of water-borne diseases. Adequate
measures for supply of potable water and sewage treatment have been
recommended as a part of Environmental Management Plan outlined in separate
Volume of this Report.
8.9 IMPACTS ON GEOLOGICAL ENVIRONMENT
The project area lies mainly within Central Crystallines represented by Sela Group
of rocks (Palaeoproterozoic) that are dominated by coarse grained quartz biotite
gneiss. The Main Central Thrust (MCT), separating Sela Group from the Lesser
Himalayan formations is disposed 60 km to the south, but, the Lumla Window (Yin
et al. 2006) comprising the interbedded biotite schist and quartzites of Lumla
Formation (Mesoproterozoic) lies 15 km south of the barrage site. In general the
strata have gentle dips that are northwesterly in upstream area (N330/30),
northeasterly in central area (N020-060/30) and southerly dips in the downstream
area (N170/30). A maximum of four joint sets have been identified separately for
upstream, central and downstream areas of the project.
The site for the proposed barrage across the River Nyamjang Chhu is located over
a major lacustrine deposit formed within the gneissic terrain of Central
Crystallines. The general foliation dip of the rocks, that also represents the main
joint set, is towards right bank, viz N 240-300/15-40. The set of sub-vertical
transverse joints, striking across the river, constitutes the other important and
conspicuous feature at the site. The Zimithang Fault Scarp, a conspicuous +25m
high feature, also strikes sub-parallel to the transverse set of joints.
The lacustrine deposit is dominated by fine and medium sand and is characterized
by complete absence of pebbly horizons. 3-7.5 m thick coarser river borne material
comprising sand, gravel and pebbles overlies the lacustrine deposit. The
investigations by drilling have confirmed the interpreted thickness of the lacustrine
NJC Hydropower Limited EIA study for Nyamjangchhu Hydroelectric Project
WAPCOS Limited
8-42
deposit that is as much as 91.5m. The overall grain size distribution pattern in the
barrage area reveals dominance of fine sand that ranges between 44% and 91%.
This is followed by medium sand that is in proportions of 4% to 41% and silt in the
proportions of 7% to 38%. The coarse sand is limited to stray pockets in low
proportions. Clay fraction is not found.
The depth of SPT ‘N’ value of 20 or less is found varying between depths 10.5m
and 22.5m, and is nil in one hole. The average depth works out to be 13.25m.
Along the barrage axis, the SPT ‘N’ value of 20 or less is restricted to a maximum
depth of 15m, and an average depth of 9m. In general, the permeability of the
material ranges between 1.01x10⁻³ and 4.5x10⁻³ cm/sec with lower values
ranging between 1.7x10⁻⁴ and 9.13x10⁻⁴ cm/sec. The material, therefore, is
generally having medium permeability, and low permeability zones are limited to
insignificant pockets, like in BH-5 and BH-5A. The barrage is accordingly to be
founded on material with medium permeability. Atterberg’s Limit indicates the
material to be non-plastic. The seismic velocities of the deposit vary from 380 to
4000 m/s and have been related to unconsolidated and consolidated material.
Seismo-tectonic evaluation of the site has revealed that the area falls in the most
seismically susceptible regions of the Himalaya, viz Zone-V of the Seismic Zoning
Map of India (Anon. 2002). It also falls within the Isoseismal-IX of the Assam
Earthquake of 12 June 1897 (Anon. 2000). The site specific design earthquake
parameter studies have been conducted by the University of Roorkee and, for MCE
condition, is estimated to be Ms=8.0 magnitude earthquake occurring at MCT
(Anon. 2009). The PGA values for MCE and DBE conditions are estimated to be
0.36g and 0.18g, respectively.
The investigation results, in particular SPT and permeability, present the risk of
liquefaction (Seed and Idriss 1971). In the foundation area of the proposed
barrage, the average depth of material susceptible to liquefaction is about 9m.
However, detailed palaeo-seismic studies at the site reveal that the lacustrine
deposit and the recent river terraces are intact and completely devoid of any
feature like sand dyke, neo-tectonic activity, etc. This feature may be considered
as indicative of reduced risk of liquefaction at the project site.
For design purpose, it is proposed to excavate potentially liquefiable material down
to the maximum depth of about 14m from the ground level, i.e. El 2100m, all
NJC Hydropower Limited EIA study for Nyamjangchhu Hydroelectric Project
WAPCOS Limited
8-43
along the structures at the diversion site. The area under the barrage would be
covered with geo- membrane to restrict the upward movement of underneath soil
particles to the treated surface and at the same time it could also be ensured that
pore pressure shall be released out by allowing seepage of water through
membrane and thus safeguard the barrage structure from uplift pressure. The
excavated zone is proposed to be back-filled with well graded and compacted
material. The particle size of the back-fill shall be within the range of 0.1 mm to
150 mm for ensuring that the GSD curve shall lie out of the region which is more
susceptible to liquefaction (Tsuchida 1970).
It has been proposed that prior to placing the back-fill, dynamic compaction and
vibro-floatation techniques shall be used to treat the foundation strata. The graded
back-fill shall be compacted using vibratory roller to achieve a relative density of
more than 80%. The degree of compaction shall be based on minimum SPT
resistance requirements which could be related to relative density in the manner
suggested by Gibbs & Holtz (1957).
The foundation excavation area is expected to be saturated. For controlling
seepage in the excavation area, a plastic concrete cut-off wall is proposed in the
upstream of the barrage.
The 23450 m long Head Race Tunnel is to be excavated for a length of 11316m
through quartz-biotite gneiss in the upstream side and remaining length of
12134m through inter-bedded quartzite and schist in the downstream side. The
contact between these two formations is represented by Lumla Thrust that is found
to be tight in the project area. The entire powerhouse complex including surge
shaft, pressure shafts, underground powerhouse cavern, transformer cavern, etc.
are located within the inter-bedded sequence of quartzite and schist. The portals of
the tunnels and the adits are mostly located in rock.
NJC Hydropower Limited EIA study for Nyamjangchhu Hydroelectric Project
WAPCOS Limited 9-1
CHAPTER - 9
CONSTRUCTION METHODOLOGY
9.1 GENERAL
The project envisages construction of barrage, a head regulator, Feeder
Channel, desilting chamber, collection pool & intake, Head race tunnel, surge
shaft, pressure shaft, underground power house, tail race tunnel and all
infrastructure works. The construction methodology and equipment planning
for various works is based on the site conditions prevailing in the project area.
Construction activities are planned in such a way that the project will be
completed in the shortest possible time period. The following assumptions
have been made for construction methodology and equipment planning of the
project.
All the pre-construction activities like land acquisition, infrastructure works
and government approvals are completed before the start of construction
works on main components of the project. All civil, hydro-mechanical and
electro-mechanical works are executed in following main packages :
CIVIL WORKS Package I : Barrage and Desilting works Package II : Head Race Tunnel from RD-0.00m to
RD-8,400.00m Package III : Head Race Tunnel from RD-8,400.00m
to RD-16,875.00m Package IV : Head Race Tunnel from RD-
16,875.00m to RD-23,450.00 m Package V : Civil works for Surge Shaft and
Pressure Shaft Package VI : Civil works for Power House, Transformer Cavern, Tail Race Tunnel and Switch Yard.
HYDRO-MECHANICAL WORKS Package VII : Hydro Mechanical works comprising of
gates, hoists and Pressure Shafts steel liner Electro-Mechanical Works
Package VIII : Generating Units (Turbine & Generator), Cooling Water System, Drainage/ Dewatering System, Unit Control & Automation, Bus duct.
Package IX : Valves-MIV& BFV Package X : EOT Crane, Package XI : Air Conditioning, Ventilation etc. Package XII : Fire Fighting, Package XIII : Transformers(Generator Transformer),
NJC Hydropower Limited EIA study for Nyamjangchhu Hydroelectric Project
WAPCOS Limited 9-2
Package XIV : 415 V Switchgear & 11 kV Switchgear Package XV : Illumination Package XVI : DG sets (construction power) Package XVII : Cable &Cable Trays Package XVIII : Switchyard & Protection metering Package XIX : Transformer (Dry Type UAT SST), Package XX : DC System (Battery & Battery
Charger), UPS Package XXI : Miscellaneous and finishing works
9.2 BASIC ASESSMENT OF CONSTRUCTION METHODOLGY
The project involves execution of large quantities of excavation and concreting
for surface and underground structures. Considering the magnitude and nature
of construction activity, mechanized construction has been considered for all
type of construction job so as to achieve consistent quality at a faster rate for
timely completion of the project. Special attention has been paid to the
equipment planning for underground works as the restricted work space and
constraints of geology make this exercise very critical.
The construction of the project will involve simultaneous works on all the
packages for civil, hydro-mechanical and electro-mechanical works for various
project components. Tunneling in Head race Tunnel & underground excavation
for power house and transformer cum GIS-Cavern is one of the most critical
activities for the project and accordingly, the work is assumed to continue
uninterrupted till its completion.
9.3 PRE CONSTRUCTION ACTIVITIES
The activities proposed to be undertaken during Pre-construction work include
the following:
Detailed Topographical Survey and marking the Layout at site, Pre- construction geotechnical investigation
Clearance from Government agencies like Pollution control board, Public health, Irrigation and Forest Clearance
Acquisition of Land Financial closure Detailed design and preparation of tender documents for Civil,
Electro-mechanical, Hydro mechanical works Award of Contracts Setting up of Site office Arranging of construction power Construction of approach roads/ paths Route survey of Transmission line Mining Licence for construction materials Formation of project team

NJC Hydropower Limited EIA study for Nyamjangchhu Hydroelectric Project
WAPCOS Limited 9-3
9.4 APPROACH ROADS AND BRIDGE
Transportation of heavy machines and equipments will be required for
construction purpose. Construction of new access roads and bridges, widening
of existing roads and improvement in grade of existing roads shall be
undertaken before starting construction of main project components. These
roads would be connected through an extensive network of project roads to
various colonies, workshop, quarries etc.
9.5 BASIC CONSIDERATIONS
Construction methodology and equipment planning has been carried out
separately for execution of all project components. The types and sizes of
equipment to be used have also been indicated while describing the
construction methodology for each of the components under relevant subhead.
The number of Machines/Equipment required for construction of each
component has been worked out and their size and capacity has been arrived
at after drawing the deployment schedule matching with the construction
schedule.
Most of the construction work shall be executed through contractors. The
requirement of equipment as marked out herein has been utilized for analysis
of rates and Cost Estimates. The prices of construction equipment are based
on the prevalent market prices in India as on May, 2010.
The project area is situated in a region where extensive rainfall occurs during
monsoon. The working season is, therefore, limited to 9 months, beginning
from October to June for open works. The underground works being critical are
proposed to be carried out in two shifts of 20 hours/day.
9.6 DETAILED DESIGN AND CONSTRUCTION DRAWINGS
The detailed design will be done in parallel with the Pre-construction works. It
is envisaged that the design will be started soon after the preliminary works
are completed. During Tender engineering, detailed design work will be
started and construction drawings will be available by the time contracts are
awarded.
9.7 BASIC ASSUMPTIONS FOR EQUIPMENT PLANNING
“Guidelines for preparation of Detailed Project Reports of Irrigation and
multipurpose Projects” issued by Central water Commission have been used
NJC Hydropower Limited EIA study for Nyamjangchhu Hydroelectric Project
WAPCOS Limited 9-4
for the planning of equipments. Basic assumptions made for the planning of
equipment for various construction activities are enumerated below:
9.7.1 Working hours of equipment
All works are proposed to be done in two shifts and the scheduled working
hours have been taken as 20 hours per day. 26 days/month have been
considered on an average in a month.
9.7.2 Densities of Materials
The calculations have been based on capacity of hauling units without
considering the densities of different types of materials for excavation and the
fill material.
9.7.3 Earth Volume conversion factor
Suitable standard norms have been adopted for conversion of volumes in
natural, loose and compacted state.
9.7.4 Operating Efficiency
The operating efficiency of different types of equipment has been taken as 50
min per hour.
9.7.5 Muck Dumping Lead
A lead of 15 km has been considered for dumping of muck that would be
generated from Head Race Tunnel and a lead of 5 km is assumed for the
dumping of muck that would be generated from Power House, TRT,
Transformer Cavern, Barrage, Feeder Channel, Desilting Chamber and
Collection Pool works. A lead of 10 km is assumed for the muck dumping of the
material generated from Surge Shaft and Pressure Shaft works.
9.7.6 Concreting Lead
A lead of 10 km is considered for the concrete works in Head Race Tunnel and
5 km is assumed for the concrete works in Power House, TRT, Transformer
Cavern, Barrage, Feeder Channel, Desilting Chamber, Collection Pool, Surge
Shaft and Pressure Shaft works.
NJC Hydropower Limited EIA study for Nyamjangchhu Hydroelectric Project
WAPCOS Limited 9-5
9.8 METHODOLOGY OF CONSTRUCTION FOR VARIOUS ACTIVITIES
9.8.1 River diversion during construction
River diversion works has been planned for construction of Barrage and Head
Regulator. The construction of Barrage has to be taken up during non monsoon
months of relatively low flow. The river will be diverted along one side of the
river by construction of temporary cofferdams for the construction of the
upstream works. The cofferdam will be made of river bed material properly
compacted to the required level to prevent overtopping. An impervious layer
of geo-membrane will be provided to prevent seepage through the body of the
dam. To avoid puncturing, fine materials are placed below and over the
impermeable layer. Rip rap protections will be provided on the river side to
prevent scouring of the dam. It is expected that the cofferdam will be
damaged during the monsoon season which will be repaired for the dry
season.
The construction of Barrage structures will be done in two stages and
cofferdam will be provided accordingly. In the first stage, the river will be
diverted towards the right bank. During the period, construction work on the
left bank will be done. The work includes construction of Spillway (5 bays),
Undersluice, Head Regulator, Feeder Channel, Desilting Chamber, Reservoir,
intake structures and flood walls, upstream and downstream aprons and
stilling basins. Likewise, the remaining bays of spillway and Earthen Dam that
are on the right bank will be constructed during the second phase. During the
period, the river will be diverted through the Undersluice and gated Spillway.
The cofferdam will create the dry space in the right bank during this period.
9.8.2 Civil works
Upstream works
The deposits on the river bank shall be removed to have enough space for
construction activities. The deposit will be used for the river diversion work
and for rip rap protection works. The construction of cofferdam will be taken
up parallel with the removal of deposits. The construction of Coffer dam would
be taken up with 2 Nos of Dozers (200 HP), 2 Nos of Hydraulic Excavators of
1.5 cum bucket capacity, 2 Nos of Vibratory Rollers and sufficient number of
20/25 T Dumpers. The Coffer Dam is planned to be completed in three
months.
NJC Hydropower Limited EIA study for Nyamjangchhu Hydroelectric Project
WAPCOS Limited 9-6
Phase-I
Construction of 5 bays of Spillway, Undersluice and Head Regulator will be
taken up in the first phase of Barrage works. Total of 3.0 lacs cum of
earthwork is involved in these structures and by providing 3 Nos of Hydraulic
Excavators of 1.5 m3 capacity working round the clock (with stand bye
equipment) and fleet of dumpers, daily progress of 3,000 m3 is expected.
Therefore, the excavation gets completed in 4 months. Adequate dewatering
arrangements would be made during the excavation in foundation at Barrage
complex. Dynamic compaction will commence immediately after the necessary
excavation at Barrage site. The excavation for cut-off wall will commence
immediately after dynamic compaction/compacted backfill at Barrage site. The
deep excavation for cut-off wall will be done with Hydraulic Excavator BC-
30. Bentonite solution will be used during excavation of cut-off wall so as to
avoid the side wall collapses. The excavation of cut-off wall up to the required
level will be done and plastic concrete will be poured in the excavated trench
by using a tremmie. The concrete work for Barrage base slab and other
superstructure works will commence immediately after the completion of
plastic concrete in cut-off walls. Concreting in the river bed, pertaining to
under sluice, 5 bays of spillway and head regulator and adjacent structures will
be taken up on priority in full swing by 2 nos. 30 m3 Batching plant and 2
Stationery 1 m3 Capacity Mixers, placement of concrete is planned by Transit
mixers and Cranes with suitable Concrete Buckets. The concreting of under
sluice, 5 bays of spillway and head regulator up to sill level will be completed
in 2 months before onset of monsoon. The superstructure works of these
structures will commence immediately after the concreting of the base slab.
The Hydro-Mechanical works for these structures will be executed in parallel to
the civil works of these components. All civil and hydro mechanical works for
these components will get completed in 27 months after the start of work at
Barrage site.
NJC Hydropower Limited EIA study for Nyamjangchhu Hydroelectric Project
WAPCOS Limited 9-7
During planning it is assumed that all the structures on the left bank that will
be affected by the river flow will be completed in two seasons. Structures like
floodwalls and the intake will be completed within the first eight months. The
upstream and downstream apron, stilling basin and the rip rap protections will
be completed within 27 months. After completing the First Phase works on the
left bank, the river will be diverted through under sluice and the construction
for Phase-II Barrage works will be taken up.
Phase-II
Construction of Earthen Dam and 6 bays Spillway will be taken up in this phase
of Barrage works. 1.2 lacs cum of earthwork is involved in these structures and
by providing 2 Nos. of Hydraulic Excavators of 1.5 cum capacity working round
the clock (with stand bye equipment) and fleet of dumpers, daily progress of
2,000 m3 is expected. Therefore, the excavation gets completed in 3 months.
Adequate dewatering arrangements would be made during the excavation in
foundation at Barrage complex. Dynamic compaction will commence
immediately after the necessary excavation at this phase of Barrage
construction. The excavation for cut-off wall will commence immediately after
dynamic compaction/compacted backfilling at this front. The deep excavation
for cut-off wall will be done with a Hydraulic Excavator BC-30 and Bentonite
solution will be used during excavation of cut-off wall so as to avoid the side
wall collapses. The excavation of cut-off wall up to the required level will be
done and plastic concrete will be poured in the excavated trench by using a
tremmie. The concrete / earth filling work for this phase will commence
immediately after the completion of plastic concrete in cut-off walls. Concreting
in the river bed, pertaining to remaining bays of spillway will be taken up after
necessary excavation / dynamic compaction. The concreting of remaining bays
of spillway up to sill level will be completed in 2 months. The superstructure
work of this structure will commence immediately after the concreting of the
base slab. All civil works for these components will get completed in 18
months.
NJC Hydropower Limited EIA study for Nyamjangchhu Hydroelectric Project
WAPCOS Limited 9-8
The structures like Desilting Basin and Feeder channel can be constructed
throughout the year. The excavation of the Desilting Basin will commence
after the completion of flood wall beside the Desilting Basin. Work at Reservoir
just downstream of Desilting Basin would be taken up simultaneously with the
Desilting Basin. Excavation and backfilling at Desilting Basin, Reservoir and
Feeder Channel would be taken up with 4 Nos. of Hydraulic excavators of 5.0
lacs cum bucket capacity and sufficient nos of 20/25 T Dumpers. Therefore,
total earthwork of 5 lacs cum involved in these structures is planned to be
completed in 6 months. Adequate dewatering arrangements would be made
during the excavation at these fronts. The concrete work will commence
immediately after the completion of excavation/backfilling work at these
fronts. Concreting of the structures will be taken up on priority in full swing by
2 nos. 30 m3 Batching plant and 2 Stationery 1 m3 Capacity Mixers,
placement of concrete is planned by Transit mixers and Cranes with suitable
Concrete Buckets. The superstructure civil works for these structures will be
carried in parallel to hydro mechanical works. All civil and hydro mechanical
works for these components will get completed in 30 months after the start of
work at these fronts.
Equipments required for the construction of Coffer Dam, Earthen Dam,
Spillway, Under Sluice, Head Regulator, Feeder Channel, Desilting Chambers
and Collection Pool are shown in Annexure-14.1.
Headrace tunnel
6.2 m dia. Circular shaped, 23.450 km long Head Race Tunnel has been
proposed at the end of Collection pool for carrying water to the pressure
shafts. 300 mm thick concrete lining has been proposed all along the length of
the tunnel.
The headrace tunnel will be started from the thirteen faces as shown in Fig-
9.1. All the adits shall be completed before the start of excavation of headrace
tunnel. Construction of HRT Face-1 and Face-2 will be taken up from Adit-1 to
HRT. Similarly Face-3/Face-4, Face-5/Face-6, Face-7/Face-8, Face-9/Face-10,
Face-11/Face-12, and Face-13 will be taken up from Adit-2, Adit-3, Adit-4,
Adit-5, Adit-6, and Adit-7 respectively. The critical reach of HRT is about
5000m between Face-8 and Face-9, so special attention in terms of resources
is required at this front for completion of work in time schedule.
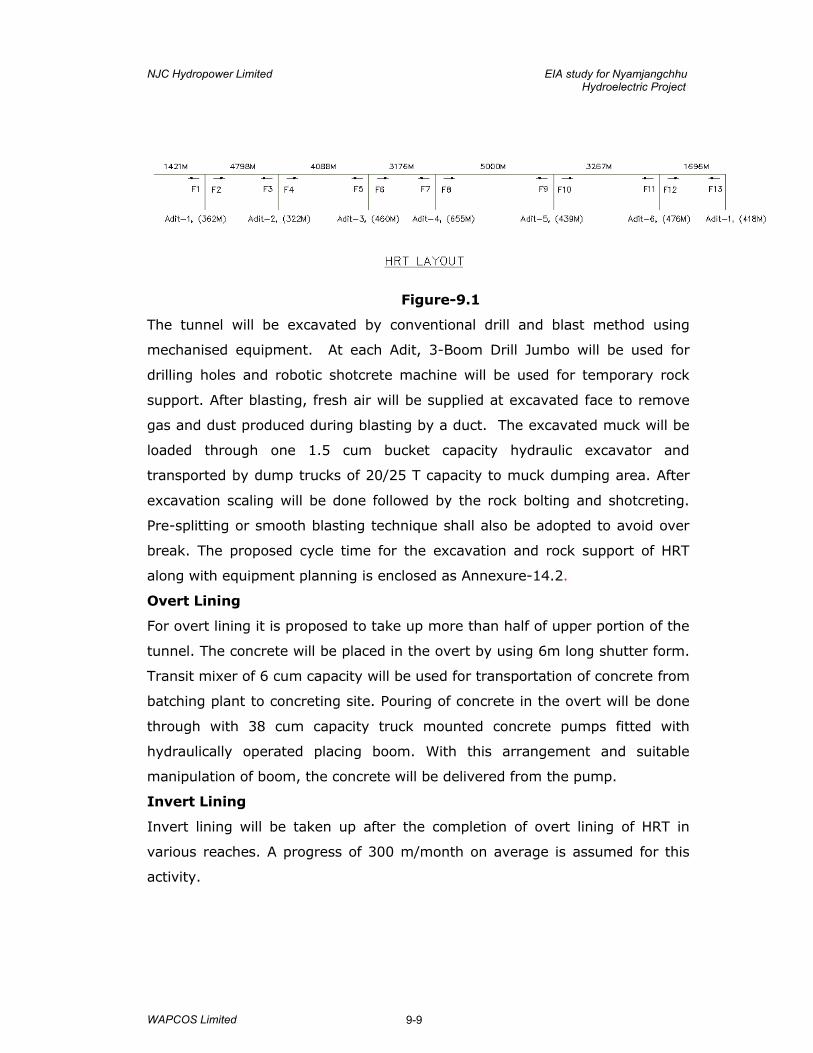
NJC Hydropower Limited EIA study for Nyamjangchhu Hydroelectric Project
WAPCOS Limited 9-9
Figure-9.1
The tunnel will be excavated by conventional drill and blast method using
mechanised equipment. At each Adit, 3-Boom Drill Jumbo will be used for
drilling holes and robotic shotcrete machine will be used for temporary rock
support. After blasting, fresh air will be supplied at excavated face to remove
gas and dust produced during blasting by a duct. The excavated muck will be
loaded through one 1.5 cum bucket capacity hydraulic excavator and
transported by dump trucks of 20/25 T capacity to muck dumping area. After
excavation scaling will be done followed by the rock bolting and shotcreting.
Pre-splitting or smooth blasting technique shall also be adopted to avoid over
break. The proposed cycle time for the excavation and rock support of HRT
along with equipment planning is enclosed as Annexure-14.2.
Overt Lining
For overt lining it is proposed to take up more than half of upper portion of the
tunnel. The concrete will be placed in the overt by using 6m long shutter form.
Transit mixer of 6 cum capacity will be used for transportation of concrete from
batching plant to concreting site. Pouring of concrete in the overt will be done
through with 38 cum capacity truck mounted concrete pumps fitted with
hydraulically operated placing boom. With this arrangement and suitable
manipulation of boom, the concrete will be delivered from the pump.
Invert Lining
Invert lining will be taken up after the completion of overt lining of HRT in
various reaches. A progress of 300 m/month on average is assumed for this
activity.
NJC Hydropower Limited EIA study for Nyamjangchhu Hydroelectric Project
WAPCOS Limited 9-10
Surge shaft
Construction of approach road to Adit to Surge Shaft bottom is planned to be
completed during pre-construction works. The construction of Adit to Surge Shaft
bottom would be taken up immediately after the start of Civil works. This Adit is
planned to be completed in 4 months. Thereafter, a pilot shaft (235m deep & 4m
dia.) would be constructed from bottom of Surge Shaft using Alimack Raise
Climber with sufficient nos. of jack hammers, one Dozer of 200 HP, one Hydraulic
Excavator of 1.5 cum capacity and sufficient nos. of 20/25 T Dumpers. This
activity is planned to be completed in 5 months time while excavation of horizontal
Pressure Shaft at EL-1940m would be in progress simultaneously. Once pilot shaft
is made through, slashing of Surge Shaft can be done from the top to bottom.
Pressure Shaft
Two number 3.3 m dia circular steel lined pressure shafts each bifurcating into
unit penstock of 2.0 m dia circular steel lined pressure shaft have been
provided for taking the water to six pelton machines in underground power
house. Each pressure shaft consists of horizontal and inclined portions. Adits to
Horizontal Pressure Shafts at EL-1571.4m, EL-1271.4m and EL-1051.4m would
be completed before the start of excavation work in Pressure Shafts. The
construction of horizontal pressure shafts at elevation of 1900.0 m shall be
taken up by full face drilling and blasting method. The adit used for reaching
the bottom of Surge Shaft will be used for construction of this portion of
pressure shaft. The excavation shall be taken up with one 3Boom Drill Jumbo,
one hydraulic excavator, one dozer (200HP) and sufficient nos of 10T/20T
dumpers.
Similarly the horizontal pressure shafts at El-1571.4m and EL-1271.4m shall
be taken up individually with separate set of equipments as deployed at upper
horizontal pressure shafts. Construction of horizontal pressure shaft at
elevation of El 1051.4 m will be undertaken from branch tunnel from Main
Access Tunnel to Power House.
NJC Hydropower Limited EIA study for Nyamjangchhu Hydroelectric Project
WAPCOS Limited 9-11
After the excavation in these horizontal Pressure Shafts, the excavation of
inclined portion for a length of about 450 m will be taken up bottom upward by
2 Nos. of double motor diesel Raise climber. The excavation of inclined
Pressure Shafts to required excavated diameter will be excavated in single
phase. Firstly the 2 Nos of Raise Climbers will be mobilized at inclined Pressure
Shafts between EL-1891.4m to EL-1571.4m. The excavation of these shafts
will be completed in 9 months. Similarly the excavation of inclined Pressure
Shafts at EL-1051.4m to EL-1271.4m (6 Nos) and at EL-1271.4m to EL-
1571.4m (2 Nos) will be taken after the completion of inclined Pressure Shafts
between EL-1891.4m to EL-1571.4m. The time taken to complete the
excavation of the inclined Pressure Shaft at EL-1051.4m to EL-1271.4m (6
Nos) and at EL-1271.4m to EL-1571.4m (2 Nos) will be 12 months and 8
months respectively. The excavation and mucking will be taken by sufficient
nos of Jack hammers, one Dozer (200 HP), one hydraulic excavator of 1.5 cum
capacity and sufficient no of 10T/20T dumpers.
Steel lining of pressure shafts will be undertaken after excavation is complete.
Ferrules of 2.5m length shall be fabricated in the workshop outside and shall
be transported on trailers to the pressure shafts for lowering. Inside the
tunnels, ferrules shall be transported on trolleys travelling on rails and pulled
by winch. For upper horizontal and inclined portion, steel lining shall proceed
from bottom to top first and there after horizontal portion shall be taken. The
concrete backfilling of these ferrules will immediately follow after the erection
and welding of ferrules inside the shaft. The concrete shall be poured after
welding 5 pieces of 2.5m ferrules. A progress of 40m/month (erection and
backfilling) per shaft is planned for these inclined Pressure Shafts. The time
taken to complete the ferrule erection/backfilling of the inclined Pressure Shaft
at EL-1051.4m to EL-1271.4m (6 Nos), EL-1271.4m to EL-1571.4m (2 Nos)
and at EL-1571.4m to EL-1891.4m (2 Nos) will be 15 months, 11 months and
12 months respectively. The ferrule erection/backfilling in horizontal pressure
shafts at various benches will be followed only after the ferrule
erection/backfilling in respective inclined pressure shafts. Equipment required
for the construction of Pressure Shaft is shown in Annexure-14.1.
NJC Hydropower Limited EIA study for Nyamjangchhu Hydroelectric Project
WAPCOS Limited 9-12
Powerhouse
An underground Power House has been proposed on the left bank of Nyamjang
Chhu River with the installed capacity of 780 MW comprising 6 units of 130
MW each. An underground excavation of 1.2 lacs cum is assessed in Power
House and is expected to be completed in 25 months with two shifts operating.
The construction of powerhouse involves co-ordination of civil works and
electromechanical works. The main civil works in the powerhouse consists of
excavation, rock support and concreting works.
The excavation of Power House would be taken up after the excavation of the
Adit to Power House Crown branching off from Main Access Tunnel to Service
Bay in the Power House. This Adit would be extended through the length of the
Power House and expanded sideways to the size of 20m x 7m. Power House
excavation would be carried out by constructing suitable ramps for benching
down. Movement of equipment would be carried through ramps. For
excavation from EL-1084.202m to EL-1077.20m mucking would be done
through adit to the crown of Power House including ramp removal. For
excavation from EL-1077.20m to EL-1070.20m mucking would be carried out
through Main Access Tunnel to Power House including Bus Duct Tunnels.
Mucking of Power House below Service Bay level would be carried out through
Main Access Tunnel as well as construction adit to Pressure Shaft and Tail Race
Tunnel. Benching down of Power House from EL-1070.20m to EL-1059.40m
would be carried out in two stages by making suitable ramps in each stage. For
excavation from EL-1059.40m to EL-1054.50 m mucking would be carried out
through pressure shaft Tunnels. The bottom of the Power House will be
excavated through Tail Race Tunnels.
The equipment required for underground excavation of power house are 3
boom drill jumbo, 1.5 cum hydraulic excavator, 20/25T dumpers, wagon
drills/crawler drills, jack hammers, shotcrete machine, grout pump, concrete
pump, vibrator, transit mixers etc. Batching and mixing plant (90 cum/hr), 180
TPH aggregate processing plant would meet the concreting requirement of
Power House. The installation of electromechanical equipment will be done in
close coordination with the civil contractor. Almost all of the civil structures
including the installation of overhead crane will be completed before the
installation of electromechanical equipment.
NJC Hydropower Limited EIA study for Nyamjangchhu Hydroelectric Project
WAPCOS Limited 9-13
Transformer Cavern
The excavation Work for Transformer Cavern of size 173mx16.3mx23m
located on downstream of Power House Cavern will generate about 70,000
cum of excavated muck. The crown of this cavern would be accessed through
100 m long Adit branching off from adit to crown of Power House cavern. The
construction adit to Transformer Cavern crown would be extended to full
length of the Transformer Cavern. Thereafter, it would be enlarged sideways to
the full width of the Transformer Cavern. Transformer Cavern excavation
would be carried out by constructing suitable ramps for benching down.
Movement of equipment would be carried through ramps. For excavation from
EL-1085.675m to EL-1076.80m mucking would be carried out through adit to
crown of Transformer Cavern including ramp removal. Mucking of Transformer
Cavern at EL-1076.80m to EL-1070.20m would be carried out through the
access tunnel branching off from Main Access Tunnel.
The equipment required for this purpose are 3 boom drill jumbo.1.5 cum
hydraulic excavator, 20/25T multi axle rear dumpers, wagon drills/crawler
drills, jack hammers, shotcrete machine, grout pump, concrete pump, vibrator,
transit mixers etc. Batching and mixing plant (90 cum/hr), 180 TPH aggregate
processing plant would meet the concreting requirement of Transformer
Cavern.
Tailrace
7m dia. Circular shape, 1.965 km long Tail Race Tunnel has been proposed
from power house to discharge the water back to river. TRT will be concrete
lined. The construction of Tail Race tunnel will be done from outlet face of TRT
and from junction of the Main Access Tunnel with TRT. The tunnel will be
excavated by drill and blast method using mechanised equipment. 3-Boom
Drill Jumbo will be used for drill holes and robotic shotcrete machine will be
used for temporary lining. An advance of 95 m/month from each face is
proposed for the excavation of TRT.
Concrete Lining of TRT will commence immediately after the completion of
excavation work at respective faces. The lining of the tunnel is proposed to be
done in two stages i.e. overt concrete will be done firstly followed by invert
concrete lining. Two gantry shutters of 6m length are proposed to be used in
TRT so as to achieve a progress of 6m/day and 150m/month in this reach.
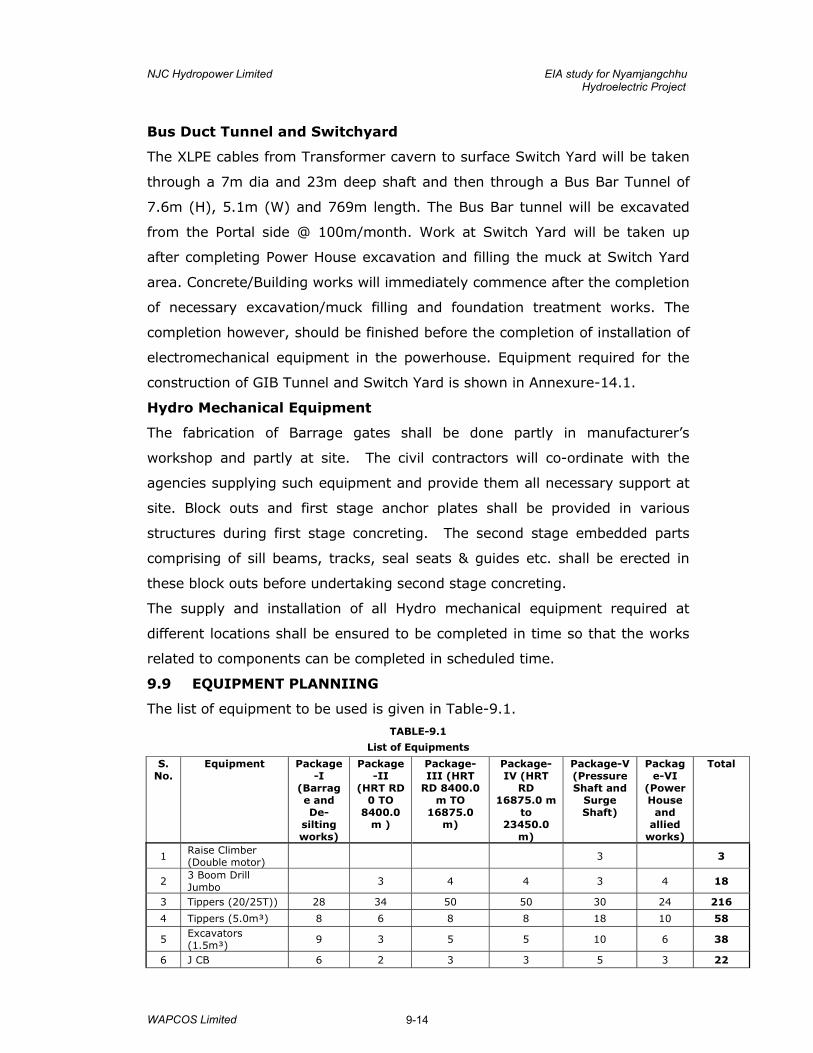
NJC Hydropower Limited EIA study for Nyamjangchhu Hydroelectric Project
WAPCOS Limited 9-14
Bus Duct Tunnel and Switchyard
The XLPE cables from Transformer cavern to surface Switch Yard will be taken
through a 7m dia and 23m deep shaft and then through a Bus Bar Tunnel of
7.6m (H), 5.1m (W) and 769m length. The Bus Bar tunnel will be excavated
from the Portal side @ 100m/month. Work at Switch Yard will be taken up
after completing Power House excavation and filling the muck at Switch Yard
area. Concrete/Building works will immediately commence after the completion
of necessary excavation/muck filling and foundation treatment works. The
completion however, should be finished before the completion of installation of
electromechanical equipment in the powerhouse. Equipment required for the
construction of GIB Tunnel and Switch Yard is shown in Annexure-14.1.
Hydro Mechanical Equipment
The fabrication of Barrage gates shall be done partly in manufacturer’s
workshop and partly at site. The civil contractors will co-ordinate with the
agencies supplying such equipment and provide them all necessary support at
site. Block outs and first stage anchor plates shall be provided in various
structures during first stage concreting. The second stage embedded parts
comprising of sill beams, tracks, seal seats & guides etc. shall be erected in
these block outs before undertaking second stage concreting.
The supply and installation of all Hydro mechanical equipment required at
different locations shall be ensured to be completed in time so that the works
related to components can be completed in scheduled time.
9.9 EQUIPMENT PLANNIING
The list of equipment to be used is given in Table-9.1.
TABLE-9.1
List of Equipments
S. No.
Equipment Package-I
(Barrage and De-
silting works)
Package-II
(HRT RD 0 TO
8400.0 m )
Package-III (HRT
RD 8400.0 m TO
16875.0 m)
Package-IV (HRT
RD 16875.0 m
to 23450.0
m)
Package-V (Pressure Shaft and
Surge Shaft)
Package-VI
(Power House
and allied
works)
Total
1 Raise Climber (Double motor)
3 3
2 3 Boom Drill Jumbo
3 4 4 3 4 18
3 Tippers (20/25T)) 28 34 50 50 30 24 216
4 Tippers (5.0m³) 8 6 8 8 18 10 58
5 Excavators (1.5m³)
9 3 5 5 10 6 38
6 J CB 6 2 3 3 5 3 22
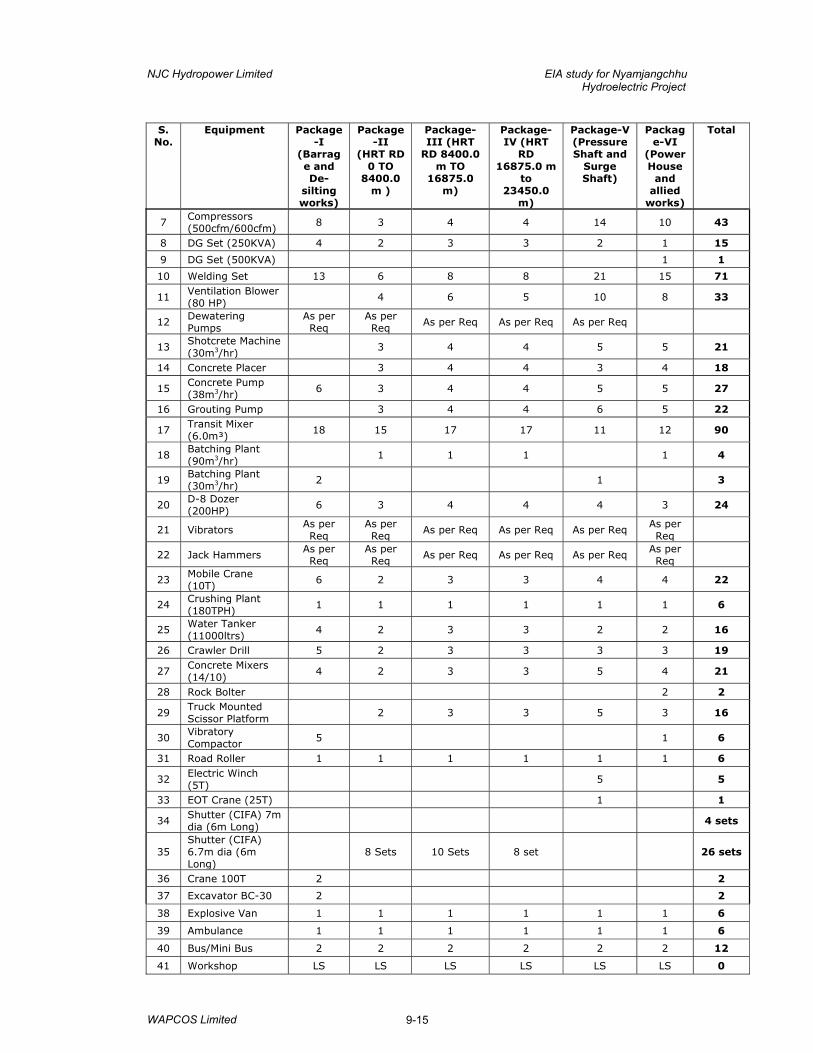
NJC Hydropower Limited EIA study for Nyamjangchhu Hydroelectric Project
WAPCOS Limited 9-15
S. No.
Equipment Package-I
(Barrage and De-
silting works)
Package-II
(HRT RD 0 TO
8400.0 m )
Package-III (HRT
RD 8400.0 m TO
16875.0 m)
Package-IV (HRT
RD 16875.0 m
to 23450.0
m)
Package-V (Pressure Shaft and
Surge Shaft)
Package-VI
(Power House
and allied
works)
Total
7 Compressors (500cfm/600cfm)
8 3 4 4 14 10 43
8 DG Set (250KVA) 4 2 3 3 2 1 15
9 DG Set (500KVA) 1 1
10 Welding Set 13 6 8 8 21 15 71
11 Ventilation Blower (80 HP)
4 6 5 10 8 33
12 Dewatering Pumps
As per Req
As per Req
As per Req As per Req As per Req
13 Shotcrete Machine (30m3/hr)
3 4 4 5 5 21
14 Concrete Placer 3 4 4 3 4 18
15 Concrete Pump (38m3/hr)
6 3 4 4 5 5 27
16 Grouting Pump 3 4 4 6 5 22
17 Transit Mixer (6.0m³)
18 15 17 17 11 12 90
18 Batching Plant (90m3/hr)
1 1 1 1 4
19 Batching Plant (30m3/hr)
2 1 3
20 D-8 Dozer (200HP)
6 3 4 4 4 3 24
21 Vibrators As per Req
As per Req
As per Req As per Req As per Req As per Req
22 Jack Hammers As per Req
As per Req
As per Req As per Req As per Req As per Req
23 Mobile Crane (10T)
6 2 3 3 4 4 22
24 Crushing Plant (180TPH)
1 1 1 1 1 1 6
25 Water Tanker (11000ltrs)
4 2 3 3 2 2 16
26 Crawler Drill 5 2 3 3 3 3 19
27 Concrete Mixers (14/10)
4 2 3 3 5 4 21
28 Rock Bolter 2 2
29 Truck Mounted Scissor Platform
2 3 3 5 3 16
30 Vibratory Compactor
5 1 6
31 Road Roller 1 1 1 1 1 1 6
32 Electric Winch (5T)
5 5
33 EOT Crane (25T) 1 1
34 Shutter (CIFA) 7m dia (6m Long)
4 sets
35 Shutter (CIFA) 6.7m dia (6m Long)
8 Sets 10 Sets 8 set 26 sets
36 Crane 100T 2 2
37 Excavator BC-30 2 2
38 Explosive Van 1 1 1 1 1 1 6
39 Ambulance 1 1 1 1 1 1 6
40 Bus/Mini Bus 2 2 2 2 2 2 12
41 Workshop LS LS LS LS LS LS 0
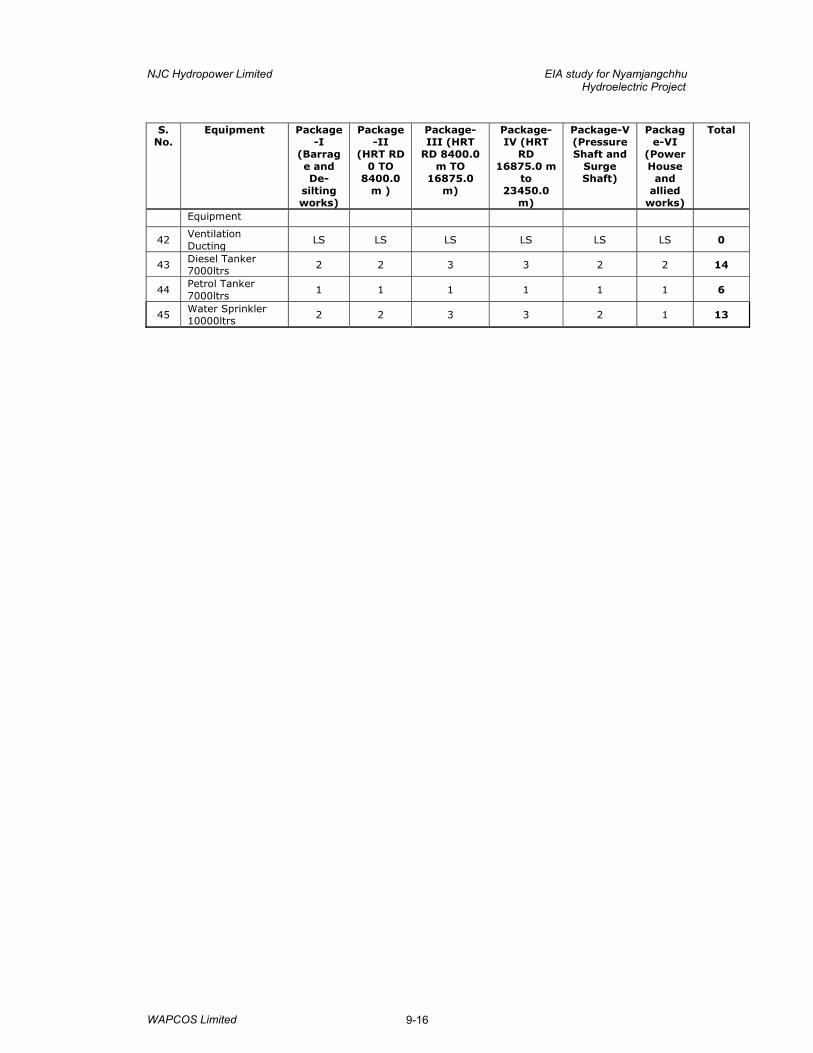
NJC Hydropower Limited EIA study for Nyamjangchhu Hydroelectric Project
WAPCOS Limited 9-16
S. No.
Equipment Package-I
(Barrage and De-
silting works)
Package-II
(HRT RD 0 TO
8400.0 m )
Package-III (HRT
RD 8400.0 m TO
16875.0 m)
Package-IV (HRT
RD 16875.0 m
to 23450.0
m)
Package-V (Pressure Shaft and
Surge Shaft)
Package-VI
(Power House
and allied
works)
Total
Equipment
42 Ventilation Ducting
LS LS LS LS LS LS 0
43 Diesel Tanker 7000ltrs
2 2 3 3 2 2 14
44 Petrol Tanker 7000ltrs
1 1 1 1 1 1 6
45 Water Sprinkler 10000ltrs
2 2 3 3 2 1 13
EARTHQUAKE ENGINEERING STUDIES
EQ : 2009- 39
SITE SPECIFIC DESIGN EARTHQUAKE PARAMETERS FOR
NYAMJANG CHHU H. E. PROJECT SITE, ARUNACHAL PRADESH
DEPARTMENT OF EARTHQUAKE ENGINEERING INDIAN INSTITUTE OF TECHNOLOGY ROORKEE
ROORKEE - 247667 INDIA
SITE SPECIFIC DESIGN EARTHQUAKE PARAMETERS FOR
NYAMJANG CHHU H. E. PROJECT SITE, ARUNACHAL PRADESH
Project No.EQD- 3017/ 09-10
Oct 2009
FOR OFFICIAL USE ONLY
DEPARTMENT OF EARTHQUAKE ENGINEERING INDIAN INSTITUTE OF TECHNOLOGY ROORKEE
ROORKEE - 247667 INDIA.
i
PREFACE
Bhilwara Energy Ltd., (BEL) has been entrusted with execution of Nyamjang Chhu H.E.
Project in Arunachal Pradesh. The project is located (Latitude 270 43’06” N and Longitude
910 43’37” E) in Tawang district of Arunachal Pradesh on Nyamjang Chhu. BEL referred
the study for Site-Specific Design Earthquake Parameters to the Department of Earthquake
Engineering, Indian Institute of Technology Roorkee. Accordingly the studies related to Site
Specific Design Earthquake Parameters were taken up.
This is the final report containing recommendations for the site dependent spectra and time
history of ground motion for seismic analysis of structures. Useful discussions held with BEL
officials regarding the site specific studies are gratefully acknowledged. This study has been
carried out by Prof. Ashwani Kumar, Prof. M. L. Sharma, Dr. H. R Wason, Dr. S. Mukerjee, Dr.
M. Shrikhande, Dr. B. K. Maheshwari, Dr. J. Das and Dr. R. N Dubey.
Roorkee (Ashwani Kumar)Oct 2009 Prof. and Head
ii
CONTENTS
Preface ............................................................................................................................ i
Contents .......................................................................................................................... ii
List of Tables, Figures & Appendices ............................................................................ iii
Executive Summary ..................................................................................................... iv
1.0 Introduction ............................................................................................................ 1
2.0 Regional geology and tectonics of the region ......................................................... 2
3.0 Site Geology ........................................................................................................... 9
4.0 Earthquake occurrences .......................................................................................... 12
5.0 Parameters for earthquake resistant design ............................................................. 14
5.1 Definitions………………………………………..……………………….14
5.1.1 Maximum Considered Earthquake (MCE) ............................ 14
5.1.2 Design Basis Earthquake (DBE) .................................14
5.2 Seismogenic Sources around the Site………………………….………...14
5.3 Estimation of Maximum Considered Earthquake ..................................... 17
5.3.1 Earthquake Parameters ..................................................17
5.3.2 Ground Motion Characteristics .....................................19
5.3.3 Acceleration Response Spectra .....................................21
5.3.4 Vertical Acceleration ....................................................22
5.3.5 Safety Criteria ...............................................................22
5.4 Estimation of Design Basis Earthquake ..................................................... 22
5.4.1 Earthquake Parameters ..................................................22
5.4.2 Ground Motion Characteristics .....................................22
5.4.3 Acceleration Response Spectra .....................................22
5.4.4 Vertical Acceleration ....................................................23
5.4.5 Safety Criteria…………………………………………23 6.0 Recommendations ................................................................................................... 25
References…………………………………………………………….…………....26
iii
List of Tables, Figures and Appendices
Caption Page No.
Table I Peak ground horizontal acceleration from various sources around Nyamjang Chhu HE Project site, Arunachal Pradesh.
16
Table II Values of various parameter for response spectra for various values of percentage of damping for Nyamjang Chhu HE Project site, Arunachal Pradesh.
21
Fig. 1. Seismotectonic setup around the Nyamjang Chhu HE Project site, Arunachal Pradesh (Modified after Seismotectonic Atlas of India, Geological Survey of India, 2000)
11
Fig. 2. Seismicity map of the region around Nyamjang Chhu HE Project site showing the line AB considered to plot the depth section as given in Fig. 3.
20
Fig. 3. Depth section across the seismogenic features around the Nyamjang Chhu HE project site for line AB as given in Fig. 2.
20
Fig. 4. Time history of horizontal ground motion for Nyamjang Chhu HE Project site, Arunachal Pradesh (Normalised to 1g).
24
Fig. 5. Normalised horizontal acceleration spectra for various conditions Nyamjang Chhu HE site, Arunachal Pradesh.
24
Annexure I Occurrence of Earthquakes around the Nyamjang Chhu HE Project site, Arunachal Pradesh.
29
Annexure II Ground motion acceleration time history for Nyamjang Chhu HE Project site, Arunachal Pradesh (normalised to 1g) at 0.01 sec interval.
46
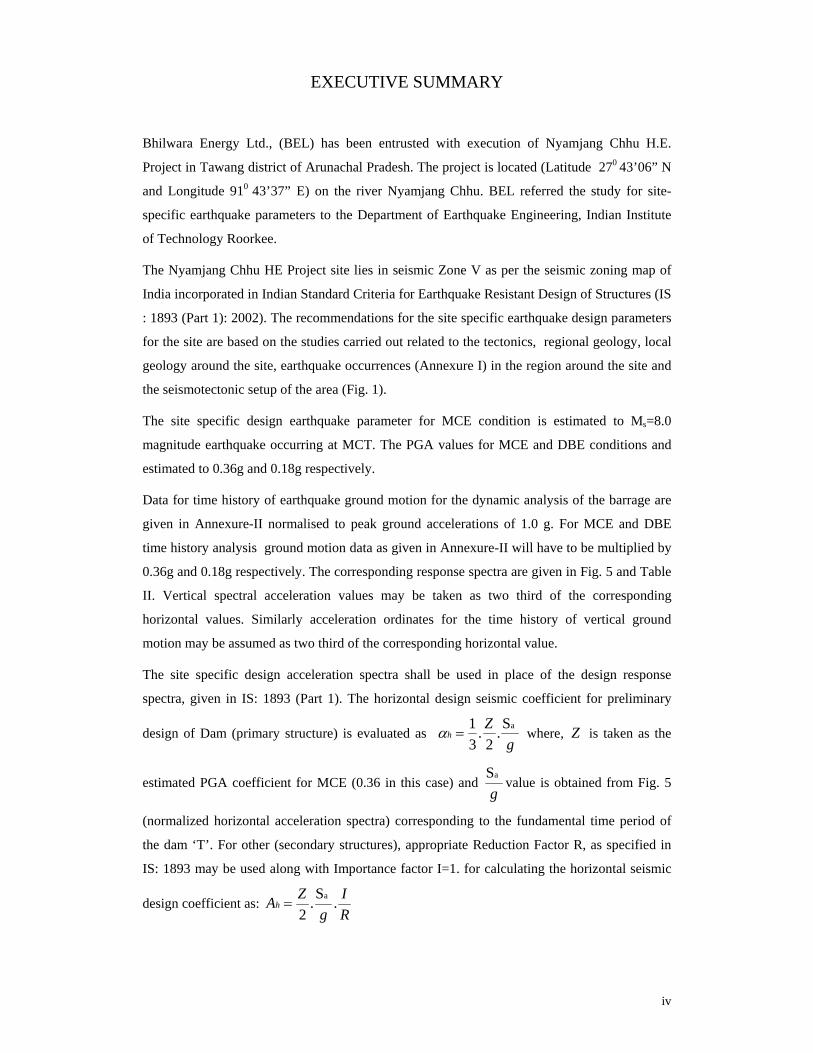
iv
EXECUTIVE SUMMARY Bhilwara Energy Ltd., (BEL) has been entrusted with execution of Nyamjang Chhu H.E.
Project in Tawang district of Arunachal Pradesh. The project is located (Latitude 270 43’06” N
and Longitude 910 43’37” E) on the river Nyamjang Chhu. BEL referred the study for site-
specific earthquake parameters to the Department of Earthquake Engineering, Indian Institute
of Technology Roorkee.
The Nyamjang Chhu HE Project site lies in seismic Zone V as per the seismic zoning map of
India incorporated in Indian Standard Criteria for Earthquake Resistant Design of Structures (IS
: 1893 (Part 1): 2002). The recommendations for the site specific earthquake design parameters
for the site are based on the studies carried out related to the tectonics, regional geology, local
geology around the site, earthquake occurrences (Annexure I) in the region around the site and
the seismotectonic setup of the area (Fig. 1).
The site specific design earthquake parameter for MCE condition is estimated to Ms=8.0
magnitude earthquake occurring at MCT. The PGA values for MCE and DBE conditions and
estimated to 0.36g and 0.18g respectively.
Data for time history of earthquake ground motion for the dynamic analysis of the barrage are
given in Annexure-II normalised to peak ground accelerations of 1.0 g. For MCE and DBE
time history analysis ground motion data as given in Annexure-II will have to be multiplied by
0.36g and 0.18g respectively. The corresponding response spectra are given in Fig. 5 and Table
II. Vertical spectral acceleration values may be taken as two third of the corresponding
horizontal values. Similarly acceleration ordinates for the time history of vertical ground
motion may be assumed as two third of the corresponding horizontal value.
The site specific design acceleration spectra shall be used in place of the design response
spectra, given in IS: 1893 (Part 1). The horizontal design seismic coefficient for preliminary
design of Dam (primary structure) is evaluated as g
Zh
aS.2
.31
=α where, Z is taken as the
estimated PGA coefficient for MCE (0.36 in this case) and g
aSvalue is obtained from Fig. 5
(normalized horizontal acceleration spectra) corresponding to the fundamental time period of
the dam ‘T’. For other (secondary structures), appropriate Reduction Factor R, as specified in
IS: 1893 may be used along with Importance factor I=1. for calculating the horizontal seismic
design coefficient as: RI
gZAh .S.2
a=
1
SITE SPECIFIC DESIGN EARTHQUAKE PARAMETERS FOR
NYAMJANG CHHU H.E PROJECT, ARUNACHAL PRADESH
1.0 INTRODUCTION
1.1 Bhilwara Energy Ltd., (BEL) has been entrusted with execution of Nyamjang
Chhu H.E. Project in Arunachal Pradesh. The project is located (Latitude 270 43’06” N
and Longitude 910 43’37” E) in Tawang district of Arunachal Pradesh on river Nyamjang
Chhu. BEL referred the study for site-specific earthquake parameters to the Department of
Earthquake Engineering, Indian Institute of Technology Roorkee. Accordingly the studies
related to site specific design earthquake parameters was taken up.
1.2 The proposed dam site lies in seismic zone V as per the seismic zoning map of
India as incorporated in Indian Standard Criteria for Earthquake Resistant Design of
Structures IS:1893-(Part I) 2002 : General Provisions and Buildings. It is usually
presumed that in design of normal structures adequate safety would be attained if
structures were designed as per Codal recommendations. The probable intensity of
earthquake in seismic zone V corresponds to Intensity IX on comprehensive intensity
scale (MSK64). The structures designed as per recommended design parameters for this
zone would generally prevent loss of human life and only repairable damage could occur.
However, the recommended design parameters in IS: 1893 are for preliminary design of
important structures and it is desirable to carry out dynamic analysis for final design of
important hydraulic structures in order to estimate stresses and deformations in probable
future earthquakes. IS code, therefore, recommends that for such structures detailed site
specific investigations be carried out for estimating the design earthquake parameters.
1.3 The site specific studies related to the local and regional geological conditions,
earthquake occurrences and seismotectonic set up of the region were carried out. The
earthquake catalogue containing the location, time of occurrence and the size of
earthquakes (provided by India Meteorological Department to the BEL project authorities)
was made available to DEQ by the BEL and the same has been used for this study.
Maximum Considered Earthquake (MCE) has been evaluated on the basis of above studies
2
using deterministic approach and the same is recommended for consideration in the design
of structures.
1.4 Recommendations have been given in the form of smoothed design acceleration
response spectra for different values of damping. A time history of strong ground motion
and the acceleration spectra along with recommendations for consideration of vertical
component of earthquake motion/spectra are also included.
2.0 REGIONAL GEOLOGY AND TECTONIC SETUP
2.1 The Nyamjang Chhu H.E. Project site on the Nyamjang Chhu river is located in
the Lesser Himalayan region of Arunachal Pradesh and located 50 km north from the
surface trace of MCT. Geologically, the project area is represented mainly by the
quartzite-biotite gneiss rocks. Numerous tectonic features are present around the site and a
6° X 6° degree area bounded by latitudes 24.75°N and 30.75°N and longitudes 88.75°E
and 94.75°E around the site (Fig. 1) has been considered for the study of regional
geotectonic set up of the region.
2.2 The northern part of the study area is occupied by the Himalayas followed
southward by the narrow Brahmaputra River basin/ Assam basin, covered by alluvial fill,
and then by the Shield area i.e. Shillong Plateau. Whereas, the southeastern part of the area
is occupied by the part of Indo-Burman fold belt. Small part of the Mishmi geotectonic
unit occurs in the northeastern side of the study area. The Shillong Plateau is mainly
represented by oldest Archean landmass with Precambrian deposits. The Extra Peninsular
belt is mainly occupied by low grade complexes of the Lesser Himalaya tectonically
reworked during the Himalayan Orogeny. The foothills Himalaya, south of the MBT
exposes cover sequence of the frontal belt (Siwalik) affected by the terminal phase of
Himalayan Orogeny.
2.3 The Himalayan mobile belt forms the main and prominent geotectonic block of the
study area. The regional structural trend of the Eastern Himalayas is mostly E-W to ENE-
WSW from Bhutan to the northeastern Arunachal Pradesh, which changes gradually to
3
NE-SW near the Siang valley and terminates against the Siang fracture (Nandy, 1976).
This block is bordered by the Central Burmese Plate towards east. The prominent tectonic
feature Indus-Tsangpo Suture Zone (ITSZ) separating the mobile belt from the Indus-
Shyok Belt of the Tibetan Plateau defines its northern limit. Along ITSZ, the river
Tsangpo (Brahmaputra) flows remarkably in an E-W rectilinear valley. The ITSZ marks
the collision boundary of the Indian and Tibetan Plates. The Main Central Thrust (MCT)
separates the rock units south of ITSZ, the highest-grade metamorphites and gneisses of
the axial belt, from Precambrian sedimentary sequence and its equivalents. The Main
Boundary Thrust (MBT) separates the Siwalik rocks from the pre-Tertiary rocks. Beyond
MBT, different stratigraphic units are disposed in intricate thrust slices. Since the rocks of
this segment range in age from Proterozoic to Cenozoic, it has undergone different stages
of crustal evolution and has been subjected to orogenic movements of varying intensity
from time to time, the imprints of which are identifiable in different deformational
structures, major unconformities or discontinuities (Kumar, 1997).
2.4 The northernmost tectonic feature of the study area is Indus Suture Zone (ISZ)
trending E-W and marks the boundary between the Indian and Tibetan plates and south of
this, litho-units of the main Himalayan belt are exposed. This zone is represented by the
obducted materials of the Neotethyan oceanic crust together with deep marine Triassic to
Eocene sediments. Main Central Thrust (MCT) is a regional tectonic feature that traverses
the whole length of Himalayas has developed in response to intensive and extensive
operative compressional tectonics. This feature is a north dipping thrust fault with initial
steepness and marks the tectonic boundary between the high-grade metamorphites of the
Se La Group and low to medium-grade metasediments of the Dirang Formation in the
Diggin Valley, in upper reaches of the Kamla river and near Taliha in the Subansiri river
section (Kumar,1997). Further in east, the Dirang Formation apears to get eliminated and
it marks the tectonic boundary with the Bomdila Group. The MCT has been traced to
Arunachal Pradesh through Nepal, Darjeeling-Sikkim and Bhutan (Ravi Shanker et al.,
1989), which abuts against the Tidding Suture in the Siang Valley.
2.5 Main Boundary Thrust (MBT) is another regional tectonic feature of the
Himalayas, which demarcates the tectonic boundary between the Main Himalayan Belt
4
and the Frontal Folded Belt forming the Sub-Himalayas. It is also a north dipping thrust
fault with ENE-WSW trend from the border with Bhutan in the west to Roing in the
Dibang valley and does not continue southeast to join the Mishmi Thrust as visualized by
Ranga Rao (1983). According to Sinha Roy (1976) the MBT flattens at depth, as indicated
by the absence of Gondwana rocks in southern Bhutan and in the west-central Arunachal
Pradesh. This is possibly due to the fact that the MBT merges at depth with some
dislocation zones in the inner belt.
2.6 In the region of foothills of the Arunachal Himalayas, south of MBT, a thick pile
of molassic sub-greywacke representing the Siwaliks are exposed. This belt is continuous
all along the Himalayan foothills from Kashmir to Arunachal Pradesh. The Siwalik
sequence was deposited during the Mio-Pliocene in an unstable sinking basin, developed
on the downward bending plate north of the Shillong Plateau and south of rising
Himalayas. The Siwaliks, are folded and thrust over by the older rocks from the north
along the MBT. The lithological assemblages of the Siwaliks were also controlled by the
vigour of tectonism in the source area of the rising Himalaya. The Main Frontal Thrust
(MFT) marks the southern fringe of the Siwalik belt, bordering the Brahmaputra basin.
2.7 Towards northeastern part of the study area the geotectonic block is represented by
the Mishmi Hills which does not belong to the Indian plate and considered to be part of the
Central Burmese Plate. This block comprises of metasediments, which had undergone four
phases of deformation and had been intruded by granites/granodiorites and abuts against
the Indian Plate along the Tidding Suture. The Mishmi Hills massif is comprised of
diorite-granodiorite crystalline complex (Nandy, 1976) and the southwestern boundary of
this is marked by high angle NW-SE trending Mishmi Thrust (MT) along which this block
is thrust on the adjoining rocks. In this region, the NW-SE trending metamorphic belt is in
direct contact with the Brahmaputra alluvium. This massif acts as a linkage between the
Himalayan and Indo-Burman structural and stratigraphical trends in north and east
respectively.
2.8 The region south and southwest of the above geotectonic blocks is occupied by the
Brahmaputra River basin that has formed over the basement revealing some structural
5
features through geophysical surveys. The basement rocks are exposed to the west of the
basin and the basement has northeastward slope which reaches up to a depth of 7 km near
Mishmi foothills (GSI, 2000) as indicated by basement configuration. Whereas, near
Guwahati the alluvial cover is only of the order of 0.34 km (Barooah and Bhattacharya,
1981) where the gneissic rocks of Shillong massif are exposed on surface as hills and
ridges in the river channel and on both banks of the river. Similar hills and ridges are also
exposed at the western most side of the Assam basin. In this part of the Assam basin the
basement lays at shallower depth due to undersurface extension of the Shillong massif
rocks. Here, the basement has been affected by various faults, highs and lows, upwarps
and downwarps as revealed by seismic survey in the upper Assam (Barooah and
Bhattacharya, 1981). Most of these basement faults trend NE-SW but some are having E-
W trends. The most striking fault of the Brahmaputra river basin is the NW-SE trending
Dhansiri-Kopili fault which runs between the Shillong and Mikir Hills Massifs in the
Kopili Gap and extends across the Brahmaputra River. In this region the morphology of
the basement is represented by bowl shaped basin with thickest sediments in the area north
of Nowgang (Nandy, 2001).
2.9 This Brahmaputra Basin is bordered by the Archean landmass, the Shillong Plateau
towards south. It is interesting to note that the Shillong Plateau has witnessed prolonged
crustal deformation since Archean time. The E-W trending Dauki Fault (DF) forming
steep scarps is a very prominent linear feature marking the southern edge of the Shillong
Massif. The basement rocks of the Shillong Plateau had faulted downward along the DF
for around 13 km. In Bangladesh, the basement rock is overlain by thick sediments. This
neighbouring part of Bangladesh also has suffered intense earth movements.
2.10 The Shillong Plateau is comprised of the Shillong Massif (SM) and Mikir Hills
Massif (MHM). The MHM is separated from the SM by an alluvial tract, which is located
in the central part of Northeast India. A large part of the shield area of Northeast India
exposes Archean folds. These zones show schistose tracts grading into vast stretches of
granitic gneisses incorporating metasedimentary and metavolcanic rocks within the
gneissic complex. A major part of this complex has apparently been formed by
6
metasomatism of these sediments and volcanics. Intrusive augen gneisses occur within the
Archean and these could possibly mark late-tectonic magmatic episodes of older orogenies
(Mazumdar, 1978).
2.11 The Archean rocks of the Shillong plateau have been subjected to polycyclic
folding and metamorphism. The Shillong Group was deposited in central parts of the
plateau, as this area developed into a trough. The post-Precambrian landmass experienced
peneplanation till Jurassic, resulting into the formation of a flat-leveled surface, which is
preserved over the plateau till today (G.S.I., 1974). The MHM, with an average elevation
of 1,000 m, represents a peneplaned surface of predominantly gneissic rocks. The
sedimentary rocks are exposed along the southern and eastern flanks.
2.12 By the end of Jurassic, the southern margin of the Shillong Plateau experienced
eruption of Sylhet Traps through E-W trending fissures (Murthy, 1970; G.S.I., 1974).
Around 150 Ma, carbonatite complex was emplaced along an N-S trending fault in the
eastern part of the Shillong massif (Sarkar et al., 1992). The Cretaceous sediments got
deposited along the subsiding southern block. Towards the Paleocene-Eocene, the plateau
attained a stable shelf condition due to lower subsidence rate. The eastern and western
parts of the Shillong massif remained landmass till mid-Eocene and experienced
progressive down-sinking which initiated the deposition of coal-bearing sandstone
(G.S.I., 1974).
2.13 Shillong Plateau represents a unique structural unit in the area, as it is block-
uplifted to its present height (Murthy, 1970; G.S.I., 1974). The southern margin of
Shillong Plateau is marked by the remarkably linear E-W trending Dauki Fault. Evans
(1964) gave detailed geological and tectonic set up along the Dauki Fault Zone and
suggested that this zone is essentially a tear-fault with a lateral movement of over 200 km.
Even though presence of slickensides on a fault surface shows horizontal E-W movement,
extent of movement was not possible to be estimated. Similarly, due to lack of evidences
on the extension of this zone below the alluvial gap between Shillong Plateau and
7
Rajmahal Hills, its westward continuation can not be ascertained. Later, Murthy (1970),
Desikachar (1974) and G.S.I. (1974) have suggested vertical movements along the Dauki
Fault, as it is evidenced by the extrusion of lava through the deep-seated vertical fracture
system. Also, Murthy (1970) has reported evidences to indicate activity along a number of
E-W, N-S and NW-SE basement faults throughout the Tertiary period. It seems that the
fault zone is characterized by uplift and down-sinking of adjacent basement blocks along
the fractures.
2.14 In the western part of the Shillong Massif, NW-SE trending high-angle Dapsi
Reverse Fault upthrust the Tura range southward. This fault forms the boundary between
the Precambrians in the north and Tertiary rocks in the south. The depositional sequence
was affected by this reverse fault, which probably demarcated the northern boundary of
the sedimentary basin from Mid-Eocene through Miocene (Murthy, 1970). The Shillong
Plateau shows a criss-cross fracture pattern and marked by sharp and prominent Dudhnoi
and Kulsi faults affecting the ancient basement. Further the basement is also affected by
NE-SW trending Barapani Shear zone. Towards west, the Shillong Plateau is bordered by
the N-S trending Jamuna/ Dhubri Fault, which is indicated by the difference in basement
levels and linear north-south Brahmaputra River course for about 150 km to 200 km. The
eastern part of the Shillong Massif is marked by the NW-SE trending Dhansiri-Kopili
Fault. This fault separates the SM from MHM, which may be connected with each other at
depth. A graben-type of structure is responsible for the down-sinking of this region.
2.15 Whereas, in the southeastern part of the study area part of the Indo-Burman
tectonic belt occurs which has a regional N-S trending arc of mountain ridges extending
from Mishmi Hills through the Patkai, Naga, Chin and Arakan-Yoma Hills and is
genetically linked with the Andaman-Nicobar ridge and Sunda belt. Very prominent
eastward dipping Eastern Boundary Thrust delimits this mobile belt from the Central
Myanmar basin (Nandy, 2001). The Indo-Burman tectonic belt has formed due to
subduction of the Indian Plate beneath the Burmese Plate in geological past.
2.16 Geologically, the hill ranges of this tectonic belt are mainly formed of thick
8
turbiditic Cretaceous to upper Eocene shales and sandstones (Brunnschweiler, 1966). This
belt has been folded more intricately in Nagaland and the NE-SW trending Naga Thrust
traverses the whole of Nagaland and then verges with the Dauki Fault after taking a swing
towards southwest to west near Haflong. The anticlines, close to the Naga Thrust, show
reversal in topography with anticlines forming sites of valleys and synclinal hills (Nandy,
2001). These anticlines appear like upwarps on the edge of the moving Naga slice with
gently eastern limbs and steep, much sheared western limbs. Remarkably, most of the
thrusts in the region of Belt of Schuppen diverge from northwest and then unite with the
Naga Thrust. Thrust shows successive increase in magnitude of overriding movement
towards north. This zone has undergone large dislocation, as is indicated by enormous
variation in lithotectonic associations and attributes on either side of the Naga Thrust.
2.17 The belt of Schuppen in the Naga hills is a narrow linear belt of imbricate thrust
slices adjacent to the Assam valley and runs for 350 km (Mathur and Evans, 1964). This
belt comprises eight or possibly more overthrusts along which Paleogene rocks of Indo-
Myanmar mobile belt have moved northwestward. These thrusts define various
lithotectonic blocks and the thrusts have monoclinal dip towards southeast. As a result of
large scale thrusting in the schuppen belt the total horizontal movement that occurred is
estimated to be over 200 km (Nandy, 2001).
2.18 Towards south in the state of Mizoram and Tripura, the folded belt is represented
by high anticlinal ridges and synclinal valleys of Surmas and Tipams (Miocene) having
major N-S trending strike faults. The Oligocene rocks (Barail) consist of a series of N-S
trending marginal to basin faults. The intensity of fold movements and amplitudes of
folded layers are higher in the eastern part than in the western part of the basin. In the
Tripura and adjacent Bangladesh area, the folds are characterized by compressed
anticlines alternating with broad, very gently depressed synclines which, becomes more
compressed towards east. The Plio-Pleistocene beds in Bangladesh plains just west of
Tripura folded belt are also affected due to folding. Both anticlines and synclines are
traversed by sub-parallel and sub-vertical regional strike faults adjacent to the crestal
region of the folds. One of the significant tectonic features of this region however, is the
region of Barak-Surma valley which is bounded by hills on three sides with opening to the
9
plains of Bangladesh through Sylhet. The valley appears to have affected by tearing and
the valley trend coincides with the well known Sylhet fault. The prominent Sylhet Fault
has long been recognized in this region which trends NE and truncates the N-S trending
fold belt of Bangaldesh and Tripura region. These fold ridges exhibit eastward dragging
affect along this fault, as these folds take eastward swing. This fault extends for about 140
km and the Kusiyara River flows along this lineament for 35 km. Study of a 1968
earthquake indicated thrust faulting along this feature (Tandon and Srivastava, 1975).
However, Dasgupta and Nandy (1982) suggested deep-seated high angle reverse fault,
having a dip of about 700 towards southeast along this lineament.
2.19 To the south of the Dauki Fault of the Shillong Plateau, the plains of Bangladesh
are covered by enormously thick alluvium. The Bengal Basin is bordered on its west by
the Precambrian basement complex of crystalline metamorphics of the Indian Shield and
to the east by the frontal folds of Tripura. The basement below the basin is marked by the
Hinge zone, a high and a trough. Differential thickening and subsidence of the overlying
Oligo-Miocene sections between the shelf on the northwest and deeper basin to the
southeast has occurred in the region of EHZ. The Bengal basin basement steeply plunges
from 4 to 10 km or even further across the EHZ (Mukhopadhyay and Dasgupta, 1988).
This extends for at least 500 km from the Dauki fault on the north and Kolkata on the
south with probable extension into the Bay of Bengal having varying width from 25 km in
the north to 110 km in the central part and 35 km in the south.
3.0 SITE GEOLOGY
3.1 The geology of the project site is represented by quartz-biotite gneiss (QBG)
belonging to Precambrian Sela Group towards upstream and an interbedded sequence of
quartzite (IQS) and schist of Precambrian Lumla/Rupa Group towards downstream. The
QBG is a fairly uniform, medium to coarse grained, well foliated rock. It shows gneissose
texture with alternate bands of mainly quartz feldspar and micas aong with accessories.
The IQS are 10m to over 40m thick and are associated with thin interbands of grey
quartzite. Occasionally, thin bands of carbonaceous schist and calcitic marble also occur.

10
A limited occurrence of granitic gneiss is also found.
3.2 At the barrage site, the river is flat and very wide up to 200m. River bed exposes
black fine silty sand with high content of micaceous minerals. Boulders composed mostly
of quartzite and gneiss and ranging in size from a few centimeter to a few meters are seen
in the river bed area. Gneissic rocks are best exposed on the right bank. On the left bank,
gneisses are exposed only along the deeply incised nallas. River bed bore hole (98m deep)
information indicate presence of overburden consisting of boulders of biotite, gneisses
with quartz content and blackish medium to fine silty sand up to a depth of 7.5m and
followed by only sand without boulder up to a depth of 91.5m. Rocks consisting of biotite
gneisses with quartz content have been encountered after the depth of 91.5m. Whereas, in
the other bore hole in river bed rock were encountered at a depth of 49m overlain by
blackish medium to fine silty sand and then boulders.
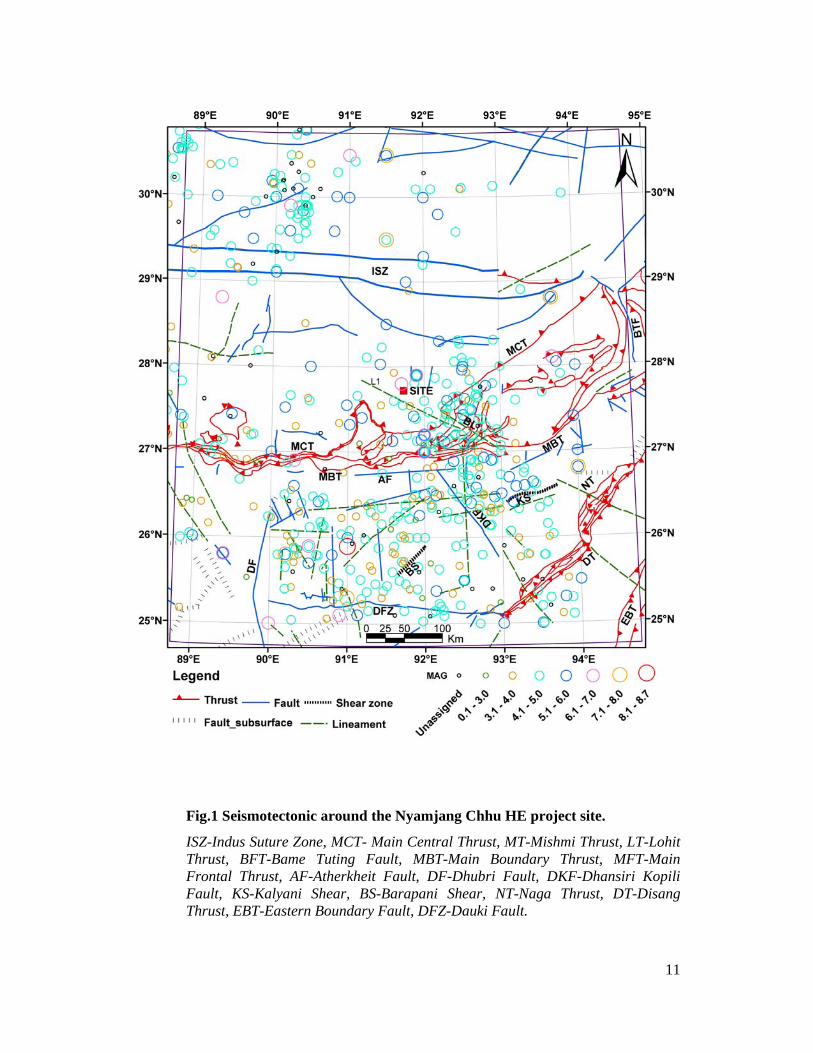
11
Fig.1 Seismotectonic around the Nyamjang Chhu HE project site.
ISZ-Indus Suture Zone, MCT- Main Central Thrust, MT-Mishmi Thrust, LT-Lohit Thrust, BFT-Bame Tuting Fault, MBT-Main Boundary Thrust, MFT-Main Frontal Thrust, AF-Atherkheit Fault, DF-Dhubri Fault, DKF-Dhansiri Kopili Fault, KS-Kalyani Shear, BS-Barapani Shear, NT-Naga Thrust, DT-Disang Thrust, EBT-Eastern Boundary Fault, DFZ-Dauki Fault.
12
4.0 EARTHQUAKE OCCURRENCES
4.1 The Nyamjang Chhu H.E. Project site situated in Tawang district of Arunachal
Pradesh and lies in seismic zone V as per the seismic zoning map of India as incorporated
in Indian Standard Criteria for Earthquake Resistant Design of Structures IS:1893-(Part I)
2002: General Provisions and Buildings. Many earthquakes, having large to great size,
have occurred in this region as per historical and instrumental earthquake data (1834-
2007) provided India Meteorological Department (IMD) and given in Appendix-I. There
are 733 earthquakes that have occurred around the site in 6° x 6° area out of which there
are 55 earthquakes with unassigned magnitude. However, there are 16, 121, 378, 139, 6
and one earthquakes reported in the magnitude ranges 1.0-3.0, 3.1-4.0, 4.1-5.0, 5.1-6.0,
6.1-7.0, 7.1-8.0 and M > 8.0, respectively.
4.2 Figure 1 shows the epicentral map along with the tectonic features in the area. The
analysis of epicentral map shows that the occurred earthquakes around the site are mostly
associated with the tectonic features such as the Main Central Thrust, Main Boundary
Thrust, Mishmi Thrust and the Shillong plateau region. Shillong plateau earthquake of
June 12, 1897 (M=8.7), Dhubri earthquake of July 3, 1930 (M=7.1) and Arunachal
Pradesh - China Border earthquake of August 15, 1950 (M=8.5) are the prominent
earthquakes experienced by this region.
4.3 The Shillong plateau earthquake of June 12, 1897 had its epicentral tract in and
around Shillong where there was considerable damage to lives and property, in addition
to other effects of very strong ground shaking. The maximum seismic intensity
experienced in the region due to the Shillong plateau earthquake of 1897 was estimated to
be X on MMI. According to an estimate it took a toll of 1542 human lives and almost
complete destruction of all brick and stone buildings in all the principal towns of
northeast Indian region including Shillong, Sylhet, Goalpara, Guwahati, Dhubri and Tura.
The destruction spread over an area of 3,71,200 sq km and the shock was felt over an area
of 4.48 million sq km. The intensity of the shaking within the epicentral tract was so large
that visible waves were seen at a number of places viz. Shillong, Nalban, Magaldai. On
the slopes of the Khasi hills a number of embedded rounded small blocks of granite were
13
thrown out of their places, showing that at these places the vertical acceleration exceeded
that of gravity, at least momentarily. Landslides occurred on enormous scale in the hills
and soft ground was filled with fissures throughout the epicentral tract. The earthquake
caused visible movements along faults besides fracturing long stretches of rock. In a
number of places the streambeds were tilted resulting in changing their course. Even the
bed of the Brahamputra river was affected, resulting in unprecedented floods in the
second half of the year 1897. The earthquake was followed by a very large number of
aftershocks whose epicenters were apparently scattered over a large area.
4.4 The Arunachal Pradesh – China Border earthquake of August 15, 1950 was the
largest earthquake to have occurred in the past five decades in India. The epicenter lay
close to the junction of the borders of India, Burma and Tibet. The level of river Lohit and
all the other streams had risen. Landslides on all the mountains enclosing the basin, has
been on a very extensive scale and wide belts had been ripped off their vegetation, which
fell into the valleys. Although the epicenter of the earthquake was located in the
unpopulated part, just outside the north – east boundary of India, it caused great
destruction to property in north- eastern Assam particularly in the sub-division of North
Lakhimpur, Dibrugarh, Jorhat, Sibsagar and Arunachal Pradesh. Road and rail
communications in the affected areas got completely disrupted, due to ground subsidence
and enormous fissures. The bed of the Brahmaputra rose giving rise to floods in the valley.
An area of nearly 46000 sq km in Assam suffered extensive heavy damage, The shock was
felt up to Lucknow, Allahabad, Rangoon and the total felt area therefore must have
exceeded 2.9 million sq km. Numerous aftershocks followed the main earthquake, their
epicenters scattered over a large area. The largest magnitude of the aftershock was 7.0.
4.5 An earthquake of moderate intensity (M=6.6) occurred on August 6, 1988 in
Manipur-Burma border region. This earthquake was widely felt in all the Northeastern
states including Arunachal Pradesh, Bangladesh, parts of North Western Burma and
Kathmandu (Nepal). Due to this earthquake, three people were killed, 12 injured and
considerable damage and landslides were noticed in the Guwahati - Sibsagar - Imphal
area. Subsidence of about 20 centimeters occurred in the Guwahati area. About 30 people
injured and some damage in Bangladesh was reported. Some damage in adjoining area of
14
Burma was also reported. The earthquake was followed by a number of aftershocks.
5.0 PARAMETERS FOR EARTHQUAKE RESISTANT DESIGN
5.1 Definitions
5.1.1 Maximum Considered Earthquake (MCE)
The Maximum Considered Earthquake is defined as the earthquake that can cause the
most severe ground motion capable of being produced at the site under the currently
known seismotectonic framework. It is a rational and believable event, which can be
supported by all known geological and seismological data. It is determined by judgment
based on maximum earthquake that a tectonic region can produce considering the
geological evidence on past movement and the recorded seismic history of the area.
5.1.2 Design Basis Earthquake (DBE)
The Design Basis Earthquake is defined as that earthquake which can reasonably be
expected to occur during the economic life of the structure (say 100 years) and in the event
of exposure to earthquake hazards it will not cause loss of life and the structure will
undergo permissible deformations and repairable damage such that the structure,
equipment facilities and services will remain functional after the earthquake. As design
criteria the resulting ground accelerations at the site under DBE may be taken as a fraction
of MCE based on engineering judgment for adopted design methodology.
5.2 Seismogenic Sources around the Site
5.2.1 This project site falls in the easternmost part of the Himalayan orogenic belt close to
the regional tectonic feature MCT. In order to evaluate earthquake hazard for the
Nyamjang Chhu H.E. project site, various important earthquake sources around the site
have been considered. To explain the cause of occurrence of earthquakes and to
understand the seismotectonics of the Himalayan collision zone, various models have been
proposed for the evolution of the Himalaya. Of these, two models namely, Steady State
Model and the Evolutionary model have gained considerable importance.
15
5.2.2 Steady state model (Seeber et al., 1981) postulates that the active low angle
contemporary thrusts i.e. MCT and MBT converge with the plane of detachment, which
marks the interface between the subducting Indian slab and overlying sedimentary wedge.
Whereas, the basement thrust in this model represents that part of shallow dipping
detachment surface where the MCT merges and hence spatially the basement thrust is
located just north of MCT. According to this model the great Himalayan earthquakes are
related to the detachment surface. The evolutionary model (Ni and Barazangi 1984)
postulates that zone of plate convergence has progressively shifted south by formation of
intra crustal thrusts and hypothesizes that the MBT is the most active tectonic surface and
that the seismicity is concentrated in a 50 km wide zone between the map trace of MBT
and MCT. This model suggests that the rupture of Great Himalayan earthquakes may have
started in the interplate thrust zone, which propagated south along the detachment to the
MBT and further south to the subsidiary blind thrusts making MBT the most active thrust
rooted in the detachment. Both these models suggest that the contemporary deformation
styles in the Himalayas are guided by the under thrusting of the Indian thrust along the
detachment surface.
5.2.3 Nearest seismogenic sources to the site are Main Central Thrust and Main
Boundary Thrust. The project area is seismically active as several earthquakes are reported
from this region.
5.2.4 The NE-SW trending Main Central Thrust (MCT) in this part of the Himalayas is a
north dipping thrust with initial steepness and marks the tectonic boundary between the
high-grade metamorphites of the Se La Group and low to medium-grade metasediments of
the Dirang Formation in the Diggin Valley, in upper reaches of the Kamla river and near
Taliha in the Subansiri river section. Further in east, the Dirang Formation appears to get
eliminated and it marks the tectonic boundary with the Bomdila Group. The MCT has
been traced to Arunachal Pradesh through Nepal, Darjeeling-Sikkim and Bhutan (Ravi
Shanker et al., 1989), which abuts against the Tidding Suture in the Siang Valley. A
magnitude 8.0 has been assigned to this regional feature for the assessment of seismic
hazard using deterministic approach.

16
5.2.5 The Main Boundary Thrust (MBT) and other north trending thrusts dip towards the
project site and hence the thrust plane lies beneath the project site. MBT demarcates the
tectonic boundary between the Main Himalayan Belt and the Frontal Folded Belt forming
the Sub-Himalayas. The Lesser Himalayan meta-sedimentaries have been brought over the
Sub Himalayan successions through large-scale movement that took place along the MBT.
The MBT is not a single tectonic plane instead is represented by several thrust slices. It is
also a north dipping thrust fault with ENE-WSW trend from the border with Bhutan in the
west to Roing in the Dibang valley and does not continue southeast to join the Mishmi
Thrust as visualized by Ranga Rao (1983). According to Sinha Roy (1976) the MBT
flattens at depth, as indicated by the absence of Gondwana rocks in southern Bhutan and
in the west-central Arunachal Pradesh. This is possibly due to the fact that the MBT
merges at depth with some dislocation zones in the inner belt. To the seismogenic source
earthquake of magnitude 7.5 has been assigned.
Table I - Peak ground horizontal acceleration from various sources around Hutong-
II H.E Project Site
Sl. No.
Sources Magnitude Distance to zone of energy
release(Km)
Max.Accl. (g)
1. Main Central Thrust 8.0 15 0.36
2. Main Boundary Thrust 7.5 15 0.31
3. Lineament L1 6.5 18 0.15
4. Indus Suture Zone 7.0 131 0.03
5. Atherkheit Fault 6.5 107 0.03
6. Dhansiri Kopili Fault 7.0 116 0.04
7. Barapani Shear 6.5 209 0.02
8. Dhubri Fault 7.5 241 0.02
9. Dauki Fault Zone 7.5 283 0.02
10. Naga / Disang Thrust 6.5 280 0.02
11. Shillong Plateau Earthquake Source 8.7 218 0.05
17
5.3 Estimation of Maximum Considered Earthquake (MCE)
5.3.1 Earthquake Parameters
5.3.1.1 Based on the regional geology along with the seismotectonics as described in
sections 2.0 to 4.0 the parameters for maximum probable earthquakes which can be
generated from the potential seismogenic sources around the site are given in Table I,
wherein eleven such sources have been considered for deterministic analysis. The peak
ground horizontal acceleration estimates are made using empirical formulae worked out
by some of the research workers for various tectonic environment. Attenuation
relationships are derived by regression analysis using different distance measures and
magnitude measures. Thus different relationships provide different estimates of probable
ground acceleration and a judicious decision to estimate ground acceleration is therefore
required for adoption in any particular situation.
5.3.1.2 ICOLD Bulletin 72 (1989) recommends use of some empirical relationships like
that of Campbell (1981) and Joyner and Boore (1981). Subsequently, Abrahamson and
Litehiser (1989) using formulation similar to the above have made comprehensive
recommendations based on analysis of 585 records from 76 world wide earthquakes. For
the present study attenuation relationship proposed by Abrahamson and Litehiser (1989)
has been used. The regression used a two-step procedure that is hybrid of the Joyner and
Boore (1981) and Campbell (1981) regression methods. The horizontal acceleration
attenuation relation is as follows:
ErFMerMa 0008.0132.0)284.0log(982.0177.062.0)log( −++−+−= -(1)
where, a is peak horizontal acceleration, r is the closest distance (in km) from site to the
zone of energy release, M is the magnitude ( LM < 6.0 and Ms > 6.0) following
Campbell (1981) where Ms is used if it is greater than or equal to 6., F is dummy
variable that is 1 for reverse or reverse oblique fault otherwise 0, and E is a dummy
variable that is 1 for inter-plate and 0 for intra-plate events. The rupture width is estimated
using Wells and Coppersmith, (1994) relationship
MRW 32.001.1)log( +−= -(2)
18
where RW is the rupture width. In case the rupture width is less than the general focal
depths of the region ( FD ) then the depth to the zone of energy release is estimated as
)sin2
( αRW
FDNSDDz −+= -(3)
where NSD is non seismogenic depth and α is the dip angle. When the rupture width is
more than FD the depth to the zone of energy release is estimated as
αsin2
RWNSDDz += -(4)
The distance to the zone of energy release De is estimated using the depth to the zone of
energy release Dz and the epicentral distance Ep as
22 DzEpDe += -(5)
If the site is on hanging wall of the thrust type of seismogenic feature, the epicentral
distance is considered as zero and the distance to the zone of energy release is taken as
depth to the zone of energy release i.e., Dz . The angle α is taken as 15° for the thrust type
of seismogenic features which are necessarily the low angle reverse faults. In case of
normal/strike slip the angle α is taken as 90°.
The estimation of the general depth of focus in this region is made using the cross section
of the line AB across the main seismogenic features such as the trends of MCT and MBT.
The line on which the earthquakes are projected is given in Fig. 2. The depth section is
shown in Fig. 3. The depth section reveals the general depth around 15 km. The trend of
the data could not be interpreted in terms of the detachment surface present in the region
due to lesser number of data available and the errors in the depths of the located events as
given in section 5.2 of the report. Conservatively, the models as proposed for the orogeny
of these seismogenic features (as reported in section 5.2) have been considered and a depth
of 15 km is assigned for general focal depth in the area as per the models.
The relationship given by Wells and Coppersmith (1994) uses the moment magnitude
which is approximately equal to surface wave magnitude in the range of 5.0-7.5
(Kanamori, 1983). Therefore, the same magnitudes are used to compute the rupture width.
19
The magnitudes are assigned to the seismic sources based on the past seismicity associated
with the individual seismogenic features. The maximum value estimated for horizontal
peak ground acceleration (PGA) is 0.42g (Table I). The surface wave magnitude Ms is
used for the estimation of PGA values.
5.3.2 Ground Motion Characteristics
Time history of ground motion is worked out from the shape of target acceleration
response spectra, which in turn depends on the parameters of the earthquake, the
predominant period of the ground motion, and the amplification of spectral acceleration at
various periods. Shape of design response spectrum is based on subjective judgment of
local geology and bed rock conditions. For the present situation the maximum
amplification is taken as 3.200 corresponding to 5% damping. This amplification
corresponds to the mean level. The history of ground motion (accelerogram) has been
generated for these parameters. Figure 4 shows the accelerogram with normalised peak
ground acceleration of 1.0 g. Appendix-II gives listing of acceleration ordinates at
intervals of 0.01 sec. corresponding to ground acceleration time history (normalised to 1.0
g) in horizontal direction. The ordinates of Fig. 4 and acceleration ordinates in Appendix-
II will have to be multiplied by 0.42 g to obtain MCE time history.
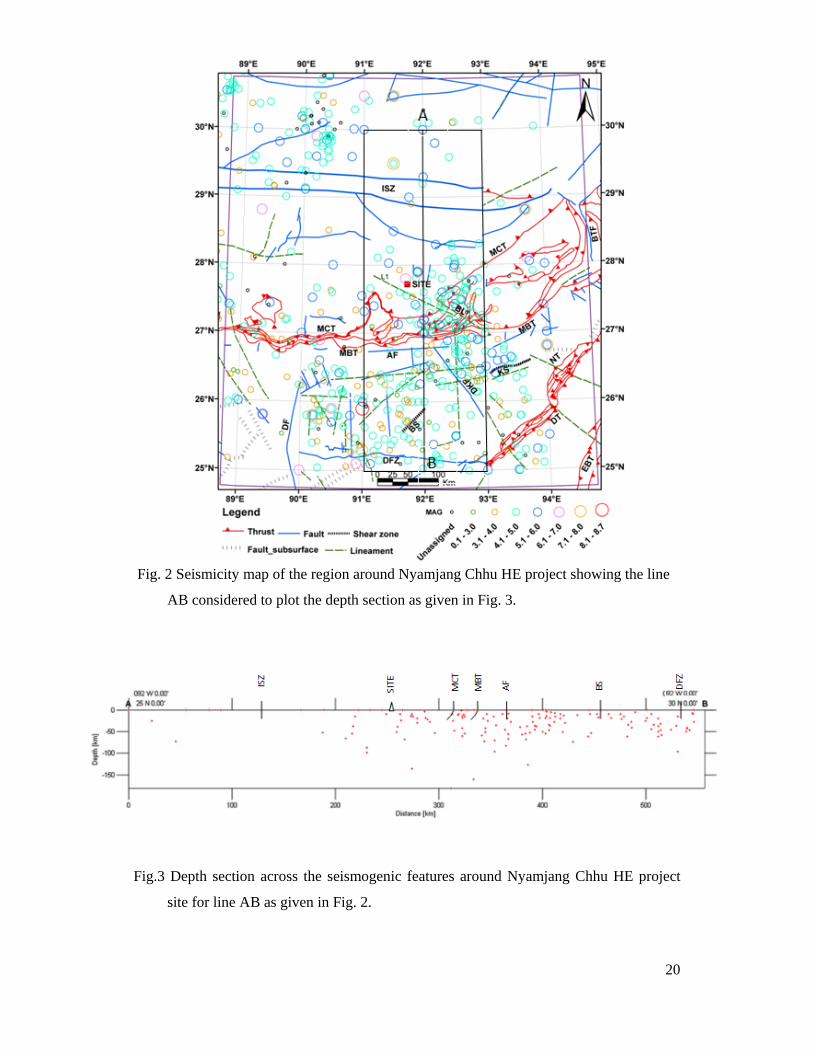
20
Fig. 2 Seismicity map of the region around Nyamjang Chhu HE project showing the line
AB considered to plot the depth section as given in Fig. 3.
Fig.3 Depth section across the seismogenic features around Nyamjang Chhu HE project
site for line AB as given in Fig. 2.
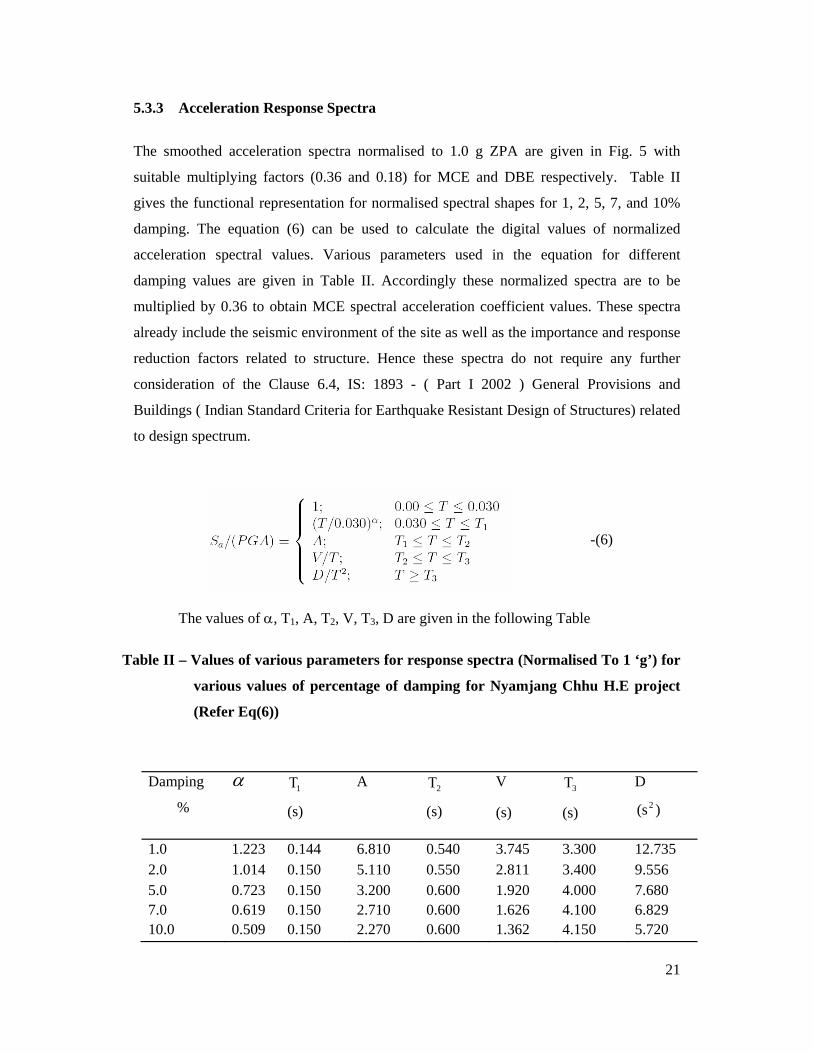
21
5.3.3 Acceleration Response Spectra
The smoothed acceleration spectra normalised to 1.0 g ZPA are given in Fig. 5 with
suitable multiplying factors (0.36 and 0.18) for MCE and DBE respectively. Table II
gives the functional representation for normalised spectral shapes for 1, 2, 5, 7, and 10%
damping. The equation (6) can be used to calculate the digital values of normalized
acceleration spectral values. Various parameters used in the equation for different
damping values are given in Table II. Accordingly these normalized spectra are to be
multiplied by 0.36 to obtain MCE spectral acceleration coefficient values. These spectra
already include the seismic environment of the site as well as the importance and response
reduction factors related to structure. Hence these spectra do not require any further
consideration of the Clause 6.4, IS: 1893 - ( Part I 2002 ) General Provisions and
Buildings ( Indian Standard Criteria for Earthquake Resistant Design of Structures) related
to design spectrum.
-(6)
The values of α, T1, A, T2, V, T3, D are given in the following Table
Table II – Values of various parameters for response spectra (Normalised To 1 ‘g’) for
various values of percentage of damping for Nyamjang Chhu H.E project
(Refer Eq(6))
Damping
%
α 1Τ
(s)
A
2Τ
(s)
V
(s)
3Τ
(s)
D
)(s2
1.0 1.223 0.144 6.810 0.540 3.745 3.300 12.735 2.0 1.014 0.150 5.110 0.550 2.811 3.400 9.556 5.0 0.723 0.150 3.200 0.600 1.920 4.000 7.680 7.0 0.619 0.150 2.710 0.600 1.626 4.100 6.829 10.0 0.509 0.150 2.270 0.600 1.362 4.150 5.720
22
5.3.4 Vertical Acceleration
Vertical spectral acceleration values may be taken as two third of the corresponding
horizontal values. Similarly acceleration ordinates for the time history of vertical ground
motion may be assumed as two third of the corresponding horizontal value.
5.3.5 Safety Criteria
Where the structure is checked for MCE either the response spectra or time history
analysis of the structure could be carried out.
5.3.5.1 Factor of safety against sliding and overturning for MCE condition should not be
less than 1.0.
5.3.5.2 For concrete barrage the maximum tension under MCE may be allowed to exceed
50% more than those specified for DBE.
5.4 Estimation of Design Basis Earthquake
5.4.1 Earthquake Parameters
Having obtained spectra and time history for Maximum Considered Earthquake conditions
the Design Basis Spectra is evaluated by using appropriate reduction factors. A scaling
factor of 2 with respect to MCE values is recommended for obtaining Design Basis
Earthquake (DBE) values.
5.4.2 Ground Motion Characteristics
The horizontal ground acceleration values for this condition shall be derived by
multiplying the values as given in Annexure-II by a factor of 0.18g.
5.4.3 Acceleration Response Spectra
The normalised smoothed acceleration spectra are given in Table II and Fig. 5.
23
Accordingly, these are to be multiplied by 0.18 to obtain DBE spectral acceleration values.
For estimating the design seismic coefficient, hα for the preliminary design of barrage
(primary structure) is obtained as:
gZ
h aS.
2.
31
=α
where, Z is the estimated PGA coefficient for MCE (0.36 in this case). For other
(secondary structure), appropriate Response Reduction Factor R, as specified in IS: 1893
may be used along with I=1 for calculating horizontal seismic design coefficient as:
RI
gZAh .S.2
a=
5.4.4 Vertical Acceleration Vertical spectral acceleration values may be taken as two third of the corresponding
horizontal values. Similarly acceleration ordinates for the time history of vertical ground
motion may be assumed as two thirds of the corresponding horizontal values.
5.4.5 Safety Criteria
5.4.5.1 Factor of safety against sliding for DBE condition should not be less than 1.5.
Factor of safety against overturning should not be less than 1.5.
5.4.5.2 For concrete/masonry barrage the maximum tension under DBE may be allowed
to exceed upto 12.5% of the ultimate compressive strength.
5.5 For design of other relatively less important and less hazardous structures/systems
the value of acceleration history/spectra could be further reduced by 50% with respect to
DBE values. Forces obtained in this manner are to be considered as working seismic loads
and may be combined with other loads as specified in the relevant codes along with
permissible stresses.
5.5.1 The reduced spectra concept mentioned in 5.4 above is based on assumption of
ductile behaviour of structures. Hence structures must be appropriately detailed for
achieving such ductility. In case of reinforced concrete structures such details are included
in IS: 13920-1993.
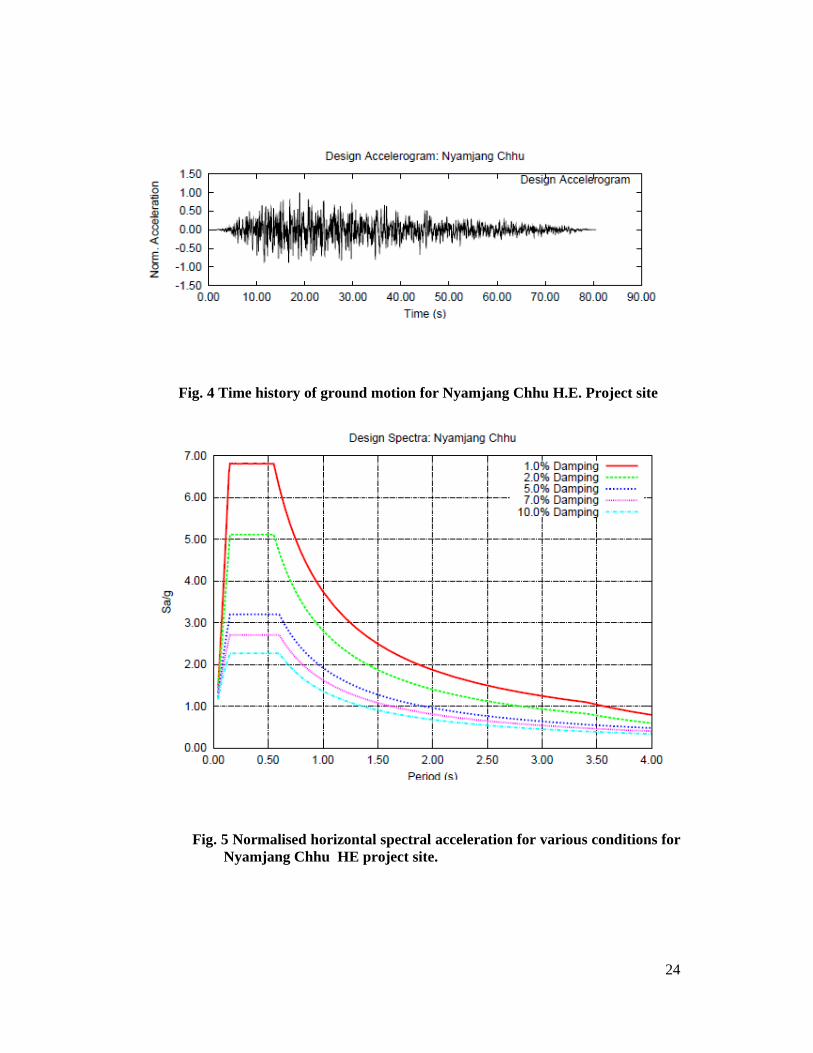
24
Fig. 4 Time history of ground motion for Nyamjang Chhu H.E. Project site
Fig. 5 Normalised horizontal spectral acceleration for various conditions for Nyamjang Chhu HE project site.
25
6.0 RECOMMENDATIONS
6.1 The site specific design earthquake parameter for MCE condition is estimated to be
magnitude 8.0 earthquake occurring at MCT.
6.2 The PGA values for MCE and DBE conditions and estimated to 0.36g and 0.18g
respectively.
6.3 The design acceleration response spectra is obtained by multiplying the normalized
horizontal acceleration spectra as given in Fig. 5 by the corresponding PGA values.
6.4 Vertical acceleration spectral values shall be taken as 2/3 of the corresponding to
horizontal values.
6.5 Data for time history of earthquake ground motion for the dynamic analysis of the
barrage are given in Annexure-II normalised to peak ground accelerations of 1.0 g.
For MCE and DBE time history analysis ground motion data as given in
Annexure-II will have to be multiplied by 0.36g and 0.18g respectively. The
corresponding response spectra are given in Fig. 5 and Table II.
6.6 Safety criteria as indicated in Sections 5.3.5 and 5.4.5 as applicable may be
followed in design of the Barrage.
26
REFERECES
1. Abrahamson N. A. and J. J. Litehiser (1989) Attenuation of vertical peak
accelerations Bull. Seis. Soc. Am. 79 549-580.
2. Barooah BC, Bhattacharya SK. 1981. A review of basement tectonics of the
Brahmaputra valley, Assam. Geological Survey of India, Miscellaneous
Publication No. 46: 123-128.
3. Brunnschweiler, R. O. (1966). On the geology of the Indoburman ranges. J. Geol.
Soc. Aust., 13, 137-194.
4. Campbell K. W. (1997) Empirical near source attenuation relationships for horizontal and vertical components of peak ground acceleration, peak ground velocity and Pseudo-Absolute acceleration response spectra, Seis. Res. Let. Vol. 68, 154-179
5. Campbell, K. W. (1981), Near source attenuation of peak horizontal acceleration,
Bull. Seis. Soc. Am., 71, 2039-2070.
6. Desikachar, S. V. (1974). A review of the tectonic and geological history of eastern
India in terms of plate tectonic theory. J. Geol. Soc. India, 15, 137-149.
7. Evans, P. (1964). The tectonic framework of Assam. J. Geol. Soc. India, 5, 80-96.
8. G. S. I. (1974). Geology and mineral resources of the states of India, Part IV,
Arunachal Pradesh, Assam, Manipur, Meghalaya, Mizoram, Nagaland and Tripura.
Geol. Surv. India, Misc. Publ., 30, 124 pp.
9. GSI (2000) Seismotectonic Atlas of India and its environs, Geological Survey of
India.
10. ICOLD Bulletin (1989), Selecting seismic parameters for large dams, Guidelines, Bulletin 72, International Commission on Large Dams
11. IS : 1893 (Part-1) - 2002, Criteria for Earthquake Resistant Design of Structures; General Provisions & Buildings, Bureau of Indian Standards, New Delhi
12. IS:13920-1993, Ductile detailing of reinforced concrete structures subjected to seismic forces - Code of Practice, Bureau of Indian Standards, New Delhi.
13. Joyner, W. B. and D. M. Boore (1981), Peak horizontal acceleration and velocity from strong motion records including records from the 1979 Imperial Valley, California earthquake, Bull. Seis. Soc. Am., 71, 2011-2038.
14. Kanamori, H (1983) Magnitude scale and quantification of earthquakes, Tectonophysics 93, 185-199.
15. Kumar, G. (1997) Geology of Arunachal Pradesh. Geological Society of India,
27
Bangalore, 217pp.
16. Mathur, L.P. and Evans, P. (1964). Oil in India. 22nd Int. Geol. Congress, India,
New Delhi, 85pp.
17. Mazumdar, S. K. (1978). Morphotectonic evolution of the Khasi hills, Meghalaya,
India. Geol. Surv. India, Misc. Publ., No. 34, 208-213.
18. Murthy, M. V. N. (1970). Tectonic and mafic igneous activity in Northeast India in
relation to upper mantle. Proc. Symp. Upper Mantle Project, Hyderabad, 287
19. Murthy, M. V. N., Mazumdar, S. K. and Bhaumik, N. (1976). Significance of
tectonic trends in the geological evolution of the Meghalaya uplands since the
Precambrian. Geol. Surv. India, Misc. Publ, 23, 471-484.
20. Nandy, D. R. (1976). Geological set up of the Eastern Himalaya and the Patkoi-
Naga-Arakan-Yoma (Indo-Burman) Hill Ranges in relation to the Indian Plate
movement. Geol. Surv. India, Misc. Publ., 41, 205-213.
21. Nandy, D.R. (2001) Geodynamics of Northeastern India and the adjoining region.
ACB publication, Kolkata, p209.
22. Ni, J. and Barazangi, M. (1984) Seismotectonics of the Himalayan collision zone:
geometry of the underthrusting Indian Plate beneath the Himalaya. J. Geophys.
Res., 89, 1147-1163.
23. Ranga Rao, A. (1983). Geology and hydrocarbon potential of a part of Assam-
Arakan Basin and its adjacent regions. Petroleum Asia Jour., 6(4), 127-158.
24. Sarkar, A., Datta, A.K., Poddar, B.C., Kollapuri, V.K., Bhattacharyya, B.K. and
Sanwal, R. (1992). Geochronological studies on early Cretaceous effusive and
intrusive rocks from Northeast India. (Abstract). Symp. on Mesozoic Magmatism
of the Eastern Margin of India, Patna University, 28-29.
25. Seeber, L. and Armbruster, J. G. (1981). Great detachment earthquakes along the
Himalayan arc and long term forecasting. In: Earthquake Prediction (edited by
D.W. Simpson and P.G. Richards), Am. Geophys. Un., 259-277.
26. Shanker, R., Kumar, G. and Saxena, S.P. (1989). Stratigraphy and sedimentation in
Himalaya: A reappraisal. In: Geology and Tectonics of Himalaya. Geol. Surv. Ind.
Spl. Pub. No. 26, pp. 1-60.
27. Sinha Roy, S. (1976). Tectonic elements in the eastern Himalaya and geodynamic
model of evolution of the Himalaya. Geol. Surv. India, Misc. Publ., 34, 57-74.

28
28. Tandon, A. N. and Srivastava, H. N. (1975). Focal mechanism of some recent
Himalayan earthquakes and regional plate tectonics. Bull. Seism. Soc. Am., 65,
963-969.
29. Wells, D. L. and Coppersmith, K. J. (1994), New empirical relationships among magnitude, rupture length, rupture width, rupture area, and surface displacement, Bull. Seis. Soc. Am., Vol. 84, No. 4, 974-1002.
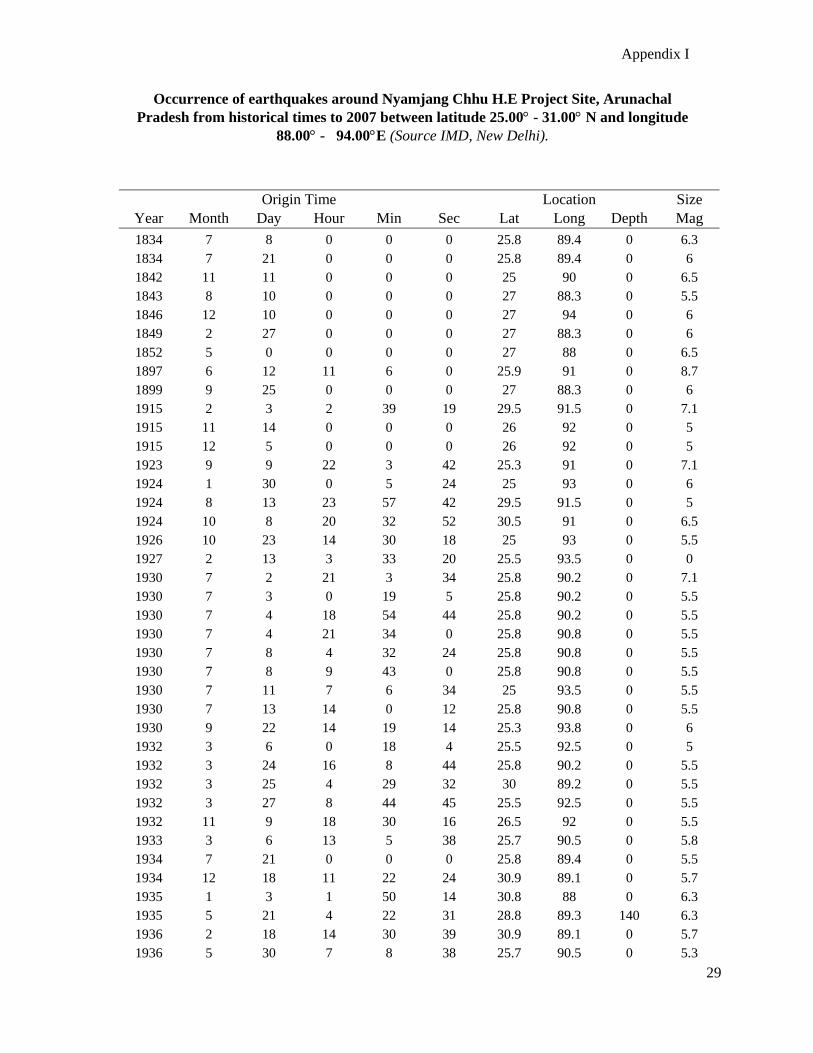
Appendix I
29
Occurrence of earthquakes around Nyamjang Chhu H.E Project Site, Arunachal Pradesh from historical times to 2007 between latitude 25.00° - 31.00° N and longitude
88.00° - 94.00°E (Source IMD, New Delhi).
Origin Time Location Size Year Month Day Hour Min Sec Lat Long Depth Mag 1834 7 8 0 0 0 25.8 89.4 0 6.3 1834 7 21 0 0 0 25.8 89.4 0 6 1842 11 11 0 0 0 25 90 0 6.5 1843 8 10 0 0 0 27 88.3 0 5.5 1846 12 10 0 0 0 27 94 0 6 1849 2 27 0 0 0 27 88.3 0 6 1852 5 0 0 0 0 27 88 0 6.5 1897 6 12 11 6 0 25.9 91 0 8.7 1899 9 25 0 0 0 27 88.3 0 6 1915 2 3 2 39 19 29.5 91.5 0 7.1 1915 11 14 0 0 0 26 92 0 5 1915 12 5 0 0 0 26 92 0 5 1923 9 9 22 3 42 25.3 91 0 7.1 1924 1 30 0 5 24 25 93 0 6 1924 8 13 23 57 42 29.5 91.5 0 5 1924 10 8 20 32 52 30.5 91 0 6.5 1926 10 23 14 30 18 25 93 0 5.5 1927 2 13 3 33 20 25.5 93.5 0 0 1930 7 2 21 3 34 25.8 90.2 0 7.1 1930 7 3 0 19 5 25.8 90.2 0 5.5 1930 7 4 18 54 44 25.8 90.2 0 5.5 1930 7 4 21 34 0 25.8 90.8 0 5.5 1930 7 8 4 32 24 25.8 90.8 0 5.5 1930 7 8 9 43 0 25.8 90.8 0 5.5 1930 7 11 7 6 34 25 93.5 0 5.5 1930 7 13 14 0 12 25.8 90.8 0 5.5 1930 9 22 14 19 14 25.3 93.8 0 6 1932 3 6 0 18 4 25.5 92.5 0 5 1932 3 24 16 8 44 25.8 90.2 0 5.5 1932 3 25 4 29 32 30 89.2 0 5.5 1932 3 27 8 44 45 25.5 92.5 0 5.5 1932 11 9 18 30 16 26.5 92 0 5.5 1933 3 6 13 5 38 25.7 90.5 0 5.8 1934 7 21 0 0 0 25.8 89.4 0 5.5 1934 12 18 11 22 24 30.9 89.1 0 5.7 1935 1 3 1 50 14 30.8 88 0 6.3 1935 5 21 4 22 31 28.8 89.3 140 6.3 1936 2 18 14 30 39 30.9 89.1 0 5.7 1936 5 30 7 8 38 25.7 90.5 0 5.3
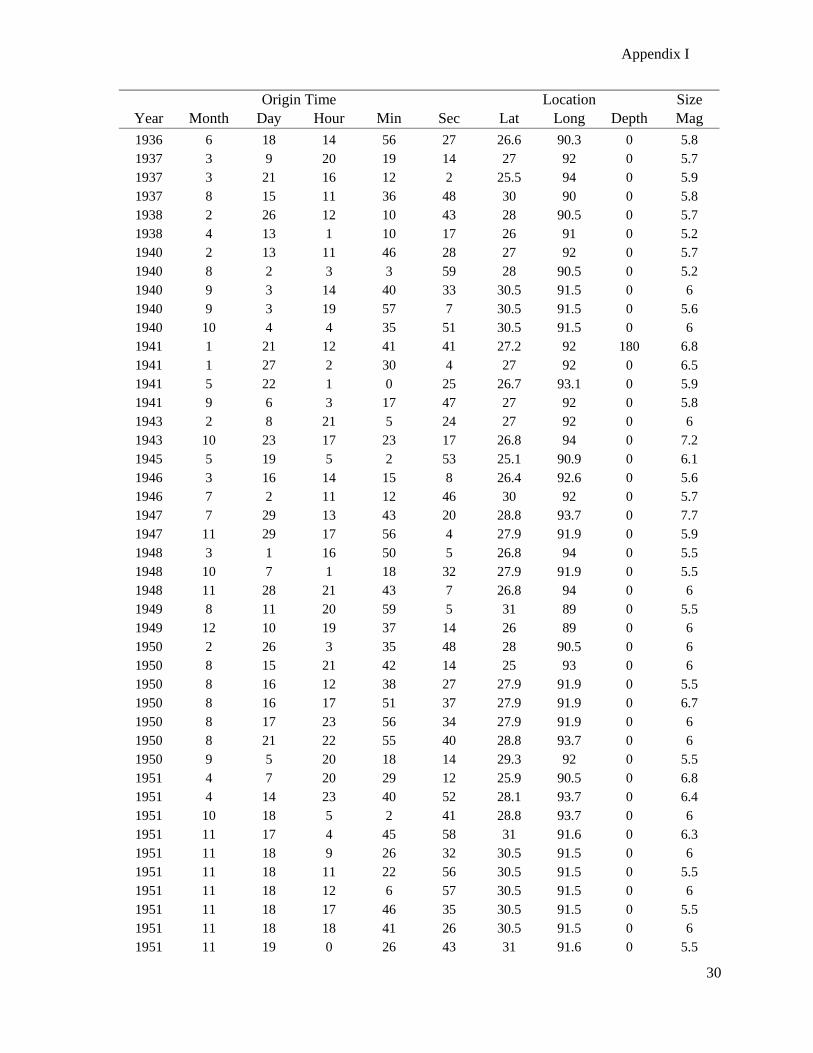
Appendix I
30
Origin Time Location Size Year Month Day Hour Min Sec Lat Long Depth Mag 1936 6 18 14 56 27 26.6 90.3 0 5.8 1937 3 9 20 19 14 27 92 0 5.7 1937 3 21 16 12 2 25.5 94 0 5.9 1937 8 15 11 36 48 30 90 0 5.8 1938 2 26 12 10 43 28 90.5 0 5.7 1938 4 13 1 10 17 26 91 0 5.2 1940 2 13 11 46 28 27 92 0 5.7 1940 8 2 3 3 59 28 90.5 0 5.2 1940 9 3 14 40 33 30.5 91.5 0 6 1940 9 3 19 57 7 30.5 91.5 0 5.6 1940 10 4 4 35 51 30.5 91.5 0 6 1941 1 21 12 41 41 27.2 92 180 6.8 1941 1 27 2 30 4 27 92 0 6.5 1941 5 22 1 0 25 26.7 93.1 0 5.9 1941 9 6 3 17 47 27 92 0 5.8 1943 2 8 21 5 24 27 92 0 6 1943 10 23 17 23 17 26.8 94 0 7.2 1945 5 19 5 2 53 25.1 90.9 0 6.1 1946 3 16 14 15 8 26.4 92.6 0 5.6 1946 7 2 11 12 46 30 92 0 5.7 1947 7 29 13 43 20 28.8 93.7 0 7.7 1947 11 29 17 56 4 27.9 91.9 0 5.9 1948 3 1 16 50 5 26.8 94 0 5.5 1948 10 7 1 18 32 27.9 91.9 0 5.5 1948 11 28 21 43 7 26.8 94 0 6 1949 8 11 20 59 5 31 89 0 5.5 1949 12 10 19 37 14 26 89 0 6 1950 2 26 3 35 48 28 90.5 0 6 1950 8 15 21 42 14 25 93 0 6 1950 8 16 12 38 27 27.9 91.9 0 5.5 1950 8 16 17 51 37 27.9 91.9 0 6.7 1950 8 17 23 56 34 27.9 91.9 0 6 1950 8 21 22 55 40 28.8 93.7 0 6 1950 9 5 20 18 14 29.3 92 0 5.5 1951 4 7 20 29 12 25.9 90.5 0 6.8 1951 4 14 23 40 52 28.1 93.7 0 6.4 1951 10 18 5 2 41 28.8 93.7 0 6 1951 11 17 4 45 58 31 91.6 0 6.3 1951 11 18 9 26 32 30.5 91.5 0 6 1951 11 18 11 22 56 30.5 91.5 0 5.5 1951 11 18 12 6 57 30.5 91.5 0 6 1951 11 18 17 46 35 30.5 91.5 0 5.5 1951 11 18 18 41 26 30.5 91.5 0 6 1951 11 19 0 26 43 31 91.6 0 5.5
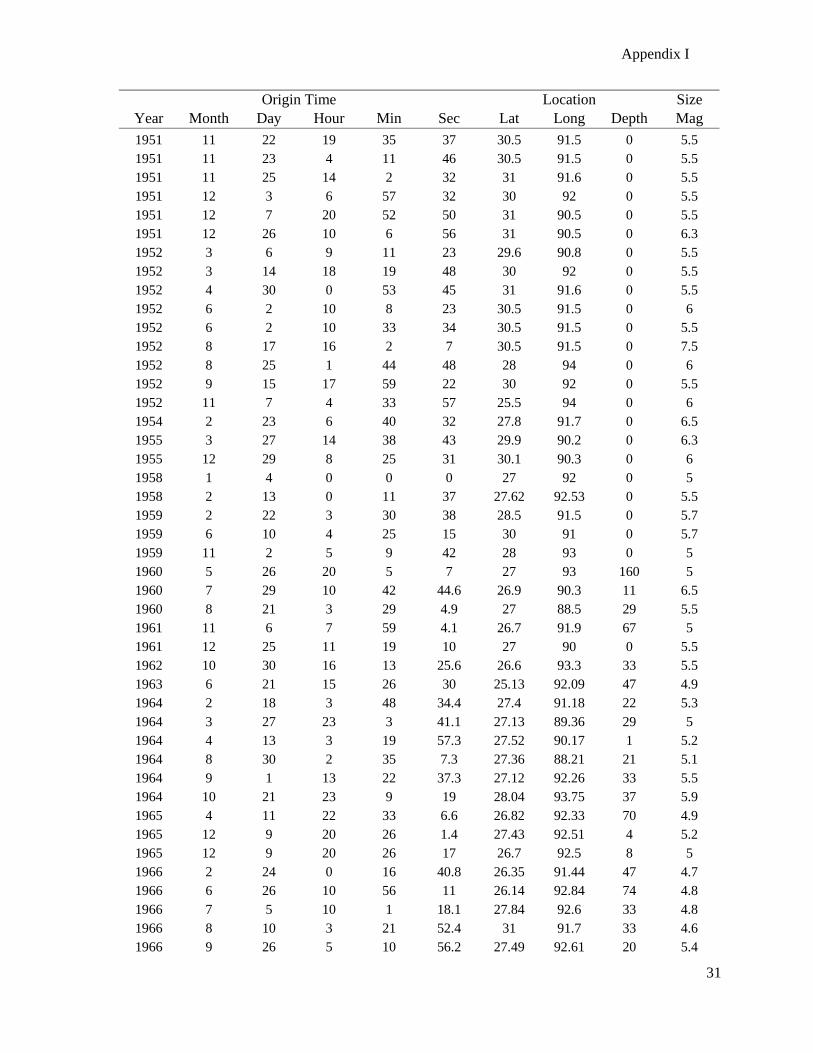
Appendix I
31
Origin Time Location Size Year Month Day Hour Min Sec Lat Long Depth Mag 1951 11 22 19 35 37 30.5 91.5 0 5.5 1951 11 23 4 11 46 30.5 91.5 0 5.5 1951 11 25 14 2 32 31 91.6 0 5.5 1951 12 3 6 57 32 30 92 0 5.5 1951 12 7 20 52 50 31 90.5 0 5.5 1951 12 26 10 6 56 31 90.5 0 6.3 1952 3 6 9 11 23 29.6 90.8 0 5.5 1952 3 14 18 19 48 30 92 0 5.5 1952 4 30 0 53 45 31 91.6 0 5.5 1952 6 2 10 8 23 30.5 91.5 0 6 1952 6 2 10 33 34 30.5 91.5 0 5.5 1952 8 17 16 2 7 30.5 91.5 0 7.5 1952 8 25 1 44 48 28 94 0 6 1952 9 15 17 59 22 30 92 0 5.5 1952 11 7 4 33 57 25.5 94 0 6 1954 2 23 6 40 32 27.8 91.7 0 6.5 1955 3 27 14 38 43 29.9 90.2 0 6.3 1955 12 29 8 25 31 30.1 90.3 0 6 1958 1 4 0 0 0 27 92 0 5 1958 2 13 0 11 37 27.62 92.53 0 5.5 1959 2 22 3 30 38 28.5 91.5 0 5.7 1959 6 10 4 25 15 30 91 0 5.7 1959 11 2 5 9 42 28 93 0 5 1960 5 26 20 5 7 27 93 160 5 1960 7 29 10 42 44.6 26.9 90.3 11 6.5 1960 8 21 3 29 4.9 27 88.5 29 5.5 1961 11 6 7 59 4.1 26.7 91.9 67 5 1961 12 25 11 19 10 27 90 0 5.5 1962 10 30 16 13 25.6 26.6 93.3 33 5.5 1963 6 21 15 26 30 25.13 92.09 47 4.9 1964 2 18 3 48 34.4 27.4 91.18 22 5.3 1964 3 27 23 3 41.1 27.13 89.36 29 5 1964 4 13 3 19 57.3 27.52 90.17 1 5.2 1964 8 30 2 35 7.3 27.36 88.21 21 5.1 1964 9 1 13 22 37.3 27.12 92.26 33 5.5 1964 10 21 23 9 19 28.04 93.75 37 5.9 1965 4 11 22 33 6.6 26.82 92.33 70 4.9 1965 12 9 20 26 1.4 27.43 92.51 4 5.2 1965 12 9 20 26 17 26.7 92.5 8 5 1966 2 24 0 16 40.8 26.35 91.44 47 4.7 1966 6 26 10 56 11 26.14 92.84 74 4.8 1966 7 5 10 1 18.1 27.84 92.6 33 4.8 1966 8 10 3 21 52.4 31 91.7 33 4.6 1966 9 26 5 10 56.2 27.49 92.61 20 5.4
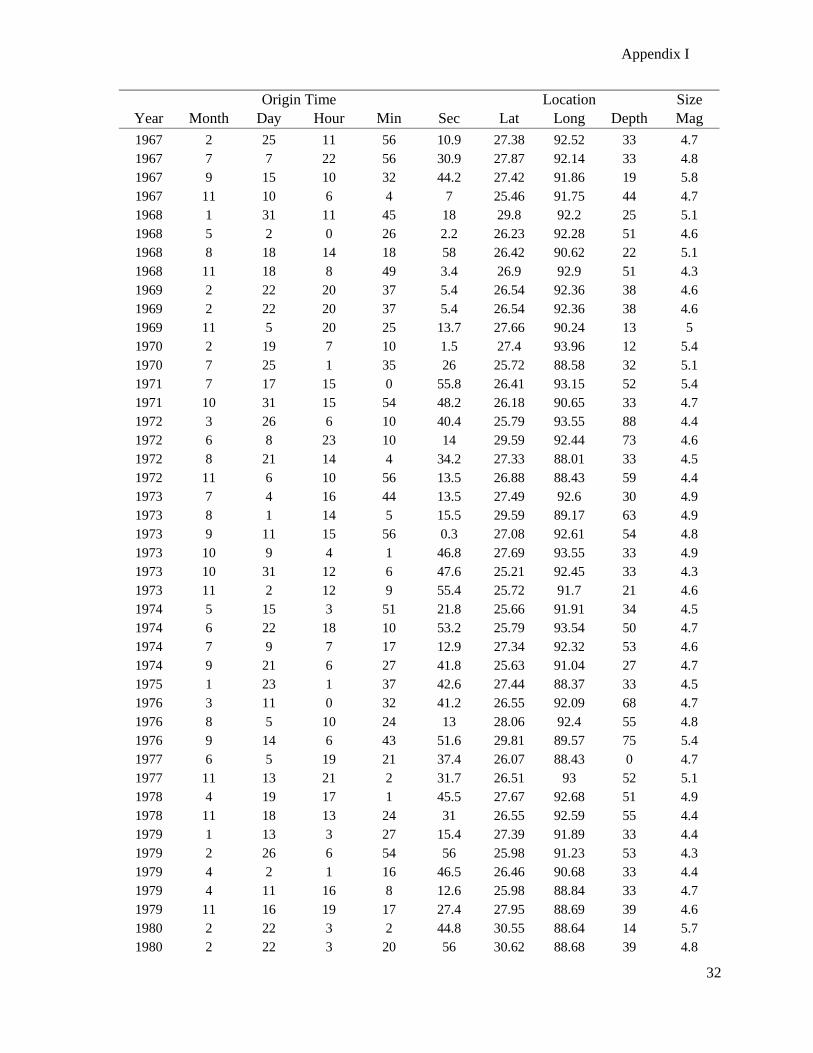
Appendix I
32
Origin Time Location Size Year Month Day Hour Min Sec Lat Long Depth Mag 1967 2 25 11 56 10.9 27.38 92.52 33 4.7 1967 7 7 22 56 30.9 27.87 92.14 33 4.8 1967 9 15 10 32 44.2 27.42 91.86 19 5.8 1967 11 10 6 4 7 25.46 91.75 44 4.7 1968 1 31 11 45 18 29.8 92.2 25 5.1 1968 5 2 0 26 2.2 26.23 92.28 51 4.6 1968 8 18 14 18 58 26.42 90.62 22 5.1 1968 11 18 8 49 3.4 26.9 92.9 51 4.3 1969 2 22 20 37 5.4 26.54 92.36 38 4.6 1969 2 22 20 37 5.4 26.54 92.36 38 4.6 1969 11 5 20 25 13.7 27.66 90.24 13 5 1970 2 19 7 10 1.5 27.4 93.96 12 5.4 1970 7 25 1 35 26 25.72 88.58 32 5.1 1971 7 17 15 0 55.8 26.41 93.15 52 5.4 1971 10 31 15 54 48.2 26.18 90.65 33 4.7 1972 3 26 6 10 40.4 25.79 93.55 88 4.4 1972 6 8 23 10 14 29.59 92.44 73 4.6 1972 8 21 14 4 34.2 27.33 88.01 33 4.5 1972 11 6 10 56 13.5 26.88 88.43 59 4.4 1973 7 4 16 44 13.5 27.49 92.6 30 4.9 1973 8 1 14 5 15.5 29.59 89.17 63 4.9 1973 9 11 15 56 0.3 27.08 92.61 54 4.8 1973 10 9 4 1 46.8 27.69 93.55 33 4.9 1973 10 31 12 6 47.6 25.21 92.45 33 4.3 1973 11 2 12 9 55.4 25.72 91.7 21 4.6 1974 5 15 3 51 21.8 25.66 91.91 34 4.5 1974 6 22 18 10 53.2 25.79 93.54 50 4.7 1974 7 9 7 17 12.9 27.34 92.32 53 4.6 1974 9 21 6 27 41.8 25.63 91.04 27 4.7 1975 1 23 1 37 42.6 27.44 88.37 33 4.5 1976 3 11 0 32 41.2 26.55 92.09 68 4.7 1976 8 5 10 24 13 28.06 92.4 55 4.8 1976 9 14 6 43 51.6 29.81 89.57 75 5.4 1977 6 5 19 21 37.4 26.07 88.43 0 4.7 1977 11 13 21 2 31.7 26.51 93 52 5.1 1978 4 19 17 1 45.5 27.67 92.68 51 4.9 1978 11 18 13 24 31 26.55 92.59 55 4.4 1979 1 13 3 27 15.4 27.39 91.89 33 4.4 1979 2 26 6 54 56 25.98 91.23 53 4.3 1979 4 2 1 16 46.5 26.46 90.68 33 4.4 1979 4 11 16 8 12.6 25.98 88.84 33 4.7 1979 11 16 19 17 27.4 27.95 88.69 39 4.6 1980 2 22 3 2 44.8 30.55 88.64 14 5.7 1980 2 22 3 20 56 30.62 88.68 39 4.8
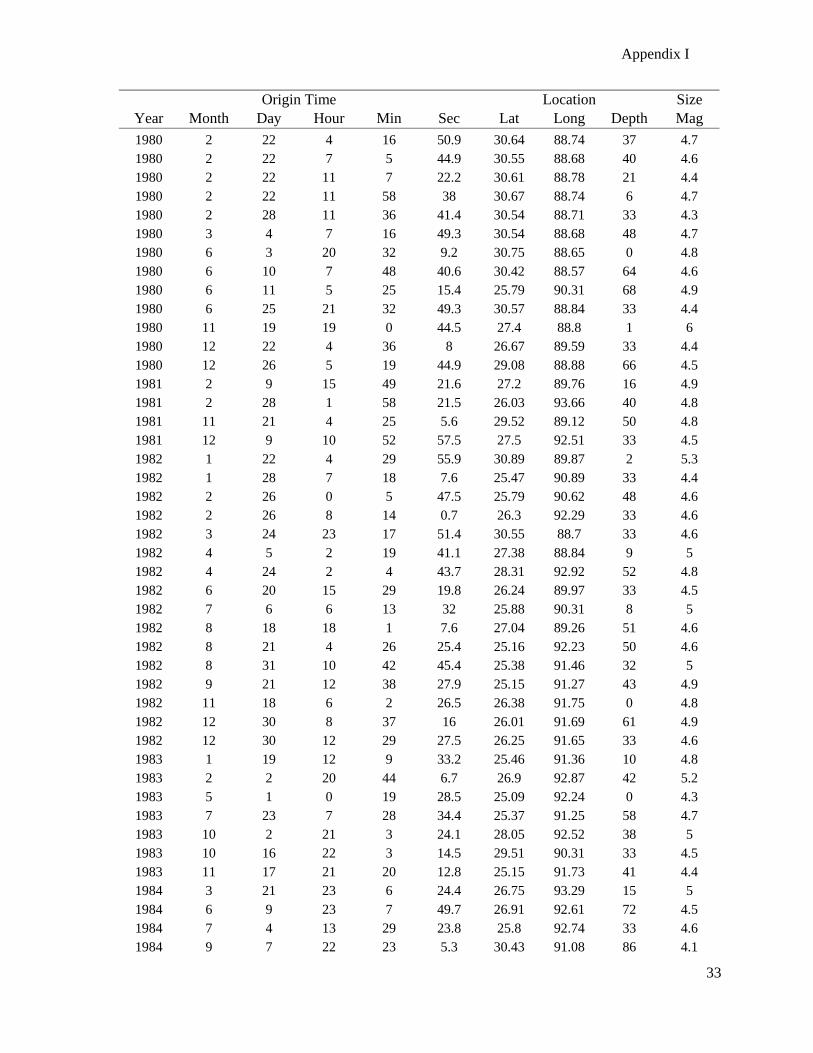
Appendix I
33
Origin Time Location Size Year Month Day Hour Min Sec Lat Long Depth Mag 1980 2 22 4 16 50.9 30.64 88.74 37 4.7 1980 2 22 7 5 44.9 30.55 88.68 40 4.6 1980 2 22 11 7 22.2 30.61 88.78 21 4.4 1980 2 22 11 58 38 30.67 88.74 6 4.7 1980 2 28 11 36 41.4 30.54 88.71 33 4.3 1980 3 4 7 16 49.3 30.54 88.68 48 4.7 1980 6 3 20 32 9.2 30.75 88.65 0 4.8 1980 6 10 7 48 40.6 30.42 88.57 64 4.6 1980 6 11 5 25 15.4 25.79 90.31 68 4.9 1980 6 25 21 32 49.3 30.57 88.84 33 4.4 1980 11 19 19 0 44.5 27.4 88.8 1 6 1980 12 22 4 36 8 26.67 89.59 33 4.4 1980 12 26 5 19 44.9 29.08 88.88 66 4.5 1981 2 9 15 49 21.6 27.2 89.76 16 4.9 1981 2 28 1 58 21.5 26.03 93.66 40 4.8 1981 11 21 4 25 5.6 29.52 89.12 50 4.8 1981 12 9 10 52 57.5 27.5 92.51 33 4.5 1982 1 22 4 29 55.9 30.89 89.87 2 5.3 1982 1 28 7 18 7.6 25.47 90.89 33 4.4 1982 2 26 0 5 47.5 25.79 90.62 48 4.6 1982 2 26 8 14 0.7 26.3 92.29 33 4.6 1982 3 24 23 17 51.4 30.55 88.7 33 4.6 1982 4 5 2 19 41.1 27.38 88.84 9 5 1982 4 24 2 4 43.7 28.31 92.92 52 4.8 1982 6 20 15 29 19.8 26.24 89.97 33 4.5 1982 7 6 6 13 32 25.88 90.31 8 5 1982 8 18 18 1 7.6 27.04 89.26 51 4.6 1982 8 21 4 26 25.4 25.16 92.23 50 4.6 1982 8 31 10 42 45.4 25.38 91.46 32 5 1982 9 21 12 38 27.9 25.15 91.27 43 4.9 1982 11 18 6 2 26.5 26.38 91.75 0 4.8 1982 12 30 8 37 16 26.01 91.69 61 4.9 1982 12 30 12 29 27.5 26.25 91.65 33 4.6 1983 1 19 12 9 33.2 25.46 91.36 10 4.8 1983 2 2 20 44 6.7 26.9 92.87 42 5.2 1983 5 1 0 19 28.5 25.09 92.24 0 4.3 1983 7 23 7 28 34.4 25.37 91.25 58 4.7 1983 10 2 21 3 24.1 28.05 92.52 38 5 1983 10 16 22 3 14.5 29.51 90.31 33 4.5 1983 11 17 21 20 12.8 25.15 91.73 41 4.4 1984 3 21 23 6 24.4 26.75 93.29 15 5 1984 6 9 23 7 49.7 26.91 92.61 72 4.5 1984 7 4 13 29 23.8 25.8 92.74 33 4.6 1984 9 7 22 23 5.3 30.43 91.08 86 4.1
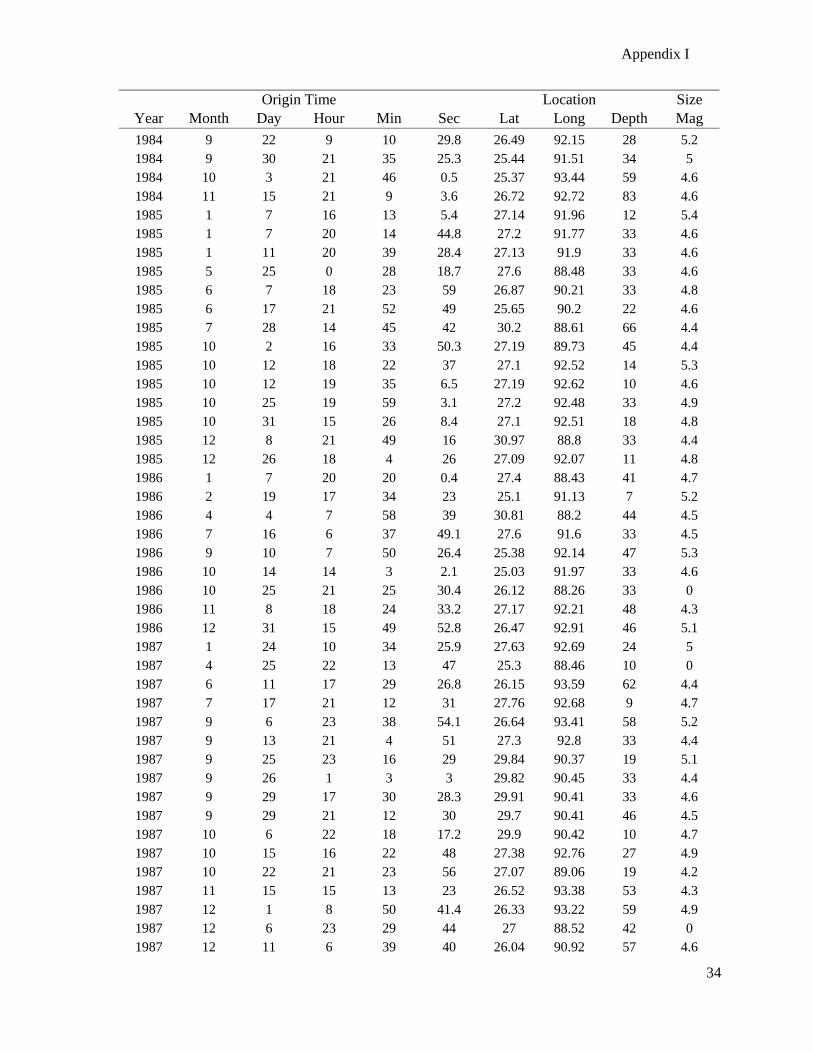
Appendix I
34
Origin Time Location Size Year Month Day Hour Min Sec Lat Long Depth Mag 1984 9 22 9 10 29.8 26.49 92.15 28 5.2 1984 9 30 21 35 25.3 25.44 91.51 34 5 1984 10 3 21 46 0.5 25.37 93.44 59 4.6 1984 11 15 21 9 3.6 26.72 92.72 83 4.6 1985 1 7 16 13 5.4 27.14 91.96 12 5.4 1985 1 7 20 14 44.8 27.2 91.77 33 4.6 1985 1 11 20 39 28.4 27.13 91.9 33 4.6 1985 5 25 0 28 18.7 27.6 88.48 33 4.6 1985 6 7 18 23 59 26.87 90.21 33 4.8 1985 6 17 21 52 49 25.65 90.2 22 4.6 1985 7 28 14 45 42 30.2 88.61 66 4.4 1985 10 2 16 33 50.3 27.19 89.73 45 4.4 1985 10 12 18 22 37 27.1 92.52 14 5.3 1985 10 12 19 35 6.5 27.19 92.62 10 4.6 1985 10 25 19 59 3.1 27.2 92.48 33 4.9 1985 10 31 15 26 8.4 27.1 92.51 18 4.8 1985 12 8 21 49 16 30.97 88.8 33 4.4 1985 12 26 18 4 26 27.09 92.07 11 4.8 1986 1 7 20 20 0.4 27.4 88.43 41 4.7 1986 2 19 17 34 23 25.1 91.13 7 5.2 1986 4 4 7 58 39 30.81 88.2 44 4.5 1986 7 16 6 37 49.1 27.6 91.6 33 4.5 1986 9 10 7 50 26.4 25.38 92.14 47 5.3 1986 10 14 14 3 2.1 25.03 91.97 33 4.6 1986 10 25 21 25 30.4 26.12 88.26 33 0 1986 11 8 18 24 33.2 27.17 92.21 48 4.3 1986 12 31 15 49 52.8 26.47 92.91 46 5.1 1987 1 24 10 34 25.9 27.63 92.69 24 5 1987 4 25 22 13 47 25.3 88.46 10 0 1987 6 11 17 29 26.8 26.15 93.59 62 4.4 1987 7 17 21 12 31 27.76 92.68 9 4.7 1987 9 6 23 38 54.1 26.64 93.41 58 5.2 1987 9 13 21 4 51 27.3 92.8 33 4.4 1987 9 25 23 16 29 29.84 90.37 19 5.1 1987 9 26 1 3 3 29.82 90.45 33 4.4 1987 9 29 17 30 28.3 29.91 90.41 33 4.6 1987 9 29 21 12 30 29.7 90.41 46 4.5 1987 10 6 22 18 17.2 29.9 90.42 10 4.7 1987 10 15 16 22 48 27.38 92.76 27 4.9 1987 10 22 21 23 56 27.07 89.06 19 4.2 1987 11 15 15 13 23 26.52 93.38 53 4.3 1987 12 1 8 50 41.4 26.33 93.22 59 4.9 1987 12 6 23 29 44 27 88.52 42 0 1987 12 11 6 39 40 26.04 90.92 57 4.6
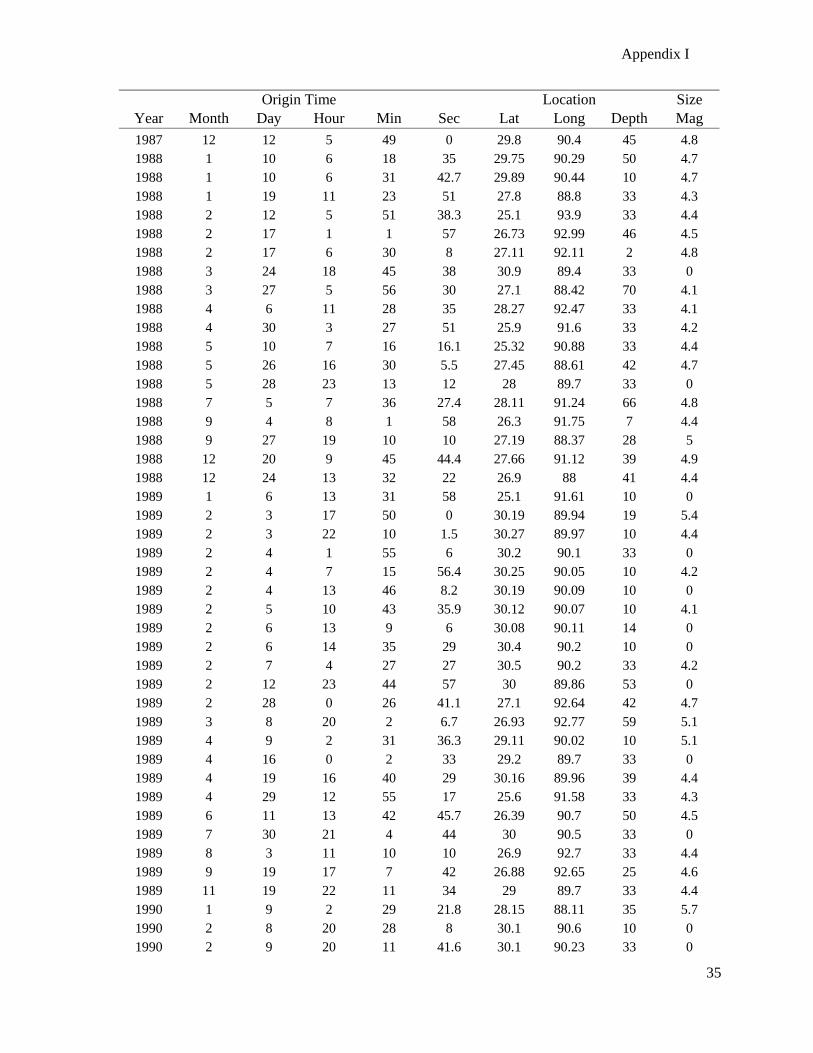
Appendix I
35
Origin Time Location Size Year Month Day Hour Min Sec Lat Long Depth Mag 1987 12 12 5 49 0 29.8 90.4 45 4.8 1988 1 10 6 18 35 29.75 90.29 50 4.7 1988 1 10 6 31 42.7 29.89 90.44 10 4.7 1988 1 19 11 23 51 27.8 88.8 33 4.3 1988 2 12 5 51 38.3 25.1 93.9 33 4.4 1988 2 17 1 1 57 26.73 92.99 46 4.5 1988 2 17 6 30 8 27.11 92.11 2 4.8 1988 3 24 18 45 38 30.9 89.4 33 0 1988 3 27 5 56 30 27.1 88.42 70 4.1 1988 4 6 11 28 35 28.27 92.47 33 4.1 1988 4 30 3 27 51 25.9 91.6 33 4.2 1988 5 10 7 16 16.1 25.32 90.88 33 4.4 1988 5 26 16 30 5.5 27.45 88.61 42 4.7 1988 5 28 23 13 12 28 89.7 33 0 1988 7 5 7 36 27.4 28.11 91.24 66 4.8 1988 9 4 8 1 58 26.3 91.75 7 4.4 1988 9 27 19 10 10 27.19 88.37 28 5 1988 12 20 9 45 44.4 27.66 91.12 39 4.9 1988 12 24 13 32 22 26.9 88 41 4.4 1989 1 6 13 31 58 25.1 91.61 10 0 1989 2 3 17 50 0 30.19 89.94 19 5.4 1989 2 3 22 10 1.5 30.27 89.97 10 4.4 1989 2 4 1 55 6 30.2 90.1 33 0 1989 2 4 7 15 56.4 30.25 90.05 10 4.2 1989 2 4 13 46 8.2 30.19 90.09 10 0 1989 2 5 10 43 35.9 30.12 90.07 10 4.1 1989 2 6 13 9 6 30.08 90.11 14 0 1989 2 6 14 35 29 30.4 90.2 10 0 1989 2 7 4 27 27 30.5 90.2 33 4.2 1989 2 12 23 44 57 30 89.86 53 0 1989 2 28 0 26 41.1 27.1 92.64 42 4.7 1989 3 8 20 2 6.7 26.93 92.77 59 5.1 1989 4 9 2 31 36.3 29.11 90.02 10 5.1 1989 4 16 0 2 33 29.2 89.7 33 0 1989 4 19 16 40 29 30.16 89.96 39 4.4 1989 4 29 12 55 17 25.6 91.58 33 4.3 1989 6 11 13 42 45.7 26.39 90.7 50 4.5 1989 7 30 21 4 44 30 90.5 33 0 1989 8 3 11 10 10 26.9 92.7 33 4.4 1989 9 19 17 7 42 26.88 92.65 25 4.6 1989 11 19 22 11 34 29 89.7 33 4.4 1990 1 9 2 29 21.8 28.15 88.11 35 5.7 1990 2 8 20 28 8 30.1 90.6 10 0 1990 2 9 20 11 41.6 30.1 90.23 33 0
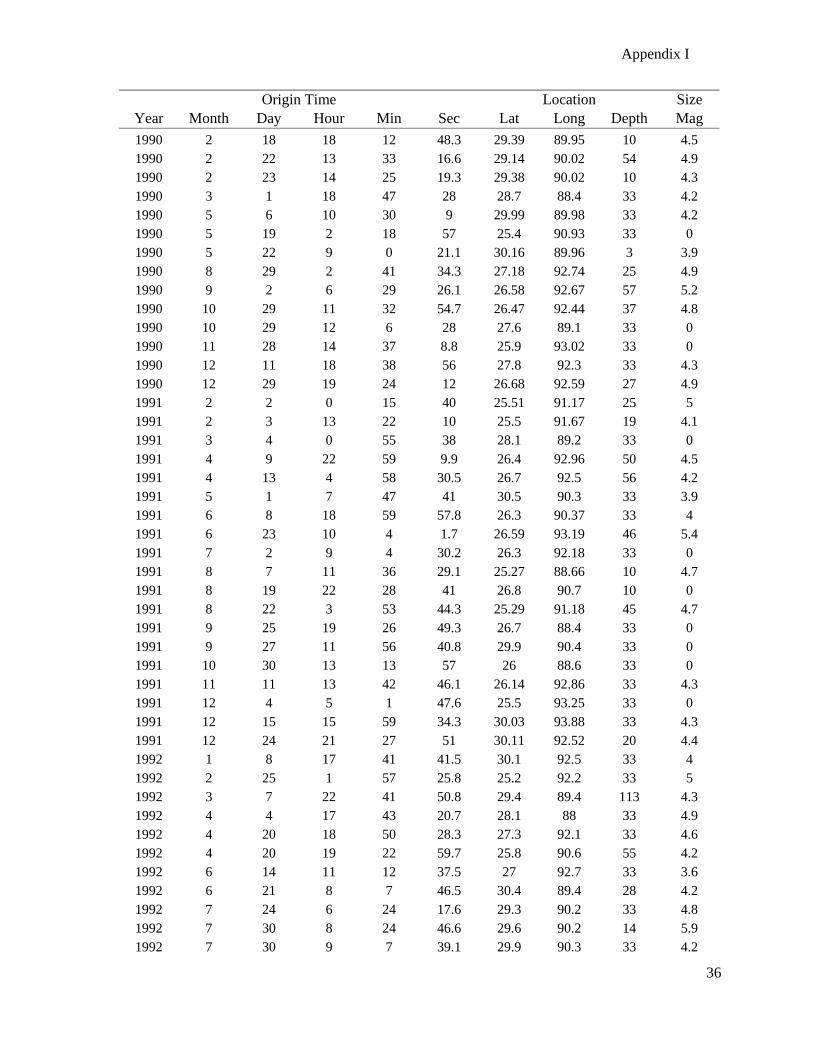
Appendix I
36
Origin Time Location Size Year Month Day Hour Min Sec Lat Long Depth Mag 1990 2 18 18 12 48.3 29.39 89.95 10 4.5 1990 2 22 13 33 16.6 29.14 90.02 54 4.9 1990 2 23 14 25 19.3 29.38 90.02 10 4.3 1990 3 1 18 47 28 28.7 88.4 33 4.2 1990 5 6 10 30 9 29.99 89.98 33 4.2 1990 5 19 2 18 57 25.4 90.93 33 0 1990 5 22 9 0 21.1 30.16 89.96 3 3.9 1990 8 29 2 41 34.3 27.18 92.74 25 4.9 1990 9 2 6 29 26.1 26.58 92.67 57 5.2 1990 10 29 11 32 54.7 26.47 92.44 37 4.8 1990 10 29 12 6 28 27.6 89.1 33 0 1990 11 28 14 37 8.8 25.9 93.02 33 0 1990 12 11 18 38 56 27.8 92.3 33 4.3 1990 12 29 19 24 12 26.68 92.59 27 4.9 1991 2 2 0 15 40 25.51 91.17 25 5 1991 2 3 13 22 10 25.5 91.67 19 4.1 1991 3 4 0 55 38 28.1 89.2 33 0 1991 4 9 22 59 9.9 26.4 92.96 50 4.5 1991 4 13 4 58 30.5 26.7 92.5 56 4.2 1991 5 1 7 47 41 30.5 90.3 33 3.9 1991 6 8 18 59 57.8 26.3 90.37 33 4 1991 6 23 10 4 1.7 26.59 93.19 46 5.4 1991 7 2 9 4 30.2 26.3 92.18 33 0 1991 8 7 11 36 29.1 25.27 88.66 10 4.7 1991 8 19 22 28 41 26.8 90.7 10 0 1991 8 22 3 53 44.3 25.29 91.18 45 4.7 1991 9 25 19 26 49.3 26.7 88.4 33 0 1991 9 27 11 56 40.8 29.9 90.4 33 0 1991 10 30 13 13 57 26 88.6 33 0 1991 11 11 13 42 46.1 26.14 92.86 33 4.3 1991 12 4 5 1 47.6 25.5 93.25 33 0 1991 12 15 15 59 34.3 30.03 93.88 33 4.3 1991 12 24 21 27 51 30.11 92.52 20 4.4 1992 1 8 17 41 41.5 30.1 92.5 33 4 1992 2 25 1 57 25.8 25.2 92.2 33 5 1992 3 7 22 41 50.8 29.4 89.4 113 4.3 1992 4 4 17 43 20.7 28.1 88 33 4.9 1992 4 20 18 50 28.3 27.3 92.1 33 4.6 1992 4 20 19 22 59.7 25.8 90.6 55 4.2 1992 6 14 11 12 37.5 27 92.7 33 3.6 1992 6 21 8 7 46.5 30.4 89.4 28 4.2 1992 7 24 6 24 17.6 29.3 90.2 33 4.8 1992 7 30 8 24 46.6 29.6 90.2 14 5.9 1992 7 30 9 7 39.1 29.9 90.3 33 4.2
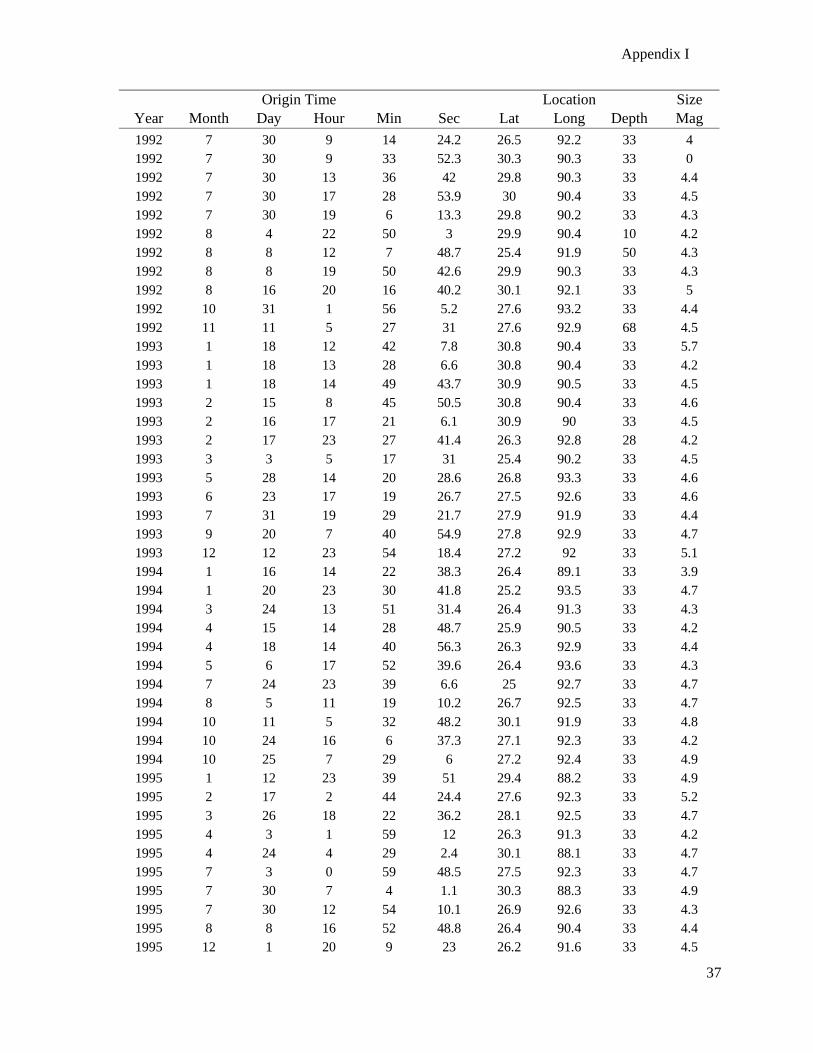
Appendix I
37
Origin Time Location Size Year Month Day Hour Min Sec Lat Long Depth Mag 1992 7 30 9 14 24.2 26.5 92.2 33 4 1992 7 30 9 33 52.3 30.3 90.3 33 0 1992 7 30 13 36 42 29.8 90.3 33 4.4 1992 7 30 17 28 53.9 30 90.4 33 4.5 1992 7 30 19 6 13.3 29.8 90.2 33 4.3 1992 8 4 22 50 3 29.9 90.4 10 4.2 1992 8 8 12 7 48.7 25.4 91.9 50 4.3 1992 8 8 19 50 42.6 29.9 90.3 33 4.3 1992 8 16 20 16 40.2 30.1 92.1 33 5 1992 10 31 1 56 5.2 27.6 93.2 33 4.4 1992 11 11 5 27 31 27.6 92.9 68 4.5 1993 1 18 12 42 7.8 30.8 90.4 33 5.7 1993 1 18 13 28 6.6 30.8 90.4 33 4.2 1993 1 18 14 49 43.7 30.9 90.5 33 4.5 1993 2 15 8 45 50.5 30.8 90.4 33 4.6 1993 2 16 17 21 6.1 30.9 90 33 4.5 1993 2 17 23 27 41.4 26.3 92.8 28 4.2 1993 3 3 5 17 31 25.4 90.2 33 4.5 1993 5 28 14 20 28.6 26.8 93.3 33 4.6 1993 6 23 17 19 26.7 27.5 92.6 33 4.6 1993 7 31 19 29 21.7 27.9 91.9 33 4.4 1993 9 20 7 40 54.9 27.8 92.9 33 4.7 1993 12 12 23 54 18.4 27.2 92 33 5.1 1994 1 16 14 22 38.3 26.4 89.1 33 3.9 1994 1 20 23 30 41.8 25.2 93.5 33 4.7 1994 3 24 13 51 31.4 26.4 91.3 33 4.3 1994 4 15 14 28 48.7 25.9 90.5 33 4.2 1994 4 18 14 40 56.3 26.3 92.9 33 4.4 1994 5 6 17 52 39.6 26.4 93.6 33 4.3 1994 7 24 23 39 6.6 25 92.7 33 4.7 1994 8 5 11 19 10.2 26.7 92.5 33 4.7 1994 10 11 5 32 48.2 30.1 91.9 33 4.8 1994 10 24 16 6 37.3 27.1 92.3 33 4.2 1994 10 25 7 29 6 27.2 92.4 33 4.9 1995 1 12 23 39 51 29.4 88.2 33 4.9 1995 2 17 2 44 24.4 27.6 92.3 33 5.2 1995 3 26 18 22 36.2 28.1 92.5 33 4.7 1995 4 3 1 59 12 26.3 91.3 33 4.2 1995 4 24 4 29 2.4 30.1 88.1 33 4.7 1995 7 3 0 59 48.5 27.5 92.3 33 4.7 1995 7 30 7 4 1.1 30.3 88.3 33 4.9 1995 7 30 12 54 10.1 26.9 92.6 33 4.3 1995 8 8 16 52 48.8 26.4 90.4 33 4.4 1995 12 1 20 9 23 26.2 91.6 33 4.5
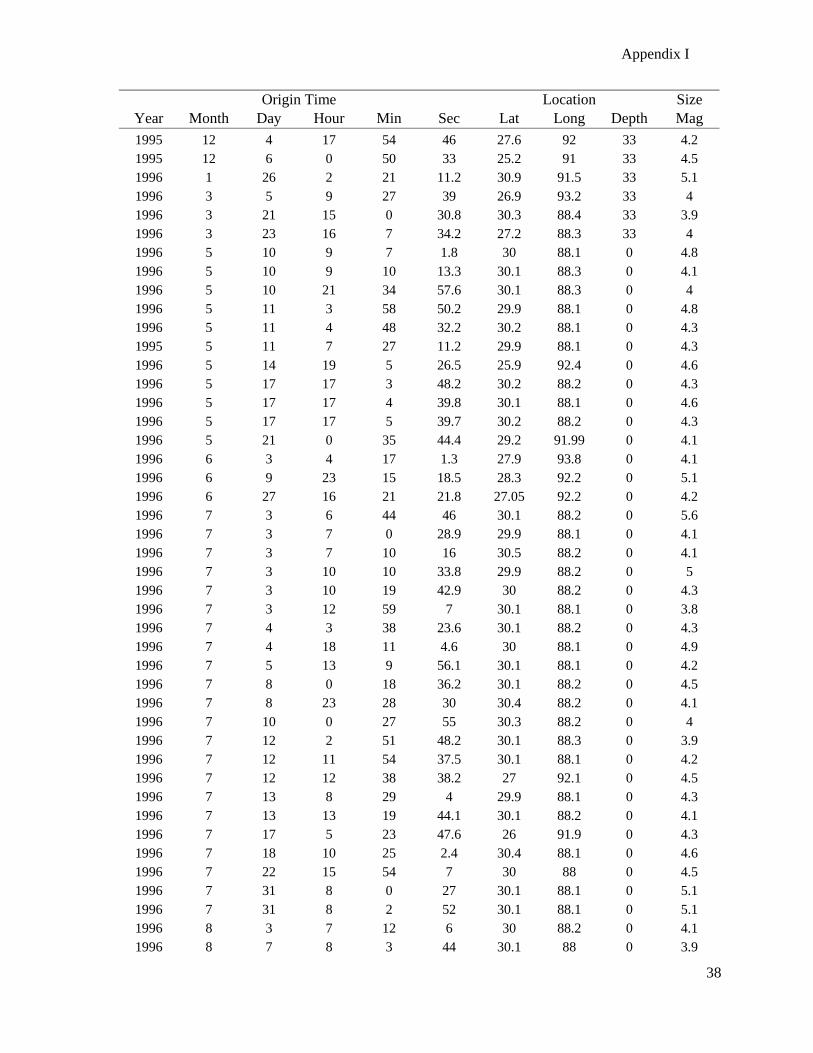
Appendix I
38
Origin Time Location Size Year Month Day Hour Min Sec Lat Long Depth Mag 1995 12 4 17 54 46 27.6 92 33 4.2 1995 12 6 0 50 33 25.2 91 33 4.5 1996 1 26 2 21 11.2 30.9 91.5 33 5.1 1996 3 5 9 27 39 26.9 93.2 33 4 1996 3 21 15 0 30.8 30.3 88.4 33 3.9 1996 3 23 16 7 34.2 27.2 88.3 33 4 1996 5 10 9 7 1.8 30 88.1 0 4.8 1996 5 10 9 10 13.3 30.1 88.3 0 4.1 1996 5 10 21 34 57.6 30.1 88.3 0 4 1996 5 11 3 58 50.2 29.9 88.1 0 4.8 1996 5 11 4 48 32.2 30.2 88.1 0 4.3 1995 5 11 7 27 11.2 29.9 88.1 0 4.3 1996 5 14 19 5 26.5 25.9 92.4 0 4.6 1996 5 17 17 3 48.2 30.2 88.2 0 4.3 1996 5 17 17 4 39.8 30.1 88.1 0 4.6 1996 5 17 17 5 39.7 30.2 88.2 0 4.3 1996 5 21 0 35 44.4 29.2 91.99 0 4.1 1996 6 3 4 17 1.3 27.9 93.8 0 4.1 1996 6 9 23 15 18.5 28.3 92.2 0 5.1 1996 6 27 16 21 21.8 27.05 92.2 0 4.2 1996 7 3 6 44 46 30.1 88.2 0 5.6 1996 7 3 7 0 28.9 29.9 88.1 0 4.1 1996 7 3 7 10 16 30.5 88.2 0 4.1 1996 7 3 10 10 33.8 29.9 88.2 0 5 1996 7 3 10 19 42.9 30 88.2 0 4.3 1996 7 3 12 59 7 30.1 88.1 0 3.8 1996 7 4 3 38 23.6 30.1 88.2 0 4.3 1996 7 4 18 11 4.6 30 88.1 0 4.9 1996 7 5 13 9 56.1 30.1 88.1 0 4.2 1996 7 8 0 18 36.2 30.1 88.2 0 4.5 1996 7 8 23 28 30 30.4 88.2 0 4.1 1996 7 10 0 27 55 30.3 88.2 0 4 1996 7 12 2 51 48.2 30.1 88.3 0 3.9 1996 7 12 11 54 37.5 30.1 88.1 0 4.2 1996 7 12 12 38 38.2 27 92.1 0 4.5 1996 7 13 8 29 4 29.9 88.1 0 4.3 1996 7 13 13 19 44.1 30.1 88.2 0 4.1 1996 7 17 5 23 47.6 26 91.9 0 4.3 1996 7 18 10 25 2.4 30.4 88.1 0 4.6 1996 7 22 15 54 7 30 88 0 4.5 1996 7 31 8 0 27 30.1 88.1 0 5.1 1996 7 31 8 2 52 30.1 88.1 0 5.1 1996 8 3 7 12 6 30 88.2 0 4.1 1996 8 7 8 3 44 30.1 88 0 3.9
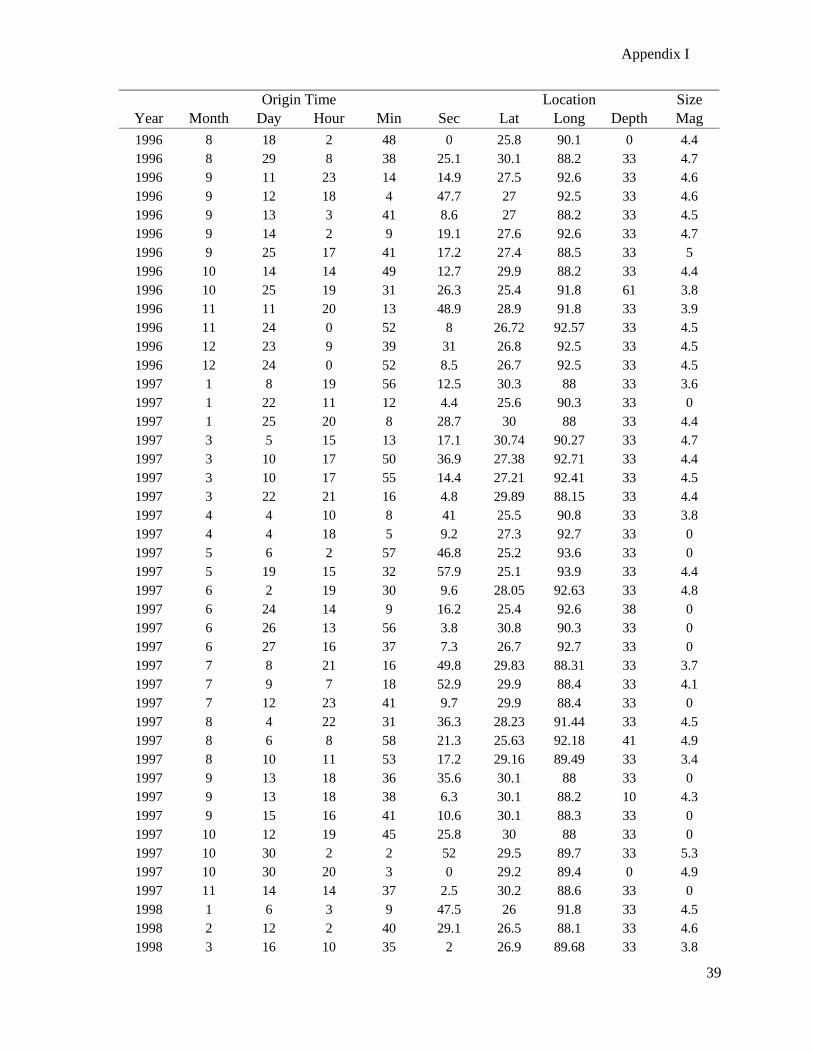
Appendix I
39
Origin Time Location Size Year Month Day Hour Min Sec Lat Long Depth Mag 1996 8 18 2 48 0 25.8 90.1 0 4.4 1996 8 29 8 38 25.1 30.1 88.2 33 4.7 1996 9 11 23 14 14.9 27.5 92.6 33 4.6 1996 9 12 18 4 47.7 27 92.5 33 4.6 1996 9 13 3 41 8.6 27 88.2 33 4.5 1996 9 14 2 9 19.1 27.6 92.6 33 4.7 1996 9 25 17 41 17.2 27.4 88.5 33 5 1996 10 14 14 49 12.7 29.9 88.2 33 4.4 1996 10 25 19 31 26.3 25.4 91.8 61 3.8 1996 11 11 20 13 48.9 28.9 91.8 33 3.9 1996 11 24 0 52 8 26.72 92.57 33 4.5 1996 12 23 9 39 31 26.8 92.5 33 4.5 1996 12 24 0 52 8.5 26.7 92.5 33 4.5 1997 1 8 19 56 12.5 30.3 88 33 3.6 1997 1 22 11 12 4.4 25.6 90.3 33 0 1997 1 25 20 8 28.7 30 88 33 4.4 1997 3 5 15 13 17.1 30.74 90.27 33 4.7 1997 3 10 17 50 36.9 27.38 92.71 33 4.4 1997 3 10 17 55 14.4 27.21 92.41 33 4.5 1997 3 22 21 16 4.8 29.89 88.15 33 4.4 1997 4 4 10 8 41 25.5 90.8 33 3.8 1997 4 4 18 5 9.2 27.3 92.7 33 0 1997 5 6 2 57 46.8 25.2 93.6 33 0 1997 5 19 15 32 57.9 25.1 93.9 33 4.4 1997 6 2 19 30 9.6 28.05 92.63 33 4.8 1997 6 24 14 9 16.2 25.4 92.6 38 0 1997 6 26 13 56 3.8 30.8 90.3 33 0 1997 6 27 16 37 7.3 26.7 92.7 33 0 1997 7 8 21 16 49.8 29.83 88.31 33 3.7 1997 7 9 7 18 52.9 29.9 88.4 33 4.1 1997 7 12 23 41 9.7 29.9 88.4 33 0 1997 8 4 22 31 36.3 28.23 91.44 33 4.5 1997 8 6 8 58 21.3 25.63 92.18 41 4.9 1997 8 10 11 53 17.2 29.16 89.49 33 3.4 1997 9 13 18 36 35.6 30.1 88 33 0 1997 9 13 18 38 6.3 30.1 88.2 10 4.3 1997 9 15 16 41 10.6 30.1 88.3 33 0 1997 10 12 19 45 25.8 30 88 33 0 1997 10 30 2 2 52 29.5 89.7 33 5.3 1997 10 30 20 3 0 29.2 89.4 0 4.9 1997 11 14 14 37 2.5 30.2 88.6 33 0 1998 1 6 3 9 47.5 26 91.8 33 4.5 1998 2 12 2 40 29.1 26.5 88.1 33 4.6 1998 3 16 10 35 2 26.9 89.68 33 3.8
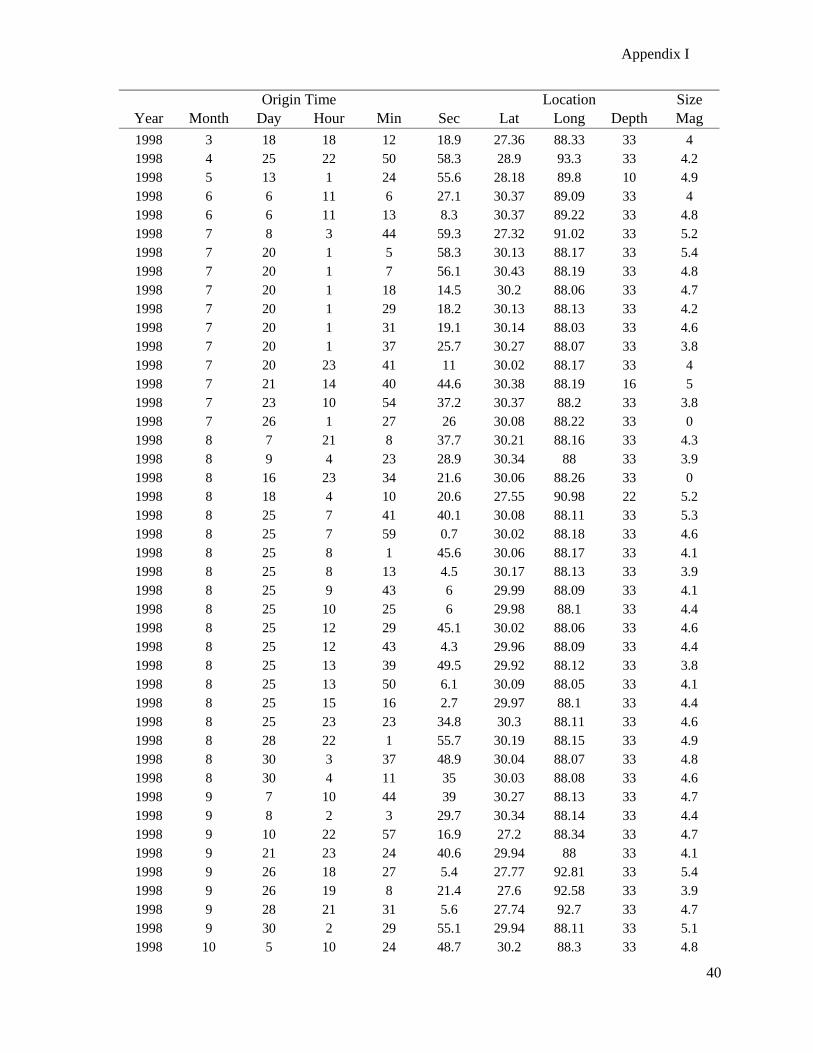
Appendix I
40
Origin Time Location Size Year Month Day Hour Min Sec Lat Long Depth Mag 1998 3 18 18 12 18.9 27.36 88.33 33 4 1998 4 25 22 50 58.3 28.9 93.3 33 4.2 1998 5 13 1 24 55.6 28.18 89.8 10 4.9 1998 6 6 11 6 27.1 30.37 89.09 33 4 1998 6 6 11 13 8.3 30.37 89.22 33 4.8 1998 7 8 3 44 59.3 27.32 91.02 33 5.2 1998 7 20 1 5 58.3 30.13 88.17 33 5.4 1998 7 20 1 7 56.1 30.43 88.19 33 4.8 1998 7 20 1 18 14.5 30.2 88.06 33 4.7 1998 7 20 1 29 18.2 30.13 88.13 33 4.2 1998 7 20 1 31 19.1 30.14 88.03 33 4.6 1998 7 20 1 37 25.7 30.27 88.07 33 3.8 1998 7 20 23 41 11 30.02 88.17 33 4 1998 7 21 14 40 44.6 30.38 88.19 16 5 1998 7 23 10 54 37.2 30.37 88.2 33 3.8 1998 7 26 1 27 26 30.08 88.22 33 0 1998 8 7 21 8 37.7 30.21 88.16 33 4.3 1998 8 9 4 23 28.9 30.34 88 33 3.9 1998 8 16 23 34 21.6 30.06 88.26 33 0 1998 8 18 4 10 20.6 27.55 90.98 22 5.2 1998 8 25 7 41 40.1 30.08 88.11 33 5.3 1998 8 25 7 59 0.7 30.02 88.18 33 4.6 1998 8 25 8 1 45.6 30.06 88.17 33 4.1 1998 8 25 8 13 4.5 30.17 88.13 33 3.9 1998 8 25 9 43 6 29.99 88.09 33 4.1 1998 8 25 10 25 6 29.98 88.1 33 4.4 1998 8 25 12 29 45.1 30.02 88.06 33 4.6 1998 8 25 12 43 4.3 29.96 88.09 33 4.4 1998 8 25 13 39 49.5 29.92 88.12 33 3.8 1998 8 25 13 50 6.1 30.09 88.05 33 4.1 1998 8 25 15 16 2.7 29.97 88.1 33 4.4 1998 8 25 23 23 34.8 30.3 88.11 33 4.6 1998 8 28 22 1 55.7 30.19 88.15 33 4.9 1998 8 30 3 37 48.9 30.04 88.07 33 4.8 1998 8 30 4 11 35 30.03 88.08 33 4.6 1998 9 7 10 44 39 30.27 88.13 33 4.7 1998 9 8 2 3 29.7 30.34 88.14 33 4.4 1998 9 10 22 57 16.9 27.2 88.34 33 4.7 1998 9 21 23 24 40.6 29.94 88 33 4.1 1998 9 26 18 27 5.4 27.77 92.81 33 5.4 1998 9 26 19 8 21.4 27.6 92.58 33 3.9 1998 9 28 21 31 5.6 27.74 92.7 33 4.7 1998 9 30 2 29 55.1 29.94 88.11 33 5.1 1998 10 5 10 24 48.7 30.2 88.3 33 4.8
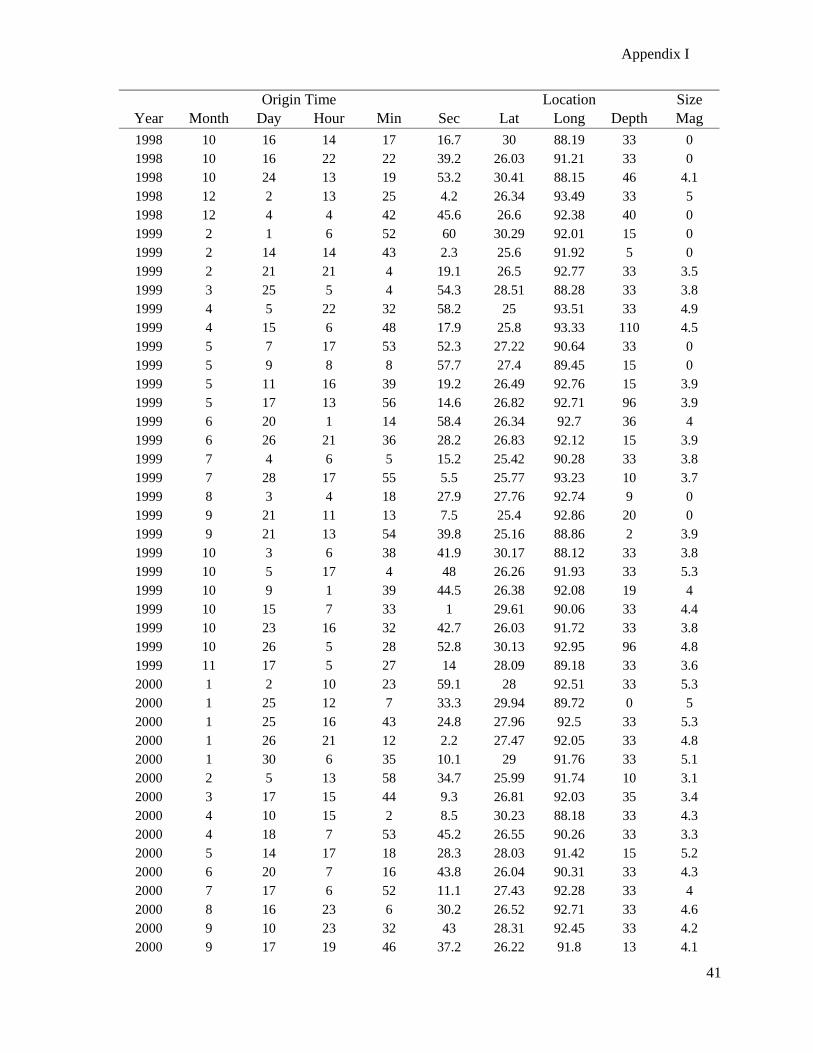
Appendix I
41
Origin Time Location Size Year Month Day Hour Min Sec Lat Long Depth Mag 1998 10 16 14 17 16.7 30 88.19 33 0 1998 10 16 22 22 39.2 26.03 91.21 33 0 1998 10 24 13 19 53.2 30.41 88.15 46 4.1 1998 12 2 13 25 4.2 26.34 93.49 33 5 1998 12 4 4 42 45.6 26.6 92.38 40 0 1999 2 1 6 52 60 30.29 92.01 15 0 1999 2 14 14 43 2.3 25.6 91.92 5 0 1999 2 21 21 4 19.1 26.5 92.77 33 3.5 1999 3 25 5 4 54.3 28.51 88.28 33 3.8 1999 4 5 22 32 58.2 25 93.51 33 4.9 1999 4 15 6 48 17.9 25.8 93.33 110 4.5 1999 5 7 17 53 52.3 27.22 90.64 33 0 1999 5 9 8 8 57.7 27.4 89.45 15 0 1999 5 11 16 39 19.2 26.49 92.76 15 3.9 1999 5 17 13 56 14.6 26.82 92.71 96 3.9 1999 6 20 1 14 58.4 26.34 92.7 36 4 1999 6 26 21 36 28.2 26.83 92.12 15 3.9 1999 7 4 6 5 15.2 25.42 90.28 33 3.8 1999 7 28 17 55 5.5 25.77 93.23 10 3.7 1999 8 3 4 18 27.9 27.76 92.74 9 0 1999 9 21 11 13 7.5 25.4 92.86 20 0 1999 9 21 13 54 39.8 25.16 88.86 2 3.9 1999 10 3 6 38 41.9 30.17 88.12 33 3.8 1999 10 5 17 4 48 26.26 91.93 33 5.3 1999 10 9 1 39 44.5 26.38 92.08 19 4 1999 10 15 7 33 1 29.61 90.06 33 4.4 1999 10 23 16 32 42.7 26.03 91.72 33 3.8 1999 10 26 5 28 52.8 30.13 92.95 96 4.8 1999 11 17 5 27 14 28.09 89.18 33 3.6 2000 1 2 10 23 59.1 28 92.51 33 5.3 2000 1 25 12 7 33.3 29.94 89.72 0 5 2000 1 25 16 43 24.8 27.96 92.5 33 5.3 2000 1 26 21 12 2.2 27.47 92.05 33 4.8 2000 1 30 6 35 10.1 29 91.76 33 5.1 2000 2 5 13 58 34.7 25.99 91.74 10 3.1 2000 3 17 15 44 9.3 26.81 92.03 35 3.4 2000 4 10 15 2 8.5 30.23 88.18 33 4.3 2000 4 18 7 53 45.2 26.55 90.26 33 3.3 2000 5 14 17 18 28.3 28.03 91.42 15 5.2 2000 6 20 7 16 43.8 26.04 90.31 33 4.3 2000 7 17 6 52 11.1 27.43 92.28 33 4 2000 8 16 23 6 30.2 26.52 92.71 33 4.6 2000 9 10 23 32 43 28.31 92.45 33 4.2 2000 9 17 19 46 37.2 26.22 91.8 13 4.1
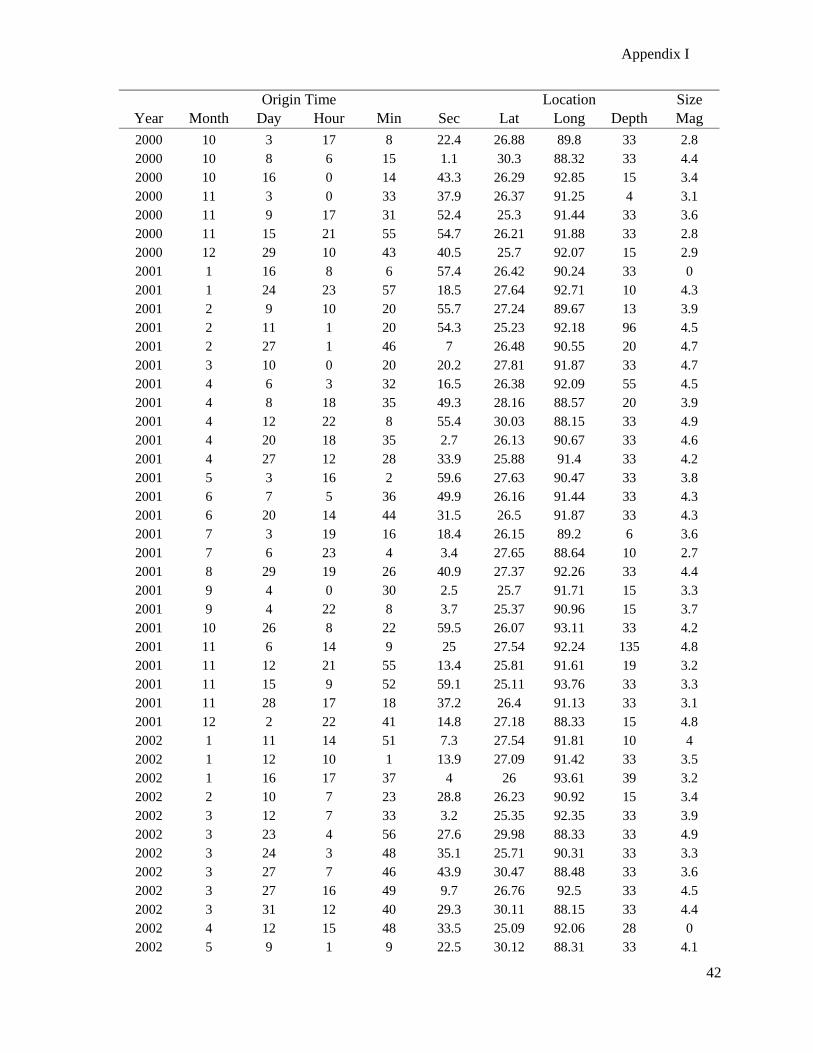
Appendix I
42
Origin Time Location Size Year Month Day Hour Min Sec Lat Long Depth Mag 2000 10 3 17 8 22.4 26.88 89.8 33 2.8 2000 10 8 6 15 1.1 30.3 88.32 33 4.4 2000 10 16 0 14 43.3 26.29 92.85 15 3.4 2000 11 3 0 33 37.9 26.37 91.25 4 3.1 2000 11 9 17 31 52.4 25.3 91.44 33 3.6 2000 11 15 21 55 54.7 26.21 91.88 33 2.8 2000 12 29 10 43 40.5 25.7 92.07 15 2.9 2001 1 16 8 6 57.4 26.42 90.24 33 0 2001 1 24 23 57 18.5 27.64 92.71 10 4.3 2001 2 9 10 20 55.7 27.24 89.67 13 3.9 2001 2 11 1 20 54.3 25.23 92.18 96 4.5 2001 2 27 1 46 7 26.48 90.55 20 4.7 2001 3 10 0 20 20.2 27.81 91.87 33 4.7 2001 4 6 3 32 16.5 26.38 92.09 55 4.5 2001 4 8 18 35 49.3 28.16 88.57 20 3.9 2001 4 12 22 8 55.4 30.03 88.15 33 4.9 2001 4 20 18 35 2.7 26.13 90.67 33 4.6 2001 4 27 12 28 33.9 25.88 91.4 33 4.2 2001 5 3 16 2 59.6 27.63 90.47 33 3.8 2001 6 7 5 36 49.9 26.16 91.44 33 4.3 2001 6 20 14 44 31.5 26.5 91.87 33 4.3 2001 7 3 19 16 18.4 26.15 89.2 6 3.6 2001 7 6 23 4 3.4 27.65 88.64 10 2.7 2001 8 29 19 26 40.9 27.37 92.26 33 4.4 2001 9 4 0 30 2.5 25.7 91.71 15 3.3 2001 9 4 22 8 3.7 25.37 90.96 15 3.7 2001 10 26 8 22 59.5 26.07 93.11 33 4.2 2001 11 6 14 9 25 27.54 92.24 135 4.8 2001 11 12 21 55 13.4 25.81 91.61 19 3.2 2001 11 15 9 52 59.1 25.11 93.76 33 3.3 2001 11 28 17 18 37.2 26.4 91.13 33 3.1 2001 12 2 22 41 14.8 27.18 88.33 15 4.8 2002 1 11 14 51 7.3 27.54 91.81 10 4 2002 1 12 10 1 13.9 27.09 91.42 33 3.5 2002 1 16 17 37 4 26 93.61 39 3.2 2002 2 10 7 23 28.8 26.23 90.92 15 3.4 2002 3 12 7 33 3.2 25.35 92.35 33 3.9 2002 3 23 4 56 27.6 29.98 88.33 33 4.9 2002 3 24 3 48 35.1 25.71 90.31 33 3.3 2002 3 27 7 46 43.9 30.47 88.48 33 3.6 2002 3 27 16 49 9.7 26.76 92.5 33 4.5 2002 3 31 12 40 29.3 30.11 88.15 33 4.4 2002 4 12 15 48 33.5 25.09 92.06 28 0 2002 5 9 1 9 22.5 30.12 88.31 33 4.1
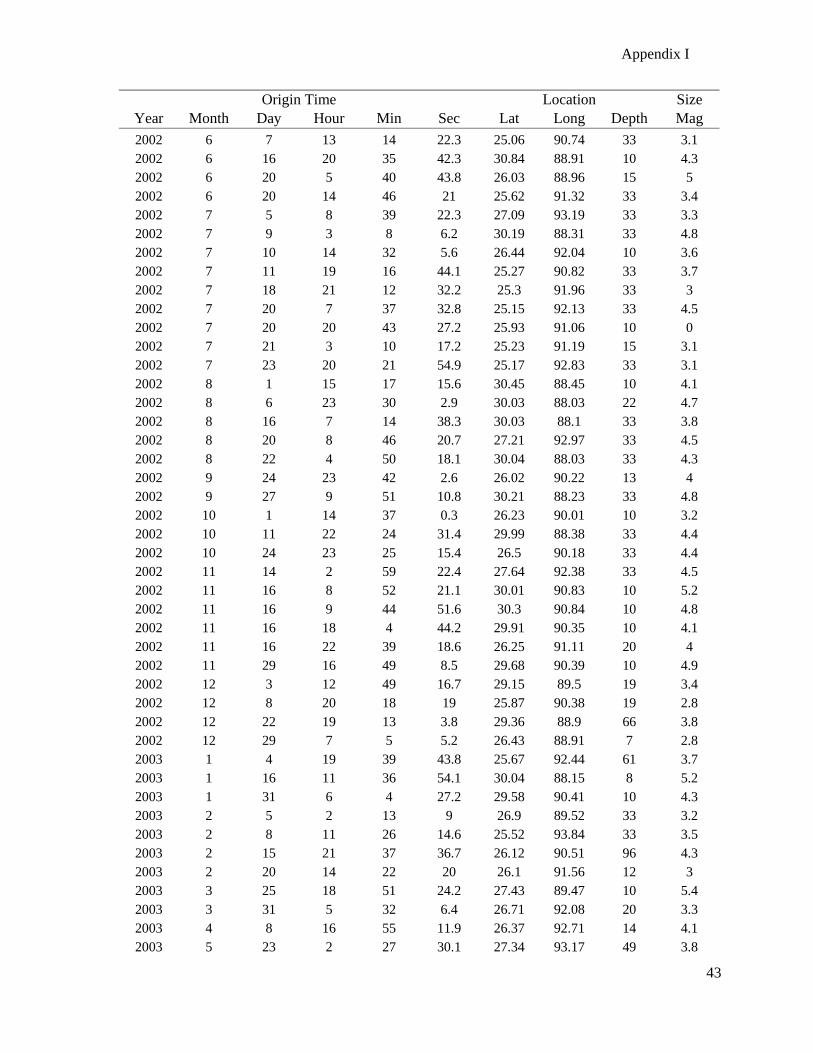
Appendix I
43
Origin Time Location Size Year Month Day Hour Min Sec Lat Long Depth Mag 2002 6 7 13 14 22.3 25.06 90.74 33 3.1 2002 6 16 20 35 42.3 30.84 88.91 10 4.3 2002 6 20 5 40 43.8 26.03 88.96 15 5 2002 6 20 14 46 21 25.62 91.32 33 3.4 2002 7 5 8 39 22.3 27.09 93.19 33 3.3 2002 7 9 3 8 6.2 30.19 88.31 33 4.8 2002 7 10 14 32 5.6 26.44 92.04 10 3.6 2002 7 11 19 16 44.1 25.27 90.82 33 3.7 2002 7 18 21 12 32.2 25.3 91.96 33 3 2002 7 20 7 37 32.8 25.15 92.13 33 4.5 2002 7 20 20 43 27.2 25.93 91.06 10 0 2002 7 21 3 10 17.2 25.23 91.19 15 3.1 2002 7 23 20 21 54.9 25.17 92.83 33 3.1 2002 8 1 15 17 15.6 30.45 88.45 10 4.1 2002 8 6 23 30 2.9 30.03 88.03 22 4.7 2002 8 16 7 14 38.3 30.03 88.1 33 3.8 2002 8 20 8 46 20.7 27.21 92.97 33 4.5 2002 8 22 4 50 18.1 30.04 88.03 33 4.3 2002 9 24 23 42 2.6 26.02 90.22 13 4 2002 9 27 9 51 10.8 30.21 88.23 33 4.8 2002 10 1 14 37 0.3 26.23 90.01 10 3.2 2002 10 11 22 24 31.4 29.99 88.38 33 4.4 2002 10 24 23 25 15.4 26.5 90.18 33 4.4 2002 11 14 2 59 22.4 27.64 92.38 33 4.5 2002 11 16 8 52 21.1 30.01 90.83 10 5.2 2002 11 16 9 44 51.6 30.3 90.84 10 4.8 2002 11 16 18 4 44.2 29.91 90.35 10 4.1 2002 11 16 22 39 18.6 26.25 91.11 20 4 2002 11 29 16 49 8.5 29.68 90.39 10 4.9 2002 12 3 12 49 16.7 29.15 89.5 19 3.4 2002 12 8 20 18 19 25.87 90.38 19 2.8 2002 12 22 19 13 3.8 29.36 88.9 66 3.8 2002 12 29 7 5 5.2 26.43 88.91 7 2.8 2003 1 4 19 39 43.8 25.67 92.44 61 3.7 2003 1 16 11 36 54.1 30.04 88.15 8 5.2 2003 1 31 6 4 27.2 29.58 90.41 10 4.3 2003 2 5 2 13 9 26.9 89.52 33 3.2 2003 2 8 11 26 14.6 25.52 93.84 33 3.5 2003 2 15 21 37 36.7 26.12 90.51 96 4.3 2003 2 20 14 22 20 26.1 91.56 12 3 2003 3 25 18 51 24.2 27.43 89.47 10 5.4 2003 3 31 5 32 6.4 26.71 92.08 20 3.3 2003 4 8 16 55 11.9 26.37 92.71 14 4.1 2003 5 23 2 27 30.1 27.34 93.17 49 3.8
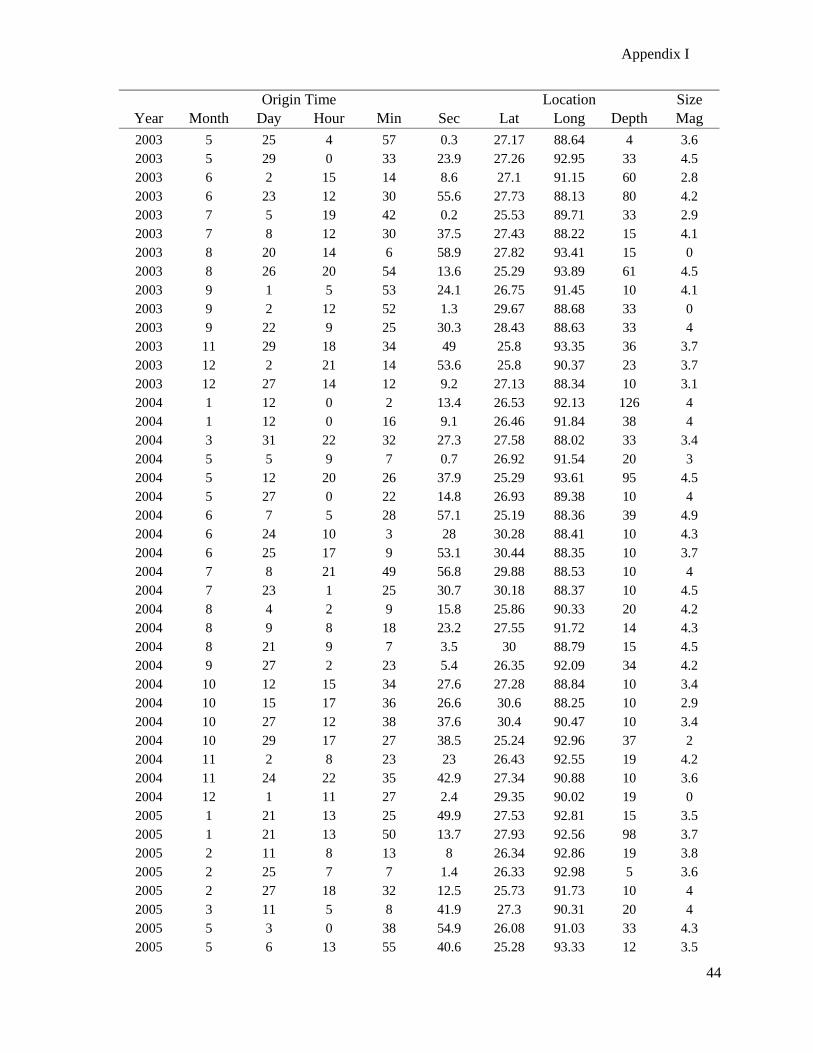
Appendix I
44
Origin Time Location Size Year Month Day Hour Min Sec Lat Long Depth Mag 2003 5 25 4 57 0.3 27.17 88.64 4 3.6 2003 5 29 0 33 23.9 27.26 92.95 33 4.5 2003 6 2 15 14 8.6 27.1 91.15 60 2.8 2003 6 23 12 30 55.6 27.73 88.13 80 4.2 2003 7 5 19 42 0.2 25.53 89.71 33 2.9 2003 7 8 12 30 37.5 27.43 88.22 15 4.1 2003 8 20 14 6 58.9 27.82 93.41 15 0 2003 8 26 20 54 13.6 25.29 93.89 61 4.5 2003 9 1 5 53 24.1 26.75 91.45 10 4.1 2003 9 2 12 52 1.3 29.67 88.68 33 0 2003 9 22 9 25 30.3 28.43 88.63 33 4 2003 11 29 18 34 49 25.8 93.35 36 3.7 2003 12 2 21 14 53.6 25.8 90.37 23 3.7 2003 12 27 14 12 9.2 27.13 88.34 10 3.1 2004 1 12 0 2 13.4 26.53 92.13 126 4 2004 1 12 0 16 9.1 26.46 91.84 38 4 2004 3 31 22 32 27.3 27.58 88.02 33 3.4 2004 5 5 9 7 0.7 26.92 91.54 20 3 2004 5 12 20 26 37.9 25.29 93.61 95 4.5 2004 5 27 0 22 14.8 26.93 89.38 10 4 2004 6 7 5 28 57.1 25.19 88.36 39 4.9 2004 6 24 10 3 28 30.28 88.41 10 4.3 2004 6 25 17 9 53.1 30.44 88.35 10 3.7 2004 7 8 21 49 56.8 29.88 88.53 10 4 2004 7 23 1 25 30.7 30.18 88.37 10 4.5 2004 8 4 2 9 15.8 25.86 90.33 20 4.2 2004 8 9 8 18 23.2 27.55 91.72 14 4.3 2004 8 21 9 7 3.5 30 88.79 15 4.5 2004 9 27 2 23 5.4 26.35 92.09 34 4.2 2004 10 12 15 34 27.6 27.28 88.84 10 3.4 2004 10 15 17 36 26.6 30.6 88.25 10 2.9 2004 10 27 12 38 37.6 30.4 90.47 10 3.4 2004 10 29 17 27 38.5 25.24 92.96 37 2 2004 11 2 8 23 23 26.43 92.55 19 4.2 2004 11 24 22 35 42.9 27.34 90.88 10 3.6 2004 12 1 11 27 2.4 29.35 90.02 19 0 2005 1 21 13 25 49.9 27.53 92.81 15 3.5 2005 1 21 13 50 13.7 27.93 92.56 98 3.7 2005 2 11 8 13 8 26.34 92.86 19 3.8 2005 2 25 7 7 1.4 26.33 92.98 5 3.6 2005 2 27 18 32 12.5 25.73 91.73 10 4 2005 3 11 5 8 41.9 27.3 90.31 20 4 2005 5 3 0 38 54.9 26.08 91.03 33 4.3 2005 5 6 13 55 40.6 25.28 93.33 12 3.5
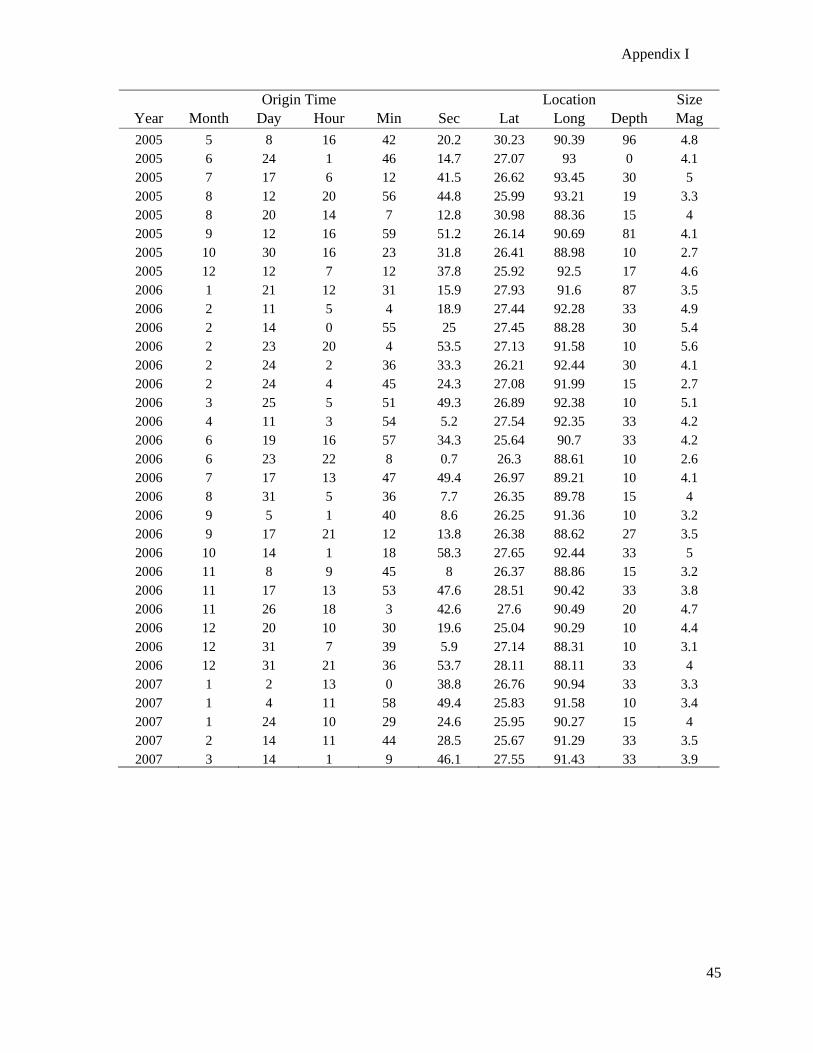
Appendix I
45
Origin Time Location Size Year Month Day Hour Min Sec Lat Long Depth Mag 2005 5 8 16 42 20.2 30.23 90.39 96 4.8 2005 6 24 1 46 14.7 27.07 93 0 4.1 2005 7 17 6 12 41.5 26.62 93.45 30 5 2005 8 12 20 56 44.8 25.99 93.21 19 3.3 2005 8 20 14 7 12.8 30.98 88.36 15 4 2005 9 12 16 59 51.2 26.14 90.69 81 4.1 2005 10 30 16 23 31.8 26.41 88.98 10 2.7 2005 12 12 7 12 37.8 25.92 92.5 17 4.6 2006 1 21 12 31 15.9 27.93 91.6 87 3.5 2006 2 11 5 4 18.9 27.44 92.28 33 4.9 2006 2 14 0 55 25 27.45 88.28 30 5.4 2006 2 23 20 4 53.5 27.13 91.58 10 5.6 2006 2 24 2 36 33.3 26.21 92.44 30 4.1 2006 2 24 4 45 24.3 27.08 91.99 15 2.7 2006 3 25 5 51 49.3 26.89 92.38 10 5.1 2006 4 11 3 54 5.2 27.54 92.35 33 4.2 2006 6 19 16 57 34.3 25.64 90.7 33 4.2 2006 6 23 22 8 0.7 26.3 88.61 10 2.6 2006 7 17 13 47 49.4 26.97 89.21 10 4.1 2006 8 31 5 36 7.7 26.35 89.78 15 4 2006 9 5 1 40 8.6 26.25 91.36 10 3.2 2006 9 17 21 12 13.8 26.38 88.62 27 3.5 2006 10 14 1 18 58.3 27.65 92.44 33 5 2006 11 8 9 45 8 26.37 88.86 15 3.2 2006 11 17 13 53 47.6 28.51 90.42 33 3.8 2006 11 26 18 3 42.6 27.6 90.49 20 4.7 2006 12 20 10 30 19.6 25.04 90.29 10 4.4 2006 12 31 7 39 5.9 27.14 88.31 10 3.1 2006 12 31 21 36 53.7 28.11 88.11 33 4 2007 1 2 13 0 38.8 26.76 90.94 33 3.3 2007 1 4 11 58 49.4 25.83 91.58 10 3.4 2007 1 24 10 29 24.6 25.95 90.27 15 4 2007 2 14 11 44 28.5 25.67 91.29 33 3.5 2007 3 14 1 9 46.1 27.55 91.43 33 3.9
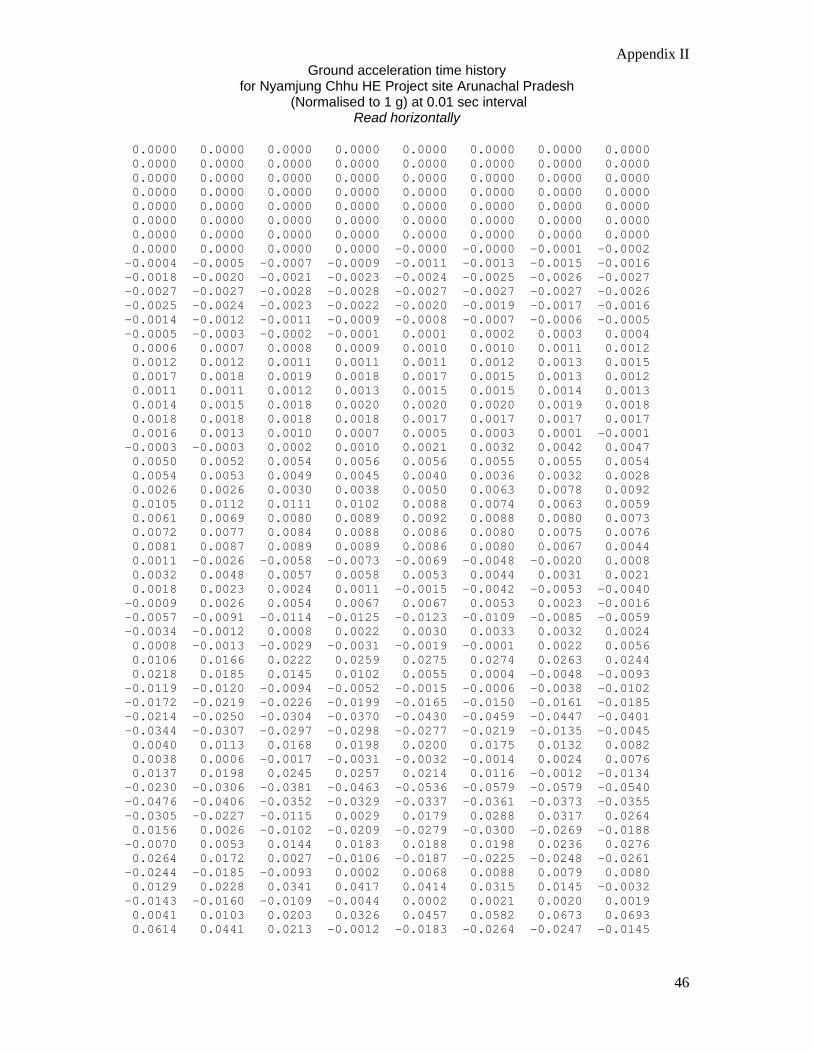
Appendix II Ground acceleration time history
for Nyamjung Chhu HE Project site Arunachal Pradesh (Normalised to 1 g) at 0.01 sec interval
Read horizontally
46
0.0000 0.0000 0.0000 0.0000 0.0000 0.0000 0.0000 0.0000 0.0000 0.0000 0.0000 0.0000 0.0000 0.0000 0.0000 0.0000 0.0000 0.0000 0.0000 0.0000 0.0000 0.0000 0.0000 0.0000 0.0000 0.0000 0.0000 0.0000 0.0000 0.0000 0.0000 0.0000 0.0000 0.0000 0.0000 0.0000 0.0000 0.0000 0.0000 0.0000 0.0000 0.0000 0.0000 0.0000 0.0000 0.0000 0.0000 0.0000 0.0000 0.0000 0.0000 0.0000 0.0000 0.0000 0.0000 0.0000 0.0000 0.0000 0.0000 0.0000 -0.0000 -0.0000 -0.0001 -0.0002 -0.0004 -0.0005 -0.0007 -0.0009 -0.0011 -0.0013 -0.0015 -0.0016 -0.0018 -0.0020 -0.0021 -0.0023 -0.0024 -0.0025 -0.0026 -0.0027 -0.0027 -0.0027 -0.0028 -0.0028 -0.0027 -0.0027 -0.0027 -0.0026 -0.0025 -0.0024 -0.0023 -0.0022 -0.0020 -0.0019 -0.0017 -0.0016 -0.0014 -0.0012 -0.0011 -0.0009 -0.0008 -0.0007 -0.0006 -0.0005 -0.0005 -0.0003 -0.0002 -0.0001 0.0001 0.0002 0.0003 0.0004 0.0006 0.0007 0.0008 0.0009 0.0010 0.0010 0.0011 0.0012 0.0012 0.0012 0.0011 0.0011 0.0011 0.0012 0.0013 0.0015 0.0017 0.0018 0.0019 0.0018 0.0017 0.0015 0.0013 0.0012 0.0011 0.0011 0.0012 0.0013 0.0015 0.0015 0.0014 0.0013 0.0014 0.0015 0.0018 0.0020 0.0020 0.0020 0.0019 0.0018 0.0018 0.0018 0.0018 0.0018 0.0017 0.0017 0.0017 0.0017 0.0016 0.0013 0.0010 0.0007 0.0005 0.0003 0.0001 -0.0001 -0.0003 -0.0003 0.0002 0.0010 0.0021 0.0032 0.0042 0.0047 0.0050 0.0052 0.0054 0.0056 0.0056 0.0055 0.0055 0.0054 0.0054 0.0053 0.0049 0.0045 0.0040 0.0036 0.0032 0.0028 0.0026 0.0026 0.0030 0.0038 0.0050 0.0063 0.0078 0.0092 0.0105 0.0112 0.0111 0.0102 0.0088 0.0074 0.0063 0.0059 0.0061 0.0069 0.0080 0.0089 0.0092 0.0088 0.0080 0.0073 0.0072 0.0077 0.0084 0.0088 0.0086 0.0080 0.0075 0.0076 0.0081 0.0087 0.0089 0.0089 0.0086 0.0080 0.0067 0.0044 0.0011 -0.0026 -0.0058 -0.0073 -0.0069 -0.0048 -0.0020 0.0008 0.0032 0.0048 0.0057 0.0058 0.0053 0.0044 0.0031 0.0021 0.0018 0.0023 0.0024 0.0011 -0.0015 -0.0042 -0.0053 -0.0040 -0.0009 0.0026 0.0054 0.0067 0.0067 0.0053 0.0023 -0.0016 -0.0057 -0.0091 -0.0114 -0.0125 -0.0123 -0.0109 -0.0085 -0.0059 -0.0034 -0.0012 0.0008 0.0022 0.0030 0.0033 0.0032 0.0024 0.0008 -0.0013 -0.0029 -0.0031 -0.0019 -0.0001 0.0022 0.0056 0.0106 0.0166 0.0222 0.0259 0.0275 0.0274 0.0263 0.0244 0.0218 0.0185 0.0145 0.0102 0.0055 0.0004 -0.0048 -0.0093 -0.0119 -0.0120 -0.0094 -0.0052 -0.0015 -0.0006 -0.0038 -0.0102 -0.0172 -0.0219 -0.0226 -0.0199 -0.0165 -0.0150 -0.0161 -0.0185 -0.0214 -0.0250 -0.0304 -0.0370 -0.0430 -0.0459 -0.0447 -0.0401 -0.0344 -0.0307 -0.0297 -0.0298 -0.0277 -0.0219 -0.0135 -0.0045 0.0040 0.0113 0.0168 0.0198 0.0200 0.0175 0.0132 0.0082 0.0038 0.0006 -0.0017 -0.0031 -0.0032 -0.0014 0.0024 0.0076 0.0137 0.0198 0.0245 0.0257 0.0214 0.0116 -0.0012 -0.0134 -0.0230 -0.0306 -0.0381 -0.0463 -0.0536 -0.0579 -0.0579 -0.0540 -0.0476 -0.0406 -0.0352 -0.0329 -0.0337 -0.0361 -0.0373 -0.0355 -0.0305 -0.0227 -0.0115 0.0029 0.0179 0.0288 0.0317 0.0264 0.0156 0.0026 -0.0102 -0.0209 -0.0279 -0.0300 -0.0269 -0.0188 -0.0070 0.0053 0.0144 0.0183 0.0188 0.0198 0.0236 0.0276 0.0264 0.0172 0.0027 -0.0106 -0.0187 -0.0225 -0.0248 -0.0261 -0.0244 -0.0185 -0.0093 0.0002 0.0068 0.0088 0.0079 0.0080 0.0129 0.0228 0.0341 0.0417 0.0414 0.0315 0.0145 -0.0032 -0.0143 -0.0160 -0.0109 -0.0044 0.0002 0.0021 0.0020 0.0019 0.0041 0.0103 0.0203 0.0326 0.0457 0.0582 0.0673 0.0693 0.0614 0.0441 0.0213 -0.0012 -0.0183 -0.0264 -0.0247 -0.0145
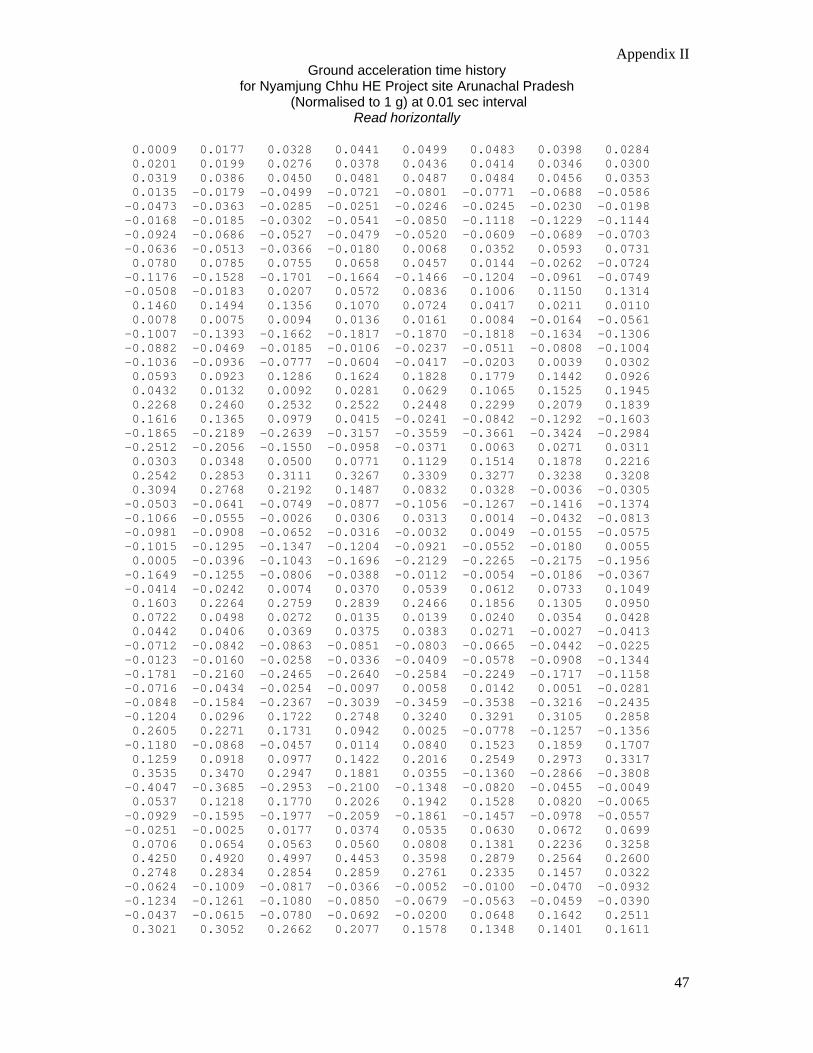
Appendix II Ground acceleration time history
for Nyamjung Chhu HE Project site Arunachal Pradesh (Normalised to 1 g) at 0.01 sec interval
Read horizontally
47
0.0009 0.0177 0.0328 0.0441 0.0499 0.0483 0.0398 0.0284 0.0201 0.0199 0.0276 0.0378 0.0436 0.0414 0.0346 0.0300 0.0319 0.0386 0.0450 0.0481 0.0487 0.0484 0.0456 0.0353 0.0135 -0.0179 -0.0499 -0.0721 -0.0801 -0.0771 -0.0688 -0.0586 -0.0473 -0.0363 -0.0285 -0.0251 -0.0246 -0.0245 -0.0230 -0.0198 -0.0168 -0.0185 -0.0302 -0.0541 -0.0850 -0.1118 -0.1229 -0.1144 -0.0924 -0.0686 -0.0527 -0.0479 -0.0520 -0.0609 -0.0689 -0.0703 -0.0636 -0.0513 -0.0366 -0.0180 0.0068 0.0352 0.0593 0.0731 0.0780 0.0785 0.0755 0.0658 0.0457 0.0144 -0.0262 -0.0724 -0.1176 -0.1528 -0.1701 -0.1664 -0.1466 -0.1204 -0.0961 -0.0749 -0.0508 -0.0183 0.0207 0.0572 0.0836 0.1006 0.1150 0.1314 0.1460 0.1494 0.1356 0.1070 0.0724 0.0417 0.0211 0.0110 0.0078 0.0075 0.0094 0.0136 0.0161 0.0084 -0.0164 -0.0561 -0.1007 -0.1393 -0.1662 -0.1817 -0.1870 -0.1818 -0.1634 -0.1306 -0.0882 -0.0469 -0.0185 -0.0106 -0.0237 -0.0511 -0.0808 -0.1004 -0.1036 -0.0936 -0.0777 -0.0604 -0.0417 -0.0203 0.0039 0.0302 0.0593 0.0923 0.1286 0.1624 0.1828 0.1779 0.1442 0.0926 0.0432 0.0132 0.0092 0.0281 0.0629 0.1065 0.1525 0.1945 0.2268 0.2460 0.2532 0.2522 0.2448 0.2299 0.2079 0.1839 0.1616 0.1365 0.0979 0.0415 -0.0241 -0.0842 -0.1292 -0.1603 -0.1865 -0.2189 -0.2639 -0.3157 -0.3559 -0.3661 -0.3424 -0.2984 -0.2512 -0.2056 -0.1550 -0.0958 -0.0371 0.0063 0.0271 0.0311 0.0303 0.0348 0.0500 0.0771 0.1129 0.1514 0.1878 0.2216 0.2542 0.2853 0.3111 0.3267 0.3309 0.3277 0.3238 0.3208 0.3094 0.2768 0.2192 0.1487 0.0832 0.0328 -0.0036 -0.0305 -0.0503 -0.0641 -0.0749 -0.0877 -0.1056 -0.1267 -0.1416 -0.1374 -0.1066 -0.0555 -0.0026 0.0306 0.0313 0.0014 -0.0432 -0.0813 -0.0981 -0.0908 -0.0652 -0.0316 -0.0032 0.0049 -0.0155 -0.0575 -0.1015 -0.1295 -0.1347 -0.1204 -0.0921 -0.0552 -0.0180 0.0055 0.0005 -0.0396 -0.1043 -0.1696 -0.2129 -0.2265 -0.2175 -0.1956 -0.1649 -0.1255 -0.0806 -0.0388 -0.0112 -0.0054 -0.0186 -0.0367 -0.0414 -0.0242 0.0074 0.0370 0.0539 0.0612 0.0733 0.1049 0.1603 0.2264 0.2759 0.2839 0.2466 0.1856 0.1305 0.0950 0.0722 0.0498 0.0272 0.0135 0.0139 0.0240 0.0354 0.0428 0.0442 0.0406 0.0369 0.0375 0.0383 0.0271 -0.0027 -0.0413 -0.0712 -0.0842 -0.0863 -0.0851 -0.0803 -0.0665 -0.0442 -0.0225 -0.0123 -0.0160 -0.0258 -0.0336 -0.0409 -0.0578 -0.0908 -0.1344 -0.1781 -0.2160 -0.2465 -0.2640 -0.2584 -0.2249 -0.1717 -0.1158 -0.0716 -0.0434 -0.0254 -0.0097 0.0058 0.0142 0.0051 -0.0281 -0.0848 -0.1584 -0.2367 -0.3039 -0.3459 -0.3538 -0.3216 -0.2435 -0.1204 0.0296 0.1722 0.2748 0.3240 0.3291 0.3105 0.2858 0.2605 0.2271 0.1731 0.0942 0.0025 -0.0778 -0.1257 -0.1356 -0.1180 -0.0868 -0.0457 0.0114 0.0840 0.1523 0.1859 0.1707 0.1259 0.0918 0.0977 0.1422 0.2016 0.2549 0.2973 0.3317 0.3535 0.3470 0.2947 0.1881 0.0355 -0.1360 -0.2866 -0.3808 -0.4047 -0.3685 -0.2953 -0.2100 -0.1348 -0.0820 -0.0455 -0.0049 0.0537 0.1218 0.1770 0.2026 0.1942 0.1528 0.0820 -0.0065 -0.0929 -0.1595 -0.1977 -0.2059 -0.1861 -0.1457 -0.0978 -0.0557 -0.0251 -0.0025 0.0177 0.0374 0.0535 0.0630 0.0672 0.0699 0.0706 0.0654 0.0563 0.0560 0.0808 0.1381 0.2236 0.3258 0.4250 0.4920 0.4997 0.4453 0.3598 0.2879 0.2564 0.2600 0.2748 0.2834 0.2854 0.2859 0.2761 0.2335 0.1457 0.0322 -0.0624 -0.1009 -0.0817 -0.0366 -0.0052 -0.0100 -0.0470 -0.0932 -0.1234 -0.1261 -0.1080 -0.0850 -0.0679 -0.0563 -0.0459 -0.0390 -0.0437 -0.0615 -0.0780 -0.0692 -0.0200 0.0648 0.1642 0.2511 0.3021 0.3052 0.2662 0.2077 0.1578 0.1348 0.1401 0.1611
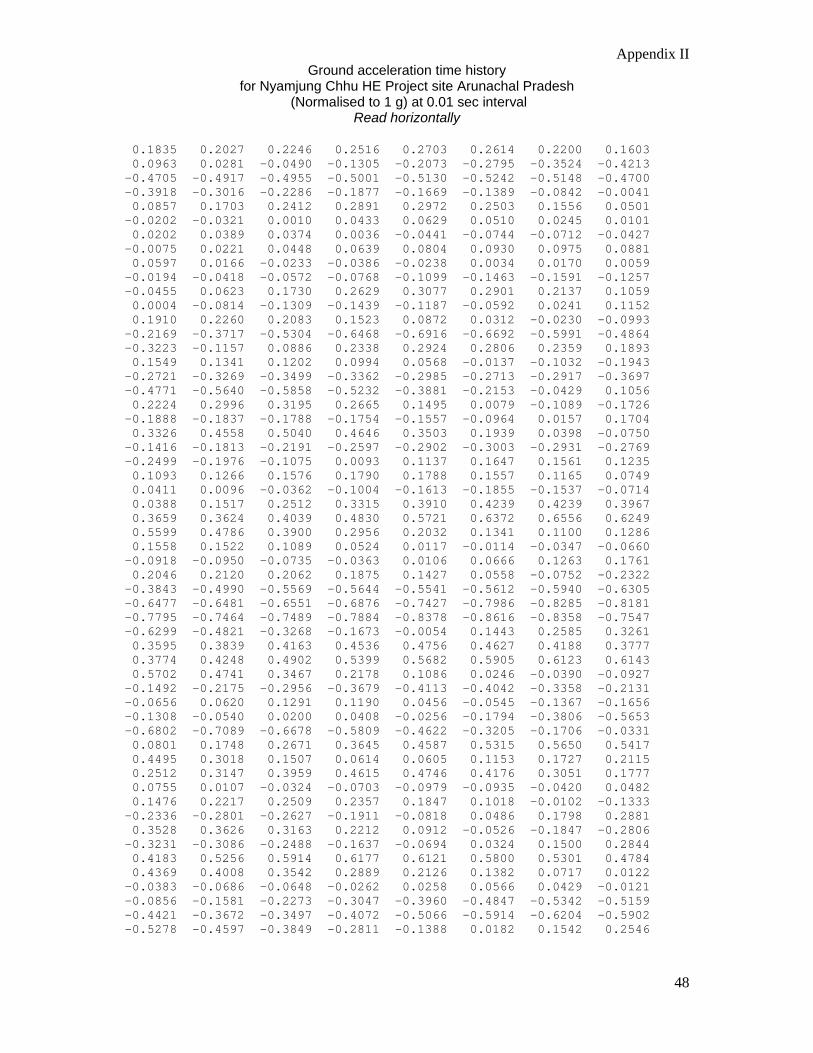
Appendix II Ground acceleration time history
for Nyamjung Chhu HE Project site Arunachal Pradesh (Normalised to 1 g) at 0.01 sec interval
Read horizontally
48
0.1835 0.2027 0.2246 0.2516 0.2703 0.2614 0.2200 0.1603 0.0963 0.0281 -0.0490 -0.1305 -0.2073 -0.2795 -0.3524 -0.4213 -0.4705 -0.4917 -0.4955 -0.5001 -0.5130 -0.5242 -0.5148 -0.4700 -0.3918 -0.3016 -0.2286 -0.1877 -0.1669 -0.1389 -0.0842 -0.0041 0.0857 0.1703 0.2412 0.2891 0.2972 0.2503 0.1556 0.0501 -0.0202 -0.0321 0.0010 0.0433 0.0629 0.0510 0.0245 0.0101 0.0202 0.0389 0.0374 0.0036 -0.0441 -0.0744 -0.0712 -0.0427 -0.0075 0.0221 0.0448 0.0639 0.0804 0.0930 0.0975 0.0881 0.0597 0.0166 -0.0233 -0.0386 -0.0238 0.0034 0.0170 0.0059 -0.0194 -0.0418 -0.0572 -0.0768 -0.1099 -0.1463 -0.1591 -0.1257 -0.0455 0.0623 0.1730 0.2629 0.3077 0.2901 0.2137 0.1059 0.0004 -0.0814 -0.1309 -0.1439 -0.1187 -0.0592 0.0241 0.1152 0.1910 0.2260 0.2083 0.1523 0.0872 0.0312 -0.0230 -0.0993 -0.2169 -0.3717 -0.5304 -0.6468 -0.6916 -0.6692 -0.5991 -0.4864 -0.3223 -0.1157 0.0886 0.2338 0.2924 0.2806 0.2359 0.1893 0.1549 0.1341 0.1202 0.0994 0.0568 -0.0137 -0.1032 -0.1943 -0.2721 -0.3269 -0.3499 -0.3362 -0.2985 -0.2713 -0.2917 -0.3697 -0.4771 -0.5640 -0.5858 -0.5232 -0.3881 -0.2153 -0.0429 0.1056 0.2224 0.2996 0.3195 0.2665 0.1495 0.0079 -0.1089 -0.1726 -0.1888 -0.1837 -0.1788 -0.1754 -0.1557 -0.0964 0.0157 0.1704 0.3326 0.4558 0.5040 0.4646 0.3503 0.1939 0.0398 -0.0750 -0.1416 -0.1813 -0.2191 -0.2597 -0.2902 -0.3003 -0.2931 -0.2769 -0.2499 -0.1976 -0.1075 0.0093 0.1137 0.1647 0.1561 0.1235 0.1093 0.1266 0.1576 0.1790 0.1788 0.1557 0.1165 0.0749 0.0411 0.0096 -0.0362 -0.1004 -0.1613 -0.1855 -0.1537 -0.0714 0.0388 0.1517 0.2512 0.3315 0.3910 0.4239 0.4239 0.3967 0.3659 0.3624 0.4039 0.4830 0.5721 0.6372 0.6556 0.6249 0.5599 0.4786 0.3900 0.2956 0.2032 0.1341 0.1100 0.1286 0.1558 0.1522 0.1089 0.0524 0.0117 -0.0114 -0.0347 -0.0660 -0.0918 -0.0950 -0.0735 -0.0363 0.0106 0.0666 0.1263 0.1761 0.2046 0.2120 0.2062 0.1875 0.1427 0.0558 -0.0752 -0.2322 -0.3843 -0.4990 -0.5569 -0.5644 -0.5541 -0.5612 -0.5940 -0.6305 -0.6477 -0.6481 -0.6551 -0.6876 -0.7427 -0.7986 -0.8285 -0.8181 -0.7795 -0.7464 -0.7489 -0.7884 -0.8378 -0.8616 -0.8358 -0.7547 -0.6299 -0.4821 -0.3268 -0.1673 -0.0054 0.1443 0.2585 0.3261 0.3595 0.3839 0.4163 0.4536 0.4756 0.4627 0.4188 0.3777 0.3774 0.4248 0.4902 0.5399 0.5682 0.5905 0.6123 0.6143 0.5702 0.4741 0.3467 0.2178 0.1086 0.0246 -0.0390 -0.0927 -0.1492 -0.2175 -0.2956 -0.3679 -0.4113 -0.4042 -0.3358 -0.2131 -0.0656 0.0620 0.1291 0.1190 0.0456 -0.0545 -0.1367 -0.1656 -0.1308 -0.0540 0.0200 0.0408 -0.0256 -0.1794 -0.3806 -0.5653 -0.6802 -0.7089 -0.6678 -0.5809 -0.4622 -0.3205 -0.1706 -0.0331 0.0801 0.1748 0.2671 0.3645 0.4587 0.5315 0.5650 0.5417 0.4495 0.3018 0.1507 0.0614 0.0605 0.1153 0.1727 0.2115 0.2512 0.3147 0.3959 0.4615 0.4746 0.4176 0.3051 0.1777 0.0755 0.0107 -0.0324 -0.0703 -0.0979 -0.0935 -0.0420 0.0482 0.1476 0.2217 0.2509 0.2357 0.1847 0.1018 -0.0102 -0.1333 -0.2336 -0.2801 -0.2627 -0.1911 -0.0818 0.0486 0.1798 0.2881 0.3528 0.3626 0.3163 0.2212 0.0912 -0.0526 -0.1847 -0.2806 -0.3231 -0.3086 -0.2488 -0.1637 -0.0694 0.0324 0.1500 0.2844 0.4183 0.5256 0.5914 0.6177 0.6121 0.5800 0.5301 0.4784 0.4369 0.4008 0.3542 0.2889 0.2126 0.1382 0.0717 0.0122 -0.0383 -0.0686 -0.0648 -0.0262 0.0258 0.0566 0.0429 -0.0121 -0.0856 -0.1581 -0.2273 -0.3047 -0.3960 -0.4847 -0.5342 -0.5159 -0.4421 -0.3672 -0.3497 -0.4072 -0.5066 -0.5914 -0.6204 -0.5902 -0.5278 -0.4597 -0.3849 -0.2811 -0.1388 0.0182 0.1542 0.2546
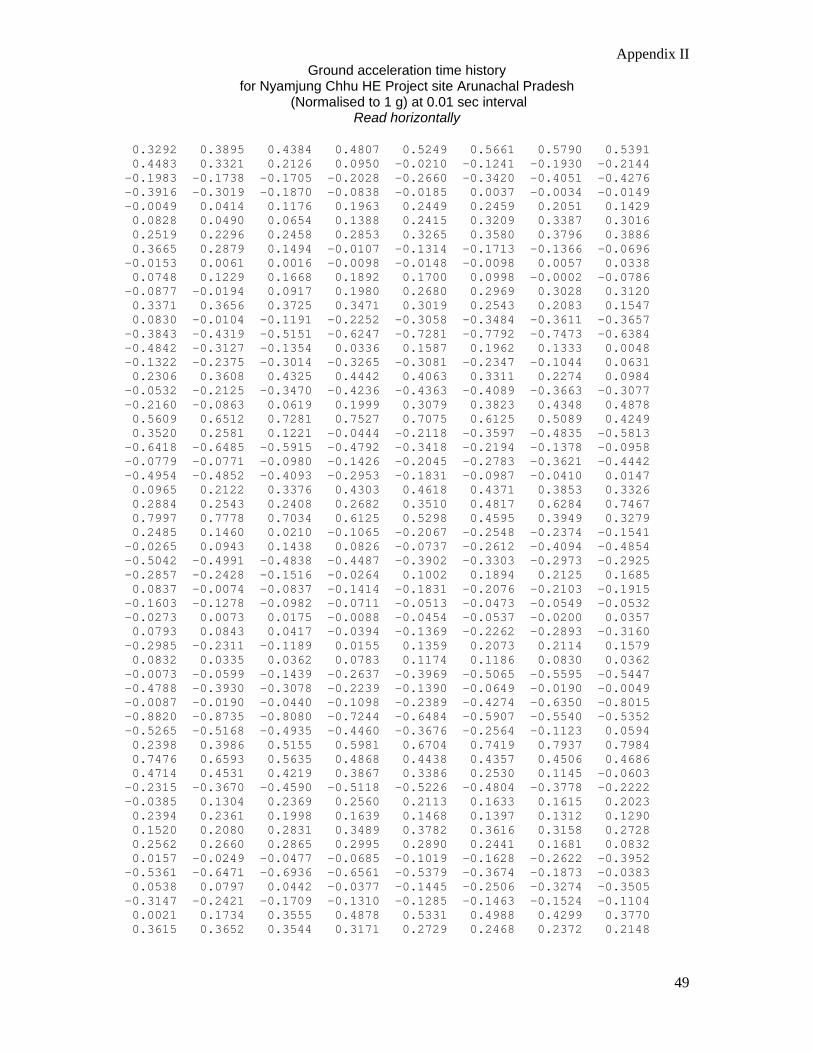
Appendix II Ground acceleration time history
for Nyamjung Chhu HE Project site Arunachal Pradesh (Normalised to 1 g) at 0.01 sec interval
Read horizontally
49
0.3292 0.3895 0.4384 0.4807 0.5249 0.5661 0.5790 0.5391 0.4483 0.3321 0.2126 0.0950 -0.0210 -0.1241 -0.1930 -0.2144 -0.1983 -0.1738 -0.1705 -0.2028 -0.2660 -0.3420 -0.4051 -0.4276 -0.3916 -0.3019 -0.1870 -0.0838 -0.0185 0.0037 -0.0034 -0.0149 -0.0049 0.0414 0.1176 0.1963 0.2449 0.2459 0.2051 0.1429 0.0828 0.0490 0.0654 0.1388 0.2415 0.3209 0.3387 0.3016 0.2519 0.2296 0.2458 0.2853 0.3265 0.3580 0.3796 0.3886 0.3665 0.2879 0.1494 -0.0107 -0.1314 -0.1713 -0.1366 -0.0696 -0.0153 0.0061 0.0016 -0.0098 -0.0148 -0.0098 0.0057 0.0338 0.0748 0.1229 0.1668 0.1892 0.1700 0.0998 -0.0002 -0.0786 -0.0877 -0.0194 0.0917 0.1980 0.2680 0.2969 0.3028 0.3120 0.3371 0.3656 0.3725 0.3471 0.3019 0.2543 0.2083 0.1547 0.0830 -0.0104 -0.1191 -0.2252 -0.3058 -0.3484 -0.3611 -0.3657 -0.3843 -0.4319 -0.5151 -0.6247 -0.7281 -0.7792 -0.7473 -0.6384 -0.4842 -0.3127 -0.1354 0.0336 0.1587 0.1962 0.1333 0.0048 -0.1322 -0.2375 -0.3014 -0.3265 -0.3081 -0.2347 -0.1044 0.0631 0.2306 0.3608 0.4325 0.4442 0.4063 0.3311 0.2274 0.0984 -0.0532 -0.2125 -0.3470 -0.4236 -0.4363 -0.4089 -0.3663 -0.3077 -0.2160 -0.0863 0.0619 0.1999 0.3079 0.3823 0.4348 0.4878 0.5609 0.6512 0.7281 0.7527 0.7075 0.6125 0.5089 0.4249 0.3520 0.2581 0.1221 -0.0444 -0.2118 -0.3597 -0.4835 -0.5813 -0.6418 -0.6485 -0.5915 -0.4792 -0.3418 -0.2194 -0.1378 -0.0958 -0.0779 -0.0771 -0.0980 -0.1426 -0.2045 -0.2783 -0.3621 -0.4442 -0.4954 -0.4852 -0.4093 -0.2953 -0.1831 -0.0987 -0.0410 0.0147 0.0965 0.2122 0.3376 0.4303 0.4618 0.4371 0.3853 0.3326 0.2884 0.2543 0.2408 0.2682 0.3510 0.4817 0.6284 0.7467 0.7997 0.7778 0.7034 0.6125 0.5298 0.4595 0.3949 0.3279 0.2485 0.1460 0.0210 -0.1065 -0.2067 -0.2548 -0.2374 -0.1541 -0.0265 0.0943 0.1438 0.0826 -0.0737 -0.2612 -0.4094 -0.4854 -0.5042 -0.4991 -0.4838 -0.4487 -0.3902 -0.3303 -0.2973 -0.2925 -0.2857 -0.2428 -0.1516 -0.0264 0.1002 0.1894 0.2125 0.1685 0.0837 -0.0074 -0.0837 -0.1414 -0.1831 -0.2076 -0.2103 -0.1915 -0.1603 -0.1278 -0.0982 -0.0711 -0.0513 -0.0473 -0.0549 -0.0532 -0.0273 0.0073 0.0175 -0.0088 -0.0454 -0.0537 -0.0200 0.0357 0.0793 0.0843 0.0417 -0.0394 -0.1369 -0.2262 -0.2893 -0.3160 -0.2985 -0.2311 -0.1189 0.0155 0.1359 0.2073 0.2114 0.1579 0.0832 0.0335 0.0362 0.0783 0.1174 0.1186 0.0830 0.0362 -0.0073 -0.0599 -0.1439 -0.2637 -0.3969 -0.5065 -0.5595 -0.5447 -0.4788 -0.3930 -0.3078 -0.2239 -0.1390 -0.0649 -0.0190 -0.0049 -0.0087 -0.0190 -0.0440 -0.1098 -0.2389 -0.4274 -0.6350 -0.8015 -0.8820 -0.8735 -0.8080 -0.7244 -0.6484 -0.5907 -0.5540 -0.5352 -0.5265 -0.5168 -0.4935 -0.4460 -0.3676 -0.2564 -0.1123 0.0594 0.2398 0.3986 0.5155 0.5981 0.6704 0.7419 0.7937 0.7984 0.7476 0.6593 0.5635 0.4868 0.4438 0.4357 0.4506 0.4686 0.4714 0.4531 0.4219 0.3867 0.3386 0.2530 0.1145 -0.0603 -0.2315 -0.3670 -0.4590 -0.5118 -0.5226 -0.4804 -0.3778 -0.2222 -0.0385 0.1304 0.2369 0.2560 0.2113 0.1633 0.1615 0.2023 0.2394 0.2361 0.1998 0.1639 0.1468 0.1397 0.1312 0.1290 0.1520 0.2080 0.2831 0.3489 0.3782 0.3616 0.3158 0.2728 0.2562 0.2660 0.2865 0.2995 0.2890 0.2441 0.1681 0.0832 0.0157 -0.0249 -0.0477 -0.0685 -0.1019 -0.1628 -0.2622 -0.3952 -0.5361 -0.6471 -0.6936 -0.6561 -0.5379 -0.3674 -0.1873 -0.0383 0.0538 0.0797 0.0442 -0.0377 -0.1445 -0.2506 -0.3274 -0.3505 -0.3147 -0.2421 -0.1709 -0.1310 -0.1285 -0.1463 -0.1524 -0.1104 0.0021 0.1734 0.3555 0.4878 0.5331 0.4988 0.4299 0.3770 0.3615 0.3652 0.3544 0.3171 0.2729 0.2468 0.2372 0.2148
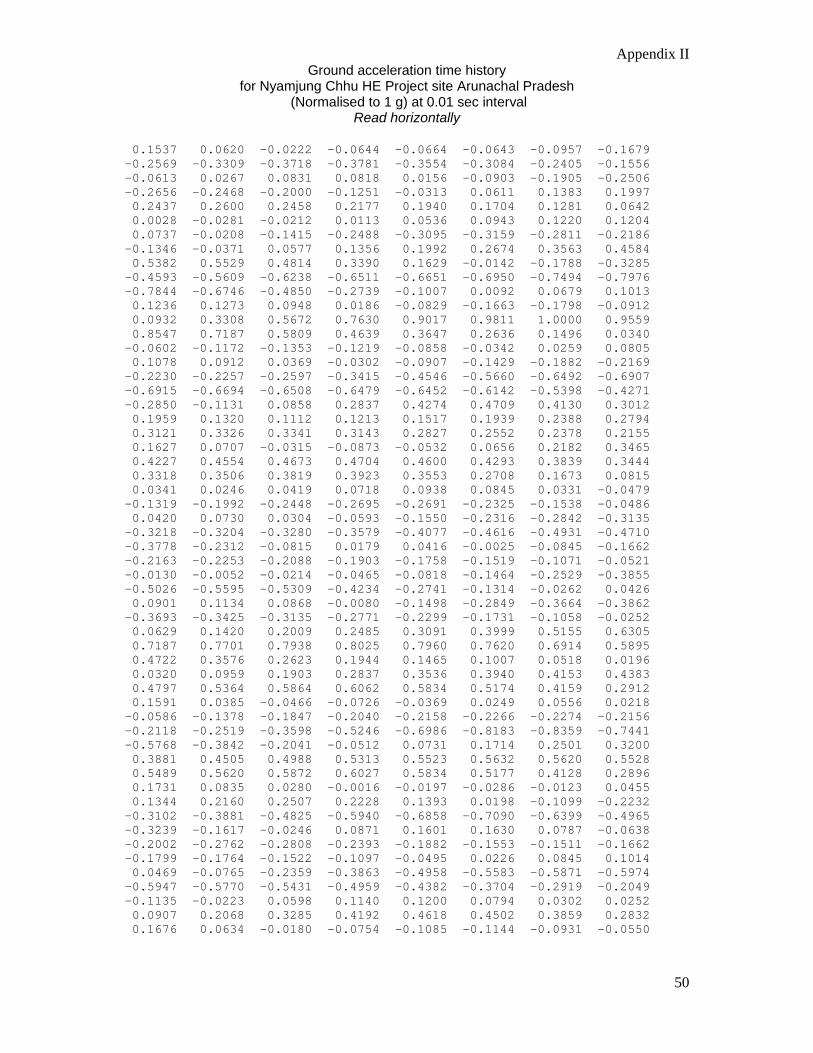
Appendix II Ground acceleration time history
for Nyamjung Chhu HE Project site Arunachal Pradesh (Normalised to 1 g) at 0.01 sec interval
Read horizontally
50
0.1537 0.0620 -0.0222 -0.0644 -0.0664 -0.0643 -0.0957 -0.1679 -0.2569 -0.3309 -0.3718 -0.3781 -0.3554 -0.3084 -0.2405 -0.1556 -0.0613 0.0267 0.0831 0.0818 0.0156 -0.0903 -0.1905 -0.2506 -0.2656 -0.2468 -0.2000 -0.1251 -0.0313 0.0611 0.1383 0.1997 0.2437 0.2600 0.2458 0.2177 0.1940 0.1704 0.1281 0.0642 0.0028 -0.0281 -0.0212 0.0113 0.0536 0.0943 0.1220 0.1204 0.0737 -0.0208 -0.1415 -0.2488 -0.3095 -0.3159 -0.2811 -0.2186 -0.1346 -0.0371 0.0577 0.1356 0.1992 0.2674 0.3563 0.4584 0.5382 0.5529 0.4814 0.3390 0.1629 -0.0142 -0.1788 -0.3285 -0.4593 -0.5609 -0.6238 -0.6511 -0.6651 -0.6950 -0.7494 -0.7976 -0.7844 -0.6746 -0.4850 -0.2739 -0.1007 0.0092 0.0679 0.1013 0.1236 0.1273 0.0948 0.0186 -0.0829 -0.1663 -0.1798 -0.0912 0.0932 0.3308 0.5672 0.7630 0.9017 0.9811 1.0000 0.9559 0.8547 0.7187 0.5809 0.4639 0.3647 0.2636 0.1496 0.0340 -0.0602 -0.1172 -0.1353 -0.1219 -0.0858 -0.0342 0.0259 0.0805 0.1078 0.0912 0.0369 -0.0302 -0.0907 -0.1429 -0.1882 -0.2169 -0.2230 -0.2257 -0.2597 -0.3415 -0.4546 -0.5660 -0.6492 -0.6907 -0.6915 -0.6694 -0.6508 -0.6479 -0.6452 -0.6142 -0.5398 -0.4271 -0.2850 -0.1131 0.0858 0.2837 0.4274 0.4709 0.4130 0.3012 0.1959 0.1320 0.1112 0.1213 0.1517 0.1939 0.2388 0.2794 0.3121 0.3326 0.3341 0.3143 0.2827 0.2552 0.2378 0.2155 0.1627 0.0707 -0.0315 -0.0873 -0.0532 0.0656 0.2182 0.3465 0.4227 0.4554 0.4673 0.4704 0.4600 0.4293 0.3839 0.3444 0.3318 0.3506 0.3819 0.3923 0.3553 0.2708 0.1673 0.0815 0.0341 0.0246 0.0419 0.0718 0.0938 0.0845 0.0331 -0.0479 -0.1319 -0.1992 -0.2448 -0.2695 -0.2691 -0.2325 -0.1538 -0.0486 0.0420 0.0730 0.0304 -0.0593 -0.1550 -0.2316 -0.2842 -0.3135 -0.3218 -0.3204 -0.3280 -0.3579 -0.4077 -0.4616 -0.4931 -0.4710 -0.3778 -0.2312 -0.0815 0.0179 0.0416 -0.0025 -0.0845 -0.1662 -0.2163 -0.2253 -0.2088 -0.1903 -0.1758 -0.1519 -0.1071 -0.0521 -0.0130 -0.0052 -0.0214 -0.0465 -0.0818 -0.1464 -0.2529 -0.3855 -0.5026 -0.5595 -0.5309 -0.4234 -0.2741 -0.1314 -0.0262 0.0426 0.0901 0.1134 0.0868 -0.0080 -0.1498 -0.2849 -0.3664 -0.3862 -0.3693 -0.3425 -0.3135 -0.2771 -0.2299 -0.1731 -0.1058 -0.0252 0.0629 0.1420 0.2009 0.2485 0.3091 0.3999 0.5155 0.6305 0.7187 0.7701 0.7938 0.8025 0.7960 0.7620 0.6914 0.5895 0.4722 0.3576 0.2623 0.1944 0.1465 0.1007 0.0518 0.0196 0.0320 0.0959 0.1903 0.2837 0.3536 0.3940 0.4153 0.4383 0.4797 0.5364 0.5864 0.6062 0.5834 0.5174 0.4159 0.2912 0.1591 0.0385 -0.0466 -0.0726 -0.0369 0.0249 0.0556 0.0218 -0.0586 -0.1378 -0.1847 -0.2040 -0.2158 -0.2266 -0.2274 -0.2156 -0.2118 -0.2519 -0.3598 -0.5246 -0.6986 -0.8183 -0.8359 -0.7441 -0.5768 -0.3842 -0.2041 -0.0512 0.0731 0.1714 0.2501 0.3200 0.3881 0.4505 0.4988 0.5313 0.5523 0.5632 0.5620 0.5528 0.5489 0.5620 0.5872 0.6027 0.5834 0.5177 0.4128 0.2896 0.1731 0.0835 0.0280 -0.0016 -0.0197 -0.0286 -0.0123 0.0455 0.1344 0.2160 0.2507 0.2228 0.1393 0.0198 -0.1099 -0.2232 -0.3102 -0.3881 -0.4825 -0.5940 -0.6858 -0.7090 -0.6399 -0.4965 -0.3239 -0.1617 -0.0246 0.0871 0.1601 0.1630 0.0787 -0.0638 -0.2002 -0.2762 -0.2808 -0.2393 -0.1882 -0.1553 -0.1511 -0.1662 -0.1799 -0.1764 -0.1522 -0.1097 -0.0495 0.0226 0.0845 0.1014 0.0469 -0.0765 -0.2359 -0.3863 -0.4958 -0.5583 -0.5871 -0.5974 -0.5947 -0.5770 -0.5431 -0.4959 -0.4382 -0.3704 -0.2919 -0.2049 -0.1135 -0.0223 0.0598 0.1140 0.1200 0.0794 0.0302 0.0252 0.0907 0.2068 0.3285 0.4192 0.4618 0.4502 0.3859 0.2832 0.1676 0.0634 -0.0180 -0.0754 -0.1085 -0.1144 -0.0931 -0.0550
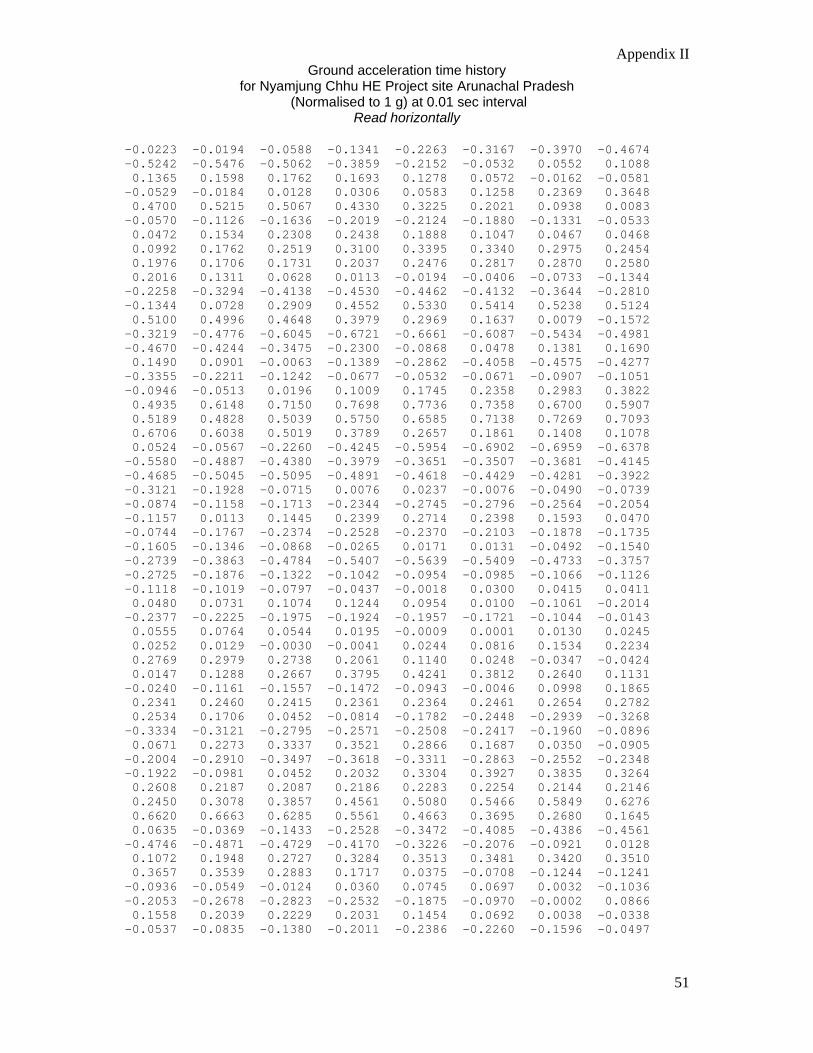
Appendix II Ground acceleration time history
for Nyamjung Chhu HE Project site Arunachal Pradesh (Normalised to 1 g) at 0.01 sec interval
Read horizontally
51
-0.0223 -0.0194 -0.0588 -0.1341 -0.2263 -0.3167 -0.3970 -0.4674 -0.5242 -0.5476 -0.5062 -0.3859 -0.2152 -0.0532 0.0552 0.1088 0.1365 0.1598 0.1762 0.1693 0.1278 0.0572 -0.0162 -0.0581 -0.0529 -0.0184 0.0128 0.0306 0.0583 0.1258 0.2369 0.3648 0.4700 0.5215 0.5067 0.4330 0.3225 0.2021 0.0938 0.0083 -0.0570 -0.1126 -0.1636 -0.2019 -0.2124 -0.1880 -0.1331 -0.0533 0.0472 0.1534 0.2308 0.2438 0.1888 0.1047 0.0467 0.0468 0.0992 0.1762 0.2519 0.3100 0.3395 0.3340 0.2975 0.2454 0.1976 0.1706 0.1731 0.2037 0.2476 0.2817 0.2870 0.2580 0.2016 0.1311 0.0628 0.0113 -0.0194 -0.0406 -0.0733 -0.1344 -0.2258 -0.3294 -0.4138 -0.4530 -0.4462 -0.4132 -0.3644 -0.2810 -0.1344 0.0728 0.2909 0.4552 0.5330 0.5414 0.5238 0.5124 0.5100 0.4996 0.4648 0.3979 0.2969 0.1637 0.0079 -0.1572 -0.3219 -0.4776 -0.6045 -0.6721 -0.6661 -0.6087 -0.5434 -0.4981 -0.4670 -0.4244 -0.3475 -0.2300 -0.0868 0.0478 0.1381 0.1690 0.1490 0.0901 -0.0063 -0.1389 -0.2862 -0.4058 -0.4575 -0.4277 -0.3355 -0.2211 -0.1242 -0.0677 -0.0532 -0.0671 -0.0907 -0.1051 -0.0946 -0.0513 0.0196 0.1009 0.1745 0.2358 0.2983 0.3822 0.4935 0.6148 0.7150 0.7698 0.7736 0.7358 0.6700 0.5907 0.5189 0.4828 0.5039 0.5750 0.6585 0.7138 0.7269 0.7093 0.6706 0.6038 0.5019 0.3789 0.2657 0.1861 0.1408 0.1078 0.0524 -0.0567 -0.2260 -0.4245 -0.5954 -0.6902 -0.6959 -0.6378 -0.5580 -0.4887 -0.4380 -0.3979 -0.3651 -0.3507 -0.3681 -0.4145 -0.4685 -0.5045 -0.5095 -0.4891 -0.4618 -0.4429 -0.4281 -0.3922 -0.3121 -0.1928 -0.0715 0.0076 0.0237 -0.0076 -0.0490 -0.0739 -0.0874 -0.1158 -0.1713 -0.2344 -0.2745 -0.2796 -0.2564 -0.2054 -0.1157 0.0113 0.1445 0.2399 0.2714 0.2398 0.1593 0.0470 -0.0744 -0.1767 -0.2374 -0.2528 -0.2370 -0.2103 -0.1878 -0.1735 -0.1605 -0.1346 -0.0868 -0.0265 0.0171 0.0131 -0.0492 -0.1540 -0.2739 -0.3863 -0.4784 -0.5407 -0.5639 -0.5409 -0.4733 -0.3757 -0.2725 -0.1876 -0.1322 -0.1042 -0.0954 -0.0985 -0.1066 -0.1126 -0.1118 -0.1019 -0.0797 -0.0437 -0.0018 0.0300 0.0415 0.0411 0.0480 0.0731 0.1074 0.1244 0.0954 0.0100 -0.1061 -0.2014 -0.2377 -0.2225 -0.1975 -0.1924 -0.1957 -0.1721 -0.1044 -0.0143 0.0555 0.0764 0.0544 0.0195 -0.0009 0.0001 0.0130 0.0245 0.0252 0.0129 -0.0030 -0.0041 0.0244 0.0816 0.1534 0.2234 0.2769 0.2979 0.2738 0.2061 0.1140 0.0248 -0.0347 -0.0424 0.0147 0.1288 0.2667 0.3795 0.4241 0.3812 0.2640 0.1131 -0.0240 -0.1161 -0.1557 -0.1472 -0.0943 -0.0046 0.0998 0.1865 0.2341 0.2460 0.2415 0.2361 0.2364 0.2461 0.2654 0.2782 0.2534 0.1706 0.0452 -0.0814 -0.1782 -0.2448 -0.2939 -0.3268 -0.3334 -0.3121 -0.2795 -0.2571 -0.2508 -0.2417 -0.1960 -0.0896 0.0671 0.2273 0.3337 0.3521 0.2866 0.1687 0.0350 -0.0905 -0.2004 -0.2910 -0.3497 -0.3618 -0.3311 -0.2863 -0.2552 -0.2348 -0.1922 -0.0981 0.0452 0.2032 0.3304 0.3927 0.3835 0.3264 0.2608 0.2187 0.2087 0.2186 0.2283 0.2254 0.2144 0.2146 0.2450 0.3078 0.3857 0.4561 0.5080 0.5466 0.5849 0.6276 0.6620 0.6663 0.6285 0.5561 0.4663 0.3695 0.2680 0.1645 0.0635 -0.0369 -0.1433 -0.2528 -0.3472 -0.4085 -0.4386 -0.4561 -0.4746 -0.4871 -0.4729 -0.4170 -0.3226 -0.2076 -0.0921 0.0128 0.1072 0.1948 0.2727 0.3284 0.3513 0.3481 0.3420 0.3510 0.3657 0.3539 0.2883 0.1717 0.0375 -0.0708 -0.1244 -0.1241 -0.0936 -0.0549 -0.0124 0.0360 0.0745 0.0697 0.0032 -0.1036 -0.2053 -0.2678 -0.2823 -0.2532 -0.1875 -0.0970 -0.0002 0.0866 0.1558 0.2039 0.2229 0.2031 0.1454 0.0692 0.0038 -0.0338 -0.0537 -0.0835 -0.1380 -0.2011 -0.2386 -0.2260 -0.1596 -0.0497
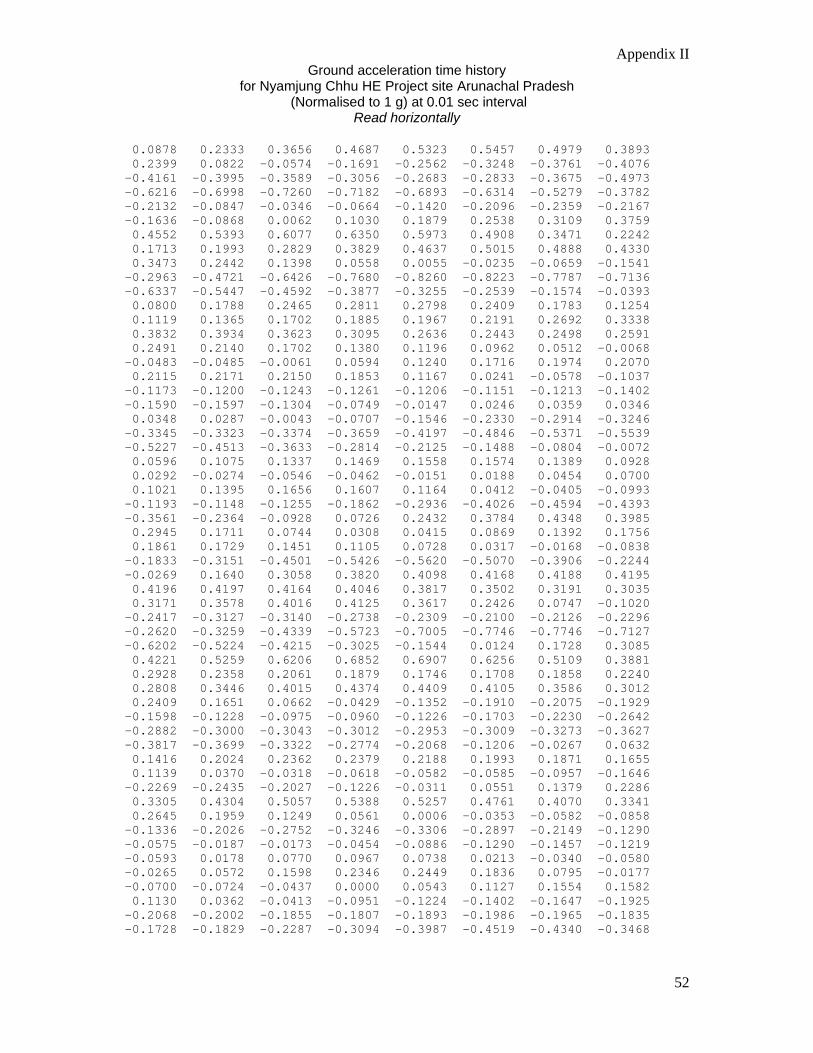
Appendix II Ground acceleration time history
for Nyamjung Chhu HE Project site Arunachal Pradesh (Normalised to 1 g) at 0.01 sec interval
Read horizontally
52
0.0878 0.2333 0.3656 0.4687 0.5323 0.5457 0.4979 0.3893 0.2399 0.0822 -0.0574 -0.1691 -0.2562 -0.3248 -0.3761 -0.4076 -0.4161 -0.3995 -0.3589 -0.3056 -0.2683 -0.2833 -0.3675 -0.4973 -0.6216 -0.6998 -0.7260 -0.7182 -0.6893 -0.6314 -0.5279 -0.3782 -0.2132 -0.0847 -0.0346 -0.0664 -0.1420 -0.2096 -0.2359 -0.2167 -0.1636 -0.0868 0.0062 0.1030 0.1879 0.2538 0.3109 0.3759 0.4552 0.5393 0.6077 0.6350 0.5973 0.4908 0.3471 0.2242 0.1713 0.1993 0.2829 0.3829 0.4637 0.5015 0.4888 0.4330 0.3473 0.2442 0.1398 0.0558 0.0055 -0.0235 -0.0659 -0.1541 -0.2963 -0.4721 -0.6426 -0.7680 -0.8260 -0.8223 -0.7787 -0.7136 -0.6337 -0.5447 -0.4592 -0.3877 -0.3255 -0.2539 -0.1574 -0.0393 0.0800 0.1788 0.2465 0.2811 0.2798 0.2409 0.1783 0.1254 0.1119 0.1365 0.1702 0.1885 0.1967 0.2191 0.2692 0.3338 0.3832 0.3934 0.3623 0.3095 0.2636 0.2443 0.2498 0.2591 0.2491 0.2140 0.1702 0.1380 0.1196 0.0962 0.0512 -0.0068 -0.0483 -0.0485 -0.0061 0.0594 0.1240 0.1716 0.1974 0.2070 0.2115 0.2171 0.2150 0.1853 0.1167 0.0241 -0.0578 -0.1037 -0.1173 -0.1200 -0.1243 -0.1261 -0.1206 -0.1151 -0.1213 -0.1402 -0.1590 -0.1597 -0.1304 -0.0749 -0.0147 0.0246 0.0359 0.0346 0.0348 0.0287 -0.0043 -0.0707 -0.1546 -0.2330 -0.2914 -0.3246 -0.3345 -0.3323 -0.3374 -0.3659 -0.4197 -0.4846 -0.5371 -0.5539 -0.5227 -0.4513 -0.3633 -0.2814 -0.2125 -0.1488 -0.0804 -0.0072 0.0596 0.1075 0.1337 0.1469 0.1558 0.1574 0.1389 0.0928 0.0292 -0.0274 -0.0546 -0.0462 -0.0151 0.0188 0.0454 0.0700 0.1021 0.1395 0.1656 0.1607 0.1164 0.0412 -0.0405 -0.0993 -0.1193 -0.1148 -0.1255 -0.1862 -0.2936 -0.4026 -0.4594 -0.4393 -0.3561 -0.2364 -0.0928 0.0726 0.2432 0.3784 0.4348 0.3985 0.2945 0.1711 0.0744 0.0308 0.0415 0.0869 0.1392 0.1756 0.1861 0.1729 0.1451 0.1105 0.0728 0.0317 -0.0168 -0.0838 -0.1833 -0.3151 -0.4501 -0.5426 -0.5620 -0.5070 -0.3906 -0.2244 -0.0269 0.1640 0.3058 0.3820 0.4098 0.4168 0.4188 0.4195 0.4196 0.4197 0.4164 0.4046 0.3817 0.3502 0.3191 0.3035 0.3171 0.3578 0.4016 0.4125 0.3617 0.2426 0.0747 -0.1020 -0.2417 -0.3127 -0.3140 -0.2738 -0.2309 -0.2100 -0.2126 -0.2296 -0.2620 -0.3259 -0.4339 -0.5723 -0.7005 -0.7746 -0.7746 -0.7127 -0.6202 -0.5224 -0.4215 -0.3025 -0.1544 0.0124 0.1728 0.3085 0.4221 0.5259 0.6206 0.6852 0.6907 0.6256 0.5109 0.3881 0.2928 0.2358 0.2061 0.1879 0.1746 0.1708 0.1858 0.2240 0.2808 0.3446 0.4015 0.4374 0.4409 0.4105 0.3586 0.3012 0.2409 0.1651 0.0662 -0.0429 -0.1352 -0.1910 -0.2075 -0.1929 -0.1598 -0.1228 -0.0975 -0.0960 -0.1226 -0.1703 -0.2230 -0.2642 -0.2882 -0.3000 -0.3043 -0.3012 -0.2953 -0.3009 -0.3273 -0.3627 -0.3817 -0.3699 -0.3322 -0.2774 -0.2068 -0.1206 -0.0267 0.0632 0.1416 0.2024 0.2362 0.2379 0.2188 0.1993 0.1871 0.1655 0.1139 0.0370 -0.0318 -0.0618 -0.0582 -0.0585 -0.0957 -0.1646 -0.2269 -0.2435 -0.2027 -0.1226 -0.0311 0.0551 0.1379 0.2286 0.3305 0.4304 0.5057 0.5388 0.5257 0.4761 0.4070 0.3341 0.2645 0.1959 0.1249 0.0561 0.0006 -0.0353 -0.0582 -0.0858 -0.1336 -0.2026 -0.2752 -0.3246 -0.3306 -0.2897 -0.2149 -0.1290 -0.0575 -0.0187 -0.0173 -0.0454 -0.0886 -0.1290 -0.1457 -0.1219 -0.0593 0.0178 0.0770 0.0967 0.0738 0.0213 -0.0340 -0.0580 -0.0265 0.0572 0.1598 0.2346 0.2449 0.1836 0.0795 -0.0177 -0.0700 -0.0724 -0.0437 0.0000 0.0543 0.1127 0.1554 0.1582 0.1130 0.0362 -0.0413 -0.0951 -0.1224 -0.1402 -0.1647 -0.1925 -0.2068 -0.2002 -0.1855 -0.1807 -0.1893 -0.1986 -0.1965 -0.1835 -0.1728 -0.1829 -0.2287 -0.3094 -0.3987 -0.4519 -0.4340 -0.3468
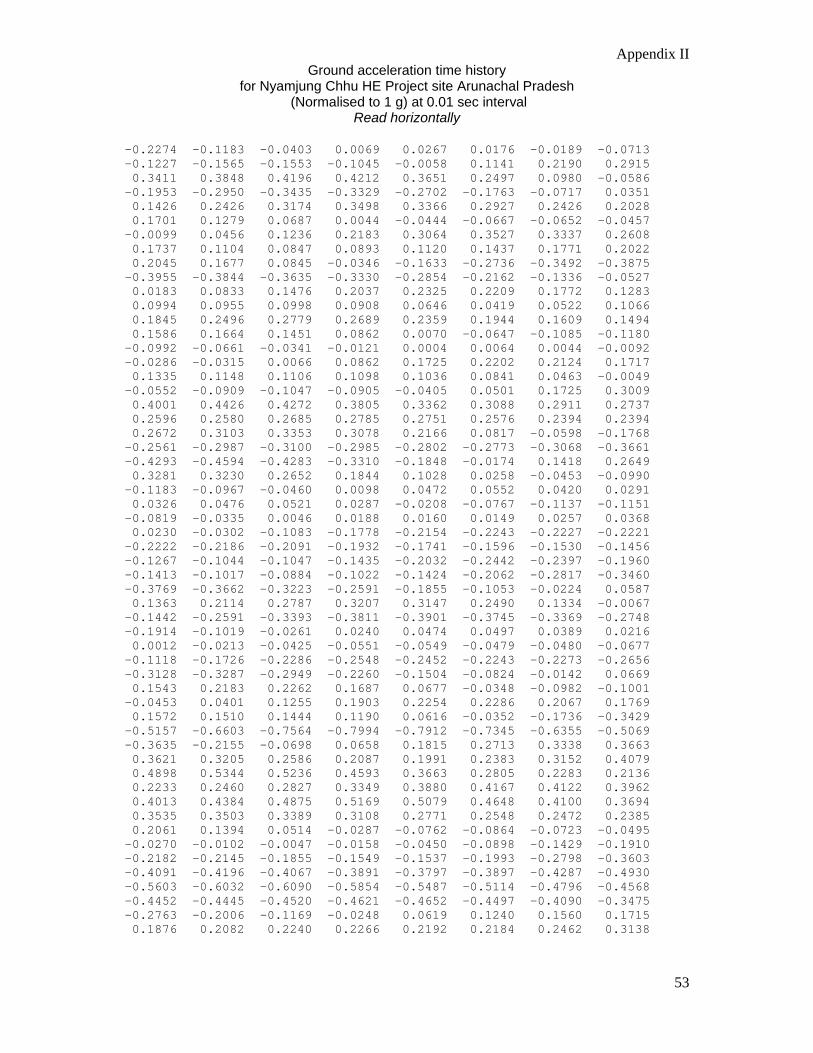
Appendix II Ground acceleration time history
for Nyamjung Chhu HE Project site Arunachal Pradesh (Normalised to 1 g) at 0.01 sec interval
Read horizontally
53
-0.2274 -0.1183 -0.0403 0.0069 0.0267 0.0176 -0.0189 -0.0713 -0.1227 -0.1565 -0.1553 -0.1045 -0.0058 0.1141 0.2190 0.2915 0.3411 0.3848 0.4196 0.4212 0.3651 0.2497 0.0980 -0.0586 -0.1953 -0.2950 -0.3435 -0.3329 -0.2702 -0.1763 -0.0717 0.0351 0.1426 0.2426 0.3174 0.3498 0.3366 0.2927 0.2426 0.2028 0.1701 0.1279 0.0687 0.0044 -0.0444 -0.0667 -0.0652 -0.0457 -0.0099 0.0456 0.1236 0.2183 0.3064 0.3527 0.3337 0.2608 0.1737 0.1104 0.0847 0.0893 0.1120 0.1437 0.1771 0.2022 0.2045 0.1677 0.0845 -0.0346 -0.1633 -0.2736 -0.3492 -0.3875 -0.3955 -0.3844 -0.3635 -0.3330 -0.2854 -0.2162 -0.1336 -0.0527 0.0183 0.0833 0.1476 0.2037 0.2325 0.2209 0.1772 0.1283 0.0994 0.0955 0.0998 0.0908 0.0646 0.0419 0.0522 0.1066 0.1845 0.2496 0.2779 0.2689 0.2359 0.1944 0.1609 0.1494 0.1586 0.1664 0.1451 0.0862 0.0070 -0.0647 -0.1085 -0.1180 -0.0992 -0.0661 -0.0341 -0.0121 0.0004 0.0064 0.0044 -0.0092 -0.0286 -0.0315 0.0066 0.0862 0.1725 0.2202 0.2124 0.1717 0.1335 0.1148 0.1106 0.1098 0.1036 0.0841 0.0463 -0.0049 -0.0552 -0.0909 -0.1047 -0.0905 -0.0405 0.0501 0.1725 0.3009 0.4001 0.4426 0.4272 0.3805 0.3362 0.3088 0.2911 0.2737 0.2596 0.2580 0.2685 0.2785 0.2751 0.2576 0.2394 0.2394 0.2672 0.3103 0.3353 0.3078 0.2166 0.0817 -0.0598 -0.1768 -0.2561 -0.2987 -0.3100 -0.2985 -0.2802 -0.2773 -0.3068 -0.3661 -0.4293 -0.4594 -0.4283 -0.3310 -0.1848 -0.0174 0.1418 0.2649 0.3281 0.3230 0.2652 0.1844 0.1028 0.0258 -0.0453 -0.0990 -0.1183 -0.0967 -0.0460 0.0098 0.0472 0.0552 0.0420 0.0291 0.0326 0.0476 0.0521 0.0287 -0.0208 -0.0767 -0.1137 -0.1151 -0.0819 -0.0335 0.0046 0.0188 0.0160 0.0149 0.0257 0.0368 0.0230 -0.0302 -0.1083 -0.1778 -0.2154 -0.2243 -0.2227 -0.2221 -0.2222 -0.2186 -0.2091 -0.1932 -0.1741 -0.1596 -0.1530 -0.1456 -0.1267 -0.1044 -0.1047 -0.1435 -0.2032 -0.2442 -0.2397 -0.1960 -0.1413 -0.1017 -0.0884 -0.1022 -0.1424 -0.2062 -0.2817 -0.3460 -0.3769 -0.3662 -0.3223 -0.2591 -0.1855 -0.1053 -0.0224 0.0587 0.1363 0.2114 0.2787 0.3207 0.3147 0.2490 0.1334 -0.0067 -0.1442 -0.2591 -0.3393 -0.3811 -0.3901 -0.3745 -0.3369 -0.2748 -0.1914 -0.1019 -0.0261 0.0240 0.0474 0.0497 0.0389 0.0216 0.0012 -0.0213 -0.0425 -0.0551 -0.0549 -0.0479 -0.0480 -0.0677 -0.1118 -0.1726 -0.2286 -0.2548 -0.2452 -0.2243 -0.2273 -0.2656 -0.3128 -0.3287 -0.2949 -0.2260 -0.1504 -0.0824 -0.0142 0.0669 0.1543 0.2183 0.2262 0.1687 0.0677 -0.0348 -0.0982 -0.1001 -0.0453 0.0401 0.1255 0.1903 0.2254 0.2286 0.2067 0.1769 0.1572 0.1510 0.1444 0.1190 0.0616 -0.0352 -0.1736 -0.3429 -0.5157 -0.6603 -0.7564 -0.7994 -0.7912 -0.7345 -0.6355 -0.5069 -0.3635 -0.2155 -0.0698 0.0658 0.1815 0.2713 0.3338 0.3663 0.3621 0.3205 0.2586 0.2087 0.1991 0.2383 0.3152 0.4079 0.4898 0.5344 0.5236 0.4593 0.3663 0.2805 0.2283 0.2136 0.2233 0.2460 0.2827 0.3349 0.3880 0.4167 0.4122 0.3962 0.4013 0.4384 0.4875 0.5169 0.5079 0.4648 0.4100 0.3694 0.3535 0.3503 0.3389 0.3108 0.2771 0.2548 0.2472 0.2385 0.2061 0.1394 0.0514 -0.0287 -0.0762 -0.0864 -0.0723 -0.0495 -0.0270 -0.0102 -0.0047 -0.0158 -0.0450 -0.0898 -0.1429 -0.1910 -0.2182 -0.2145 -0.1855 -0.1549 -0.1537 -0.1993 -0.2798 -0.3603 -0.4091 -0.4196 -0.4067 -0.3891 -0.3797 -0.3897 -0.4287 -0.4930 -0.5603 -0.6032 -0.6090 -0.5854 -0.5487 -0.5114 -0.4796 -0.4568 -0.4452 -0.4445 -0.4520 -0.4621 -0.4652 -0.4497 -0.4090 -0.3475 -0.2763 -0.2006 -0.1169 -0.0248 0.0619 0.1240 0.1560 0.1715 0.1876 0.2082 0.2240 0.2266 0.2192 0.2184 0.2462 0.3138
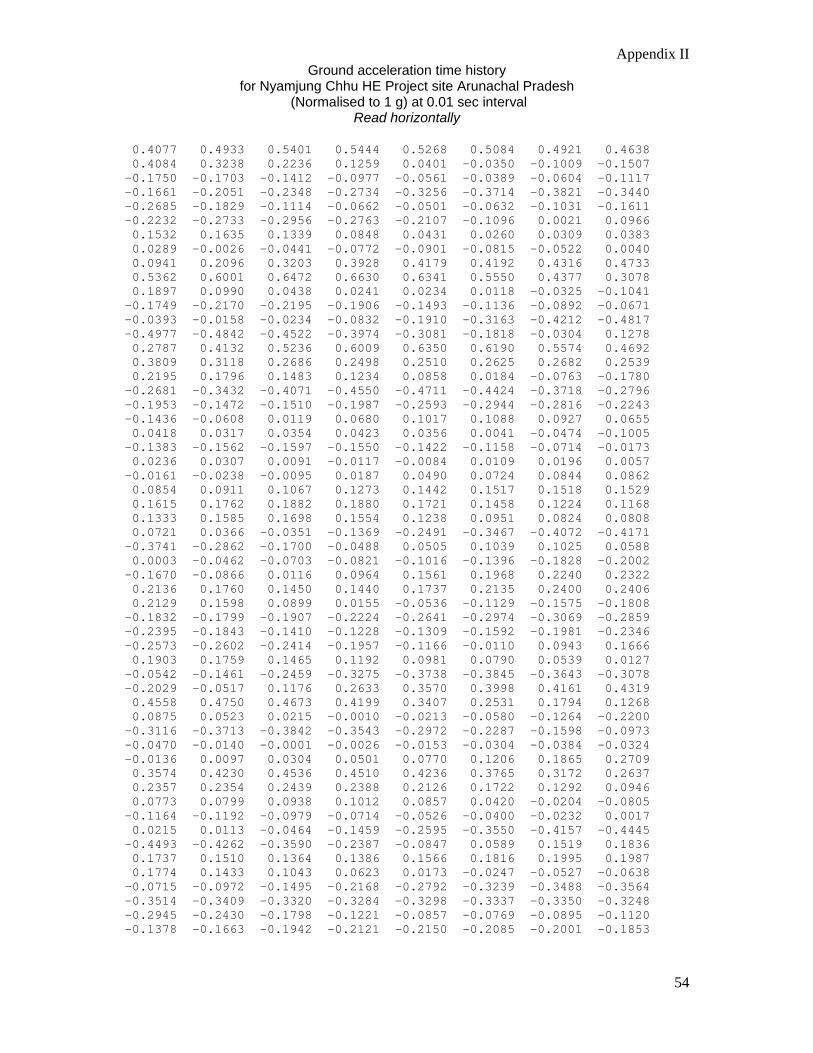
Appendix II Ground acceleration time history
for Nyamjung Chhu HE Project site Arunachal Pradesh (Normalised to 1 g) at 0.01 sec interval
Read horizontally
54
0.4077 0.4933 0.5401 0.5444 0.5268 0.5084 0.4921 0.4638 0.4084 0.3238 0.2236 0.1259 0.0401 -0.0350 -0.1009 -0.1507 -0.1750 -0.1703 -0.1412 -0.0977 -0.0561 -0.0389 -0.0604 -0.1117 -0.1661 -0.2051 -0.2348 -0.2734 -0.3256 -0.3714 -0.3821 -0.3440 -0.2685 -0.1829 -0.1114 -0.0662 -0.0501 -0.0632 -0.1031 -0.1611 -0.2232 -0.2733 -0.2956 -0.2763 -0.2107 -0.1096 0.0021 0.0966 0.1532 0.1635 0.1339 0.0848 0.0431 0.0260 0.0309 0.0383 0.0289 -0.0026 -0.0441 -0.0772 -0.0901 -0.0815 -0.0522 0.0040 0.0941 0.2096 0.3203 0.3928 0.4179 0.4192 0.4316 0.4733 0.5362 0.6001 0.6472 0.6630 0.6341 0.5550 0.4377 0.3078 0.1897 0.0990 0.0438 0.0241 0.0234 0.0118 -0.0325 -0.1041 -0.1749 -0.2170 -0.2195 -0.1906 -0.1493 -0.1136 -0.0892 -0.0671 -0.0393 -0.0158 -0.0234 -0.0832 -0.1910 -0.3163 -0.4212 -0.4817 -0.4977 -0.4842 -0.4522 -0.3974 -0.3081 -0.1818 -0.0304 0.1278 0.2787 0.4132 0.5236 0.6009 0.6350 0.6190 0.5574 0.4692 0.3809 0.3118 0.2686 0.2498 0.2510 0.2625 0.2682 0.2539 0.2195 0.1796 0.1483 0.1234 0.0858 0.0184 -0.0763 -0.1780 -0.2681 -0.3432 -0.4071 -0.4550 -0.4711 -0.4424 -0.3718 -0.2796 -0.1953 -0.1472 -0.1510 -0.1987 -0.2593 -0.2944 -0.2816 -0.2243 -0.1436 -0.0608 0.0119 0.0680 0.1017 0.1088 0.0927 0.0655 0.0418 0.0317 0.0354 0.0423 0.0356 0.0041 -0.0474 -0.1005 -0.1383 -0.1562 -0.1597 -0.1550 -0.1422 -0.1158 -0.0714 -0.0173 0.0236 0.0307 0.0091 -0.0117 -0.0084 0.0109 0.0196 0.0057 -0.0161 -0.0238 -0.0095 0.0187 0.0490 0.0724 0.0844 0.0862 0.0854 0.0911 0.1067 0.1273 0.1442 0.1517 0.1518 0.1529 0.1615 0.1762 0.1882 0.1880 0.1721 0.1458 0.1224 0.1168 0.1333 0.1585 0.1698 0.1554 0.1238 0.0951 0.0824 0.0808 0.0721 0.0366 -0.0351 -0.1369 -0.2491 -0.3467 -0.4072 -0.4171 -0.3741 -0.2862 -0.1700 -0.0488 0.0505 0.1039 0.1025 0.0588 0.0003 -0.0462 -0.0703 -0.0821 -0.1016 -0.1396 -0.1828 -0.2002 -0.1670 -0.0866 0.0116 0.0964 0.1561 0.1968 0.2240 0.2322 0.2136 0.1760 0.1450 0.1440 0.1737 0.2135 0.2400 0.2406 0.2129 0.1598 0.0899 0.0155 -0.0536 -0.1129 -0.1575 -0.1808 -0.1832 -0.1799 -0.1907 -0.2224 -0.2641 -0.2974 -0.3069 -0.2859 -0.2395 -0.1843 -0.1410 -0.1228 -0.1309 -0.1592 -0.1981 -0.2346 -0.2573 -0.2602 -0.2414 -0.1957 -0.1166 -0.0110 0.0943 0.1666 0.1903 0.1759 0.1465 0.1192 0.0981 0.0790 0.0539 0.0127 -0.0542 -0.1461 -0.2459 -0.3275 -0.3738 -0.3845 -0.3643 -0.3078 -0.2029 -0.0517 0.1176 0.2633 0.3570 0.3998 0.4161 0.4319 0.4558 0.4750 0.4673 0.4199 0.3407 0.2531 0.1794 0.1268 0.0875 0.0523 0.0215 -0.0010 -0.0213 -0.0580 -0.1264 -0.2200 -0.3116 -0.3713 -0.3842 -0.3543 -0.2972 -0.2287 -0.1598 -0.0973 -0.0470 -0.0140 -0.0001 -0.0026 -0.0153 -0.0304 -0.0384 -0.0324 -0.0136 0.0097 0.0304 0.0501 0.0770 0.1206 0.1865 0.2709 0.3574 0.4230 0.4536 0.4510 0.4236 0.3765 0.3172 0.2637 0.2357 0.2354 0.2439 0.2388 0.2126 0.1722 0.1292 0.0946 0.0773 0.0799 0.0938 0.1012 0.0857 0.0420 -0.0204 -0.0805 -0.1164 -0.1192 -0.0979 -0.0714 -0.0526 -0.0400 -0.0232 0.0017 0.0215 0.0113 -0.0464 -0.1459 -0.2595 -0.3550 -0.4157 -0.4445 -0.4493 -0.4262 -0.3590 -0.2387 -0.0847 0.0589 0.1519 0.1836 0.1737 0.1510 0.1364 0.1386 0.1566 0.1816 0.1995 0.1987 0.1774 0.1433 0.1043 0.0623 0.0173 -0.0247 -0.0527 -0.0638 -0.0715 -0.0972 -0.1495 -0.2168 -0.2792 -0.3239 -0.3488 -0.3564 -0.3514 -0.3409 -0.3320 -0.3284 -0.3298 -0.3337 -0.3350 -0.3248 -0.2945 -0.2430 -0.1798 -0.1221 -0.0857 -0.0769 -0.0895 -0.1120 -0.1378 -0.1663 -0.1942 -0.2121 -0.2150 -0.2085 -0.2001 -0.1853
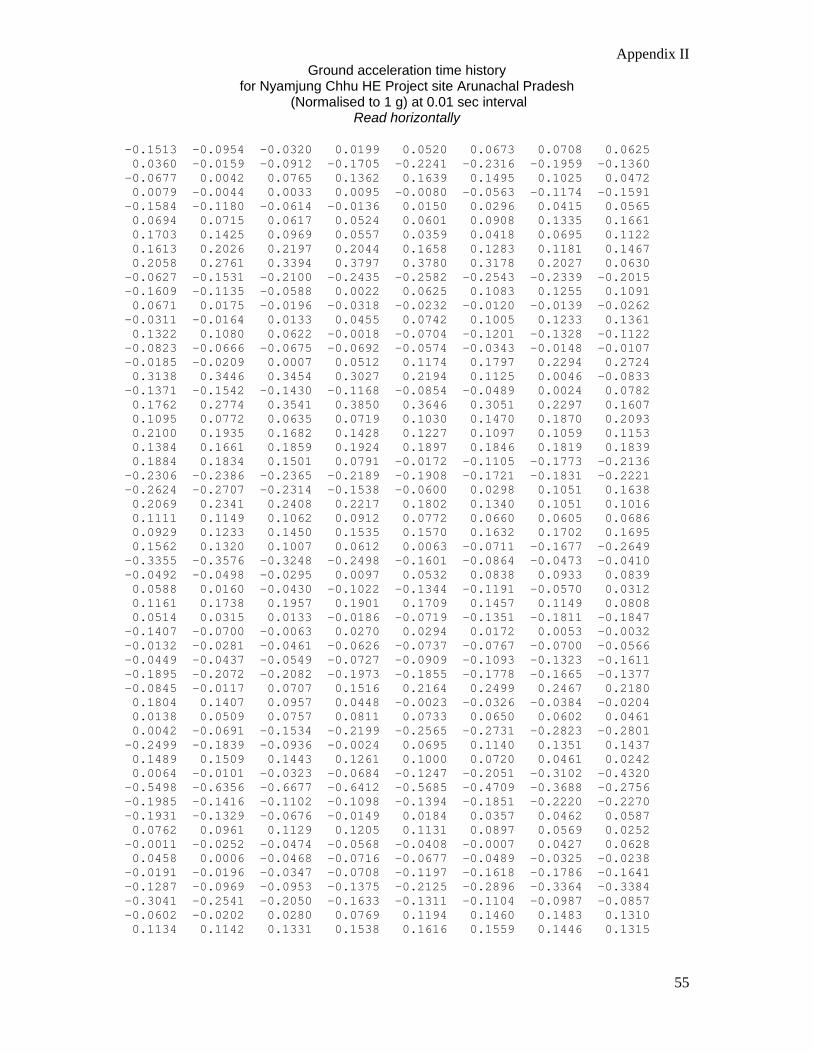
Appendix II Ground acceleration time history
for Nyamjung Chhu HE Project site Arunachal Pradesh (Normalised to 1 g) at 0.01 sec interval
Read horizontally
55
-0.1513 -0.0954 -0.0320 0.0199 0.0520 0.0673 0.0708 0.0625 0.0360 -0.0159 -0.0912 -0.1705 -0.2241 -0.2316 -0.1959 -0.1360 -0.0677 0.0042 0.0765 0.1362 0.1639 0.1495 0.1025 0.0472 0.0079 -0.0044 0.0033 0.0095 -0.0080 -0.0563 -0.1174 -0.1591 -0.1584 -0.1180 -0.0614 -0.0136 0.0150 0.0296 0.0415 0.0565 0.0694 0.0715 0.0617 0.0524 0.0601 0.0908 0.1335 0.1661 0.1703 0.1425 0.0969 0.0557 0.0359 0.0418 0.0695 0.1122 0.1613 0.2026 0.2197 0.2044 0.1658 0.1283 0.1181 0.1467 0.2058 0.2761 0.3394 0.3797 0.3780 0.3178 0.2027 0.0630 -0.0627 -0.1531 -0.2100 -0.2435 -0.2582 -0.2543 -0.2339 -0.2015 -0.1609 -0.1135 -0.0588 0.0022 0.0625 0.1083 0.1255 0.1091 0.0671 0.0175 -0.0196 -0.0318 -0.0232 -0.0120 -0.0139 -0.0262 -0.0311 -0.0164 0.0133 0.0455 0.0742 0.1005 0.1233 0.1361 0.1322 0.1080 0.0622 -0.0018 -0.0704 -0.1201 -0.1328 -0.1122 -0.0823 -0.0666 -0.0675 -0.0692 -0.0574 -0.0343 -0.0148 -0.0107 -0.0185 -0.0209 0.0007 0.0512 0.1174 0.1797 0.2294 0.2724 0.3138 0.3446 0.3454 0.3027 0.2194 0.1125 0.0046 -0.0833 -0.1371 -0.1542 -0.1430 -0.1168 -0.0854 -0.0489 0.0024 0.0782 0.1762 0.2774 0.3541 0.3850 0.3646 0.3051 0.2297 0.1607 0.1095 0.0772 0.0635 0.0719 0.1030 0.1470 0.1870 0.2093 0.2100 0.1935 0.1682 0.1428 0.1227 0.1097 0.1059 0.1153 0.1384 0.1661 0.1859 0.1924 0.1897 0.1846 0.1819 0.1839 0.1884 0.1834 0.1501 0.0791 -0.0172 -0.1105 -0.1773 -0.2136 -0.2306 -0.2386 -0.2365 -0.2189 -0.1908 -0.1721 -0.1831 -0.2221 -0.2624 -0.2707 -0.2314 -0.1538 -0.0600 0.0298 0.1051 0.1638 0.2069 0.2341 0.2408 0.2217 0.1802 0.1340 0.1051 0.1016 0.1111 0.1149 0.1062 0.0912 0.0772 0.0660 0.0605 0.0686 0.0929 0.1233 0.1450 0.1535 0.1570 0.1632 0.1702 0.1695 0.1562 0.1320 0.1007 0.0612 0.0063 -0.0711 -0.1677 -0.2649 -0.3355 -0.3576 -0.3248 -0.2498 -0.1601 -0.0864 -0.0473 -0.0410 -0.0492 -0.0498 -0.0295 0.0097 0.0532 0.0838 0.0933 0.0839 0.0588 0.0160 -0.0430 -0.1022 -0.1344 -0.1191 -0.0570 0.0312 0.1161 0.1738 0.1957 0.1901 0.1709 0.1457 0.1149 0.0808 0.0514 0.0315 0.0133 -0.0186 -0.0719 -0.1351 -0.1811 -0.1847 -0.1407 -0.0700 -0.0063 0.0270 0.0294 0.0172 0.0053 -0.0032 -0.0132 -0.0281 -0.0461 -0.0626 -0.0737 -0.0767 -0.0700 -0.0566 -0.0449 -0.0437 -0.0549 -0.0727 -0.0909 -0.1093 -0.1323 -0.1611 -0.1895 -0.2072 -0.2082 -0.1973 -0.1855 -0.1778 -0.1665 -0.1377 -0.0845 -0.0117 0.0707 0.1516 0.2164 0.2499 0.2467 0.2180 0.1804 0.1407 0.0957 0.0448 -0.0023 -0.0326 -0.0384 -0.0204 0.0138 0.0509 0.0757 0.0811 0.0733 0.0650 0.0602 0.0461 0.0042 -0.0691 -0.1534 -0.2199 -0.2565 -0.2731 -0.2823 -0.2801 -0.2499 -0.1839 -0.0936 -0.0024 0.0695 0.1140 0.1351 0.1437 0.1489 0.1509 0.1443 0.1261 0.1000 0.0720 0.0461 0.0242 0.0064 -0.0101 -0.0323 -0.0684 -0.1247 -0.2051 -0.3102 -0.4320 -0.5498 -0.6356 -0.6677 -0.6412 -0.5685 -0.4709 -0.3688 -0.2756 -0.1985 -0.1416 -0.1102 -0.1098 -0.1394 -0.1851 -0.2220 -0.2270 -0.1931 -0.1329 -0.0676 -0.0149 0.0184 0.0357 0.0462 0.0587 0.0762 0.0961 0.1129 0.1205 0.1131 0.0897 0.0569 0.0252 -0.0011 -0.0252 -0.0474 -0.0568 -0.0408 -0.0007 0.0427 0.0628 0.0458 0.0006 -0.0468 -0.0716 -0.0677 -0.0489 -0.0325 -0.0238 -0.0191 -0.0196 -0.0347 -0.0708 -0.1197 -0.1618 -0.1786 -0.1641 -0.1287 -0.0969 -0.0953 -0.1375 -0.2125 -0.2896 -0.3364 -0.3384 -0.3041 -0.2541 -0.2050 -0.1633 -0.1311 -0.1104 -0.0987 -0.0857 -0.0602 -0.0202 0.0280 0.0769 0.1194 0.1460 0.1483 0.1310 0.1134 0.1142 0.1331 0.1538 0.1616 0.1559 0.1446 0.1315
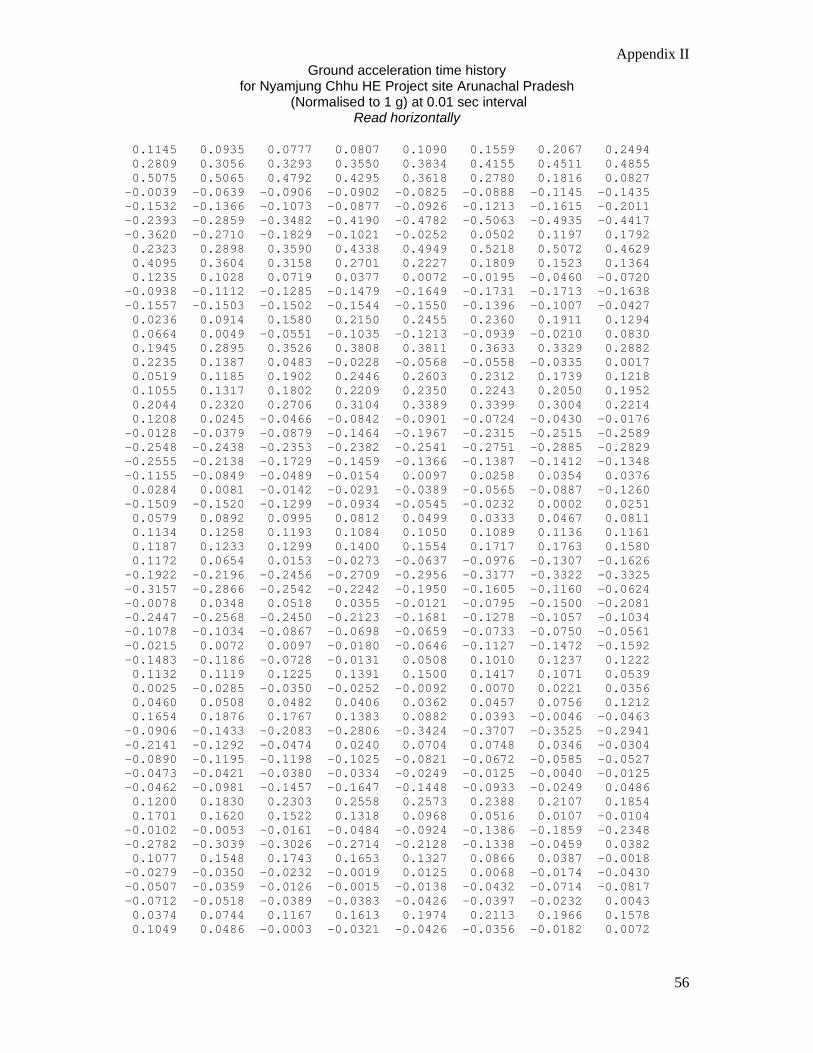
Appendix II Ground acceleration time history
for Nyamjung Chhu HE Project site Arunachal Pradesh (Normalised to 1 g) at 0.01 sec interval
Read horizontally
56
0.1145 0.0935 0.0777 0.0807 0.1090 0.1559 0.2067 0.2494 0.2809 0.3056 0.3293 0.3550 0.3834 0.4155 0.4511 0.4855 0.5075 0.5065 0.4792 0.4295 0.3618 0.2780 0.1816 0.0827 -0.0039 -0.0639 -0.0906 -0.0902 -0.0825 -0.0888 -0.1145 -0.1435 -0.1532 -0.1366 -0.1073 -0.0877 -0.0926 -0.1213 -0.1615 -0.2011 -0.2393 -0.2859 -0.3482 -0.4190 -0.4782 -0.5063 -0.4935 -0.4417 -0.3620 -0.2710 -0.1829 -0.1021 -0.0252 0.0502 0.1197 0.1792 0.2323 0.2898 0.3590 0.4338 0.4949 0.5218 0.5072 0.4629 0.4095 0.3604 0.3158 0.2701 0.2227 0.1809 0.1523 0.1364 0.1235 0.1028 0.0719 0.0377 0.0072 -0.0195 -0.0460 -0.0720 -0.0938 -0.1112 -0.1285 -0.1479 -0.1649 -0.1731 -0.1713 -0.1638 -0.1557 -0.1503 -0.1502 -0.1544 -0.1550 -0.1396 -0.1007 -0.0427 0.0236 0.0914 0.1580 0.2150 0.2455 0.2360 0.1911 0.1294 0.0664 0.0049 -0.0551 -0.1035 -0.1213 -0.0939 -0.0210 0.0830 0.1945 0.2895 0.3526 0.3808 0.3811 0.3633 0.3329 0.2882 0.2235 0.1387 0.0483 -0.0228 -0.0568 -0.0558 -0.0335 0.0017 0.0519 0.1185 0.1902 0.2446 0.2603 0.2312 0.1739 0.1218 0.1055 0.1317 0.1802 0.2209 0.2350 0.2243 0.2050 0.1952 0.2044 0.2320 0.2706 0.3104 0.3389 0.3399 0.3004 0.2214 0.1208 0.0245 -0.0466 -0.0842 -0.0901 -0.0724 -0.0430 -0.0176 -0.0128 -0.0379 -0.0879 -0.1464 -0.1967 -0.2315 -0.2515 -0.2589 -0.2548 -0.2438 -0.2353 -0.2382 -0.2541 -0.2751 -0.2885 -0.2829 -0.2555 -0.2138 -0.1729 -0.1459 -0.1366 -0.1387 -0.1412 -0.1348 -0.1155 -0.0849 -0.0489 -0.0154 0.0097 0.0258 0.0354 0.0376 0.0284 0.0081 -0.0142 -0.0291 -0.0389 -0.0565 -0.0887 -0.1260 -0.1509 -0.1520 -0.1299 -0.0934 -0.0545 -0.0232 0.0002 0.0251 0.0579 0.0892 0.0995 0.0812 0.0499 0.0333 0.0467 0.0811 0.1134 0.1258 0.1193 0.1084 0.1050 0.1089 0.1136 0.1161 0.1187 0.1233 0.1299 0.1400 0.1554 0.1717 0.1763 0.1580 0.1172 0.0654 0.0153 -0.0273 -0.0637 -0.0976 -0.1307 -0.1626 -0.1922 -0.2196 -0.2456 -0.2709 -0.2956 -0.3177 -0.3322 -0.3325 -0.3157 -0.2866 -0.2542 -0.2242 -0.1950 -0.1605 -0.1160 -0.0624 -0.0078 0.0348 0.0518 0.0355 -0.0121 -0.0795 -0.1500 -0.2081 -0.2447 -0.2568 -0.2450 -0.2123 -0.1681 -0.1278 -0.1057 -0.1034 -0.1078 -0.1034 -0.0867 -0.0698 -0.0659 -0.0733 -0.0750 -0.0561 -0.0215 0.0072 0.0097 -0.0180 -0.0646 -0.1127 -0.1472 -0.1592 -0.1483 -0.1186 -0.0728 -0.0131 0.0508 0.1010 0.1237 0.1222 0.1132 0.1119 0.1225 0.1391 0.1500 0.1417 0.1071 0.0539 0.0025 -0.0285 -0.0350 -0.0252 -0.0092 0.0070 0.0221 0.0356 0.0460 0.0508 0.0482 0.0406 0.0362 0.0457 0.0756 0.1212 0.1654 0.1876 0.1767 0.1383 0.0882 0.0393 -0.0046 -0.0463 -0.0906 -0.1433 -0.2083 -0.2806 -0.3424 -0.3707 -0.3525 -0.2941 -0.2141 -0.1292 -0.0474 0.0240 0.0704 0.0748 0.0346 -0.0304 -0.0890 -0.1195 -0.1198 -0.1025 -0.0821 -0.0672 -0.0585 -0.0527 -0.0473 -0.0421 -0.0380 -0.0334 -0.0249 -0.0125 -0.0040 -0.0125 -0.0462 -0.0981 -0.1457 -0.1647 -0.1448 -0.0933 -0.0249 0.0486 0.1200 0.1830 0.2303 0.2558 0.2573 0.2388 0.2107 0.1854 0.1701 0.1620 0.1522 0.1318 0.0968 0.0516 0.0107 -0.0104 -0.0102 -0.0053 -0.0161 -0.0484 -0.0924 -0.1386 -0.1859 -0.2348 -0.2782 -0.3039 -0.3026 -0.2714 -0.2128 -0.1338 -0.0459 0.0382 0.1077 0.1548 0.1743 0.1653 0.1327 0.0866 0.0387 -0.0018 -0.0279 -0.0350 -0.0232 -0.0019 0.0125 0.0068 -0.0174 -0.0430 -0.0507 -0.0359 -0.0126 -0.0015 -0.0138 -0.0432 -0.0714 -0.0817 -0.0712 -0.0518 -0.0389 -0.0383 -0.0426 -0.0397 -0.0232 0.0043 0.0374 0.0744 0.1167 0.1613 0.1974 0.2113 0.1966 0.1578 0.1049 0.0486 -0.0003 -0.0321 -0.0426 -0.0356 -0.0182 0.0072
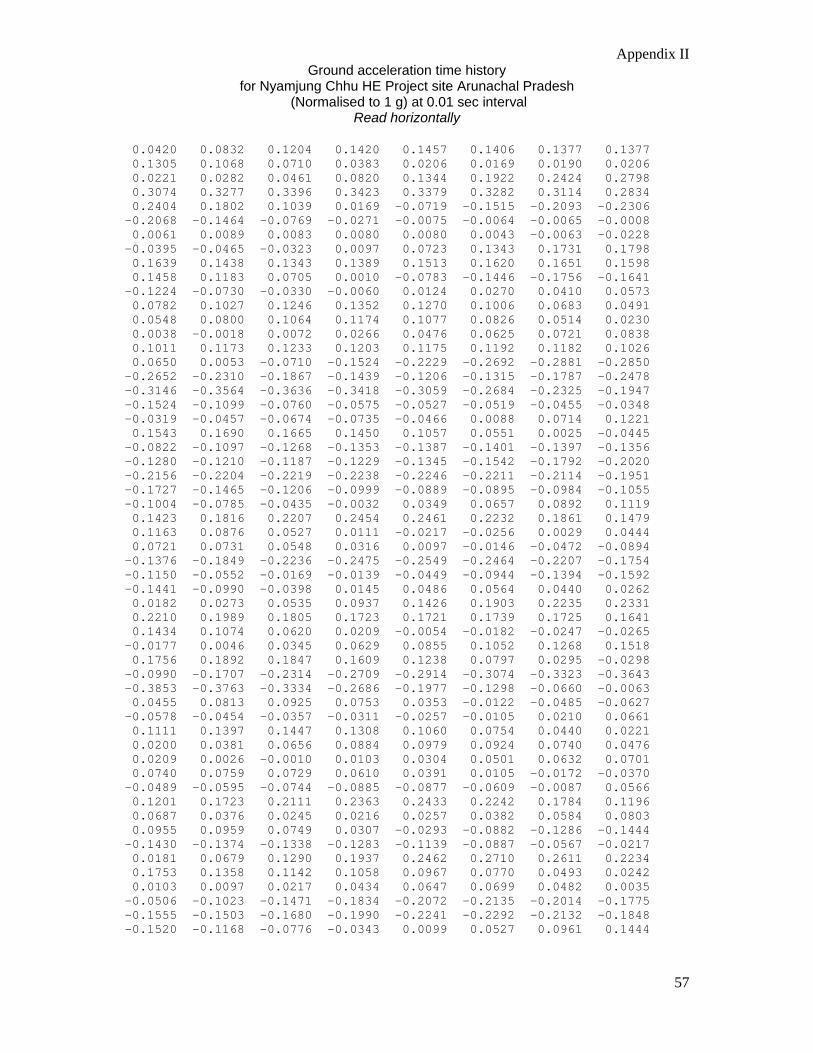
Appendix II Ground acceleration time history
for Nyamjung Chhu HE Project site Arunachal Pradesh (Normalised to 1 g) at 0.01 sec interval
Read horizontally
57
0.0420 0.0832 0.1204 0.1420 0.1457 0.1406 0.1377 0.1377 0.1305 0.1068 0.0710 0.0383 0.0206 0.0169 0.0190 0.0206 0.0221 0.0282 0.0461 0.0820 0.1344 0.1922 0.2424 0.2798 0.3074 0.3277 0.3396 0.3423 0.3379 0.3282 0.3114 0.2834 0.2404 0.1802 0.1039 0.0169 -0.0719 -0.1515 -0.2093 -0.2306 -0.2068 -0.1464 -0.0769 -0.0271 -0.0075 -0.0064 -0.0065 -0.0008 0.0061 0.0089 0.0083 0.0080 0.0080 0.0043 -0.0063 -0.0228 -0.0395 -0.0465 -0.0323 0.0097 0.0723 0.1343 0.1731 0.1798 0.1639 0.1438 0.1343 0.1389 0.1513 0.1620 0.1651 0.1598 0.1458 0.1183 0.0705 0.0010 -0.0783 -0.1446 -0.1756 -0.1641 -0.1224 -0.0730 -0.0330 -0.0060 0.0124 0.0270 0.0410 0.0573 0.0782 0.1027 0.1246 0.1352 0.1270 0.1006 0.0683 0.0491 0.0548 0.0800 0.1064 0.1174 0.1077 0.0826 0.0514 0.0230 0.0038 -0.0018 0.0072 0.0266 0.0476 0.0625 0.0721 0.0838 0.1011 0.1173 0.1233 0.1203 0.1175 0.1192 0.1182 0.1026 0.0650 0.0053 -0.0710 -0.1524 -0.2229 -0.2692 -0.2881 -0.2850 -0.2652 -0.2310 -0.1867 -0.1439 -0.1206 -0.1315 -0.1787 -0.2478 -0.3146 -0.3564 -0.3636 -0.3418 -0.3059 -0.2684 -0.2325 -0.1947 -0.1524 -0.1099 -0.0760 -0.0575 -0.0527 -0.0519 -0.0455 -0.0348 -0.0319 -0.0457 -0.0674 -0.0735 -0.0466 0.0088 0.0714 0.1221 0.1543 0.1690 0.1665 0.1450 0.1057 0.0551 0.0025 -0.0445 -0.0822 -0.1097 -0.1268 -0.1353 -0.1387 -0.1401 -0.1397 -0.1356 -0.1280 -0.1210 -0.1187 -0.1229 -0.1345 -0.1542 -0.1792 -0.2020 -0.2156 -0.2204 -0.2219 -0.2238 -0.2246 -0.2211 -0.2114 -0.1951 -0.1727 -0.1465 -0.1206 -0.0999 -0.0889 -0.0895 -0.0984 -0.1055 -0.1004 -0.0785 -0.0435 -0.0032 0.0349 0.0657 0.0892 0.1119 0.1423 0.1816 0.2207 0.2454 0.2461 0.2232 0.1861 0.1479 0.1163 0.0876 0.0527 0.0111 -0.0217 -0.0256 0.0029 0.0444 0.0721 0.0731 0.0548 0.0316 0.0097 -0.0146 -0.0472 -0.0894 -0.1376 -0.1849 -0.2236 -0.2475 -0.2549 -0.2464 -0.2207 -0.1754 -0.1150 -0.0552 -0.0169 -0.0139 -0.0449 -0.0944 -0.1394 -0.1592 -0.1441 -0.0990 -0.0398 0.0145 0.0486 0.0564 0.0440 0.0262 0.0182 0.0273 0.0535 0.0937 0.1426 0.1903 0.2235 0.2331 0.2210 0.1989 0.1805 0.1723 0.1721 0.1739 0.1725 0.1641 0.1434 0.1074 0.0620 0.0209 -0.0054 -0.0182 -0.0247 -0.0265 -0.0177 0.0046 0.0345 0.0629 0.0855 0.1052 0.1268 0.1518 0.1756 0.1892 0.1847 0.1609 0.1238 0.0797 0.0295 -0.0298 -0.0990 -0.1707 -0.2314 -0.2709 -0.2914 -0.3074 -0.3323 -0.3643 -0.3853 -0.3763 -0.3334 -0.2686 -0.1977 -0.1298 -0.0660 -0.0063 0.0455 0.0813 0.0925 0.0753 0.0353 -0.0122 -0.0485 -0.0627 -0.0578 -0.0454 -0.0357 -0.0311 -0.0257 -0.0105 0.0210 0.0661 0.1111 0.1397 0.1447 0.1308 0.1060 0.0754 0.0440 0.0221 0.0200 0.0381 0.0656 0.0884 0.0979 0.0924 0.0740 0.0476 0.0209 0.0026 -0.0010 0.0103 0.0304 0.0501 0.0632 0.0701 0.0740 0.0759 0.0729 0.0610 0.0391 0.0105 -0.0172 -0.0370 -0.0489 -0.0595 -0.0744 -0.0885 -0.0877 -0.0609 -0.0087 0.0566 0.1201 0.1723 0.2111 0.2363 0.2433 0.2242 0.1784 0.1196 0.0687 0.0376 0.0245 0.0216 0.0257 0.0382 0.0584 0.0803 0.0955 0.0959 0.0749 0.0307 -0.0293 -0.0882 -0.1286 -0.1444 -0.1430 -0.1374 -0.1338 -0.1283 -0.1139 -0.0887 -0.0567 -0.0217 0.0181 0.0679 0.1290 0.1937 0.2462 0.2710 0.2611 0.2234 0.1753 0.1358 0.1142 0.1058 0.0967 0.0770 0.0493 0.0242 0.0103 0.0097 0.0217 0.0434 0.0647 0.0699 0.0482 0.0035 -0.0506 -0.1023 -0.1471 -0.1834 -0.2072 -0.2135 -0.2014 -0.1775 -0.1555 -0.1503 -0.1680 -0.1990 -0.2241 -0.2292 -0.2132 -0.1848 -0.1520 -0.1168 -0.0776 -0.0343 0.0099 0.0527 0.0961 0.1444
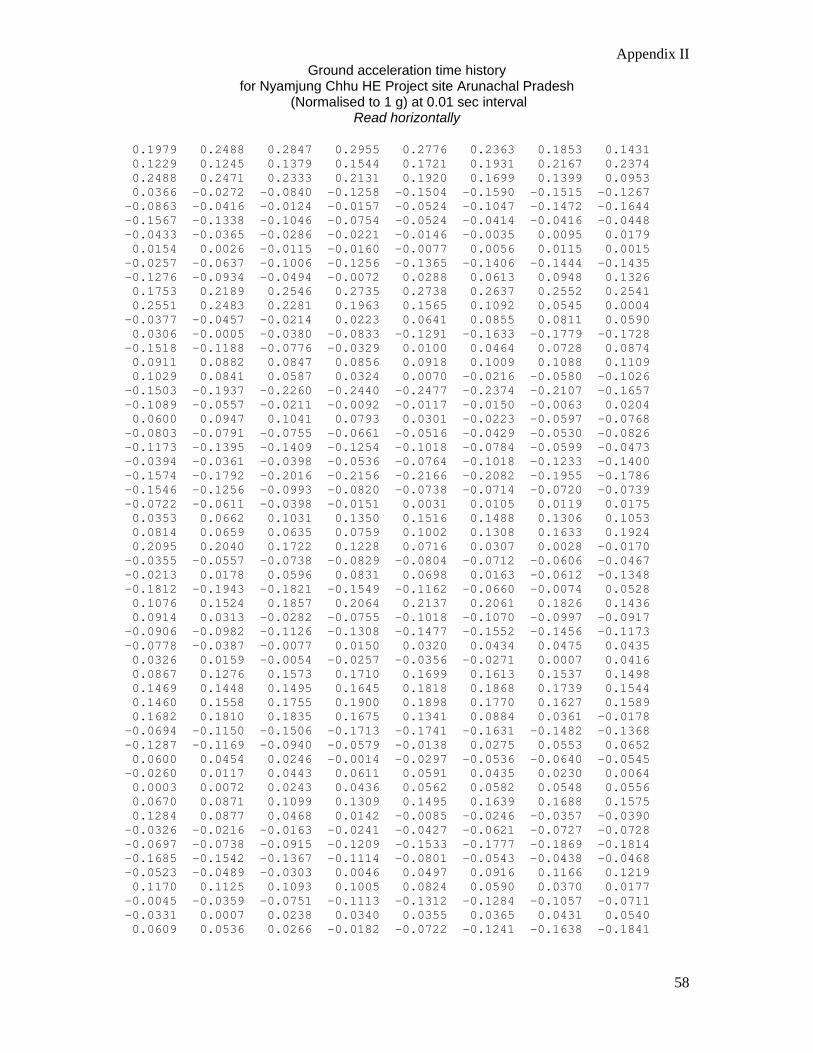
Appendix II Ground acceleration time history
for Nyamjung Chhu HE Project site Arunachal Pradesh (Normalised to 1 g) at 0.01 sec interval
Read horizontally
58
0.1979 0.2488 0.2847 0.2955 0.2776 0.2363 0.1853 0.1431 0.1229 0.1245 0.1379 0.1544 0.1721 0.1931 0.2167 0.2374 0.2488 0.2471 0.2333 0.2131 0.1920 0.1699 0.1399 0.0953 0.0366 -0.0272 -0.0840 -0.1258 -0.1504 -0.1590 -0.1515 -0.1267 -0.0863 -0.0416 -0.0124 -0.0157 -0.0524 -0.1047 -0.1472 -0.1644 -0.1567 -0.1338 -0.1046 -0.0754 -0.0524 -0.0414 -0.0416 -0.0448 -0.0433 -0.0365 -0.0286 -0.0221 -0.0146 -0.0035 0.0095 0.0179 0.0154 0.0026 -0.0115 -0.0160 -0.0077 0.0056 0.0115 0.0015 -0.0257 -0.0637 -0.1006 -0.1256 -0.1365 -0.1406 -0.1444 -0.1435 -0.1276 -0.0934 -0.0494 -0.0072 0.0288 0.0613 0.0948 0.1326 0.1753 0.2189 0.2546 0.2735 0.2738 0.2637 0.2552 0.2541 0.2551 0.2483 0.2281 0.1963 0.1565 0.1092 0.0545 0.0004 -0.0377 -0.0457 -0.0214 0.0223 0.0641 0.0855 0.0811 0.0590 0.0306 -0.0005 -0.0380 -0.0833 -0.1291 -0.1633 -0.1779 -0.1728 -0.1518 -0.1188 -0.0776 -0.0329 0.0100 0.0464 0.0728 0.0874 0.0911 0.0882 0.0847 0.0856 0.0918 0.1009 0.1088 0.1109 0.1029 0.0841 0.0587 0.0324 0.0070 -0.0216 -0.0580 -0.1026 -0.1503 -0.1937 -0.2260 -0.2440 -0.2477 -0.2374 -0.2107 -0.1657 -0.1089 -0.0557 -0.0211 -0.0092 -0.0117 -0.0150 -0.0063 0.0204 0.0600 0.0947 0.1041 0.0793 0.0301 -0.0223 -0.0597 -0.0768 -0.0803 -0.0791 -0.0755 -0.0661 -0.0516 -0.0429 -0.0530 -0.0826 -0.1173 -0.1395 -0.1409 -0.1254 -0.1018 -0.0784 -0.0599 -0.0473 -0.0394 -0.0361 -0.0398 -0.0536 -0.0764 -0.1018 -0.1233 -0.1400 -0.1574 -0.1792 -0.2016 -0.2156 -0.2166 -0.2082 -0.1955 -0.1786 -0.1546 -0.1256 -0.0993 -0.0820 -0.0738 -0.0714 -0.0720 -0.0739 -0.0722 -0.0611 -0.0398 -0.0151 0.0031 0.0105 0.0119 0.0175 0.0353 0.0662 0.1031 0.1350 0.1516 0.1488 0.1306 0.1053 0.0814 0.0659 0.0635 0.0759 0.1002 0.1308 0.1633 0.1924 0.2095 0.2040 0.1722 0.1228 0.0716 0.0307 0.0028 -0.0170 -0.0355 -0.0557 -0.0738 -0.0829 -0.0804 -0.0712 -0.0606 -0.0467 -0.0213 0.0178 0.0596 0.0831 0.0698 0.0163 -0.0612 -0.1348 -0.1812 -0.1943 -0.1821 -0.1549 -0.1162 -0.0660 -0.0074 0.0528 0.1076 0.1524 0.1857 0.2064 0.2137 0.2061 0.1826 0.1436 0.0914 0.0313 -0.0282 -0.0755 -0.1018 -0.1070 -0.0997 -0.0917 -0.0906 -0.0982 -0.1126 -0.1308 -0.1477 -0.1552 -0.1456 -0.1173 -0.0778 -0.0387 -0.0077 0.0150 0.0320 0.0434 0.0475 0.0435 0.0326 0.0159 -0.0054 -0.0257 -0.0356 -0.0271 0.0007 0.0416 0.0867 0.1276 0.1573 0.1710 0.1699 0.1613 0.1537 0.1498 0.1469 0.1448 0.1495 0.1645 0.1818 0.1868 0.1739 0.1544 0.1460 0.1558 0.1755 0.1900 0.1898 0.1770 0.1627 0.1589 0.1682 0.1810 0.1835 0.1675 0.1341 0.0884 0.0361 -0.0178 -0.0694 -0.1150 -0.1506 -0.1713 -0.1741 -0.1631 -0.1482 -0.1368 -0.1287 -0.1169 -0.0940 -0.0579 -0.0138 0.0275 0.0553 0.0652 0.0600 0.0454 0.0246 -0.0014 -0.0297 -0.0536 -0.0640 -0.0545 -0.0260 0.0117 0.0443 0.0611 0.0591 0.0435 0.0230 0.0064 0.0003 0.0072 0.0243 0.0436 0.0562 0.0582 0.0548 0.0556 0.0670 0.0871 0.1099 0.1309 0.1495 0.1639 0.1688 0.1575 0.1284 0.0877 0.0468 0.0142 -0.0085 -0.0246 -0.0357 -0.0390 -0.0326 -0.0216 -0.0163 -0.0241 -0.0427 -0.0621 -0.0727 -0.0728 -0.0697 -0.0738 -0.0915 -0.1209 -0.1533 -0.1777 -0.1869 -0.1814 -0.1685 -0.1542 -0.1367 -0.1114 -0.0801 -0.0543 -0.0438 -0.0468 -0.0523 -0.0489 -0.0303 0.0046 0.0497 0.0916 0.1166 0.1219 0.1170 0.1125 0.1093 0.1005 0.0824 0.0590 0.0370 0.0177 -0.0045 -0.0359 -0.0751 -0.1113 -0.1312 -0.1284 -0.1057 -0.0711 -0.0331 0.0007 0.0238 0.0340 0.0355 0.0365 0.0431 0.0540 0.0609 0.0536 0.0266 -0.0182 -0.0722 -0.1241 -0.1638 -0.1841
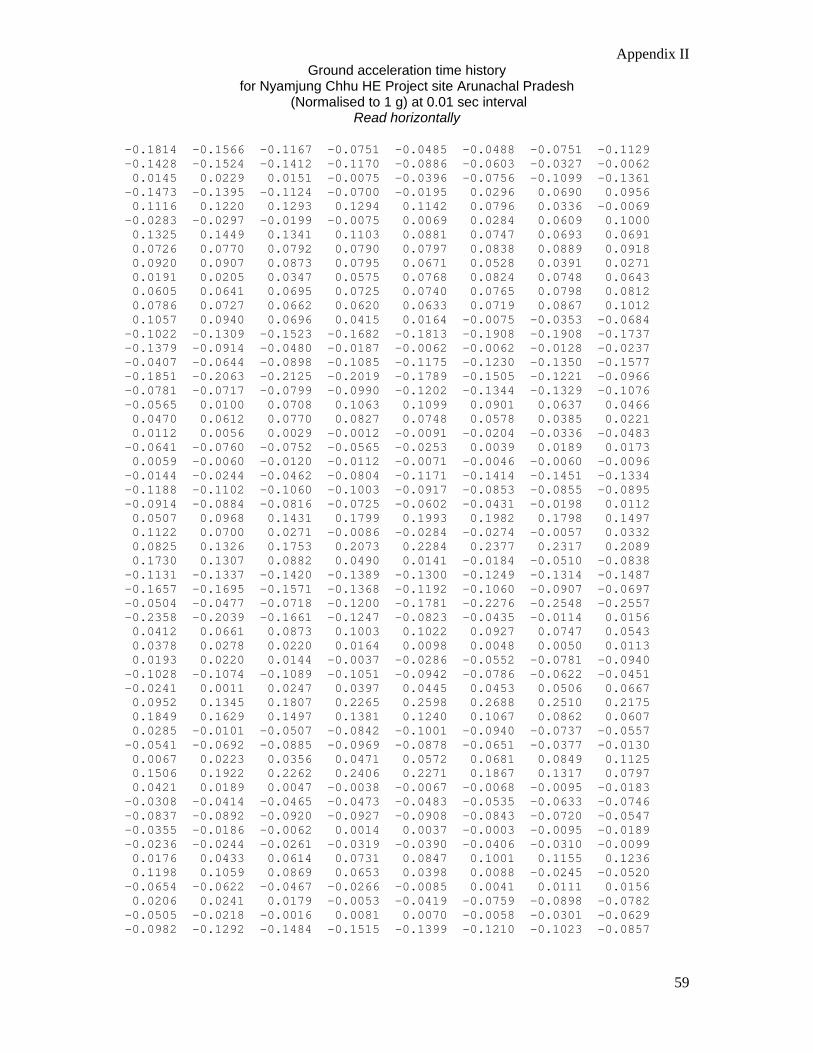
Appendix II Ground acceleration time history
for Nyamjung Chhu HE Project site Arunachal Pradesh (Normalised to 1 g) at 0.01 sec interval
Read horizontally
59
-0.1814 -0.1566 -0.1167 -0.0751 -0.0485 -0.0488 -0.0751 -0.1129 -0.1428 -0.1524 -0.1412 -0.1170 -0.0886 -0.0603 -0.0327 -0.0062 0.0145 0.0229 0.0151 -0.0075 -0.0396 -0.0756 -0.1099 -0.1361 -0.1473 -0.1395 -0.1124 -0.0700 -0.0195 0.0296 0.0690 0.0956 0.1116 0.1220 0.1293 0.1294 0.1142 0.0796 0.0336 -0.0069 -0.0283 -0.0297 -0.0199 -0.0075 0.0069 0.0284 0.0609 0.1000 0.1325 0.1449 0.1341 0.1103 0.0881 0.0747 0.0693 0.0691 0.0726 0.0770 0.0792 0.0790 0.0797 0.0838 0.0889 0.0918 0.0920 0.0907 0.0873 0.0795 0.0671 0.0528 0.0391 0.0271 0.0191 0.0205 0.0347 0.0575 0.0768 0.0824 0.0748 0.0643 0.0605 0.0641 0.0695 0.0725 0.0740 0.0765 0.0798 0.0812 0.0786 0.0727 0.0662 0.0620 0.0633 0.0719 0.0867 0.1012 0.1057 0.0940 0.0696 0.0415 0.0164 -0.0075 -0.0353 -0.0684 -0.1022 -0.1309 -0.1523 -0.1682 -0.1813 -0.1908 -0.1908 -0.1737 -0.1379 -0.0914 -0.0480 -0.0187 -0.0062 -0.0062 -0.0128 -0.0237 -0.0407 -0.0644 -0.0898 -0.1085 -0.1175 -0.1230 -0.1350 -0.1577 -0.1851 -0.2063 -0.2125 -0.2019 -0.1789 -0.1505 -0.1221 -0.0966 -0.0781 -0.0717 -0.0799 -0.0990 -0.1202 -0.1344 -0.1329 -0.1076 -0.0565 0.0100 0.0708 0.1063 0.1099 0.0901 0.0637 0.0466 0.0470 0.0612 0.0770 0.0827 0.0748 0.0578 0.0385 0.0221 0.0112 0.0056 0.0029 -0.0012 -0.0091 -0.0204 -0.0336 -0.0483 -0.0641 -0.0760 -0.0752 -0.0565 -0.0253 0.0039 0.0189 0.0173 0.0059 -0.0060 -0.0120 -0.0112 -0.0071 -0.0046 -0.0060 -0.0096 -0.0144 -0.0244 -0.0462 -0.0804 -0.1171 -0.1414 -0.1451 -0.1334 -0.1188 -0.1102 -0.1060 -0.1003 -0.0917 -0.0853 -0.0855 -0.0895 -0.0914 -0.0884 -0.0816 -0.0725 -0.0602 -0.0431 -0.0198 0.0112 0.0507 0.0968 0.1431 0.1799 0.1993 0.1982 0.1798 0.1497 0.1122 0.0700 0.0271 -0.0086 -0.0284 -0.0274 -0.0057 0.0332 0.0825 0.1326 0.1753 0.2073 0.2284 0.2377 0.2317 0.2089 0.1730 0.1307 0.0882 0.0490 0.0141 -0.0184 -0.0510 -0.0838 -0.1131 -0.1337 -0.1420 -0.1389 -0.1300 -0.1249 -0.1314 -0.1487 -0.1657 -0.1695 -0.1571 -0.1368 -0.1192 -0.1060 -0.0907 -0.0697 -0.0504 -0.0477 -0.0718 -0.1200 -0.1781 -0.2276 -0.2548 -0.2557 -0.2358 -0.2039 -0.1661 -0.1247 -0.0823 -0.0435 -0.0114 0.0156 0.0412 0.0661 0.0873 0.1003 0.1022 0.0927 0.0747 0.0543 0.0378 0.0278 0.0220 0.0164 0.0098 0.0048 0.0050 0.0113 0.0193 0.0220 0.0144 -0.0037 -0.0286 -0.0552 -0.0781 -0.0940 -0.1028 -0.1074 -0.1089 -0.1051 -0.0942 -0.0786 -0.0622 -0.0451 -0.0241 0.0011 0.0247 0.0397 0.0445 0.0453 0.0506 0.0667 0.0952 0.1345 0.1807 0.2265 0.2598 0.2688 0.2510 0.2175 0.1849 0.1629 0.1497 0.1381 0.1240 0.1067 0.0862 0.0607 0.0285 -0.0101 -0.0507 -0.0842 -0.1001 -0.0940 -0.0737 -0.0557 -0.0541 -0.0692 -0.0885 -0.0969 -0.0878 -0.0651 -0.0377 -0.0130 0.0067 0.0223 0.0356 0.0471 0.0572 0.0681 0.0849 0.1125 0.1506 0.1922 0.2262 0.2406 0.2271 0.1867 0.1317 0.0797 0.0421 0.0189 0.0047 -0.0038 -0.0067 -0.0068 -0.0095 -0.0183 -0.0308 -0.0414 -0.0465 -0.0473 -0.0483 -0.0535 -0.0633 -0.0746 -0.0837 -0.0892 -0.0920 -0.0927 -0.0908 -0.0843 -0.0720 -0.0547 -0.0355 -0.0186 -0.0062 0.0014 0.0037 -0.0003 -0.0095 -0.0189 -0.0236 -0.0244 -0.0261 -0.0319 -0.0390 -0.0406 -0.0310 -0.0099 0.0176 0.0433 0.0614 0.0731 0.0847 0.1001 0.1155 0.1236 0.1198 0.1059 0.0869 0.0653 0.0398 0.0088 -0.0245 -0.0520 -0.0654 -0.0622 -0.0467 -0.0266 -0.0085 0.0041 0.0111 0.0156 0.0206 0.0241 0.0179 -0.0053 -0.0419 -0.0759 -0.0898 -0.0782 -0.0505 -0.0218 -0.0016 0.0081 0.0070 -0.0058 -0.0301 -0.0629 -0.0982 -0.1292 -0.1484 -0.1515 -0.1399 -0.1210 -0.1023 -0.0857
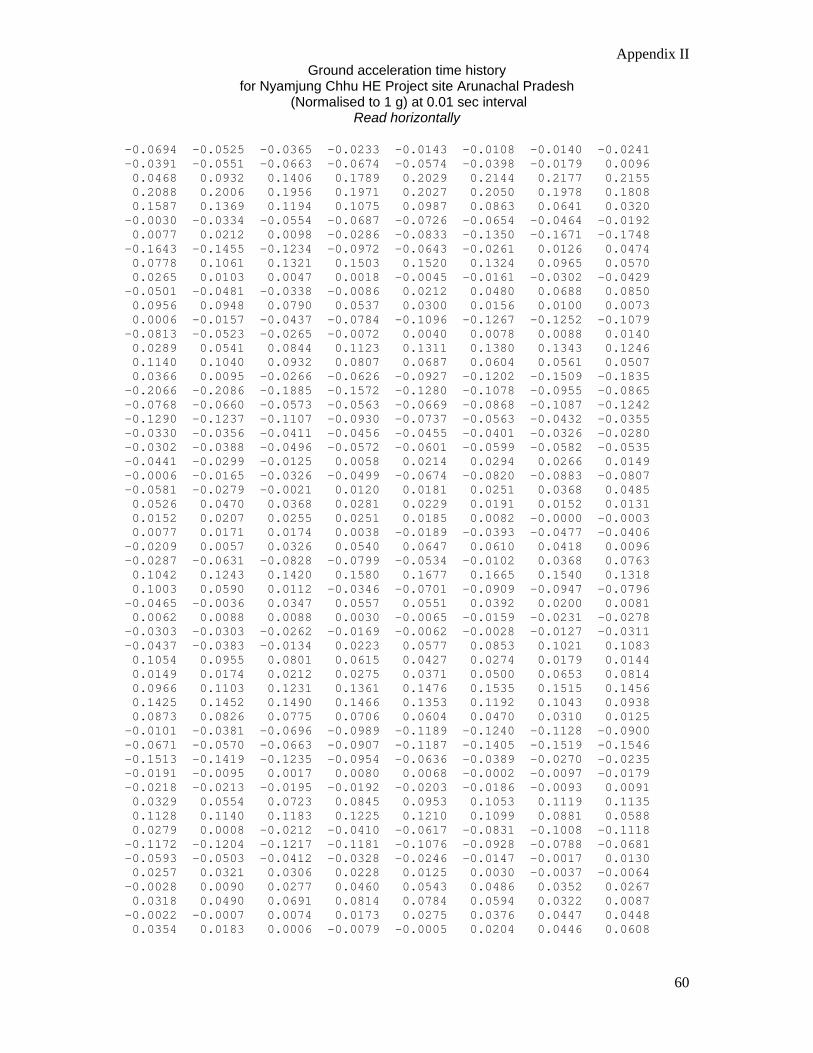
Appendix II Ground acceleration time history
for Nyamjung Chhu HE Project site Arunachal Pradesh (Normalised to 1 g) at 0.01 sec interval
Read horizontally
60
-0.0694 -0.0525 -0.0365 -0.0233 -0.0143 -0.0108 -0.0140 -0.0241 -0.0391 -0.0551 -0.0663 -0.0674 -0.0574 -0.0398 -0.0179 0.0096 0.0468 0.0932 0.1406 0.1789 0.2029 0.2144 0.2177 0.2155 0.2088 0.2006 0.1956 0.1971 0.2027 0.2050 0.1978 0.1808 0.1587 0.1369 0.1194 0.1075 0.0987 0.0863 0.0641 0.0320 -0.0030 -0.0334 -0.0554 -0.0687 -0.0726 -0.0654 -0.0464 -0.0192 0.0077 0.0212 0.0098 -0.0286 -0.0833 -0.1350 -0.1671 -0.1748 -0.1643 -0.1455 -0.1234 -0.0972 -0.0643 -0.0261 0.0126 0.0474 0.0778 0.1061 0.1321 0.1503 0.1520 0.1324 0.0965 0.0570 0.0265 0.0103 0.0047 0.0018 -0.0045 -0.0161 -0.0302 -0.0429 -0.0501 -0.0481 -0.0338 -0.0086 0.0212 0.0480 0.0688 0.0850 0.0956 0.0948 0.0790 0.0537 0.0300 0.0156 0.0100 0.0073 0.0006 -0.0157 -0.0437 -0.0784 -0.1096 -0.1267 -0.1252 -0.1079 -0.0813 -0.0523 -0.0265 -0.0072 0.0040 0.0078 0.0088 0.0140 0.0289 0.0541 0.0844 0.1123 0.1311 0.1380 0.1343 0.1246 0.1140 0.1040 0.0932 0.0807 0.0687 0.0604 0.0561 0.0507 0.0366 0.0095 -0.0266 -0.0626 -0.0927 -0.1202 -0.1509 -0.1835 -0.2066 -0.2086 -0.1885 -0.1572 -0.1280 -0.1078 -0.0955 -0.0865 -0.0768 -0.0660 -0.0573 -0.0563 -0.0669 -0.0868 -0.1087 -0.1242 -0.1290 -0.1237 -0.1107 -0.0930 -0.0737 -0.0563 -0.0432 -0.0355 -0.0330 -0.0356 -0.0411 -0.0456 -0.0455 -0.0401 -0.0326 -0.0280 -0.0302 -0.0388 -0.0496 -0.0572 -0.0601 -0.0599 -0.0582 -0.0535 -0.0441 -0.0299 -0.0125 0.0058 0.0214 0.0294 0.0266 0.0149 -0.0006 -0.0165 -0.0326 -0.0499 -0.0674 -0.0820 -0.0883 -0.0807 -0.0581 -0.0279 -0.0021 0.0120 0.0181 0.0251 0.0368 0.0485 0.0526 0.0470 0.0368 0.0281 0.0229 0.0191 0.0152 0.0131 0.0152 0.0207 0.0255 0.0251 0.0185 0.0082 -0.0000 -0.0003 0.0077 0.0171 0.0174 0.0038 -0.0189 -0.0393 -0.0477 -0.0406 -0.0209 0.0057 0.0326 0.0540 0.0647 0.0610 0.0418 0.0096 -0.0287 -0.0631 -0.0828 -0.0799 -0.0534 -0.0102 0.0368 0.0763 0.1042 0.1243 0.1420 0.1580 0.1677 0.1665 0.1540 0.1318 0.1003 0.0590 0.0112 -0.0346 -0.0701 -0.0909 -0.0947 -0.0796 -0.0465 -0.0036 0.0347 0.0557 0.0551 0.0392 0.0200 0.0081 0.0062 0.0088 0.0088 0.0030 -0.0065 -0.0159 -0.0231 -0.0278 -0.0303 -0.0303 -0.0262 -0.0169 -0.0062 -0.0028 -0.0127 -0.0311 -0.0437 -0.0383 -0.0134 0.0223 0.0577 0.0853 0.1021 0.1083 0.1054 0.0955 0.0801 0.0615 0.0427 0.0274 0.0179 0.0144 0.0149 0.0174 0.0212 0.0275 0.0371 0.0500 0.0653 0.0814 0.0966 0.1103 0.1231 0.1361 0.1476 0.1535 0.1515 0.1456 0.1425 0.1452 0.1490 0.1466 0.1353 0.1192 0.1043 0.0938 0.0873 0.0826 0.0775 0.0706 0.0604 0.0470 0.0310 0.0125 -0.0101 -0.0381 -0.0696 -0.0989 -0.1189 -0.1240 -0.1128 -0.0900 -0.0671 -0.0570 -0.0663 -0.0907 -0.1187 -0.1405 -0.1519 -0.1546 -0.1513 -0.1419 -0.1235 -0.0954 -0.0636 -0.0389 -0.0270 -0.0235 -0.0191 -0.0095 0.0017 0.0080 0.0068 -0.0002 -0.0097 -0.0179 -0.0218 -0.0213 -0.0195 -0.0192 -0.0203 -0.0186 -0.0093 0.0091 0.0329 0.0554 0.0723 0.0845 0.0953 0.1053 0.1119 0.1135 0.1128 0.1140 0.1183 0.1225 0.1210 0.1099 0.0881 0.0588 0.0279 0.0008 -0.0212 -0.0410 -0.0617 -0.0831 -0.1008 -0.1118 -0.1172 -0.1204 -0.1217 -0.1181 -0.1076 -0.0928 -0.0788 -0.0681 -0.0593 -0.0503 -0.0412 -0.0328 -0.0246 -0.0147 -0.0017 0.0130 0.0257 0.0321 0.0306 0.0228 0.0125 0.0030 -0.0037 -0.0064 -0.0028 0.0090 0.0277 0.0460 0.0543 0.0486 0.0352 0.0267 0.0318 0.0490 0.0691 0.0814 0.0784 0.0594 0.0322 0.0087 -0.0022 -0.0007 0.0074 0.0173 0.0275 0.0376 0.0447 0.0448 0.0354 0.0183 0.0006 -0.0079 -0.0005 0.0204 0.0446 0.0608
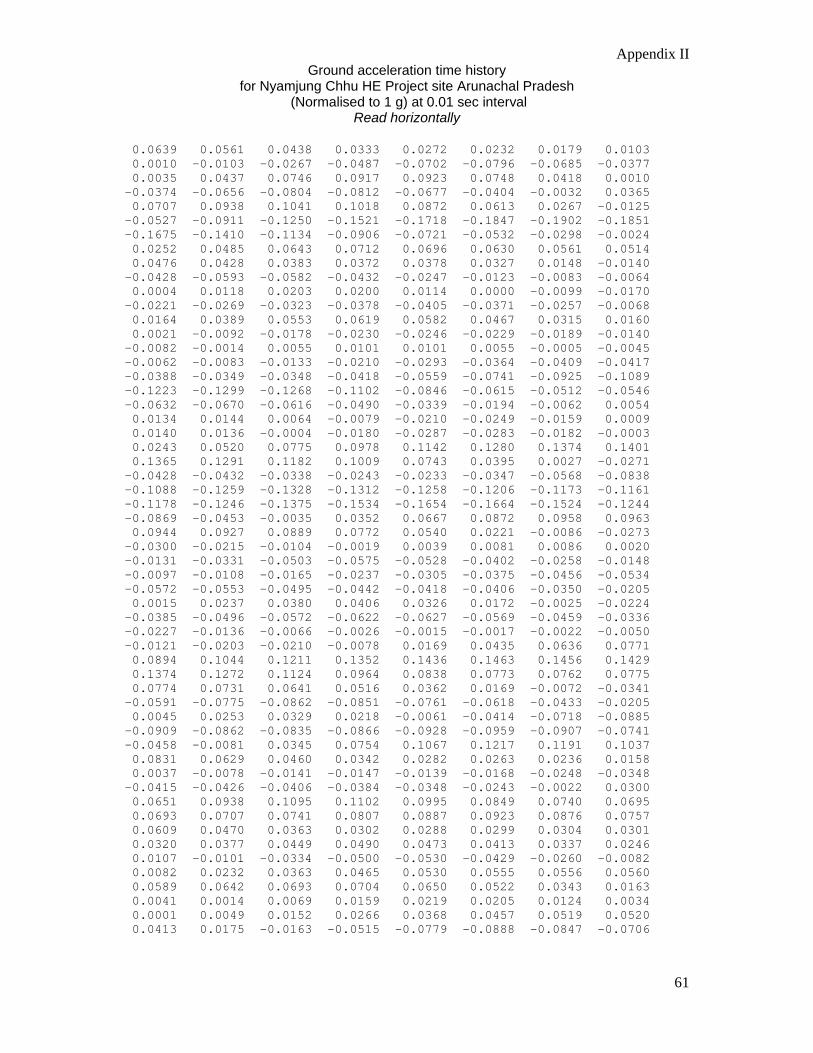
Appendix II Ground acceleration time history
for Nyamjung Chhu HE Project site Arunachal Pradesh (Normalised to 1 g) at 0.01 sec interval
Read horizontally
61
0.0639 0.0561 0.0438 0.0333 0.0272 0.0232 0.0179 0.0103 0.0010 -0.0103 -0.0267 -0.0487 -0.0702 -0.0796 -0.0685 -0.0377 0.0035 0.0437 0.0746 0.0917 0.0923 0.0748 0.0418 0.0010 -0.0374 -0.0656 -0.0804 -0.0812 -0.0677 -0.0404 -0.0032 0.0365 0.0707 0.0938 0.1041 0.1018 0.0872 0.0613 0.0267 -0.0125 -0.0527 -0.0911 -0.1250 -0.1521 -0.1718 -0.1847 -0.1902 -0.1851 -0.1675 -0.1410 -0.1134 -0.0906 -0.0721 -0.0532 -0.0298 -0.0024 0.0252 0.0485 0.0643 0.0712 0.0696 0.0630 0.0561 0.0514 0.0476 0.0428 0.0383 0.0372 0.0378 0.0327 0.0148 -0.0140 -0.0428 -0.0593 -0.0582 -0.0432 -0.0247 -0.0123 -0.0083 -0.0064 0.0004 0.0118 0.0203 0.0200 0.0114 0.0000 -0.0099 -0.0170 -0.0221 -0.0269 -0.0323 -0.0378 -0.0405 -0.0371 -0.0257 -0.0068 0.0164 0.0389 0.0553 0.0619 0.0582 0.0467 0.0315 0.0160 0.0021 -0.0092 -0.0178 -0.0230 -0.0246 -0.0229 -0.0189 -0.0140 -0.0082 -0.0014 0.0055 0.0101 0.0101 0.0055 -0.0005 -0.0045 -0.0062 -0.0083 -0.0133 -0.0210 -0.0293 -0.0364 -0.0409 -0.0417 -0.0388 -0.0349 -0.0348 -0.0418 -0.0559 -0.0741 -0.0925 -0.1089 -0.1223 -0.1299 -0.1268 -0.1102 -0.0846 -0.0615 -0.0512 -0.0546 -0.0632 -0.0670 -0.0616 -0.0490 -0.0339 -0.0194 -0.0062 0.0054 0.0134 0.0144 0.0064 -0.0079 -0.0210 -0.0249 -0.0159 0.0009 0.0140 0.0136 -0.0004 -0.0180 -0.0287 -0.0283 -0.0182 -0.0003 0.0243 0.0520 0.0775 0.0978 0.1142 0.1280 0.1374 0.1401 0.1365 0.1291 0.1182 0.1009 0.0743 0.0395 0.0027 -0.0271 -0.0428 -0.0432 -0.0338 -0.0243 -0.0233 -0.0347 -0.0568 -0.0838 -0.1088 -0.1259 -0.1328 -0.1312 -0.1258 -0.1206 -0.1173 -0.1161 -0.1178 -0.1246 -0.1375 -0.1534 -0.1654 -0.1664 -0.1524 -0.1244 -0.0869 -0.0453 -0.0035 0.0352 0.0667 0.0872 0.0958 0.0963 0.0944 0.0927 0.0889 0.0772 0.0540 0.0221 -0.0086 -0.0273 -0.0300 -0.0215 -0.0104 -0.0019 0.0039 0.0081 0.0086 0.0020 -0.0131 -0.0331 -0.0503 -0.0575 -0.0528 -0.0402 -0.0258 -0.0148 -0.0097 -0.0108 -0.0165 -0.0237 -0.0305 -0.0375 -0.0456 -0.0534 -0.0572 -0.0553 -0.0495 -0.0442 -0.0418 -0.0406 -0.0350 -0.0205 0.0015 0.0237 0.0380 0.0406 0.0326 0.0172 -0.0025 -0.0224 -0.0385 -0.0496 -0.0572 -0.0622 -0.0627 -0.0569 -0.0459 -0.0336 -0.0227 -0.0136 -0.0066 -0.0026 -0.0015 -0.0017 -0.0022 -0.0050 -0.0121 -0.0203 -0.0210 -0.0078 0.0169 0.0435 0.0636 0.0771 0.0894 0.1044 0.1211 0.1352 0.1436 0.1463 0.1456 0.1429 0.1374 0.1272 0.1124 0.0964 0.0838 0.0773 0.0762 0.0775 0.0774 0.0731 0.0641 0.0516 0.0362 0.0169 -0.0072 -0.0341 -0.0591 -0.0775 -0.0862 -0.0851 -0.0761 -0.0618 -0.0433 -0.0205 0.0045 0.0253 0.0329 0.0218 -0.0061 -0.0414 -0.0718 -0.0885 -0.0909 -0.0862 -0.0835 -0.0866 -0.0928 -0.0959 -0.0907 -0.0741 -0.0458 -0.0081 0.0345 0.0754 0.1067 0.1217 0.1191 0.1037 0.0831 0.0629 0.0460 0.0342 0.0282 0.0263 0.0236 0.0158 0.0037 -0.0078 -0.0141 -0.0147 -0.0139 -0.0168 -0.0248 -0.0348 -0.0415 -0.0426 -0.0406 -0.0384 -0.0348 -0.0243 -0.0022 0.0300 0.0651 0.0938 0.1095 0.1102 0.0995 0.0849 0.0740 0.0695 0.0693 0.0707 0.0741 0.0807 0.0887 0.0923 0.0876 0.0757 0.0609 0.0470 0.0363 0.0302 0.0288 0.0299 0.0304 0.0301 0.0320 0.0377 0.0449 0.0490 0.0473 0.0413 0.0337 0.0246 0.0107 -0.0101 -0.0334 -0.0500 -0.0530 -0.0429 -0.0260 -0.0082 0.0082 0.0232 0.0363 0.0465 0.0530 0.0555 0.0556 0.0560 0.0589 0.0642 0.0693 0.0704 0.0650 0.0522 0.0343 0.0163 0.0041 0.0014 0.0069 0.0159 0.0219 0.0205 0.0124 0.0034 0.0001 0.0049 0.0152 0.0266 0.0368 0.0457 0.0519 0.0520 0.0413 0.0175 -0.0163 -0.0515 -0.0779 -0.0888 -0.0847 -0.0706
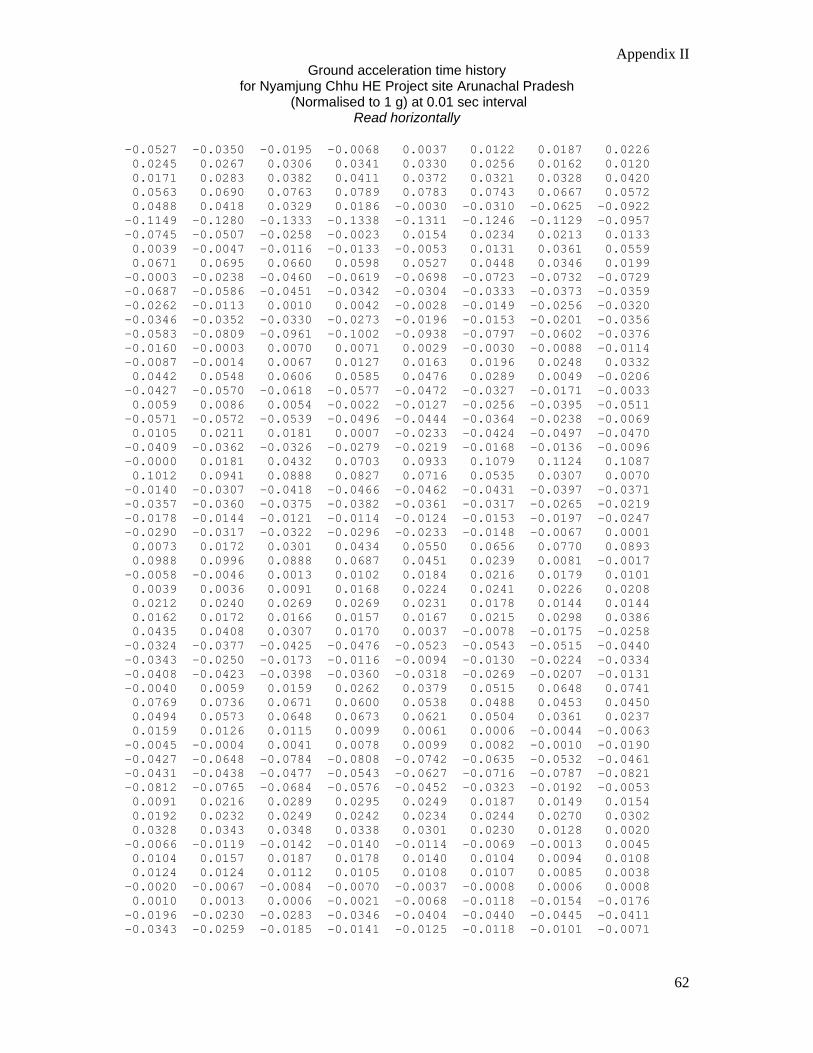
Appendix II Ground acceleration time history
for Nyamjung Chhu HE Project site Arunachal Pradesh (Normalised to 1 g) at 0.01 sec interval
Read horizontally
62
-0.0527 -0.0350 -0.0195 -0.0068 0.0037 0.0122 0.0187 0.0226 0.0245 0.0267 0.0306 0.0341 0.0330 0.0256 0.0162 0.0120 0.0171 0.0283 0.0382 0.0411 0.0372 0.0321 0.0328 0.0420 0.0563 0.0690 0.0763 0.0789 0.0783 0.0743 0.0667 0.0572 0.0488 0.0418 0.0329 0.0186 -0.0030 -0.0310 -0.0625 -0.0922 -0.1149 -0.1280 -0.1333 -0.1338 -0.1311 -0.1246 -0.1129 -0.0957 -0.0745 -0.0507 -0.0258 -0.0023 0.0154 0.0234 0.0213 0.0133 0.0039 -0.0047 -0.0116 -0.0133 -0.0053 0.0131 0.0361 0.0559 0.0671 0.0695 0.0660 0.0598 0.0527 0.0448 0.0346 0.0199 -0.0003 -0.0238 -0.0460 -0.0619 -0.0698 -0.0723 -0.0732 -0.0729 -0.0687 -0.0586 -0.0451 -0.0342 -0.0304 -0.0333 -0.0373 -0.0359 -0.0262 -0.0113 0.0010 0.0042 -0.0028 -0.0149 -0.0256 -0.0320 -0.0346 -0.0352 -0.0330 -0.0273 -0.0196 -0.0153 -0.0201 -0.0356 -0.0583 -0.0809 -0.0961 -0.1002 -0.0938 -0.0797 -0.0602 -0.0376 -0.0160 -0.0003 0.0070 0.0071 0.0029 -0.0030 -0.0088 -0.0114 -0.0087 -0.0014 0.0067 0.0127 0.0163 0.0196 0.0248 0.0332 0.0442 0.0548 0.0606 0.0585 0.0476 0.0289 0.0049 -0.0206 -0.0427 -0.0570 -0.0618 -0.0577 -0.0472 -0.0327 -0.0171 -0.0033 0.0059 0.0086 0.0054 -0.0022 -0.0127 -0.0256 -0.0395 -0.0511 -0.0571 -0.0572 -0.0539 -0.0496 -0.0444 -0.0364 -0.0238 -0.0069 0.0105 0.0211 0.0181 0.0007 -0.0233 -0.0424 -0.0497 -0.0470 -0.0409 -0.0362 -0.0326 -0.0279 -0.0219 -0.0168 -0.0136 -0.0096 -0.0000 0.0181 0.0432 0.0703 0.0933 0.1079 0.1124 0.1087 0.1012 0.0941 0.0888 0.0827 0.0716 0.0535 0.0307 0.0070 -0.0140 -0.0307 -0.0418 -0.0466 -0.0462 -0.0431 -0.0397 -0.0371 -0.0357 -0.0360 -0.0375 -0.0382 -0.0361 -0.0317 -0.0265 -0.0219 -0.0178 -0.0144 -0.0121 -0.0114 -0.0124 -0.0153 -0.0197 -0.0247 -0.0290 -0.0317 -0.0322 -0.0296 -0.0233 -0.0148 -0.0067 0.0001 0.0073 0.0172 0.0301 0.0434 0.0550 0.0656 0.0770 0.0893 0.0988 0.0996 0.0888 0.0687 0.0451 0.0239 0.0081 -0.0017 -0.0058 -0.0046 0.0013 0.0102 0.0184 0.0216 0.0179 0.0101 0.0039 0.0036 0.0091 0.0168 0.0224 0.0241 0.0226 0.0208 0.0212 0.0240 0.0269 0.0269 0.0231 0.0178 0.0144 0.0144 0.0162 0.0172 0.0166 0.0157 0.0167 0.0215 0.0298 0.0386 0.0435 0.0408 0.0307 0.0170 0.0037 -0.0078 -0.0175 -0.0258 -0.0324 -0.0377 -0.0425 -0.0476 -0.0523 -0.0543 -0.0515 -0.0440 -0.0343 -0.0250 -0.0173 -0.0116 -0.0094 -0.0130 -0.0224 -0.0334 -0.0408 -0.0423 -0.0398 -0.0360 -0.0318 -0.0269 -0.0207 -0.0131 -0.0040 0.0059 0.0159 0.0262 0.0379 0.0515 0.0648 0.0741 0.0769 0.0736 0.0671 0.0600 0.0538 0.0488 0.0453 0.0450 0.0494 0.0573 0.0648 0.0673 0.0621 0.0504 0.0361 0.0237 0.0159 0.0126 0.0115 0.0099 0.0061 0.0006 -0.0044 -0.0063 -0.0045 -0.0004 0.0041 0.0078 0.0099 0.0082 -0.0010 -0.0190 -0.0427 -0.0648 -0.0784 -0.0808 -0.0742 -0.0635 -0.0532 -0.0461 -0.0431 -0.0438 -0.0477 -0.0543 -0.0627 -0.0716 -0.0787 -0.0821 -0.0812 -0.0765 -0.0684 -0.0576 -0.0452 -0.0323 -0.0192 -0.0053 0.0091 0.0216 0.0289 0.0295 0.0249 0.0187 0.0149 0.0154 0.0192 0.0232 0.0249 0.0242 0.0234 0.0244 0.0270 0.0302 0.0328 0.0343 0.0348 0.0338 0.0301 0.0230 0.0128 0.0020 -0.0066 -0.0119 -0.0142 -0.0140 -0.0114 -0.0069 -0.0013 0.0045 0.0104 0.0157 0.0187 0.0178 0.0140 0.0104 0.0094 0.0108 0.0124 0.0124 0.0112 0.0105 0.0108 0.0107 0.0085 0.0038 -0.0020 -0.0067 -0.0084 -0.0070 -0.0037 -0.0008 0.0006 0.0008 0.0010 0.0013 0.0006 -0.0021 -0.0068 -0.0118 -0.0154 -0.0176 -0.0196 -0.0230 -0.0283 -0.0346 -0.0404 -0.0440 -0.0445 -0.0411 -0.0343 -0.0259 -0.0185 -0.0141 -0.0125 -0.0118 -0.0101 -0.0071
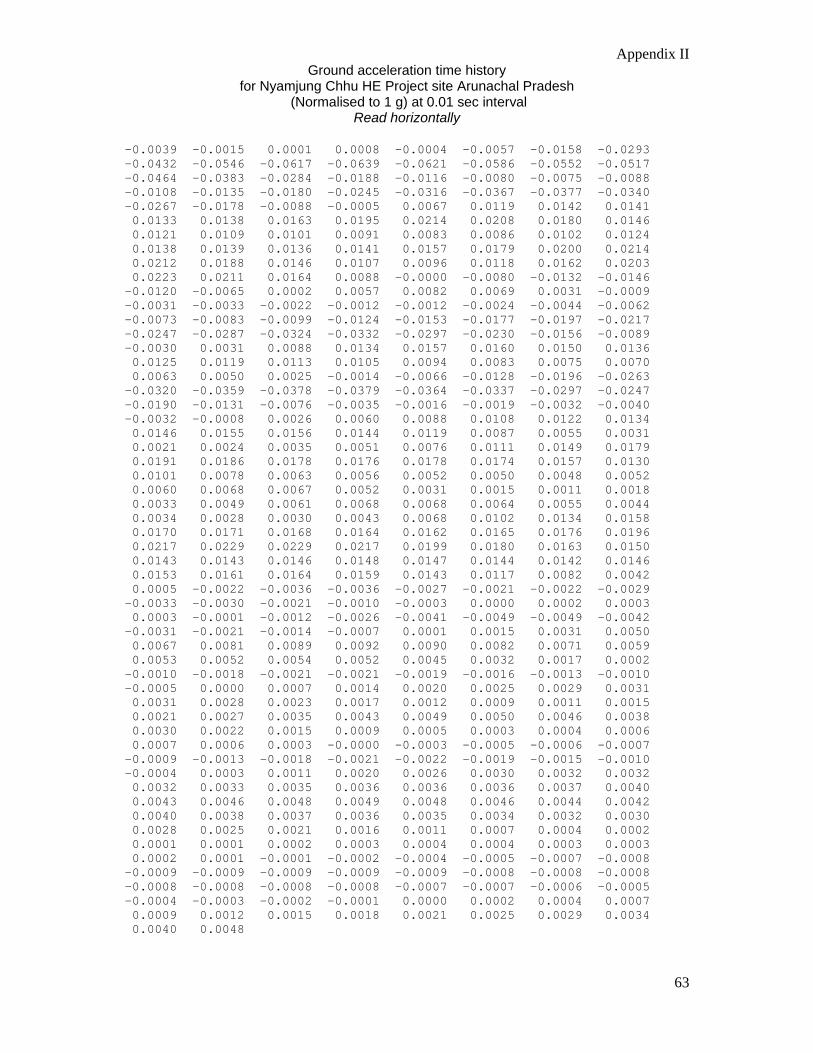
Appendix II Ground acceleration time history
for Nyamjung Chhu HE Project site Arunachal Pradesh (Normalised to 1 g) at 0.01 sec interval
Read horizontally
63
-0.0039 -0.0015 0.0001 0.0008 -0.0004 -0.0057 -0.0158 -0.0293 -0.0432 -0.0546 -0.0617 -0.0639 -0.0621 -0.0586 -0.0552 -0.0517 -0.0464 -0.0383 -0.0284 -0.0188 -0.0116 -0.0080 -0.0075 -0.0088 -0.0108 -0.0135 -0.0180 -0.0245 -0.0316 -0.0367 -0.0377 -0.0340 -0.0267 -0.0178 -0.0088 -0.0005 0.0067 0.0119 0.0142 0.0141 0.0133 0.0138 0.0163 0.0195 0.0214 0.0208 0.0180 0.0146 0.0121 0.0109 0.0101 0.0091 0.0083 0.0086 0.0102 0.0124 0.0138 0.0139 0.0136 0.0141 0.0157 0.0179 0.0200 0.0214 0.0212 0.0188 0.0146 0.0107 0.0096 0.0118 0.0162 0.0203 0.0223 0.0211 0.0164 0.0088 -0.0000 -0.0080 -0.0132 -0.0146 -0.0120 -0.0065 0.0002 0.0057 0.0082 0.0069 0.0031 -0.0009 -0.0031 -0.0033 -0.0022 -0.0012 -0.0012 -0.0024 -0.0044 -0.0062 -0.0073 -0.0083 -0.0099 -0.0124 -0.0153 -0.0177 -0.0197 -0.0217 -0.0247 -0.0287 -0.0324 -0.0332 -0.0297 -0.0230 -0.0156 -0.0089 -0.0030 0.0031 0.0088 0.0134 0.0157 0.0160 0.0150 0.0136 0.0125 0.0119 0.0113 0.0105 0.0094 0.0083 0.0075 0.0070 0.0063 0.0050 0.0025 -0.0014 -0.0066 -0.0128 -0.0196 -0.0263 -0.0320 -0.0359 -0.0378 -0.0379 -0.0364 -0.0337 -0.0297 -0.0247 -0.0190 -0.0131 -0.0076 -0.0035 -0.0016 -0.0019 -0.0032 -0.0040 -0.0032 -0.0008 0.0026 0.0060 0.0088 0.0108 0.0122 0.0134 0.0146 0.0155 0.0156 0.0144 0.0119 0.0087 0.0055 0.0031 0.0021 0.0024 0.0035 0.0051 0.0076 0.0111 0.0149 0.0179 0.0191 0.0186 0.0178 0.0176 0.0178 0.0174 0.0157 0.0130 0.0101 0.0078 0.0063 0.0056 0.0052 0.0050 0.0048 0.0052 0.0060 0.0068 0.0067 0.0052 0.0031 0.0015 0.0011 0.0018 0.0033 0.0049 0.0061 0.0068 0.0068 0.0064 0.0055 0.0044 0.0034 0.0028 0.0030 0.0043 0.0068 0.0102 0.0134 0.0158 0.0170 0.0171 0.0168 0.0164 0.0162 0.0165 0.0176 0.0196 0.0217 0.0229 0.0229 0.0217 0.0199 0.0180 0.0163 0.0150 0.0143 0.0143 0.0146 0.0148 0.0147 0.0144 0.0142 0.0146 0.0153 0.0161 0.0164 0.0159 0.0143 0.0117 0.0082 0.0042 0.0005 -0.0022 -0.0036 -0.0036 -0.0027 -0.0021 -0.0022 -0.0029 -0.0033 -0.0030 -0.0021 -0.0010 -0.0003 0.0000 0.0002 0.0003 0.0003 -0.0001 -0.0012 -0.0026 -0.0041 -0.0049 -0.0049 -0.0042 -0.0031 -0.0021 -0.0014 -0.0007 0.0001 0.0015 0.0031 0.0050 0.0067 0.0081 0.0089 0.0092 0.0090 0.0082 0.0071 0.0059 0.0053 0.0052 0.0054 0.0052 0.0045 0.0032 0.0017 0.0002 -0.0010 -0.0018 -0.0021 -0.0021 -0.0019 -0.0016 -0.0013 -0.0010 -0.0005 0.0000 0.0007 0.0014 0.0020 0.0025 0.0029 0.0031 0.0031 0.0028 0.0023 0.0017 0.0012 0.0009 0.0011 0.0015 0.0021 0.0027 0.0035 0.0043 0.0049 0.0050 0.0046 0.0038 0.0030 0.0022 0.0015 0.0009 0.0005 0.0003 0.0004 0.0006 0.0007 0.0006 0.0003 -0.0000 -0.0003 -0.0005 -0.0006 -0.0007 -0.0009 -0.0013 -0.0018 -0.0021 -0.0022 -0.0019 -0.0015 -0.0010 -0.0004 0.0003 0.0011 0.0020 0.0026 0.0030 0.0032 0.0032 0.0032 0.0033 0.0035 0.0036 0.0036 0.0036 0.0037 0.0040 0.0043 0.0046 0.0048 0.0049 0.0048 0.0046 0.0044 0.0042 0.0040 0.0038 0.0037 0.0036 0.0035 0.0034 0.0032 0.0030 0.0028 0.0025 0.0021 0.0016 0.0011 0.0007 0.0004 0.0002 0.0001 0.0001 0.0002 0.0003 0.0004 0.0004 0.0003 0.0003 0.0002 0.0001 -0.0001 -0.0002 -0.0004 -0.0005 -0.0007 -0.0008 -0.0009 -0.0009 -0.0009 -0.0009 -0.0009 -0.0008 -0.0008 -0.0008 -0.0008 -0.0008 -0.0008 -0.0008 -0.0007 -0.0007 -0.0006 -0.0005 -0.0004 -0.0003 -0.0002 -0.0001 0.0000 0.0002 0.0004 0.0007 0.0009 0.0012 0.0015 0.0018 0.0021 0.0025 0.0029 0.0034 0.0040 0.0048

Appendix II Ground acceleration time history
for Nyamjung Chhu HE Project site Arunachal Pradesh (Normalised to 1 g) at 0.01 sec interval
Read horizontally
64
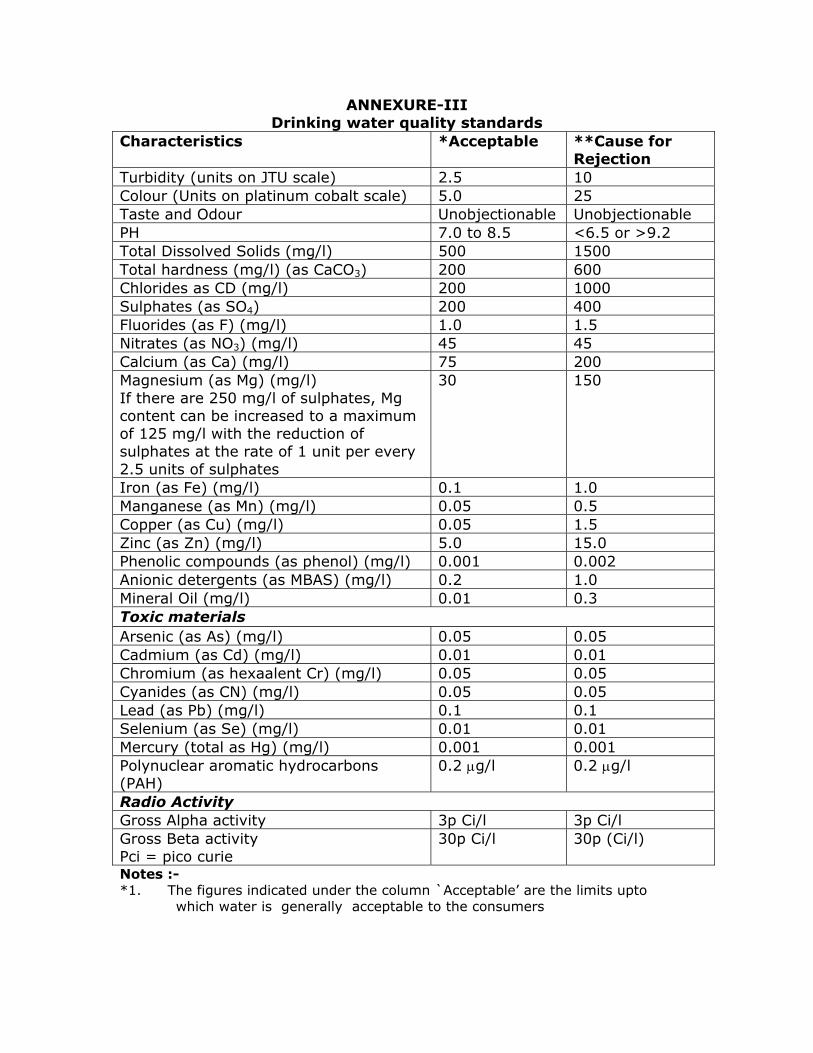
ANNEXURE-III Drinking water quality standards
Characteristics *Acceptable **Cause for Rejection
Turbidity (units on JTU scale) 2.5 10 Colour (Units on platinum cobalt scale) 5.0 25 Taste and Odour Unobjectionable Unobjectionable PH 7.0 to 8.5 <6.5 or >9.2 Total Dissolved Solids (mg/l) 500 1500 Total hardness (mg/l) (as CaCO3) 200 600 Chlorides as CD (mg/l) 200 1000 Sulphates (as SO4) 200 400 Fluorides (as F) (mg/l) 1.0 1.5 Nitrates (as NO3) (mg/l) 45 45 Calcium (as Ca) (mg/l) 75 200 Magnesium (as Mg) (mg/l) If there are 250 mg/l of sulphates, Mg content can be increased to a maximum of 125 mg/l with the reduction of sulphates at the rate of 1 unit per every 2.5 units of sulphates
30 150
Iron (as Fe) (mg/l) 0.1 1.0 Manganese (as Mn) (mg/l) 0.05 0.5 Copper (as Cu) (mg/l) 0.05 1.5 Zinc (as Zn) (mg/l) 5.0 15.0 Phenolic compounds (as phenol) (mg/l) 0.001 0.002 Anionic detergents (as MBAS) (mg/l) 0.2 1.0 Mineral Oil (mg/l) 0.01 0.3 Toxic materials Arsenic (as As) (mg/l) 0.05 0.05 Cadmium (as Cd) (mg/l) 0.01 0.01 Chromium (as hexaalent Cr) (mg/l) 0.05 0.05 Cyanides (as CN) (mg/l) 0.05 0.05 Lead (as Pb) (mg/l) 0.1 0.1 Selenium (as Se) (mg/l) 0.01 0.01 Mercury (total as Hg) (mg/l) 0.001 0.001 Polynuclear aromatic hydrocarbons (PAH)
0.2 µg/l 0.2 µg/l
Radio Activity Gross Alpha activity 3p Ci/l 3p Ci/l Gross Beta activity Pci = pico curie
30p Ci/l 30p (Ci/l)
Notes :- *1. The figures indicated under the column `Acceptable’ are the limits upto which water is generally acceptable to the consumers

**2 Figures in excess of those mentioned under `Acceptable render the water not acceptable, but still may be tolerated in the absence of alternative and better source but upto the limits indicated under column “Cause for Rejection” above which are supply will have to be rejected.
*3. It is possible that some mine and spring waters may exceed these radio
activity limits and in such cases it is necessary to analyse the individual radionuclides in order to assess the acceptability or otherwise for public consumption.
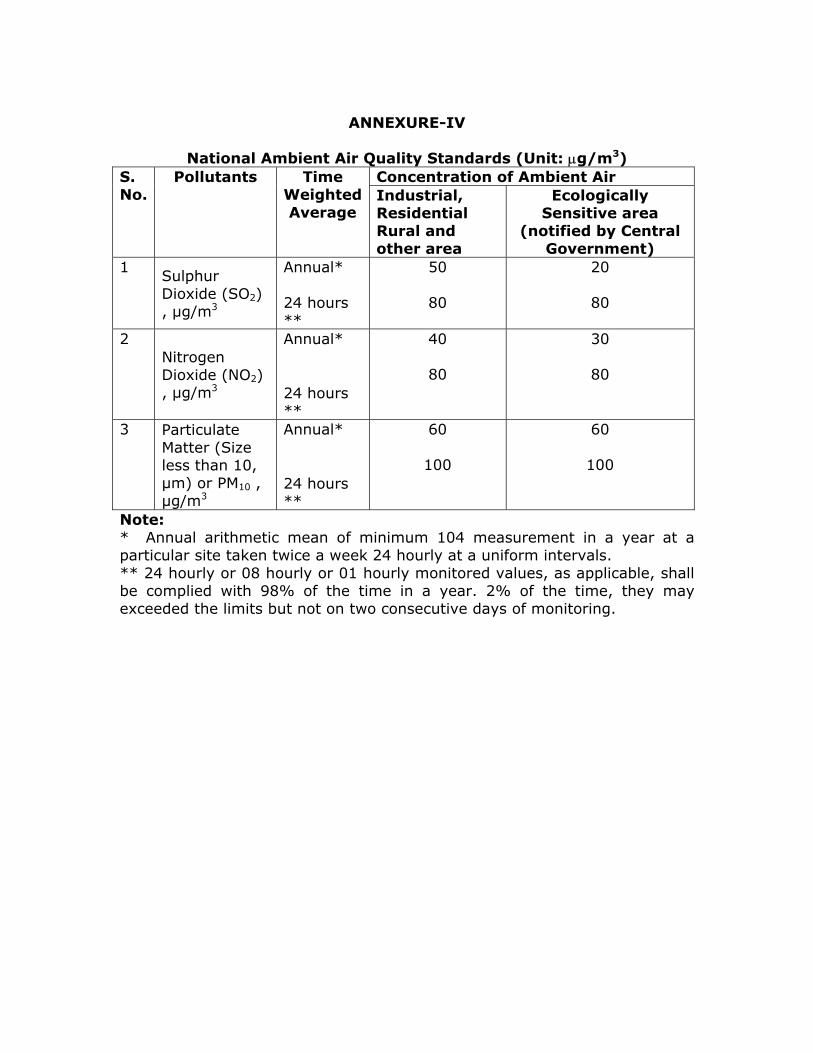
ANNEXURE-IV
National Ambient Air Quality Standards (Unit: µg/m3)
S. No.
Pollutants Time Weighted Average
Concentration of Ambient Air Industrial, Residential Rural and other area
Ecologically Sensitive area
(notified by Central Government)
1 Sulphur Dioxide (SO2) , µg/m3
Annual* 24 hours **
50
80
20
80
2 Nitrogen Dioxide (NO2) , µg/m3
Annual*
24 hours **
40
80
30
80
3 Particulate Matter (Size less than 10, µm) or PM10 , µg/m3
Annual*
24 hours **
60
100
60
100
Note: * Annual arithmetic mean of minimum 104 measurement in a year at a particular site taken twice a week 24 hourly at a uniform intervals. ** 24 hourly or 08 hourly or 01 hourly monitored values, as applicable, shall be complied with 98% of the time in a year. 2% of the time, they may exceeded the limits but not on two consecutive days of monitoring.
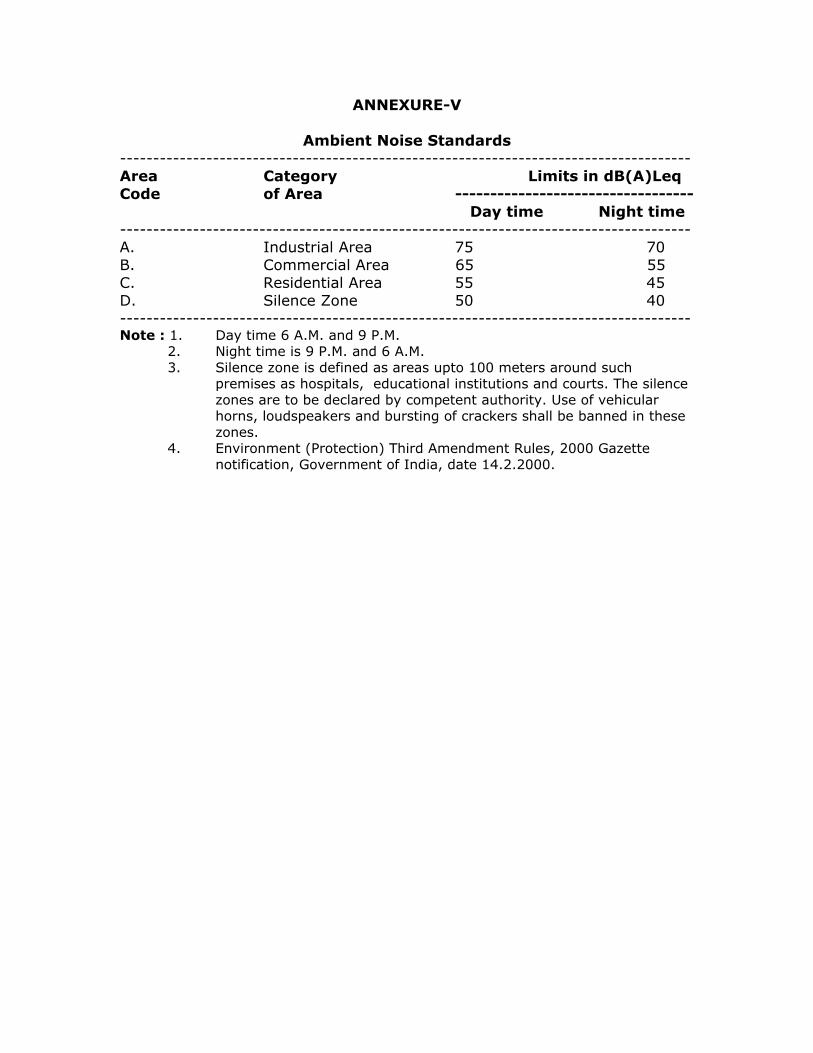
ANNEXURE-V
Ambient Noise Standards --------------------------------------------------------------------------------------Area Category Limits in dB(A)Leq Code of Area ---------------------------------- Day time Night time -------------------------------------------------------------------------------------- A. Industrial Area 75 70 B. Commercial Area 65 55 C. Residential Area 55 45 D. Silence Zone 50 40 -------------------------------------------------------------------------------------- Note : 1. Day time 6 A.M. and 9 P.M.
2. Night time is 9 P.M. and 6 A.M. 3. Silence zone is defined as areas upto 100 meters around such
premises as hospitals, educational institutions and courts. The silence zones are to be declared by competent authority. Use of vehicular horns, loudspeakers and bursting of crackers shall be banned in these zones.
4. Environment (Protection) Third Amendment Rules, 2000 Gazette notification, Government of India, date 14.2.2000.

ANNEXURE -VI
LIST OF PLANT SPECIES (WITH THEIR FAMILY AND LOCAL NAMES) FOUND IN THE STUDY AREA
Botanical name Family Local name/ Common name
Angiosperm Dicot Trees Albizia lucida Fabaceae Alnus nepalensis Betulaceae Betula alnoides Betulaceae Birch Engelhardtia spicata Juglandaceae Erythirina arborescens Fabaceae Eucalyptus sp. Myrtaceae Ficus roxburghii Moraceae Ficus scandens Moraceae Glochidion acuminatum Euphorbiaceae Hippophae salicifolia Elaeagnaceae Hovenia dulcis Rhamnaceae Ilex sp. Aquifoliaceae Juglans regia Juglandaceae Walnut Lyonia ovalifolia Ericaceae Macaranga denticulate Euphorbiaceae Morali Morus serrata Moraceae Myrica esculenta Myricaceae Persea odoratissima Lauraceae Populus gamblei Salicaceae Quercus griffithii Fagaceae Rhododendron campanulatum
Ericaceae
Rhododendron maddeni Ericaceae Rhododendron nerifolium Ericaceae Rhus javanica Anacardiaceae Salix sp. Salicaceae Schima khasiana Theaceae Toona ciliate Meliaceae Poma Wendlandia puberula Rubiaceae Zanthoxylum armatum Rutaceae Shrubs Artemisia nilagirica Asteraceae Buddleja asiatica Buddlejaceae Cotoneaster sp. Rosaceae Debregaesia longifolia Urticaceae Elaeagnus sp. Elaeagnaceae Indigofera dosua Fabaceae

Gaultheria fragrantissima Ericaceae Mesea indica Mrysinaceae Mussaenda roxburghii Rubiaceae Neillia thyrsiflora Rosaceae Philadelphus tomentosus Hydrangeaceae Plectranthus coetsa Lamiaceae Prinsepia utilis Elaeagnaceae Rhus javanica Anacardiaceae Ribes glaciale Grossulariaceae Rubus ellipticus Rosaceae Rubus hypergyrus Rosaceae Rubus rugosus Rosaceae Spiraea canescens Rosaceae Viburnum erubescens Caprifoliaceae Monocots Saccharum spontaneum Poaceae Taapi Thysanolaena maxima Poaceae Phool jharu Herbs Aconogonum sp. Polygonaceae Anaphalis triplinervis Asteraceae Anemone vitifolia Ranunculaceae Arisaema tortuosum Araceae Bidens pilosa Asteraceae Bistorta sp. Polygonaceae Cannabis sativa Cannabinaceae Capsella bursa-pastoris Brassicaceae Centella asiatica Apiaceae Cirsium sp. Asteraceae Corydalis rutifolia Fumariaceae Drymaria cordata Fabaceae Cynoglossum furcatum Boraginaceae Fagopyrum dibotrys Papaveraceae Fragaria indica Rosaceae Galinsoga parviflora Asteraceae Gallium asperifolium Rubiaceae Geranium nepalense Geraniaceae Gerardinia heterophylla Urticaceae Gnaphalium sp. Asteraceae Heracleum sp. Apiaceae Houttuynia cordata Saururaceae Hydrocotyl javanica Apiaceae Inula cappa Asteraceae Leucas ciliate Lamiaceae Mazus surculosus Scrophulariaceae Nicandra physaloides Solanaceae Oenanthe sp. Apiaceae

Osbeckia nutans Melastomataceae Oxalis corniculata Oxalidaceae Parochetus communis Fabaceae Pilea lineolatum Urticaceae Piptanthus nepalensis Fabaceae Plantago major Plantaginaceae Polygonum capitatum Polygonaceae Polygonum hydropiper Polygonaceae Polygonum runcinatum Polygonaceae Potentilla fulgens Rosaceae Pouzolzia hirta Urticaceae Pouzolzia sp. Urticaceae Ranunculus scleratus Ranuncalaceae Rosa sericea Rosaceae Ranunculus adoxifolius Ranunculaceae Rumex nepalensis Polygonaceae Sedum multicaule Saxifragaceae Solanum viarum Solanaceae Stellaria sp. Caryophyllaceae Urena lobata Malvaceae Urtica dioca Urticaceae Viola sp. Violaceae Monocots Axonopus compressus Poaceae Paspalum sp. Poaceae Poa annua Poaceae Climbers Periploca sp. Asclepiadaceae Parthenocissus himalayana
Vitaceae
Symthea sp. Rhamnaceae Rubia cordifolia Rubiaceae Gymnosperm Pinus wallichiana Pinaceae Blue pine Cryptomeria japonica Taxodaceae Cupressus sp. Cupressaceae Cupressus torulosa Cupressaceae Pteridophytes Blechnum sp. Blechnaceae Drynaria propinqua Drynariaceae Lepisorus nudus Polypodiaceae Lycopodium clavatum Lycopodiaceae Osmunda cinnamomea Osmundaceae Selaginella sp. Selaginellaceae Pteridium aquilinum Pteridaceae Lepisorus nudus Polypodaceae

Vittaria elongate Vittariaceae Drynaria propinqua Drynariaceae Bryophytes Brachymenium sikkimense
Bryaceae
Bryum billardieri Bryaceae Pohlia minor Mniaceae Hymenostylium aurantiacum
Pottiaceae
Algae Epithemia sp. Bacillariophyta Actinastrum sp. Chlorophyta Triploceros sp. Chlorophyta Anabaena sp. Cyanophyta Microcystis sp. Cyanophyta Spirulina sp. Cyanophyta Synechocystis sp. Cyanophyta Fungi Agaricus sp. Agariceae Hymenichaete sp. Hymenochaetaceae Calocera sp. Dacrymycetaceae Daldina concentrica Xylariaceae
NJC Hydropower Limited EIA study for Nyamjangchu Hydroelectric Project
WAPCOS Limited 4-1
CHAPTER – 4
HYDROLOGY
4.1 BASIN DESCRIPTION
The river Nyamjang Chhu runs through north-western part of Arunachal Pradesh and
flows mostly in a North - South direction. It is a major tributary of the westerly
flowing Tawang Chhu within the State of Arunachal Pradesh. Nyamjang Chhu
originates in China at an elevation of about ±6400 m and flows through Tibet before
entering India at Khinzemane. It flows southwards crossing into Arunachal Pradesh
and continues on a southerly course, parallel with the Indo-Bhutanese border, for a
distance of about 40 km to its confluence with the Tawang Chhu near Lumla, Kumba
villages. Tawang Chhu flows beyond Lumla village in a westerly direction into Bhutan
as Gamri Chhu and ultimately becomes a tributary of the Manas and Brahmaputra
rivers. Major tributaries of river Manas include Tawang Chhu, Nyamjang Chhu, Kuri
Chhu, Khulong Chhu, Amri Chhu and Sheri Chhu.
Nyamjang Chhu is a perennial river with its main source of water being the south
west monsoon and snow melt contribution of Himalayan glaciers. The general pattern
of river flow shows a large variation with high flows in the months of June to
September and lower flows in the remaining months. The total length of Nyamjang
Chhu from its origin in the Tibetan plateau at an elevation of about 6400 m, to its
confluence with the Tawang Chhu at an elevation of about about 1036 m is about
125 km. The upper portion of the river, comprising about 85 km, is in Tibet and
remaining 40 km is in India. In India, the Nyamjang Chhu flows through rugged
mountainous terrain with an average gradient of 1 in 30. The river enters India at
approx. EL 2220 m near village Khinzemane and covers a distance of about 10 km up
to Zimithang. It meets Namka Chhu 2.41 km south of Khinzemane and Sumta Chhu
joins Nyamjang Chhu near Zimithang. The river is flat in the Zimithang area for a
stretch of almost 2.5 km. After this it again runs through steep slopes up to
confluence with Tawang Chhu. Eight nallas including Taksang Chhu and Gomkarang
Chhu join Nyamjang Chhu between Zimithang and its confluence with Tawang Chhu.
These contribute to the discharges of the Nyamjang Chhu all along this stretch.
NJC Hydropower Limited EIA study for Nyamjangchu Hydroelectric Project
WAPCOS Limited 4-2
The river bed elevation at Zimithang village is about EL 2106.0 m and that at the
confluence is about EL about 1036 m. A gross head of about 1057.4 m can therefore
be exploited for development of hydro power potential of the basin.
The total catchment area of the Nyamjang Chhu up to the confluence with Tawang
Chhu is about 3170 km2. The catchment area upstream from Zimithang Village
(barrage site) is about 2650 km2. Out of this 2650 km2, about 1945 km2 of
catchment area is above permanent snow line of EL 4500 m and 705 km2 of
catchment area receives precipitation in the form of rainfall. A Satellite image of the
Nyamjang Chhu catchment is shown in Figure 4.1.The catchment area map showing
drainage network is shown in Figure 4.2. The delineation of snow fed and rainfed
areas in the catchment is shown in Figure-4.3.
During its course from Zimithang to its confluence with Tawang Chhu, Nyamjang
Chhu is joined by eight major nallas. Two nallas namely Sumta Chhu and Taksang
Chhu carry significant perennial discharges and have catchment areas of 100 km2
and 154 km2 respectively. Sumta Chhu is a right bank tributary of Nyamjang Chhu
while Taksang Chhu is located on the left bank. It is proposed to divert the perennial
flow of Taksang Chhu into the headrace tunnel of Nyamjang Chhu HEP to utilise the
flow for power generation. The catchment area of Taksang Chhu upto the proposed
diversion site at EL 2156.4 m is 154 km2. Accordingly the flow in Nyamjang Chhu is
computed including the catchment area of Taksang Chhu upto the proposed diversion
site. Thus, the total catchment area including Taksang Chhu is 2804 km2.
4.2 Water Availability Study
Hydrological data of Nyamjang Chhu is available for a period of only 18 months from
December 2006. Discharge data of Tawang river located east of Nyamjang Chhu and
Kuri Chhu located west of Nyamjang Chhu is available for 7 years and 16 years
respectively.
In the absence of long term discharge data for Nyamjang Chhu, the hydrological data
of Tawang Chhu and Kuri Chhu have been used in the DPR to estimate a long term
flow series for Nyamjang Chhu.