eif sme access to finance index - june 2018 update · convenient tool to compare and benchmark...
TRANSCRIPT
EIF Research & Market Analysis
Working Paper 2018/49
EIF SME Access to Finance Index -
June 2018 update
Wouter Torfs �

i
ii
Wouter Torfs is Research Officer in EIF’s Research & Market Analysis division.
Contact: [email protected] Tel.: +352 248581 752
Editor: Helmut Kraemer-Eis, Head of EIF’s Research & Market Analysis, Chief Economist Contact: European Investment Fund 37B, avenue J.F. Kennedy, L-2968 Luxembourg Tel.: +352 248581 394 http://www.eif.org/news_centre/research/index.htm Luxembourg, June 2018
Scan above to obtain a PDF version of this working paper
iii
Abstract1
This EIF Working Paper elaborates on the most recent update of the EIF SME Access to Finance (ESAF) Index, a composite indicator used to monitor SME external financing markets in the 28 EU countries. The current update, using 2017 data, constitutes the fifth iteration of this exercise. The note is used to provide some background information underlying the aggregate ESAF results, by analysing its four subindices and their subindicators and focussing on a select number of individual results.
Disclaimer: This Working Paper should not be referred to as representing the views of the European Investment Fund (EIF) or of the European Investment Bank Group (EIB Group). Any views expressed herein, including interpretation(s) of regulations, reflect the current views of the author(s), which do not necessarily correspond to the views of EIF or of the EIB Group. Views expressed herein may differ from views set out in other documents, including similar research papers, published by EIF or by the EIB Group. Contents of this Working Paper, including views expressed, are current at the date of publication set out above, and may change without notice. No representation or warranty, express or implied, is or will be made and no liability or responsibility is or will be accepted by EIF or by the EIB Group in respect of the accuracy or completeness of the information contained herein and any such liability is expressly disclaimed. Nothing in this Working Paper constitutes investment, legal, or tax advice, nor shall be relied upon as such advice. Specific professional advice should always be sought separately before taking any action based on this Working Paper. Reproduction, publication and reprint are subject to prior written authorisation.
1 This paper benefited from the input of Salome Gvetadze, Helmut Kraemer-Eis, Frank Lang, Simone Signore and Virginie Varga. All remaining errors are the author’s.
iv
Table of contents
1 The EIF SME Access to Finance Index ................................................................... 1
2 The 2017 ESAF results ....................................................................................... 3
3 A closer look at some of the dynamics .................................................................. 6
4 A few case studies ............................................................................................. 9
4.1 The UK vs Sweden ................................................................................................... 9
4.2 Spain vs Belgium ................................................................................................... 12
5 The ESAF Index vs the EIBIS financial constraints indicator ..................................... 15
6 Conclusion ..................................................................................................... 16
References ............................................................................................................ 17
About … .............................................................................................................. 18
… the European Investment Fund ............................................................................ 18
… EIF’s Research & Market Analysis ......................................................................... 18
… this Working Paper series ................................................................................... 18
EIF Working Papers ............................................................................................... 19

v
1
1 The EIF SME Access to Finance Index
This note presents the results of the 2017 EIF SME Access to Finance Index (ESAF) update. The ESAF is a composite indicator that summarises the state of SME external financing markets for the EU28 countries. It was first introduced and elaborated upon in the European Small Business Finance Outlook, a semi-annual EIF Working Paper (see Kraemer-Eis et al, 2016). The indicator provides a convenient tool to compare and benchmark country performance in the context of SMEs’ access to finance in the EU.
Box 1: The four ESAF subindices and their respective SME access to finance indicators Loans:
■ Percentage of SMEs using bank loans in the last 6 months ■ Percentage of SMEs using grants or subsidised bank loans in the last 6 months ■ Percentage of SMEs not applying for a bank loan because of possible rejection in the last 6 months ■ Interest rate for loans under EUR 250k (floating rate with IRF up to 1 year) ■ Interest rate spread (under EUR 250k vs over EUR 1m for floating rate with IRF up to 1 year)
Equity: ■ Venture Capital Investments / GDP ■ Venture capital availability index ■ Value of IPO market / GDP ■ Percentage of SMEs using equity capital in last 6 months
Credit and Leasing: ■ Percentage of SMEs using bank overdraft, credit line, or credit card overdraft in last the 6 months ■ Percentage of SMEs not applying for the above because of possible rejection in last the 6 months ■ Percentage of SMEs using leasing or hire-purchase in the last 6 months ■ Median interest rate charged to SMEs for credit line or bank overdraft application in the last 6 months
Macro Factors: ■ Gap between actual and potential GDP ■ Strength of legal rights index ■ Depth of credit information index ■ Availability of financial services index ■ Bank non-performing loans to total gross loans ■ Percentage of SMEs "feeling that there are no financing obstacles"
The index is composed of four subindices, three of which are related to different financing instruments, while the fourth covers the general macro-economic conditions in which SMEs operate. The subindices in turn are comprised of a series of variables (Box 1). The normalisation process proceeds using the min-max method and indicators are geometrically aggregated, after being weighted equally. The min-max normalisation method implies individual countries’ ESAF values require a relative interpretation, vis-à-vis the worst and best performing country on the respective subindicators. The methodology is elaborated upon in Gvetadze et al. (2018).
2
The relative interpretation implies that, while it is possible to compare the ESAF values of countries within a given year, or compare how the relative position of countries has changed over time, it is problematic to interpret an ESAF value isolated on a scale of 0 to 1. For example, a value of 0.5 does not in itself imply a country performs average in terms of access to finance. Instead, it implies a country performs average vis-à-vis the best and the worst performing country. It is also not possible to track the performance of an isolated country’s ESAF over time. An increase in the value of its index does not necessarily imply SMEs in that particular country experienced an increased access to finance.
One final word of warning relates to putting excessive emphasis on a country’s performance on an individual subindex. Although the index is carefully constructed, an individual subindex consist in some cases of no more than four subindicators, which are in turn derived from surveys and/or are estimated. When aggregated to the overall index, the influence of individual subindicators is limited. At the level of a subindex, however, it can be more pronounced. Interpretation of the relative outcomes of the subindexes is possible, but should nevertheless proceed with caution. It is advised to revert back to the underlying subindicators in case of doubt, which is exactly what this publication aims to do. Because of the black-box nature of a composite indicator, its credibility stands or falls with the transparency at which its results are communicated. Therefore, aside from the presentation of the outcome of the ESAF and its subindices, we will also elaborate on the underlying economic indicators of select individual countries, and provide head-to-head country comparisons where appropriate.
3
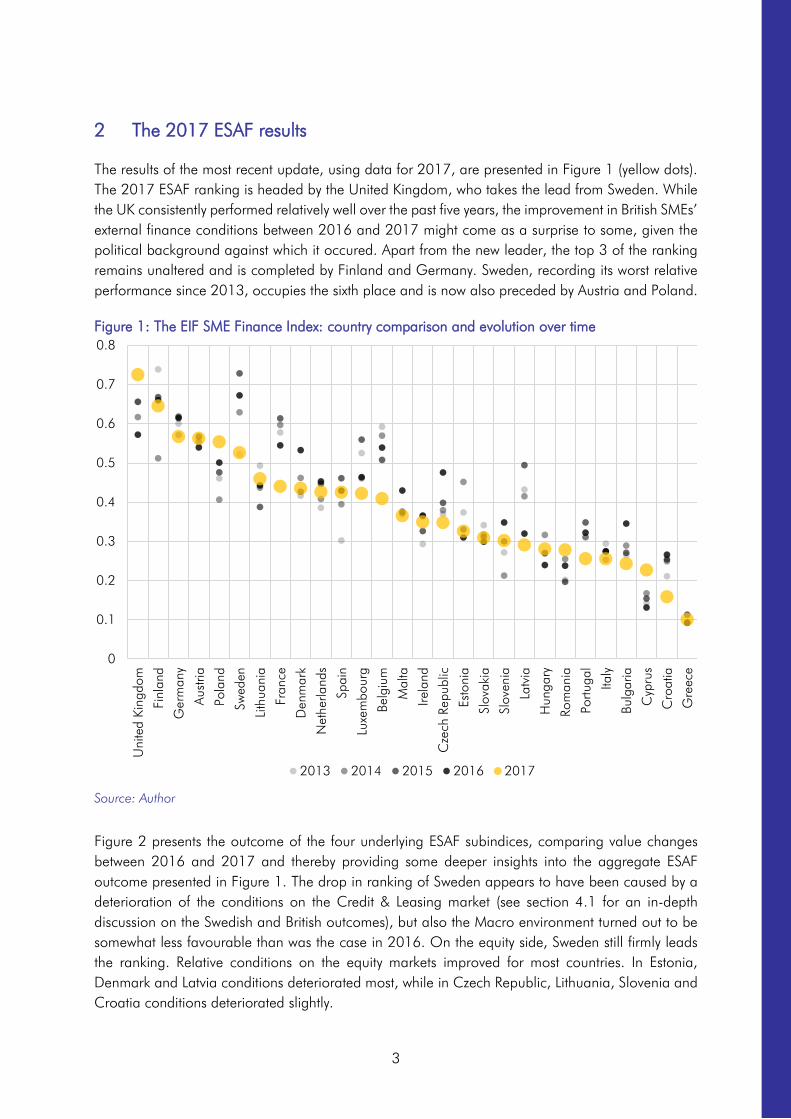
2 The 2017 ESAF results
The results of the most recent update, using data for 2017, are presented in Figure 1 (yellow dots). The 2017 ESAF ranking is headed by the United Kingdom, who takes the lead from Sweden. While the UK consistently performed relatively well over the past five years, the improvement in British SMEs’ external finance conditions between 2016 and 2017 might come as a surprise to some, given the political background against which it occured. Apart from the new leader, the top 3 of the ranking remains unaltered and is completed by Finland and Germany. Sweden, recording its worst relative performance since 2013, occupies the sixth place and is now also preceded by Austria and Poland.
Figure 1: The EIF SME Finance Index: country comparison and evolution over time
Source: Author
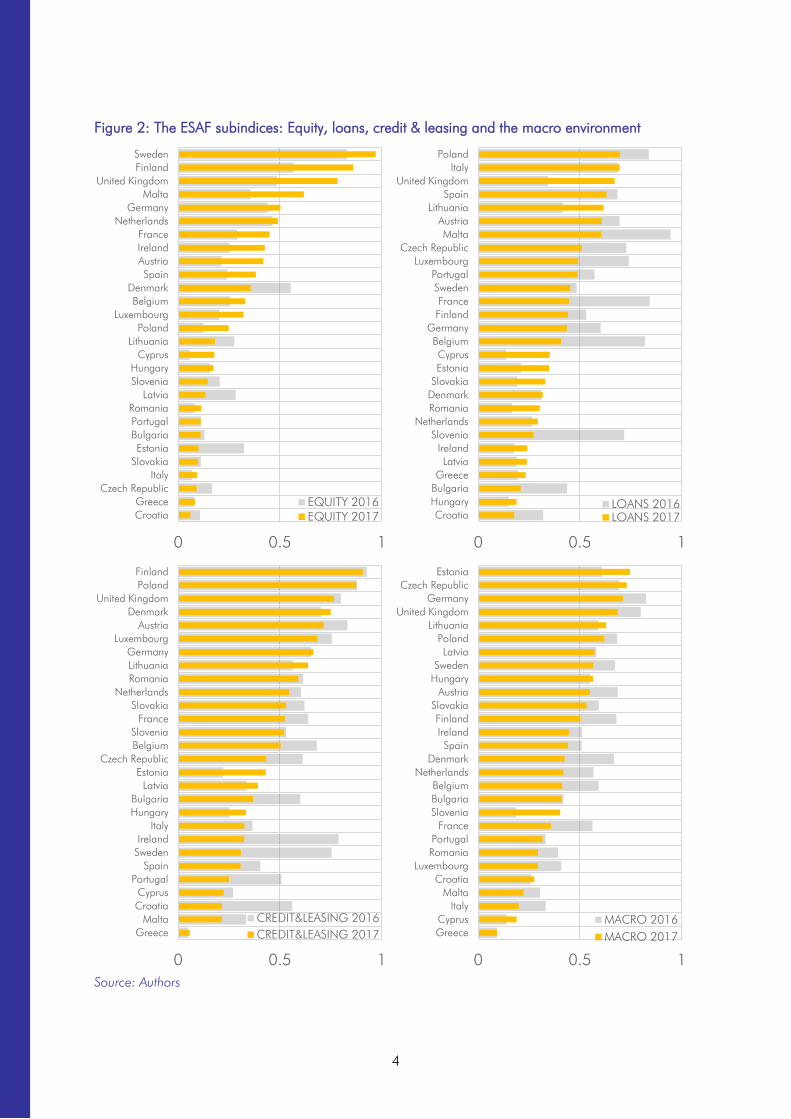
Figure 2 presents the outcome of the four underlying ESAF subindices, comparing value changes between 2016 and 2017 and thereby providing some deeper insights into the aggregate ESAF outcome presented in Figure 1. The drop in ranking of Sweden appears to have been caused by a deterioration of the conditions on the Credit & Leasing market (see section 4.1 for an in-depth discussion on the Swedish and British outcomes), but also the Macro environment turned out to be somewhat less favourable than was the case in 2016. On the equity side, Sweden still firmly leads the ranking. Relative conditions on the equity markets improved for most countries. In Estonia, Denmark and Latvia conditions deteriorated most, while in Czech Republic, Lithuania, Slovenia and Croatia conditions deteriorated slightly.
0
0.1
0.2
0.3
0.4
0.5
0.6
0.7
0.8
Uni
ted
King
dom
Finl
and
Ger
man
y
Aus
tria
Pola
nd
Swed
en
Lith
uani
a
Fran
ce
Den
mar
k
Net
herla
nds
Spai
n
Luxe
mbo
urg
Belg
ium
Mal
ta
Irela
nd
Cze
ch R
epub
lic
Esto
nia
Slov
akia
Slov
enia
Latv
ia
Hun
gary
Rom
ania
Portu
gal
Italy
Bulg
aria
Cyp
rus
Cro
atia
Gre
ece
2013 2014 2015 2016 2017
4
Figure 2: The ESAF subindices: Equity, loans, credit & leasing and the macro environment
Source: Authors
0 0.5 1
CroatiaGreece
Czech RepublicItaly
SlovakiaEstonia
BulgariaPortugalRomania
LatviaSloveniaHungary
CyprusLithuania
PolandLuxembourg
BelgiumDenmark
SpainAustriaIrelandFrance
NetherlandsGermany
MaltaUnited Kingdom
FinlandSweden
EQUITY 2016EQUITY 2017
0 0.5 1
CroatiaHungaryBulgariaGreece
LatviaIreland
SloveniaNetherlands
RomaniaDenmarkSlovakiaEstoniaCyprus
BelgiumGermany
FinlandFrance
SwedenPortugal
LuxembourgCzech Republic
MaltaAustria
LithuaniaSpain
United KingdomItaly
Poland
LOANS 2016LOANS 2017
0 0.5 1
GreeceMalta
CroatiaCyprus
PortugalSpain
SwedenIreland
ItalyHungaryBulgaria
LatviaEstonia
Czech RepublicBelgiumSlovenia
FranceSlovakia
NetherlandsRomaniaLithuaniaGermany
LuxembourgAustria
DenmarkUnited Kingdom
PolandFinland
CREDIT&LEASING 2016CREDIT&LEASING 2017
0 0.5 1
GreeceCyprus
ItalyMalta
CroatiaLuxembourg
RomaniaPortugal
FranceSloveniaBulgariaBelgium
NetherlandsDenmark
SpainIrelandFinland
SlovakiaAustria
HungarySweden
LatviaPoland
LithuaniaUnited Kingdom
GermanyCzech Republic
Estonia
MACRO 2016MACRO 2017
5
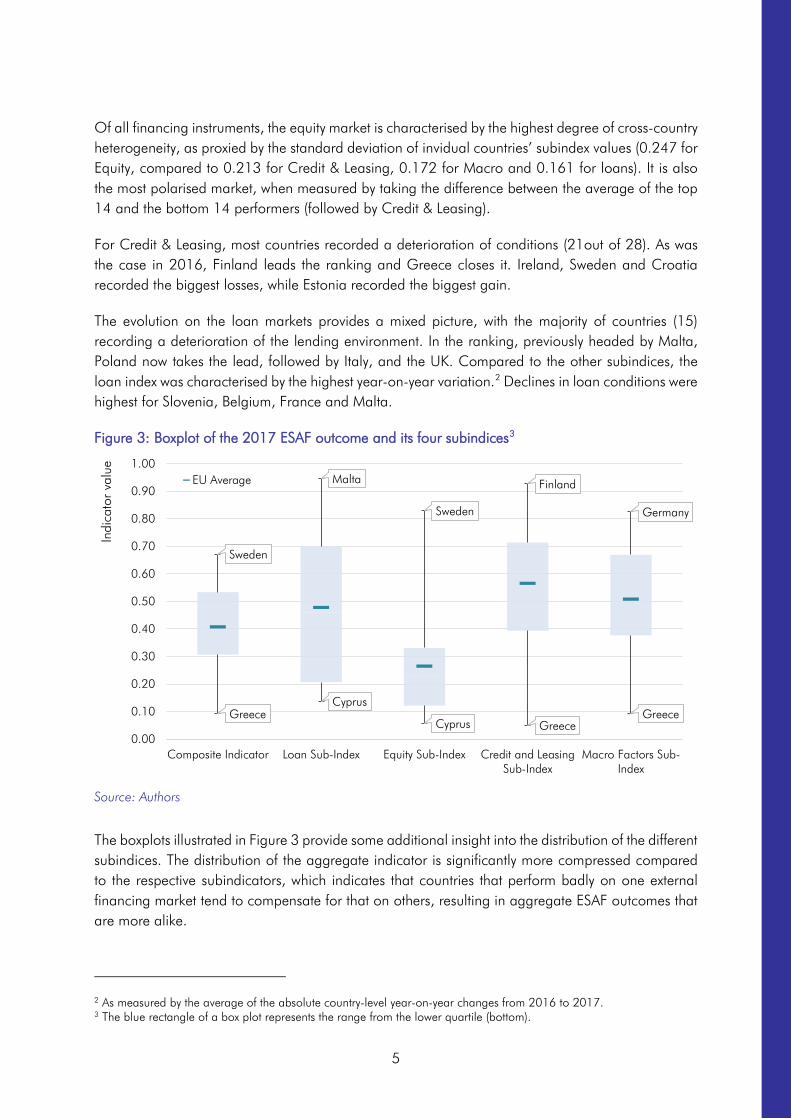
Of all financing instruments, the equity market is characterised by the highest degree of cross-country heterogeneity, as proxied by the standard deviation of invidual countries’ subindex values (0.247 for Equity, compared to 0.213 for Credit & Leasing, 0.172 for Macro and 0.161 for loans). It is also the most polarised market, when measured by taking the difference between the average of the top 14 and the bottom 14 performers (followed by Credit & Leasing).
For Credit & Leasing, most countries recorded a deterioration of conditions (21out of 28). As was the case in 2016, Finland leads the ranking and Greece closes it. Ireland, Sweden and Croatia recorded the biggest losses, while Estonia recorded the biggest gain.
The evolution on the loan markets provides a mixed picture, with the majority of countries (15) recording a deterioration of the lending environment. In the ranking, previously headed by Malta, Poland now takes the lead, followed by Italy, and the UK. Compared to the other subindices, the loan index was characterised by the highest year-on-year variation.2 Declines in loan conditions were highest for Slovenia, Belgium, France and Malta.
Figure 3: Boxplot of the 2017 ESAF outcome and its four subindices3
Source: Authors
The boxplots illustrated in Figure 3 provide some additional insight into the distribution of the different subindices. The distribution of the aggregate indicator is significantly more compressed compared to the respective subindicators, which indicates that countries that perform badly on one external financing market tend to compensate for that on others, resulting in aggregate ESAF outcomes that are more alike.
2 As measured by the average of the absolute country-level year-on-year changes from 2016 to 2017. 3 The blue rectangle of a box plot represents the range from the lower quartile (bottom).
Sweden
Malta
Sweden
Finland
Germany
GreeceCyprus
Cyprus GreeceGreece
0.00
0.10
0.20
0.30
0.40
0.50
0.60
0.70
0.80
0.90
1.00
Composite Indicator Loan Sub-Index Equity Sub-Index Credit and LeasingSub-Index
Macro Factors Sub-Index
Indi
cato
r va
lue
EU Average
6
3 A closer look at some of the dynamics
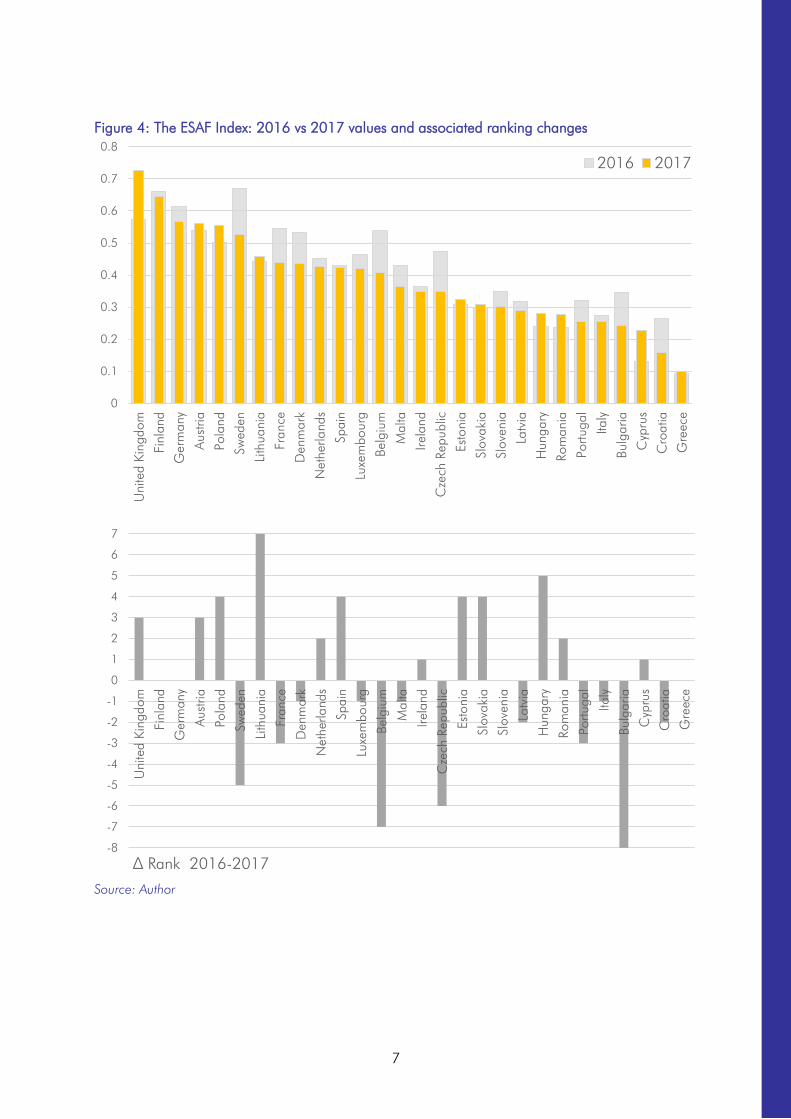
Figure 4 (on page 7) illustrates how the year to year changes in the ESAF values translated into changes in the ranking of countries. Sweden and the UK, the former and current leader, respectively, were also the two countries that experienced the biggest change in the value of the indicator, in absolute value. This caused the UK to jump up 3 places in the ranking, while Sweden dropped 5. Large shifts in a country’s ranking are not necessarily associated with large changes in the country’s underlying SMEs’ financing conditions (and hence ESAF value), but can also be caused by a compressed distribution of ESAF values around the country’s earlier spot in the ESAF ranking. This seems for example to be the case for Lithuania, where a modest change in the ESAF’s value led to a significant jump (7 spots) in the country ranking between 2016 and 2017. On the negative side of that distribution, Bulgaria lost the most places (8 spots). Contrary to the Lithuanian case, the underlying change in the ESAF value was more substantial, caused by a deterioration of its debt markets (both on the loan and on the credit and leasing segment). The second and third largest rankings drops were recorded for Belgium and Czech Republic. For the latter country, the associated change in the ESAF value was limited. For Belgium, a minor improvement in its equity subindex could not be compensated by a deterioration on all other fronts, resulting in a significant negative impact on the aggregate ESAF value.
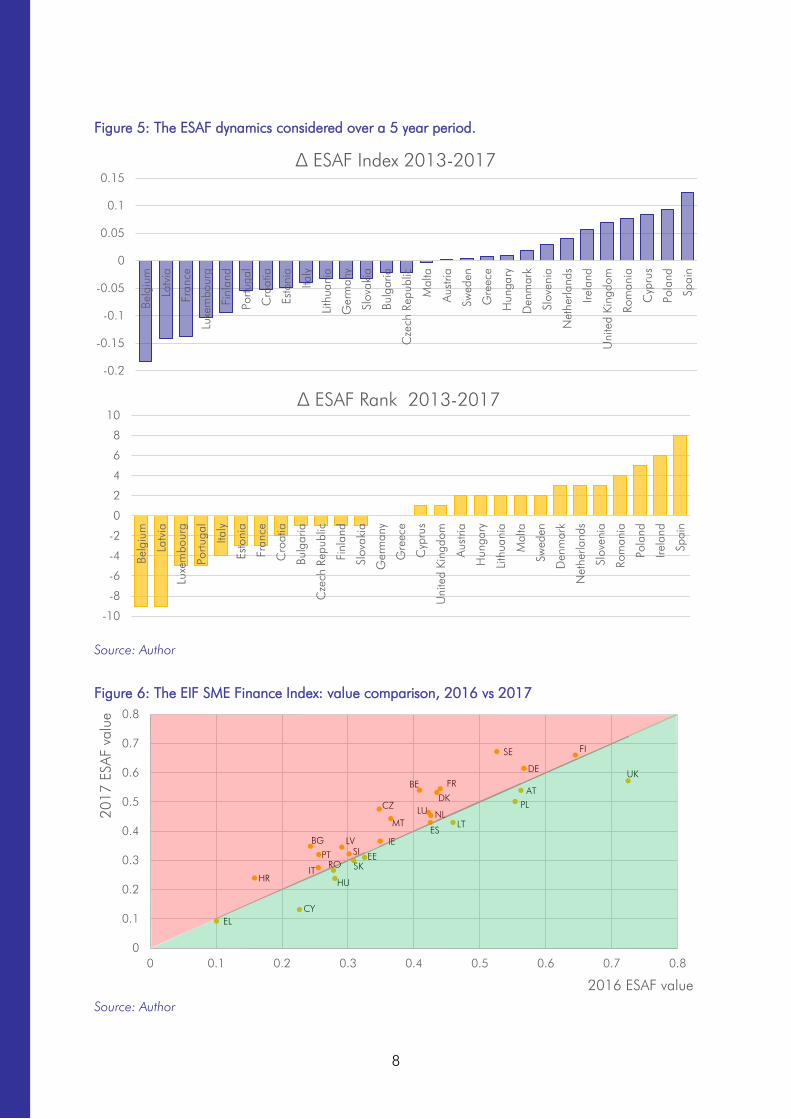
The 2017-update implied the fifth data-point in the ESAF time series, a time span long enough to analyse patterns in ESAF and ranking dynamics. Figure 5 does exactly that by illustrating the change in the ESAF value as well as the ranking shifts between 2013 and 2017. Over this five year period, Spain has improved most, both in terms of ESAF value and in the ranking (10 spots). In fact, together with Romania, Spain is the only country that was able to consistently improve each year since the start of the time series. On the other side of this spectrum, we find Belgium and Latvia. Both countries lost 9 spots in the ranking. We will discuss the Belgian and the Spanish case in greater detail in section 4.2.
It is clear that, despite the sometimes weak connection in the magnitude of the change in the value of the ESAF and the shift in the ranking (as discussed before), the ESAF value and the associated ranking move in close correlation to each other, as can be seen by comparing the top and the bottom panel of Figure 5.
Figure 6 plots the 2017 ESAF values against those of 2016. All countries located in the red part of the graphic experienced a (relative) deterioration in external financing conditions, while the opposite holds true for countries in the green part of the graph. This particular way of plotting the data makes it possible to examine whether a pattern of polarisation is taking place, or shifts in the ESAF value occur rather randomly across its distribution. As it stands, between 2016 and 2017 no particular polarisation pattern can be identified in EU countries’ external financing conditions.
7
Figure 4: The ESAF Index: 2016 vs 2017 values and associated ranking changes
Source: Author
0
0.1
0.2
0.3
0.4
0.5
0.6
0.7
0.8U
nite
d Ki
ngdo
m
Finl
and
Ger
man
y
Aus
tria
Pola
nd
Swed
en
Lith
uani
a
Fran
ce
Den
mar
k
Net
herla
nds
Spai
n
Luxe
mbo
urg
Belg
ium
Mal
ta
Irela
nd
Cze
ch R
epub
lic
Esto
nia
Slov
akia
Slov
enia
Latv
ia
Hun
gary
Rom
ania
Portu
gal
Italy
Bulg
aria
Cyp
rus
Cro
atia
Gre
ece
2016 2017
-8
-7
-6
-5
-4
-3
-2
-1
0
1
2
3
4
5
6
7
Uni
ted
King
dom
Finl
and
Ger
man
y
Aus
tria
Pola
nd
Swed
en
Lith
uani
a
Fran
ce
Den
mar
k
Net
herla
nds
Spai
n
Luxe
mbo
urg
Belg
ium
Mal
ta
Irela
nd
Cze
ch R
epub
lic
Esto
nia
Slov
akia
Slov
enia
Latv
ia
Hun
gary
Rom
ania
Portu
gal
Italy
Bulg
aria
Cyp
rus
Cro
atia
Gre
ece
∆ Rank 2016-2017
8
Figure 5: The ESAF dynamics considered over a 5 year period.
Source: Author
Figure 6: The EIF SME Finance Index: value comparison, 2016 vs 2017
Source: Author
-0.2
-0.15
-0.1
-0.05
0
0.05
0.1
0.15
Belg
ium
Latv
ia
Fran
ce
Luxe
mbo
urg
Finl
and
Portu
gal
Cro
atia
Esto
nia
Italy
Lith
uani
a
Ger
man
y
Slov
akia
Bulg
aria
Cze
ch R
epub
lic
Mal
ta
Aus
tria
Swed
en
Gre
ece
Hun
gary
Den
mar
k
Slov
enia
Net
herla
nds
Irela
nd
Uni
ted
King
dom
Rom
ania
Cyp
rus
Pola
nd
Spai
n
∆ ESAF Index 2013-2017
-10
-8
-6
-4
-2
0
2
4
6
8
10
Belg
ium
Latv
ia
Luxe
mbo
urg
Portu
gal
Italy
Esto
nia
Fran
ce
Cro
atia
Bulg
aria
Cze
ch R
epub
lic
Finl
and
Slov
akia
Ger
man
y
Gre
ece
Cyp
rus
Uni
ted
King
dom
Aus
tria
Hun
gary
Lith
uani
a
Mal
ta
Swed
en
Den
mar
k
Net
herla
nds
Slov
enia
Rom
ania
Pola
nd
Irela
nd
Spai
n
∆ ESAF Rank 2013-2017
SE FI
DE UKFRBE
ATDK
PLCZ LU NLMT LT
ESIEBG LV
SIPT EESKIT
ROHR HU
CYEL
0
0.1
0.2
0.3
0.4
0.5
0.6
0.7
0.8
0 0.1 0.2 0.3 0.4 0.5 0.6 0.7 0.8
2017
ESA
F va
lue
2016 ESAF value
9
4 A few case studies
4.1 The UK vs Sweden
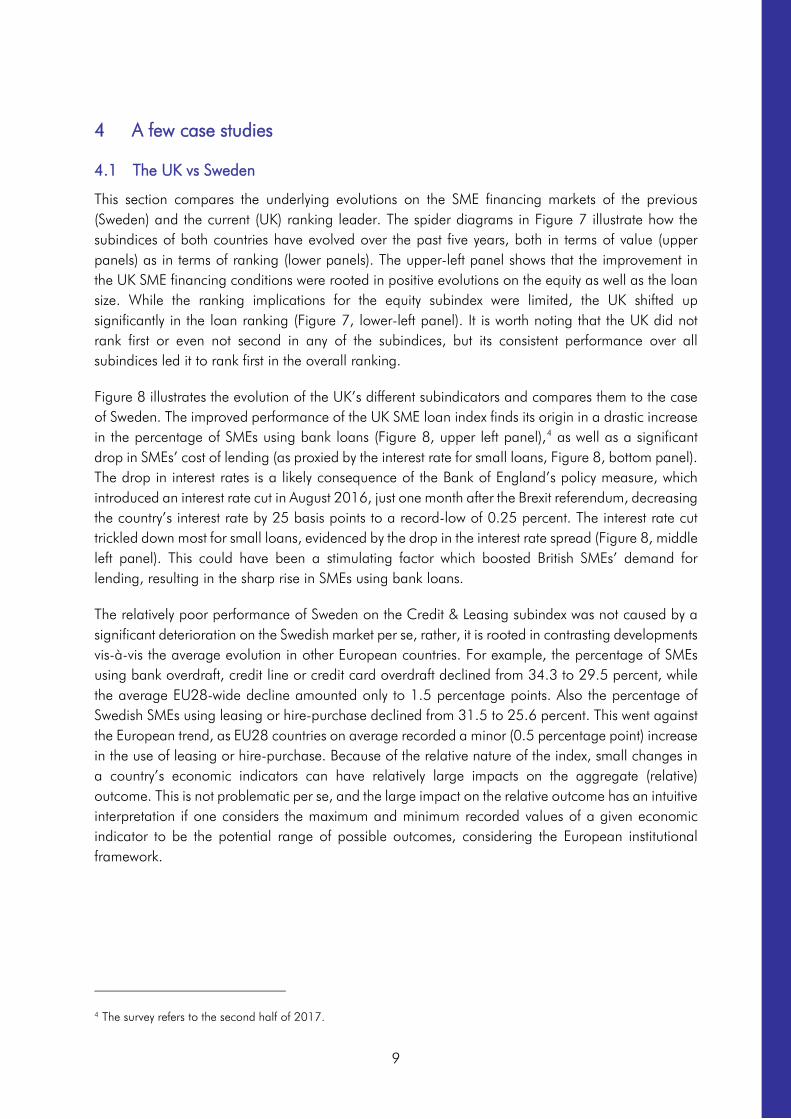
This section compares the underlying evolutions on the SME financing markets of the previous (Sweden) and the current (UK) ranking leader. The spider diagrams in Figure 7 illustrate how the subindices of both countries have evolved over the past five years, both in terms of value (upper panels) as in terms of ranking (lower panels). The upper-left panel shows that the improvement in the UK SME financing conditions were rooted in positive evolutions on the equity as well as the loan size. While the ranking implications for the equity subindex were limited, the UK shifted up significantly in the loan ranking (Figure 7, lower-left panel). It is worth noting that the UK did not rank first or even not second in any of the subindices, but its consistent performance over all subindices led it to rank first in the overall ranking.
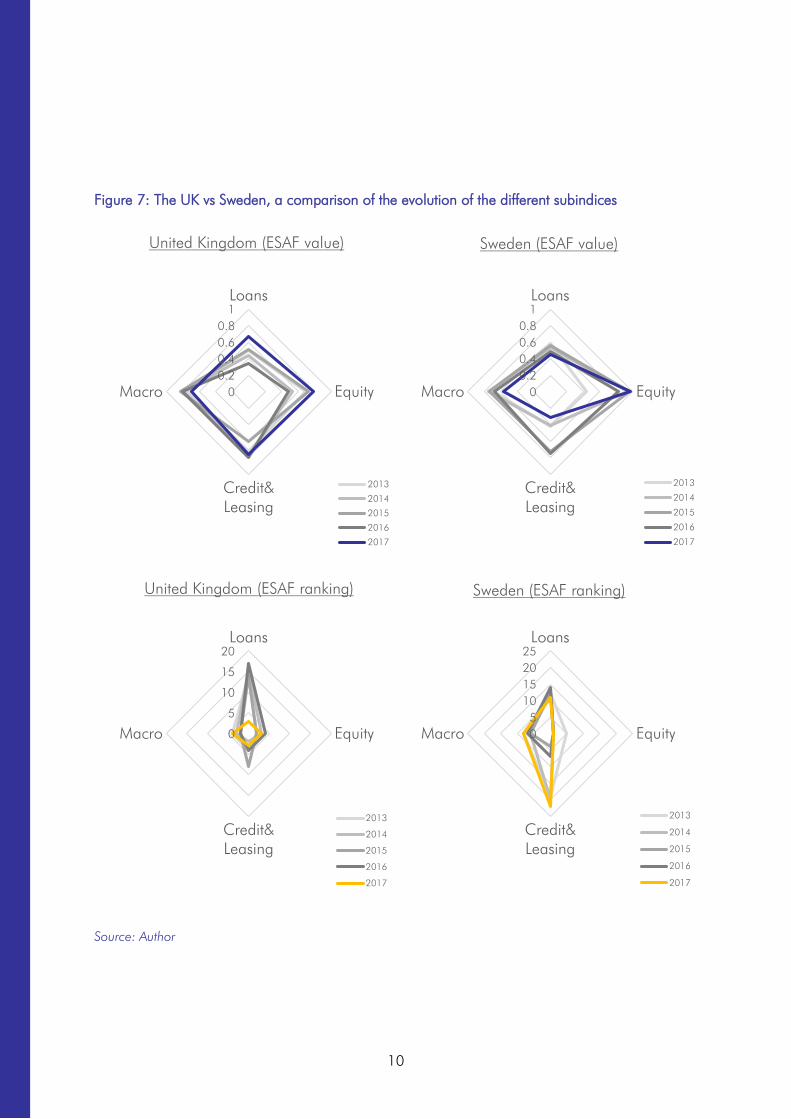
Figure 8 illustrates the evolution of the UK’s different subindicators and compares them to the case of Sweden. The improved performance of the UK SME loan index finds its origin in a drastic increase in the percentage of SMEs using bank loans (Figure 8, upper left panel),4 as well as a significant drop in SMEs’ cost of lending (as proxied by the interest rate for small loans, Figure 8, bottom panel). The drop in interest rates is a likely consequence of the Bank of England’s policy measure, which introduced an interest rate cut in August 2016, just one month after the Brexit referendum, decreasing the country’s interest rate by 25 basis points to a record-low of 0.25 percent. The interest rate cut trickled down most for small loans, evidenced by the drop in the interest rate spread (Figure 8, middle left panel). This could have been a stimulating factor which boosted British SMEs’ demand for lending, resulting in the sharp rise in SMEs using bank loans.
The relatively poor performance of Sweden on the Credit & Leasing subindex was not caused by a significant deterioration on the Swedish market per se, rather, it is rooted in contrasting developments vis-à-vis the average evolution in other European countries. For example, the percentage of SMEs using bank overdraft, credit line or credit card overdraft declined from 34.3 to 29.5 percent, while the average EU28-wide decline amounted only to 1.5 percentage points. Also the percentage of Swedish SMEs using leasing or hire-purchase declined from 31.5 to 25.6 percent. This went against the European trend, as EU28 countries on average recorded a minor (0.5 percentage point) increase in the use of leasing or hire-purchase. Because of the relative nature of the index, small changes in a country’s economic indicators can have relatively large impacts on the aggregate (relative) outcome. This is not problematic per se, and the large impact on the relative outcome has an intuitive interpretation if one considers the maximum and minimum recorded values of a given economic indicator to be the potential range of possible outcomes, considering the European institutional framework.
4 The survey refers to the second half of 2017.
10
Figure 7: The UK vs Sweden, a comparison of the evolution of the different subindices
Source: Author
00.20.40.60.8
1Loans
Equity
Credit&Leasing
Macro
United Kingdom (ESAF value)
2013
2014
2015
2016
2017
00.20.40.60.8
1Loans
Equity
Credit&Leasing
Macro
Sweden (ESAF value)
2013
2014
2015
2016
2017
0
5
10
15
20Loans
Equity
Credit&Leasing
Macro
United Kingdom (ESAF ranking)
2013
2014
2015
2016
2017
05
10152025Loans
Equity
Credit&Leasing
Macro
Sweden (ESAF ranking)
2013
2014
2015
2016
2017
11
Figure 8: The UK vs Sweden, a comparison of the individual loan variables
Source: Author
0%5%
10%15%20%25%30%35%40%45%
2013 2014 2015 2016 2017
Percentage of SMEs using bank loans in the last 6 months
0%
2%
4%
6%
8%
10%
12%
2013 2014 2015 2016 2017
Percentage of SMEs using grants or subsidised bank loans in the last 6
months
0%
1%
2%
3%
4%
5%
6%
7%
2013 2014 2015 2016 2017
Percentage of SMEs not applying for a bank loan because of possible rejection
in the last 6 months
0.0%
0.5%
1.0%
1.5%
2.0%
2013 2014 2015 2016 2017
Interest rate spread (under € 250K vs over € 1m for floating rate with IRF up
to 1 year)
0%1%1%2%2%3%3%4%4%5%5%
2013 2014 2015 2016 2017
Interest rate for loans under € 250K (floating rate with IRF up to 1 year)
Sweden UK
12
4.2 Spain vs Belgium
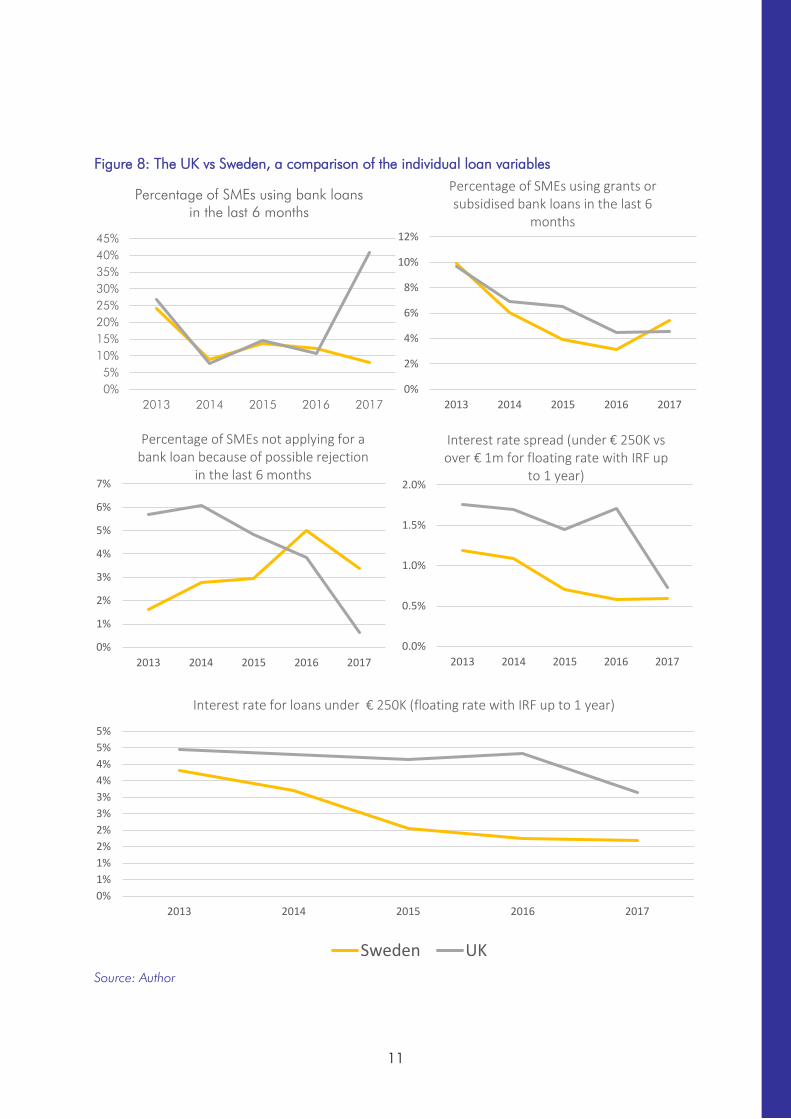
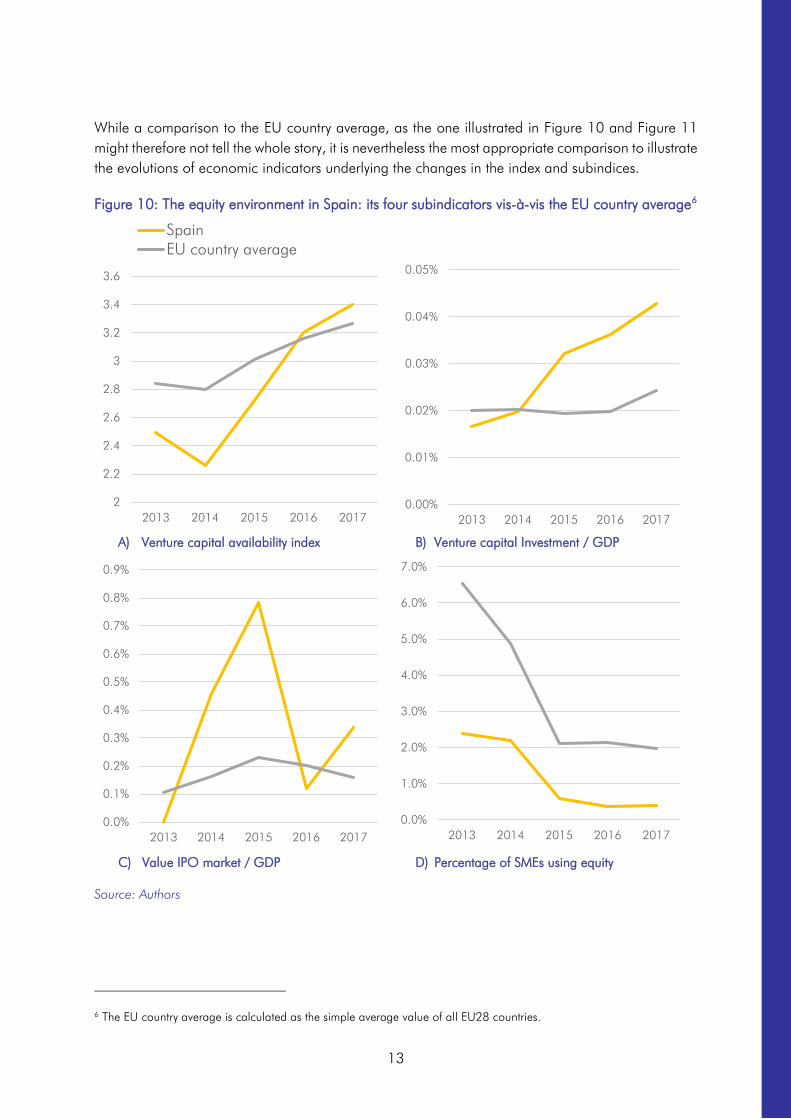
In this section we examine the diverging fortunes of Spain and Belgium, the two countries with the most extreme performance on either side of the spectrum between 2013 and 2017 (see Figure 5). Figure 9 shows that the improvement of Spanish overall external finance conditions happened in spite of a deteriorating credit and leasing market, which were compensated by positive developments elsewhere. It also becomes clear that in 2017 Spanish SMEs were particularly better served when it comes to equity, a market which still showed significant weakness in 2013, but has partly recovered since. Figure 10 illustrates the evolution of the equity subindicators over the considered period. Between 2014 and 2017, the World Economics Forum’s Venture Capital Availability Index (WEF, 2017) has risen above the average level of the EU28 countries (Figure 10A).5 The evolution in the index is consistent with the evolution of VC investments (Figure 10B), which, relative to GDP, has more than doubled since 2013.
Figure 9: Belgium and Spain, a comparison of the evolution of the different subindices
Source: Authors
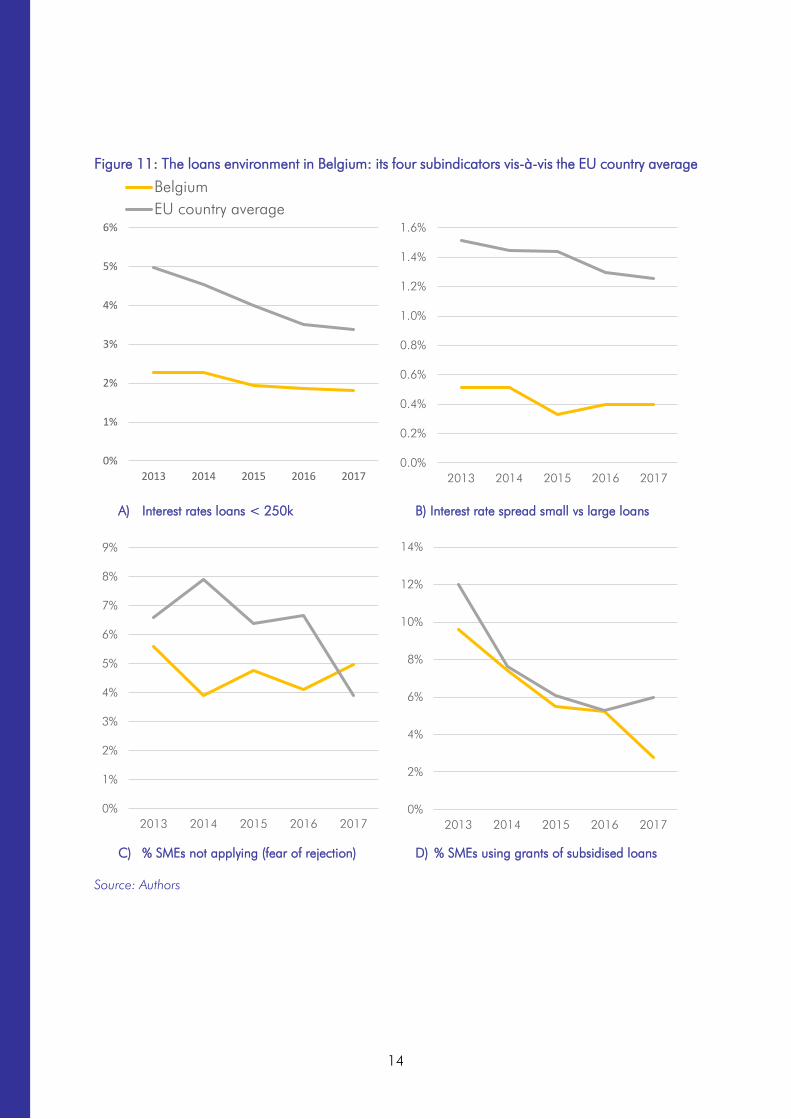
Belgium’s index decline seems rooted in both the macro and the lending environment, which deteriorated significantly, and to a lesser extent the Credit & Leasing subindex, while no consistent trends are recorded for the equity subindex. Figure 3 revealed Belgium performs about average for SME lending environment, a noticeable difference from past performance, as in 2013 it still occupied the fourth spot in the ranking. In this context, Figure 11 (page 14) illustrates the evolution of the four Loan subindicators for Belgium, comparing them to the EU country average. While interest rates on small loans are still relatively low in Belgium, they have declined less strongly compared to other EU countries. Also the percentage of Belgian SMEs not applying for bank loans out of fear for possible rejection remained relatively constant between 2013 and 2017, contrary to the EU average, which declined significantly. It is important to stress that the ESAF Index is a relative measure whose values are always expressed vis-à-vis the best and the worst performing country on respective subindicators.
5 The Venture Capital Availability Index is published annually and is derived from a survey question in the Executive Opinion Survey. It polls start-up entrepreneurs about the ease of obtaining risk capital for innovative projects (1 = extremely difficult, 7 = extremely easy).
0.00
0.20
0.40
0.60
0.80Loans
Equity
Credit&Leasing
Macro
Spain
20132014201520162017
0.00
0.20
0.40
0.60
0.80
1.00Loans
Equity
Credit&Leasing
Macro
Belgium
20132014201520162017
13
While a comparison to the EU country average, as the one illustrated in Figure 10 and Figure 11 might therefore not tell the whole story, it is nevertheless the most appropriate comparison to illustrate the evolutions of economic indicators underlying the changes in the index and subindices.
Figure 10: The equity environment in Spain: its four subindicators vis-à-vis the EU country average6
A) Venture capital availability index B) Venture capital Investment / GDP
C) Value IPO market / GDP D) Percentage of SMEs using equity
Source: Authors
6 The EU country average is calculated as the simple average value of all EU28 countries.
2
2.2
2.4
2.6
2.8
3
3.2
3.4
3.6
2013 2014 2015 2016 2017
SpainEU country average
0.00%
0.01%
0.02%
0.03%
0.04%
0.05%
2013 2014 2015 2016 2017
0.0%
0.1%
0.2%
0.3%
0.4%
0.5%
0.6%
0.7%
0.8%
0.9%
2013 2014 2015 2016 20170.0%
1.0%
2.0%
3.0%
4.0%
5.0%
6.0%
7.0%
2013 2014 2015 2016 2017
14
Figure 11: The loans environment in Belgium: its four subindicators vis-à-vis the EU country average
A) Interest rates loans < 250k B) Interest rate spread small vs large loans
C) % SMEs not applying (fear of rejection) D) % SMEs using grants of subsidised loans
Source: Authors
0%
1%
2%
3%
4%
5%
6%
2013 2014 2015 2016 2017
BelgiumEU country average
0.0%
0.2%
0.4%
0.6%
0.8%
1.0%
1.2%
1.4%
1.6%
2013 2014 2015 2016 2017
0%
1%
2%
3%
4%
5%
6%
7%
8%
9%
2013 2014 2015 2016 20170%
2%
4%
6%
8%
10%
12%
14%
2013 2014 2015 2016 2017
15
5 The ESAF Index vs the EIBIS financial constraints indicator
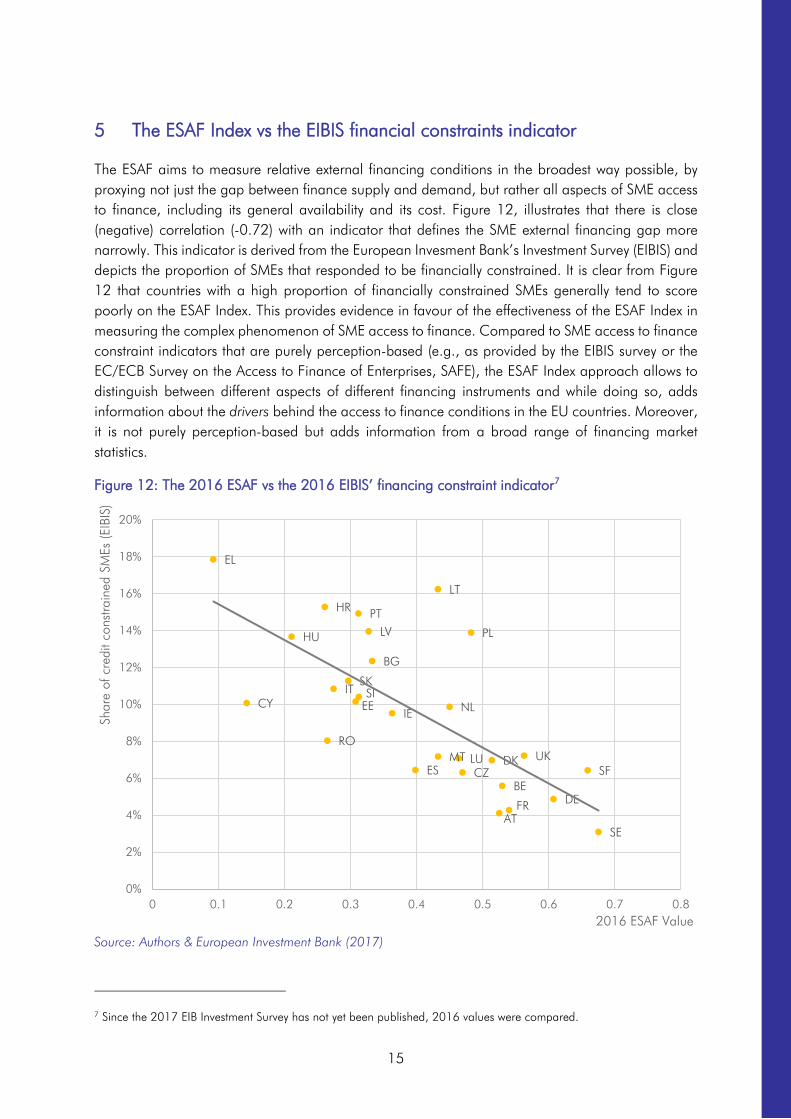
The ESAF aims to measure relative external financing conditions in the broadest way possible, by proxying not just the gap between finance supply and demand, but rather all aspects of SME access to finance, including its general availability and its cost. Figure 12, illustrates that there is close (negative) correlation (-0.72) with an indicator that defines the SME external financing gap more narrowly. This indicator is derived from the European Invesment Bank’s Investment Survey (EIBIS) and depicts the proportion of SMEs that responded to be financially constrained. It is clear from Figure 12 that countries with a high proportion of financially constrained SMEs generally tend to score poorly on the ESAF Index. This provides evidence in favour of the effectiveness of the ESAF Index in measuring the complex phenomenon of SME access to finance. Compared to SME access to finance constraint indicators that are purely perception-based (e.g., as provided by the EIBIS survey or the EC/ECB Survey on the Access to Finance of Enterprises, SAFE), the ESAF Index approach allows to distinguish between different aspects of different financing instruments and while doing so, adds information about the drivers behind the access to finance conditions in the EU countries. Moreover, it is not purely perception-based but adds information from a broad range of financing market statistics.
Figure 12: The 2016 ESAF vs the 2016 EIBIS’ financing constraint indicator7
Source: Authors & European Investment Bank (2017)
7 Since the 2017 EIB Investment Survey has not yet been published, 2016 values were compared.
AT
BE
BG
HR
CY
CZDK
EE
SF
FR DE
EL
HU
IE
IT
LV
LT
LUMT
NL
PL
PT
RO
SKSI
ES
SE
UK
0%
2%
4%
6%
8%
10%
12%
14%
16%
18%
20%
0 0.1 0.2 0.3 0.4 0.5 0.6 0.7 0.8
Shar
e of
cre
dit c
onst
rain
ed S
MEs
(EIB
IS)
2016 ESAF Value
16
6 Conclusion
This note provided some background information on the current update of the EIF SME Access to Finance Index, using data for 2017, and presented a few case studies. It explained the underlying evolution behind the good relative performance of the United Kingdom and the relative deterioration of the Swedish SME access to finance conditions. It also highlighted the diverging fortunes of the two countries who experienced the largest change in the absolute value of the ESAF index between 2013 and 2017: Belgium and Spain. By focusing on these individual cases, it is our hope to ensure transparency with respect to the ESAF’s results, its methodology and the underlying economic indicators. Finally, it was shown that the ESAF Index correlates strongly with an alternative measure of access to finance, the EIBIS’ proportion of SMEs that feel financially constrained.
17
References
European Investment Bank (2017). EIB Group Survey on Investment and Investment Finance: EU overview.
Gvetadze, S., Kraemer-Eis, H., Lang, F., Prencipe, D., Signore, S., & Torfs, W. (2018). EIF SME Access to Finance Index. EIF Working Paper, No. 2018/47.
Kraemer-Eis, H., Lang, F., Torfs, W., and Gvetadze, S. (2016a). European Small Business Finance Outlook: June 2016. EIF Working Paper 2016/35.
WEF (2017). The Global Competitiveness Report 2017-2018. World Economic Forum.
18
About …
… the European Investment Fund
The European Investment Fund (EIF) is Europe’s leading risk finance provider for small and medium sized enterprises (SMEs) and mid-caps, with a central mission to facilitate their access to finance. As part of the European Investment Bank (EIB) Group, EIF designs, promotes and implements equity and debt financial instruments which specifically target the needs of these market segments.
In this role, EIF fosters EU objectives in support of innovation, research and development, entrepreneurship, growth, and employment. EIF manages resources on behalf of the EIB, the European Commission, national and regional authorities and other third parties. EIF support to enterprises is provided through a wide range of selected financial intermediaries across Europe. EIF is a public-private partnership whose tripartite shareholding structure includes the EIB, the European Union represented by the European Commission and various public and private financial institutions from European Union Member States and Turkey. For further information, please visit www.eif.org.
… EIF’s Research & Market Analysis
Research & Market Analysis (RMA) supports EIF’s strategic decision-making, product development and mandate management processes through applied research and market analyses. RMA works as internal advisor, participates in international fora and maintains liaison with many organisations and institutions.
… this Working Paper series
The EIF Working Papers are designed to make available to a wider readership selected topics and studies in relation to EIF´s business. The Working Papers are edited by EIF´s Research & Market Analysis and are typically authored or co-authored by EIF staff, or written in cooperation with EIF. The Working Papers are usually available only in English and typically distributed in electronic form (pdf).
19
EIF Working Papers
2009/001 Microfinance in Europe – A market overview. November 2009.
2009/002 Financing Technology Transfer. December 2009.
2010/003 Private Equity Market in Europe – Rise of a new cycle or tail of the recession?
February 2010. 2010/004 Private Equity and Venture Capital Indicators – A research of EU27 Private Equity and Venture Capital Markets. April 2010. 2010/005 Private Equity Market Outlook.
May 2010. 2010/006 Drivers of Private Equity Investment activity. Are Buyout and Venture investors really so different? August 2010 2010/007 SME Loan Securitisation – an important tool to support European SME lending.
October 2010. 2010/008 Impact of Legislation on Credit Risk – How different are the U.K. and Germany?
November 2010. 2011/009 The performance and prospects of European Venture Capital.
May 2011. 2011/010 European Small Business Finance Outlook.
June 2011. 2011/011 Business Angels in Germany. EIF’s initiative to support the non-institutional
financing market. November 2011. 2011/012 European Small Business Finance Outlook 2/2011.
December 2011. 2012/013 Progress for microfinance in Europe.
January 2012. 2012/014 European Small Business Finance Outlook.
May 2012. 2012/015 The importance of leasing for SME finance.
August 2012. 2012/016 European Small Business Finance Outlook.
December 2012. 2013/017 Forecasting distress in European SME portfolios.
May 2013. 2013/018 European Small Business Finance Outlook.
June 2013.
20
2013/019 SME loan securitisation 2.0 – Market assessment and policy options. October 2013.
2013/020 European Small Business Finance Outlook. December 2013.
2014/021 Financing the mobility of students in European higher education. January 2014.
2014/022 Guidelines for SME Access to Finance Market Assessments. April 2014.
2014/023 Pricing Default Risk: the Good, the Bad, and the Anomaly. June 2014.
2014/024 European Small Business Finance Outlook. June 2014.
2014/025 Institutional non-bank lending and the role of debt funds. October 2014.
2014/026 European Small Business Finance Outlook. December 2014.
2015/027 Bridging the university funding gap: determinants and consequences of university
seed funds and proof-of-concept Programs in Europe. May 2015. 2015/028 European Small Business Finance Outlook.
June 2015. 2015/029 The Economic Impact of EU Guarantees on Credit to SMEs - Evidence from CESEE
Countries. July 2015. 2015/030 Financing patterns of European SMEs: An Empirical Taxonomy.
November 2015. 2015/031 SME Securitisation – at a crossroads?
December 2015. 2015/032 European Small Business Finance Outlook.
December 2015. 2016/033 Evaluating the impact of European microfinance. The foundations.
January 2016 2016/034 The European Venture Capital Landscape: an EIF perspective.
Volume I: the impact of EIF on the VC ecosystem. June 2016. 2016/035 European Small Business Finance Outlook.
June 2016. 2016/036 The role of cooperative banks and smaller institutions for the financing of SMEs and
small midcaps in Europe. July 2016. 2016/037 European Small Business Finance Outlook.
December 2016. 2016/038 The European Venture Capital Landscape: an EIF perspective. Volume II: Growth patterns of EIF-backed startups. December 2016.
21
2017/039 Guaranteeing Social Enterprises – The EaSI way. February 2017.
2017/040 Financing Patterns of European SMEs Revisited: An Updated Empirical Taxonomy and Determinants of SME Financing Clusters. March 2017.
2017/041 The European Venture Capital landscape: an EIF perspective. Volume III: Liquidity events and returns of EIF-backed VC investments. April 2017.
2017/042 Credit Guarantee Schemes for SME lending in Western Europe. June 2017.
2017/043 European Small Business Finance Outlook. June 2017.
2017/044 Financing Micro Firms in Europe: An Empirical Analysis. September 2017.
2017/045 The European venture capital landscape: an EIF perspective. Volume IV: The value of innovation for EIF-backed startups. December 2017.
2017/046 European Small Business Finance Outlook. December 2017.
2018/047 EIF SME Access to Finance Index. January 2018. 2018/048 EIF VC Survey 2018 – Fund managers’ market sentiment and views on public
intervention. April 2018. 2018/049 EIF SME Access to Finance Index – June 2018 update June 2018.

22