eifel maars: quantitative shape characterization of
TRANSCRIPT

Eifel maars: Quantitative shape characterization of juvenile ash particles(Eifel Volcanic Field, Germany)
Juanita Rausch a,⁎, Bernard Grobéty a, Pierre Vonlanthen b
a Department of Geosciences, University of Fribourg, Chemin du Musée 6, CH-1700 Fribourg, Switzerlandb Institute of Earth Sciences, University of Lausanne, UNIL Mouline, Building Géopolis, CH-1015 Lausanne, Switzerland
The Eifel region in western central Germany is the type locality for maar volcanism, which is classicallyinterpreted to be the result of explosive eruptions due to shallow interaction between magma and externalwater (i.e. phreatomagmatic eruptions). Sedimentary structures, deposit features and particle morphologyfound in many maar deposits of the West Eifel Volcanic Field (WEVF), in contrast to deposits in the East EifelVolcanic Field (EEVF), lack the diagnostic criteria of typical phreatomagmatic deposits.The aim of this studywas to determine quantitatively the shape ofWEVF and EEVFmaar ash particles in order toinfer the governing eruption style in Eifel maar volcanoes. The quantitative shape characterization was done byanalyzing fractal dimensions of particle contours (125–250 μm sieve fraction) obtained from Scanning electronmicroscopy (SEM) and SEM micro-computed tomography (SEM micro-CT) images.The fractal analysis (dilation method) and the fractal spectrum technique confirmed that the WEVF and EEVFmaar particles have contrasting multifractal shapes. Whereas the low small-scale dimensions of EEVF particles(Eppelsberg Green Unit) coincide with previously published values for phreatomagmatic particles, the WEVFparticles (Meerfelder Maar, Pulvermaar and Ulmener Maar) have larger values indicating more complex small-scale features, which are characteristic for magmatic particles. These quantitative results are strengthening thequalitative microscopic observations, that the studied WEVF maar eruptions are rather dominated by magmaticprocesses. The different eruption styles in the two volcanic fields can be explained by the different geological andhydrological settings found in both regions and the different chemical compositions of the magmas.
1. Introduction and aim of study
The shape and internal texture of juvenile volcanic particles – especiallyof thefine ash fraction – provide unique insights into the fragmentation,the transport and the deposition processes, aswell as the physical prop-erties of erupted magma (e.g. magma viscosity, temperature, volatilecontent). In particular, the shape of volcanic particles can deliver impor-tant information on the conditions in the volcanic conduit during parti-cle formation. Based on the morphology and texture of the juvenileclasts, the role of internal vs. external volatiles in the fragmentation pro-cesses can be evaluated (e.g. Heiken, 1972; Wohletz, 1983; Fisher andSchmincke, 1984; Dellino and La Volpe, 1995, 1996; Zimanowski et al.,1997; Büttner et al., 1999; Maria and Carey, 2002, 2007). Volatiles caneither be released from the ascending magma or may be added froman external source. In the latter case, both magmatic and externalwater derived volatiles will be present in various proportions. Both pro-cessesmay occur at a very high rate, which leads to explosive expansionof the fluid and to fragmentation of the magma. The term “magmatic”
will be used in the case where external water does not play a dominantrole, whereas “phreatomagmatic” implies the interaction of externalwater (e.g. groundwater, seawater, surfacewater, etc.)with the ascend-ing magma (see definition in Morrissey et al., 2000 in Encyclopedia ofVolcanoes, page 431). The characteristics of the fragmentation productsare a function of both the pre-eruptive magma properties and the frag-mentation mechanism (Heiken, 1972; Schmincke, 1977; Wohletz,1983; Fisher and Schmincke, 1984). The morphology of particles fromboth magmatic and phreatomagmatic eruptions have been analyzedquantitatively in the past using classical shape parameters (circularity,elongation, compactness, rectangularity, planarity, convexity, concavi-ty, number of corners, Feret's diameter) (e.g. Honnorez and Kirst,1975; Eiríksson et al., 1994; Dellino and La Volpe, 1996; Cioni et al.,2008). Scanning electron microscopy (SEM) based 3D morphologicalanalysis of particles formed during different eruptive phases of the1982–1983 Galunggung eruption (Indonesia) revealed a clear depen-dence of certain morphological parameters on the amount of externalwater involved (Ersoy et al., 2007). In a comparison study of particlesfrom a magmatic eruption of Katla and a phreatomagmatic eruption ofGrimsvötn (both in Iceland) clear differences of the particle shapesand surfaces – especially at small scales – were also found (Maria andCarey, 2002).
⁎ Corresponding author.E-mail address: [email protected] (J. Rausch).
1
Published in
which should be cited to refer to this work.
http
://do
c.re
ro.c
h

The Eifel Volcanic Field (EVF) (Germany) is the type of locality formaar volcanism. Maar volcanoes have been classically interpreted asthe result of explosive water–magma interaction (i.e. phreatomagmaticeruptions) (e.g. Steininger, 1820; Fisher and Waters, 1970; Nakamuraand Krämer, 1970; Waters and Fisher, 1971; Crowe and Fisher, 1973;Lorenz, 1973; Schmincke et al., 1973; Schmincke, 1977). However,while most deposits of East Eifel maars seem to have all the characteris-tics of typical phreatomagmatic products, most of them are lacking inthe West Eifel maar deposits. In addition, features incompatible with aphreatomagmatic origin but typical for magmatic eruptions (e.g. agglu-tinated particles) are very common in theWest Eifel (Schmincke, 2007;Rausch, 2014). In the present work we want to test if the differencesbetween East and West Eifel maar deposits are also present in themorphology of juvenile particles.
The morphology analysis of the maar juvenile particles from bothvolcanic fields was made using the fractal method. Fractal dimensionshave been introduced by Mandelbrot (1967). This method measuresthe self-similarity of a shape at different scales. True fractal objects arecharacterized by a single fractal dimension valid for all scales. Non- orpseudo fractal objects can nevertheless also be analyzed by the fractalmethod. Such objects are characterized by several fractal dimensions,each of which is valid for a specific scale range. Fractal analysis hassince then been applied on a wide range of complex objects, includingsmall unspecified particles (Kaye, 1978), biological cells (Baumannet al., 1994), aerosols (Kindratenko et al., 1994) and marine snow(Kilps et al., 1994). Fractal dimensions have also been used in manyfields of geosciences such as remote sensing (Sun et al., 2006), geomor-phology (Dodds and Rothman, 2000) and geophysics (Lovejoy andSchertzer, 2007). A number of applications of the fractal method to vol-canic deposits (e.g. Kueppers et al., 2006; Perugini et al., 2007, 2011;Pepe et al., 2008) and particles (e.g. Orford and Whalley, 1983; Careyet al., 2000; Maria and Carey, 2002, 2007; Dellino and Liotino, 2002;Mattsson, 2010) have proven the great potential of this method whenstudying volcanic processes.
Volcanic particles are characterized by pseudofractal geometries.Different self-similarities are observed for small and large scales,which are described by two fractal dimensions (D1 and D2). D1, calledthe textural fractal dimension by Maria and Carey (2002, 2007),describes the self-similarity at small scales, whereas D2 is the morpho-logical fractal dimension, which describes the self-similarity at largescales. The latter authors demonstrated that the two fractal dimensionswere characteristic for the eruption type which produced the particles.They were able to discriminate between particles emitted from recentphreatomagmatic (Grimsvötn, Iceland) and magmatic (Katla, Iceland)eruptions. In the present work we compared the values obtained byMaria and Carey with the fractal dimensions obtained from the Eifelmaar particles.
2. Geological setting
The Eifel Volcanic Field (EVF) is located in western central Germany~40 km south of Bonn. It is subdivided into three fields: the West, Eastand Hoch Eifel Volcanic Fields (WEVF, EEVF and HEVF) (Mertes andSchmincke, 1985; Schmincke, 2007) (Fig. 1, inset map). The EVF devel-oped on the Rhenish shield, a large Paleozoic block that has beenuplifted during the past 40 Ma and that is in part still rising (e.g. Fuchset al., 1983). The Eifel volcanism started in the Hocheifel during theEocene about 50 Ma ago, while the volcanic activity in the West Eifelstarted at ~700–600 ka and in the East Eifel at ~460 ka (Schmincke,2007). The most recent activity occurred at Ulmener Maar (WestEifel) 11,000 a BP (Zolitschka et al., 1995; Sirocko et al., 2013). TheWEVF (~600 km2) is limited by the Booser maars to the northeast, thetowns of Bad Bertrich to the south, and Ormont to the northwest. TheWEVF consists of ~240 volcanic centers (6 maar lakes, 70 “dry” maarcraters and 160 scoria cones) (Büchel and Mertes, 1982; Büchel,1994). The EEVF (~400 km2) is bordered by the Rhine River to the
east, the Moselle River to the southeast, and the towns of Mayen tothe south and Kempenich to the west. It comprises about 100 volcaniccenters (~80 scoria cones, a fewwell-preservedmaars and several larg-er phonolitic volcanic complexes such as Kempenich, Rieden,Wehr andLaacher See) (Schmincke, 2007) (Fig. 1). Bothfields areNW–SE orientedcoinciding with the preferential orientation of dikes and faults, whichserved as pathways for rising magmas (Mertes and Schmincke, 1985;Schmincke, 2007).
The 4–6 km thick West Eifel basement consists of folded LowerDevonian non-porous, clastic, sedimentary rocks (sandstone, siltstone,graywacke and slate) (Meyer, 2013), deposited during the stages Siegen(Pragian) and Ems (Meyer and Stets, 1979). The Lower Devonian rocksare overlain in the central part of the field byMiddle to Upper Devonianlimestones and in the western part of the WEVF by lower TriassicBuntsandstein sandstones (Meyer and Stets, 1979; Büchel, 1994). Inthe East Eifel, the Lower Devonian rocks are overlain by up to 25 mthick, impermeable Tertiary clay deposits with local intercalations ofunconsolidated, highly permeable sand and gravel (Meyer, 2013).
3. Studied deposits
Juvenile particles from three maar deposits in the WEVF and fromone maar phase in the EEVF were studied. The general stratigraphy,sedimentology and volcanology of each singlemaar deposit are summa-rized in Appendix A.
3.1. West Eifel
3.1.1. Meerfelder Maar (MFM)The age ofMeerfelderMaar, the largestmaar in theWest Eifel Volca-
nic Field, is still a matter of debate and ranges from ~45,000 a BP (14Cdating, Schaber and Sirocko, 2005; Schmincke, 2009, 2014) to80,400 ± 8340 (feldspar infrared stimulated luminescence, Zölleret al., 2009).
The up to 23 m thick MFM deposit is well exposed in theLeyendecker pit, ~400 m southeast of the town Deudesfeld and 400 mwest of the MFM crater rim (Appendix A), representing a proximal tomedial facies of the deposit. The MFM deposit was subdivided intofive depositional units (I–V) (Appendix A). The particles analyzedwere selected from the MFM03 layer in Unit I, the MFM07 layer inUnit II, the MFM20 layer in Unit III, and the MFM40, MFM45 andMFM49 layers in Unit V. The selected layers differ by their transportand deposition mode. Particles from fallout, surge and debris jet layershave been analyzed. The description of the layers is shown in Table 1.
3.1.2. Pulvermaar (PM)The Pulvermaar eruption is estimated at 15,000–20,000 a BP (Büchel
and Lorenz, 1982; Büchel, 1993) based on the occurrence of ice wedgesat the base of the tephra ring deposit, which are interpreted to be fromthe last glacial period (Weichsel). The PM deposit, which crops out in apit ~300meast of the townof Gillenfeld, on the southwestern rim of thePulvermaar crater (Appendix A), represents a proximal facies of theeruption. Here, the deposit has a minimum thickness of 27 m, wherebyonly the uppermost 14 m are exposed. The PM deposit was subdividedinto five stratigraphic units (I–V) (Appendix A). The particles analyzedwere picked from the PM22 and PM25 layers in Unit I (Table 1).
3.1.3. Ulmener Maar (UM)The UlmenerMaar is the result of the youngest eruption in Germany
(11,000 a BP) according to calibrated 14C dating (Sirocko et al., 2013)and corrected varve chronology (Zolitschka et al., 1995). The up to7.5 m thick deposit was logged on the western rim of the UM crater,in a road cut along the Cochemer Strasse north of the church ofUlmen, 80 m south of highway A48 (Appendix A). This section repre-sents the proximal facies of the Ulmener Maar eruption, which wassubdivided into nine depositional units (I–IX) based on lithological,
2
http
://do
c.re
ro.c
h

grain size and sedimentological changes (Appendix A). The particles an-alyzed were selected from the UM01 and UM03 layers in Unit I(Table 1).
3.2. East Eifel
3.2.1. EppelsbergEppelsberg is a highly complex scoria cone volcano cropping out
~2 km east of Laacher See and ~2 km north of highway A61 (AppendixA). The outcrop consists of several eruptive phases highly variable innature, ranging from proximal to distal scoria cone deposits to well-bedded maar phases separated occasionally by paleosols and reworkedloess deposits. The complex deposit succession is topped by Laacher SeeTephra (12,900 a BP, van den Bogaard, 1995) and is estimated to havebeen erupted 150,000–250,000 a BP. In this study, we focused on oneof the well-bedded, fine-grained maar phases, referred to as theEppelsberg Green Unit (EBGU), which was stratigraphically subdividedinto four units (I–IV) (Appendix A). The juvenile particles analyzedwere extracted from the EBGU03 and EBGU04 layers from Unit II(Table 1).
4. Methodology
4.1. Light microscopy
One hundred and fifty thin sections of lapilli to coarse ash-sizedparticles from the four studiedmaar depositswere analyzed by lightmi-croscopy. The descriptive morphology (i.e. angular, round, subround),the different constituents (i.e. phenocrysts, xenolith and lithoclast inclu-sions, groundmass and vesicles) and the internal texture (agglutination,composite lapilli) of the juvenile particles were determined (Table 1).
4.2. Scanning electron microscopy (SEM)
Juvenile particles of the 125–250 μm sieve fraction were separatedfrom the deposits of all four studied maars, mounted in epoxy resin,and polished down as thin sections. This sieve fractionwasused becauseit enabled a direct comparison with the fractal analyses performed byMaria and Carey (2002) on either type of particle end-members(magmatic and phreatomagmatic).
The thin sections were analyzed with an automated SEM- and ener-gy dispersive spectroscopy (EDS)-based single particle analysis routine.The analyses were performed using the FEI XL30 Sirion field-emission(FE) SEM of the University of Fribourg (Switzerland), operated at anacceleration voltage of 25 kV. Contours of individual particles were ex-tracted from electron backscattered (BSE) images for subsequent fractalanalysis. The images (1280 × 960 pixels) were taken with a magnifica-tion of 200×.
4.3. SEM micro-CT
High-resolution 3D reconstructions of 17 juvenile particles of thesame sieve fraction (125–250 μm) were obtained by scanning electronmicroscopy X-ray micro-computed tomography (SEMmicro-CT) at theUniversity of Lausanne (Switzerland) using a CamScan MV2300 SEMequipped with a Bruker SEM micro-CT attachment. This techniqueenables visualization and morphometric quantification with micron tosub-micron resolution of small-scale 3D features, such as vesicles. Thereconstructed volume can be sectioned along all orientations and posi-tions within a single particle. Contours of such cross-sections were ana-lyzed by fractal analysis. All images obtained from the SEM micro-CTanalyses had a pixel dimension of 512 × 512. A detailed description of
Fig. 1. Map of the Eifel Volcanic Field (Germany), showing the West and East Eifel Volcanic Fields (WEVF and EEVF) and the best exposed maar volcanoes. MFM: Meerfelder Maar, DM:Dauner Maars, PM: Pulvermaar, OM: Oberwinkler Maar, WB/SM: Wartgesberg/Sprinker Maar, UM: Ulmener Maar, BM: Booser Maars, HB: Herchenberg, LK: Leilenkopf, and EB:Eppelsberg. Chemical rock compositions for the volcanoes (see legend) are from Mertes and Schmincke (1985) and Schmincke (2007). Inset map: Cenozoic volcanic fields located onthe uplifted Rhenish shield and close-by areas. The Eifel Volcanic Fields, i.e. the QuaternaryWEVF and EEVF as well as the Eocene Hocheifel Volcanic Field (HEVF) are located in westernGermany, south of Bonn. Dashed lines are for national borders.Modified from Büchel and Mertes (1982) and Schmincke (2007).
3
http
://do
c.re
ro.c
h

Table 1Description of juvenile lapilli to coarse ash-sized particles from the West Eifel maar volcanoes Meeerfelder Maar (MFM), Pulvermaar (PM) and Ulmener Maar (UM), and from the East Eifel maar phase Eppelsberg Green Unit (EBGU).
Locality Sample Description of layer Composition Description of juvenile lapilli
Morphology Texture Groundmass Vesicularity Vesicleshape
Phenocrysts Xenolithinclusions
Lithoclastinclusions
Other features
West EifelMeerfelderMaar50°06′03.00″ N06°44′20.46″ E
MFM03 Well-sorted, lapilli-sized,black scoria lapilli fallout
Melilite-bearingolivinenephelinite
Highly irregular Smooth Mainlysideromelane
Moderate tohigh (40–70%)
Round,connected
Cpx, ol No Sandstone,slate (b5%)
Composite lapilli type 1a
MFM07 Crudely bedded, coarsegrained, lithic-rich (debrisjet)
Subround Highlyrugose
Tachylitic Relatively low(10–20%)
Irregular Cpx, ol Peridotite Sandstone,slate (15–20%)
Composite lapilli type 2b
MFM20 Lithic-rich, coarsestgrained layer (blocks b1 mø) (debris jet)
Subround Highlyrugose
Tachylitic Relatively low(10–20%)
Irregular Cpx, ol Peridotite Sandstone,slate (15–20%)
Composite lapilli type 2b
MFM40 Moderately sorted,lapilli-sized fallout.Relatively juvenile rich
Subround Highlyrugose
Tachylitic Low tomoderate(10-40%)
Subround Cpx, ol Peridotite Sandstone,slate (15–20%)
Composite lapilli type 2b
MFM45 Grayish, moderately towell-sorted, juvenile-richfallout
Subround Highlyrugose
Tachylitic Low tomoderate(10–30%)
Subround toirregular
Cpx, ol Peridotite Sandstone,slate (15–30%)
Composite lapilli type 2b
MFM49 Grayish, juvenile-rich, finelapilli-sized, well-sortedfallout
Irregular Slightlyrugose
Mainlysideromelane
Moderate tohigh (40–70%)
Round,connected
Cpx, ol Peridotite Sandstone,slate (b5%)
Pulvermaar50°07′49.96″ N06°55′05.72″ E
PM22 Coarse ash to lapilli-sized,moderately-sorted (debrisjet)
Melilitenephelinite
Subround Highlyrugose
Tachylitic Relatively low(10–20%)
Subround toirregular
Cpx,ol ± amp
Cumulatec,granite ±peridotite
Sandstone,slate (10–15%)
Composite lapilli type 2b
PM25 Fine-grained (ash-sized),cross-bedded deposit(surge)
Subround Highlyrugose
Tachylitic Relatively low(10–20%)
Subround toirregular
Cpx,ol ± amp
Cumulatec,granite
Sandstone,slate (10–15%)
Composite lapilli type 2b
Ulmener Maar50°12′39.65″ N06°58′48.62″ E
UM01 Lapilli-sized,moderately-sorted,lithic-rich (debris jet)
Melilitenephelinite
Round/subround Rugose Tachylitic Relatively low(10–20%)
Subround toirregular
Cpx, ol, ne,mel
No Sandstone,slate (5–25%)
Composite lapilli type 2b,fine-grained coating
UM03 Lapilli/ash-sized,well-sorted, slightly morejuvenile-rich (fallout)
Round/subround Rugose Tachylitic Relatively low(10–20%)
Subround toIrregular
Cpx, ol, ne,mel
No Sandstone,slate (5–25%)
Composite lapilli type 2b,fine-grained coating
East EifelEppelsberg50°24′09.13″ N07°19′11.52″ E
EBGU03 Brownish, ash-sized, finelybedded deposit (wetfallout)
Basanite Angular Smooth Sideromelane Very low(0–15%)
Round Cpx ± ol,amp, bt
No No Accretionary/armored lapilli,fine-grained coating
EBGU04 Greenish, ash-sized, finelybedded deposit (wetfallout)
Angular Smooth Sideromelane Very low(0–15%)
Round Cpx ± ol,amp, bt
No No Accretionary/armored lapilli,fine-grained coating
a Lapilli composed of dark tachylitic, dense to moderate vesiculated particles embedded in a glassy (sideromelane), high to moderate vesiculated groundmass.b Lapilli consisting of dark, dense, tachylitic patches or droplets and slightly lighter tachylitic higher vesiculated (up to 40%) areas.c Cumulates consisting of clinopyroxene (Cpx), amphibole (amp) and biotite (bt).
4
http
://do
c.re
ro.c
h

the SEM micro-CT technique and its applicability to volcanic ash ispresented in Vonlanthen et al. (2014).
4.4. Fractal analyses
The mathematician Benoît Mandelbrot (1967) coined the termfractal for objects (or mathematic functions) for which the shape ofthe contours was scale-independent, i.e. had similar shape independentof the scale at which the object/function was observed. He discoveredthat many natural contours such as coast lines, leave rims and river net-works are fractal in nature. The strength of fractal analysis developed byMandelbrot is its ability to describe in simple manner complex objects,which were very difficult or impossible to handle by Euclidean geome-try. The fractal nature of a contour can be tested bymeasuring its lengthwith ever-decreasing yard stick lengths s (=scale). The length L of afractal line (fractal surface, volume) measured at a scale s is given by(k: constant):
L ¼ ks−D:
The exponent D for a true fractal object, called the fractal dimensionor Hausdorff dimension, is constant and independent of s. Graphicallythe fractal dimension can be extracted from the slope of Richardsonplots log (L) vs. log(s).
Many objects and time series in nature (e.g. human heart beat,natural luminosity or meteorology time series) are pseudo- ormultifractal, i.e. they cannot be described by a single Hausdorff dimen-sion, but by several exponents, each valid only for a limited scalerange, or by a continuous spectrumof changing exponents, called singu-larity spectrum. Fractal analysis of object contours is mostly done ondigital images of the objects of interest. Such images are limited in res-olution by the pixel size and the magnification at which the images
were taken. Pixel based images of contours are strictly speaking nevertruly fractal in nature, because the scale of observation cannot bereduced infinitely but is limited by the pixel size. Nevertheless themethod is applied to pixelate lines, stopping at the scale of the pixelsize. Volcanic particles turned out to be multifractal and can bedescribed by two fractal dimensions (D1 and D2).
The advantage of fractal analysis is that it gives morphological in-formation of contours for different scales. Many classic shape de-scriptors (e.g. excentricity) only give information on the large-scalecharacteristics of a contour, whereas others such as circularity, convex-ity, rectangularity or solidity are more sensitive to small scale features.In both cases, however, no information can be retrieved for a specificscale of interest. Individual contour curvature plots, area functionsor triangle area representations are shape descriptors correspondingto only one specific scale. To ensure a multiscale description, a set ofdescriptor curves, or a combination of different types of descriptorsare necessary.
The fractal spectra belong to descriptors which contain multiscaleinformation on a contour within one single curve (function), which isa clear advantage over the previously mentioned descriptors. Similarmultiscale descriptors are the curvature scale space or the chord lengthand angle distributions.
For the fractal analyses, BSE and SEM micro-CT grayscale images ofindividual particle sectionswere converted to binary images, and subse-quently the particle outline, one pixel in width, was extracted (Fig. 2,steps 1–4) using the image processing software ImageJ (http://imagej.nih.gov/ij/). The images obtained through SEM micro-CT weresmoothed to eliminate artifacts such as the spurious spikes present atsome corners of the cross sections. Smoothing reduces the resolutionof the contour. Therefore, a relatively low Gaussian smoothing value(S = 2 in the Bruker's NRecon software, see Vonlanthen et al., 2014for details) was applied. This value turned out to have little effect on
Fig. 2. Processing steps for the fractal analysis by the dilation method (steps 1–6) and by the fractal spectrum technique (steps 1–7).
5
http
://do
c.re
ro.c
h
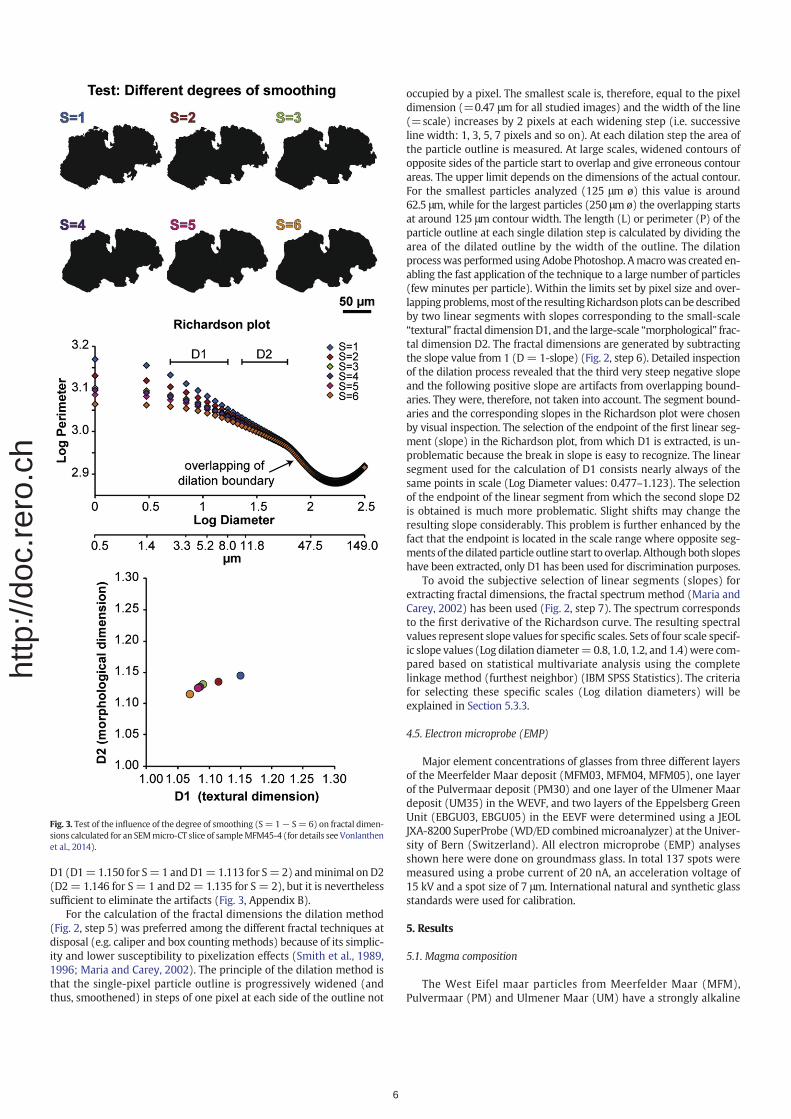
D1 (D1=1.150 for S=1 and D1=1.113 for S=2) andminimal on D2(D2= 1.146 for S = 1 and D2= 1.135 for S = 2), but it is neverthelesssufficient to eliminate the artifacts (Fig. 3, Appendix B).
For the calculation of the fractal dimensions the dilation method(Fig. 2, step 5) was preferred among the different fractal techniques atdisposal (e.g. caliper and box countingmethods) because of its simplic-ity and lower susceptibility to pixelization effects (Smith et al., 1989,1996; Maria and Carey, 2002). The principle of the dilation method isthat the single-pixel particle outline is progressively widened (andthus, smoothened) in steps of one pixel at each side of the outline not
occupied by a pixel. The smallest scale is, therefore, equal to the pixeldimension (=0.47 μm for all studied images) and the width of the line(=scale) increases by 2 pixels at each widening step (i.e. successiveline width: 1, 3, 5, 7 pixels and so on). At each dilation step the area ofthe particle outline is measured. At large scales, widened contours ofopposite sides of the particle start to overlap and give erroneous contourareas. The upper limit depends on the dimensions of the actual contour.For the smallest particles analyzed (125 μm ø) this value is around62.5 μm, while for the largest particles (250 μmø) the overlapping startsat around 125 μm contour width. The length (L) or perimeter (P) of theparticle outline at each single dilation step is calculated by dividing thearea of the dilated outline by the width of the outline. The dilationprocesswas performed using Adobe Photoshop. Amacrowas created en-abling the fast application of the technique to a large number of particles(few minutes per particle). Within the limits set by pixel size and over-lapping problems,most of the resultingRichardsonplots canbedescribedby two linear segments with slopes corresponding to the small-scale“textural” fractal dimension D1, and the large-scale “morphological” frac-tal dimension D2. The fractal dimensions are generated by subtractingthe slope value from 1 (D= 1-slope) (Fig. 2, step 6). Detailed inspectionof the dilation process revealed that the third very steep negative slopeand the following positive slope are artifacts from overlapping bound-aries. They were, therefore, not taken into account. The segment bound-aries and the corresponding slopes in the Richardson plot were chosenby visual inspection. The selection of the endpoint of the first linear seg-ment (slope) in the Richardson plot, from which D1 is extracted, is un-problematic because the break in slope is easy to recognize. The linearsegment used for the calculation of D1 consists nearly always of thesame points in scale (Log Diameter values: 0.477–1.123). The selectionof the endpoint of the linear segment from which the second slope D2is obtained is much more problematic. Slight shifts may change theresulting slope considerably. This problem is further enhanced by thefact that the endpoint is located in the scale range where opposite seg-ments of the dilated particle outline start to overlap. Althoughboth slopeshave been extracted, only D1 has been used for discrimination purposes.
To avoid the subjective selection of linear segments (slopes) forextracting fractal dimensions, the fractal spectrum method (Maria andCarey, 2002) has been used (Fig. 2, step 7). The spectrum correspondsto the first derivative of the Richardson curve. The resulting spectralvalues represent slope values for specific scales. Sets of four scale specif-ic slope values (Log dilation diameter=0.8, 1.0, 1.2, and 1.4)were com-pared based on statistical multivariate analysis using the completelinkage method (furthest neighbor) (IBM SPSS Statistics). The criteriafor selecting these specific scales (Log dilation diameters) will beexplained in Section 5.3.3.
4.5. Electron microprobe (EMP)
Major element concentrations of glasses from three different layersof the Meerfelder Maar deposit (MFM03, MFM04, MFM05), one layerof the Pulvermaar deposit (PM30) and one layer of the Ulmener Maardeposit (UM35) in the WEVF, and two layers of the Eppelsberg GreenUnit (EBGU03, EBGU05) in the EEVF were determined using a JEOLJXA-8200 SuperProbe (WD/ED combinedmicroanalyzer) at the Univer-sity of Bern (Switzerland). All electron microprobe (EMP) analysesshown here were done on groundmass glass. In total 137 spots weremeasured using a probe current of 20 nA, an acceleration voltage of15 kV and a spot size of 7 μm. International natural and synthetic glassstandards were used for calibration.
5. Results
5.1. Magma composition
The West Eifel maar particles from Meerfelder Maar (MFM),Pulvermaar (PM) and Ulmener Maar (UM) have a strongly alkaline
Fig. 3. Test of the influence of the degree of smoothing (S = 1− S= 6) on fractal dimen-sions calculated for an SEMmicro-CT slice of sampleMFM45-4 (for details see Vonlanthenet al., 2014).
6
http
://do
c.re
ro.c
h

and highly silica-undersaturated (i.e. melilite–nephelinitic) compo-sition (Mertes and Schmincke, 1985; Schmincke, 2007). The juve-nile clasts from the East Eifel maar phase “Eppelsberg Green Unit”(EBGU) are slightly more evolved and less silica-undersaturated(i.e. basanitic) (Appendix D, Fig. 4A). All three West Eifel maar vol-canoes are Na-rich (Na2O/K2O N 1.1), while the East Eifel maarphase Eppelsberg is K-rich (Na2O/K2O b 1.1) (Fig. 4B). Thus, thestudied Eifel maar deposits build two compositionally distinctgroups: (1) West Eifel Na-rich melilite–nephelinites and (2) EastEifel K-rich basanites.
5.2. Qualitative description of juvenile lapilli to coarse ash
Juvenile lapilli and coarse ash from the best-exposed West Eifelmaar deposits (e.g. Pulvermaar, Meerfelder, Ulmener, Oberwinkler,Gemündener, Weinfelder maars) are characterized by subround to ir-regular morphologies, highly rugose textures, low to moderate vesicu-larities (5–40%) and a tachylitic groundmass (Figs. 5A, B, C, Table 1).Vesicle shapes range from subround to irregular. Dense, angular, glassy(sideromelane) shards, typical for phreatomagmatic eruptions, are ab-sent, while agglutinated particles resembling composite lapilli (sensuFisher and Schmincke, 1984, and Bednarz and Schmincke, 1990) andcored lapilli typical of diatremes (i.e. autoliths, Lorenz, 1975; Dawson,1980; Mitchell, 1986) are ubiquitous. Agglutinated juvenile particlesconsist of dark, dense, tachylitic droplets or patches within a lighter
(grayish/brownish), higher vesiculated, tachylitic groundmass separat-ed by a diffuse boundary (Fig. 5A, B). Cored lapilli consist of a crystalfragment (ol or cpx phenocryst/xenocryst) surrounded by a slightlyvesiculated, tachylitic rind (Fig. 5C). The studied West Eifel particlescontain mainly olivine and clinopyroxene phenocrysts ± small nephe-line and melilite crystals in the groundmass. They contain variableamounts of lithoclast and mafic to ultramafic xenolith fragments (upto 30 vol.%). Thus, their density is highly variable.
In contrast, juvenile lapilli and coarse ash particles from the East Eifelmaar phase (EBGU) are angular, poorly vesiculated (0–15%) and glassy(sideromelane) shards characterized by smooth textures (Fig. 5D,Table 1). Juvenile clasts and lithoclasts erupted fromEBGU are common-ly coated by a brownish, sticky, fine-grained (clayey) rim (Fig. 5E, F).Fine-grained layers are rich in accretionary and armored lapilli (Fig. 5E).
Qualitative analysis of the juvenile particles based on light and scan-ning electron microscopy show clear differences in morphology,microtexture, vesicularity and internal organization between the Westand East Eifel juvenile particles. Thus, it would certainly be advanta-geous if the qualitative discrimination could be completed by the quan-tification of some of these features (e.g. morphology andmicrotexture).
5.3. Quantitative morphological and textural studies: fractal analysis
5.3.1. Testing the fractal technique in 3D (SEM micro-CT)The SEM micro-CT reconstructions of juvenile particles enabled the
fractal technique to be tested in 3D. Fractal analyses were performedon different cross-sections of the same particle (MFM45-4), in orderto test the effect of cross section orientation and position on the fractaldimensions. The three perpendicular cross sections (X, Y and Z inFig. 6A) intersecting approximately in the center of gravity of the parti-cle show relatively small variations in both the textural dimension(D1 = 1.11−1.07), and the morphological dimension (D2 = 1.13–1.08). In addition, the test performed on 14 parallel cross sectionsspaced by ~15 μm (Fig. 6B, Appendix B) shows that D2 varies signifi-cantly (1.21–1.05) with the position of the cross section within the par-ticle, whereas D1 shows a smaller variation within the same crosssections (1.13–1.04). Most of the “outlier” fractal values, however,correspond to cross sections with small surface area, i.e. for which thecutting plane is located at a distance equal to 80% or more of the dis-tance between the center and the edge of the particle. Those sectionsare thus not appropriate for fractal analysis and should be avoided.Doing so the spread of both the D1 and D2 values is much smaller(D1 = 1.09–1.04, D2 = 1.10–1.05). Consequently, only particle crosssections with a diameter N150 μm were used for subsequent fractalanalyses in thin sections.
5.3.2. Richardson plots (dilation method)Fractal dimensions D1 and D2 from particles from the six layers of
theMeerfelderMaar deposit, and from the two layers of the Pulvermaar,Ulmener Maar and Eppelsberg Green Unit deposits, were extractedfrom the corresponding Richardson plots. Ten particles per layer wereanalyzed resulting in a total of 120 analyzed particles. Our results arecompared with the fractal dimensions of particles erupted from Katlavolcano (Iceland), which have been formed by magmatic processeswithout contribution of external water, and with fractal dimensions ofparticles erupted from Grimsvötn volcano, which have been formedby fragmentation processes, in which external water played a crucialrole (Maria and Carey, 2002).
A larger number of layers of the Meerfelder Maar (MFM) depositwere analyzed in order to examine the variability of the fractal dimen-sions between layers presumably formed through similar types of pro-cesses. Even though the 60 MFM particles show a relatively largevariation in both fractal dimensions (D1 and D2), they clearly clusteroutside the field defined by the phreatomagmatic particles ofGrimsvötn, and they match the field defined by the magmatic particlesof Katla (Fig. 7A). Based on the consistency of the Meerfelder Maar
Fig. 4. EMP glass analyses for Eifel maar volcanoes. A) SiO2+Al2O3 vs. Na2O+K2O+CaOdiagram showing the nephelinitic composition of the studied West Eifel maar volcanoes(Meerfelder Maar, Pulvermaar and Ulmener Maar) contrasting with the basanitic compo-sition of the East Eifel maar phase Eppelsberg Green Unit; B) SiO2 vs. Na2O/K2O diagramshowing that the melilite nephelinites from the West Eifel are rich in Na (Na2O/K2O N
1.1), while the basanitic Eppelsberg maar deposit is rich in K (Na2O/K2O b 1.1).
7
http
://do
c.re
ro.c
h

Fig. 5. Compilation of photomicrographs showing the characteristic features of juvenile particles from the studied West Eifel maars (A–C) and from the “Green Unit”, a maar phase ofEppelsberg volcano, East Eifel (D–F). A) Typical subround to irregular shaped, tachylitic West Eifel juvenile particle, consisting of several agglutinated particles (i.e. composite lapillus).Dark, low vesicular (0–10%) droplets or patches (red arrows) are agglutinated with a lighter, highly vesiculated (up to 50%) groundmass (yellow arrow). B) Another example of acomposite lapillus. Red arrows show darker, low vesicular droplets within the lighter and slightly more vesiculated round particle. C) Common cored lapillus consisting of a crystalcore (olivine) surrounded by a tachylitic rim. D) Typical angular, low to non-vesicular (0–10%), sideromelane shard from Eppelsberg (East Eifel). E) Accretionary/armored lapilli (yellowarrows) abundant in the EppelsbergGreen Unit deposit. Note sideromelane shards coated by a fine-grained rim (red arrows). F) Close-up of an angular, non-vesicular, sideromelane shardcoated by a sticky, fine-grained (clayey) rim.
8
http
://do
c.re
ro.c
h

fractal values with the one of the fields defined by the Icelandic parti-cles, we decided to extend our study to other maar volcanoes in theEifel Volcanic Field but limit the number of layers per volcano to two.
The particles from the otherWEVF deposits i.e. from Pulvermaar andUlmener Maar have similar spreads for both fractal dimension as theMeerfelder Maar particles (D1 = 1.025–1.103; D2 = 1.035–1.135).The juvenile particles from the East Eifel maar deposit (EppelsbergGreen Unit) are characterized by similar morphological dimensions(D2 = 1.018–1.096), but definitely smaller textural (D1 = 1.004–1.027) fractal dimensions (Fig. 7B, Appendix C). The textural fractal di-mensions of the particles from the Eppelsberg Green Unit maar phasecoincidewith the textural dimensions of the phreatomagmatic particlesfrom Grimsvötn (Maria and Carey, 2002). The morphological fractal di-mensions of the Eifel particles show a smaller spread than the valuesgiven for Katla and Grimsvötn particles. Recalculations of fractal valuesfor Icelandic particles have shown, however, that many of the morpho-logical fractal dimensions seem to be overestimated. The cause is thechoice of the second linear segment in the Richardson plots. It seemsthat Maria and Carey (2002) selected in many cases the third verysteep slope as D2. Careful follow-up of the dilation process revealedthat thefinal steepening in the part of the Richardson plotwith negativeslope is a consequence of first overlaps of opposite segments of the con-tours (see Richardson plot in Fig. 2 and 3).
However, regardless of which D2 (slope 2) is chosen, it has no con-sequence on the interpretation of the Richardson plots because thevalues for the particles formed by either of the two processes largelyoverlap and the morphological fractal dimension does not to allow dis-criminating between both formation processes. The comparison of thetextural dimensions (D1 values), however, gives a clear cut separation
between East and West Eifel maar particles with a limiting value ofapproximately 1.025–1.027. It is remarkable that a similar limitingvalue (D1=~1.029)was found between Katla and Grimsvötn particles.
The weakness of the analysis of the Richardson plot is the visualchoice of the section from which the slope is determined. The samedatawere, therefore, also analyzed using the fractal spectrum technique(Maria and Carey, 2002).
5.3.3. Fractal spectrum technique and multivariate statistical analysisThe fractal spectrum technique is most appropriate for the compari-
son of multifractal contours provided that the selected set of spectralvalues are chosen at the same scales for all particles (Appendix C). Insteadof taking the slopes of linear segments in the Richardson plots, slopes(=spectral value) at given scale values (first derivatives of theRichardsoncurve) are compared. Sets of 4 spectral values at given scaleswere chosenfor each particle. Because only small-scale (textural) fractal dimensionsare useful to discriminate particles formed by different processes (asshown by the fractal dimensions obtained from the Richardson plots),the set was restricted to scales within D1 in the Richardson plot. Tofacilitate comparison with the data from Katla and Grimsvötn particles,the same small-scale values as Maria and Carey (2002) were chosen (atLog dilation diameter = 0.8, 1.0, 1.2, and 1.4 pixels, Fig. 2).
Cluster analyses of the spectral value sets based on the completelinkage method (furthest neighbor) were performed and the resultswere visualized in a hierarchical tree (dendrogram). The squaredEuclidean distance is used as a measure of dissimilarity between theparticles (Fig. 8). In the dendrogram, the Grimsvötn phreatomagmaticparticles and the Katla magmatic particles cluster in two differentgroups separated by the second largest squared Euclidean distance.
Fig. 6. Consistency tests of the fractal technique using several cross sections obtained from the 3D SEM micro-CT reconstruction of the particle MFM45-4 (see Vonlanthen et al., 2014).A) Influence of the cross section orientation on the calculated fractal dimensions; B) Influence of the location of parallel cross sections on the calculated fractal dimensions.
9
http
://do
c.re
ro.c
h

The West Eifel maar particles (yellow labels) are clustered with theKatla magmatic particles (red labels), while the particles from the EastEifel maar phase (Eppelsberg Green Unit, EBGU) (bright blue labels)are grouped with the phreatomagmatic particles from Grimsvötn(dark blue labels). Among a total of 120 particles only six “mismatches”occur, one East Eifel particle is located within the Katla–West Eifelgroup, and three West Eifel and two Katla particles are located withinthe Grimsvötn–East Eifel group.
Two particles fromKatla (119–120) cluster in a separate group char-acterized by the largest dissimilarity (i.e. squared Euclidean distance)compared to the rest of the particles. The cause for this classification isthe very irregular particle shapes, which are due to the higher contentof vesicles. Even though the Katla–West Eifel groupwas statistically fur-ther classified in subgroups, we opted not to use further subdivisions forour interpretations due to the relatively small dissimilarity betweenthose groups.
The cluster analysis thus strengthens the result obtained from theRichardson plots and confirms the successful discrimination betweenWEVF and EEVF maar particles.
6. Discussion
6.1. What do classical microscopy and fractal analysis tell us about the Eifelmaar eruptions?
The main cause of acceleration and fragmentation of magmas arestresses exerted on the magma by rapidly expanding gases, eitherexsolved from themagma or formed through the volatilization of exter-nal fluids. Acceleration of magma–gas–bubble mixtures results in highstrain rateswhich lead to fragmentation due to fluid instabilities or brit-tle fracture. Unloading elastic wave propagation downward into themagma, layer-by-layer vesicle bursting and rapid gas-filtration floware fragmentation mechanisms occurring after sudden decompressionof magma (Alibidirov and Dingwell, 1996). The metallurgical fuel cool-ant interaction (FCI) model has been used as analog for explaining frag-mentation occurring during magma–external water interactions.Destabilization of vapor films and thermal stresses are responsible forFCI fragmentation (Morrissey et al., 2000). All fragmentation processescan occur in parallel. The large variety in fragment shape and surface
Fig. 7.D1 (textural dimension) vs. D2 (morphological dimension) diagram showing the results of the fractal analyses performedon the thin sections for A)MeerfelderMaar, B)MeerfelderMaar, Pulvermaar, Ulmener Maar and Eppelsberg Green Unit. The fractal values of two Icelandic volcanoes (Katla and Grimsvötn) obtained by Maria and Carey (2002) are shown forcomparison.
10
http
://do
c.re
ro.c
h

11
http
://do
c.re
ro.c
h

morphology is thus not surprising, when considering the number offragmentation mechanisms and the range of properties the magmacan have before fragmentation.
Despite the large number of parameters playing a role in juvenileparticle fragmentation, the prevailing view is that the amount andsize of vesicles present in the magma before fragmentation havethe major control on juvenile particle morphology. Fracture surfaceswill preferentially follow the shortest path between two neighboringvesicles. The fracture surface will, therefore, be a composite of intraand inter vesicle surfaces. The more numerous and/or larger the ves-icles are prior to magma fragmentation, the higher the likelihoodthat the particle surface morphology is composed of the inner wallsof broken vesicles. Particles resulting from the fragmentation ofmagmas with large vesicles will be complex at large scale, but rathersmooth at small scales. Fracture surfaces of magmas with numeroussmall vesicles will be complex at small scale and simpler at largescales. Particles from magmas with a large distribution of vesiclesizes at the start of fragmentation will have complex surfaces at allscales. The latter situation is typical for “magmatic” particles i.e.which are the result of fragmentation induced by exsolving andexpanding gases originally dissolved in the magma.
The only way magmas with small number of vesicles may fracture isby external addition of water. The fracture surfaces of such particleswill be dominated by the intra vesicle surfaces i.e. by the fracture mech-anism. Several fracturing processes are effective during magma–coolantinteraction. Fracturing due to fluid instabilities and the collapse of vaporfilms result in fine ash particles (b63 μm) with highly irregular, “moss-like” surfaces. Quenching of the melt due to high heat transfer acrossthe aforementioned irregular surfaces induces thermal stress waves.Fragmentation due to thermal shock produces blocky particles withstraight surfaces (i.e. smooth surfaces at small scales) (e.g. Heiken,1974; Schmincke, 1977; Wohletz, 1983; Fisher and Schmincke, 1984;Heiken and Wohletz, 1985; Zimanowski et al., 1991; Dellino and LaVolpe, 1996; Büttner et al., 2002), which are larger (mainly 250–63 μm)than the particles formed by vapor film collapse (Wohletz, 1983).
Similar to what we found in our study, small scale features such assurface roughness of particles formed during the 1982–1983Galunggungeruption (Indonesia) were smaller during “wet” phases (Ersoy et al.,2007). The particles emitted during the “phreatomagmatic” eruption ofGrimsvötn had very low small scale fractal dimensions, as well. The fineash fraction (3 to 5 phi) from a rhyolitic tuff ring volcano, TepexitlMexico, and particles produced by FCI experiments with the samemate-rial were characterized by blocky particles and smooth surfaces (Austin-Erickson et al., 2008). Even when the addition of external fluids occurredafter major exsolution of magmatic gases and vesicle formation, typicalfor Askja volcano (Iceland), the juvenile fine ash fraction shows primarilythe blocky morphology and the smooth topography at small scale(Graettinger et al., 2013).
The Eifel Volcanic Field is regarded as the type locality formaar erup-tions, which are traditionally thought to be triggered by the addition ofexternal water.
It is, therefore, not surprising, that the fractal analyses of juvenileparticles from the maar phase in the East Eifel (Eppelsberg GreenUnit)match themorphological observationsmade in the previous stud-ies of particles resulting from magma–external fluid interactions. Thevery small textural fractal dimensions (D1= 1–1.023) and the relative-ly small morphological dimensions (D2 b 1.1) are in agreement withfractal values observed for classical phreatomagmatic particles (e.g.Grimsvötn, Iceland, Maria and Carey, 2002). In addition, the commonaccretionary lapilli and fine-grained (clayey) coating stuck around theparticles clearly indicate the presence of water/steam in the transport/depositional system. Thus, deposit and particle characteristics clearly
suggest that the Eppelsberg Green Unit was the result of a primarilyphreatomagmatic eruption.
The picture is, however, very different for the juvenile particles fromthemaar volcanoes located in theWest Eifel Volcanic Field. The quanti-tative shape analyses performed in this study of WEVF particles rein-force previous qualitative microscopic observations (Schmincke, 2007;Rausch, 2014), confirming that juvenile particles from classical WestEifel maars (e.g. Meerfelder Maar, Ulmener Maar and Pulvermaar)lack the diagnostic features of phreatomagmatic particles in the sizerange 63–250 μm. Though West Eifel maar particles (fractionsN 125 μm) share characteristics with the “moss-like” clasts describedbyWohletz (1983) and the “round to subround, rugged particles”men-tioned by Zimanowski et al. (1991) as typical for FCI particles resultingfromwater film collapse, the lack of blocky clasts with smooth surfaces,described to be dominant in themedium to coarse grained ash fractions(N63 μm) of natural and experimentally produced phreatomagmaticparticles, suggest that the fragmentation processes during West Eifelmaar eruptions were different than for classical phreatomagmaticeruptions (e.g. Taal Volcano, Philippines; Ubehebe, California, etc.).Their large textural fractal dimensions (D1 N 1.023), coincide with frac-tal dimensions typical for magmatic particles (e.g. Katla, Iceland, Mariaand Carey, 2002). The fractal analyses and the qualitative observations,thus suggest that the formation ofWEVFmaar particles was dominatedby magmatic fragmentation processes.
Moreover, theWest Eifel maar highly rugose particles consist nearlyalways of dark tachylitic glass, suggesting lower cooling rates, whereasthe round to subround, rugged particles produced during water–magma interaction experiments (Zimanowski et al., 1991) using amelt with a similar composition than the West Eifel magmas (i.e.olivine-melilititic) consist of “light or even non-colored glass” suggest-ing very rapid cooling.
6.2. Influence of transport mechanisms
The difference in particlemorphology could also be caused by differ-ent transport modes and distances (e.g. Maria and Carey, 2007). Thestudied West Eifel maar deposits include layers interpreted to havebeen transported and deposited as fallout, surge and debris jets (Appen-dix A). Surge and debris jet transport is accompanied by particle colli-sions, which tend to smoothen the surface of the particles. The EastEifel Eppelsberg GreenUnit is thought to have been transported and de-posited as alternating wet and dry fallouts as evidenced by the goodsorting, constant thickness and normal grading of single layers and var-iable content of accretionary and armored lapilli. Assuming all studieddeposits to be the result of phreatomagmatic eruptions with similarstarting particle shapes (in the range of the studied particles), oneshould expect a smoothening of the particles transported throughsurge and debris jets relative to fallout particles. Thus, the shape of theWest Eifel particles transported by surge and debris jets shouldhave been more affected by collisional smoothing than theEppelsberg particles. The West Eifel particles, however, are charac-terized by the largest small-scale irregularities. Thus, we excludetransport and deposition mechanisms to be the main reason for thedifferences in particle shape between the studied West and EastEifel particles.
6.3. Recycling of juvenile particles
Juvenile particle recycling is a common process in scoria cone andmaar eruptions. Particles ejected by relatively low energetic explosionscan either fall directly back into the vent, or they can be temporarily de-posited on the inner crater walls and subsequently fall back into the
Fig. 8.Hierarchical tree showing the clusters built after statistical analysis using the complete linkagemethod (farthest neighbor) (IBM SPSS Statistics). To the right the binary images of thecorresponding particles are shown. Eighty particles are from the EVF, while 40 particles were studied by Maria and Carey (2002) and are used here as endmembers.
12
http
://do
c.re
ro.c
h

vent during collapse of the steep, unstable inner crater walls. These par-ticles are re-ejected during the next explosions of the same eruption(Houghton and Smith, 1993). In this way, the shape of the particlescan be modified by repeated reworking, partial melting and coating ofthe particle by new magma. Such processes may transform primaryphreatomagmatic particles to secondary “pseudo” magmatic particles.The extreme scenario would be that all particles in the West Eifelmaar deposits would have been affected by recycling. Light micros-copy and BSE images, however, do not show evidence of recycledparticles (e.g. dense, angular, glassy shard embedded within atachylitic, higher vesiculated groundmass). Even though recyclingof a fraction of the juvenile particles erupted in Eifel maars cannotbe ruled out and is most likely an important process, the strikingconsistency in the differences (e.g. morphology, microtexture, typeof glass, vesicularity and internal organization) between the studiedWest and East Eifel maar particles, is not in favor of a dominantrecycling process.
6.4. What are the differences between the East and West Eifel VolcanicField?
Phreatomagmatic eruptions require thepresence of a shallowor sur-face water source. The bed rock lithology in the East Eifel Volcanic Field(EEVF) has the requisites for the occurrence of a confined aquifer(=highly permeable, unconsolidated sand and gravel deposits) under-lain by impermeable, consolidated Devonian rocks and sealed by anaquitard (=low permeable clay layer) (Fig. 9A), representing a mixedhard-soft environmental setting (Lorenz, 2003; Ross et al., 2011). Thehighly fractured crust below the EEVF facilitates the rapid ascent ofmagma to the shallow groundwater level. Thus, the EEVF has a classicalgeological and hydrological setting for effective and explosive interac-tion of rising magma with groundwater.
On the other hand, the geological setting in theWEVF does not favorthe development of an extensive aquifer, neither confined nor uncon-fined. The bedrock underlying the WEVF consists mainly of imperme-able Lower Devonian rocks (Fig. 9B) (i.e. hard-rock setting, Lorenz,2003). The only permeable sediments, thus the only potential level fora primary aquifer in theWest Eifel, are the Lower Triassic Buntsandstein
deposits (R. Poppe, 2013, personal communication). These sedimentsare only preserved in local depressions in the southwestern and north-western part of the field, but are absent below the studied maar volca-noes (i.e. Meerfelder Maar, Pulvermaar, Oberwinkler Maar, UlmenerMaar). This is evidenced by the lack of corresponding lithoclasts withinthemaar deposits (Appendix A). A fractured bedrock aquifer is also un-likely because there is no evidence for large hydraulic conductivity be-tween the fractures cutting the crust underlying the WEVF. This isshown in the striking different elevations of the water table (up to80 m, Fig. 10) of the neighboring Dauner maars (i.e. Gemündener,Weinfelder and Schalkenmehrener maars).
The remaining alternative external water source for hypotheticalphreatomagmatic eruptions in the West Eifel is surface water (e.g.streams, rain or snow). Lorenz (1973) proposed the interaction ofmagmawith streamwater to be responsible for theWest Eifel maar vol-canism.We think, however, that streams represent a very limitedwatersupply, making a dominant phreatomagmatic model for the formationof West Eifel maar volcanoes questionable.
A further difference between theWEVF and EEVF is the magma com-position. West Eifel magmas are mainly foiditic (red triangles/circles inFig. 1), while a significant portion of East Eifel magmas are basanitic(blue triangles/circles in Fig. 1). The melilite–nephelinitic magmas ofthe studied West Eifel maar volcanoes are inferred to be CO2-rich basedon experimental studies on the genesis of such silica-undersaturatedmagmas (Brey, 1976; Brey and Green, 1976), the strong CO2-degassingin the EVF (e.g. Giggenbach et al., 1991; Aeschbach-Hertig et al., 1996),as at Ulmener Maar and the close association of these magmas withcarbonatites.
Furthermore, it has been shown that CO2 solubility increases withincreasing pressure and decreasing silica-content (Mysen et al., 1975;Wyllie, 1979). Brooker et al. (2001) have demonstrated that up to 15–18 wt.% CO2 can be dissolved in melilititic melts at mantle conditions.Thus, we suggest that fastmagma risemay have led to strong exsolutionof large amounts of CO2 and the sudden increase in pressure withinthe vesicles may have triggered magmatic fragmentation prior to theshallow interaction with variable amounts of ground or surface water.Magmatic fragmentation at depth is supported by the occurrence ofmantle to lower crust xenoliths coated by agglutinated particles in
Fig. 9. A) Schematic cross section of the East Eifel, showing the configuration of the basement. Highly fractured and folded, impermeable Devonian rocks are overlain by a low permeableTertiary clay layer locally containing sandstone and gravel lenses. Based on the lack ofmantle or lower/middle crustal xenolithswithin the tephra deposits (Schmincke, 2007), themagmareservoir is interpreted to be at the base of the upper crust. B) Schematic cross section of theWest Eifel (example Meerfelder Maar). The upper crust consists of strongly folded, fracturedLower Devonian rocks overlain in local morphological depressions by Buntsandstein sediments. The depth of the magma reservoir beneath Meerfelder Maar is estimated based on peri-dotite (upper mantle) xenoliths found within the deposit. In the case of Pulvermaar and Ulmener Maar the magma reservoir is interpreted to be slightly shallower (lower/middle crust)based on the granitic lower/middle crust xenoliths found within the ejected tephra.
13
http
://do
c.re
ro.c
h

many WEVF volcanoes (Schmincke, 2007; Rausch, 2014). The slightlyless silica-undersaturated basanitic magmas, as the EEVF Eppelsbergmagma have most likely a lower CO2 solubility, which may be thereason for a slower ascent and stagnation in shallower levels. Thiscombined with the presence of a confined aquifer in the East Eifel areclear evidence that the triggering of the eruption of the EppelsbergGreen Unit was the contact of magma with groundwater at shallowdepths.
The fact that East Eifel melilite–nephelinite volcanoes Herchenbergand Leilenkopf (Bednarz and Schmincke, 1990) share practically thesame geological setting with Eppelsberg, but also lack conventionalcriteria for phreatomagmatic fragmentation processes, indicates thatthe magma composition, and hence the CO2 content, can have a largeinfluence or probably even dictate theprevailingmodeof fragmentationand style of eruption.
7. Concluding remarks
In this work, fractal analysis and the fractal spectrum method havebeen applied for the first time to analyze particle shapes from maardeposits in order to determine likely fragmentation processes and erup-tion styles. As benchmark the discrimination criteria obtained fromparticles sampled from two historic eruptions in Iceland, for which frag-mentation processes were known, have been used. The fractal analysisconfirmed microscopic observations, in that the studied WEVF maareruptions were not dominated by phreatomagmatic processes andwere largely influenced by magmatic fragmentation at depth, whereasEEVFmaar phases fulfill all the characteristics of classical maar deposits,interpreted to be phreatomagmatic in origin. The eruption mechanismsderived from microscopic observations and the quantitative particleshape analyses are compatible with both the geological setting ofthe studied volcanoes and the chemical composition of the eruptionproducts.
Supplementary data to this article can be found online at http://dx.doi.org/10.1016/j.jvolgeores.2014.11.008.
Acknowledgments
The present study was financially supported by the Swiss NationalScience Foundation (Marie-Heim Vögtlin Program) and the Universityof Fribourg (Switzerland). The authors thank S. Dettmar for the prepara-tion of excellent polished thin sections of particle mounts. Specialthanks go to C. Neururer (University of Fribourg) for technical supportduring SEM-based automated particle imaging and analysis. We arealso grateful to M. Robyr (University of Bern) for assistance duringEMP measurements. We thank Ulrich Kueppers and an anonymousreviewer for their valuable comments that helped to improve themanuscript.
References
Aeschbach-Hertig, W., Kipfer, R., Hofer, M., Wieler, R., Signer, P., 1996. Quantification ofgas fluxes from the subcontinental mantle: the example of Laacher See, a maar lakein Germany. Geochim. Cosmochim. Acta 60 (1), 31–41.
Alibidirov, M., Dingwell, D.B., 1996. Magma fragmentation by rapid decompression. Nature380, 146–148.
Austin-Erickson, A., Buttner, R., Dellino, P., Ort, M.H., Zimanowski, B., 2008. Phreatomagmaticexplosions of rhyolitic magma: experimental and field evidence. J. Geophys. Res. SolidEarth 113 (B11). http://dx.doi.org/10.1029/2008JB005731.
Baumann, G., Barth, A., Nonnenmacher, T.F., 1994. Measuring fractal dimensions of cellcontours: practical approaches and their limitations. Fractals in Biology andMedicine.Birkhäuser, Basel, pp. 182–189.
Bednarz, U., Schmincke, H.U., 1990. Evolution of the Quaternary melitite–nepheliniteHerchenberg volcano (East Eifel). Bull. Volcanol. 52 (6), 426–444.
Brey, G., 1976. CO2 solubility and solubility mechanisms in silicatemelts at high pressures.Contrib. Mineral. Petrol. 57 (2), 215–221.
Brey, G.P., Green, D.H., 1976. Solubility of CO2 in olivine melilitite at high pressures androle of CO2 in the earth's upper mantle. Contrib. Mineral. Petrol. 55 (2), 217–230.
Brooker, R.A., Kohn, S.C., Holloway, J.R., McMillan, P.F., 2001. Structural controls on thesolubility of CO2 in silicate melts: part I: bulk solubility data. Chem. Geol. 174 (1),225–239.
Büchel, G., 1994. Vulkanologische Karte der West- und Hocheifel 1:50,000, Koblenz.(Hrsg.) Landesvermessungsamt, Rheinland-Pfalz.
Büchel, G., Lorenz, V., 1982. Zum Alter des Maarvulkanismus der Westeifel. Neues Jahrb.Geol. Palaontol. Abh. 163, 1–22.
Büchel, G., 1993. Maars of the Westeifel (Germany). In: Negendank, J.F.W., Zolitschka, B.(Eds.), Palaeolimnology of European Maar Lakes. Lecture Notes in Earth Sciences49. Springer, Berlin-Heidelberg, pp. 1–13.
Büchel, G., Mertes, H., 1982. Die Eruptionszentren des Westeifeler Vulkanfeldes. Z. Dtsch.Geol. Ges. 133, 409–429.
Büttner, R., Dellino, P., Zimanowski, B., 1999. Identifying magma–water interaction fromthe surface features of ash particles. Nature 401 (6754), 688–690.
Büttner, R., Dellino, P., La Volpe, L., Lorenz, V., Zimanowski, B., 2002. Thermohydraulicexplosions in phreatomagmatic eruptions as evidenced by the comparison betweenpyroclasts and products from Molten Fuel Coolant Interaction experiments. J.Geophys. Res. Solid Earth 107 (B11), 1978–2012 (ECV-5).
Carey, S., Maria, A., Sigurdsson, H., 2000. Use of fractal analysis for discrimination ofparticles from primary and reworked jökulhlaup deposits in SE Iceland. J. Volcanol.Geotherm. Res. 104 (1), 65–80.
Cioni, R., D'Oriano, C., Bertagnini, A., 2008. Fingerprinting ash deposits of small scale erup-tions by their physical and textural features. J. Volcanol. Geotherm. Res. 177 (1),277–287.
Crowe, B.M., Fisher, R.V., 1973. Sedimentary structures in base–surge deposits withspecial reference to cross-bedding, Ubehebe Craters, Death Valley, California. Geol.Soc. Am. Bull. 84 (2), 663–682.
Dawson, J.B., 1980. Kimberlites and Their Xenoliths. Springer, Berlin Heidelberg, pp. 1–252.Dellino, P., La Volpe, L., 1995. Fragmentation versus transportation mechanisms in the
pyroclastic sequence of Monte Pilato–Rocche Rosse (Lipari, Italy). J. Volcanol.Geotherm. Res. 64 (3), 211–231.
Dellino, P., La Volpe, L., 1996. Image processing analysis in reconstructing fragmentationand transportation mechanisms of pyroclastic deposits. The case of Monte Pilato–Rocche Rosse eruptions, Lipari (Aeolian islands, Italy). J. Volcanol. Geotherm. Res.71 (1), 13–29.
Dodds, P.S., Rothman, D.H., 2000. Scaling, universality, and geomorphology. Annu. Rev.Earth Planet. Sci. 28, 571–610.
Eiríksson, J., Sigurgeirsson, M., Hoelstad, T., 1994. Image analysis and morphometry ofhydromagmatic and magmatic tephra grains, Reykjanes volcanic system, Iceland.Jökull 44, 41–65.
Ersoy, O., Gourgaud, A., Aydar, E., Chinga, G., Thouret, J.-C., 2007. Quantitative scanning-electron microscope analysis of volcanic ash surfaces: application to the 1982–1983Galunggung eruption (Indonesia). Geol. Soc. Am. Bull. 119, 743–752.
Fig. 10. Digital Elevation Model (DEM) of the Dauner maars obtained from ©GeoBasis-DE/LVermGeoRP2011-05-17. GM: Gemündener Maar, WM: Weinfelder Maar and SMM:Schalkenmehrener Maars. Profile A–B across the GM, WM and SMM craters shows the striking difference in water table elevation (up to 80 m). The location of the tephra pit wheredeposits of Gemündener Maar (GM) andWeinfelder Maar (WM) are cropping out is indicated by an orange star.
14
http
://do
c.re
ro.c
h

Fisher, R.V., Schmincke, H.U., 1984. Pyroclastic Rocks. Springer, Berlin, p. 472.Fisher, R.V.,Waters, A.C., 1970. Base surge bed forms inmaar volcanoes. Am. J. Sci. 268 (2),
157–180.Fuchs, K., von Gehlen, K., Mälzer, H., 1983. Plateau Uplift: The Rhenish Shield, A Case
History (411 pp., Berlin).Giggenbach, W.F., Sano, Y., Schmincke, H.U., 1991. CO2-rich gases from Lakes Nyos and
Monoun, Cameroon; Laacher See, Germany; Dieng, Indonesia, and Mt. Gambier,Australia—variations on a common theme. J. Volcanol. Geotherm. Res. 45 (3),311–323.
Graettinger, A.H., Skilling, I., McGarvie, D., Hoskuldsson, A., 2013. Subaqueous basalticmagmatic explosions trigger phreatomagmatism: a case study from Askja, Iceland.J. Volcanol. Geotherm. Res. 264, 17–35.
Heiken, G., 1972. Morphology and petrography of volcanic ashes. Geol. Soc. Am. Bull. 83(7), 1961–1988.
Heiken, G., 1974. An atlas of volcanic ash. UMI 101.Heiken, G., Wohletz, K., 1985. Volcanic Ash. University Presses of California, Chicago,
Harvard & MIT.Honnorez, J., Kirst, P., 1975. Submarine basaltic volcanism: morphometric parameters for
discriminating hyaloclastites from hyalotuffs. Bull. Volcanol. 39, 441–465.Houghton, B.F., Smith, R.T., 1993. Recycling of magmatic clasts during explosive
eruptions: estimating the true juvenile content of phreatomagmatic volcanicdeposits. Bull. Volcanol. 55 (6), 414–420.
Kaye, B.H., 1978. Specification of the ruggedness and/or texture of a fine particle profile byits fractal dimension. Powder Technol. 21 (1), 1–16.
Kilps, J.R., Logan, B.E., Alldredge, A.L., 1994. Fractal dimensions of marine snow deter-mined from image analysis of in situ photographs. Deep-Sea Res. I Oceanogr. Res.Pap. 41 (8), 1159–1169.
Kindratenko, V.V., Van Espen, P.J., Treiger, B.A., Van Grieken, R.E., 1994. Fractal dimensionalclassification of aerosol particles by computer-controlled scanning electronmicroscopy.Environ. Sci. Technol. 28 (12), 2197–2202.
Kueppers, U., Perugini, D., Dingwell, D.B., 2006. “Explosive energy” during volcanic erup-tions from fractal analysis of pyroclasts. Earth Planet. Sci. Lett. 248 (3), 800–807.
Lorenz, V., 1973. On the formation of maars. Bull. Volcanol. 37 (2), 183–204.Lorenz, V., 1975. Formation of phreatomagmatic maar-diatreme volcanoes and its rele-
vance to kimberlite diatremes. Phys. Chem. Earth 9, 17–27.Lorenz, V., 2003. Maar-diatreme volcanoes, their formation, and their setting in hard-rock
or soft-rock environments. Geologija 15, 72–83.Lovejoy, S., Schertzer, D., 2007. Scaling andmultifractal fields in the solid earth and topog-
raphy. Nonlinear Process. Geophys. 14 (4), 465–502.Mandelbrot, B.B., 1967. How long is the coast of Britain? Statistical self-similarity and frac-
tional dimension. Science 156 (3775), 636–638.Maria, A., Carey, S., 2002. Using fractal analysis to quantitatively characterize the shapes
of volcanic particles. 107 (B11), 1978–2012 (ECV-7).Maria, A., Carey, S., 2007. Quantitative discrimination ofmagma fragmentation and pyroclas-
tic transport processes using the fractal spectrum technique. J. Volcanol. Geotherm. Res.161 (3), 234–246.
Mattsson, H.B., 2010. Textural variation in juvenile pyroclasts from an emergent,Surtseyan-type, volcanic eruption: the Capelas tuff cone, São Miguel (Azores).J. Volcanol. Geotherm. Res. 189 (1), 81–91.
Mertes, H., Schmincke, H.U., 1985. Mafic potassic lavas of the Quaternary West Eifelvolcanic field. Contrib. Mineral. Petrol. 89 (4), 330–345.
Meyer, W., 2013. Geologie der Eifel. Schweizerbart, Stuttgart (614 pp.).Meyer, W., Stets, J., 1979. Die Manderscheider Vulkangruppe (Westeifel) in Beziehung zu
den Strukturen des Sockels. Z. Dtsch. Geol. Ges. 130, 273–288.Mitchell, R.H., 1986. Kimberlite magmatism and textural genetic classifications of kimber-
lite. Kimberlites. Springer, US, pp. 29–71.Mysen, B.O., Arculus, R.J., Eggler, D.H., 1975. Solubility of carbon dioxide inmelts of andesite,
tholeiite, and olivine nephelinite composition to 30 kbar pressure. Contrib. Mineral.Petrol. 53 (4), 227–239.
Nakamura, K., Krämer, F., 1970. Basaltic ashflowdeposits fromamaar inWest-Eifel. NeuesJahrbuch für Geologie und Paläontologie. Monatshefte, Germany, pp. 491–501.
Orford, J.D., Whalley, W.B., 1983. The use of the fractal dimension to quantify the mor-phology of irregular‐shaped particles. Sedimentology 30 (5), 655–668.
Pepe, S., Solaro, G., Ricciardi, G.P., Tizzani, P., 2008. On the fractal dimension of the falloutdeposits: a case study of the 79 AD Plinian eruption at Mt. Vesuvius. J. Volcanol.Geotherm. Res. 177 (1), 288–299.
Perugini, D., Valentini, L., Poli, G., 2007. Insights into magma chamber processes from theanalysis of size distribution of enclaves in lava flows: a case study from VulcanoIsland (Southern Italy). J. Volcanol. Geotherm. Res. 166 (3), 193–203.
Perugini, D., Speziali, A., Caricchi, L., Kueppers, U., 2011. Application of fractal fragmenta-tion theory to natural pyroclastic deposits: insights into volcanic explosivity of theValentano scoria cone (Italy). J. Volcanol. Geotherm. Res. 202 (3), 200–210.
Rausch, J., 2014. Eifel maars: external water vs. magmatic volatiles (Eifel Volcanic Field,Germany). (PhD Thesis) University of Fribourg, Switzerland.
Ross, P.S., Delpit, S., Haller, M.J., Németh, K., Corbella, H., 2011. Influence of the substrateon maar–diatreme volcanoes—an example of a mixed setting from the Pali Aikevolcanic field, Argentina. J. Volcanol. Geotherm. Res. 201 (1), 253–271.
Schaber, K., Sirocko, F., 2005. Lithologie und Stratigraphie der spätpleistozänenTrockenmaare der Eifel. Mainz. Geowiss. Mitt. 33, 295–340.
Schmincke, H.U., 1977. Phreatomagmatische Phasen in quartären Vulkanen der Osteifel.Geol. Jahrb. 39, 3–45.
Schmincke, H.U., 2007. The Quaternary volcanic fields of the East and West Eifel(Germany). In: Ritter, J.R., Christensen, U.R. (Eds.), Mantle Plumes 24. Springer, BerlinHeidelberg (241-322 pp.).
Schmincke, H.U., 2009. Vulkane der Eifel: Aufbau, Entstehung und heutige Bedeutung.Spectrum, Heidelberg (160 pp.).
Schmincke, H.U., Fisher, R.V., Waters, A.C., 1973. Antidune and chute and pool structuresin the base surge deposits of the Laacher See area, Germany. Sedimentology 20 (4),553–574.
Sirocko, F., Dietrich, S., Veres, D., Grootes, P.M., Schaber-Mohr, K., Seelos, K., Nadeau, M.J.,Kromer, B., Rothacker, L., Röhner, M., Krbetschek, M., Appleby, P., Hambach, U., Rolf,C., Sudo, M., Grim, S., 2013. Multi-proxy dating of Holocene maar lakes and Pleisto-cene dry maar sediments in the Eifel, Germany. Quat. Sci. Rev. 62, 56–76.
Smith Jr., T.G., Marks, W.B., Lange, G.D., Sheriff Jr., W.H., Neale, E.A., 1989. A fractal analysisof cell images. J. Neurosci. Methods 27 (2), 173–180.
Smith Jr., T.G., Lange, G.D., Marks, W.B., 1996. Fractal methods and results in cellular mor-phology—dimensions, lacunarity and multifractals. J. Neurosci. Methods 69 (2),123–136.
Steininger, J., 1820. Die erloschenenVulkane in der Eifel und amNiederrheine: Ein Bericht andie Gesellschaft nützlicher Forschungen zu Trier. Florian Kupferberg, Mainz, pp. 1–180.
Sun, W., Xu, G., Gong, P., Liang, S., 2006. Fractal analysis of remotely sensed images: areview of methods and applications. Int. J. Remote Sens. 27 (22), 4963–4990.
van den Bogaard, P., 1995. 40Ar/39Ar ages of sanidine phenocrysts from Laacher SeeTephra (12,900 yr BP): chronostratigraphic and petrological significance. EarthPlanet. Sci. Lett. 133 (1), 163–174.
Vonlanthen, P., Rausch, J., Ketcham, R.A., Putlitz, B., Baumgartner, L.P., Grobety, B., 2014.High-resolution 3D analyses of the shape and internal constituents of small volcanicash particles: the contribution of SEMmicro-computed tomography (SEMmicro-CT).J. Volcanol. Geotherm. Res. http://dx.doi.org/10.1016/j.jvolgeores.2014.11.016.
Waters, A.C., Fisher, R.V., 1971. Base surges and their deposits: Capelinhos and Taal volca-noes. J. Geophys. Res. 76 (23), 5596–5614.
Wohletz, K.H., 1983. Mechanisms of hydrovolcanic pyroclast formation: grain-size, scan-ning electron microscopy, and experimental studies. J. Volcanol. Geotherm. Res. 17(1), 31–63.
Wyllie, P.J., 1979. Magmas and volatile components. Am. Mineral. 64 (5–6), 469–500.Zimanowski, B., Fröhlich, G., Lorenz, V., 1991. Quantitative experiments on phreatomagmatic
explosions. J. Volcanol. Geotherm. Res. 48 (3), 341–358.Zimanowski, B., Büttner, R., Lorenz, V., 1997. Premixing of magma and water in MFCI
experiments. Bull. Volcanol. 58 (6), 491–495.Zolitschka, B., Negendank, J.F.W., Lottermoser, B.G., 1995. Sedimentological proof and dat-
ing of the early Holocene volcanic eruption of Ulmener Maar (Vulkaneifel, Germany).Int. J. Earth Sci. 84 (1), 213–219.
Zöller, L., Blanchard, H., McCammon, C., 2009. Can temperature assisted hydrostatic pres-sure reset the ambient TL of rocks? A note on the TL of partially heated country rockfrom volcanic eruptions. Ancient TL 27 (1), 15–23.
15
http
://do
c.re
ro.c
h