eighteen month review final - education council...
TRANSCRIPT
Eighteen Month Review of the National Partnership Agreement on Early Childhood Education
Report by Allen Consulting Group
And
Statements by the Commonwealth and each State and Territory on the Allen Consulting Group Report
October 2011

Eighteen Month Review of the National Partnership Agreement on Early Childhood Education: Report by the Allen Consulting Group Incorporating Statements by the Commonwealth and each State and Territory
2
BackgroundThe National Partnership Agreement on Early Childhood Education provides that the
agreement be reviewed after the first 18 months. The National Partnership specifies at
Clause 41 that:
− the agreement will be reviewed after the first 18 months;
− the review will have regard to progress made by the Parties against the agreement
and the underpinning bilateral agreements; and
− the review will specifically address:
a) the adequacy of funding to achieve specified outcomes and outputs;
b) the appropriateness of timelines;
c) achievement of agreed outcomes, outputs and performance indicators;
d) satisfactory compliance by governments with all financial and reporting requirements
of the National Partnership; and
e) annual bilateral discussions to review progress against bilateral agreements, and
outcomes and outputs as set out in the National Partnership.
In accordance with MCEECDYA, a consultant (Allen Consulting Group - ACG) was engaged
to report against the terms of the review, constituting Phase 1 of the review.
In October 2011, Council members endorsed publication of the Allen Consulting Group
report on the 18 month review with an accompanying jurisdictional statement on ACG’s
data, methodology and conclusions.
Jurisdictions’ statements on the ACG report on the NP ECE 18 month review address
the data, methodology, findings and conclusions of the ACG report:
• The appropriateness of the data and methodology applied by ACG to support one
or more of the findings or conclusions;
• Whether the jurisdiction agrees or disagrees with one or more of the findings or conclusions;
• Whether one or more of the findings or conclusions is/are beyond the scope of the
18 month review (the key issues for the review being adequacy of funding, appropriateness
of timelines, and achievement of outcomes, outputs and performance indicators).
CommonwealthThe Australian Government agrees with the Allen Consulting Group that:
• the funding supporting the implementation of the National Partnership on Early
Childhood Education in all states and territories is adequate for achieving the objectives
of the Agreement; and
• all jurisdictions have made significant progress in their implementation efforts, and it is
important — and appropriate — to sustain the considerable momentum that has built up
in each jurisdiction’s early childhood education sector since the Agreement was signed.
The Australian Government also notes that comments by the Allen Consulting Group
on funding for the maintenance of universal access after 30 June 2013 are outside
the terms of the review.

Eighteen Month Review of the National Partnership Agreement on Early Childhood Education: Report by the Allen Consulting Group Incorporating Statements by the Commonwealth and each State and Territory
3
New South WalesThe NSW Government recognises the report as a useful input into the review of the
National Partnership.
In relation to the question of the adequacy of funding, the report acknowledges a number
of limitations in the modelling and analysis. A major limitation of the report is that it does not
seek to quantify the implications of the National Partnership’s requirement that “cost does
not present a barrier to access” for families. Another limitation is that, in the view of NSW,
the report underestimates implementation costs, such as costs of reaching “hard to reach”
families and capital costs, and recurrent operating costs which can be expected to increase
significantly by 2013.
As a result, New South Wales does not consider the report’s finding about the adequacy
of funding to be conclusive.
In relation to sustainability of funding, the report shows that the Agreement’s 2012-13
funding level would be insufficient to cover the additional recurrent cost of maintaining the
universal access objective in future years. This funding gap would be expected to widen
were the issue of costs for families considered properly by the report.
VictoriaThe Allen Consulting Group report reflects much of what Victoria understands as the
requirements for implementation and sustained delivery of the NP ECE. However,
Victoria’s concerns arise from the inconsistency between the report’s “findings” (pp 16-27)
and the report’s “conclusions” (pp 28-39), in that the methodology to support the report’s
“conclusions” (adequacy of funding and timelines) is not clear.
ACG estimates the 2012-13 Victorian funding requirement to be an additional
$141.1 million in service funding (pp 31, 91). However, funding of $109.5 million only
is available in 2012-13 for both service delivery and implementation. Given the shortfall
of at least $31 million in that year alone, it is unclear why ACG concludes that there is
‘adequate funding’ (pp vi, 34-36).
ACG also highlights Victoria’s substantial workforce (pp 15, 21, 87, 93) and infrastructure
requirements (pp 33, 92) and also the risk of 37 per cent of three year old kindergarten
programs ceasing (p 17). Given that developing additional infrastructure capacity and
ensuring an appropriately qualified workforce takes time, it is unclear how ACG conclude
that these substantial challenges can be overcome by 2013.
Further, Victoria believes that the methodology used to calculate both the 2012-13 and
ongoing funding underestimates the required funding because the contribution of local
government to education and care services in Victoria (p 5) is excluded. In addition, known
cost drivers which increase the cost of delivery of NP ECE objectives are not included
(e.g. the NQA revises the staff to child ratio requirement from 1:15 to 1:11 for Victorian
kindergarten programs from 2016 and hence 2012-13 funding is insufficient to sustain
programs in future years).

Eighteen Month Review of the National Partnership Agreement on Early Childhood Education: Report by the Allen Consulting Group Incorporating Statements by the Commonwealth and each State and Territory
4
Finally, the ACG report does set out clear “findings” that highlight the need for
re-consideration of how to effectively and sustainably achieve the NP ECE. However,
as core elements of the methodology are unclear, Victoria cannot agree with the report’s
“conclusions” regarding the adequacy of funding and appropriateness of timelines.
QueenslandWhile the methodology used by the Allen Consulting Group has a sound
theoretical basis, the application of the model is compromised by the lack of quality,
comparable data from across jurisdictions with which to populate it.
Despite the caveats around the data, the ACG conclude that the overall allocation of
funding provided under the National Partnership Agreement on Early Childhood Education
is adequate to achieve the objectives of the NP. However, the basis for this conclusion is
unclear, particularly given the ACG's findings reported in Tables 2.3 and 2.4, pages 30-31.
These tables show that the gap between NP funding and cost of achieving the objectives
vary considerably across jurisdictions and the distribution of NP funds does not appear
to align with the relative cost impacts on each jurisdiction.
Queensland supports the ACGʼs finding regarding insufficient national consistency of data
on NP performance indicators. Comparable reporting of jurisdictional performance is not
likely to occur until at least the end of the NP when jurisdictions report against the outcomes
of the NP ECE, rather than their negotiated Bilateral Agreements.
Importantly, Queensland is delivering on the full range of objectives of the NP ECE. These
objectives include participation of children in an early education program delivered by
a four year qualified early childhood teacher, for at least 15 hours per week, 40 weeks a year,
in the year prior to full-time schooling.
Queensland has exceeded its 2010 participation target under the NP and has done so
within the available funds. Queensland will continue to drive participation rates upwards and
monitor implementation costs. At the end of the NP, when comparable data and reporting
is available, the financial implications of sustaining the NP objectives will be clearer for all
jurisdictions and inform future practices.
Western Australia The Report on Government Services (RoGS) 2009 cautions against using its data to
compare jurisdictions. Despite this, ACG used RoGS’ data from Table 3A.6 to determine
preschool costs per child for each jurisdiction. Comments for Western Australia at Table
3A.6 note that State expenditure in 2008-9 on non-government sector preschool provision
is not included. In 2008-9, this amounted to $18 million.
Another issue with RoGS’ data for Western Australia is that a lot of preschool expenditure
is subsumed within school expenditure, so does not appear in preschool tables. Subsumed
elements include the preschool share of school utilities, insurance, operating grants,
administration, buildings, maintenance, gardens, office staff, libraries, professional learning,
teacher uplift and housing.

Eighteen Month Review of the National Partnership Agreement on Early Childhood Education: Report by the Allen Consulting Group Incorporating Statements by the Commonwealth and each State and Territory
5
Due to the inappropriate use of RoGS’ data, the per-capita per-hour cost of preschool
that ACG calculated for Western Australia (at table 2.3) is roughly half the mean cost for the
rest of Australia. This questionable per-capita per-hour cost at Table 2.3 renders the Western
Australian data in Table 2.4 equally questionable. The same applies to conclusions drawn
about Western Australia from Tables 2.3 and 2.4 (and repeated in Tables H.3 and H.4).
ACG do not adequately attribute Western Australia’s pre-existing universal access to
preschool to the large (and ongoing) investment the State has directed towards preschool
provision in public, Catholic and independent schools prior to this National Partnership.
Notwithstanding Western Australia’s concerns about RoGS to populate the cost models,
we note ACG’s observation that, “There appears to be a correlation between the provision
of a mixed market system and having a higher weekly average cost for ECE services …
family contributions in these states is higher than in states and territories where ECE is
provided largely within a school”. (p. 9)
South AustraliaThe methodology used to assess the “adequacy of funding to achieve the NP’s objectives”
for each jurisdiction assumes incorrectly that every State and Territory has similar
implementation strategies and starting points.
The costing has applied a top down approach without factoring in individual circumstances for
each jurisdiction. An example from a South Australian perspective is instructive. The modelling
assumes that the Department of Education & Children’s Services (DECS) in South Australia will
provide for the full cost of providing 15 hours to children not currently enrolled in a preschool
program. For these children, whether they are enrolled in a DECS or non government service,
DECS will provide a subsidy for the additional cost of providing a preschool program for
15 hours per week to these children, and will not provide for full cost recovery.
Other issues with the methodology are that the costs calculated in the model utilises
the “real expenditure on preschool services”. For DECS this incorporates indirect costs of
providing preschool, including central and regional office management and administration
costs. These indirect costs are fixed and would remain static regardless of the number of
children or services accessing preschool. Also incorporated into the “average cost per child
per hour of ECE” is the “average weekly out of pocket expense by families on ECE”.
SA would not view this cost as being part of the “additional recurrent cost of the NP ECE”.
For the finding: ‘...this review considers that the funding supporting the implementation of
the NP in all states and territories is adequate for achieving the objectives of the Agreement’
(ACG March 2011, p. vi). SA is reserved about this issue as it will depend on the level of
service provision to children in rural and remote locations where there are small numbers of
children. The provision of a preschool program for 15 hours per week delivered face to face
by an early childhood teacher will be cost prohibitive in these situations.

Eighteen Month Review of the National Partnership Agreement on Early Childhood Education: Report by the Allen Consulting Group Incorporating Statements by the Commonwealth and each State and Territory
6
Tasmania Tasmania has two concerns with the data and methodology used in calculating:
• The shortfall in hours. Footnote (a) in table 1.1 indicates the baseline relates to the
number of children enrolled in ECEC but for less than 15 hours but this figure is then
multiplied by the average hours of all enrolled children. This results in a higher number
of hours being assumed than is the actual case.
• The costs of provision in school settings (although some caveats have been noted).
Despite providing cost estimates on infrastructure and additional requirements at least twice,
these were not included in Table 2.5 (p. 33).
Tasmania agrees with the first finding in relation to infrastructure requirements (p. 16).
In order to obviate the need for additional infrastructure, and in order to achieve the
timelines, a range of different models of delivery are being trialed in 2012, but some of
these are more expensive in staffing (and will therefore more heavily impact on recurrent
costs into the future) than the usual model of delivery.
Tasmania does not agree with the conclusion (p. 28) that a shortfall of $2.4m (based on
actual funding of $10.4m) means that the funding in 2012/13 is adequate to resource the
additional recurrent cost of the NP ECE. (Table 2.4 p. 31)
Tasmania agrees with the findings in relation to:
• the impact of the NQA putting pressure on ECE workforce requirements and the need for
clarification on qualification requirements for ECE teachers (pp 22 and 25 respectively); and
• the insufficient national consistency on what counts as part of the program to enable
consistency in reporting (part of second finding on p. 20).
Tasmania also agrees that consideration should be given to interaction between the NP’s
goals and funding arrangements and those of existing child care support arrangements
(second finding p. 24)
Australian Capital TerritoryThe ACT has a number of comments regarding the 18 Month Review of the National
Partnership Agreement on Early Childhood Education report. Of greatest concern is the
methodology used to determine the cost of the initiative to the ACT.
The ACT disagrees with the report as it indicates that the ACT is receiving almost $2 million
more from the Commonwealth than the cost of implementing the NP. This is not the case.
The calculation of the additional recurrent cost of NP ECE is incorrect.
The funding does not cover infrastructure costs associated with the NP ECE or costs
associated with up-skilling teachers who do not have degree qualifications in early childhood
education. These costs are currently met by the ACT Government.
It is the position of the ACT that the funding is not sufficient to provide funding to any other
setting apart from ACT public school preschool units. Universal access is achieved because
ACT public school preschool units are accessible to all four year old children.

Eighteen Month Review of the National Partnership Agreement on Early Childhood Education: Report by the Allen Consulting Group Incorporating Statements by the Commonwealth and each State and Territory
7
The ACT disagrees with the calculations for:
• Current average hours per year
• Inflation calculation
• Total annual ACT Government Expenditure on ECE
• Average weekly out of pocket expenses by families
• Average cost per child
• Annual recurrent cost of ECE in Year Before Full Time Schooling (2007-08)
In addition, the ACT has experienced significant growth in the number of children accessing
ACT public school preschool units that was not expected when the NP ECE was developed.
This increase has also had significant impact on the funds required to implement the initiative
across the ACT.
Northern Territory The NT has serious concerns about a range of data used in the ACG report. There have
been several instances where the NT position has been misrepresented. The areas of
concern include:
1. Understated NT preschool provision baseline figures
2. An unverified cost for preschool provision to parents
3. Understated hours of preschool provision
The report concludes that it is likely that the challenges of delivering universal access across
the Northern Territory is likely to prevent it from fully realising the objectives of the agreement
during the term of the Agreement. Whilst the NT has some challenges including providing
infrastructure support to small cohorts, most communities already have a preschool service.
The greatest challenge is employing sufficient early childhood trained teachers. The National
Partnership Agreement acknowledged that this would be a challenge for all jurisdictions
when it states, “reasonable transitional arrangements—including potentially beyond 2013—
are needed to implement the commitment to preschool program delivery by four year
university qualified early childhood teachers.”
Whilst the review considers that the funding provided in any given year under the Agreement
would be insufficient to sustain the level of service provision required to meet the objectives
of the NP ECE beyond 2012–13 in the Northern Territory, the NT costing is not yet complete
and cannot verify if funding will be adequate for achieving the objectives of the NP and
sustaining the level of service provision.

Eighteen Month Review of the National Partnership Agreement on Early Childhood Education
May 2011
Report to the Early Childhood Development Working Group of the Australian Education, Early Childhood Development and Youth Affairs Senior Officials Committee

The Allen Consulting Group ii
Allen Consulting Group Pty Ltd
ACN 007 061 930, ABN 52 007 061 930
Melbourne
Level 9, 60 Collins St Melbourne VIC 3000 Telephone: (61-3) 8650 6000 Facsimile: (61-3) 9654 6363
Sydney
Level 1, 50 Pitt St Sydney NSW 2000 Telephone: (61-2) 8272 5100 Facsimile: (61-2) 9247 2455
Canberra
Empire Chambers, Level 2, 1-13 University Ave Canberra ACT 2600 GPO Box 418, Canberra ACT 2601 Telephone: (61-2) 6204 6500 Facsimile: (61-2) 6230 0149
Online
Email: [email protected] Website: www.allenconsult.com.au
Suggested citation for this report: The Allen Consulting Group 2011, Eighteen Month Review of the National Partnership Agreement on Early Childhood Education report to the Early Childhood Development Working Group of the Australian Education, Early Childhood Development and Youth Affairs Senior Officials Committee, Canberra, May.
Disclaimer: While the Allen Consulting Group endeavours to provide reliable analysis and believes the material it presents is accurate, it will not be liable for any claim by any party acting on such information. © Allen Consulting Group 2011

The Allen Consulting Group iii
Contents
Executive summary v This report v Early childhood across Australia v Are states and territories on track to achieving the NP objectives? v
Chapter 1 Project overview 1
1.2 Background 1 1.3 The review process 1 1.4 This report 6
Part 1 Review findings 7
Chapter 2 Review findings 8
2.1 Overview — Early childhood education across Australia 8 2.2 What is the NP ECE intended to achieve? 9 2.3 What is currently happening? 12 2.4 Can it be done? 16 2.5 Conclusion — adequacy of funding and appropriateness of timelines
for achieving the NP’s objectives 28
Appendices Jurisdictional summaries 40
Appendix A ACT 41
A.1 Overview of early childhood education in ACT 41 A.2 Conclusion — adequacy of funding and appropriateness of timelines 43
Appendix B New South Wales 48
B.1 Overview of early childhood education in New South Wales 48 B.2 Conclusion — adequacy of funding and appropriateness of timelines 51

The Allen Consulting Group iv
Appendix C Northern Territory 56
C.1 Overview of early childhood education in the Northern Territory 56 C.2 Conclusion — adequacy of funding and appropriateness of timelines 58
Appendix D Queensland 63
D.1 Overview of early childhood education in Queensland 63 D.2 Conclusion — adequacy of funding and appropriateness of timelines 65
Appendix E South Australia 71
E.1 Overview of early childhood education in South Australia 71 E.2 Conclusion — adequacy of funding and appropriateness of timelines 73
Appendix F Tasmania 79
F.1 Overview of early childhood education in Tasmania 79 F.2 Conclusion — adequacy of funding and appropriateness of timelines 81
Appendix G Victoria 86
G.1 Overview of early childhood education in Victoria 86 G.2 Conclusion — adequacy of funding and appropriateness of timelines 88
Appendix H Western Australia 95
H.1 Overview of early childhood education in Western Australia 95 H.2 Conclusion — adequacy of funding and appropriateness of timelines 99
References 104
E I G H T E E N M O N T H R E V I E W O F T H E N A T I O N A L P A R T N E R S H I P A G R E E M E N T O N E A R L Y C H I L D H O O D
E D U C A T I O N
The Allen Consulting Group v
Executive summary
This report
The National Partnership Agreement on Early Childhood Education (NP ECE) requires a review within eighteen months of its commencement to measure the progress made by the Parties to the NP against the Agreement’s objectives and the bilateral agreements. This report forms part of the eighteen month review. It is intended to inform annual negotiations between the Parties to the Agreement on the ongoing implementation of the NP.
The report documents the findings from two streams of parallel analysis undertaken by the Allen Consulting Group: (i) qualitative analysis, which included extensive national stakeholder consultations with officials and industry stakeholders representing each of the parties to the Agreement, and (ii) quantitative analysis comprising a model developed in consultation with Parties to the Agreement.
Early childhood across Australia
Across Australia, early childhood education (ECE) is characterised by enormous diversity. A number of ECE variables differ significantly across jurisdictions, such as the ECE setting and management types, the average number of hours per week of attendance, the percentage of children enrolled in ECE programs, the number of qualified teachers, and the average weekly cost of ECE. Due to the different starting points in the provision of preschool programs in each state and territory, jurisdictions are seeking to progress a range of objectives through the NP ECE and have adopted different approaches to meeting the outcomes of the Agreement.
Are states and territories on track to achieving the NP objectives?
In understanding the progress of states and territories in achieving the objectives of the NP ECE, the Allen Consulting Group has analysed both qualitative and quantitative information against the four key focus areas of the NP: universal access, workforce, affordability and convenience.
In summary, this review concludes that it is likely that the majority of jurisdictions will achieve the objectives of the NP ECE by the 2012-2013 implementation date. However, the challenges of delivering universal access across Queensland and Northern Territory are likely to prevent these jurisdictions from fully realising the objectives of the agreement during the time of the Agreement. This conclusion supports the significant progress made across the country — including Queensland and the Northern Territory — towards successfully implementing the Agreement, and recognises the scale of the challenge that the NP ECE represents. For all jurisdictions, the cost of achieving the NP’s objectives will be significant and will require the successful management of numerous economic, social, geographical, cultural and industrial barriers.
This review outlines the barriers that have been identified and derives conclusions in relation to two key considerations:
• the adequacy of funding to achieve the NP’s objectives; and

E I G H T E E N M O N T H R E V I E W O F T H E N A T I O N A L P A R T N E R S H I P A G R E E M E N T O N E A R L Y C H I L D H O O D
E D U C A T I O N
The Allen Consulting Group vi
• the appropriateness of timelines to achieve the NP’s objectives.
Adequacy of funding for achieving the NP’s objectives
As part of this review, the Allen Consulting Group was asked to consider whether the funding to support the NP ECE has been adequate to achieve the objectives of the Agreement. In consultation with Parties to the Agreement, however, it is evident that two questions emerge in relation to funding:
• Adequacy of funding — whether the overall funding allocated under the NP ECE has been adequate to achieve the objectives of the Agreement in 2012-13; and
• Sustainability of funding — whether the annual funding under the Agreement is likely to sustain the ongoing maintenance of the NP ECE's objectives beyond the term of the Agreement.
It should be noted that the second of these questions is beyond the scope of this review. However, it is possible to draw some conclusions on both the adequacy and sustainability of funding under the NP ECE by comparing the overall and annual funding under the NP with estimates of the likely recurrent cost of the Agreement in 2012–13. However, before outlining these conclusions, it is first necessary to discuss some of the issues emerging from the Allen Consulting Group's quantitative analysis of the funding supporting the NP ECE.
Conclusions on adequacy of funding
On the question of adequacy of funding, this review considers that the funding supporting the implementation of the NP in all states and territories is adequate for achieving the objectives of the Agreement. It reaches this conclusion by comparing the estimated cost of achieving the objectives of the NP ECE with the total funding distributed under the Agreement (see Figure ES 1.1). This analysis assumes that the funding to support the Agreement is intended to achieve a single set of outcomes at a single point in time — the NP's 2013 implementation date.
On this reading of the question of adequacy, and as Figure ES 1.1 illustrates, the funding to achieve the NP's objectives is greater than the anticipated recurrent cost of the Agreement in 2012–13 in all but one jurisdiction. In Queensland, the funding supporting the achievement of the NP is equivalent to 91 per cent of the estimated recurrent cost of the NP in 2012–13. Given that state and territory governments are partners in the NP and are, with the Australian Government, contributing to the achievement of the NP's objectives, it is reasonable to conclude that the funding under the NP ECE is adequate to achieve the Agreement's objectives in 2012–13.
E I G H T E E N M O N T H R E V I E W O F T H E N A T I O N A L P A R T N E R S H I P A G R E E M E N T O N E A R L Y C H I L D H O O D
E D U C A T I O N
The Allen Consulting Group vii
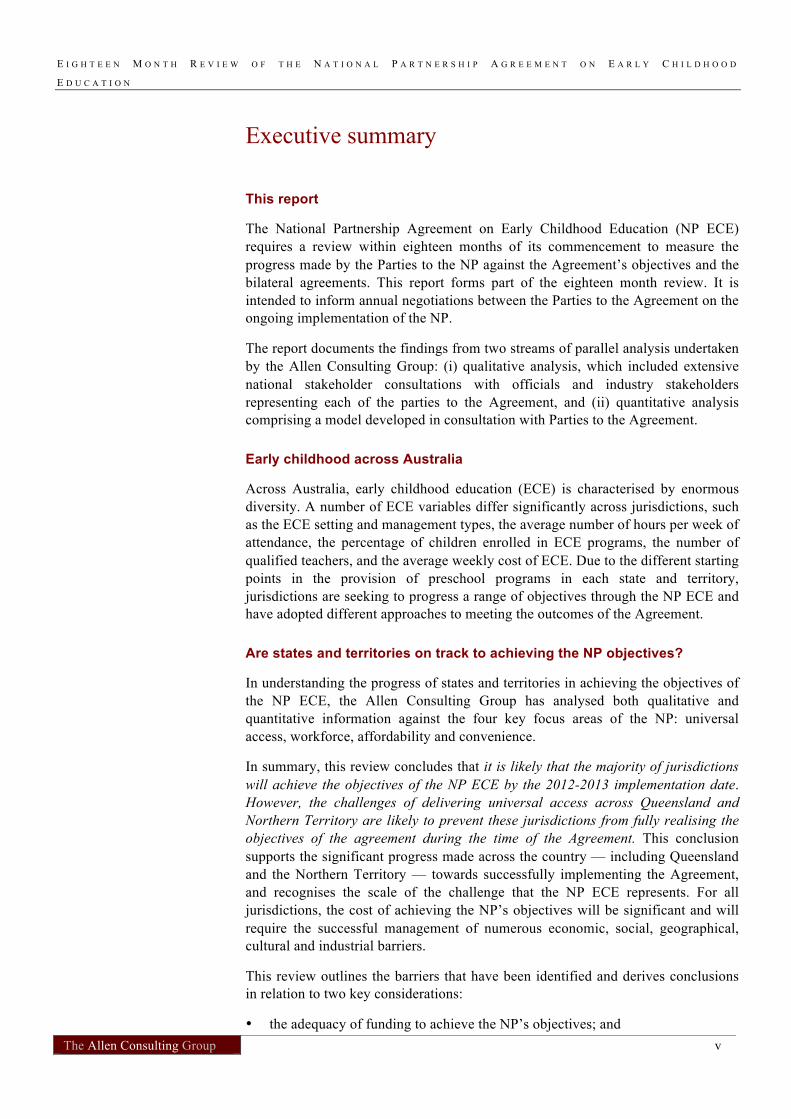
Figure ES 1.1
COMPARISON OF TOTAL NP ECE FUNDING AND EXPECTED COSTS, INCLUDING ‘IMPLEMENTATION COSTS’
Note: Implementation costs have been amortised and show the interest payable in one year on the total value of anticipated implementation costs.
Figures for total funding are distributed over five years to achieve the outcomes of the NP in the single year of its implementation. Figures for recurrent cost of the NP represent the one-off cost of implementing the NP in 2012-13.
Source: Allen Consulting Group analysis, using method described in report Overview.
This finding is further supported by recent data reported in the Report on Government Services (RoGS) 2011 which shows that, with the exception of Queensland, when growth in State and Territory recurrent expenditure on early childhood education between 2007-2008 and 2009-10 is taken into account, the difference between total government funding and the recurrent cost of the NP ECE in 2012-13 declines considerably. The increase in state and territory governments' contributions between year 2007–08 and 2009–10 is shown in Table ES 1.1.
Table ES 1.1
STATE AND TERRITORY GOVERNMENT REAL EXPENDITURE ON PRESCHOOL SERVICES ($, MILLION)
NSW VIC QLD WA SA TAS ACT NT AUS
2007–08 $135m $158m $38m $68m $100m $25m $22m $25m $571m 2009–10 $169m $177m $51m $179m $107m $27m $23m $30m $762m Difference $34m $19m $13m $111m $6m $2m $1m $5m $191m Growth 25% 12% 34% $163% 6% 8% 5% 22% 34%
Note: These figures also include funding provided by the Australian Government to support the implementation of the NP ECE.
Source: Steering Committee on Government Service Provision (SCGSP) 2011, Report on Government Services 2011, Chapter 3, Table 3A.5
However, in all states and territories significant implementation issues are anticipated, driven by likely increases in capital, workforce costs and — for the Northern Territory, Queensland, South Australia and Western Australia — challenges relating to the provision of ECE in remote locations.

E I G H T E E N M O N T H R E V I E W O F T H E N A T I O N A L P A R T N E R S H I P A G R E E M E N T O N E A R L Y C H I L D H O O D
E D U C A T I O N
The Allen Consulting Group viii
It is important to recognise that not all contributions into the ECE sector are represented in Figure ES 1.1. While the column showing the total NP ECE funding represents the Australian Government's contribution to the Agreement, the difference between that figure and the estimated additional recurrent cost of the NP ECE will come from a combination of sources, including state and territory governments, local governments and families. While it is beyond the scope of this review to recommend an appropriate 'split' between the contributions made by different sources in ECE in Australia, it is hoped that the modelling method and analysis of issues outlined in this report will assist Parties to the Agreement to frame their negotiations by highlighting the most critical issues concerning the NP ECE.
Conclusions on sustainability of funding
On the question of sustainability of funding, the review considers that the funding provided in any given year under the Agreement may be insufficient to sustain the level of service provision required to meet the objectives of the NP ECE beyond 2012–13 in Queensland, the Northern Territory and possibly South Australia.
Figure ES 1.2 compares the estimated additional recurrent and implementation costs of meeting the NP ECE’s objectives with the final year's funding under the Agreement for each jurisdiction. In Queensland and the Northern Territory, the 2012-13 funding under the Agreement is lower than the estimated recurrent cost of achieving the NP's objectives by 65 per cent and 41 per cent respectively. In South Australia, the equivalent shortfall is around 38 per cent, while in the ACT and WA, the 2012-13 NP ECE funding is greater than the estimated recurrent cost of achieving the Agreement's objectives by 35 per cent and 43 per cent, respectively.
Figure ES 1.2
COMPARISON OF 2012-13 NP ECE FUNDING AND ESTIMATED RECURRENT AND IMPLEMENTATION COSTS POST IMPLEMENTATION
Note: Implementation costs have been amortised and show the interest payable in one year on the total value of anticipated implementation costs.
Source: Allen Consulting Group analysis, using method described in report Overview.

E I G H T E E N M O N T H R E V I E W O F T H E N A T I O N A L P A R T N E R S H I P A G R E E M E N T O N E A R L Y C H I L D H O O D
E D U C A T I O N
The Allen Consulting Group ix
If the annual funding to support the NP ECE is less than the estimated cost of delivering the services required to meet the Agreement, other actors in the ECE sector — including state and territory governments, local governments, community services organisations and families — may be required to contribute to the achievement of the Agreement's long-term objectives.
Appropriateness of timelines for achieving the NP’s objectives
While the Allen Consulting Group’s analysis of the adequacy of funding has been based on both economic analysis and the opinions of stakeholders, it has not been able to rely on forecasting or other similarly ‘objective’ methodologies to determine the appropriateness of the Agreement’s timelines. Any estimate of the appropriateness of timelines is necessarily subjective, and as such, the Allen Consulting Group has relied significantly on the qualitative component of the eighteen month review.
On the basis of that qualitative research, this review considers that the states’ and territories’ progress to date in implementing the NP ECE has been appropriate. However, this review also considers that the timelines of the Agreement are likely to be too short for the Northern Territory and Queensland to fully realise the objectives of the Agreement, given the significant challenge in achieving universal access — in particular, in remote communities — for these jurisdictions.
Further, this review considers that all jurisdictions have acted in good faith in implementing the Agreement, despite the significant challenge that the NP represents. All jurisdictions have made significant and laudable progress in their implementation efforts, and it is important — and appropriate — to sustain the considerable momentum that has built up in each jurisdiction’s ECE sector since the Agreement was signed.

E I G H T E E N M O N T H R E V I E W O F T H E N A T I O N A L P A R T N E R S H I P A G R E E M E N T O N E A R L Y C H I L D H O O D
E D U C A T I O N
The Allen Consulting Group 1
Chapter 1
Project overview
1.2 Background
In November 2008, the Council of Australian Governments (COAG) signed the National Partnership on Early Childhood Education (NP ECE). Ten months later, NP ECE bilateral agreements between the Commonwealth and all state and territory governments were concluded and announced.
Under the Agreement, a review was required within eighteen months of the NP ECE’s commencement to measure the progress made by the Parties to the NP ECE against the Agreement’s objectives and the bilateral agreements. The scope of the eighteen month review has been to consider:
• the adequacy of funding to achieve NP ECE outcomes and outputs;
• the appropriateness of timelines;
• achievement of agreed outcomes, outputs and performance indicators;
• compliance by Parties with financial and reporting requirements; and
• annual bilateral discussions to review progress against bilateral agreements.
1.3 The review process
This report forms part of the eighteen month review of the NP ECE. It documents the findings of the Allen Consulting Group’s work, incorporating two streams of parallel analysis.
Qualitative component
First the Allen Consulting Group undertook a qualitative analysis component that included consultation with officials and industry stakeholders (selected by each jurisdiction) representing each of the Parties to the Agreement. The consultation schedule is outlined in Table 1.1 below.

E I G H T E E N M O N T H R E V I E W O F T H E N A T I O N A L P A R T N E R S H I P A G R E E M E N T O N E A R L Y C H I L D H O O D
E D U C A T I O N
The Allen Consulting Group 2
Table 1.1
CONSULTATION SCHEDULE FOR THE EIGHTEEN MONTH REVIEW
Consultation Location Date
Tasmanian Department of Education, Tasmanian early childhood sector representatives
Hobart 16 July 2010
Queensland Department of Education and Training Brisbane 22 July 2010
Queensland early childhood sector representatives Brisbane 22 July 2010
Northern Territory early childhood sector representatives
Darwin 28 July 2010
Northern Territory Department of Education and Training
Darwin 28 July 2010
Victorian Government Department of Education and Early Childhood Development
Melbourne 3 August 2010
Victorian early childhood sector representatives Melbourne 3 August 2010
Western Australian Department of Education, WA early childhood sector representatives
Perth 5 August 2010
Community Services NSW Sydney 10 August 2010
NSW early childhood sector representatives Sydney 10 August 2010
South Australian Department of Education and Children’s Services
Adelaide 11 August 2010
South Australian early childhood sector representatives
Adelaide 11 August 2010
ACT Department of Education and Training Canberra 16 August 2010
Australian Government Department of Education, Employment and Workplace Relations
Canberra 16 September 2010
Source: Allen Consulting Group
In addition, the Allen Consulting Group invited Parties to the Agreement to make submissions to the eighteen month review. Eight Parties took up this opportunity.
Quantitative component
Second, a quantitative component was undertaken comprising a model developed in consultation with Parties to the Agreement. The model considered two scenarios:
• the ‘baseline’ recurrent expenditure on ECE had the NP ECE not been agreed; and
• the total recurrent cost of implementing the NP ECE.
The ‘baseline’ scenario
For the baseline scenario, the Allen Consulting Group’s model firstly estimates the recurrent expenditure on ECE in each jurisdiction at the starting point of the NP (2007–08) by applying data on:
• participation rates;

E I G H T E E N M O N T H R E V I E W O F T H E N A T I O N A L P A R T N E R S H I P A G R E E M E N T O N E A R L Y C H I L D H O O D
E D U C A T I O N
The Allen Consulting Group 3
• average hours of ECE provided;
• population of four year olds; and
• expenditure data (both government and private sources).
Building on the starting point estimates of average cost per child and average cost per child per hour of ECE, the model then calculates the likely expenditure on ECE in each jurisdiction (from both government and private sources) in 2012–13 had the NP ECE not been agreed, by taking into account population growth and inflation. This forms the ‘base case’.
Figure 1.1 shows the method employed and the calculations to estimate both the annual government and private expenditure on ECE for the ‘baseline’ scenario.

E I G H T E E N M O N T H R E V I E W O F T H E N A T I O N A L P A R T N E R S H I P A G R E E M E N T O N E A R L Y C H I L D H O O D
E D U C A T I O N
The Allen Consulting Group 4
Figure 1.1
ESTIMATING THE BASELINE RECURRENT EXPENDITURE ON ECE IN EACH JURISDICTION
Sources and assumptions: a 4 year old children already enrolled in ECE (or 4 and 5 year old children in Tasmania), but for less than the required 15 hours, as reported in NP ECE Data Capability Reports. b From Data Capability Reports provided under the NP ECE. c Australian Bureau of Statistics 2006-2101, released 2008, Population Projections Australia, cat. no. 3222.0, Series B for 4 year old population. d From Data Capability Reports provided under the NP ECE. e Steering Committee on Government Service Provision (SCGSP) 2009, Report on Government Services 2009, Chapter 3, Table 3A.6. f From Data Capability Reports provided under the NP ECE. Calculated by multiplying the annual State and Territory government subsidy to ECE providers by the number of children in each State and Territory who access ECE in a long day care setting, further multiplied by the difference (in percentage terms) between the subsidy paid by State and Territory Governments to stand alone ECE providers and long day care providers who also offer an ECE program. Assumes that the cost of ECE delivered in long day care services is the same as that in stand alone ECE services, and that parental costs are the same across the different settings in which ECE is delivered. g Steering Committee on Government Service Provision (SCGSP) 2010, Report on Government Services 2010, Chapter 3, Table 3A.26. ACG acknowledges that the ROGS data used (3A.26) is derived only from surveys of parents using child care and is only about net costs per child after subsidies (CCB and CCR) and may not reflect the actual out of pocket cost of ECE for families. h Steering Committee on Government Service Provision (SCGSP) 2010, Report on Government Services 2010, Chapter 3, Table 3A.13. i From Data Capability Reports provided under the NP ECE. j Inflation will be based on five year average (mean) of annual change in the Consumer Price Index, between September 2005 and September 2010 (latest). Australian Bureau of Statistics 2010 Consumer Price Index, Australia, Sep 2010, cat. no. 6401.0, Tables 1 and 2.
Note: Several stakeholders have observed that RoGS data, while the best data available at this time, has significant limitations that should be considered. Specifically, RoGS data on funding does not include funding allocated to coasts that are shared across schools, including allocations for infrastructure, maintenance, administration and asset management. In addition, RoGS data on out-of-pocket expenses of ECEC provides a better estimate of the costs of care rather than education. These issues notwithstanding, RoGS data is the best available at this time, and is used in this report subject to these caveats. Source: The Allen Consulting Group
Total recurrent cost of implementing the NP ECE
Having established the starting point and the base case as described above, the Allen Consulting Group’s modelling then considers the difference between the baseline results and the estimates of the likely expenditure on ECE in each jurisdiction required to meet the objectives of the NP ECE by:
E I G H T E E N M O N T H R E V I E W O F T H E N A T I O N A L P A R T N E R S H I P A G R E E M E N T O N E A R L Y C H I L D H O O D
E D U C A T I O N
The Allen Consulting Group 5
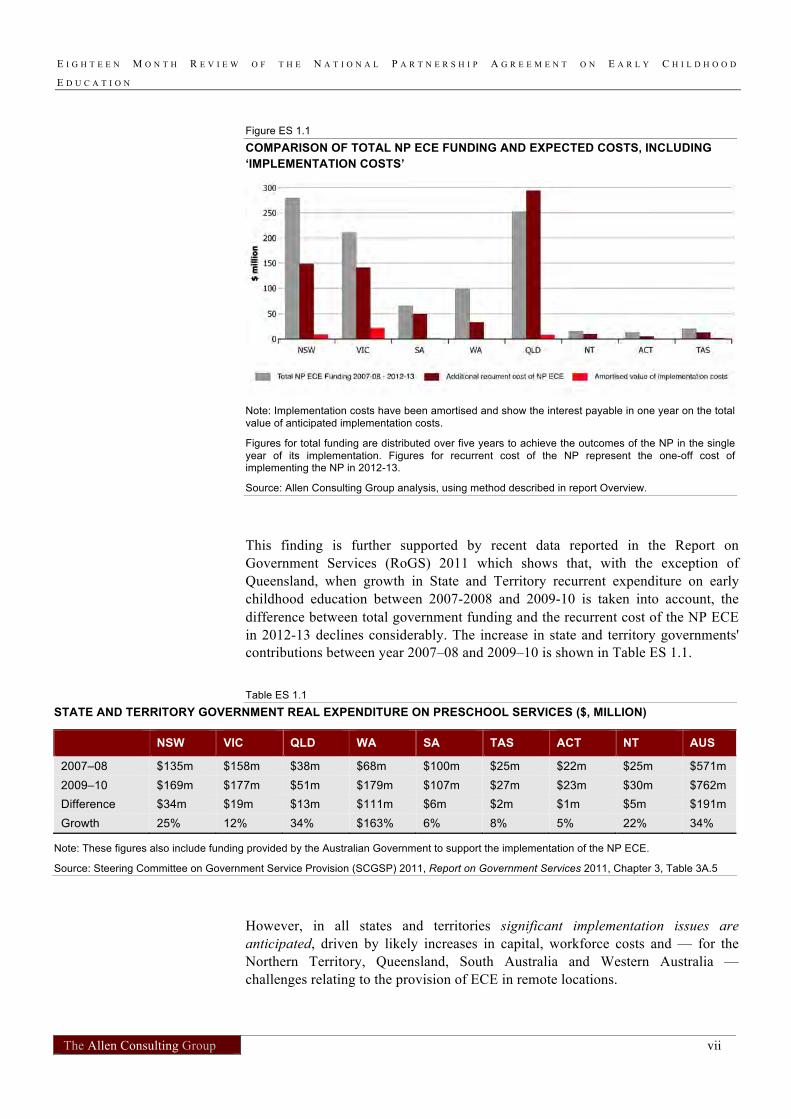
• estimating the hours required to provide ECE to four year old children who do not currently access ECE in the year before formal schooling (YBFS) — that is, the increase in participation resulting from the 'universal access' commitment to the NP — and the additional hours required by children who already access a kindergarten program (the 'fifteen hours commitment' of the NP); and
• applying the average cost per child per hour of ECE delivered that is calculated in the ‘baseline’ scenario (adjusted for inflation) to derive the total additional recurrent cost of implementing the Agreement in 2012–13.
Figure 1.2 illustrates the method employed and calculations to estimate the recurrent costs required to achieve the NP ECE objectives for each jurisdiction.
Figure 1.2
ESTIMATING THE RECURRENT COSTS REQUIRED TO ACHIEVE THE NP ECE OBJECTIVES
Sources and assumptions: a Australian Bureau of Statistics 2006-2101, released 2008, Population Projections Australia, cat. no. 3222.0, Series B for 4 year old population (average of 12/13). b 4 year old children already enrolled in ECE, but for less than the required 15 hours, as reported in Data Capability Reports. c From Data Capability Reports provided under the NP ECE. d From Data Capability Reports provided under the NP ECE. e Australian Bureau of Statistics 2006-2101, released 2008, Population Projections Australia, cat. no. 3222.0, Series B for 4 year old population (average of 12/13. f From Data Capability Reports provided under the NP ECE. g Inflation will be based on five year average (mean) of annual change in the Consumer Price Index, between September 2005 and September 2010 (latest). Australian Bureau of Statistics 2010 Consumer Price Index, Australia, Sep 2010, cat. no. 6401.0, Tables 1 and 2.
Note: Several stakeholders have observed that RoGS data, while the best data available at this time, has significant limitations that should be considered. Specifically, RoGS data on funding does not include funding allocated to costs that are shared across schools, including allocations for infrastructure, maintenance, administration and asset management. In addition, RoGS data on out-of-pocket expenses of ECEC provides a better estimate of the costs of care rather than education. These issues notwithstanding, RoGS data is the best available at this time, and is used in this report subject to these caveats.
Source: The Allen Consulting Group

E I G H T E E N M O N T H R E V I E W O F T H E N A T I O N A L P A R T N E R S H I P A G R E E M E N T O N E A R L Y C H I L D H O O D
E D U C A T I O N
The Allen Consulting Group 6
There is currently no single, definitive source of data on early childhood — instead, there are many, fragmented sources, and not all data are readily available, timely, comprehensive or reliable. Existing survey and administrative data relating to early childhood includes some rich sources, but not all of the currently available data are high quality, accessible or transparent. Particularly, administrative data systems are not equipped to address the full range of information needs of the NP ECE, and comparisons across jurisdictions and for key sub-groups in the population are difficult to make.
The National Information Agreement for Early Childhood Education and Care (NIA ECEC), which was endorsed by MCEECDYA at its 6 November 2009 meeting, aims to improve early childhood data and support performance information reporting needs under the COAG Inter Governmental Agreement on Federal Financial Relations, and the NP ECE. However, it is anticipated that these improvements will only be realised after the conclusion of the 18 Month Review.
In addition, stakeholders in all jurisdictions observed that the funding required to deliver early childhood outcomes varied as a result of social, cultural, geographic and financial factors.
1.4 This report
As an input into the eighteen month review, this report is intended to inform annual negotiations between the Parties to the Agreement on the ongoing implementation of the NP.
The report comprises two parts:
• Part 1 summarises the Allen Consulting Group’s key findings at a national level. It aggregates findings from individual states and territories in a single national overview, and details the overall progress of the NP.
• Part 2 — Appendices is broken into jurisdictional appendices outlining the contexts within which ECE is delivered across Australia and the quantitative analysis of the adequacy and sustainability of funding in each jurisdiction.

E I G H T E E N M O N T H R E V I E W O F T H E N A T I O N A L P A R T N E R S H I P A G R E E M E N T O N E A R L Y C H I L D H O O D
E D U C A T I O N
The Allen Consulting Group 7
Part 1 Review findings

E I G H T E E N M O N T H R E V I E W O F T H E N A T I O N A L P A R T N E R S H I P A G R E E M E N T O N E A R L Y C H I L D H O O D
E D U C A T I O N
The Allen Consulting Group 8
Chapter 2
Review findings
2.1 Overview — Early childhood education across Australia
Across Australia, early childhood education (ECE) is characterised by enormous diversity. There are a number of ECE variables that differ across jurisdictions, which are summarised in Table 2.1 below.
Table 2.1
CHARACTERISTICS OF EARLY CHILDHOOD EDUCATION SYSTEMS ACROSS AUSTRALIA
NSW Vic Qld WA SA Tas ACT* NT
Setting Mixed Mixed Mixed School School School School School
Hours Medium Low High Low Low Low High Medium
Participation (all children) Medium High Low High Medium High High Medium
Disadvantaged Medium High Low High High High Medium High
Indigenous High Medium Low High High Medium Medium High
Number of qualified staff Low High Low High Low High High Medium
Cost High High High Low Low Low High Low
Note: Hours shows the average number of hours per week of attendance at an ECE program (minimum 10 hours, maximum 15 hours), where 10-12 is low, 12-13 medium and 13 and above high; Participation shows the percentage of children who are enrolled in an ECE program, for all children, disadvantaged children and Indigenous children, where 0-50% is low, 50-90% is medium and 90% and above is high; Disadvantaged and Indigenous shows the participation rates for disadvantaged and Indigenous children as a proportion of their respective targets for 2012–13, where below 70% is low, 70%-90% is medium and 90%-100% is high; Staff shows the percentage or number of teachers delivering ECE programs who are 4-year university trained and EC qualified as a proportion of the target for 2012–13, where 0-60% is low, 60%-80% is medium and 80%-100% is high; Cost shows a qualitative, three scale rating of the median weekly cost of ECE (average for ACT), where low is between $0 and $5, Medium is between $5 and $15 and high is over $15; ACG acknowledges that the ROGS data used (3A.26) is derived only from surveys of parents using child care and is only about net costs per child after subsidies (CCB and CCR) and may not reflect the actual out of pocket cost of ECE for families, and Setting shows the percentage of licensed and/or registered preschool providers, by management type.
Source: ACT Government 2010b; NSW Government 2010; NT Government 2010; Queensland Government 2010; South Australian Government 2010a; Tasmanian Government 2010; Victorian Government 2010; Government of WA 2010; Dowling, A and O’Malley, K 2009; SGRGSP 2009, Table 3A.26.
As Table 2.1 shows, there is a clear distinction between jurisdictions in terms of the setting in which ECE is provided. Five jurisdictions provide ECE through a school-based system, in which ‘kindergarten’ or ‘preschool’ services are predominantly provided within the primary school system. In contrast, in New South Wales, Victoria and Queensland, a ‘mixed market’ system operates, whereby children can access ECE in a range of settings through providers with a variety of ownership characteristics.
Average attendance at an ECE program varies between 10 and 15 hours per week. Queensland, with an average of 13.7 hours per week, is closest to achieving the NP target. Victoria, Western Australia, South Australia and Tasmania face the greatest challenge in increasing the provision of services from the current level of between 10 and 12 hours per week.

E I G H T E E N M O N T H R E V I E W O F T H E N A T I O N A L P A R T N E R S H I P A G R E E M E N T O N E A R L Y C H I L D H O O D
E D U C A T I O N
The Allen Consulting Group 9
The proportion of children enrolled in an ECE program varies significantly between jurisdictions, ranging from less than 50 per cent in Queensland to more than 90 per cent in Victoria, Western Australia, Tasmania and the Australian Capital Territory. Enrolment rates are generally lower for children from disadvantaged and Aboriginal or Torres Strait Islander backgrounds across all jurisdictions, although Victoria and South Australia have achieved high participation rates for disadvantaged children and Western Australia, Northern Territory, South Australia and New South Wales having achieved high participation rates for Indigenous children.
Staff engaged in the provision of ECE services have a variety of educational backgrounds. Although for example in Western Australia all ECE staff are university-trained, the proportion of staff with a four-year university degree varies between jurisdictions.
The cost to families of accessing ECE programs varies, with the Australian Capital Territory and Tasmania providing programs for almost no direct cost to families. There appears to be a correlation between the provision of a mixed market system and having a higher weekly average cost for ECE services, with New South Wales, Victoria and Queensland all having high costs compared to other jurisdictions. Additionally, family contributions in these states is higher than in states and territories where ECE is provided largely within a school setting.
2.2 What is the NP ECE intended to achieve?
Consultations with Parties to the Agreement reveal the range of objectives that jurisdictions are seeking to progress through the NP ECE. As the jurisdictional chapters in Part 2 detail, state and territory governments have implemented the Agreement in diverse ways, reflecting the characteristics of their existing ECE systems and policies and the needs of local children and families. Consequently, this section will not go into detail about the different ways in which the NP is being used to progress policy objectives in different states and territories. Rather, it will describe the national ‘architecture’ of the NP, and list jurisdictions’ commitments under the NP.
The NP ECE operates within the Intergovernmental Agreement on Federal Financial Relations (IGA) framework. Under this framework, governments collectively agree on specific outcomes for national policy, and are funded on the achievement of those outcomes.
Within the IGA framework, the NP ECE allows for negotiation between state and territory governments and the Australian Government to develop the strategies, actions and deliverables for achieving the intended outcomes in a way that is appropriate for local conditions and consistent with state and territory government policies.
For the NP ECE and the related Bilateral Agreements, the outcomes listed in Figure 2.1 have been agreed by state and territory governments.

E I G H T E E N M O N T H R E V I E W O F T H E N A T I O N A L P A R T N E R S H I P A G R E E M E N T O N E A R L Y C H I L D H O O D
E D U C A T I O N
The Allen Consulting Group 10
Figure 2.1
OBJECTIVES OF THE NP ECE AND THE BILATERAL AGREEMENTS
Source: DEEWR
Further, the IGA provides for the performance management framework supporting the NP ECE, as outlined in Table 2.2.

E I G H T E E N M O N T H R E V I E W O F T H E N A T I O N A L P A R T N E R S H I P A G R E E M E N T O N E A R L Y C H I L D H O O D
E D U C A T I O N
The Allen Consulting Group 11
Table 2.2
NP ECE OUTCOME, OUTPUT AND PERFORMANCE MEASUREMENT FRAMEWORK
Outcomes Outputs Performance Indicators
All children have access to affordable, quality early childhood education in the (YBFS) formal schooling.
Children have universal access to a preschool program for 15 hours per week, 40 weeks per year.
The proportion of children who are enrolled in (and attending, where possible to measure) a preschool program.
The number of teachers delivering preschool programs who are four year university trained and early childhood qualified.
Hours per week of attendance (where possible to measure) at a preschool program.
Universal access to a preschool program is delivered across a range of settings at a cost which is not a barrier to access
Distribution of children who attend a preschool program by weekly cost per child (after subsidies) as defined by jurisdictions
Disadvantaged children have universal access to a preschool program.
The proportion of disadvantaged children enrolled in (and attending, where possible to measure) a preschool program.
All Indigenous four year olds in remote Indigenous communities will have access to a quality early childhood education program
Indigenous children (including those in remote Indigenous communities) enrolled in and attending a preschool program.
The proportion of Indigenous children (by geographic location as identified by the Australian Standard Geographic Classification), who are enrolled in (and attending, where possible to measure) a preschool program.
Source: COAG 2008.
To summarise, then, the NP ECE has four key focus areas:
• universal access — that is, the aspects of the NP that focus on ‘increasing participation rates (particularly for Indigenous and disadvantaged children)’ and ‘increasing program hours’;
• workforce — in particular through the NP’s focus on ‘strengthening program quality and consistency’
• affordability — that is, ‘ensuring cost is not a barrier to access’; and
• convenience — that is, the aspects of the NP that relate to ‘fostering service integration and coordination across stand-alone preschool and child care’.1
1 It is noted that these four key focus areas may have more resonance at different times as the NP is
implemented. For example, as implementation progresses, a focus on service integration and co-ordination may be required, in addition to a focus on convenience. For the purposes of this report, the four acknowledged focus areas are used to guide the logic of the report's analysis.

E I G H T E E N M O N T H R E V I E W O F T H E N A T I O N A L P A R T N E R S H I P A G R E E M E N T O N E A R L Y C H I L D H O O D
E D U C A T I O N
The Allen Consulting Group 12
2.3 What is currently happening?
As has been observed, state and territory governments have adopted different approaches to meeting the outcomes of the NP ECE. The following chapters provide brief descriptions of recent key projects relating to universal access to early childhood education in each state and territory. As such, this chapter will not outline in detail the strategies being employed to implement the NP in specific jurisdictions, but will discuss other national policy initiatives that intersect with, or are being implemented at the same time as, the NP ECE.
National policy initiatives seeking to improve early childhood outcomes
Other National Partnership Agreements
There are several National Partnership Agreements other than the Agreement on Early Childhood Education that seek to improve early childhood outcomes.
• The National Partnership Agreement on a National Quality Agenda for Early Childhood Education and Care (ECEC) aims to improve the quality of early childhood education and care services through pursuing a number of objectives relating to an integrated and unified national system for ECEC, improving educational and developmental outcomes for children attending ECEC and OSHC, fostering a joint system of governance in the operation of the National Quality Framework; improving the efficiency and cost effectiveness of the regulation of ECEC and OSHC services; reducing the regulatory burden for ECEC and OSHC service providers; improving public knowledge about and access to information on the quality of ECEC and OSHC services; and building a highly skilled workforce.
• The National Partnership Agreement on Indigenous Early Childhood Development (NP IECD) seeks to establish 38 new Children and Family Centres, and to increase access to child and family health services for Indigenous children and families (as part of the broader Closing the Gap strategy aimed at reducing Indigenous disadvantage). Within the NP IECD, the Aboriginal and Torres Strait Islander Universal Access Strategy provides for four key focus areas:
– access to early childhood education;
– positive community awareness and engagement;
– quality early childhood programs and activities; and
– culturally aware and sensitive teachers and support staff .
• The National Partnership Agreement on Preventive Health focuses on strategies to prevent chronic diseases that commence in early childhood.
• The National Partnership Agreement on Homelessness focuses on intervening early for children and families at risk of homelessness.
• The National Disability Agreement includes an Early Intervention and Prevention Framework to increase Governments’ ability to be effective with early intervention and prevention strategies.

E I G H T E E N M O N T H R E V I E W O F T H E N A T I O N A L P A R T N E R S H I P A G R E E M E N T O N E A R L Y C H I L D H O O D
E D U C A T I O N
The Allen Consulting Group 13
National Early Childhood Development Strategy
The National Early Childhood Development Strategy — Investing in the Early Years (National ECD Strategy) was endorsed by COAG in July 2009. The National ECD Strategy builds on and links with a number of Commonwealth election commitments and previous COAG childhood development reforms. It is expected to further evolve as it responds to the challenges and needs of Australia’s children and families. The purpose of the Strategy is to ‘help all levels of government to build a more effective and better coordinated national early childhood development system to support the diverse needs of Australian children and their families’ (DEEWR 20102). The Strategy proposes six priority areas for reform to be further developed for COAG in 2010:
• strengthen universal maternal, child and family health services;
• support for vulnerable children;
• engaging parents and the community in understanding the importance of ECD;
• improve early childhood infrastructure;
• strengthen the workforce across ECD and family support services; and
• build better information and a solid evidence base.
As part of the commitment to build better information and a solid evidence base, investment has been made in the following data sources:
• Australian Early Development Index (AEDI) — a population measure of young children's development, covering five key domains of early childhood development: physical health and wellbeing, social competence, emotional maturity, language and cognitive skills, and communication skills and general knowledge. Communities can use the AEDI results to develop and evaluate their efforts to improve outcomes for children; and
• National Early Childhood Education and Care Workforce Census — the first nationally consistent data set on the early childhood education and care workforce, including the number of four year trained early childhood teachers in the workforce.
National Framework for Protecting Australia’s Children
The National Framework for Protecting Australia’s Children was endorsed by COAG in April 2009 and is designed deliver a substantial and sustained reduction in child abuse and neglect in Australia. New commitments under this framework are anticipated to make a significant contribution to the implementation of the National ECD Strategy.
A key component of the National Framework for Protecting Australia’s Children is the Family Support Program, which brings together a number of existing family, children and parenting services with a common purpose to provide more flexibility in supporting families and children — particularly those who are vulnerable or disadvantaged.
2 http://www.deewr.gov.au/Earlychildhood/Policy_Agenda/Pages/EarlyChildhoodDevelopmentStrategy.aspx

E I G H T E E N M O N T H R E V I E W O F T H E N A T I O N A L P A R T N E R S H I P A G R E E M E N T O N E A R L Y C H I L D H O O D
E D U C A T I O N
The Allen Consulting Group 14
National Quality Framework for Early Childhood Education and Care
COAG has agreed to a National Quality Framework for Early Childhood Education and Care that is being implemented progressively from July 2010 through the National Partnership Agreement on the National Quality Agenda for Early Childhood Education and Care (NP NQA), covering long day care, family day care, outside school hours care and preschools. A key component of this framework is the Early Years Learning Framework, which describes the principles, practice and outcomes essential to support and enhance young children’s learning from birth to five years of age, as well as their transition to school.
The National Quality Framework will put in place a new National Quality Standard to ensure high quality and consistent early childhood education and care across Australia. This will be achieved through:
• improved staff to child ratios to ensure each child gets more individual care and attention;
• new staff qualification requirements to ensure staff have the skills to help children learn and develop;
• a new quality rating system to ensure Australian families have access to transparent information relating to the quality of early childhood education and care services; and
• the establishment of a new National Body to ensure early childhood education and care is of a high quality.
In the 2008-09 Federal Budget, the Australian Government committed to a $126.6 million package of measures aimed at increasing the supply and quality of the early childhood workforce. The package includes the removal of TAFE fees for child care diplomas and advanced diplomas; additional early childhood education university places; and HECS-HELP Benefit for early childhood education teachers working in areas of high disadvantage.
Melbourne Declaration on Educational Goals for Young Australians
This declaration was released by State, Territory and Commonwealth Ministers of Education in December 2008, and sets the direction of Australian schooling for the next 10 years. It includes a commitment to supporting the development and strengthening of early childhood education.
Paid Parental Leave scheme
Australia’s first national Paid Parental Leave scheme commenced in January 2011, and provides eligible working parents with 18 weeks of parental leave pay at the national minimum wage.

E I G H T E E N M O N T H R E V I E W O F T H E N A T I O N A L P A R T N E R S H I P A G R E E M E N T O N E A R L Y C H I L D H O O D
E D U C A T I O N
The Allen Consulting Group 15
Children’s centres
The Australian Government is progressing the establishment of 38 Early Learning and Care Centres (ELCC). It has allocated $114.5 million over four years in the 2008-2009 Budget to establish the centres (including six Autism-specific centres). The funding includes both the capital costs and the ongoing costs of establishing additional child care places, including Child Care Benefit and the Child Care Rebate. While the focus of these centres is not primarily to deliver against the objectives of the NP ECE, they will support the ECE sectors in the communities in which they are built to provide ECE programs, consistent with government policy.
While not all of this funding will directly contribute to the achievement of Universal Access, some of it will have a positive impact, as the scope ELCC projects facilities such as 'early learning area', 'early education precinct', 'early years precinct', 'early learning classroom', 'early childhood learning facility', 'early childhood classroom' or 'early literacy library'. The Western Australian Government chose to devote a significant portion of the funding received under the Building the Education Revolution program on early childhood infrastructure, which has enhanced the state's implementation of the Universal Access strategy.
Implications for ECE sector
As the above overview of national policy initiatives shows, the NP ECE is not the only significant reform agenda currently being implemented in the ECE sector. A number of policy initiatives intersect and cause ECE services in all states and territories to prioritise effort and resources towards multiple, overlapping objectives.
One example of an area where the ECE sector is likely to feel pressure in meeting the overlapping objectives under different initiatives is with respect to the ECE workforce. The NP ECE is likely to significantly increase demand on the ECE workforce. The NP NQA is being implemented starting in 2014 and seeks to improve child:teacher ratios in early childhood services and provide for a qualified early childhood teacher in every long day care service with more than twenty-five licensed places. This will further increase demand for qualified ECE staff. Although initiatives such as the removal of TAFE fees for child care diplomas and advanced diplomas and additional early childhood education university places may go some way to meeting this demand in the future, in the short-term stakeholders in some jurisdictions (e.g. Victoria) are anticipating workforce shortages.
The cumulative impact of these reforms is significant, and will intensify as the different deadlines for the delivery of the NP ECE and NP NQA, in particular, approach. While the review acknowledges the complementary timelines built into the implementation, and the efforts at both state and territory and Australian government levels to ensure consistency between the NPs, the new requirements under different reforms may require service providers to entirely rethink their method of service delivery. In the absence of guidance from, for example, DEEWR, service providers may face difficulties in successfully implementing the necessary changes.
E I G H T E E N M O N T H R E V I E W O F T H E N A T I O N A L P A R T N E R S H I P A G R E E M E N T O N E A R L Y C H I L D H O O D
E D U C A T I O N
The Allen Consulting Group 16
2.4 Can it be done?
This section discusses whether states and territories are on track to achieving the objectives of the NP ECE. It is broken into the key focus areas of the NP:
• universal access — that is, the aspects of the NP that focus on ‘increasing participation rates (particularly for Aboriginal and Torres Strait Islander and disadvantaged children)’ and ‘increasing program hours’;
• workforce — in particular through the NP’s focus on ‘strengthening program quality and consistency’
• affordability — that is, ‘ensuring cost is not a barrier to access’; and
• convenience — that is, the aspects of the NP that relate to ‘fostering service integration and coordination across stand-alone preschool and child care’.
In summary, this review concludes that it is likely that the majority of jurisdictions will achieve the objectives of the NP ECE by the 2012-2013 implementation date. However, the challenges of delivering universal access across Queensland and Northern Territory are likely to prevent these jurisdictions from fully realising the objectives of the agreement during the time of the Agreement. This conclusion supports the significant progress made across the country — including Queensland and the Northern Territory — towards successfully implementing the Agreement, and recognises the scale of the challenge that the NP ECE represents. For all jurisdictions, the cost of achieving the NP’s objectives will be significant and will require the successful management of numerous economic, social, geographical, cultural and industrial barriers.
Universal access
The review has identified significant challenges that must be overcome in order for the national ECE sector to meet the objective of universal access. These challenges relate to:
• meeting infrastructure requirements;
• protecting other early childhood services; and
• promoting a common understanding of universal access; and
• universal access in remote and regional areas.
Meeting infrastructure requirements
Infrastructure represents a significant constraint on the capacity of the ECE sector in delivering against the objectives of the NP, for two reasons. First, the schedule of funding for the NP provides states and territories with relatively little in the early years of the Agreement, and significantly more in the final two years of the NP. Second, for infrastructure to be developed, capital must be provided with sufficient lead time to allow centres to be planned and constructed.
Finding:
The schedule by which the NP’s funding is distributed has not facilitated the capital investment required to meet infrastructure needs to achieve the NP’s objectives.

E I G H T E E N M O N T H R E V I E W O F T H E N A T I O N A L P A R T N E R S H I P A G R E E M E N T O N E A R L Y C H I L D H O O D
E D U C A T I O N
The Allen Consulting Group 17
Infrastructure
Significant regional variations exist in the quality and extent of early childhood education infrastructure in Australia. Stakeholders have observed that, while inner urban and established regional areas are often well served with ECE infrastructure, such infrastructure is less well developed in other areas — particularly in areas of high growth. In some jurisdictions, such as Queensland, stakeholders noted that in many areas where ECE infrastructure is not well developed, there was strong demand for long day care, but less demand for kindergarten. However, it is not clear whether demand is low in these areas because ECE infrastructure is not well developed, or whether infrastructure is not developed because demand is low.
Finding:
The need for additional preschool places to meet the goal of universal access will require additional infrastructure in some areas. A detailed analysis of infrastructure needs in those jurisdictions with low enrolment rates or with high geographic variations in enrolments would help target capital investment in infrastructure.
Protecting other early childhood services
Stakeholders observed that implementing the NP ECE could jeopardise the provision of other early childhood services. In particular, it was noted that the NP’s focus on children in the year prior to formal schooling had the potential to limit opportunities for younger children and children with special needs to engage in planned developmental programs. Stakeholders are concerned about this ‘crowding out’ because children who can benefit most from ECE, such as children from disadvantaged backgrounds, stand to gain most when they access quality ECE from a younger age. This is exemplified in a study undertaken by DEECD (Victoria), which estimates that around 37 per cent of services that currently provide structured developmental programs for three year old children would not be able to continue to provide such a program after implementing a fifteen hour per week ECE program for four year old children (DEECD unpublished).
Finding:
Providing more ECE to four year old children may prevent services from providing other early childhood services to younger children.
A reduction in ECE services for children younger than four years could have a negative impact on efforts to engage vulnerable children. A number of jurisdictions have specific programs for engaging vulnerable children in ECE at an earlier age than their other peers. For example, in South Australia and Victoria, Aboriginal children and children under public guardianship are eligible for government-funded ECE programs from the age of three — within in the existing network of three year old ECE programs.
Finding:
The NP’s focus on universal access could divert government and the sector’s efforts to engage the most vulnerable children at an earlier age in an effort to ensure comprehensive access for four year olds.

E I G H T E E N M O N T H R E V I E W O F T H E N A T I O N A L P A R T N E R S H I P A G R E E M E N T O N E A R L Y C H I L D H O O D
E D U C A T I O N
The Allen Consulting Group 18
While implementing the NP may limit opportunities for younger children to access some early childhood services, stakeholders noted that universal access might also impact on services that support children with special needs to access ECE. Several jurisdictions prioritise early intervention programs as a key support to smooth the transition to schooling for children who are identified with a developmental delay or disability. However, funding for the NP does not include specific support to assist children with a disability or other special need to access ECE. The implementation of a fifteen hour ECE program for all four year olds may therefore reduce the ECE programs available to children with disabilities. Research undertaken by DEECD in Victoria has found that 23 per cent of providers currently providing Early Childhood Intervention Services (ECIS) for children with special needs and their families alongside an ECE program would be unable to continue the ECIS component after implementing universal access (DEECD unpublished).
Finding:
Providing more ECE to four year old children may prevent services from providing other early childhood services to children with a disability or with special needs.
Promoting a common understanding of universal access
ECE is designed to achieve a number of outcomes for young children. Accordingly, the objectives of jurisdictions in implementing the NP ECE are multiple, and may relate to factors such as quality, participation and family choice. Thus, for certain jurisdictions, while emphasis has been given to the increase in provision of ECE to fifteen hours, this increase has not been promoted as an end in itself.
However, for some stakeholders, the objectives of the NP ECE seem to relate solely to the provision of fifteen hours of ECE for forty weeks a year. Furthermore, not all stakeholders share a common understanding of the evidence supporting the NP ECE and the need for 15 hours of ECE. Some government and sector stakeholders noted that it may not be practical for families or service providers to meet the requirement for 15 hours per week per child target under current program models. In particular, children who currently attend preschool for 12 hours per week would be offered an additional half a day — which may represent more of an inconvenience for some families. Given the potential to disrupt existing service patterns — and family arrangements — stakeholders suggested that neither the state/territory nor the Australian governments had articulated the benefits that would accrue from achieving the NP ECE’s objectives.
State and territory governments have been challenged to fully communicate the vision for ECE outlined in the NP, and stakeholders emphasised the importance of, and need to, communicate the benefits of the NP ECE to the broader community, through written or other information as part of a national campaign that educates families of the value of high-quality ECE. In particular, stakeholders observed that communication on the benefits of the NP ECE could help families to recognise good quality ECE when selecting service providers for their children.

E I G H T E E N M O N T H R E V I E W O F T H E N A T I O N A L P A R T N E R S H I P A G R E E M E N T O N E A R L Y C H I L D H O O D
E D U C A T I O N
The Allen Consulting Group 19
While the COAG National Early Childhood Development Strategy includes an agreed vision for early childhood many non-government stakeholders are unfamiliar with that vision. This unfamiliarity leads to perception that the numerous significant reforms to the ECE sector over recent years have lacked a single ‘narrative’. Stakeholders observed that there is an opportunity to promote the ‘vision’ for early childhood and the importance of early childhood education and its long-term outcome. Stakeholders noted that the vision for early childhood that is articulated to the broader community should not dwell on how ECE should be delivered, or in which settings, rather it should recognise that ECE should support families and their choices.
Finding:
There is an opportunity to promote the benefits of the NP ECE and the evidence on which it is based to the wider community.
Stakeholders have observed that a more flexible interpretation of the performance indicator relating to the NP ECE’s objective to increase the weekly attendance at ECE to fifteen hours would reduce the overall impact of the NP on the ECE sector. Some stakeholders suggested that rather than requiring each individual child to receive 15 hours preschool per week, that averaging attendance across a jurisdiction’s population or leveraging the hourly allotment for individual children across a year (e.g. 600 hours) might allow the sector to achieve the overall target of 15 hours of preschool per child per week more easily while at the same time providing more flexibility for families. However, any consideration of flexibility needs to be a balanced consideration of meeting the needs of children, fostering productivity and real constraints on service delivery.
Universal access in remote and regional areas
There is significant geographic variation in the existing capacity of service providers to supply ECE services. This presents challenges for implementing the NP ECE — and universal access in particular — in remote and regional areas. Implementing the NP ECE in these areas may require greater flexibility in the design and delivery of ECE services.
Queensland is one example of a large jurisdiction with a number of remote communities. Achieving universal access to early childhood education will require services to engage children and families who live a long way from existing kindergartens and long day care centres. Recognising this, innovative service models, such as mobile or outreach service models may be required to engage children and families in remote areas in ECE. For example, in 2008-09 the Queensland Government trialled an online, interactive outreach program where a qualified early childhood teacher engages with children online, supported by ongoing parent-led learning in children’s homes.
Difficulties in providing ECE services in remote areas have also been noted in Western Australia, such as in the very remote regions of Kimberley and Pilbara. There, the lack of schools in some locations means that a small number of young children have to travel long distances by school bus to access ECE services. In these remote areas there is a practice of providing multi-age classes comprising preschool and older children (by one or two years) to achieve the critical mass necessary to justify a full-time teacher in such localities.
E I G H T E E N M O N T H R E V I E W O F T H E N A T I O N A L P A R T N E R S H I P A G R E E M E N T O N E A R L Y C H I L D H O O D
E D U C A T I O N
The Allen Consulting Group 20
While programs such as the example that was trialled in Queensland may assist in achieving good outcomes for remotely located children and families, it is not clear that they are consistent with the current definitions for ECE programs as outlined in the NP ECE. There is a danger that inflexible application of NP ECE principles may impede the provision of quality ECE programs to children in remote locations.
Finding:
To fully implement the universal access commitment of the NP ECE — particularly in remote areas — services may require greater flexibility in the design and delivery of ECE services, and consideration of a range of service models and locations.
While stakeholders noted that increased flexibility is required in the interpretation of performance indicators, it should be noted that such flexibility would come at the cost of consistency in performance reporting. While the review notes work underway to improve national consistency of data, at present the performance measures against which progress against the NP’s objectives are determined are interpreted and reported inconsistently across all states and territories. As a consequence, it is not currently possible to undertake a systematic, econometric analysis of the effectiveness of jurisdictions’ progress against their NP ECE commitments.
Under the NP, the Commonwealth Government provides national leadership on issues relating to data development, research, and evaluation with respect to the Agreement. It is noted that the Commonwealth, states and territories are currently collaborating to address the issue of national consistency, under the auspices of the National Information Agreement on Early childhood Education and Care, including the completion of the first (transitional) national collection in 2010, to be published in 2011. It is anticipated that the 2011 national collection, to be published in 2012, will address many of the data consistency issues for the first time. That said, clear leadership and guidance will continue to be required to embed consistency in the treatment and interpretation of data reported under the NP.
Finding:
While individual state and territory performance is able to be tracked through the bilateral agreements and associated reporting arrangements, there is currently insufficient national consistency in data definitions, collections and interpretation.
The NP ECE’s focus on ‘universal’ access is, in part, intended to ensure that factors such as remoteness do not prevent children from accessing early childhood education. The universality of access is key, given that Aboriginal and Torres Strait Islander children are known to fare relatively worse than other children on a range of outcome measures (see for example, SCRGSP 2010, CCCH 2010, BCG 2008). Impediments to the provision of ECE to children in remote locations could, therefore, prevent children who would significantly benefit from attending ECE from accessing appropriate services. In particular, this could prevent the NP ECE from improving Aboriginal children’s access to ECE, given the large proportion on Aboriginal children who live in remote communities.

E I G H T E E N M O N T H R E V I E W O F T H E N A T I O N A L P A R T N E R S H I P A G R E E M E N T O N E A R L Y C H I L D H O O D
E D U C A T I O N
The Allen Consulting Group 21
Finding:
The NP’s focus on universal access may impede the provision of ECE to the most vulnerable children and families, especially those in remote areas.
While the NP ECE has encouraged service integration within the early childhood development sectors, stakeholders noted that it was less attuned to opportunities to integrate services more broadly. Stakeholders saw significant opportunities to leverage existing social service infrastructure — and to complement NP ECE funds with alternative sources — in regional and remote areas, where infrastructure could be used to deliver multiple social services.
This is particularly important given that the essential infrastructure to ensure the provision of ECE services — such as teacher housing — may be lacking in regional and remote areas.
Workforce
Workforce issues are likely to create significant challenges for the achievement of the NP’s objectives, and fall into two broad categories:
• anticipated workforce shortages from implementing the NP; and
• the interplay with other reforms to early childhood services.
Anticipated workforce shortages
Stakeholders in multiple jurisdictions have noted that the implementation of the NP is likely to lead to significant ECE workforce shortages. Specific examples are listed below.
• Victoria — the Victorian Government anticipates a shortage of around 39 per cent of the current ECE teaching and support workforce by 2012–13, as a result of implementing universal access requirements (Access Economics, unpublished).
• Queensland — stakeholders identified workforce issues as being potentially the most significant barrier to the successful implementation of the NP ECE, and few service providers expected to meet their anticipated workforce needs in this term of the NP. For this reason, many stakeholders have begun to explore alternative options for increasing the supply of qualified ECE staff, such as by encouraging currently unqualified staff to undertake further study.
• Western Australia — Western Australia has experienced workforce shortages and recruitment and retainment difficulties of qualified teachers for all school years, including early childhood education, for a number of years. Significant challenges exist due to the increasing numbers of teacher resignations (partially related to the booming economy and competition from the private sector) and retirement, combined with a decline in university teacher training enrolments and a predicted significant decrease in workforce population (15-65 year olds) between now and 2018 (Department of Education and Training 2008).

E I G H T E E N M O N T H R E V I E W O F T H E N A T I O N A L P A R T N E R S H I P A G R E E M E N T O N E A R L Y C H I L D H O O D
E D U C A T I O N
The Allen Consulting Group 22
• Northern Territory — workforce issues are potentially the most significant barriers to the successful implementation of the NP ECE, mainly due to the cost of providing staff in remote communities. Attracting qualified staff to deliver the preschool program in remote areas is problematic and expensive. Not only is it difficult to attract staff, there are also ongoing issues in housing availability for staff in remote environment. Remoteness can prevent staff from undertaking professional development, and can impact on retention rates in remotely located services.
The Commonwealth has initiated a program that provides HECS-HELP relief to early childhood teachers working in areas of high demand, as an incentive to attract and retain staff in remote or isolated areas. This may help address the workforce challenges faced in rural and remote areas.
Other factors that have been identified as potentially resulting in ECE workforce shortages include:
• increases in the size of the target group for ECE services;
• an ageing workforce — a large number of teachers will be reaching retirement age in the near future;
• a national market for a qualified workforce — a ‘brain drain’ may be expected from certain jurisdictions with qualified teachers taking up positions in other jurisdictions; in South Australia this was identified as a concern because (i) disparate industrial agreements offer higher salaries to teachers in other jurisdictions, and (ii) South Australian students already have to undergo a four-year training course in order to become registered teachers, and will therefore be in greater demand in other jurisdictions; and
• National Quality Agenda (NQA) requirements — the requirement that long day care services employ early childhood teachers from 2014 which may put some pressure on the supply of preschool teachers, particularly in remote and other difficult-to-staff locations (see section ‘Interplay with other reforms to early childhood services’ below).
Stakeholders noted that salaries for preschool teachers are likely to rise in response to workforce shortages, further increasing the challenge of implementing the NP efficiently.
Finding:
Implementing the NP (in conjunction with the NQA) is likely to put pressure on ECE workforce requirements.
More generally, stakeholders perceive that the increase in the number of staff required to deliver a 15 hour program may stretch the capacity of universities and other training providers to provide such training. To address this issue the 2008-09 Commonwealth Budget provided $53.9 million to create additional university places for early childhood education teachers, starting with 500 places in 2009 and rising to 1500 places by 2011. However, the impact of this initiative has yet to be assessed.

E I G H T E E N M O N T H R E V I E W O F T H E N A T I O N A L P A R T N E R S H I P A G R E E M E N T O N E A R L Y C H I L D H O O D
E D U C A T I O N
The Allen Consulting Group 23
Certain jurisdictions have managed to limit the potential of workforce shortages. For example, in its bilateral agreement, the Victorian Government secured a provision that transitional arrangements would continue to recognise existing three-year trained teachers in Victoria who hold an approved qualification under Victoria’s Children’s Services Regulations 2009. Given this provision, the Victorian Government has assumed that teachers who meet this criterion would not need to upgrade to a four-year qualification. Other stakeholders, however, expressed a desire for clearer guidelines on the type of qualifications that are appropriate under the NP in order to determine which universities and TAFE institutions offer the necessary qualifications
Finding:
A detailed analysis of the capacity of training providers to meet additional demand for ECE workforce development in the short to medium term should be completed.
The relative value of early childhood education vis-a-vis the broader, school based education system presents significant workforce issues for all states and territories. Many stakeholders observed that there appears to be a limited understanding of the value of early childhood teacher qualifications and/or the positive impact of qualified and competent early childhood educators on developmental and learning outcomes for young children among primary, secondary and tertiary educators. Although there is now a national Early Years Learning Framework and all states and territories have an early years curriculum framework in place there still exists differences between school based teachers and other early childhood teachers both in terms of the value placed on the provision of early childhood education and on the remuneration offered to teachers in the early childhood sector.3 For both reasons, stakeholders expressed concern that recent increases in the number of places in university teaching programs may not translate into additional teachers in the early childhood education workforce.
Finding:
The value of quality early childhood education in improving outcomes throughout life needs to be communicated broadly to help enhance the status of the ECE workforce.
Stakeholders observed that although teachers with higher qualifications will require higher remuneration, this has not been taken into account in the quantum of funding provided to jurisdictions under the NP. In some jurisdictions (e.g. Tasmania) this has been compounded by recent industrial agreements for teachers that have agreed additional pay rises.
3 In Queensland, remuneration of teachers in community kindergarten services is comparable with that provided
to state school teachers.

E I G H T E E N M O N T H R E V I E W O F T H E N A T I O N A L P A R T N E R S H I P A G R E E M E N T O N E A R L Y C H I L D H O O D
E D U C A T I O N
The Allen Consulting Group 24
Stakeholders in Queensland and Tasmania also noted that fifteen hour programs are inconsistent with current industrial agreements. Under current agreements, the provision of more than one ECE program for 15 hours per week by an individual teacher would breach the maximum working hour limit. Industrial relations issues may thus impact on future ECE sector capacity.4 Therefore, greater flexibility may be required in the design and delivery of the fifteen hour ECE programs to enable successful implementation of the NP.
With these significant issues, achieving the number of early childhood teachers required by the target date is considered to be ambitious. However, stakeholders also note that one of the benefits of the NP ECE has been to draw attention to the benefits of empowering early childhood educators in remote areas. The NP could also help to establish an evidence base for future service provision, by, for example, allowing service providers and policy makers to develop innovative service models that allow children and families, particularly those in remote areas, to access quality ECE programs.
Interplay with other reforms to early childhood services
As has been identified, implementing the NP is likely to lead to workforce pressures. However, the NP is not the only significant reform agenda currently being implemented in the ECE sector. In addition, the National Partnership Agreement on the National Quality Agenda for Early Childhood Education and Care (NP NQA) is being implemented over a similar period as the NP ECE and affects many of the same services as those impacted by the NP ECE.
Stakeholders observed that the concurrent preparation for the two NPs had a compounding effect on the workforce impacts described above and presented significant challenges for the sector — while the NP ECE was intended to increase the quantity of ECE, the NP NQA was simultaneously intended to improve service quality. For example, the NP NQA improves child:teacher ratios in early childhood services and provides for a qualified early childhood teacher in every long day care service with more than twenty-five licensed places. Both of these initiatives increase demand for qualified ECE staff. At the same time, and as discussed above, the NP ECE is likely to significantly increase demand on the ECE workforce, to the extent that stakeholders anticipate workforce shortages in the near future.
This cumulative impact of the reforms has been overwhelming to some stakeholders in the ECE sector. In particular, the multiple reforms have required teachers and other staff involved in service planning to rethink their models of service delivery. While ongoing service improvement is the goal of high performing organisations, stakeholders observed that little change management support has been provided to staff to guide them in their planning.
Finding:
The concurrent preparation for the NP ECE and NP NQA will be challenging for the sector due to the workforce impacts that will result. The sector may need additional change management support to guide them through the process of reform.
4 Notably in Queensland the current industrial agreement for community kindergarten services allows for a
maximum of 27.5 hours of direct educational instruction and a maximum of 37.5 hour working week.

E I G H T E E N M O N T H R E V I E W O F T H E N A T I O N A L P A R T N E R S H I P A G R E E M E N T O N E A R L Y C H I L D H O O D
E D U C A T I O N
The Allen Consulting Group 25
Definition of a four year trained early childhood teacher
There currently appears to be inconsistent interpretation of key terms in the ECE sector. Stakeholders observed that meaningful reporting against the NP ECE’s objectives is not possible in the absence of clear and consistent national definitions of key terms. While all jurisdictions have endorsed the National Minimum Data Set which outlines consistent data definitions, this has not translated into a clear understanding of the terms by the jurisdictions and their stakeholders in terms of their obligations under the NP.
Many stakeholders expressed a need for greater clarity on what constitutes a ‘four year trained’ early childhood teacher, noting that a precise definition of the NP ECE’s provisions relating to workforce training is a pre-condition to successful design and implementation of workforce development initiatives.
Finding:
Clarification of the NP ECE’s qualification requirements for ECE teachers is required.
Affordability
Many stakeholders observed that significant investments in resources and capital have already been made as a result of previous national and jurisdictional reforms of the ECE sector. The NP ECE — coming as it does along side the NP NQA — requires yet more of the sector. As a result of this succession of reforms, the sector is not in a position to absorb the cost of current reforms through productivity gains or efficiency improvements. Without additional support from either jurisdictional or Commonwealth governments, service providers would be forced to pass on cost increases to families — thereby reducing the affordability of ECE services. Specific concerns raised include:
• Victoria — service providers have recently incurred capital and resource costs in adhering to new space requirements introduced in 2007, and due to improvements in the ratio of staff to children as a result of 2009 regulations;
• South Australia — stakeholders noted that the current cost of ECE, which is low by national standards, already poses a barrier to access for vulnerable families, and are concerned that the additional requirements for service provision will increase both staff and infrastructure costs which may be difficult for providers to absorb; and
• Northern Territory — although government schools do not charge tuition fees, schools in the non-government sector may need to pass on some of the increase in costs to parents through higher fees; this may be critical for Catholic service providers who teach a significant number of Aboriginal and Torres Strait Islander children whose families will not be able to afford higher fees.
Finding:
Further work is required to understand the impact of the NP ECE on affordability for both services providers and families. ]

E I G H T E E N M O N T H R E V I E W O F T H E N A T I O N A L P A R T N E R S H I P A G R E E M E N T O N E A R L Y C H I L D H O O D
E D U C A T I O N
The Allen Consulting Group 26
Convenience
The final key focus area discussed in this section relates to convenience, and in particular the aspects of the NP that relate to ‘fostering service integration and coordination across stand-alone preschool and child care’.
Defining ‘integration’
In discussing integration with different stakeholders, it is clear that multiple — and often contradictory — definitions for ‘integration’ exist within the ECE sector. Many stakeholders describe ‘integration’ in the sense of ‘co-location’, where multiple services exist in a single place. When other stakeholders talk about ‘integration’, they describe services that are coordinated across different settings, or where children and families can be referred to a range of services — which may or may not be co-located — by accessing a single service. Additionally, many stakeholders do not consider ‘integration’ to pertain to ECE services only and, in fact, see integration with other services such as health to be an important component of a truly integrated service system.
Various forms of integration of ECE services are currently being implemented around the country as a result of market trends (e.g. parents demanding more flexibility) and policy changes (e.g. jurisdictional and Commonwealth initiatives) and directly as a consequence of the NP ECE. However, there remains confusion among jurisdictions and stakeholders on the ‘definition’ of integration as it pertains to the NP ECE. An opportunity exists to promote an agreed definition of ‘integration’ across the sector and the jurisdictions.
Finding:
Multiple understandings of ‘integration’ exist. A definition of what integration means in terms of the NP ECE should be articulated, documented and communicated to jurisdictions and stakeholders.
Supporting innovative and family friendly ECE service delivery
A number of stakeholders identified a need for more innovative and family-friendly ECE service delivery. Various jurisdictions have plans to address innovation in service delivery and the Commonwealth government is currently considering each of the proposals as part of the NP ECE process.
Examples of proposed changes include:
• Victoria — the Victorian Government is exploring options for improving the affordability of ECE through combining existing government subsidies and rebates in innovative ways. The Victorian Government — with Australian Government support — is seeking to establish trials where stand alone kindergarten services are able to access Child Care Benefit (CCB) and Child Care Rebate (CCR) to implement a ‘wrap around’ ECE model. In this way, children can participate in a quality ECE program in the kindergarten of their families’ choice, in a way that allows family members to work for a full working day. While these Victorian trials show that a ‘blurring’ between ECE and child care is possible, significant issues exist that prevent CCB and CCR being more widely available to support more innovative and family friendly delivery of ECE services (discussed further below).

E I G H T E E N M O N T H R E V I E W O F T H E N A T I O N A L P A R T N E R S H I P A G R E E M E N T O N E A R L Y C H I L D H O O D
E D U C A T I O N
The Allen Consulting Group 27
• Western Australia — Given the achievements in Western Australia to date providing universal access and achieving consistently high participation rates, it is considered that greater benefits could have been achieved had the funding under the NP been directed towards different objectives or allowed for greater flexibility in spending. Examples mentioned include the building of integrated service centres (one-stop-shop) that bring child care, education and health services together, as well as provision of early childhood education targeted at 0-3 year olds and vulnerable children.
Finding:
Further work is required to identify mechanisms by which to support innovative and family friendly ECE service delivery, using resources available to governments at all levels.
Funding structures
Current funding arrangements, which embed distinctions between ECE and child care, may prevent the practical integration of services across different settings. Significant issues exist that prevent CCB and CCR being more widely available to support more innovative and family friendly delivery of ECE services. For example, the definitions for CCB and CCR eligibility currently prevents ECE services from accessing Australian Government funding. In addition, the fact that CCB is means tested does not marry with funding arrangements in, for example, Victoria, where approved early childhood education programs can attract a standard per-child fee subsidy, regardless of their setting.
In a positive step toward addressing this issue, the Commonwealth government, as part of the NP ECE process, is considering all of the ideas from the jurisdictions on improving funding structures for ECE services. However, the difficulties exist ‘in the now’ and potentially hamper effective long term planning for integrated services.
This difficulty in improving integration is exemplified in the South Australian case. The South Australian Government is committed to providing wrap-around child care in preschools, that is care for children before and after preschool programs. In doing so, they aim for preschools to meet all CCB eligibility requirements, i.e. the services will operate for a minimum of eight hours a day, five days a week, forty-eight weeks per year. However, it is currently not possible to attract CCB for the wrap-around component only, which acts as a disincentive for centres to provide before and after preschool services. If a family were charged for a full day of child care/preschool, on the other hand, the service would be eligible for CCB and CCR. However, this is inconsistent with the South Australian government’s commitment to deliver preschool free of charge.
Finding:
As the NP ECE is implemented, consideration should be given to the interaction between the NP’s goals and funding arrangements and those of existing child care support arrangements.

E I G H T E E N M O N T H R E V I E W O F T H E N A T I O N A L P A R T N E R S H I P A G R E E M E N T O N E A R L Y C H I L D H O O D
E D U C A T I O N
The Allen Consulting Group 28
2.5 Conclusion — adequacy of funding and appropriateness of timelines for achieving the NP’s objectives
This chapter has summarised national progress toward the implementation of the NP ECE across all states and territories. It has considered the objectives of the NP, the activities undertaken so far in the NP’s implementation and whether the objectives of the NP are likely to be met during the term of the Agreement.
In summary, this review concludes that it is likely that the majority of jurisdictions will achieve the objectives of the NP ECE by the 2012-2013 implementation date. However, the challenges of delivering universal access across Queensland and Northern Territory are likely to prevent these jurisdictions from fully realising the objectives of the agreement during the time of the Agreement. This conclusion is not intended to ignore the significant progress made across the country — including in Queensland and the Northern Territory — towards successfully implementing the Agreement, but merely recognises the scale of the challenge that the NP ECE represents. For all jurisdictions, the cost of achieving the NP’s objectives will be significant and will require the successful management of many economic, social, geographical, cultural and industrial barriers.
This conclusion draws together the barriers that have been identified throughout the chapter in relation to two key considerations:
• the adequacy of funding to achieve the NP’s objectives; and
• the appropriateness of timelines to achieve the NP’s objectives.
Summary 1 — Adequacy of funding for achieving the NP’s objectives
As part of this review, the Allen Consulting Group was asked to consider whether the funding to support the NP ECE has been adequate to achieve the objectives of the Agreement. In consultation with Parties to the Agreement, however, it is evident that two questions emerge in relation to funding:
• Adequacy of funding — whether the overall funding allocated under the NP ECE has been adequate to achieve the objectives of the Agreement in 2012-13; and
• Sustainability of funding — whether the annual funding under the Agreement is likely to sustain the ongoing maintenance of the NP ECE's objectives beyond the term of the Agreement.
It should be noted that the second of these questions is beyond the scope of this review. However, it is possible to draw some conclusions on both the adequacy and sustainability of funding under the NP ECE by comparing the overall and annual funding under the NP with estimates of the likely recurrent cost of the Agreement in 2012–13. However, before outlining these conclusions, it is first necessary to discuss some of the issues emerging from the Allen Consulting Group's quantitative analysis of the funding supporting the NP ECE.
E I G H T E E N M O N T H R E V I E W O F T H E N A T I O N A L P A R T N E R S H I P A G R E E M E N T O N E A R L Y C H I L D H O O D
E D U C A T I O N
The Allen Consulting Group 29
Discussion of quantitative analysis
As was described in the Overview at the beginning of this report, the Allen Consulting Group has undertaken economic modelling to estimate the funding required to implement the NP ECE in 2012–13. This model was designed based on significant input from the Parties to the Agreement with all model elements and data sources agreed collectively. In building the model a collective decision was made to use data sources that would allow comparison between jurisdictions. ACG and the Parties to the Agreement acknowledge that jurisdictions may hold data that they believe to be more accurate for their given circumstance however, using this data would not allow the comparability needed for this review. The ACG model provides a foundation for all parties to the agreement to use in subsequent negotiations and has the flexibility to incorporate jurisdictional specific data should that be warranted outside this review.
As has been noted, the modelling sums the hours required to provide ECE to four year old children who do not currently access ECE in YBFS (the increase in participation resulting from the ‘universal access’ commitment of the NP) and the additional hours required by children who already access a kindergarten program (the ‘fifteen hours commitment’ of the NP) to derive a total additional recurrent cost of implementing the Agreement in 2012–13.
Further, the Allen Consulting Group’s modelling includes two scenarios. First, it estimates the likely expenditure on ECE in each state and territory (from both government and private sources) had the NP ECE not been agreed. This scenario is the ‘baseline’, on which estimates of the likely cost of implementing the NP are based.
Table 2.3 lists the key variables and outputs in the baseline scenario. The Allen Consulting Group’s analysis estimates that the average cost per child per hour of ECE delivered would have increased in 2012–13, even without the introduction of the NP ECE, to the extent that, across Australia, total annual recurrent expenditure on ECE (from both public and private sources) would increase from $828 million in 2007–08 to $1,040 million in 2012–13.
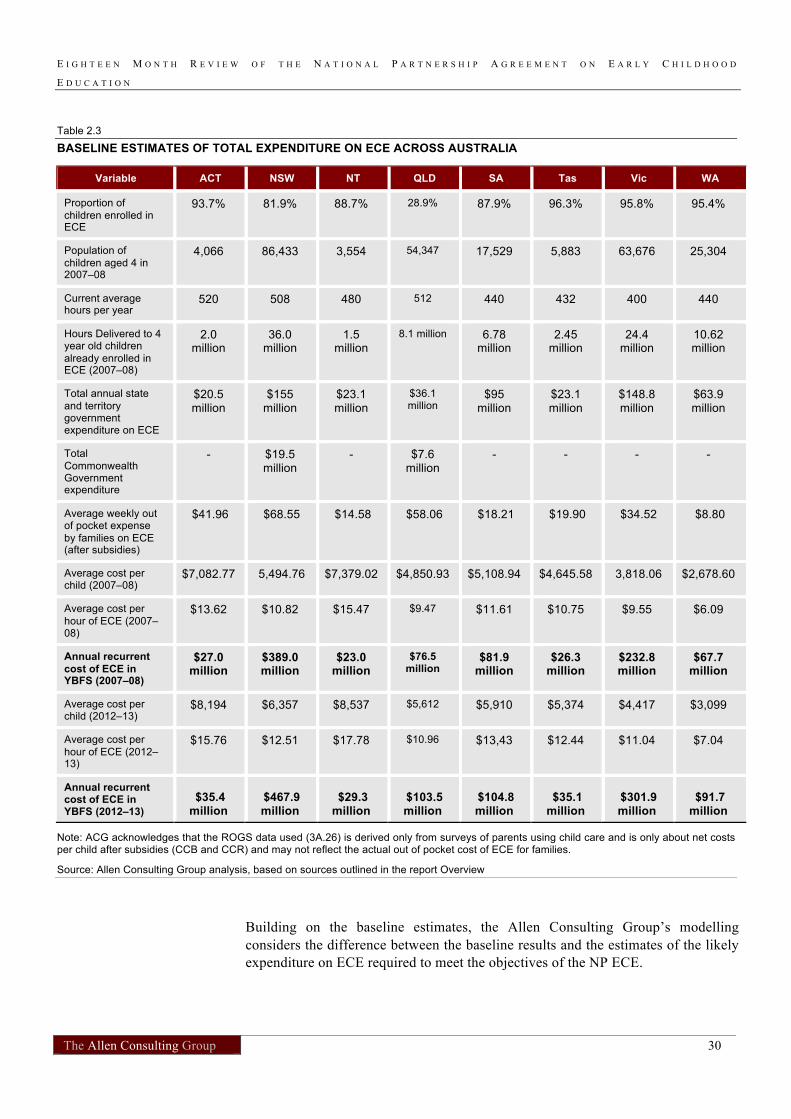
E I G H T E E N M O N T H R E V I E W O F T H E N A T I O N A L P A R T N E R S H I P A G R E E M E N T O N E A R L Y C H I L D H O O D
E D U C A T I O N
The Allen Consulting Group 30
Table 2.3
BASELINE ESTIMATES OF TOTAL EXPENDITURE ON ECE ACROSS AUSTRALIA
Variable ACT NSW NT QLD SA Tas Vic WA
Proportion of children enrolled in ECE
93.7% 81.9% 88.7% 28.9% 87.9% 96.3% 95.8% 95.4%
Population of children aged 4 in 2007–08
4,066 86,433 3,554 54,347 17,529 5,883 63,676 25,304
Current average hours per year
520 508 480 512 440 432 400 440
Hours Delivered to 4 year old children already enrolled in ECE (2007–08)
2.0 million
36.0 million
1.5 million
8.1 million 6.78 million
2.45 million
24.4 million
10.62 million
Total annual state and territory government expenditure on ECE
$20.5 million
$155 million
$23.1 million
$36.1 million
$95 million
$23.1 million
$148.8 million
$63.9 million
Total Commonwealth Government expenditure
- $19.5 million
- $7.6 million
- - - -
Average weekly out of pocket expense by families on ECE (after subsidies)
$41.96 $68.55 $14.58 $58.06 $18.21 $19.90 $34.52 $8.80
Average cost per child (2007–08)
$7,082.77 5,494.76 $7,379.02 $4,850.93 $5,108.94 $4,645.58 3,818.06 $2,678.60
Average cost per hour of ECE (2007–08)
$13.62 $10.82 $15.47 $9.47 $11.61 $10.75 $9.55 $6.09
Annual recurrent cost of ECE in YBFS (2007–08)
$27.0 million
$389.0 million
$23.0 million
$76.5 million
$81.9 million
$26.3 million
$232.8 million
$67.7 million
Average cost per child (2012–13)
$8,194 $6,357 $8,537 $5,612 $5,910 $5,374 $4,417 $3,099
Average cost per hour of ECE (2012–13)
$15.76 $12.51 $17.78 $10.96 $13,43 $12.44 $11.04 $7.04
Annual recurrent cost of ECE in YBFS (2012–13)
$35.4 million
$467.9 million
$29.3 million
$103.5 million
$104.8 million
$35.1 million
$301.9 million
$91.7 million
Note: ACG acknowledges that the ROGS data used (3A.26) is derived only from surveys of parents using child care and is only about net costs per child after subsidies (CCB and CCR) and may not reflect the actual out of pocket cost of ECE for families.
Source: Allen Consulting Group analysis, based on sources outlined in the report Overview
Building on the baseline estimates, the Allen Consulting Group’s modelling considers the difference between the baseline results and the estimates of the likely expenditure on ECE required to meet the objectives of the NP ECE.

E I G H T E E N M O N T H R E V I E W O F T H E N A T I O N A L P A R T N E R S H I P A G R E E M E N T O N E A R L Y C H I L D H O O D
E D U C A T I O N
The Allen Consulting Group 31
Table 2.4 details the key outputs of the Allen Consulting Group’s modelling. The total estimated recurrent costs of meeting the NP ECE’s objectives are anticipated to be $638 million in 2012–13. This includes the $392 million to be distributed to states and territories in 2012–13 under the Agreement.
Table 2.4
RECURRENT COSTS REQUIRED TO ACHIEVE NP ECE OBJECTIVES ACROSS AUSTRALIA
Variable ACT NSW NT QLD SA Tas Vic WA
Hours required for 4 year old children not enrolled in ECE at all
0.03 million
7.06 million
0.1 million
25.2 million
0.7 million
0 0 0
Additional hours required for 4 year old children already enrolled
0.3 million
4.8 million
0.4 million
1.6 million
2.8 million
1.0 million
12.8 million
4.7 million
Total additional hours per year
0.3 million
11.87 million
0.5 million
26.8 million
3.7 million
1.0 million
12.8 million
4.7 million
Additional recurrent cost of NP ECE
$5.3 million
$148.6 million
$10.0 million
$293.9 million
$49.6 million
$12.8 million
$141.1 million
$33.3 million
2012-13 funding from the NP ECE
$7.1 million
$137.9 million
$5.9 million
$97.6 million
$30.9 million
$10.4 million
$109.5 million
$47.6 million
Note: ACG acknowledges that the ROGS data used (3A.26) is derived only from surveys of parents using child care and is only about net costs per child after subsidies (CCB and CCR) and may not reflect the actual out of pocket cost of ECE for families.
Source: Allen Consulting Group analysis, based on sources outlined in the report Overview
It should be noted, however, that the estimates outlined in Table 2.4 relate only to recurrent costs and do not consider other costs that might have a material impact on implementing the NP. Across Australia, stakeholders noted that three considerations could be relevant in implementation, in ways that might increase the cost of achieving the objectives of the Agreement. In discussions about the NP, stakeholders have used the concept of ‘implementation costs’ to describe these effects.
First, and as this chapter has highlighted, infrastructure costs and expenses relating to workforce could significantly increase the total cost of implementing the Agreement. The estimates in Table 2.4 do not take into account the cost of capital of expanding the facilities available to kindergarten programs in the state.
Second, estimates also ignore the likely increases in workforce costs that would result from the initiatives in both the NP and the NP NQA to improve the quality of the ECE workforce. The NP NQA requirements will not impact the sector until after 2013 but as teacher qualifications gradually improve, the cost of employing and retaining staff in the sector would increase. Moreover, stakeholders observed that the NP will exacerbate ECE workforce shortages, since it will require additional staff in a sector where staff are already in high demand. As a result, qualified staff will be in a strong position to negotiate improvements in salaries and conditions.

E I G H T E E N M O N T H R E V I E W O F T H E N A T I O N A L P A R T N E R S H I P A G R E E M E N T O N E A R L Y C H I L D H O O D
E D U C A T I O N
The Allen Consulting Group 32
Third, many communities across Australia are remote, and stakeholders observed that the cost of service provision in remote areas is significantly higher than in urban centres. Further, a number of stakeholders identified the significant challenge of encouraging ‘hard to reach’ children and families to enrol in ECE. In this context, ‘hard to reach’ can be interpreted as suggestive of the social, cultural, economic and cultural barriers that may prevent children and families from accessing any service, the logic being that the ‘harder to reach’ children are, the costlier it is to provide them with services.
There is some evidence to support this view. In developing the National Child Development Strategy, the Boston Consulting Group (2008, p. 25) observed that per child government expenditure is lower for children in non-metropolitan locations than for children in metropolitan areas. In part, and as BCG (2008) also observes, the difference in government expenditure on children in non-metropolitan areas may be a function of the limited supply of services in those areas. The smaller populations in these areas may not provide viable markets to sustain service providers. Consequently, additional subsidies may be required in these areas to support provision of universal services.
This section has considered a number of ‘implementation costs’, relating to the variable social, cultural and geographic conditions within which ECE is delivered. However, estimating the value of these ‘implementation costs’ across Australia is difficult, since they are driven, at least in part, by the different strategies adopted by state and territory governments to implement the NP. Accordingly, the Allen Consulting Group has relied on indicative estimates of both capital and workforce costs from the Australian Government, based on inputs from state and territory governments to inform decision making about the additional resources that might be required above the recurrent costs outlined in Table 2.4. Table 2.5 summarises the results of this analysis.

E I G H T E E N M O N T H R E V I E W O F T H E N A T I O N A L P A R T N E R S H I P A G R E E M E N T O N E A R L Y C H I L D H O O D
E D U C A T I O N
The Allen Consulting Group 33
Table 2.5
IMPLEMENTATION COSTS ACROSS AUSTRALIA
Variable ACT NSW NT QLD SA Tas Vic* WA
Cost of installing extra capital in 2012–13 (2007–08 prices)
$0.4 million
$88.3 million
$1.8 million
$91.4 million
$10.7 million
$25 million
$273.0 million
$0
Recurrent cost of extra physical capital (2012–13 prices)
- $6.7 million - $6.6 million
$0.5 million - - $0
Additional salary in 2013 (10% salary premium of $4,599.30) (QLD: Number of additional four year trained teachers: the lower range: 970; upper range: 1,580)
$0.2 million
$4.3 million $0.4 million
Range: $4.5 – $7.3 million
$1.3 million - $0.9 million
$0.5 million
Notes: ACG acknowledges that in New South Wales' view, the recurrent teacher salary premium is underestimated. However, the Commonwealth has applied a nationally consistent method in estimating the salary premium for each jurisdiction. Data from the National Early Childhood Education and Care Workforce Census regarding the number of teachers required to deliver UA and the qualifications of existing teachers, may be more suitable than the sources proposed by the Commonwealth. However, data from the Census will become available after the submission of the Final Report by ACG and so can only be considered at a later stage.
Estimates of teacher salary premiums in the Northern Territory were note received in time to be included in the final report.
The Victorian estimate for capital cost is based on PricewaterhouseCoopers analysis commissioned by the Victorian Government and is not comparable with figures in other states and territories.
Source: DEEWR, email correspondences on 13 December 2010, and PricewaterhouseCoopers modelling commissioned for the Victorian Government (PwC 2010), Department of Education, email correspondence on 13 December 2010, based on method outlined in the report Overview
However, the concept of ‘implementation costs’ has not been well defined by Parties to the Agreement, and several issues emerge in thinking through this idea.
First, as the discussion about the architecture of the NP ECE highlights, the funding to support the Agreement allowed significant flexibility to Parties. As such, jurisdictions could use — and in Victoria’s case, have used — the funding available under the Agreement to support a capital improvement program.
Second, in suggesting that infrastructure costs be incorporated into the funding for the NP ECE, Parties have ignored the funding mix that typically supports any capital program. In general, capital is funded through a combination of equity and debt. As such, the cost of capital refers not to the value of the asset, but to the cost of servicing that asset over a given period. As such, a robust estimate of infrastructure costs would reflect the amortisation effects of asset values, rather than assuming that the total infrastructure costs occur at once, at the beginning of the Agreement.
Finally, ‘implementation costs’ result from the concurrent preparation for a number of National Partnership Agreements. For example, both the NP ECE and the NP NQA will contribute to increases in both capital and workforce costs. As such, it may not be possible to attribute these implementation costs between NPs with precision. However, it is reasonable to suggest that not all of the anticipated increase in capital and workforce costs would be attributable to the NP ECE.
E I G H T E E N M O N T H R E V I E W O F T H E N A T I O N A L P A R T N E R S H I P A G R E E M E N T O N E A R L Y C H I L D H O O D
E D U C A T I O N
The Allen Consulting Group 34
This notwithstanding, the review acknowledges stakeholders' observations that, particularly in jurisdictions with 'mixed markets' for ECE, no single actor in the ECE sector is solely responsible for infrastructure. In particular, the role of local governments in planning and developing early childhood infrastructure is significant in some jurisdictions. For example, and as the review heard in consultations in more than one jurisdiction, some local governments provide ECE facilities for 'peppercorn' rents to community service organisations, effectively subsidising ECE provision in some local areas. While the methodology outlined in Chapter 1 includes private contributions to ECE through parental fees, it does not incorporate subsidies (either implicit or explicit) from local government or other private actors, in large part because little evidence exists on the extent or value of such subsidies. To this end, significant further work will be required to fully represent all contributions to the ECE sector in the Allen Consulting Group's model.
In addition, the Allen Consulting Group's modelling does not take into account the variable cost of ECE service delivery in different areas due to differences in social, cultural, economic and geographic conditions. This review concludes that further work is also required to understand the variable costs of service provision across the country. Such work would provide a framework for Parties to the Agreement to resolve outstanding issues relating to the definition of an 'affordable' cost of ECE in different locations.
Having considered these issues, it is possible to draw conclusions on both the adequacy and sustainability of funding.
Conclusions on adequacy of funding
On the question of adequacy of funding, this review considers that the funding supporting the implementation of the NP in all states and territories is adequate for achieving the objectives of the Agreement. It reaches this conclusion by comparing the estimated cost of achieving the objectives of the NP ECE with the total funding distributed under the Agreement (see Figure 2.2). This analysis assumes that the funding to support the Agreement is intended to achieve a single set of outcomes at a single point in time — the NP's 2013 implementation date. On this reading of the question of adequacy, and as Figure 2.2 illustrates, the funding to achieve the NP's objectives is greater than the anticipated recurrent cost of the Agreement in 2012–13 in all but one jurisdiction. In Queensland, the funding supporting the achievement of the NP is equivalent to 86 per cent of the estimated recurrent cost of the NP in 2012–13. Given that state and territory governments are partners in the NP and are, with the Australian Government, contributing to the achievement of the NP's objectives, it is reasonable to conclude that the funding under the NP ECE is adequate to achieve the Agreement's objectives in 2012–13. This finding is further supported by recent data reported in the Report on Government Services (RoGS) 2011 which shows that, with the exception of Queensland, when growth in State and Territory recurrent expenditure on early childhood education between 2007-2008 and 2009-10 is taken into account, the difference between total government funding and the recurrent cost of the NP ECE in 2012-13 declines considerably.

E I G H T E E N M O N T H R E V I E W O F T H E N A T I O N A L P A R T N E R S H I P A G R E E M E N T O N E A R L Y C H I L D H O O D
E D U C A T I O N
The Allen Consulting Group 35
Figure 2.2
COMPARISON OF TOTAL NP ECE FUNDING AND EXPECTED COSTS, INCLUDING ‘IMPLEMENTATION COSTS’
Note: Implementation costs have been amortised and show the interest payable in one year on the total value of anticipated implementation costs.
Source: Allen Consulting Group analysis, using method described in report Overview.
However, in all these states and territories significant implementation issues are anticipated, driven by likely increases in capital, workforce costs and — for the Northern Territory, Queensland, South Australia and Western Australia — challenges relating to the provision of ECE in remote locations.
It is important to recognise that not all contributions into the ECE sector are represented in Figure 2.2. While the column showing the total NP ECE funding represents the Australian Government's contribution to the Agreement, the difference between that figure and the estimated additional recurrent cost of the NP ECE will come from a combination of sources, including state and territory governments, local governments and families. While it is beyond the scope of this review to recommend an appropriate 'split' between the contributions made by different sources in ECE in Australia, it is hoped that the modelling method and analysis of issues outlined in this report will assist Parties to the Agreement to frame their negotiations by highlighting the most critical issues concerning the NP ECE.
Conclusions on sustainability of funding
On the question of sustainability of funding, the review considers that the funding provided in any given year under the Agreement would be insufficient to sustain the level of service provision required to meet the objectives of the NP ECE beyond 2012–13 in Queensland, the Northern Territory and possibly South Australia.
Figure 2.3 compares the estimated additional recurrent and implementation costs of meeting the NP ECE’s objectives with the final year's funding under the Agreement for each jurisdiction. In Queensland and the Northern Territory, the 2012-13 funding under the Agreement is lower than the estimated recurrent cost of achieving the NP's objectives by 67 per cent and 41 per cent respectively. In South Australia, the equivalent shortfall is around 38 per cent, while in the ACT and WA, the 2012-13 NP ECE funding is greater than the estimated recurrent cost of achieving the Agreement's objectives by 35 per cent and 43 per cent, respectively.

E I G H T E E N M O N T H R E V I E W O F T H E N A T I O N A L P A R T N E R S H I P A G R E E M E N T O N E A R L Y C H I L D H O O D
E D U C A T I O N
The Allen Consulting Group 36
Figure 2.3
COMPARISON OF 2012-13 NP ECE FUNDING AND ESTIMATED RECURRENT AND IMPLEMENTATION COSTS POST IMPLEMENTATION
Note: Implementation costs have been amortised and show the interest payable in one year on the total value of anticipated implementation costs.
Source: Allen Consulting Group analysis, using method described in report Overview.
If the annual funding to support the NP ECE is less than the estimated cost of delivering the services required to meet the Agreement, other actors in the ECE sector — including state and territory governments, local governments, community services organisations and families — would be required to make significant contributions to the achievement of the Agreement's objectives.
Discussion of qualitative analysis
The qualitative analysis outlined throughout this chapter — based on consultations with government and industry stakeholders — contextualises the conclusions drawn in the Allen Consulting Group’s modelling of the anticipated costs of the NP.
As has been noted, stakeholders in a number of jurisdictions observed that there are significant costs that have to be incurred in the implementation of the NP — such as the cost of staff and funding for improving data collection — that have not been reflected in funding to support the Agreement. Infrastructure needs are particularly high in some states. In Queensland, for example, infrastructure needs are significant in areas where demand for ECE is currently low. Stakeholders in the state observed that if the objectives of the NP are successfully met, and the ECE participation rate increases to around 95 per cent, it is very unlikely that there will be sufficient ECE capacity in all areas across the state. In particular, stakeholders observed that children in remote communities were unlikely to enjoy universal access to ECE in the same way as children in more densely populated areas, due to a combination of the inadequacy of funding to support remote services provision and a lack of flexibility that prevents providers from developing innovative service models to deliver ECE in remote areas at a lower cost. Recognising this, the Queensland Government has allocated an additional $321 million in capital spending to support the NP ECE.

E I G H T E E N M O N T H R E V I E W O F T H E N A T I O N A L P A R T N E R S H I P A G R E E M E N T O N E A R L Y C H I L D H O O D
E D U C A T I O N
The Allen Consulting Group 37
Related to this, the funding modalities present issues for some states and territories as they implement the NP. The bulk of the funding for the NP ECE is provided late in the implementation period, and may impact on the roll-out of activities that will contribute to the NP’s implementation. For example, because of the low initial investment, capital works to support the NP’s implementation will begin in 2012 at the earliest (although some jurisdictions, including Queensland, have independently funded capital programs with earlier implementation schedules). In addition, schools are also keen to receive assurances that the Universal Access commitment to July 2013 from the Commonwealth will be maintained beyond that period.
Stakeholders — particularly in those states where a ‘mixed market’ system of early childhood education and care predominates — anticipate that implementing the NP ECE will significantly reduce the affordability of early childhood education. Given that one of the objectives of the NP is to improve access to and quality of ECE ‘at a cost that is not a barrier to access’ (COAG 2008), the anticipated reduction in overall ECE affordability places the achievement of Agreement’s objectives at risk.
Related to this, stakeholders in NSW, Queensland and Victoria emphasised the need to clearly define the provision in the NP relating to ‘cost that is not a barrier to access’ (COAG 2008). This provision as currently articulated allows for multiple — and inconsistent — interpretations.
Stakeholders in South Australia, Western Australia, Queensland and the Northern Territory argued that the funding to provide the additional hours of preschool will not be sufficient to meet the NP objectives if a single model of delivery is imposed, that is, if all fifteen hours have to be delivered face-to-face. Stakeholders expressed concerns that in very remote areas, in particular, workforce shortages and cost may prevent a face-to-face model of service delivery from being implemented.
Related to this, stakeholder observed that although the Northern Territory is currently pioneering in the ECEC area, the Territory’s success in its innovation efforts in ECEC is mainly due to the pilot arrangements that were funded by other sources than the NP. For example, there has been some additional funding from the Northern Territory Government into the Early Childhood sector, through the Closing the Gap effort, and this has allowed significant innovation to occur which has supported the delivery of the NP ECE.
In the ACT, stakeholders noted that funding from the NP has been allocated to preschools, but not long day care and other services — where a significant proportion of children access ECE. According to stakeholders, prioritising one setting over another in funding allocation decisions may risk undermining the achievement of the NP objectives to ‘foster service integration and coordination across stand-alone preschool and child care’ and deliver universal access across a range of settings.

E I G H T E E N M O N T H R E V I E W O F T H E N A T I O N A L P A R T N E R S H I P A G R E E M E N T O N E A R L Y C H I L D H O O D
E D U C A T I O N
The Allen Consulting Group 38
Finally, Western Australian stakeholders noted that the continuity and sustainability of funding is an issue. The concurrent preparations for the NP ECE and the NP NQA have stretched the resources of the ECE sector in the state. As such, stakeholders noted that strategies should be identified to find the most efficient mechanism by which to achieve the objectives of each Agreement. Stakeholders had observed that a combined National Agreement that drew together the resources of multiple NPs and ongoing commitments from governments at all levels, would provide the resources and focus for jurisdictions to achieve their own, and national policy objectives in a way that respected local ECE contexts and family needs.
Summary 2 — Appropriateness of timelines for achieving the NP’s objectives
While the Allen Consulting Group’s analysis of the adequacy of funding has been based on both economic analysis and the opinions of stakeholders, it has not been able to rely on forecasting or other similarly ‘objective’ methodologies to determine the appropriateness of the Agreement’s timelines. Any estimate of the appropriateness of timelines is necessarily subjective, and as such, the Allen Consulting Group has relied significantly on the qualitative component of the eighteen month review.
On the basis of that qualitative research, this review considers that that states and territories’ progress to date in implementing the NP ECE have been appropriate. However, this review also considers that the timelines of the Agreement are likely to be too short for the Northern Territory and Queensland to fully realise the objectives of the Agreement, given the significant challenge in achieving universal access — in particular, in remote communities — for these jurisdictions.
Further, this review considers that all jurisdictions have acted in good faith in implementing the Agreement, despite the significant challenge that the NP represents. All jurisdictions have made significant and laudable progress in their implementation efforts, and it is important — and appropriate — to sustain the considerable momentum that has built up in each jurisdiction’s ECE sector since the Agreement was signed.
Across all states and territories, stakeholders observed that workforce issues represent a significant challenge. Stakeholders note that implementing the NP is likely to lead to significant ECE workforce shortages. Further, the combined NP ECE and NP NQA reforms have created twin demand drivers for early childhood education training, such that training providers may not be able to meet additional demand for ECE workforce development in the short and medium terms. In the view of stakeholders it would be beneficial for the Parties to undertake additional analysis of early childhood education workforce demand and supply.
Stakeholders in a number of states and territories also observed that there is a danger that driving the sectors in each jurisdiction too quickly towards the objectives of the NP ECE may create incentives for service providers that potentially worsen outcomes for children. By potentially reducing opportunities for younger children and children with a disability or special need, implementing universal access to ECE programs for four year olds could undermine efforts to engage children and families who are at most risk of developmental vulnerabilities.

E I G H T E E N M O N T H R E V I E W O F T H E N A T I O N A L P A R T N E R S H I P A G R E E M E N T O N E A R L Y C H I L D H O O D
E D U C A T I O N
The Allen Consulting Group 39
In particular, stakeholders noted that there may be regional variations in the capacity of local communities to deliver on the NP. As such, there is a danger that by promoting ‘universal access’ to a specific vision of ECE, the Agreement could overextend the ECE sectors in each jurisdictions, leading some providers — particularly in remote areas — to withdraw. Stakeholders suggest that the timelines, rather than the funding, create the greatest challenges for providers. However, as with the question of the adequacy of funding, greater flexibility in the mode of service provision may allow services to meet the objectives of the NP within the agreed timelines as long as that flexibility does not compromise the quality of education children receive..
Stakeholders also observed that key definitions are required at the national level in order for governments to progress priority actions to implement the NP ECE. In particular, clarity is required on the precise (nationally agreed) interpretation of ‘fifteen hours’, ‘four year, early childhood trained’ teacher, and ‘integration’. In the absence of such clarification, sectors in different jurisdictions risk developing strategies to implement the NP in ways that are inconsistent with strategies adopted elsewhere.
Stakeholders noted that many of the major issues relating to the timely achievement of the NP ECE objectives — including those relating to the supply of the ECE workforce, the additional expenditure required and the integration of early childhood education with other services — require collaboration between governments, providers, workers and the community. No one actor in ECE can act alone to achieve specific outcomes. As such, the successful implementation and maintenance of the NP will require negotiation and compromise between the state and territory and Australian Governments, sector stakeholders and families.
Related to this, the absence of a clear ‘narrative’ and the lack of communication of evidence relating to the NP ECE could prevent governments from harnessing the considerable energy and drive within the ECE sectors across Australia. Stakeholders articulated a clear frustration at the limited consultation and data analysis that was undertaken prior to the NP ECE being announced. Consequently, an opportunity exists to inspire the ECE sector in Australia by articulating the existing vision for ECE and by communicating the evidence for investing in ECE in the way the NP outlines as a means to achieving that vision.

E I G H T E E N M O N T H R E V I E W O F T H E N A T I O N A L P A R T N E R S H I P A G R E E M E N T O N E A R L Y C H I L D H O O D
E D U C A T I O N
The Allen Consulting Group 40
Appendices Jurisdictional summaries

E I G H T E E N M O N T H R E V I E W O F T H E N A T I O N A L P A R T N E R S H I P A G R E E M E N T O N E A R L Y C H I L D H O O D
E D U C A T I O N
The Allen Consulting Group 41
Appendix A
ACT
A.1 Overview of early childhood education in ACT
Early childhood education (ECE) or preschool in ACT is the non-compulsory year of part-time education the year before Kindergarten and is principally offered to children aged four years. A significant proportion of children in ACT access ECE at the age of four through public preschools that are amalgamated with primary schools, or within child care settings such as long day care. The ACT Government does not charge tuition fees for preschool education. ACT public school preschool units have consistently had a high enrolment rate with 87.3 per cent of the total preschool enrolments captured in the ACT February 2010 Schools Census in public school preschool units — noting that ECE participation rate for ACT is at 94 per cent (DET 2010).
ECE in the ACT is also delivered in the independent preschool and Catholic school sectors and in some cases in long day care settings. Currently, there are nine independent schools offering preschool education, eight of which already provide fifteen hours or more of preschool education. Conversely, Catholic schools previously did not have preschool education programs but have commenced an initiative to open new preschool units across Canberra.
In ACT, preschool is seen by most parents as a common and welcome part of childhood. So common is it for ACT children to attend preschool, many families would not know that preschool was not compulsory. The ACT Government has a strong commitment to early childhood, which is evident through its significant investments in preschool education ($22 million in 2009) in recent years and provision of free access to twelve hours of public preschool per week (ACT Government 2010b).
In terms of employment patterns, ACT has the highest female workforce participation in Australia. Consequently, a high proportion of young children attend child care — approximately 50 per cent of ACT children live in families with both parents employed and 42 per cent of 0–5 year olds use formal child care (ACT Government 2010a).
The ACT Government has recently provided significant funding ($15.5 million) to transform four existing school sites into Early Childhood Schools, drawing from successful practice and a strong research and evidence base supporting an integrated pathway from child care and preschool through to year 2. The schools are designed to provide access to quality education, child care, and health and community support services for children from birth through to year 2 and their families. Crèche and Kindergarten (C&K) Association of Queensland, a private provider, has been selected by the ACT Government to provide the child care services component of the Early Childhood Schools.
Figure A.1 further elaborates on the characteristics of the ACT ECE sector and achievements of ACT against the targets in the Bilateral Agreement for the NP ECE. In particular, it shows:

E I G H T E E N M O N T H R E V I E W O F T H E N A T I O N A L P A R T N E R S H I P A G R E E M E N T O N E A R L Y C H I L D H O O D
E D U C A T I O N
The Allen Consulting Group 42
• ACT’s achievements as a percentage of the targets for average hours of ECE provided per week, participation rates (for all children, disadvantaged children and Indigenous children) and proportion of teachers who are four year university trained and EC qualified;
• the cost of ECE for families (after subsidies) which is a qualitative, three scale rating of the average weekly cost of ECE, where low is between $0 and $5, medium is between $5 and $15 and high is over $15; and
• the percentage of licensed and/or registered preschool providers, by management type.
It shows that the ACT is very close to achieving the universal access objective (i.e. 95 per cent participation rate for all children) and the dominance of the school system in the provision of ECE in the ACT. In addition, a relatively high proportion of the ECE workforce in ACT is four year trained, and the cost of ECE is very low by national standards. However, ACT does face some challenges in engaging Aboriginal and Torres Strait Islander children in ECE. The ACT acknowledges that Aboriginal and Torres Strait Islander families are accessing a range of programs across Early Childhood settings, although the small numbers of Aboriginal and Torres Strait Islander children in the ACT suggest that data should be analysed carefully to exclude the possibility of data volatility.

E I G H T E E N M O N T H R E V I E W O F T H E N A T I O N A L P A R T N E R S H I P A G R E E M E N T O N E A R L Y C H I L D H O O D
E D U C A T I O N
The Allen Consulting Group 43
Figure A.1
SNAPSHOT OF AUSTRALIAN CAPITAL TERRITORY’S ECE SYSTEM IN 2009
Note: Hours shows the average hours per week as a percentage of the 15 hours target for 2012–13; Participation shows the participation rates for all children, disadvantaged children and Indigenous children, respectively, as a percentage of the respective targets for 2012–13, noting that participation rates for disadvantaged and Indigenous children are measure as a proportion of all children enrolled in an ECE program; Staff shows the percentage of teachers delivering ECE programs who are four-year university trained and EC qualified as a percentage of the target for 2012–13; Cost shows a qualitative, three scale rating of the average weekly cost of ECE, where low is between $0 and $5, Medium is between $5 and $15 and high is over $15. ACG acknowledges that the ROGS data used (3A.26) is derived only from surveys of parents using child care and is only about net costs per child after subsidies (CCB and CCR) and may not reflect the actual out of pocket cost of ECE for families; and Setting shows the percentage of funded early childhood education program providers, by management type.
ACG has gone to significant length to ensure the accuracy of data, however, it is important to note that there are inconsistencies in the way jurisdictions report data in the annual reports and bilateral agreements.
Source: Australian and ACT Governments 2008, ACT Government 2010b; Dowling, A and O’Malley, K 2009.
A.2 Conclusion — adequacy of funding and appropriateness of timelines
This review concludes that it is likely that the ACT Government will achieve the objectives of the NP ECE during the term of the NP. This review also notes, however, that the NP’s objectives probably will not be achieved across all settings in which ECE is delivered. This conclusion draws together the barriers that have been identified throughout the chapter in relation to two key considerations:

E I G H T E E N M O N T H R E V I E W O F T H E N A T I O N A L P A R T N E R S H I P A G R E E M E N T O N E A R L Y C H I L D H O O D
E D U C A T I O N
The Allen Consulting Group 44
• the adequacy of funding to achieve the NP’s objectives; and
• the appropriateness of timelines to achieve the NP’s objectives.
Summary 1 — Adequacy of funding to achieve the NP’s objectives
This review considers that the funding supporting the implementation of the NP in the ACT is adequate for achieving the objectives of the Agreement. While this review also notes that universal access is unlikely to be implemented in all settings in which ECE is delivered due to funding constraints, it recognises that this reflects ACT Government policy to extend universal access from a strong school system base.
Quantitative analysis
As was described in Overview to this report, which details the Allen Consulting Group’s method for estimating the cost of the NP ECE in 2012–13, the Allen Consulting Group has undertaken economic modelling to estimate the funding required to implement the NP ECE in 2012–13.
As has been noted, that modelling sums the hours required to provide ECE to four year old children who do not currently access ECE in YBFS (the increase in participation resulting from the ‘universal access’ commitment of the NP) and the additional hours required by children who already access a kindergarten program (the ‘fifteen hours commitment’ of the NP) to derive a total additional recurrent cost of implementing the Agreement in 2012–13.
Further, the Allen Consulting Group’s modelling includes two scenarios. First, it estimates the likely expenditure on ECE in the ACT (from both government and private sources) had the NP ECE not been agreed. This scenario is the ‘baseline’, on which estimates of the likely cost of implementing the NP are based.
Table A.1 lists the key variables and outputs in the baseline scenario. The Allen Consulting Group’s analysis suggests that the total expenditure on ECE in the ACT would have increased from $27 million to $35.4 million between 2007–08 and 2012–13. Further, the modelling estimates that the average cost per child per hour of ECE delivered would have increased in 2012–13, even without the introduction of the NP ECE.

E I G H T E E N M O N T H R E V I E W O F T H E N A T I O N A L P A R T N E R S H I P A G R E E M E N T O N E A R L Y C H I L D H O O D
E D U C A T I O N
The Allen Consulting Group 45
Table A.1
BASELINE ESTIMATES OF TOTAL EXPENDITURE ON ECE IN THE ACT
Delivery Estimate
Proportion of children enrolled in ECE 93.7%
Population of children aged 4 in 2007–08 4,066
Current average hours per year 520
Hours Delivered to 4 year old children already enrolled in ECE (2007–08)
2.0 million
Total annual state and territory government expenditure on ECE $20.5 million
Average weekly out of pocket expense by families on ECE (after subsidies)
$41.96
Average cost per child (2007–08) $7,082.77
Average cost per hour of ECE (2007–08) $13.62
Annual recurrent cost of ECE in YBFS (2007–08) $27.0 million
Average cost per child (2012–13) $8,194
Average cost per hour of ECE (2012–13) $15.76
Annual recurrent cost of ECE in YBFS (2012–13) $35.4 million
Source: Allen Consulting Group analysis, based on sources outlined in report Overview
Building on the baseline estimates, the Allen Consulting Group’s modelling then considers the difference between the baseline results and the estimates of the likely expenditure on ECE in the ACT required to meet the objectives of the NP ECE.
Table A.2 shows the key outputs of the Allen Consulting Group’s modelling. As this chapter has noted (see Figure A.1) the ACT does not meet the NP ECE objective of 95 per cent of children enrolled in ECE. As such, the costs for the ACT of implementing the Agreement result from both the ‘universal access’ commitment and the ‘fifteen hour commitment’ of the Agreement. Further, Table A.2 highlights that the total estimated recurrent costs of meeting the NP ECE’s objectives is $5.3 million in 2012–13. This compares with the $7.1 million that the ACT Government has received under the NP to implement the Agreement’s objectives.
Table A.2 RECURRENT COST REQUIRED TO ACHIEVE NP ECE OBJECTIVES IN ACT
Delivery Estimate
Hours required for 4 year old children not enrolled in ECE at all 0.03 million
Additional hours required for 4 year old children already enrolled 0.3 million
Total additional hours per year 0.3 million
Additional recurrent cost of NP ECE $5.3 million
2012–13 funding received for NP ECE $7.1 million
Source: Allen Consulting Group analysis, based on sources outlines in the report Overview
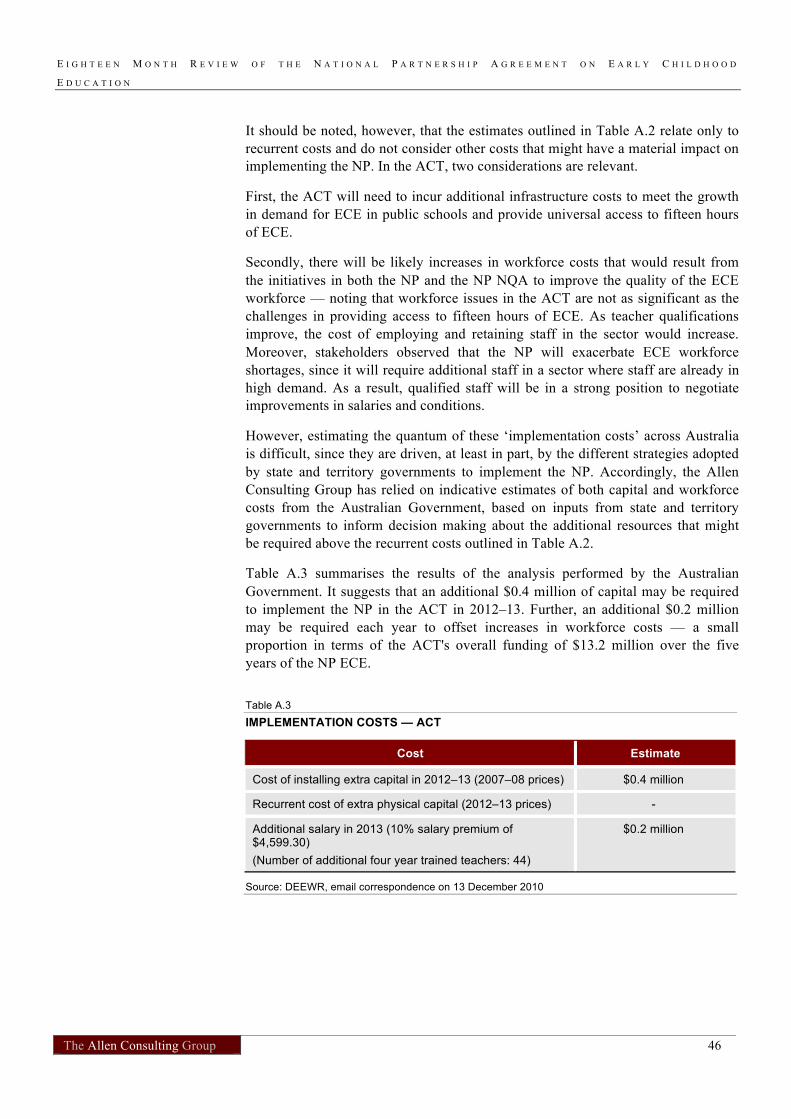
E I G H T E E N M O N T H R E V I E W O F T H E N A T I O N A L P A R T N E R S H I P A G R E E M E N T O N E A R L Y C H I L D H O O D
E D U C A T I O N
The Allen Consulting Group 46
It should be noted, however, that the estimates outlined in Table A.2 relate only to recurrent costs and do not consider other costs that might have a material impact on implementing the NP. In the ACT, two considerations are relevant.
First, the ACT will need to incur additional infrastructure costs to meet the growth in demand for ECE in public schools and provide universal access to fifteen hours of ECE.
Secondly, there will be likely increases in workforce costs that would result from the initiatives in both the NP and the NP NQA to improve the quality of the ECE workforce — noting that workforce issues in the ACT are not as significant as the challenges in providing access to fifteen hours of ECE. As teacher qualifications improve, the cost of employing and retaining staff in the sector would increase. Moreover, stakeholders observed that the NP will exacerbate ECE workforce shortages, since it will require additional staff in a sector where staff are already in high demand. As a result, qualified staff will be in a strong position to negotiate improvements in salaries and conditions.
However, estimating the quantum of these ‘implementation costs’ across Australia is difficult, since they are driven, at least in part, by the different strategies adopted by state and territory governments to implement the NP. Accordingly, the Allen Consulting Group has relied on indicative estimates of both capital and workforce costs from the Australian Government, based on inputs from state and territory governments to inform decision making about the additional resources that might be required above the recurrent costs outlined in Table A.2.
Table A.3 summarises the results of the analysis performed by the Australian Government. It suggests that an additional $0.4 million of capital may be required to implement the NP in the ACT in 2012–13. Further, an additional $0.2 million may be required each year to offset increases in workforce costs — a small proportion in terms of the ACT's overall funding of $13.2 million over the five years of the NP ECE.
Table A.3
IMPLEMENTATION COSTS — ACT
Cost Estimate
Cost of installing extra capital in 2012–13 (2007–08 prices) $0.4 million
Recurrent cost of extra physical capital (2012–13 prices) -
Additional salary in 2013 (10% salary premium of $4,599.30) (Number of additional four year trained teachers: 44)
$0.2 million
Source: DEEWR, email correspondence on 13 December 2010

E I G H T E E N M O N T H R E V I E W O F T H E N A T I O N A L P A R T N E R S H I P A G R E E M E N T O N E A R L Y C H I L D H O O D
E D U C A T I O N
The Allen Consulting Group 47
Many of these ‘implementation costs’ result from the concurrent preparation for a number of National Partnership Agreements. For example, both the NP ECE and the NP NQA will contribute to increases in both capital and workforce costs. As such, it may not be possible to attribute these implementation costs between NPs with precision. However, it is reasonable to suggest that not all of the anticipated increase in capital and workforce costs would be attributable to the NP ECE.
In short, this analysis suggests that, the funding provided to the ACT Government under the NP is appropriate to achieve the Agreement’s objectives, even after accounting for the specific challenges facing the ACT ECE sector.
Summary 2 — Appropriateness of timelines for achieving the NP’s objectives
This review considers that the timelines for the implementation of the NP in the ACT are appropriate for the ACT rollout. This conclusion largely reflects the significant ACT Government investments in ECE over time, and the significant infrastructure and workforce resources available to the ACT ECE sector.
Notwithstanding the above, the ACT ECE sector faces challenges relating to increasing demand and the concurrent preparation for the NP NQA and NP ECE, which have created twin demand drivers for ECE training. This is a significant concern for child care centres, who have not received any funding to implement the NP.
Consequently, while it is highly likely that the government schools sector will meet the NP’s objectives within the timeframe of the Agreement, the child care sector will require a much longer time to do so.
E I G H T E E N M O N T H R E V I E W O F T H E N A T I O N A L P A R T N E R S H I P A G R E E M E N T O N E A R L Y C H I L D H O O D
E D U C A T I O N
The Allen Consulting Group 48
Appendix B
New South Wales
B.1 Overview of early childhood education in New South Wales
In New South Wales (NSW), early childhood education in the year prior to school is generally referred to as ‘preschool programs’. Attendance at preschools, which usually accept children aged three to five years, is optional. Preschool programs are delivered across a range of settings (including long day care and mobile children’s services), with preschool education funding provided by NSW Community Services and the Department of Education and Training (DET). Community Services funded preschool programs are usually operated by not-for-profit community organisations or local government, parent committees, church groups or other private operators.
The first year at NSW’s primary schools is called ‘kindergarten’ after which children complete another six years of primary school, Years One to Six, before going on to secondary or high school. While ‘kindergarten’ is part of primary school and is compulsory, some community or private entities use the term ‘kindergarten’ to market their preschool services (NSW Public Schools website).
DET currently provides 100 fully-funded preschools across the state. These preschools are fully funded by NSW Government so that parents make only a small voluntary contribution. These preschools are an integral part of the schools to which they are attached and provide educational programs for children for one year prior to enrolment in kindergarten. These preschools are mostly located in low socioeconomic status (SES) areas and give priority to children from disadvantaged background, particularly those children whose families experience financial hardship and Aboriginal and Torres Strait Islander children.
NSW Community Services provides subsidies for most other NSW preschools (about 750) that are operated by community organisations, parent committees, or local councils. These preschool services are funded on a per capita child basis that is matched to the profile of their enrolments, and the community in which tyet are located. Parents pay a fee to use these services, currently an average of $27 a day for community-managed preschools, compared to long day care fees for three to six year olds which are usually around $65 a day. An additional 80 preschools in NSW are privately managed and provide fee-based services (IBISWorld 2010).
It is estimated that in NSW in 2007-08 approximately 60 per cent of children access state government funded and/or provided preschool services in the year before school (Productivity Commission 2009), although this figure does not include children accessing ECE in other settings. This figure does not include children who received ECE services in long day care or through mobile children’s services. Official data of participation in fully privately funded preschool programs was not available at the time of writing this report.
Most preschool programs in NSW employ early childhood qualified teachers with at least three years of training.

E I G H T E E N M O N T H R E V I E W O F T H E N A T I O N A L P A R T N E R S H I P A G R E E M E N T O N E A R L Y C H I L D H O O D
E D U C A T I O N
The Allen Consulting Group 49
Figure B.1 further elaborates on the characteristics of the NSW ECE sector and achievements of NSW against the targets in the Bilateral Agreement for the NP ECE. In particular, it shows:
• NSW’s achievements as a percentage of the targets for average hours of ECE provided per week, the participation rate for all children, disadvantaged children and Indigenous children and the number of four year qualified teachers;
• the cost of ECE for families (after subsidies) which is a qualitative, three-scale rating of the average weekly cost of ECE, where low is between $0 and $5, medium is between $5 and $15 and high is over $15; and
• the percentage of licensed and/or registered preschool providers, by management type.

E I G H T E E N M O N T H R E V I E W O F T H E N A T I O N A L P A R T N E R S H I P A G R E E M E N T O N E A R L Y C H I L D H O O D
E D U C A T I O N
The Allen Consulting Group 50
Figure B.1 SNAPSHOT OF NEW SOUTH WALES’ ECE SYSTEM
Note: Hours shows the average hours per week as a percentage of the 15 hours target for 2012–13; Participation: All, Disadvantaged and Indigenous show the participation rates for all children, disadvantaged children and Indigenous children, respectively, as a percentage of the respective targets for 2012–13; Staff shows the number of teachers delivering ECE programs who are four-year university trained and EC qualified as a percentage of the target for 2012–13. The target is provided in the Bilateral Agreement and the number of four year university trained early childhood qualified teachers and calculations are provided by DHS (email correspondence). NSW’s 2009 Annual Report shows a total of 5,741 teachers as of December 2009 but does not differentiate between 3 and 4 year trained. Email correspondence from DHS provides this breakdown, which includes 2,087 four year trained teachers (including 829 four year trained EC teachers and 1,258 (=46% of 2,734) degree or diploma equivalent teacher qualifications in LDC delivering preschool programs) as well as 969 three year trained EC teachers, 1,209 diploma qualified educators in community preschools, and 1,476 (=54% of 2,734) degree or diploma equivalent teacher qualifications in LDC delivering preschool programs; Cost shows a qualitative, three scale rating of the median weekly cost of ECE, where low is between $0 and $5, medium is between $5 and $15 and high is over $15; and Setting shows the percentage of funded early childhood education program providers, by management type.
ACG has gone to significant length to ensure the accuracy of data, however, it is important to note that there are inconsistencies in the way jurisdictions report data in the annual reports and bilateral agreements.
In addition, Figure B.1 does not include data on preschool program participation in long day care.
Source: Australian and NSW Governments 2008; DHS, email correspondence on the 17 December 2010; NSW Government 2010; Dowling, A and O’Malley, K 2009.

E I G H T E E N M O N T H R E V I E W O F T H E N A T I O N A L P A R T N E R S H I P A G R E E M E N T O N E A R L Y C H I L D H O O D
E D U C A T I O N
The Allen Consulting Group 51
Harrington (2008) estimates that around 85 per cent of four-year-old children access preschool in NSW — a participation rate that is broadly consistent among disadvantaged and Aboriginal and Torres Strait Islander children and the general population. Indeed, as Figure B.1 shows, participation among Aboriginal and Torres Strait Islander children is slightly higher than for all children. Children in preschool receive, on average, just over twelve-and-a-half hours of ECE per week (corresponding to 84 per cent of the 15 hours target).
The NSW preschool sector is, as in Victoria and Queensland, a ‘mixed market’, where children can access ECE in a range of settings through providers with a variety of ownership characteristics. The majority of ECE providers within the NSW sector are commercial, although NFP providers have a much larger market share of ECE in the year prior to school, however, a small but important proportion of preschools, as observed above, are operated within school settings by DET. This notwithstanding, NSW faces significant shortage of four year university trained and early childhood qualified teachers and the cost of ECE is high by national standards.
B.2 Conclusion — adequacy of funding and appropriateness of timelines
This review concludes that although significant challenges exist it is likely that the NSW Government will achieve the objectives of the NP ECE during the term of the NP. This conclusion draws together the barriers that have been identified throughout the chapter in relation to two key considerations:
• the adequacy of funding to achieve the NP’s objectives; and
• the appropriateness of timelines to achieve the NP’s objectives.
Summary 1 — Adequacy of funding to achieve the NP ECE outcomes
This review considers that the funding supporting the implementation of the NP in NSW is adequate for achieving the objectives of the Agreement. However, significant implementation issues are anticipated, primarily driven by likely increases in capital and workforce costs in this state. Quantitative and qualitative analysis informs this conclusion.
Quantitative analysis
As was described in the Overview to this report, the Allen Consulting Group has undertaken economic modelling to estimate the funding required to implement the NP ECE in 2012–13. That modelling sums the hours required to provide ECE to four year old children who do not currently access ECE in the year before school (the increase in participation resulting from the ‘universal access’ commitment of the NP) and the additional hours required by children who already access a kindergarten program (the ‘fifteen hours commitment’ of the NP) to derive a total additional recurrent cost of implementing the Agreement in 2012–13.

E I G H T E E N M O N T H R E V I E W O F T H E N A T I O N A L P A R T N E R S H I P A G R E E M E N T O N E A R L Y C H I L D H O O D
E D U C A T I O N
The Allen Consulting Group 52
Further, the Allen Consulting Group’s modelling includes two scenarios. First, it estimates the likely expenditure on ECE in New South Wales (from both government and private sources) had the NP ECE not been agreed. This scenario is the ‘baseline’ on which estimates of the likely cost of implementing the NP are based.
Table B.1 lists the key variables and outputs in the baseline scenario. The Allen Consulting Group’s analysis suggests that the total expenditure on ECE in New South Wales would have increased from $389.0 million to $467.9 million between 2007–08 and 2012–13. Further, the modelling estimates that the average cost per child per hour of ECE delivered would have increased in 2012–13, even without the introduction of the NP ECE.
Table B.1 BASELINE ESTIMATES OF TOTAL EXPENDITURE ON ECE IN NEW SOUTH WALES
Delivery Estimate
Proportion of children enrolled in ECE 81.9%
Population of children aged 4 in 2007–08 86,433
Current average hours per year 508
Hours Delivered to 4 year old children already enrolled in ECE (2007–08)
36.0 million
Total annual state and territory government expenditure on ECE $155 million
Average weekly out of pocket expense by families on ECE (after subsidies)
$68.55
Average cost per child (2007–08) $5,494.76
Average cost per hour of ECE (2007–08) $10.82
Annual recurrent cost of ECE in YBFS (2007–08) $389.0 million
Average cost per child (2012–13) $6,357
Average cost per hour of ECE (2012–13) $12.51
Annual recurrent cost of ECE in YBFS (2012–13) $467.9 million
Source: Allen Consulting Group analysis, based on sources outlined in the report Overview
Building on the baseline estimates, the Allen Consulting Group’s modelling then considers the difference between the baseline results and the estimates of the likely expenditure on ECE in New South Wales required to meet the objectives of the NP ECE.

E I G H T E E N M O N T H R E V I E W O F T H E N A T I O N A L P A R T N E R S H I P A G R E E M E N T O N E A R L Y C H I L D H O O D
E D U C A T I O N
The Allen Consulting Group 53
Table B.2 shows the key outputs of the Allen Consulting Group’s modelling. In the baseline scenario, New South Wales does not meet the NP ECE objective of 95 per cent of children enrolled in ECE, requiring an additional 13.1 per cent of children aged four years to enrol. This represents an additional 7.1 million hours required to meet the objective. Furthermore, only 29 per cent of children are enrolled in at least fifteen hours of ECE, requiring an additional 4.8 million hours to meet this objective. This corresponds to a total of 11.9 million additional hours to meet the NP ECE objectives. At an average cost per hour of ECE of $12.51 (see Table B.1), meeting the NP objectives would result in an additional recurrent cost of $148.55 million. This compares with the $137.9 million that the New South Wales Government will receive under the NP in 2012-13.
Table B.2
RECURRENT COSTS REQUIRED TO ACHIEVE NP ECE OBJECTIVES IN NEW SOUTH WALES
Delivery Estimate
Hours required for four year old children not enrolled in ECE at all
7.1 million
Additional hours required for four year old children already enrolled
4.8 million
Total additional hours per year 11.9 million
Additional recurrent cost of NP ECE $148.6 million
2012–13 funding received for NP ECE $137.9 million
Source: Allen Consulting Group analysis, based on sources outlined in the report Overview
It should be noted, however, that the estimates outlined in Table B.2 relate only to recurrent costs directly attributable to the NP ECE alone and do not consider other costs that might have a material impact on implementing the NP, such as those relating to the NP NQA and other similar initiatives. In New South Wales, two considerations are relevant.
First, infrastructure costs and expenses relating to workforce could significantly increase the total cost of implementing the NP ECE. The estimates in Table B.2 do not take into account the cost of capital of expanding the facilities available to preschool programs in the state. However, it is likely that implementing the Agreement will require significant expansion of existing facilities. Capital costs are therefore a key consideration in estimates about the ‘true’ expenditure required to implement the NP.
Second, estimates also ignore the likely increases in workforce costs that would result from the initiatives in both the NP ECE and the NP NQA to improve the quality of the ECE workforce. As teacher qualifications improve, the cost of employing and retaining staff in the sector would increase. Moreover, stakeholders observed that the NP ECE may exacerbate ECE workforce shortages, since it will require additional staff in a sector where staff are already in high demand. As a result, qualified staff will be in a strong position to negotiate improvements in salaries and conditions.
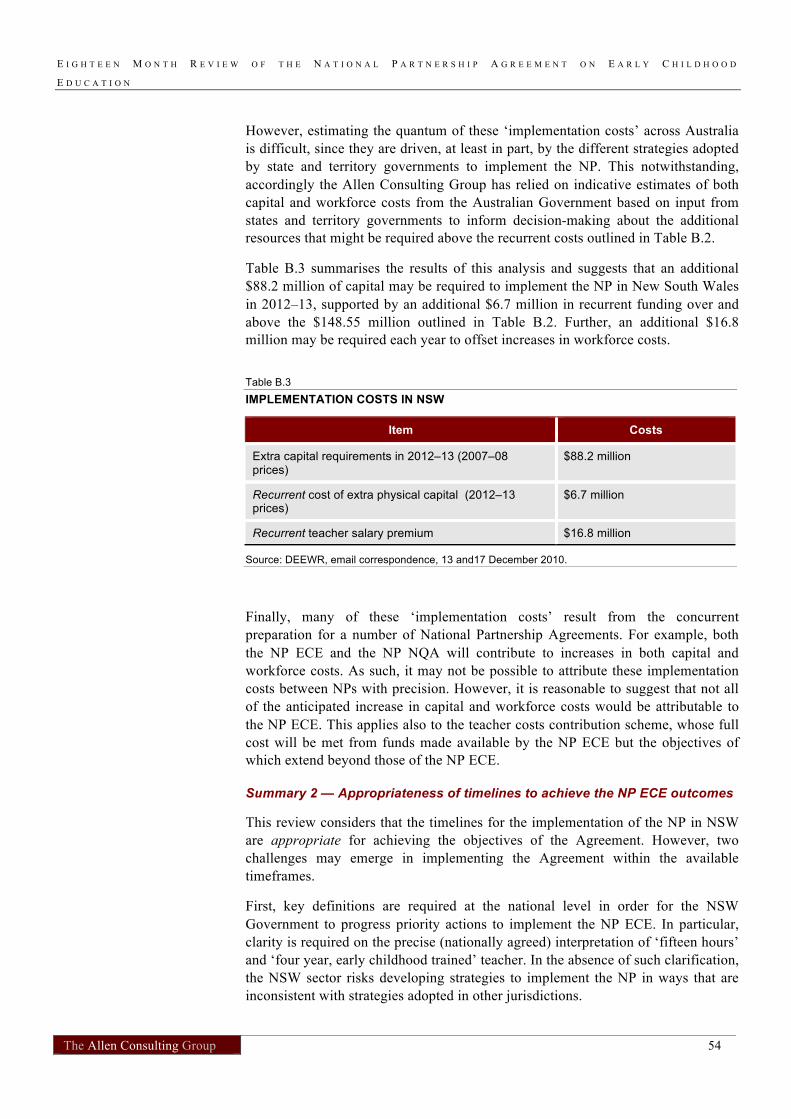
E I G H T E E N M O N T H R E V I E W O F T H E N A T I O N A L P A R T N E R S H I P A G R E E M E N T O N E A R L Y C H I L D H O O D
E D U C A T I O N
The Allen Consulting Group 54
However, estimating the quantum of these ‘implementation costs’ across Australia is difficult, since they are driven, at least in part, by the different strategies adopted by state and territory governments to implement the NP. This notwithstanding, accordingly the Allen Consulting Group has relied on indicative estimates of both capital and workforce costs from the Australian Government based on input from states and territory governments to inform decision-making about the additional resources that might be required above the recurrent costs outlined in Table B.2.
Table B.3 summarises the results of this analysis and suggests that an additional $88.2 million of capital may be required to implement the NP in New South Wales in 2012–13, supported by an additional $6.7 million in recurrent funding over and above the $148.55 million outlined in Table B.2. Further, an additional $16.8 million may be required each year to offset increases in workforce costs.
Table B.3
IMPLEMENTATION COSTS IN NSW
Item Costs
Extra capital requirements in 2012–13 (2007–08 prices)
$88.2 million
Recurrent cost of extra physical capital (2012–13 prices)
$6.7 million
Recurrent teacher salary premium $16.8 million
Source: DEEWR, email correspondence, 13 and17 December 2010.
Finally, many of these ‘implementation costs’ result from the concurrent preparation for a number of National Partnership Agreements. For example, both the NP ECE and the NP NQA will contribute to increases in both capital and workforce costs. As such, it may not be possible to attribute these implementation costs between NPs with precision. However, it is reasonable to suggest that not all of the anticipated increase in capital and workforce costs would be attributable to the NP ECE. This applies also to the teacher costs contribution scheme, whose full cost will be met from funds made available by the NP ECE but the objectives of which extend beyond those of the NP ECE.
Summary 2 — Appropriateness of timelines to achieve the NP ECE outcomes
This review considers that the timelines for the implementation of the NP in NSW are appropriate for achieving the objectives of the Agreement. However, two challenges may emerge in implementing the Agreement within the available timeframes.
First, key definitions are required at the national level in order for the NSW Government to progress priority actions to implement the NP ECE. In particular, clarity is required on the precise (nationally agreed) interpretation of ‘fifteen hours’ and ‘four year, early childhood trained’ teacher. In the absence of such clarification, the NSW sector risks developing strategies to implement the NP in ways that are inconsistent with strategies adopted in other jurisdictions.

E I G H T E E N M O N T H R E V I E W O F T H E N A T I O N A L P A R T N E R S H I P A G R E E M E N T O N E A R L Y C H I L D H O O D
E D U C A T I O N
The Allen Consulting Group 55
Second, the absence of a clear ‘narrative’ and communication of evidence relating to the NP ECE could prevent the NSW and Australian governments from harnessing the considerable energy and drive within the NSW ECE sector. NSW stakeholders articulated a clear frustration at the limited consultation and data analysis that was undertaken prior to the Bilateral Agreement on Universal Access being announced. Consequently, an opportunity exists to inspire the sector in NSW by articulating a clear vision for ECE (or even a vision for early childhood development more broadly) and by communicating the evidence for investing in ECE in the way the NP outlines as a means to achieving that vision.

E I G H T E E N M O N T H R E V I E W O F T H E N A T I O N A L P A R T N E R S H I P A G R E E M E N T O N E A R L Y C H I L D H O O D
E D U C A T I O N
The Allen Consulting Group 56
Appendix C
Northern Territory
C.1 Overview of early childhood education in the Northern Territory
In the Northern Territory (NT), early childhood education (ECE) or ‘preschool’ is a non-compulsory first stage of education. The NT Government funds and provides on average 12.9 hours of preschool education programs, which are integrated with a primary school and are almost all located on the same site as the primary school (DET 2009). Thus, in the NT, preschool is seen as first and foremost integrated with the schooling system and is defined as such within the Northern Territory Education Act.
Preschools attached to or under the auspices of primary schools are the major provider of ECE in the NT’s regional centres. Most preschools in larger schools, especially in major towns, are housed in standalone facilities and cater for groups of approximately 24 children per session. Preschools in smaller communities can operate in similarly separate facilities on or near the school site or out of a regular classroom (DET 2009). In smaller remote schools, preschool children may also be enrolled in multi-level, early years classes.
A number of non-government schools have developed ELCCs over the last decade or more, with the Catholic Education Office (CEO) as the main provider of these centres. In some remote communities the Catholic Education Office is the only provider of early learning services. Northern Territory Catholic Education Office does not have registered preschools in urban areas, it has Early Leaning Centres that attract childcare benefit and each child is further subsidised $1000 per head, per annum, by NTG. Other (independent and Christian) providers also deliver ECE.
Figure C.1 further elaborates on the characteristics of the NT ECE sector and the achievements of NT against the targets in the Bilateral Agreement for the NP ECE. In particular, it shows:
• NT’s achievements as a percentage of the targets for average hours of ECE provided per week, participation rate for all children, disadvantaged children and Indigenous children and number of four year qualified teachers;
• the cost of ECE for families (after subsidies) which is a qualitative, three scale rating of the average weekly cost of ECE, where low is between $0 and $5, Medium is between $5 and $15 and high is over $15; and
• the percentage of licensed and/or registered preschool providers, by management type.

E I G H T E E N M O N T H R E V I E W O F T H E N A T I O N A L P A R T N E R S H I P A G R E E M E N T O N E A R L Y C H I L D H O O D
E D U C A T I O N
The Allen Consulting Group 57
It shows that the NT faces significant challenge in meeting the objectives of increasing participation among all children, but among Aboriginal and Torres Strait Islander children in particular. NT government schools currently provide 12.9 hours of ECE per child per week, and therefore rates moderately in relation to other states and territories. Further, it shows that there is a need for a considerable increase in the proportion of teachers who are early childhood qualified, and that the school system dominates provision. Finally, the NT ECE sector provides ECE at a low cost, relative to other states and territories.
Figure C.1
SNAPSHOT OF THE NORTHERN TERRITORY’S ECE SYSTEM IN 2009
Note: Hours shows the average hours per week as a percentage of the 15 hours target for 2012–13; Participation show the participation rates for all children, disadvantaged children and Indigenous children, respectively, as a percentage of the respective targets for 2012–13. — noting that participation rates for disadvantaged and Indigenous children are measured as a proportion of all children enrolled in an ECE program; Staff shows the proportion of teachers delivering ECE programs who are four-year university trained and EC qualified as a percentage of the target for 2012–13; Cost shows a qualitative, three scale rating of the median weekly cost of ECE, where low is between $0 and $5, medium is between $5 and $15 and high is over $15; and Setting shows the percentage of funded early childhood education program providers, by management type.
ACG has gone to significant length to ensure the accuracy of data, however, it is important to note that there are inconsistencies in the way jurisdictions report data in the annual reports and bilateral agreements.
Source: Australian and NT Governments 2008, NT Government 2010; Dowling, A and O’Malley, K 2009.

E I G H T E E N M O N T H R E V I E W O F T H E N A T I O N A L P A R T N E R S H I P A G R E E M E N T O N E A R L Y C H I L D H O O D
E D U C A T I O N
The Allen Consulting Group 58
C.2 Conclusion — adequacy of funding and appropriateness of timelines
This review considers that it is likely that the NT Government will achieve some — but not all — of the objectives of the NP ECE during the term of the NP. In particular, this review considers the achievement of universal access to be highly unlikely in NT, given the significant proportion of children and families in the Territory who live in remote areas. This conclusion draws together issues relating to two key considerations:
• the adequacy of funding to achieve the NP’s objectives; and
• the appropriateness of timelines to achieve the NP’s objectives.
Summary 1 — Adequacy of funding for achieving the NP’s objectives
This review considers that the funding supporting the implementation of the NP in the NT is adequate for achieving the objectives of the Agreement by 2012-13. However, this review does not consider the annual funding provided to the NT in 2012-13 sufficient to sustain the same level of achievement into the future. Both quantitative and qualitative analyses support this conclusion.
Quantitative analysis
As was described in Overview at the beginning of this report, which details the Allen Consulting Group’s method for estimating the cost of the NP ECE in 2012–13, the Allen Consulting Group has undertaken economic modelling to estimate the funding required to implement the NP ECE in 2012–13.
As has been noted, that modelling sums the hours required to provide ECE to four year old children who do not currently access ECE in YBFS (the increase in participation resulting from the ‘universal access’ commitment of the NP) and the additional hours required by children who already access a kindergarten program (the ‘fifteen hours commitment’ of the NP) to derive a total additional recurrent cost of implementing the Agreement in 2012–13.
Further, the Allen Consulting Group’s modelling includes two scenarios. First, it estimates the likely expenditure on ECE in the NT (from both government and private sources) had the NP ECE not been agreed. This scenario is the ‘baseline’, on which estimates of the likely cost of implementing the NP are based.
Table C.1 lists the key variables and outputs in the baseline scenario. The Allen Consulting Group’s analysis suggests that the total expenditure on ECE in the NT would have increased from $23.3 million to $27.7 million between 2007–08 and 2012–13. Further, the modelling estimates that the average cost per child per hour of ECE delivered would have increased in 2012–13, even without the introduction of the NP ECE.

E I G H T E E N M O N T H R E V I E W O F T H E N A T I O N A L P A R T N E R S H I P A G R E E M E N T O N E A R L Y C H I L D H O O D
E D U C A T I O N
The Allen Consulting Group 59
Table C.1
BASELINE ESTIMATES OF TOTAL EXPENDITURE ON ECE FOR NORTHERN TERRITORY
Delivery Estimate
Proportion of children enrolled in ECE 88.7%
Population of children aged 4 in 2007–08 3,554
Current average hours per year 480
Hours Delivered to 4 year old children already enrolled in ECE (2007–08)
1.5 million
Total annual state and territory government expenditure on ECE
$23.1 million
Average weekly out of pocket expense by families on ECE (after subsidies)
$14.58
Average cost per child (2007–08) $7,379.02
Average cost per hour of ECE (2007–08) $15.47
Annual recurrent cost of ECE in YBFS (2007–08) $23.0 million
Average cost per child (2012–13) $8,537
Average cost per hour of ECE (2012–13) $17.78
Annual recurrent cost of ECE in YBFS (2012–13) $29.3 million
Source: Allen Consulting Group analysis, based on sources outlined in the report Overview
Building on the baseline estimates, the Allen Consulting Group’s modelling then considers the difference between the baseline results and the estimates of the likely expenditure on ECE in the NT required to meet the objectives of the NP ECE.
Table C.2 shows the key outputs of the Allen Consulting Group’s modelling. As Figure C.1 illustrates, the NT faces the dual challenge of increasing its participation rate to meet the NP ECE's 'universal access' and increasing the hours it offers to meet the Agreement's ‘fifteen hour commitment’. Further, Table C.2 highlights that the total estimated recurrent costs of meeting the NP ECE’s objectives is $10.0 million in 2012–13. This compares with the $5.9 million that the NT Government will receive in 2012-13 under the Agreement. As such, the annual funding to NT in 2012-13 is 41 per cent less than the estimated annual cost of delivering the NP ECE in that year. While this review acknowledges that both state and territory and Australian governments have agreed to contribute towards the achievement of the Agreement’s objectives, the size of the difference between the agreed funding and the likely cost raises a question about whether the same level of service provision could be sustained beyond the term of the Agreement.

E I G H T E E N M O N T H R E V I E W O F T H E N A T I O N A L P A R T N E R S H I P A G R E E M E N T O N E A R L Y C H I L D H O O D
E D U C A T I O N
The Allen Consulting Group 60
Table C.2
RECURRENT COST REQUIRED TO ACHIEVE NP ECE OBJECTIVES IN NORTHERN TERRITORY
Delivery Estimate
Hours required for 4 year old children not enrolled in ECE at all
0.1 million
Additional hours required for 4 year old children already enrolled
0.4 million
Total additional hours per year 0.6 million
Additional recurrent cost of NP ECE $10.0 million
2012-13 funding received under the NP ECE $5.9 million
Source: Allen Consulting Group analysis, based on sources outlined in the report Overview
It should be noted, however, that the estimates outlined in Table C.2 relate only to recurrent costs and do not consider other costs that might have a material impact on implementing the NP. In the NT, the issue of remoteness represents the most significant challenge faced.
Providing ECE programs to four year old children living in remote and very remote location is a significant challenge for the NT. As discussed, it is financially and logistically difficult to provide preschool programs in very remote areas where there are just a handful of young children. Stakeholders noted that the availability and cost of providing staff in remote communities is one of the most significant issues for NT.
In addition, the high proportion of Aboriginal and Torres Strait Islander population in the NT presents significant challenges in the delivery of preschool programs that are culturally appropriate and sustainable.
Estimating the quantum of these ‘implementation costs’ across Australia is difficult, since they are driven, at least in part, by the different strategies adopted by state and territory governments to implement the NP. Accordingly, the Allen Consulting Group has relied on indicative estimates of both capital and workforce costs from the Australian Government, based on inputs from state and territory governments to inform decision making about the additional resources that might be required above the recurrent costs outlined in Table C.3. The data provided suggests that an additional $1.8 million of capital may be required to implement the NP in the NT in 2012–13. Further, an additional $0.4 million may be required each year to offset increases in workforce costs.

E I G H T E E N M O N T H R E V I E W O F T H E N A T I O N A L P A R T N E R S H I P A G R E E M E N T O N E A R L Y C H I L D H O O D
E D U C A T I O N
The Allen Consulting Group 61
Table C.3
IMPLEMENTATION COSTS — THE NORTHERN TERRITORY
Cost Estimate
Extra capital requirements in 2012–13 (2007–08 prices)
$1.8 million
Recurrent cost of extra physical capital (2012–13 prices)
-
Recurrent teacher salary premium (10% salary premium of $4,599.30) (Number of additional four year trained teachers: 90)
$0.4 million
Source: DEEWR, email correspondence on 13 December 2010
Finally, many of these ‘implementation costs’ result from the concurrent preparation for a number of National Partnership Agreements. For example, the NP ECE, NP NQA and the National Partnership on Indigenous Early Childhood Development (NP IECD) will contribute to increases in both capital and workforce costs. As such, it may not be possible to attribute these implementation costs between NPs with precision. However, it is reasonable to suggest that not all of the anticipated increase in capital and workforce costs would be attributable to the NP ECE.
In short, this analysis suggests that, the funding provided to the NT Government under the NP is appropriate to achieve the Agreement’s objectives, even accounting for the specific challenges facing the NT ECE sector. However, the annual funding in 2012-13 is significantly less (by 41 per cent) than the estimated cost of delivering the NP ECE in that year, suggesting that sustaining the one-off achievement of the NP’s objectives may be difficult in the NT.
Summary 2 — Appropriateness of timelines for achieving the NP’s objectives
This review considers the Northern Territory’s progress to date in implementing the Agreement both appropriate and laudable. However, the timelines are likely to be too short for the Northern Territory to fully realise the objectives of the Agreement.
The timelines are likely to be achievable in larger communities but may overextend remote areas in the Northern Territory. In particular, given that the lack of qualified early childhood teachers, especially in remote communities, is the most significant barrier to providing universal access to fifteen hours of preschool education in Northern Territory, the timing required to increase the capacity of the workforce to meet demand in remote areas will potentially extend past the timeframe of the Agreement.
Further, the concurrent preparation for the NP NQA and NP ECE has an impact on the timelines due to the need to meet the quality requirements such as staff qualifications and teacher: student ratios. As with the question of the adequacy of funding, greater flexibility in the timing of funding may assist services to meet the objectives of the NP within the agreed timelines.

E I G H T E E N M O N T H R E V I E W O F T H E N A T I O N A L P A R T N E R S H I P A G R E E M E N T O N E A R L Y C H I L D H O O D
E D U C A T I O N
The Allen Consulting Group 62
Stakeholders have indicated that although some of the key deliverables have slipped, they think that they will achieve many of the objectives at the end of the NP and that the timelines help to focus peoples’ minds and actions. However, the time to scale up and introduce the new models of preschool over the next three years is also going to be a huge challenge for the Northern Territory.
E I G H T E E N M O N T H R E V I E W O F T H E N A T I O N A L P A R T N E R S H I P A G R E E M E N T O N E A R L Y C H I L D H O O D
E D U C A T I O N
The Allen Consulting Group 63
Appendix D
Queensland
D.1 Overview of early childhood education in Queensland
In Queensland, early childhood education in the year prior to school is generally referred to as 'kindergarten programs'. Attendance at kindergarten programs, which is for children aged at least 4 years by 30 June in the year they attend, is optional. The Queensland early childhood education sector is a mixed model, where children can access kindergarten programs in kindergarten services (community-operated or operated by non-state schools) or long day care services as well as in a small number of state schools located in discrete indigenous communities.
Despite the range of settings within which Queensland’s children can access early childhood education, relatively few children participate in kindergarten in the year prior to formal schooling, in comparison with other Australian state and territories.5 However, Queensland’s low ECE participation rate reflects two further issues.
First, the Queensland Government introduced a ‘preparatory’ year of education in 2007. To some degree, the preparatory year incorporated kindergarten services that were previously considered early childhood education. As such, many kindergarten services — particularly schools — that had previously provided early childhood education have been incorporated into the school system, so that, as the Australian Council for Educational Research has observed, ‘there are now very few government preschools left in Queensland catering to four year olds’ (Dowling & O’Malley 2009, p. 2).
Second, the historic development of the early childhood education and care sector in Queensland means that many children who are eligible for early childhood education attend long day care, rather than a kindergarten program. Until 2010, the majority of children accessed early childhood education through a not-for-profit association, C&K. Up to that point, almost all community kindergarten services received government funding via C&K to deliver kindergarten consistent with guidelines set out in a Service Agreement between C&K and the Department of Education and Training (DETA). However, the distribution of community kindergarten programs in Queensland did not reflect population growth in urban areas in recent decades. As the Allen Consulting Group has previously observed (ACG 2008), the greater Brisbane area and Northern Queensland had the lowest number of places in kindergarten programs relative to population, while most regional areas were relatively well served in comparison. In the context of the broader ECEC market, children in well populated areas had access to both long day care and community kindergarten programs , while children outside densely populated areas depended on access to community kindergarten programs.
The combined picture of the Queensland ECE sector and its achievements against the targets in the Bilateral Agreement for the NP ECE are outlined in Figure D.1. In particular, it shows: 5 Notably, up to December 2009, only kindergarten programs provided by community kindergarten services
were eligible to access Queensland Government funding to support the provision of an early childhood education program.

E I G H T E E N M O N T H R E V I E W O F T H E N A T I O N A L P A R T N E R S H I P A G R E E M E N T O N E A R L Y C H I L D H O O D
E D U C A T I O N
The Allen Consulting Group 64
• Queensland’s achievements as a percentage of the targets for average hours of ECE provided per week, participation rates (for all children, disadvantaged children and Indigenous children) and number of teachers who are four year university trained and EC qualified;
• the cost of ECE for families (after subsidies) which is a qualitative, three scale rating of the average weekly cost of ECE, where low is between $0 and $5, medium is between $5 and $15 and high is over $15; and
• the percentage of funded ECE program providers by management type.
Perhaps Queensland’s most significant challenge relates to increasing the participation rate in ECE. However, participation rates among disadvantaged and Aboriginal and Torres Strait Islander children are comparable with participation more generally. Children who do currently access ECE receive, on average, 13.7 hours of a structured program per week — higher than the national average.
The ECE sector faces a significant shortage of four year degree qualified teachers, and the cost of ECE is high by national standards. Finally, the Queensland ECE sector is a mixed market, where children and families can access ECE in a variety of locations and in a range of settings. This notwithstanding, community services — a significant majority of which are stand alone kindergartens — provide ECE to the majority of Queensland’s children.

E I G H T E E N M O N T H R E V I E W O F T H E N A T I O N A L P A R T N E R S H I P A G R E E M E N T O N E A R L Y C H I L D H O O D
E D U C A T I O N
The Allen Consulting Group 65
Figure D.1
SNAPSHOT OF QUEENSLAND’S ECE SYSTEM IN 2009
Participation shows the participation rates for all children, disadvantaged children and Indigenous children, respectively, as a percentage of the respective targets for 2012–13, noting that participation rates for disadvantaged and Indigenous children are measure as a proportion of all disadvantaged and Indigenous children enrolled in an ECE program, respectively. No current population was available for the total number of four year olds in disadvantaged areas in Queensland and therefore 2006 census figure from the baseline was used; Staff shows the number of teachers delivering ECE programs who are four-year university trained and EC qualified as a percentage of the target for 2012–13; Cost shows a qualitative, three scale rating of the median weekly cost of ECE, where low is between $0 and $5, Medium is between $5 and $15 and high is over $15; and Setting shows the percentage of funded early childhood education program providers, by management type.
ACG has gone to significant length to ensure the accuracy of data, however, it is important to note that there are inconsistencies in the way jurisdictions report data in the annual reports and bilateral agreements.
Source: Australian and Queensland Governments 2008, Queensland Government 2010; Dowling, A and O’Malley, K 2009.
D.2 Conclusion — adequacy of funding and appropriateness of timelines
This review concludes that it is likely that the Queensland Government will achieve some — but not all — of the objectives of the NP ECE during the term of the NP. In particular, this review considers the achievement of a participation rate of 95 per cent to be highly unlikely in Queensland, given the currently low level of participation in the state.

E I G H T E E N M O N T H R E V I E W O F T H E N A T I O N A L P A R T N E R S H I P A G R E E M E N T O N E A R L Y C H I L D H O O D
E D U C A T I O N
The Allen Consulting Group 66
Further, this review also notes that the cost of Queensland achieving the NP’s objectives may be significant, and may prevent the state from achieving the objectives of the NP ‘at a cost that is not a barrier to access’. This section draws together conclusions identified throughout the chapter in relation to two key considerations:
• the adequacy of funding to achieve the NP’s objectives; and
• the appropriateness of timelines to achieve the NP’s objectives.
Summary 1 — Adequacy of funding for achieving the NP’s objectives
This review considers that the funding supporting the implementation of the NP in Queensland is adequate for achieving the objectives of the Agreement. However, this review does not consider the annual funding provided to Queensland in 2012-13 sufficient to sustain the same level of achievement into the future. Both quantitative and qualitative analyses support this conclusion.
Quantitative analysis
As was described in the Overview at the beginning of this report, the Allen Consulting Group has undertaken economic modelling to estimate the funding required to implement the NP ECE in 2012–13.
As has been noted, that modelling sums the hours required to provide ECE to four year old children who do not currently access ECE in YBFS (the increase in participation resulting from the ‘universal access’ commitment of the NP) and the additional hours required by children who already access a kindergarten program (the ‘fifteen hours commitment’ of the NP) to derive a total additional recurrent cost of implementing the Agreement in 2012–13.
Further, the Allen Consulting Group’s modelling includes two scenarios. First, it estimates the likely expenditure on ECE in Queensland (from both government and private sources) had the NP ECE not been agreed. This scenario is the ‘baseline’, on which estimates of the likely cost of implementing the NP are based.
Table D.1 lists the key variables and outputs in the baseline scenario. The Allen Consulting Group’s analysis suggests that the total expenditure on ECE in Queensland would have increased from $76.5 million to $103.5 million between 2007–08 and 2012–13. Further, the modelling estimates that the average cost per child per hour of ECE delivered would have increased in 2012–13, even without the introduction of the NP ECE.

E I G H T E E N M O N T H R E V I E W O F T H E N A T I O N A L P A R T N E R S H I P A G R E E M E N T O N E A R L Y C H I L D H O O D
E D U C A T I O N
The Allen Consulting Group 67
Table D.1
BASELINE ESTIMATES OF TOTAL EXPENDITURE ON ECE IN QUEENSLAND
Variable Estimate
Proportion of children enrolled in ECE 29%
Population of children aged 4 in 2007–08 54,347
Current average hours per year 512
Hours Delivered to 4 year old children already enrolled in ECE (2007–08)
8.1 million
Total annual state and territory government expenditure on ECE
$36.1 million
Average weekly out of pocket expense by families on ECE (after subsidies)
$58.06
Average cost per child (2007–08) $4,850.93
Average cost per hour of ECE (2007–08) $9.47
Annual recurrent cost of ECE in YBFS (2007–08) $76.5 million
Average cost per child (2012–13) $5,612
Average cost per hour of ECE (2012–13) $10.96
Annual recurrent cost of ECE in YBFS (2012–13) $103.51 million
Source: Allen Consulting Group analysis, based on sources outlined in the report Overview
Building on the baseline estimates, the Allen Consulting Group’s modelling then considers the difference between the baseline results and the estimates of the likely expenditure on ECE in Queensland required to meet the objectives of the NP ECE.
Table D.2 shows the key outputs of the Allen Consulting Group’s modelling. As this chapter has noted (see Figure D.1), Queensland faces the combined challenge of increasing both the proportion of children enrolled in ECE and the number of hours of ECE delivered to children accessing ECE. As such, the expenditure required for Queensland to achieve the objectives of the Agreement are significant — and significantly higher than for other states and territories. As Table D.2 shows, the total estimated recurrent costs of meeting the NP ECE’s objectives is $293.86 million in 2012–13. This compares with the $97.6 million that the Queensland Government will receive in 2012-13 under the Agreement.

E I G H T E E N M O N T H R E V I E W O F T H E N A T I O N A L P A R T N E R S H I P A G R E E M E N T O N E A R L Y C H I L D H O O D
E D U C A T I O N
The Allen Consulting Group 68
Table D.2
RECURRENT COSTS REQUIRED TO ACHIEVE NP ECE OBJECTIVES IN QUEENSLAND
Delivery Estimate
Hours required for 4 year old children not enrolled in ECE at all
25.2 million
Additional hours required for 4 year old children already enrolled
1.6 million
Total additional hours per year 26.8 million
Additional recurrent cost of NP ECE $293.9 million
Actual funding received from the NP ECE $97.6 million
Source: Allen Consulting Group analysis, based on sources outlined in the report Overview
It should be noted, however, that the estimates outlined in Table D.2 relate only to recurrent costs and do not consider other costs that might have a material impact on implementing the NP. In Queensland, three considerations are relevant.
First, and as this chapter has highlighted, infrastructure costs and expenses relating to workforce could significantly increase the total cost of implementing the Agreement. The estimates in Table D.2 do not take into account the cost of capital for expanding the facilities available to kindergarten programs in the state. In consultations, the review heard that some long day care service providers anticipate that implementing the Agreement will require significant expansion of existing facilities.
Second, estimates also ignore the likely increases in workforce costs that would result from the initiatives in both the NP and the NP NQA to improve the quality of the ECE workforce. As teacher qualifications improve, the cost of employing and retaining staff in the long day care sector would increase. Moreover, stakeholders observed that the NP will exacerbate ECE workforce shortages, since it will require additional staff in a sector where staff are already in high demand. As a result, qualified staff will be in a strong position to negotiate improvements in salaries and conditions.
Third, many communities in Queensland are remote, and as this chapter has argued, the cost of service provision in remote areas is significantly higher than in urban centres. Further, a number of stakeholders in Queensland identified the significant challenge of encouraging ‘hard to reach’ children and families to enrol in ECE. In this context, ‘hard to reach’ can be interpreted as suggestive of the social, cultural, economic and cultural barriers that may prevent children and families from accessing any service, the logic being that the ‘harder to reach’ children are, the costlier it is to provide them with services.
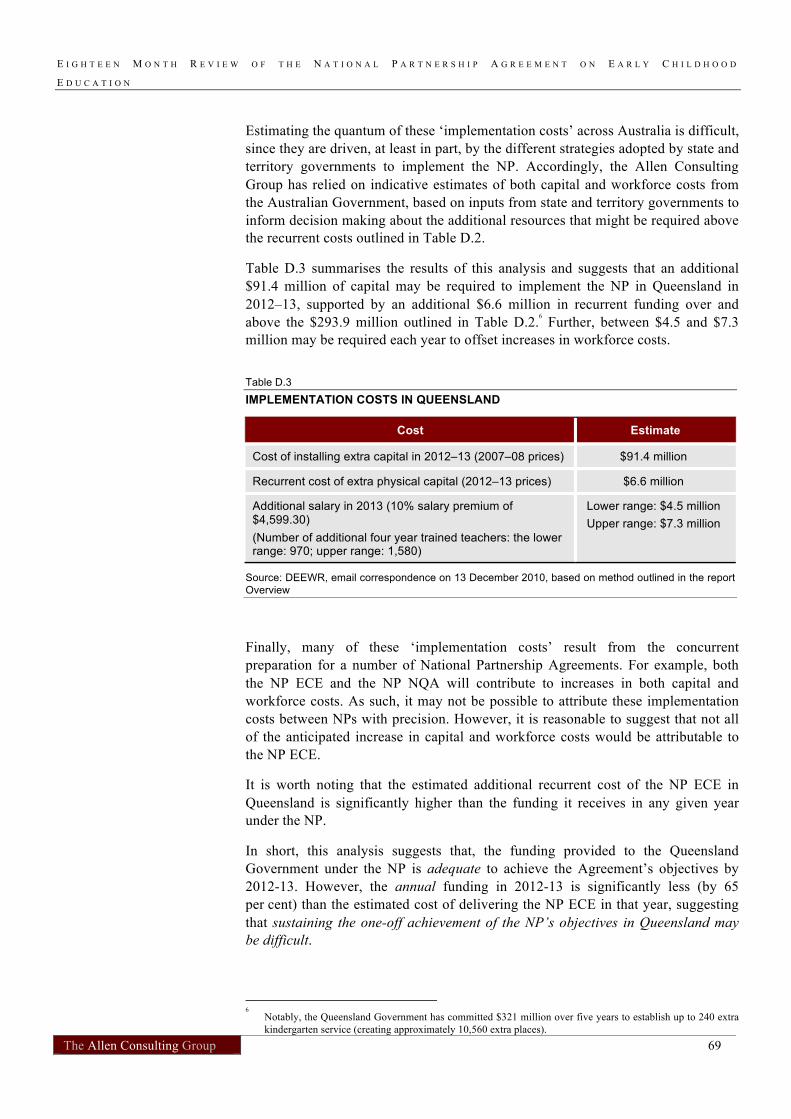
E I G H T E E N M O N T H R E V I E W O F T H E N A T I O N A L P A R T N E R S H I P A G R E E M E N T O N E A R L Y C H I L D H O O D
E D U C A T I O N
The Allen Consulting Group 69
Estimating the quantum of these ‘implementation costs’ across Australia is difficult, since they are driven, at least in part, by the different strategies adopted by state and territory governments to implement the NP. Accordingly, the Allen Consulting Group has relied on indicative estimates of both capital and workforce costs from the Australian Government, based on inputs from state and territory governments to inform decision making about the additional resources that might be required above the recurrent costs outlined in Table D.2.
Table D.3 summarises the results of this analysis and suggests that an additional $91.4 million of capital may be required to implement the NP in Queensland in 2012–13, supported by an additional $6.6 million in recurrent funding over and above the $293.9 million outlined in Table D.2.6 Further, between $4.5 and $7.3 million may be required each year to offset increases in workforce costs.
Table D.3
IMPLEMENTATION COSTS IN QUEENSLAND
Cost Estimate
Cost of installing extra capital in 2012–13 (2007–08 prices) $91.4 million
Recurrent cost of extra physical capital (2012–13 prices) $6.6 million
Additional salary in 2013 (10% salary premium of $4,599.30) (Number of additional four year trained teachers: the lower range: 970; upper range: 1,580)
Lower range: $4.5 million Upper range: $7.3 million
Source: DEEWR, email correspondence on 13 December 2010, based on method outlined in the report Overview
Finally, many of these ‘implementation costs’ result from the concurrent preparation for a number of National Partnership Agreements. For example, both the NP ECE and the NP NQA will contribute to increases in both capital and workforce costs. As such, it may not be possible to attribute these implementation costs between NPs with precision. However, it is reasonable to suggest that not all of the anticipated increase in capital and workforce costs would be attributable to the NP ECE.
It is worth noting that the estimated additional recurrent cost of the NP ECE in Queensland is significantly higher than the funding it receives in any given year under the NP.
In short, this analysis suggests that, the funding provided to the Queensland Government under the NP is adequate to achieve the Agreement’s objectives by 2012-13. However, the annual funding in 2012-13 is significantly less (by 65 per cent) than the estimated cost of delivering the NP ECE in that year, suggesting that sustaining the one-off achievement of the NP’s objectives in Queensland may be difficult.
6 Notably, the Queensland Government has committed $321 million over five years to establish up to 240 extra
kindergarten service (creating approximately 10,560 extra places).
E I G H T E E N M O N T H R E V I E W O F T H E N A T I O N A L P A R T N E R S H I P A G R E E M E N T O N E A R L Y C H I L D H O O D
E D U C A T I O N
The Allen Consulting Group 70
Qualitative analysis
The qualitative analysis outlined throughout this chapter — based on consultations with government and industry stakeholders in Queensland — supports the conclusions raised in the Allen Consulting Group’s modelling of the anticipated costs of the NP. Two factors in particular inform this conclusion.
First, efforts to implement the NP ECE in Queensland have been complicated by both the low current participation in ECE in the state and the remoteness of some communities. As this chapter has noted, infrastructure needs are significant in areas where demand for ECE is currently low. Stakeholders observed that if the objectives of the NP are successfully met, and the ECE participation rate increases to around 95 per cent, it is very unlikely that there will be sufficient ECE capacity in all areas across the state.
In particular, stakeholders observed that children in remote communities were unlikely to enjoy universal access to ECE in the same way as children in more densely populated areas, due to a combination of the inadequacy of funding to support remote services provision and a lack of flexibility that prevents providers from developing innovative service models to deliver ECE in remote areas at a lower cost.
Second, stakeholders anticipate that implementing the NP ECE will significantly reduce the affordability of early childhood education in Queensland. Given that one of the objectives of the NP is to improve access to and quality of ECE ‘at a cost that is not a barrier to access’ (Australian and Queensland Governments 2008), the anticipated reduction in overall ECE affordability places the achievement of the Agreement’s objectives at risk.
Summary 2 — Appropriateness of timelines for achieving the NP’s objectives
This review considers Queensland’s progress to date in implementing the Agreement both appropriate and laudable. However, the timelines are likely to be too short for Queensland to fully realise the objectives of the Agreement.
In particular, stakeholders note that there may be regional variations in the capacity of local communities to deliver on the NP. As such, there is a danger that by promoting ‘universal access’ to a specific vision of ECE, the Agreement could overextend the ECE sector in the state, leading some providers — particularly in remote areas — to withdraw. Stakeholders suggest that the timelines, rather than the inadequacy of funding, create the greatest challenges for providers. However, as with the question of the adequacy of funding, greater flexibility in the mode of service provision may allow services to meet the objectives of the NP within the agreed timelines.

E I G H T E E N M O N T H R E V I E W O F T H E N A T I O N A L P A R T N E R S H I P A G R E E M E N T O N E A R L Y C H I L D H O O D
E D U C A T I O N
The Allen Consulting Group 71
Appendix E
South Australia
E.1 Overview of early childhood education in South Australia
In South Australia, early childhood education services, including preschools, are administered by the Department of Education and Children’s Services (DECS). Government preschools are operated and staffed by DECS employees. In addition, there are preschool programs provided by the non-government sector. DECS is currently providing grant funding for forty-two non-government preschools that provides them with the equivalent staffing resources of DECS preschools.
Preschool programs are available to all children aged four years old. In rural and remote areas children are eligible for government-funded preschool programs from the age of three-and-a-half, and Aboriginal and Torres Strait Islander children and children under the Guardianship of the Minister for Families and Communities are eligible from age three7. Preschools may offer 'extension programs' such as pre-entry to preschool programs and play groups. Where resources permit preschool staff can deliver these programs, however, they do not attract additional government funding.
At the commencement of the Bilateral Agreement on Achieving Universal Access to Early Childhood Education in South Australia (Australian and South Australian Governments 2008), an estimated 88 per cent of four year old children were already being provided with access to a minimum of eleven hours of preschool education in DECS-funded preschools.
There is good geographical coverage of preschool programs in South Australia, including – or rather particularly – in regional and remote areas Nevertheless, regional and remote areas frequently experience challenges with providing universal access, primarily due to issues such as transport and staff retention that present barriers to access.
Integrated centres, combining child care and preschool, have been promoted and implemented by the government since 1985 in recognition of the needs of working parents. Non-government preschools are currently not captured by regulations that apply to child-care centres in South Australia, (childcare centres are licensed and therefore eligible for CCB). Some licensed services employ teachers and adertise the provision of a preschool program and are believed to offer preschool programs and employ qualified teachers.
7 Children in rural and remote areas access the same amount of preschool time over a longer period, i.e., 600
hours over 18 months instead of 12 months. Aboriginal children and children under the Guardianship of the Minister, on the other hand, have access to a greater entitlement: they can access 12 hours of preschool per week from 3 years of age and 15 hours from four years of age. Children with additional needs may also access early entry to preschool from 3 years nine months.

E I G H T E E N M O N T H R E V I E W O F T H E N A T I O N A L P A R T N E R S H I P A G R E E M E N T O N E A R L Y C H I L D H O O D
E D U C A T I O N
The Allen Consulting Group 72
Currently, the South Australian Government is the sole provider of family day care in the state and all family day care and some long day care centres are taking children to preschool as part of their arrangements. South Australia is also working towards attaching out of preschool hours care to their preschools subject to Commonwealth approval of Child Care Benefit for the out of preschool hours care program. While family day care and long day care centres attract CCB funding, preschools do not and the government is currently seeking to attract CCB for the ‘wrap-around’ component.
At present, the South Australian Government’s preschool subsidy provides for a minimum of eleven hours of ECE per week for all eligible children. Extension programs, such as playgroups and early entry preschool, are usually provided on days outside the eleven-hour provision of preschool. The costs for families of extension programs is comparable to the costs for preschool.
The costs for attending preschools are set by the preschool's governing council. They vary from centre to centre and are generally very low (average weekly fees charged by DECS preschools are $5 a week), however, no child is excluded from a government-funded preschool on financial grounds. The government would seek to maintain this low level of parent contribution under the NP.
Figure E.1 further elaborates on the characteristics of the South Australian ECE sector and achievements of South Australia against the targets in the Bilateral Agreement for the NP ECE. In particular, it shows:
• South Australia’s achievements as a percentage of the targets for average hours of ECE provided per week, the participation rate for all children, disadvantaged children and Indigenous children, and the number of four year qualified teachers;
• the cost of ECE for families (after subsidies) which is a qualitative, three-scale rating of the average weekly cost of ECE, where low is between $0 and $5, medium is between $5 and $15 and high is over $15; and
• the percentage of licensed and/or registered preschool providers, by management type.

E I G H T E E N M O N T H R E V I E W O F T H E N A T I O N A L P A R T N E R S H I P A G R E E M E N T O N E A R L Y C H I L D H O O D
E D U C A T I O N
The Allen Consulting Group 73
Figure E.1
SNAPSHOT OF SOUTH AUSTRALIA’S ECE SYSTEM IN 2009
Note: Hours shows the average hours per week as a percentage of the 15 hours target for 2012–13; Participation shows the participation rates for all children, disadvantaged children and Indigenous children, respectively, as a percentage of the respective targets for 2012–13, noting that participation rate for disadvantaged children is measured as a proportion of all children enrolled in an ECE program and participation rate for Indigenous children is measured as a proportion of all Indigenous children; Staff shows the number of teachers delivering ECE programs who are four-year university trained and EC qualified as a percentage of the target for 2012–13; Cost shows a qualitative, three scale rating of the median weekly cost of ECE, where low is between $0 and $5, Medium is between $5 and $15 and high is over $15; and Setting shows the percentage of funded early childhood education program providers, by management type.
ACG has gone to significant length to ensure the accuracy of data, however, it is important to note that there are inconsistencies in the way jurisdictions report data in the annual reports and bilateral agreements.
Source: Australian and South Australian Governments 2008; South Australian Government 2010a; Dowling and O’Malley 2009.
E.2 Conclusion — adequacy of funding and appropriateness of timelines
This review considers that it is likely that the South Australian Government will achieve the objectives of the NP ECE during the term of the NP. This review also notes, however, that the cost of South Australia achieving the NP’s objectives may be significant, and will require the successful management of numerous barriers.
This conclusion draws together the barriers that have been identified throughout the chapter in relation to two key considerations:

E I G H T E E N M O N T H R E V I E W O F T H E N A T I O N A L P A R T N E R S H I P A G R E E M E N T O N E A R L Y C H I L D H O O D
E D U C A T I O N
The Allen Consulting Group 74
• the adequacy of funding to achieve the NP’s objectives; and
• the appropriateness of timelines to achieve the NP’s objectives.
Summary 1 — Adequacy of funding for achieving the NP’s objectives
This review considers that the funding supporting the implementation of the NP ECE in South Australia is adequate for achieving the objectives of the Agreement.
Further, the review notes that South Australia’s annual funding in 2012-13 under the Agreement is lower (by 38 per cent) than the estimated recurrent cost of implementing the NP in that year. While this shortfall is less than the equivalents in Queensland and the Northern Territory, it remains a significant figure and will require Parties to the Agreement to determine an appropriate split between the different actors in the ECE sector nationally and within the state.
In addition, the review notes that implementation issues are anticipated, primarily driven by likely increases in capital and workforce costs in this state. Quantitative and qualitative analysis informs this conclusion.
Quantitative analysis
As was described in the Overview to this report, the Allen Consulting Group has undertaken economic modelling to estimate the funding required to implement the NP ECE in 2012–13. That modelling sums the hours required to provide ECE to four year old children who do not currently access ECE in the year before school (the increase in participation resulting from the ‘universal access’ commitment of the NP) and the additional hours required by children who already access a kindergarten program (the ‘fifteen hours commitment’ of the NP) to derive a total additional recurrent cost of implementing the Agreement in 2012–13.
Further, the Allen Consulting Group’s modelling includes two scenarios. First, it estimates the likely expenditure on ECE in South Australia (from both government and private sources) had the NP ECE not been agreed. This scenario is the ‘baseline’ on which estimates of the likely cost of implementing the NP are based.
Table E.1 lists the key variables and outputs in the baseline scenario. The Allen Consulting Group’s analysis suggests that the total expenditure on ECE in South Australia would have increased from $81.9 million to $104.8 million between 2007–08 and 2012–13. Further, the modelling estimates that the average cost per child per hour of ECE delivered would have increased in 2012–13, even without the introduction of the NP ECE.

E I G H T E E N M O N T H R E V I E W O F T H E N A T I O N A L P A R T N E R S H I P A G R E E M E N T O N E A R L Y C H I L D H O O D
E D U C A T I O N
The Allen Consulting Group 75
Table E.1
BASELINE ESTIMATES OF TOTAL EXPENDITURE ON ECE IN SOUTH AUSTRALIA
Delivery Estimate
Proportion of children enrolled in ECE 87.9%
Population of children aged 4 in 2007–08 17,529
Current average hours per year 440
Hours Delivered to 4 year old children already enrolled in ECE (2007–08)
6.78 million
Total annual state and territory government expenditure on ECE
$95 million
Average weekly out of pocket expense by families on ECE (after subsidies)
$18.21
Average cost per child (2007–08) $5,108.94
Average cost per hour of ECE (2007–08) $11.61
Annual recurrent cost of ECE in YBFS (2007–08) $81.9 million
Average cost per child (2012–13) $5,910
Average cost per hour of ECE (2012–13) $13,43
Annual recurrent cost of ECE in YBFS (2012–13) $104.8 million
Source: Allen Consulting Group analysis, based on sources outlined in the report Overview
Building on the baseline estimates, the Allen Consulting Group’s modelling then considers the difference between the baseline results and the estimates of the likely expenditure on ECE in South Australia required to meet the objectives of the NP ECE.
Table E.2 shows the key outputs of the Allen Consulting Group’s modelling. In the baseline scenario, South Australia does not meet the NP ECE objective of 95 per cent of children enrolled in ECE, requiring an additional 7.1 per cent of children aged four years to enrol. This represents an additional 0.7 million hours required to meet the objective. Furthermore, in the model, none of the children are enrolled in at least fifteen hours of ECE, requiring an additional 2.4 million hours to meet this objective. This corresponds to a total of 3.11 million additional hours to meet the NP ECE objectives. At an average cost per hour of ECE of $13.43 (see Table E.1), meeting the NP objectives would result in an additional recurrent cost of $41.72 million. This compares with the $65.4 million that the South Australian Government receives under the NP to implement the Agreement’s objectives.

E I G H T E E N M O N T H R E V I E W O F T H E N A T I O N A L P A R T N E R S H I P A G R E E M E N T O N E A R L Y C H I L D H O O D
E D U C A T I O N
The Allen Consulting Group 76
Table E.2
RECURRENT COSTS REQUIRED TO ACHIEVE NP ECE OBJECTIVES IN SOUTH AUSTRALIA
Delivery Estimate
Hours required for 4 year old children not enrolled in ECE at all
0.9 million
Additional hours required for 4 year old children already enrolled
2.8 million
Total additional hours per year 3.7 million
Additional recurrent cost of NP ECE $49.6 million
2012-13 funding received under the NP ECE $30.9 million
Source: Allen Consulting Group analysis, based on sources outlined in the report Overview
It should be noted, however, that the estimates outlined in Table E.2 relate only to recurrent costs directly attributable to the NP ECE alone and do not consider other costs that might have a material impact on implementing the NP, such as those relating to the NP NQA and other similar initiatives. In South Australia, three considerations are relevant.
First, infrastructure costs and expenses relating to workforce could increase the total cost of implementing the NP ECE. The estimates in Table E.2 do not take into account the cost of capital of expanding the facilities available to preschool programs in the state. However, it is likely that implementing the Agreement will require expansion of existing facilities, particularly in growth areas. Capital costs are therefore a key consideration in estimates about the ‘true’ expenditure required to implement the NP.
Second, estimates also ignore the likely increases in workforce costs that would result from the initiatives in both the NP ECE and the NP NQA to improve the quality of the ECE workforce. As teacher qualifications improve, the cost of employing and retaining staff in the sector would increase. Moreover, stakeholders observed that the NP ECE may exacerbate ECE workforce shortages, since it will require additional staff in a sector where staff are already in high demand. As a result, qualified staff will be in a strong position to negotiate improvements in salaries and conditions.
Third, a number of communities in South Australia are remote, and as this chapter has argued, the cost of service provision in remote areas is significantly higher than in urban centres. Further, a number of stakeholders in South Australia identified the significant challenge of encouraging ‘hard to reach’ children and families to enrol in ECE. In this context, ‘hard to reach’ can be interpreted as suggestive of the social, cultural, economic and cultural barriers that may prevent children and families from accessing any service, the logic being that the ‘harder to reach’ children are, the costlier it is to provide them with services.

E I G H T E E N M O N T H R E V I E W O F T H E N A T I O N A L P A R T N E R S H I P A G R E E M E N T O N E A R L Y C H I L D H O O D
E D U C A T I O N
The Allen Consulting Group 77
Estimating the quantum of these ‘implementation costs’ across Australia is difficult, since they are driven, at least in part, by the different strategies adopted by state and territory governments to implement the NP. This notwithstanding, accordingly the Allen Consulting Group has relied on indicative estimates of both capital and workforce costs from the Australian Government based on input from states and territory governments to inform decision-making about the additional resources that might be required above the recurrent costs outlined in Table E.2.
Table E.3 summarises the results of this analysis and suggests that an additional $10.7 million of capital may be required to implement the NP in South Australia in 2012–13, supported by an additional $0.5 million in recurrent funding over and above the $41.7 million outlined in Table E.2. Further, an additional $1.4 million may be required each year to offset increases in workforce costs.
Table E.3
IMPLEMENTATION COSTS IN SOUTH AUSTRALIA
Item Cost
Extra capital requirements in 2012–13 (2007–08 prices)
$10.7 million
Recurrent cost of extra physical capital (2012–13 prices)
$0.5 million
Recurrent teacher salary premium $1.4 million
Source: DEEWR, email correspondence 13 December 2010, based on method outlined in the report Overview
Finally, many of these ‘implementation costs’ result from the concurrent preparation for a number of National Partnership Agreements. For example, both the NP ECE and the NP NQA will contribute to increases in both capital and workforce costs. As such, it may not be possible to attribute these implementation costs between NPs with precision. However, it is reasonable to suggest that not all of the anticipated increase in capital and workforce costs would be attributable to the NP ECE.
Summary 2 — Appropriateness of timelines for achieving the NP’s objectives
This review considers that the timelines for the implementation of the NP in South Australia are appropriate for achieving the objectives of the Agreement. However, two challenges may emerge in implementing the Agreement within the available timeframes.
First, stakeholders note that there may be regional variations in the capacity of local communities to deliver on the NP. As such, there is a danger that by promoting ‘universal access’ to a specific vision of ECE, the Agreement could overextend the ECE sector in the state, leading some providers — particularly in remote areas — to withdraw. Stakeholders suggest that the timelines, rather than the inadequacy of funding, create the greatest challenges for providers. However, as with the question of the adequacy of funding, greater flexibility in the mode of service provision may allow services to meet the objectives of the NP within the agreed timelines.

E I G H T E E N M O N T H R E V I E W O F T H E N A T I O N A L P A R T N E R S H I P A G R E E M E N T O N E A R L Y C H I L D H O O D
E D U C A T I O N
The Allen Consulting Group 78
Second, stakeholders also observed that ongoing lack of clarity prevents the ECE sector from building up the momentum required to realise the objectives of the NP by 2013. The NP ECE was signed off later than had been anticipated at the time of the bilateral negotiations, delaying some implementation strategies. Further, and as this chapter has outlined, agreements on interpretations of key concepts and commitments has not yet been achieved nationally, preventing progress in critical areas.

E I G H T E E N M O N T H R E V I E W O F T H E N A T I O N A L P A R T N E R S H I P A G R E E M E N T O N E A R L Y C H I L D H O O D
E D U C A T I O N
The Allen Consulting Group 79
Appendix F
Tasmania
F.1 Overview of early childhood education in Tasmania
Preschool program, which is called ‘kindergarten’ in Tasmania, is the non-compulsory year of part-time education the year before the compulsory preparatory year. The core kindergarten program is funded for ten hours of early childhood education (ECE) per week (although some schools offer twelve or more hours) and is predominantly delivered within the primary school system. The relevant legislation is the Education Act 1994 (Dowling, A & O’Malley, K 2009).
In the last ten years, non-government schools have increased their provision of kindergarten services. Similar developments have also occurred in the child care sector, but several services that were registered to provide kindergarten in the past have ceased (Tasmania Government 2010). In addition, there is an increase in the provision of child care on school sites in Tasmania — about 50 per cent have out of school hours care or another child care service, and about another 30 per cent have a child care centre close by.
Tasmania has a forty-year history of free provision and investment in government schools — such is the strong link between ECE and school in Tasmania that families typically regard kindergarten as ‘the first year of school’. As such, kindergarten is an integral part of primary schools in Tasmania. In the non-government sector, the Tasmanian Government funds the provision of kindergarten programs, through subsidy arrangements in the same way subsidies are paid for older students. It is apparent from the long-standing high participation rates in ECE at around 96.5 per cent (Tasmanian Government 2010) that kindergarten is valued in Tasmania and is viewed as a key enabler of children’s educational and social development.
In terms of cost, parents do not have to contribute towards kindergarten arrangements in government schools, apart from a levy of up to $190 per annum, which is subject to means testing and may not be payable. Access to government kindergarten is already ‘universal’ and is guaranteed in the Education Act. While this guarantee holds true for government schools it does not pertain to non-government setting therefore if families choose to participate in these setting a fee is applied.
Unlike in other states and territories such as the ACT, where there is a high proportion of children in formal child care due to a high female workforce participation rate, Tasmania’s female workforce participation rate (56.6 per cent (ABS 2010)) and mortgages are relatively lower. This lower workforce participation rate may act to limit demand for other forms of early childhood education and care, such as long day care, family day care and occasional care. For this reason, kindergarten represents a first point of contact with formal social and educational programs for many children and families in Tasmania.

E I G H T E E N M O N T H R E V I E W O F T H E N A T I O N A L P A R T N E R S H I P A G R E E M E N T O N E A R L Y C H I L D H O O D
E D U C A T I O N
The Allen Consulting Group 80
Figure F.1 further elaborates on the characteristics of the Tasmanian ECE sector and the achievements of Tasmania against the targets in the Bilateral Agreement for the NP ECE. It shows:
• Tasmania’s achievements in terms of hours of kindergarten provided, participation rate of all children, disadvantaged children and Indigenous children and the number of four year qualified teachers against their respective targets;
• a qualitative measure of cost of ECE to families;
• the percentage of licensed and/or registered preschool providers, by management type.
Figure F.1 shows than Tasmania faces some challenges in increasing the number of hours of ECE it provides to children. The state currently provides on average just under twelve hours of ECE to children per week (i.e. approximately 79 per cent of the target 15 hours). In other ways, however, Tasmania’s sector fares well in comparison with other Australian jurisdictions. Its participation rate is above the required 95 per cent participation, which defines universal access. Further, a relatively high number of the ECE teachers are four year trained, and the school system dominates provision — noting that the non-government sector enrols about a quarter of kindergarten children. Finally, the Tasmanian ECE sector provides ECE at a low cost to parents, relative to other states and territories.

E I G H T E E N M O N T H R E V I E W O F T H E N A T I O N A L P A R T N E R S H I P A G R E E M E N T O N E A R L Y C H I L D H O O D
E D U C A T I O N
The Allen Consulting Group 81
Figure F.1 SNAPSHOT OF TASMANIA’S ECE SYSTEM IN 2009
Hours shows the average hours per week as a percentage of the 15 hours target for 2012–13; Participation show the participation rates for all children, disadvantaged children and Indigenous children, respectively, as a percentage of the respective targets for 2012–13. — noting that participation rates for disadvantaged children and Indigenous children are measured as a proportion of all children enrolled in an ECE program; Staff shows the number of teachers delivering ECE programs who are four-year university trained and EC qualified as a percentage of the target for 2012–13. Tasmania's Bilateral Agreement does not yet include staff targets, however better workforce information will enable the target for ECE qualifications to be set; Cost shows a qualitative, three scale rating of the median weekly cost of ECE, where low is between $0 and $5, Medium is between $5 and $15 and high is over $15. ACG acknowledges that the ROGS data used (3A.26) is derived only from surveys of parents using child care and is only about net costs per child after subsidies (CCB and CCR) and may not reflect the actual out of pocket cost of ECE for families; and Setting shows the percentage of funded early childhood education program providers, by management type.
Note: ACG has gone to significant length to ensure the accuracy of data, however, it is important to note that there are inconsistencies in the way jurisdictions report data in the annual reports and bilateral agreements.
Source: Australian and Tasmanian Governments 2008; Tasmanian Government 2010; Dowling, A and O’Malley, K 2009.
F.2 Conclusion — adequacy of funding and appropriateness of timelines
This review concludes that it is likely that the Tasmanian Government will achieve the objectives of the NP ECE during the term of the NP. This conclusion draws together the barriers that have been identified throughout the chapter in relation to two key considerations:
• the adequacy of funding to achieve the NP’s objectives; and
• the appropriateness of timelines to achieve the NP’s objectives.

E I G H T E E N M O N T H R E V I E W O F T H E N A T I O N A L P A R T N E R S H I P A G R E E M E N T O N E A R L Y C H I L D H O O D
E D U C A T I O N
The Allen Consulting Group 82
Summary 1 — Adequacy of funding to achieve the NP’s objectives
This review considers that the funding supporting the implementation of the NP in Tasmania is adequate for achieving the objectives of the Agreement. Although the review finds funding adequate, it notes that several challenges will need to be addressed.
Quantitative analysis
As was described in the Overview at the beginning of this report, which details the Allen Consulting Group’s method for estimating the cost of the NP ECE in 2012–13, the Allen Consulting Group has undertaken economic modelling to estimate the funding required to implement the NP ECE in 2012–13.
As has been noted, that modelling sums the hours required to provide ECE to four year old children who do not currently access ECE in year before formal schooling (the increase in participation resulting from the ‘universal access’ commitment of the NP) and the additional hours required by children who already access a kindergarten program (the ‘fifteen hours commitment’ of the NP) to derive a total additional recurrent cost of implementing the NP ECE in 2012–13.
Further, the Allen Consulting Group’s modelling includes two scenarios. First, it estimates the likely expenditure on ECE in Tasmania (from both government and private sources) had the NP ECE not been agreed. This scenario is the ‘baseline’, on which estimates of the likely cost of implementing the NP are based.
Table F.1 lists the key variables and outputs in the baseline scenario. The Allen Consulting Group’s analysis suggests that the total expenditure on ECE in Tasmania would have increased from $26.3 million to $35.1 million between 2007–08 and 2012–13. Further, the modelling estimates that the average cost per child per hour of ECE delivered would have increased in 2012–13, even without the introduction of the NP ECE.

E I G H T E E N M O N T H R E V I E W O F T H E N A T I O N A L P A R T N E R S H I P A G R E E M E N T O N E A R L Y C H I L D H O O D
E D U C A T I O N
The Allen Consulting Group 83
Table F.1
BASELINE ESTIMATES OF TOTAL EXPENDITURE ON ECE FOR TASMANIA
Delivery Estimate
Proportion of children enrolled in ECE 96.3%
Population of children aged 4 in 2007–08 5,883
Current average hours per year 432
Hours Delivered to 4 year old children already enrolled in ECE (2007–08)
2.45 million
Total annual state and territory government expenditure on ECE
$23.1 million
Average weekly out of pocket expense by families on ECE (after subsidies)
$19.90
Average cost per child (2007–08) $4,645.58
Average cost per hour of ECE (2007–08) $10.75
Annual recurrent cost of ECE in YBFS (2007–08) $26.3 million
Average cost per child (2012–13) $5,374
Average cost per hour of ECE (2012–13) $12.44
Annual recurrent cost of ECE in YBFS (2012–13) $35.1 million
Source: Allen Consulting Group analysis, based on sources outlined in the report Overview
Building on the baseline estimates, the Allen Consulting Group’s modelling then considers the difference between the baseline results and the estimates of the likely expenditure on ECE in Tasmania required to meet the objectives of the NP ECE.
Table F.2 shows the key outputs of the Allen Consulting Group’s modelling. As this chapter has noted (see Figure F.1), Tasmania already meets the NP ECE objective of 95 per cent of children enrolled in ECE. As such, the costs for Tasmania of implementing the Agreement result from the ‘fifteen hour commitment’ of the Agreement, rather than from the ‘universal access’ commitment.
Further, Table F.2 highlights that the total estimated recurrent costs of meeting the NP ECE’s objectives is $12.8 million in 2012–13. This compares with the $10.4 million that the Tasmanian Government will receive in 2012-13 under the Agreement.
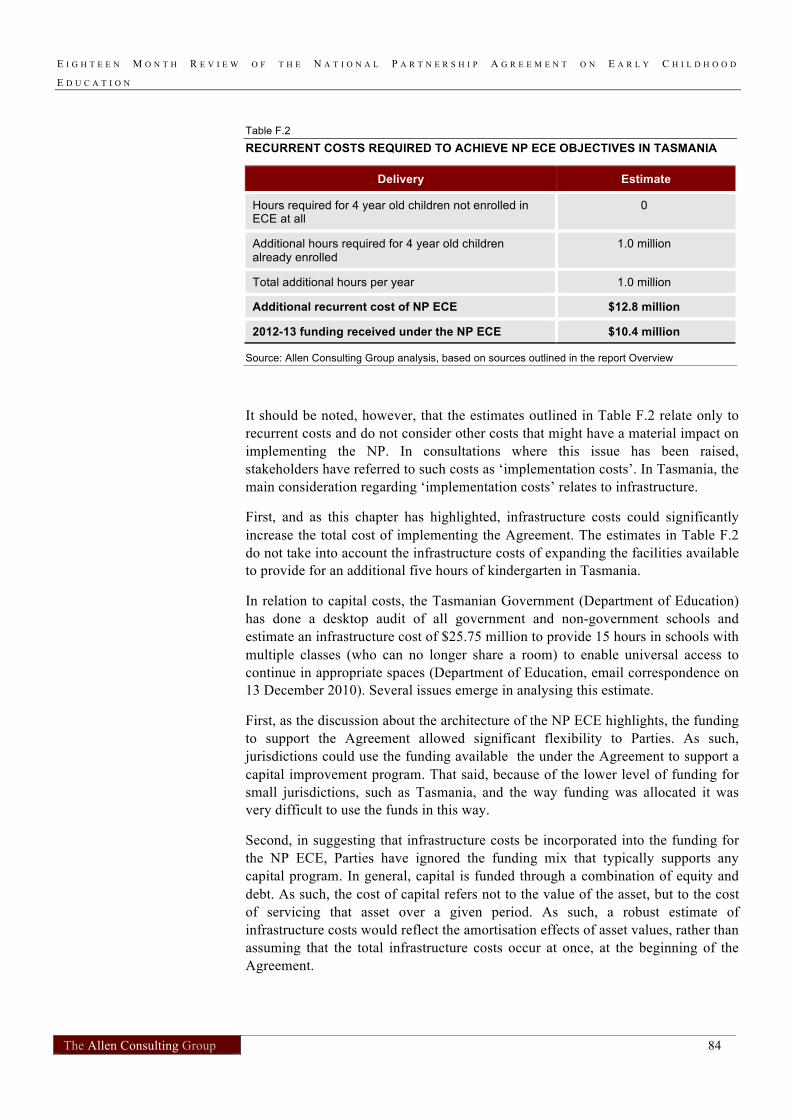
E I G H T E E N M O N T H R E V I E W O F T H E N A T I O N A L P A R T N E R S H I P A G R E E M E N T O N E A R L Y C H I L D H O O D
E D U C A T I O N
The Allen Consulting Group 84
Table F.2
RECURRENT COSTS REQUIRED TO ACHIEVE NP ECE OBJECTIVES IN TASMANIA
Delivery Estimate
Hours required for 4 year old children not enrolled in ECE at all
0
Additional hours required for 4 year old children already enrolled
1.0 million
Total additional hours per year 1.0 million
Additional recurrent cost of NP ECE $12.8 million
2012-13 funding received under the NP ECE $10.4 million
Source: Allen Consulting Group analysis, based on sources outlined in the report Overview
It should be noted, however, that the estimates outlined in Table F.2 relate only to recurrent costs and do not consider other costs that might have a material impact on implementing the NP. In consultations where this issue has been raised, stakeholders have referred to such costs as ‘implementation costs’. In Tasmania, the main consideration regarding ‘implementation costs’ relates to infrastructure.
First, and as this chapter has highlighted, infrastructure costs could significantly increase the total cost of implementing the Agreement. The estimates in Table F.2 do not take into account the infrastructure costs of expanding the facilities available to provide for an additional five hours of kindergarten in Tasmania.
In relation to capital costs, the Tasmanian Government (Department of Education) has done a desktop audit of all government and non-government schools and estimate an infrastructure cost of $25.75 million to provide 15 hours in schools with multiple classes (who can no longer share a room) to enable universal access to continue in appropriate spaces (Department of Education, email correspondence on 13 December 2010). Several issues emerge in analysing this estimate.
First, as the discussion about the architecture of the NP ECE highlights, the funding to support the Agreement allowed significant flexibility to Parties. As such, jurisdictions could use the funding available the under the Agreement to support a capital improvement program. That said, because of the lower level of funding for small jurisdictions, such as Tasmania, and the way funding was allocated it was very difficult to use the funds in this way.
Second, in suggesting that infrastructure costs be incorporated into the funding for the NP ECE, Parties have ignored the funding mix that typically supports any capital program. In general, capital is funded through a combination of equity and debt. As such, the cost of capital refers not to the value of the asset, but to the cost of servicing that asset over a given period. As such, a robust estimate of infrastructure costs would reflect the amortisation effects of asset values, rather than assuming that the total infrastructure costs occur at once, at the beginning of the Agreement.

E I G H T E E N M O N T H R E V I E W O F T H E N A T I O N A L P A R T N E R S H I P A G R E E M E N T O N E A R L Y C H I L D H O O D
E D U C A T I O N
The Allen Consulting Group 85
Finally, ‘implementation costs’ — including infrastructure costs — result from the concurrent preparation for a number of National Partnership Agreements. For example, both the NP ECE and the NP NQA will contribute to increases in both capital and workforce costs. As such, it may not be possible to attribute these implementation costs between NPs with precision. However, it is reasonable to suggest that not all of the anticipated increase in capital and workforce costs would be attributable to the NP ECE.
In short, this analysis suggests that, the funding provided to the Tasmanian Government under the NP is appropriate to achieve the Agreement’s objectives.
Summary 2 — Appropriateness of timelines for achieving the NP’s objectives
This review considers that the timelines for the implementation of the NP in Tasmania are appropriate for achieving the objectives of the Agreement. However, workforce challenges may emerge in implementing the Agreement within the available timeframes.
Although Tasmania appears to be in a good position to achieve the NP’s objectives within the timeline of the Agreement, this is based on the assumption that there will be a recognition of prior learning program for existing teachers in order to meet the qualification requirement for kindergarten teachers. First graduates will take another three years to complete the ECE degree. If there is no recognition of prior learning, Tasmania will have difficulties in ensuring the objective that states that all kindergarten teachers must hold a four-year early childhood qualification is met.

E I G H T E E N M O N T H R E V I E W O F T H E N A T I O N A L P A R T N E R S H I P A G R E E M E N T O N E A R L Y C H I L D H O O D
E D U C A T I O N
The Allen Consulting Group 86
Appendix G
Victoria
G.1 Overview of early childhood education in Victoria
In Victoria, ECE, or ‘kindergarten’, is a universal program available to all children in the year prior to school entry, when they are typically aged four years. The Victorian Government contributes to kindergarten programs for children in the year prior to school. At present, the Victorian Government’s kindergarten subsidy provides for ten hours of ECE per week for all eligible children.
Historically, kindergarten programs have been linked closely to education and have had a strong developmental focus. Services are provided by a qualified teacher, usually on a sessional basis in community based, stand-alone kindergarten programs. However, some community and private long day care centres also provide kindergarten programs, as do state, independent and Catholic schools. Not-for-profit providers have long dominated kindergarten service provision, while local governments have long been the dominant owners of kindergarten program infrastructure, holding more than a third of all buildings in which kindergarten programs operate (ACG 2009).
Box G.1 provides a summary of the characteristics of the Victorian ECE sector.
Box G.1
ECE IN VICTORIA
In 2009, there were 982 funded kindergarten providers in Victoria operating across 1,670 locations. Of these locations 1,281 were community-managed, with the single most common management structure being the incorporated association. Further, 389, or around 23% of locations were private sector operated. One-quarter, 443, of all locations were operated in LDC settings, with the remainder of locations including standard, rural, small rural and independent school settings. In total, 63,365 children were enrolled in a kindergarten program in Victoria in 2009. The distribution of enrolments largely reflects the distribution of services, with 53,600 or 85% of children enrolled in stand-alone kindergartens and the remaining 9,750 in LDC centres. Again, incorporated associations provided the largest number of places.
Source: Victoria 2010.
Figure G.1 further elaborates on the characteristics of the Victorian ECE sector and achievements of Victoria against the targets in the Bilateral Agreement for the NP ECE. In particular, it shows:
• Victoria’s achievements as a percentage of the targets for average hours of ECE provided per week, participation rates (for all children, disadvantaged children and Indigenous children) and number of teachers who are four year university trained and EC qualified;
• the cost of ECE for families (after subsidies) which is a qualitative, three scale rating of the average weekly cost of ECE, where low is between $0 and $5, medium is between $5 and $15 and high is over $15; and

E I G H T E E N M O N T H R E V I E W O F T H E N A T I O N A L P A R T N E R S H I P A G R E E M E N T O N E A R L Y C H I L D H O O D
E D U C A T I O N
The Allen Consulting Group 87
• the percentage of licensed and/or registered preschool providers, by management type.
It shows that while Victoria notionally faces a significant challenge in meeting the objective of providing fifteen hours of ECE per week (the Government subsidises ten hours of ECE per week for children in the year before school), on average, Victorian children receive more hours of ECE per week than children in other jurisdictions. Figure G.1 also shows that Victoria’s participation rate is very high among all children, but that participation is lower among Aboriginal and Torres Strait Islander children.
Additionally, Victoria already has approximately 83 per cent of the required number of four year university trained and EC qualified teachers in 2012–13 (i.e. relative to the bilateral trajectory of1,000 qualified teachers in 2012–13) and the cost of ECE is high by national standards — noting that the actual requirement as indicated by the Victorian Government is vastly greater (2,084 teachers). Finally, the Victorian ECE sector is a mixed market, where children and families can access ECE in a variety of locations and in a range of settings. This notwithstanding, community services — a significant majority of which are stand alone kindergarten programs — provide ECE to the majority of Victorian children.

E I G H T E E N M O N T H R E V I E W O F T H E N A T I O N A L P A R T N E R S H I P A G R E E M E N T O N E A R L Y C H I L D H O O D
E D U C A T I O N
The Allen Consulting Group 88
Figure G.1 SNAPSHOT OF VICTORIA’S ECE SYSTEM IN 2009
Hours shows the average hours per week as a percentage of the target for 2012–13 as set out in the source data; Participation shows the participation rates for all children, disadvantaged children and Indigenous children, respectively, as a percentage of the respective targets for 2012–13, noting that participation rates for disadvantaged and Indigenous children are measure as a proportion of all disadvantaged children and Indigenous children enrolled in an ECE program, respectively; Staff shows the number of teachers delivering ECE programs who are four-year university trained and EC qualified as a percentage of the target for 2012–13 as stated in the Bilateral Agreement; Cost shows a qualitative, three scale rating of the median weekly cost of ECE, where low is between $0 and $5, Medium is between $5 and $15 and high is over $15; and Setting shows the percentage of funded early childhood education program providers, by management type.
ACG has gone to significant length to ensure the accuracy of data, however, it is important to note that there are inconsistencies in the way jurisdictions report data in the annual reports and bilateral agreements.
Source: Australian and Victorian Governments 2008, Victorian Government 2010; Dowling, A and O’Malley, K 2009.
G.2 Conclusion — adequacy of funding and appropriateness of timelines
This review concludes that although significant challenges exist it is likely that the Victorian Government will achieve the objectives of the NP ECE during the term of the NP. This review also notes, however, that the cost of Victoria achieving the NP’s objectives may be significant, and will require the successful management of many social, geographic, economic, cultural and industrial barriers. This conclusion draws together the barriers that have been identified throughout the chapter in relation to two key considerations:
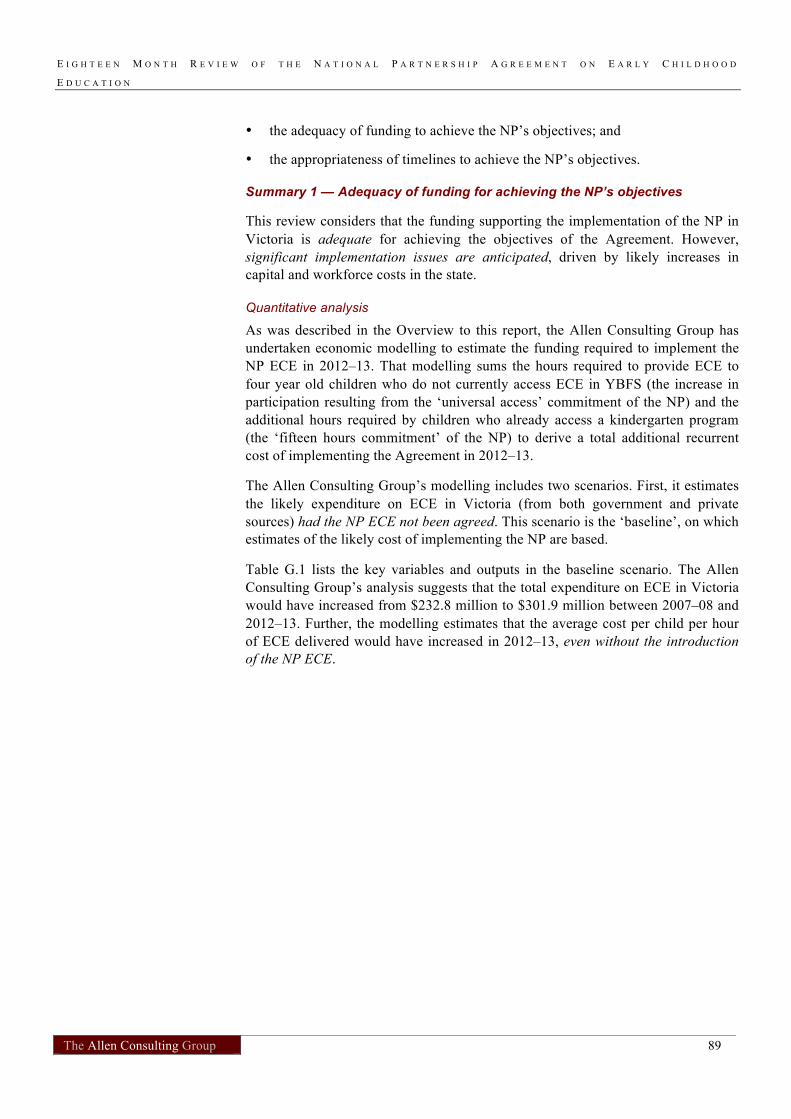
E I G H T E E N M O N T H R E V I E W O F T H E N A T I O N A L P A R T N E R S H I P A G R E E M E N T O N E A R L Y C H I L D H O O D
E D U C A T I O N
The Allen Consulting Group 89
• the adequacy of funding to achieve the NP’s objectives; and
• the appropriateness of timelines to achieve the NP’s objectives.
Summary 1 — Adequacy of funding for achieving the NP’s objectives
This review considers that the funding supporting the implementation of the NP in Victoria is adequate for achieving the objectives of the Agreement. However, significant implementation issues are anticipated, driven by likely increases in capital and workforce costs in the state.
Quantitative analysis
As was described in the Overview to this report, the Allen Consulting Group has undertaken economic modelling to estimate the funding required to implement the NP ECE in 2012–13. That modelling sums the hours required to provide ECE to four year old children who do not currently access ECE in YBFS (the increase in participation resulting from the ‘universal access’ commitment of the NP) and the additional hours required by children who already access a kindergarten program (the ‘fifteen hours commitment’ of the NP) to derive a total additional recurrent cost of implementing the Agreement in 2012–13.
The Allen Consulting Group’s modelling includes two scenarios. First, it estimates the likely expenditure on ECE in Victoria (from both government and private sources) had the NP ECE not been agreed. This scenario is the ‘baseline’, on which estimates of the likely cost of implementing the NP are based.
Table G.1 lists the key variables and outputs in the baseline scenario. The Allen Consulting Group’s analysis suggests that the total expenditure on ECE in Victoria would have increased from $232.8 million to $301.9 million between 2007–08 and 2012–13. Further, the modelling estimates that the average cost per child per hour of ECE delivered would have increased in 2012–13, even without the introduction of the NP ECE.

E I G H T E E N M O N T H R E V I E W O F T H E N A T I O N A L P A R T N E R S H I P A G R E E M E N T O N E A R L Y C H I L D H O O D
E D U C A T I O N
The Allen Consulting Group 90
Table G.1
BASELINE ESTIMATES OF TOTAL EXPENDITURE ON ECE IN VICTORIA
Variable Estimate
Proportion of children enrolled in ECE 95.8%
Population of children aged 4 in 2007–08 62,033
Current average hours per year 400
Hours Delivered to 4 year old children already enrolled in ECE (2007–08)
23.8 million
Total annual state and territory government expenditure on ECE
$148.8 million
Average weekly out of pocket expense by families on ECE (after subsidies)
$34.52
Average cost per child (2007–08) $3,818.06
Average cost per hour of ECE (2007–08) $9.55
Annual recurrent cost of ECE in YBFS (2007–08) $232.8 million
Average cost per child (2012–13) $4,417
Average cost per hour of ECE (2012–13) $11.04
Annual recurrent cost of ECE in YBFS (2012–13) $301.9 million
Note: Local government contribution is not included in the analysis
Source: Allen Consulting Group analysis, based on sources outlined in the report Overview
Building on the baseline estimates, the Allen Consulting Group’s modelling then considers the difference between the baseline results and the estimates of the likely expenditure on ECE in Victoria required to meet the objectives of the NP ECE.
Table G.2 shows the key outputs of the Allen Consulting Group’s modelling. As this chapter has noted (see Figure G.1), Victoria already meets the NP ECE objective of 95% of children enrolled in ECE. As such, the costs for Victoria of implementing the Agreement result from the ‘fifteen hour commitment’ of the Agreement, rather than from the ‘universal access’ commitment. Further, Table G.2 highlights that the total estimated recurrent costs of meeting the NP ECE’s objectives is $141.1 million in 2012–13. This compares with the $109.5 million that the Victorian Government will receive under the NP in 2012-13.
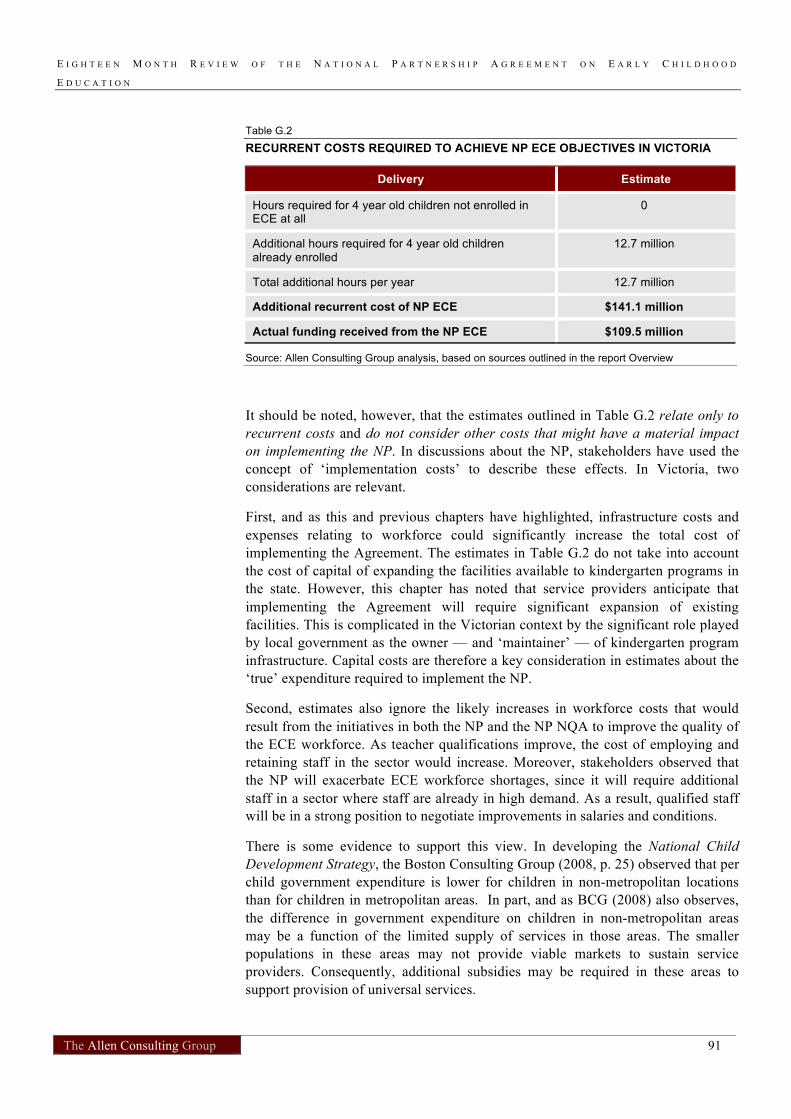
E I G H T E E N M O N T H R E V I E W O F T H E N A T I O N A L P A R T N E R S H I P A G R E E M E N T O N E A R L Y C H I L D H O O D
E D U C A T I O N
The Allen Consulting Group 91
Table G.2
RECURRENT COSTS REQUIRED TO ACHIEVE NP ECE OBJECTIVES IN VICTORIA
Delivery Estimate
Hours required for 4 year old children not enrolled in ECE at all
0
Additional hours required for 4 year old children already enrolled
12.7 million
Total additional hours per year 12.7 million
Additional recurrent cost of NP ECE $141.1 million
Actual funding received from the NP ECE $109.5 million
Source: Allen Consulting Group analysis, based on sources outlined in the report Overview
It should be noted, however, that the estimates outlined in Table G.2 relate only to recurrent costs and do not consider other costs that might have a material impact on implementing the NP. In discussions about the NP, stakeholders have used the concept of ‘implementation costs’ to describe these effects. In Victoria, two considerations are relevant.
First, and as this and previous chapters have highlighted, infrastructure costs and expenses relating to workforce could significantly increase the total cost of implementing the Agreement. The estimates in Table G.2 do not take into account the cost of capital of expanding the facilities available to kindergarten programs in the state. However, this chapter has noted that service providers anticipate that implementing the Agreement will require significant expansion of existing facilities. This is complicated in the Victorian context by the significant role played by local government as the owner — and ‘maintainer’ — of kindergarten program infrastructure. Capital costs are therefore a key consideration in estimates about the ‘true’ expenditure required to implement the NP.
Second, estimates also ignore the likely increases in workforce costs that would result from the initiatives in both the NP and the NP NQA to improve the quality of the ECE workforce. As teacher qualifications improve, the cost of employing and retaining staff in the sector would increase. Moreover, stakeholders observed that the NP will exacerbate ECE workforce shortages, since it will require additional staff in a sector where staff are already in high demand. As a result, qualified staff will be in a strong position to negotiate improvements in salaries and conditions.
There is some evidence to support this view. In developing the National Child Development Strategy, the Boston Consulting Group (2008, p. 25) observed that per child government expenditure is lower for children in non-metropolitan locations than for children in metropolitan areas. In part, and as BCG (2008) also observes, the difference in government expenditure on children in non-metropolitan areas may be a function of the limited supply of services in those areas. The smaller populations in these areas may not provide viable markets to sustain service providers. Consequently, additional subsidies may be required in these areas to support provision of universal services.

E I G H T E E N M O N T H R E V I E W O F T H E N A T I O N A L P A R T N E R S H I P A G R E E M E N T O N E A R L Y C H I L D H O O D
E D U C A T I O N
The Allen Consulting Group 92
This section has considered a number of ‘implementation costs’, relating to the variable social, cultural and geographic conditions within which ECE is delivered. However, estimating the quantum of these ‘implementation costs’ across Australia is difficult, since they are driven, at least in part, by the different strategies adopted by state and territory governments to implement the NP. Accordingly, the Allen Consulting Group has relied on indicative estimates of workforce costs from the Australian Government and capital costs from the Victorian Government to inform decision-making about the additional resources that might be required above the recurrent costs outlined in Table G.2.
This analysis suggests that an additional $273.0 million of capital may be required to implement the NP in Victoria in 2012–13 over and above the $141.1 million outlined in Table G.2. Further, an additional $0.9 million may be required each year to offset increases in workforce costs. It should be noted that this estimate of capital required in Victoria comes from PricewaterhouseCoopers analysis commissioned for the Victorian Government, and is not comparable with the same figures reported in other jurisdictions. The discrepancies between infrastructure costs identified in the Commonwealth analysis and the PwC analysis conducted for the Victorian Government suggest that significantly more work is required in order to analyse and anticipate infrastructure costs as they pertain to the NP ECE.
Table G.3
IMPLEMENTATION COSTS IN VICTORIA
Cost Estimate
Total cost estimate (2012–13) for services requiring additional infrastructure to implement UA1
Funded: $249.1 million Unfunded: $23.9 million All services: $273.0 million
Recurrent cost of extra physical capital (2012–13 prices)
-
Additional salary in 2013 (10% salary premium of $4,599.30) (Number of additional four year trained teachers: 194)
$0.9 million
Source: DEECD, email correspondence 13 December 2010, based on method outlined in the report Overview
However, the concept of ‘implementation costs’ has not been well defined by Parties to the Agreement, and several issues emerge in thinking through this idea.
First, as the discussion about the architecture of the NP ECE highlights, the funding to support the Agreement allowed significant flexibility to Parties. As such, jurisdictions could use — and in Victoria’s case, have used — the funding available to the under the Agreement to support a capital improvement program.

E I G H T E E N M O N T H R E V I E W O F T H E N A T I O N A L P A R T N E R S H I P A G R E E M E N T O N E A R L Y C H I L D H O O D
E D U C A T I O N
The Allen Consulting Group 93
Second, in suggesting that infrastructure costs be incorporated into the funding for the NP ECE, Parties have ignored the funding mix that typically supports any capital program. In general, capital is funded through a combination of equity and debt. As such, the cost of capital refers not to the value of the asset, but to the cost of servicing that asset over a given period. As such, a robust estimate of infrastructure costs would reflect the amortisation effects of asset values, rather than assuming that the total infrastructure costs occur at once, at the beginning of the Agreement.
Finally, ‘implementation costs’ result from the concurrent preparation for a number of National Partnership Agreements. For example, both the NP ECE and the NP NQA will contribute to increases in both capital and workforce costs. As such, it may not be possible to attribute these implementation costs between NPs with precision. However, it is reasonable to suggest that not all of the anticipated increase in capital and workforce costs would be attributable to the NP ECE.
This notwithstanding, the review acknowledges stakeholders' observations that, particularly in jurisdictions with 'mixed markets' for ECE, such as Victoria, no single actor in the ECE sector is solely responsible for infrastructure. In particular, the role of local governments in planning and developing early childhood infrastructure is significant in some jurisdictions. For example, and as the review heard in consultations, some local governments provide ECE facilities for 'peppercorn' rents to community service organisations, effectively subsidising ECE provision in some local areas. While the methodology outlined in Chapter 1 includes private contributions to ECE through parental fees, it does not incorporate subsidies (either implicit or explicit) from local government or other private actors, in large part because little evidence exists on the extent or value of such subsidies. To this end, significant further work would be required to fully represent all contributions to the ECE sector in the Allen Consulting Group's model.
Leaving these concerns aside, however, analysis to incorporate the concept of ‘implementation costs’ into an assessment of the adequacy of funding under the NP ECE suggests that infrastructure costs, workforce issues and the variable costs of provision caused by social, cultural, economic and geographic factors do not significantly impact on the overall expenditure required to implement the Agreement, particularly when their amortised value in any one year — rather than their full asset value — is taken into account.
Summary 2 — Appropriateness of timelines for achieving the NP’s objectives
This review considers that the timelines for the implementation of the NP in Victoria are appropriate for achieving the objectives of the Agreement. However, three challenges may emerge in implementing the Agreement within the available timeframes.
First, workforce issues remain a significant challenge. Stakeholders note that implementing the NP is likely to lead to significant ECE workforce shortages. Further, the combined NP ECE and NP NQA reforms have created twin demand drivers for early childhood education training, such that training providers may not be able to meet additional demand for ECE workforce development in the short and medium terms.

E I G H T E E N M O N T H R E V I E W O F T H E N A T I O N A L P A R T N E R S H I P A G R E E M E N T O N E A R L Y C H I L D H O O D
E D U C A T I O N
The Allen Consulting Group 94
Second, there is a danger that driving the sector too quickly towards the objectives of the NP ECE may create incentives for service providers that potentially worsen outcomes for children. For example, Victorian stakeholders observed that in focusing on the provision of ECE for children in the year before formal schooling, service providers may reduce their service offerings for younger children and children with a disability or with special needs. By potentially reducing opportunities for younger children and children with a disability or special need, implementing universal access on ECE programs for three year old could undermine efforts to engage children and families who are at most risk of developmental vulnerabilities.
Third, the schedule by which the NP funding has been distributed to the Victorian Government to implement the Agreement has not allowed for timely delivery of capital programs. The majority of Australian Government funding to implement the NP will be provided to Victoria in the last two years of the Agreement. Given the significant lead times required to successfully deliver capital programs, providing funding to Victoria earlier would have improved the likelihood of the timely implementation of the NP.
As a consequence of these issues, a significant proportion of services in Victoria — and a majority of services that are not part of an ECE ‘cluster’ — do not anticipate being able to implement universal access without ‘some assistance’ or ‘significant change’. While this fact suggests that services will have to be supported to implement the Agreement effectively, the qualitative findings throughout this chapter outline the significant efforts to which the Victorian Government has gone to build up the capacity of the sector to deliver the NP’s objectives.
It should be noted that many of the major issues relating to Victoria’s timely achievement of the NP ECE objectives — including those relating to the supply of the ECE workforce, the additional expenditure required and the integration of early childhood education with other services — require collaboration between governments, providers, workers and the community. No one actor in ECE can act alone to achieve specific outcomes. As such, the successful implementation and maintenance of the NP will require negotiation and compromise between the Victorian and Australian Governments, sector stakeholders and families.

E I G H T E E N M O N T H R E V I E W O F T H E N A T I O N A L P A R T N E R S H I P A G R E E M E N T O N E A R L Y C H I L D H O O D
E D U C A T I O N
The Allen Consulting Group 95
Appendix H
Western Australia
H.1 Overview of early childhood education in Western Australia
School-based kindergarten system
In Western Australia preschool is called ‘kindergarten’ and is part of the public education system. Kindergarten, is the first year of pre-compulsory schooling and is offered as a universal program for all children who reach the age of four years on or before June 30 of the school year (School Education Act 1999). Although attendance at kindergarten and pre-primary is not compulsory, more than 95 per cent of all age-eligible children in Western Australia were enrolled in a public or non-government school-based kindergarten program as of Semester 2, 2009 (Government of Western Australia 2010; Australian Schools Directory).
Of the children enrolled, 72 per cent attended a public school. In Semester 2, 2009 Western Australian public schools enrolled 19,774 kindergarten children of whom 1,603 were Indigenous. The remaining 28 per cent attending kindergarten at a non-government school comprised 7,557 children of whom 228 were Indigenous (Government of Western Australia 2010).
As prescribed in the School Education Act 1999 the universal kindergarten program guarantees a minimum of eleven hours per week of kindergarten provided in public schools for four-year-olds, with Aboriginal kindergartens offering programs also for three years olds that are turning four by the end of the year. In all public and non-government schools, kindergarten is taught by university degree qualified teachers (IBISWorld 2010; Government of Western Australia 2010).
In Western Australia, where kindergartens are integral to schools and mostly located on school sites, families consider kindergarten as part of school. Most parents in Western Australia would consider kindergarten the point at which children ‘start school’.
Figure H.1 further elaborates on the characteristics of the Western Australian ECE sector and achievements of Western Australia against the targets in the Bilateral Agreement for the NP ECE. In particular, it shows:
• Western Australia’s achievements as a percentage of the targets for average hours of ECE provided per week, the participation rate for all children, disadvantaged children and Indigenous children and the number of four year qualified teachers;
• the cost of ECE for families (after subsidies) which is a qualitative, three-scale rating of the average weekly cost of ECE, where low is between $0 and $5, medium is between $5 and $15 and high is over $15; and
• the percentage of licensed and/or registered preschool providers, by management type.

E I G H T E E N M O N T H R E V I E W O F T H E N A T I O N A L P A R T N E R S H I P A G R E E M E N T O N E A R L Y C H I L D H O O D
E D U C A T I O N
The Allen Consulting Group 96
The figure shows that a high proportion of children — including Aboriginal and Torres Strait Islander children — participate in ECE. However, data on participation among disadvantaged children is only available from the Index of Community Socio-Educational Advantage (ICSEA) and provided at the whole school level for all sectors (Government of WA 2010). On average, children receive eleven hours of ECE per week. In December 2009, there were a total of 470 full-time equivalent four year trained teachers in public schools — noting that the proportion of teachers with an early childhood education qualification is currently unknown (Government of WA 2010). As has been noted, school is the only setting in which ECE is provided in the state, and the cost of ECE in Western Australia is low by national standards.
Figure H.1
SNAPSHOT OF WESTERN AUSTRALIA’S ECE SYSTEM IN 2009
Note: Hours shows the average hours per week as a percentage of the 15 hours target for 2012–13; Participation shows the participation rates for all children, disadvantaged children and Indigenous children, respectively, as a percentage of the respective targets for 2012–13; noting that quantitative data for disadvantaged children is available from ICSEA in terms of socio-economic index and provided by the Australian Curriculum, Assessment and Reporting Authority (ACARA) at the whole school level only or all sectors; Staff shows the number of teachers delivering ECE programs who are four-year university trained and EC qualified as a percentage of the target for 2012–13; Cost shows a qualitative, three-scale rating of the median weekly cost of ECE, where low is between $0 and $5, medium is between $5 and $15 and high is over $15; and Setting shows the percentage of funded early childhood education program providers, by management type.
ACG has gone to significant length to ensure the accuracy of data, however, it is important to note that there are inconsistencies in the way jurisdictions report data in the annual reports and bilateral agreements.
Source: Australian and Western Australian Governments 2008, Government of WA 2010; Dowling, A and O’Malley, K 2009.

E I G H T E E N M O N T H R E V I E W O F T H E N A T I O N A L P A R T N E R S H I P A G R E E M E N T O N E A R L Y C H I L D H O O D
E D U C A T I O N
The Allen Consulting Group 97
Key stakeholders and service settings
Key providers of kindergarten programs in Western Australia are schools operated by the State government as well as the Catholic education and independent school sectors. In fact, all public schools and Catholic and most independent schools in Western Australia offer kindergarten programs.
Across these providers, options for parents include secular, religious and philosophy-based programs (e.g. Steiner, Montessori). The government provides school-based kindergartens as well as community kindergartens that are attached to and quality-assured by primary schools and funded by the Department of Education (DoE). In addition to mainstream Kindergarten programs, Western Australian public schools provide several specialist kindergarten programs, including Aboriginal Kindergartens and specialist Early Intervention Programs for children with disabilities or learning difficulties.
Schools within the Catholic and public school systems operate systemically to provide kindergarten within systemic parameters (including hours of provision and standards relating to staff ratios and qualifications). Greater flexibility is, however, evident among independent schools, with some independent schools opting to not offer kindergarten at all.
Several Catholic and independent schools offer long day care in concert with their kindergarten program, but the School Education Act 1999 currently prevents this provision in the public sector — this is being reviewed through the National Quality Agenda and may change in coming years, but is part of the landscape for Early Childhood Education National Partnership to date (Government of Western Australia 2010c [unpublished]).
Funding arrangements
Western Australia has made a significant investment in preschool provision in the public, Catholic and independent school sectors over many years. The Western Australian Government has supported the kindergarten year in non-government schools, as illustrated below in Table H.1. In 2009-2010, the Western Australian Government contributed approximately $18 million to kindergarten provision in non-government schools and approximately $95 million to kindergarten provision in public schools.

E I G H T E E N M O N T H R E V I E W O F T H E N A T I O N A L P A R T N E R S H I P A G R E E M E N T O N E A R L Y C H I L D H O O D
E D U C A T I O N
The Allen Consulting Group 98
Table H.1
BROAD COMPARISON OF WESTERN AUSTRALIAN FUNDING SOURCES FOR KINDERGARTEN, PRE-PRIMARY AND COMPULSORY SCHOOLING YEARS IN NON-GOVERNMENT SCHOOLS PRIOR TO THE EARLY CHILDHOOD EDUCATION NATIONAL PARTNERSHIP
Kindergarten Pre-primary Compulsory years (yr 1-12)
Commonwealth Contribution (Average)
0% 50% 50%
State Contribution (Average)
75% 25% 25%
Contribution from Families/Parents (Average)
25% 25% 25%
Note: Proportions in the above table does not seek to represent how the sliding scale applicable to different categories of non-government schools affects the quantum of financial assistance they receive from Commonwealth or State Government sources.
Source: Government of Western Australia 2010c [unpublished].
The investment by the State government has also been a key factor in Western Australia’s high rates of kindergarten participation, including in the numerous remote localities in the Kimberley, Pilbara, Goldfields and Midwest regions.
The total funding provided by the Commonwealth for implementing the NP in Western Australia is $98.4 million (exclusive of GST), payable by the instalments is outlined in Table H.2. The bulk of the funding is provided late in the implementation period, and may impact on the roll-out of activities that will contribute to the NP’s implementation. For example, because of the low initial investment, capital works to support the NP’s implementation will begin in 2012 at the earliest.

E I G H T E E N M O N T H R E V I E W O F T H E N A T I O N A L P A R T N E R S H I P A G R E E M E N T O N E A R L Y C H I L D H O O D
E D U C A T I O N
The Allen Consulting Group 99
Table H.2
OVERVIEW OF INSTALMENTS
Amount Payable on acceptance by the Commonwealth of
Payable no later than
$3,700,000 Signing of this agreement 7 June 2009
$3,900,000 Data Capability Report due by 30 June 2009 7 Oct 2009
$3,800,000 Progress Report due by 30 September 2009 7 Dec 2009
$8,000,000 Annual Report due by 31 March 2010 7 Jul 2010
$1,700,000 Progress Report due by 30 September 2010 7 Dec 2010
$14,850,000 Annual Progress Report due by 31 March 2011 7 Jul 2011
$14,850,000 Progress Report due by 30 September 2011 7 Dec 2011
$23,801,000 Annual Report due by 31 March 2012 7 Jul 2012
$23,801,000 Progress Report due by 30 September 2012 7 Dec 2013
Source: Australian Government and State of Western Australia 2008.
H.2 Conclusion — adequacy of funding and appropriateness of timelines
This chapter has reviewed Western Australia’s progress toward the implementation of the NP ECE. It has considered the Western Australian Government’s objectives for the NP, the activities undertaken so far in the NP’s implementation and whether the objectives of the NP are likely to be met during the term of the Agreement.
In summary, this review concludes that it is likely that the Western Australian Government will achieve the objectives of the NP ECE during the term of the NP. This conclusion draws together the barriers that have been identified throughout the chapter in relation to two key considerations:
• the adequacy of funding to achieve the NP’s objectives; and
• the appropriateness of timelines to achieve the NP’s objectives.
Summary 1 — Adequacy of funding to achieve the NP’s objectives
This review considers that the funding supporting the implementation of the NP ECE in Western Australia is adequate for achieving the objectives of the Agreement. Quantitative and qualitative analysis informs this conclusion.
Quantitative analysis
As was described in the Overview to this report, the Allen Consulting Group has undertaken economic modelling to estimate the funding required to implement the NP ECE in 2012–13. That modelling sums the hours required to provide ECE to four year old children who do not currently access ECE in the year before school (the increase in participation resulting from the ‘universal access’ commitment of the NP) and the additional hours required by children who already access a kindergarten program (the ‘fifteen hours commitment’ of the NP) to derive a total additional recurrent cost of implementing the Agreement in 2012–13.

E I G H T E E N M O N T H R E V I E W O F T H E N A T I O N A L P A R T N E R S H I P A G R E E M E N T O N E A R L Y C H I L D H O O D
E D U C A T I O N
The Allen Consulting Group 100
Further, the Allen Consulting Group’s modelling includes two scenarios. First, it estimates the likely expenditure on ECE in Western Australia (from both government and private sources) had the NP ECE not been agreed. This scenario is the ‘baseline’ on which estimates of the likely cost of implementing the NP are based.
Table H.3 lists the key variables and outputs in the baseline scenario. The Allen Consulting Group’s analysis suggests that the total expenditure on ECE in Western Australia would have increased from $63.9 million to $91.7 million between 2007–08 and 2012–13. Further, the modelling estimates that the average cost per child per hour of ECE delivered would have increased slightly in 2012–13, even without the introduction of the NP ECE.
Table H.3
BASELINE ESTIMATES OF TOTAL EXPENDITURE ON ECE IN WESTERN AUSTRALIA
Delivery Estimate
Proportion of children enrolled in ECE 95.4%
Population of children aged 4 in 2007–08 25,304
Current average hours per year 440
Hours Delivered to 4 year old children already enrolled in ECE (2007–08)
10.62 million
Total annual state and territory government expenditure on ECE $63.9 million
Average weekly out of pocket expense by families on ECE (after subsidies)
$8.80
Average cost per child (2007–08) $2,678.60
Average cost per hour of ECE (2007–08) $6.09
Annual recurrent cost of ECE in YBFS (2007–08) $67.7 million
Average cost per child (2012–13) $3,099
Average cost per hour of ECE (2012–13) $7.04
Annual recurrent cost of ECE in YBFS (2012–13) $91.7 million
Note: Non government contribution is not included in the analysis
Source: Allen Consulting Group analysis, based on sources outlined in the report Overview
Building on the baseline estimates, the Allen Consulting Group’s modelling then considers the difference between the baseline results and the estimates of the likely expenditure on ECE in Western Australia required to meet the objectives of the NP ECE.
E I G H T E E N M O N T H R E V I E W O F T H E N A T I O N A L P A R T N E R S H I P A G R E E M E N T O N E A R L Y C H I L D H O O D
E D U C A T I O N
The Allen Consulting Group 101
Table H.4 shows the key outputs of the Allen Consulting Group’s modelling. In the baseline scenario, Western Australia does already meet the NP ECE objective of 95 per cent of children enrolled in ECE. However, none of the children are enrolled in at least fifteen hours of ECE, requiring an additional 4.7 million hours to meet this objective. At an average cost per hour of ECE of $7.04 (see Table H.3), meeting the NP objectives would result in an additional recurrent cost of $33.3 million. This compares with the $47.6 million that the Western Australian Government will receive under the NP in 2012-13.
Table H.4
RECURRENT COSTS REQUIRED TO ACHIEVE NP ECE OBJECTIVES IN WESTERN AUSTRALIA
Delivery Estimate
Hours required for 4 year old children not enrolled in ECE at all
0
Additional hours required for 4 year old children already enrolled
4.7 million
Total additional hours per year 4.7 million
Additional recurrent cost of NP ECE $33.3 million
2012-13 funding received under the NP ECE $47.6 million
Note: Non government contribution is not included in the analysis
Source: Allen Consulting Group analysis, based on sources outlined in the report Overview
It should be noted, however, that the estimates outlined in Table H.4 relate only to recurrent costs directly attributable to the NP ECE alone and do not consider other costs that might have an impact on the implementation of the NP, such as those relating to the NP NQA and other similar initiatives.
Estimating the quantum of these ‘implementation costs’ across Australia is difficult, since they are driven, at least in part, by the different strategies adopted by state and territory governments to implement the NP. This notwithstanding, accordingly the Allen Consulting Group has relied on indicative estimates of both capital and workforce costs from the Australian Government based on input from states and territory governments to inform decision-making about the additional resources that might be required above the recurrent costs outlined in Table H.4. Table H.5 summarises the results of this analysis.

E I G H T E E N M O N T H R E V I E W O F T H E N A T I O N A L P A R T N E R S H I P A G R E E M E N T O N E A R L Y C H I L D H O O D
E D U C A T I O N
The Allen Consulting Group 102
Table H.5
IMPLEMENTATION COSTS IN WESTERN AUSTRALIA
Item Costs
Extra capital requirements in 2012–13 (2007–08 prices) $0
Recurrent cost of extra physical capital (2012–13 prices) $0
Recurrent teacher salary premium $0.5 million
Note: These figures do not represent the estimates of the Western Australian Government, and have been contested by the Western Australian Government. They have been used in this report for their consistency with assumptions made for other Parties to the Agreement.
Source: DEEWR, email correspondence 13 and 17 December 2010.
In relation to ‘implementation costs’ Western Australia, three considerations are relevant.
First, contrary to most other Australian states and territories, where significant costs of capital related to the expansion of existing facilities are expected, Western Australian infrastructure is generally deemed sufficient. Consequently, this analysis suggests that no extra funding will be required for capital costs to implement the NP in Western Australia in 2012–13.
Second, as teacher qualifications improve, the cost of employing and retaining staff in the sector would also increase. Moreover, stakeholders observed that the NP ECE may exacerbate ECE workforce shortages, since it will require additional staff in a sector where staff are already in high demand. As a result, qualified staff will be in a strong position to negotiate improvements in salaries and conditions. The Allen Consulting Group estimates that an additional $0.5 million may be required each year to offset increases in workforce costs.
Third, many communities in Western Australia are remote, and as this chapter has argued, the cost of service provision in remote areas is significantly higher than in urban centres. Further, a number of stakeholders in Western Australia identified the significant challenge of encouraging ‘hard to reach’ children and families to enrol in ECE. In this context, ‘hard to reach’ can be interpreted as suggestive of the social, cultural, economic and cultural barriers that may prevent children and families from accessing any service, the logic being that the ‘harder to reach’ children are, the costlier it is to provide them with services.
It is important to note that these ‘implementation costs’ result from the concurrent preparation for a number of NPs. For example, both the NP ECE and the NP NQA will contribute to increases in workforce costs. As such, it may not be possible to attribute these costs between NPs with precision. However, it is reasonable to suggest that not all of the anticipated increase workforce costs would be attributable to the NP ECE.
Summary 2 — Appropriateness of timelines for achieving the NP’s objectives
This review considers that the timelines for the implementation of the NP in Western Australia are appropriate for achieving the objectives of the Agreement.

E I G H T E E N M O N T H R E V I E W O F T H E N A T I O N A L P A R T N E R S H I P A G R E E M E N T O N E A R L Y C H I L D H O O D
E D U C A T I O N
The Allen Consulting Group 103
Western Australia is well placed to meet the objectives of the NP. The state already offers a universal kindergarten program in place in Western Australia, and has a very high participation rate. Further, its sector is well developed and can build on a strong school system as a base.
However, it is important to note that there are locations in Western Australia, particularly the remote and very remote locations, where fully implementing the NP requirements will be challenging within the timelines of the NP ECE. Providing fifteen hours of quality ECE to all four year olds face-to-face by a four-year university trained teacher may not be achievable, at least in the near future.
Furthermore, the objective of the NP to make ECE programs ‘accessible across a diversity of settings’ may be challenging for the Western Australian ECE sector in the term of the NP ECE. Legislative and other barriers exist that prevent the integration of ECE across a variety of settings.

E I G H T E E N M O N T H R E V I E W O F T H E N A T I O N A L P A R T N E R S H I P A G R E E M E N T O N E A R L Y C H I L D H O O D
E D U C A T I O N
The Allen Consulting Group 104
References
Access Economics 2010 [unpublished], Implementation of the National Partnership on Early Childhood Education in Victoria: recurrent service delivery funding analysis, report to the Department of Education and Early Childhood Education, Melbourne.
ACT Government 2010a, ACT Children’s Plan 2010-2014: Vision and building blocks for a child friendly city, Canberra.
ACT Government 2010b, 2009 Annual Report for Universal Access to 15 hours of Preschool Education for ACT, December 2009, Department of Education and Training, Canberra.
Allen Consulting Group 2008 [unpublished], Review of the Department of Education Community Assistance Scheme (DECKAS), report to the Queensland Department of Education, Training and the Arts, Brisbane.
Allen Consulting Group 2009 [unpublished], A capital idea — Establishing an Early Childhood Infrastructure Fund, report to the Department of Education and Early Childhood Education, Melbourne.
Australian and ACT Governments 2008, Bilateral Agreement on Achieving Universal Access to Early Childhood Education, Department of Education, Employment and Workplace Relations and Australian Capital Territory Department of Education and Training, Canberra.
Australian and Northern Territory Governments 2008, Bilateral Agreement on Achieving Universal Access to Early Childhood Education, Department of Education, Employment and Workplace Relations and Department of Education and Training, Canberra and Darwin.
Australian and NSW Governments 2008, Bilateral Agreement on Achieving Universal Access to Early Childhood Education, Department of Education, Employment and Workplace Relations and the Department of Community Services and the Department of Training, Canberra and Sydney.
Australian and Queensland Governments 2008, Bilateral Agreement on Achieving Universal Access to Early Childhood Education, Department of Education, Employment and Workplace Relations and the Office for Early Childhood Education and Care, Canberra and Brisbane.
Australian and South Australian Governments 2008, Bilateral Agreement on Achieving Universal Access to Early Childhood Education, Department of Education, Employment and Workplace Relations and the Department of Education and Children’s Services, Canberra and Adelaide.
Australian and Tasmanian Governments 2008, Bilateral Agreement on Achieving Universal Access to Early Childhood Education, Department of Education, Employment and Workplace Relations and the Department of Education, Canberra and Hobart.

E I G H T E E N M O N T H R E V I E W O F T H E N A T I O N A L P A R T N E R S H I P A G R E E M E N T O N E A R L Y C H I L D H O O D
E D U C A T I O N
The Allen Consulting Group 105
Australian and Victorian Governments 2008, Bilateral Agreement on Achieving Universal Access to Early Childhood Education, Department of Education, Employment and Workplace Relations and the Department of Education and Early Childhood Development, Canberra and Melbourne.
Australian and Western Australian Governments 2008, Bilateral Agreement on Achieving Universal Access to Early Childhood Education, Department of Education, Employment and Workplace Relations and Department of Education and Training, Canberra and Perth.
Australian Bureau of Statistics (ABS) 2007, General Social Survey, New South Wales 2006, cat. no. 4159.1.55.001, available <http://www.abs.gov.au/AUSSTATS/[email protected]/DetailsPage/4159.1.55.0012006?OpenDocument>, viewed 27 September 2010.
ABS 2008, Australian Social Trends, from http://www.abs.gov.au/AUSSTATS/[email protected]/Lookup/4102.0Chapter3002008 viewed on 23/12/2010.
ABS 2010, Cat no. 6202.0 Labour Force, Australia.
Australian Schools Directory, website, www.australianschoolsdirectory.com.au/educationinformation.php?region=31.
Boston Consulting Group (BCG) 2008, National Early Childhood Development Strategy, Report to the ECD Subgroup of the Productivity Agenda Working Group, COAG, September 2008, available at http://www.deewr.gov.au/EarlyChildhood/Resources/Documents/BCG%20report.pdf, accessed 15 September 2010.
Centre for Community Child Health (CCCH) and Telethon Institute for Child Health Research 2010, A Snapshot of Early Childhood Development in Australia — Australian Early Development Index (AEDI) National Report 2009, Australian Government, March, Canberra.
Council of Australian Governments (COAG) 2008, National Partnership Agreement on Early Childhood Education, Canberra, December.
Council of Australian Governments (COAG) 2009, National Quality Standard for Early Childhood Education and Care and School Age Care, December 2009.
Department of Education and Early Childhood Development Victoria 2009, Improving Victoria’s Early Childhood Workforce: Working to give Victoria’s children the best start in life, Melbourne.
Department of Education and Early Childhood Development Victoria unpublished, 18 Month Review, National Partnership on Early Childhood Education, Submission of the Victorian Department of Education and Early Childhood Development.
Department of Education and Training ACT 2007, Best Start to Life: The Importance of Early Childhood Education, Canberra.
Department of Education and Training ACT 2010, National Partnership Early Childhood Education 18 Month Review and Evaluation, ACT Submission, July 2010.
Department of Education and Training Northern Territory 2007, Strong Beginnings: An explicit guide to quality practice in the early years, Darwin.

E I G H T E E N M O N T H R E V I E W O F T H E N A T I O N A L P A R T N E R S H I P A G R E E M E N T O N E A R L Y C H I L D H O O D
E D U C A T I O N
The Allen Consulting Group 106
Department of Education and Training Northern Territory 2009a, Early Childhood Services Audit Report, Darwin, available at http://www.det.nt.gov.au/__data/assets/pdf_file/0007/12859/EarlyChildhoodAuditReport.pdf, accessed on 3rd September 2010.
Department of Education and Training Northern Territory 2009b, Strategic Plan 2009-12: Delivering a Smart Territory through Quality Education and Training, Darwin.
Department of Education and Training Northern Territory unpublished, 18 Month Review and Evaluation, Submission of the Northern Territory Department of Education.
Department of Education and Training Tasmania 2008, Starting Kindergarten, available at http://www.education.tas.gov.au/earlylearning/kinder.pdf, accessed on 6th September 2010.
Department of Education and Training Western Australia 2008, WA teacher demand and supply projections, Government of Western Australia, Perth.
Department of Education, Employment and Workplace Relations 2009, Regulation Impact Statement for Early Childhood Education and Care Quality Reforms, July 2009.
Dowling, A. and K. O’Malley 2009, Preschool education in Australia, ACER Policy Brief, December 2009.
Ferguson, C. E. 1969, The Neoclassical Theory of Production and Distribution, London: Cambridge University Press.
Government of Western Australia 2010a, Annual Report 2009: Universal Access — Western Australia, Department of Education, Perth.
Government of Western Australia 2010b Western Australian 2010 State Budget, Department of Treasury and Finance, Perth.
Government of Western Australia 2010c [unpublished], Western Australia’s submission of issues impacting on or relating to the scope of the 18 Month Review of Universal Access, June, Perth.
Harrinton, M. 2008, Preschool Education in Australia, Background Note, available at Parliamentary Library, Parliament of Australia: <www.aph.gov.au/library/pubs/bn/2007-08/PreschoolEdAustralia.htm#_Toc198010817>.
IBISWorld 2010, Growing up: Government reform to childcare and preschool education will attempt to standardise this diverse industry, IBISWorld Industry Report N8410, Preschool Education in Australia, Angela Kidson, January 2010.
New South Wales Government 2010 [unpublished], 18 Month Review of the National Partnership Agreement on Universal Access to Early Childhood Education, August 2010.
NSW Public Schools website, available at: <www.schools.nsw.edu.au/gotoschool/types/preschools.php>.
E I G H T E E N M O N T H R E V I E W O F T H E N A T I O N A L P A R T N E R S H I P A G R E E M E N T O N E A R L Y C H I L D H O O D
E D U C A T I O N
The Allen Consulting Group 107
Northern Territory Government 2010, 2009 Annual Report on Achieving Universal Access to Early Childhood Education in Northern Territory, Department of Education.
PricewaterhouseCoopers 2010, Analysis of Municipal Planning for Universal Access, Interim findings, Draft report to the Department of Education and Early Childhood Development (DEECD).
Steering Group on the Review of Government Service Provision (SGRGSP) 2009, Report on Government Services 2009, available <http://www.pc.gov.au/gsp/reports/rogs/2009>, viewed 19 October 2010.
Steering Group on the Review of Government Service Provision (SGRGSP) 2011, Report on Government Services 2011, available <http://www.pc.gov.au/gsp/reports/rogs/2011>, viewed 16 March 2011.
Queensland Government 2010, Queensland State Budget 2010, Queensland Treasury, Brisbane.
South Australian Government 2010a, 2009 Annual Report on Achieving Universal Access to Early Childhood Education in South Australia, Department of Education and Children’s Services, Adelaide.
South Australian Government 2010b, Submission to the eighteen month review of the National Partnership Agreement on Early Childhood Education, Department of Education and Children’s Services, Adelaide.
South Australian Government 2010c, South Australian State Budget, Department of Treasury and Finance, Adelaide.
State of Queensland 2008, Towards Q2: Delivering world class education — starting early, Queensland Government, Brisbane.
Tasmanian Government 2007a, Making Connections: schools and child care services, partners for early learning, Department of Education.
Tasmanian Government 2007b, Council of Australian Governments’ National Reform Agenda: Tasmania’s Early Childhood and Child Care Plan, Department of Premier and Cabinet; Department of Education; and Department of Human Services.
Tasmanian Government 2010, Annual Report 2009 for Universal Access to Early Childhood Education, Department of Education.
Victorian Government 2008, Blueprint for Education and Early Childhood Development, Department of Education and Early Childhood Development, Melbourne.
Victorian Government 2010a, 2009 Annual Report on Achieving Universal Access to Early Childhood Education in Victoria, Department of Education and Early Childhood Development, Melbourne.
Victorian Government 2010b, Victorian State Budget 2010 — Budget Paper 3, Department of Treasury and Finance, Melbourne.
Watson, J. 2005, Active engagement: Strategies to increase service participation by vulnerable families, Discussion paper, NSW Centre for Parenting & Research, NSW Department of Community Services, Sydney.
E I G H T E E N M O N T H R E V I E W O F T H E N A T I O N A L P A R T N E R S H I P A G R E E M E N T O N E A R L Y C H I L D H O O D
E D U C A T I O N
The Allen Consulting Group 108