eighth iea ief opec symposium on energy outlooks · iea-ief-opec symposium on energy outlooks held...
TRANSCRIPT

This introductory paper was prepared by the IEF and Resources for the Future, in consultation with the IEA and OPEC
AN INTERNATIONAL ENERGY FORUM PUBLICATION 14 FEBRUARY 2018
INTRODUCTORY PAPER:
A COMPARISON OF RECENT IEA AND OPEC OUTLOOKS
EIGHTH IEA IEF OPEC SYMPOSIUM ON ENERGY OUTLOOKS
International Energy Forum in partnership with Resources for the Future

2
EIGHTH IEA IEF OPEC SYMPOSIUM ON ENERGY OUTLOOKS
Acknowledgements
This report was prepared by the IEF and Resources for the Future, in consultation with the International Energy Agency and the Organization of the Petroleum Exporting Countries.
Richard G. Newell, President and CEO of Resources for the Future, served as Principal Researcher on the project. Daniel Raimi, Senior Research Associate, and Brandon Cunningham, Senior Research Assistant, led the drafting of this paper. Alan Krupnick, Senior Fellow, provided additional support.
The IEF and Resources for the Future would like to thank the IEA and OPEC for their constructive comments and insights into this document and the on-going dialogue that underpins the trilateral programme of work.

Table of ContentsAcronyms and Abbreviations .............................................................................................................................4
1. Key Observations .................................................................................................................................................5
1.1 Overview ..............................................................................................................................................5
1.2 Recent Progress on Data Harmonisation and Comparability of Outlooks .........5
1.3 Opportunities to Advance the Comparability of Outlooks .........................................6
1.4 IEA and OPEC Short-Term Oil Outlooks ..............................................................................6
1.5 IEA and OPEC Medium-Term Oil Outlooks.........................................................................8
1.6 IEA and OPEC Long-Term Energy Outlooks ......................................................................9
1.7 Recent Trends ................................................................................................................................. 11
2. Background and Introduction ......................................................................................................................12
3. Baseline 2016 Liquids Data........................................................................................................................... 14
4. Short-term Oil Outlooks ................................................................................................................................. 18
4.1 Economic Growth Assumptions ............................................................................................. 18
4.2 Short-term Liquids Demand ..................................................................................................... 19
4.3 Short-term Liquids Supply ........................................................................................................ 21
5. Medium-term Oil Outlooks .......................................................................................................................... 26
5.1 Oil Price and Economic Growth Assumptions ............................................................... 26
5.1.1 Oil Price ............................................................................................................................................ 26
5.1.2 Economic Growth ......................................................................................................................... 27
5.2 Medium-term Liquids Demand .............................................................................................. 28
5.2.1 Global and Regional Demand Growth .............................................................................. 28
5.2.2 Sectoral Demand ...........................................................................................................................30
5.3 Medium-term Liquids Supply ................................................................................................. 30
5.3.1 Liquid Fuels Classification and Projection Methodology ......................................... 30
5.3.2 Global and Regional Liquids Supply .................................................................................. 32
6. Long-term Energy Outlooks ......................................................................................................................... 36
6.1 Key Assumptions .......................................................................................................................... 36
6.1.1 Scenarios and Sensitivity Cases ......................................................................................... 36
6.1.2 Demography ................................................................................................................................... 37
6.1.3 Economic growth ......................................................................................................................... 38
6.1.4 Oil Prices ............................................................................................................................................39
6.1.5 Energy and Environmental Policies .................................................................................... 40
6.2 Long-term Energy Demand ..................................................................................................... 40
6.2.1 Primary Energy Consumption ................................................................................................ 40
6.2.2 Liquids Demand ............................................................................................................................. 43
6.3 Long-term Oil Supply .................................................................................................................. 48
6.3.1 Mathematical Models ................................................................................................................. 48
6.3.2 Liquids Supply................................................................................................................................ 49
7. Final Remarks...................................................................................................................................................... 54
Annex 1: Long-term Outlook Assumptions ............................................................................................... 56
Annex 2: Long-term Outlook Results ........................................................................................................... 57
3
4
Acronyms and Abbreviations
bbl Barrel
CPS Current Policies Scenario (IEA)
EOR Enhanced Oil Recovery
FSU Former Soviet Union
GDP Gross Domestic Product
GHG Greenhouse gas
IEA International Energy Agency
IEF International Energy Forum
IMF International Monetary Fund
INDC Intended Nationally Determined Contribution
kb/d Thousand Barrels per Day
LTO Light Tight Oil
mb/d Million Barrels per Day
mboe Million Barrels of Oil Equivalent
mboe/d Million Barrels of Oil Equivalent per Day
MOMR Monthly Oil Market Report (OPEC)
mtoe Million Tonnes of Oil Equivalent
MTBE Methyl Tertiary Butyl Ether
NGLs Natural Gas Liquids
NPV Net Present Value
OECD Organisation for Economic Co-operation and Development
OMR Oil Market Report (IEA)
OPEC Organization of the Petroleum Exporting Countries
ORB OPEC Reference Basket
ppm Parts per Million
R/P Resources-to-Production
SDS Sustainable Development Scenario (IEA)
SPR Strategic Petroleum Reserve
UN United Nations
URR Ultimately Recoverable Resources
USGS U.S. Geological Survey
WEO World Energy Outlook (IEA)
WOO World Oil Outlook (OPEC)

5
1. Key Observations
1.1 Overview
• This Introductory Paper provides a comparative analysis of the short-, medium-,and long-term energy outlooks published by the IEA and OPEC in 2017, andserves to inform discussions of the Eighth IEA-IEF-OPEC Symposium on EnergyOutlooks taking place in Riyadh, Saudi Arabia on 14 February 2018.
• The Paper compares the most recent estimates for energy demand and supplythrough the three projection timeframes of the IEA and OPEC energy outlooks, alongwith the methodologies and conventions used by the IEA and OPEC.
• Comparisons include short-, and medium-term liquid supply and demandprojections, through 2018 and 2022 respectively, and a comparative analysis oflong-term energy outlooks to 2040 for the three main scenarios. These are theCurrent and New Policies Scenarios of the IEA and the Reference Case of OPEC.
• Finally, the comparative analysis of these three scenarios is placed in the contextof additional scenarios from the IEA and sensitivity cases OPEC presents in its 2017World Oil Outlook.
1.2 Recent progress on Data Harmonisation and Comparability of Outlooks
• Substantial progress was made over the course of the seven IEA-IEF-OPEC Symposia on Energy Outlooks to enhance the comparability of the IEA and OPEC energyoutlooks.
• IEF facilitated collaboration between IEA and OPEC experts in a series oftechnical meetings. The Seventh IEA-IEF-OPEC Technical Meeting on Advancingthe Comparability of Energy Outlooks was hosted by OPEC in Vienna on 15 March2017, after OPEC volunteered ongoing support to reduce discrepancies in historicalbaseline data, and help advance the comparability of energy outlooks, and theIEA reemphasised its commitment to continued collaboration aimed at providingtransparency on the model assumptions underlying energy outlooks at the SeventhIEA-IEF-OPEC Symposium on Energy Outlooks held at the IEF in Riyadh on 15February 2017.
Key achievements include:
• Differences in world liquids demand and supply historical baseline data for thenon-OECD region that stood at 1.7 mb/d, and 1.4 mb/d last year, were reduced to0.9 mb/d and 1.3 mb/d respectively this year.
• Both organisations agreed to exchange non-OECD historical baseline data for2008-2015 and continue dialogue to deepen understanding and control fordata inconsistencies in the future.
• Maintain efforts to align the classification of regions, countries, fuel types, andunits, and improve the comparability of outlooks.
The next Eighth IEA-IEF-OPEC Technical Meeting on Advancing the Comparability of Energy Outlooks will be held in advance of the Eighth IEA-IEF-OPEC Symposium on Energy Outlooks on 13 February 2018.

6
1.3 Opportunities to Advance the Comparability of Outlooks
Nevertheless, there are additional opportunities to make the outlooks more comparable by addressing the following specific issues:
• A change in regional groupings made comparability more challenging. In itsWEO 2017, the IEA did not present its results by regional groupings according toOECD status, while OPEC’s WOO continued to report its results on those terms.Although OPEC disaggregated its member countries’ demand data to improvedirect comparison with IEA’s outlook, an inconsistency still exists, while IEAreports Middle East and Africa regions separately, OPEC groups them togetheras a single category.
• Different treatment of biofuels means that comparing regional non-OPECsupply forecasts between the IEA and OPEC requires adjustments. WhileOPEC includes biofuels in each region’s total liquids supply, the IEA onlyincludes global biofuels supply in its monthly reports. Moreover, the IEA groupsbiofuels into the renewables category, and projects demand for biofuels and oilseparately. OPEC includes biofuels in the liquids category, as the IEA does in itsshort- and medium-term outlooks (but not in the WEO).
• The IEA and OPEC also define bunker fuels differently. While the IEA reportsinternational marine bunker and aviation fuel as a distinct “bunker” group – notattributable to any country or region – OPEC includes bunker and aviation fuelin each region’s oil demand, just as it does with biofuels. In addition, OPEC doesnot differentiate between international and domestic aviation fuels.
• Economic growth and oil price assumptions are key to energy supply anddemand projections and will continue to differ depending on the perspectivestaken. This year, however, OPEC has not published its oil price assumptions forthe medium or long-term, preventing detailed comparison between the IEA andOPEC.
1.4 IEA and OPEC Short-Term Oil Outlooks
• Differences in world liquids demand and supply baseline data of 0.9 mb/d and1.3 mb/d respectively, are smaller than those reported in the previous two years.However, the difference in stock build of 0.3 mb/d in 2016 is slightly higher thanfor last year.
• Both the IEA and OPEC December 2017 short-term oil market reportsacknowledge the November 2017 extension of the decision taken on 30November 2016 by OPEC to adjust production to rebalance the market. OPECprojections reflect compliance with this benchmark, while the IEA’s considerationof this agreement in their projections is unclear, with projection of Russian outputnotably higher than the OPEC figure.
• Finally, a 0.9 mb/d difference in short-term supply from OPEC Member Countriesremains, due primarily to different definitions used by IEA and OPEC for NaturalGas Liquids and unconventionals for which there is a divergence of 0.7 mb/d.
Liquids Demand
• OPEC and the IEA respectively estimate 2016 world liquids demand baselines at

7
95.4 mb/d and 96.3 mb/d, respectively; a difference of 0.9 mb/d. This difference is notably smaller than last year’s difference of 1.7 mb/d, and is caused by modest differences from non-OECD regions, led by the Middle East, Asia, FSU nations, and Africa.
• Both the IEA and OPEC have modestly revised their world liquids demandgrowth estimates over the past year. The IEA increased its projected world liquidsdemand growth estimate by 0.2 mb/d from 1.3 mb/d in January to 1.5 mb/d inDecember 2017 due to demand growth in the OECD, while OPEC assessmentsgrew from 1.2 mb/d to 1.5 mb/d by the end of the year, driven again by OECDliquids demand growth.
• The IEA and OPEC project 2017 world liquids demand to reach 97.8 mb/d and96.9 mb/d; a difference of 0.9 mb/d, substantially less than last year’s estimateddifference of 1.9 mb/d for 2016.
• Both the IEA and OPEC project robust world liquids demand growth of 1.3 mb/dand 1.5 mb/d, respectively, for 2018. This similarity at the global level masksdifferences in regional growth assessments. While the IEA is more bullish aboutdemand growth in non-OECD Asia, the Middle East, and Africa, OPEC estimatesstronger demand growth in OECD Americas and OECD Asia Pacific.
• The IEA and OPEC estimate 2018 world liquids demand to reach 99.1 mb/d and98.5 mb/d, respectively. This leads to smaller gaps in demand projections thanprevious years of 0.9 mb/d in 2017 and 0.6 mb/d in 2018, suggesting improvementsin coordination of historical baseline data and methodological issues.
Liquids Supply
• OPEC and the IEA estimate 2016 world liquids supply baseline data at 95.8 mb/dand 97.0 mb/d respectively; a difference of 1.3 mb/d, slightly lower than last year’sreport, with differences again primarily due to non-OECD data divergences on OPECsupplies (0.9 mb/d) and the FSU (0.4 mb/d).
• OPEC and the IEA estimate 2017 world liquids supply at 96.9 mb/d and 97.8mb/d respectively, amounting to a difference between estimates of 0.9 mb/d, wellbelow last year’s divergence of 1.9 mb/d for 2016.
• OPEC and the IEA estimate 2018 world liquids supply at 98.5 mb/d and 99.1mb/d respectively; differing in their assessment by just 0.6 mb/d, well below lastyear’s difference of 2 mb/d for 2017.
• The IEA projects net annual liquids supply growth of 0.6 mb/d and 1.6 mb/d for2017 and 2018 respectively. This varies considerably from OPEC’s net annualsupply growth projection of 0.8 mb/d in 2017 and 1.0 mb/d in 2018.
• Unlike last year, non-OPEC liquid supply growth returned to recent form, surprising on the upside. Both the IEA and OPEC substantially revised their projections upwardfor OECD supplies during the first half of 2017. These trends are largely attributableto the growth of “unconventionals” in the OECD Americas region.
• Revisions to projections for non-OPEC non-OECD regions were modest through2017, and production is expected to remain roughly flat, with the IEA and OPECprojecting respective growth of 0.0 mb/d and 0.1 mb/d.
• Regional assessments of IEA and OPEC estimates on short-term world liquidssupply growth again reveal a large and growing difference in constructedestimates for OPEC supply. This divergence has increased in each of the last four

8
years, with this year showing a difference of 1.8 mb/d in 2017 and 2.7 mb/d in 2018. This growing gap stands in contrast to closer historical baseline data, meriting further discussion.
• Like previous years, the largest difference in IEA and OPEC projections of non-OPEC liquids supply is for the FSU region, amounting to 0.4 mb/d for 2017 and 0.5mb/d for 2018.
1.5 IEA and OPEC Medium-Term Oil Outlooks
Liquids Demand
• The IEA and OPEC expect 2022 world liquids demand to reach 103.8 mb/d and102.3 mb/d respectively.
• Like last year, both the IEA and OPEC forecast robust liquids demand growth butOPEC projects a slightly lower annual growth rate of world liquids demand of 1.15mb/d, compared to the annual growth rate of 1.20 mb/d forecast by the IEA throughto 2022.
• The IEA and OPEC medium term world liquids demand projections reveal adifferential of 1.5 mb/d by 2022. This compares to 2016 projections gap of 2.5mb/d for world liquids demand in 2021.
• The IEA projects non-OECD liquids demand to be 2.8 mb/d higher than OPEC in2022, partly due to a higher baseline demand estimate that differs by 1.2 mb/d.
• Conversely, OPEC projects liquids demand from OECD nations to be 1.3 mb/dhigher than the IEA in 2022. This difference is driven by more optimistic projectionsof demand in OPEC’s outlook, as baseline estimates differ by only 0.1 mb/d.
• OPEC and IEA assessments agree that little to no growth in OECD liquids demand will occur. OPEC projects modest growth followed by a decline, with 2016 demandequal to 2022 (46.8 mb/d). The IEA projects annual average declines of 0.2 mb/d,reaching 45.5 mb/d in 2022.
• Both the IEA and OPEC note that the overall driver for liquids demand growthremains transportation, followed by petrochemicals and industrial demand.However, growth projections are dampened by the impact of fuel efficiency standards, notably in the OECD, and slowing demand growth in China due to structural shiftstowards a services and consumption oriented economy.
Liquids Supply
• OPEC and the IEA project world liquids supply to reach 102.5 mb/d and 103.8mb/d by 2022 respectively, differing in their medium term liquid supply assessmentby 1.2 mb/d.
• OPEC and IEA non-OPEC supply projections differ through 2022, with morebullish projections coming from the IEA through 2018, followed by higher projectionsby OPEC for non-OPEC supplies in later years, with a difference in 2022 of 1.1 mb/d.
• IEA and OPEC projections agree that most non-OPEC supply growth will comefrom OECD Americas, followed by more modest growth from Latin America. Theyalso agree that supplies from non-OECD Asia are likely to decline through 2022.
• In a notable difference to last year’s medium-term projections, OPEC showssubstantially stronger supply growth than the IEA for OECD Americas. OPECestimates 2022 OECD Americas supplies of 24.6 mb/d, compared with the IEA’s

9
2022 forecast of 23.0 mb/d.
• In sum, the IEA and OPEC forecast total non-OPEC supplies to reach 60.9 mb/dand 62.0 mb/d in 2022 respectively; a 1.1 mb/d difference.
• The IEA and OPEC projections imply supplies from OPEC member countries of42.9 mb/d and 40.5 in 2022 respectively, a difference of 2.4 mb/d. This differencestems largely from IEA’s 2022 world liquids supply projections being 1.2 mb/d higherthan OPEC’s projection, along with OPEC’s projection of more robust supplies fromOECD Americas.
• This year’s IEA and OPEC medium-term oil supply estimates from the UnitedStates and Canada diverge substantially. While both made upward revisions thisyear, OPEC and the IEA respectively project oil production from the United Statesand Canada of 21.4 and 19.5 mb/d in 2022, a difference of 1.9 mb/d.
1.6 IEA and OPEC Long-Term Energy Outlooks
• The IEA and OPEC prepared projections through 2040 for total primary energydemand, along with liquid fuel demand and supply. Both organisations use 2015historical data as the baseline for primary energy demand (though the IEA alsoincludes estimates for 2016) and 2016 for oil in their projections.
• The central scenarios of each organisation that are subject to this comparativeanalysis are the Reference Case of OPEC and the New Policies Scenario of theIEA.
• The comparison is placed in the broader context of the IEA’s Current PoliciesScenario, which provides a business-as-usual scenario, and the IEA’s SustainableDevelopment Scenario, which assumes energy and environmental policies areimplemented in line with the United National Sustainable Development goals. Theanalysis also includes OPEC’s sensitivity cases, which examine the effect on liquidsmarkets from alternative pathways in economic growth, energy efficiency, electricvehicle deployment, and liquids supplies.
Primary Energy Demand
• Total primary energy demand in OPEC’s Reference Case reaches 372 mboe/din 2040 compared with the IEA’s Current Policies Scenario projection of 390mboe/d. These assessments are lower than those given in 2016 of 382 mboe/d and396 mboe/d, respectively. The IEA’s New Policies Scenario reaches 355 mboe/din 2040.
• Like last year, this year’s IEA and OPEC projections show global primary energydemand growing more slowly than in previous years’ projections. OPEC’sReference Case has shifted the most, projecting that primary energy demand willgrow by 35% from 2015 to 2040, compared with 40% growth from 2014 to 2040 inlast year’s assessment. The IEA’s Current Policies Scenario forecasts 42% growthover the projection period, a slight departure from last year’s estimate of 43% growth,and the IEA’s New Policies Scenario sees 29% growth, compared with 31% in 2016’soutlook.
• The IEA’s Current Policies Scenario projects significantly higher primary energydemand than any other scenario examined here, followed by OPEC’s ReferenceCase, the IEA’s New Policies Scenario, and the IEA’s Sustainable DevelopmentScenario. The IEA’s Current Policies and Sustainable Development Scenario showthe largest difference of 105 mboe/d in 2040.

10
• OPEC and the IEA both project that fossil fuels will continue to dominate theprimary energy mix with oil, gas and coal maintaining a 75% to 79% share oftotal primary energy demand in 2040 with the exception of the IEA’s SustainableDevelopment Scenario, where fossil fuels supply 61% of primary energy demand in2040.
• However, the IEA and OPEC differ on the shares of coal, oil, and natural gas intotal primary energy demand in 2040. The IEA’s Current Policies Scenario projectscoal and oil consumption to be 16 mboe/d and 10 mboe/d higher, respectively, thanOPEC’s Reference Case. The IEA’s New Policies Scenario projects lower consumption of all fossil fuels than OPEC’s Reference Case with differences in coal (-7 mboe/d),natural gas (-5 mboe/d), and oil (-3 mboe/d).
Energy Supply Mix
• The IEA’s New Policies and Current Policies Scenarios, along with OPEC’sReference Case, project that oil will maintain its position as the leading fuel in2040, though its share in the energy mix shrinks from more than 30% in 2015 to 27-28% under these three scenarios.
• Unlike either of the last two years, OPEC’s Reference Case does not projectnatural gas emerging as the leading primary energy source by 2040. However,natural gas is set to grow the fastest among fossil fuels (in percentage and absoluteterms), with an increasing share in the fuel mix in every scenario examined here,including the IEA Sustainable Development Scenario.
• Both the IEA and OPEC project that the share of renewables, led by growth inwind and solar, will increase in all scenarios from 14% in 2015 to 16% under the IEA’sCurrent Policies Scenario, 18% in OPEC’s Reference Case, 20% under the IEA’s NewPolicies Scenario, and to 29% under the IEA’s Sustainable Development Scenario by2040.
Liquids Demand
• The share of oil in the world primary energy portfolio is expected to decrease,but the level of oil demand still enjoys robust growth under central scenarios. InOPEC’s Reference Case and the IEA’s New Policies Scenario, world liquids demandrespectively reaches 111 mb/d and 109 mb/d by 2040. In the IEA’s Current PoliciesScenario, world liquids demand grows to 122 mb/d, falling only under the SustainableDevelopment Scenario to 80 mb/d by 2040.
• The difference between the highest (IEA Current Policies Scenario) and lowest(IEA Sustainable Development Scenario) projections for 2040 world liquidsdemand is 42 mb/d.
• The IEA’s Current Policies Scenario provides the highest projections for liquidsdemand growth of 1.1 mb/d per year from 2016 to 2040, while OPEC’s ReferenceCase and the IEA’s New Policies Scenario project annual growth for liquids demandof 0.7 mb/d and 0.6 mb/d respectively.
• The IEA’s New Policies Scenario shows India overtaking China as the leadingcentre of demand growth in absolute terms, while both the IEA’s Current PoliciesScenario and OPEC project that absolute growth in liquids consumption in China andIndia will be roughly equal.
Liquids Supply
• OPEC’s Reference Case forecasts global supply in 2040 of 111 mb/d, slightly
11
more than the 109 mb/d under the IEA’s New Policies Scenario, and well below the IEA’s Current Policies Scenario which projects 122 mb/d of supply in 2040.
• OPEC is substantially more bullish on production from non-OECD Europe andEurasia, projecting 2040 production to be 2.8 mb/d and 0.8 mb/d higher than theIEA New Policies and Current Policies Scenarios, respectively.
• OPEC projects that OPEC member nations will provide 46% of global supply in2040, equal to its 2016 estimate. The IEA projects OPEC supplies of 43% underboth the IEA’s New Policies and Current Policies Scenarios, compared with 45% and46% respectively under last year’s IEA outlook.
• Like last year, IEA’s Current- and New Policies Scenarios are more bullish onsupplies from the OECD, as the OECD Americas region supplies 2.0 mb/d and 4.0mb/d more than OPEC’s Reference Case under the IEA’s New Policies and CurrentPolicies Scenarios, respectively.
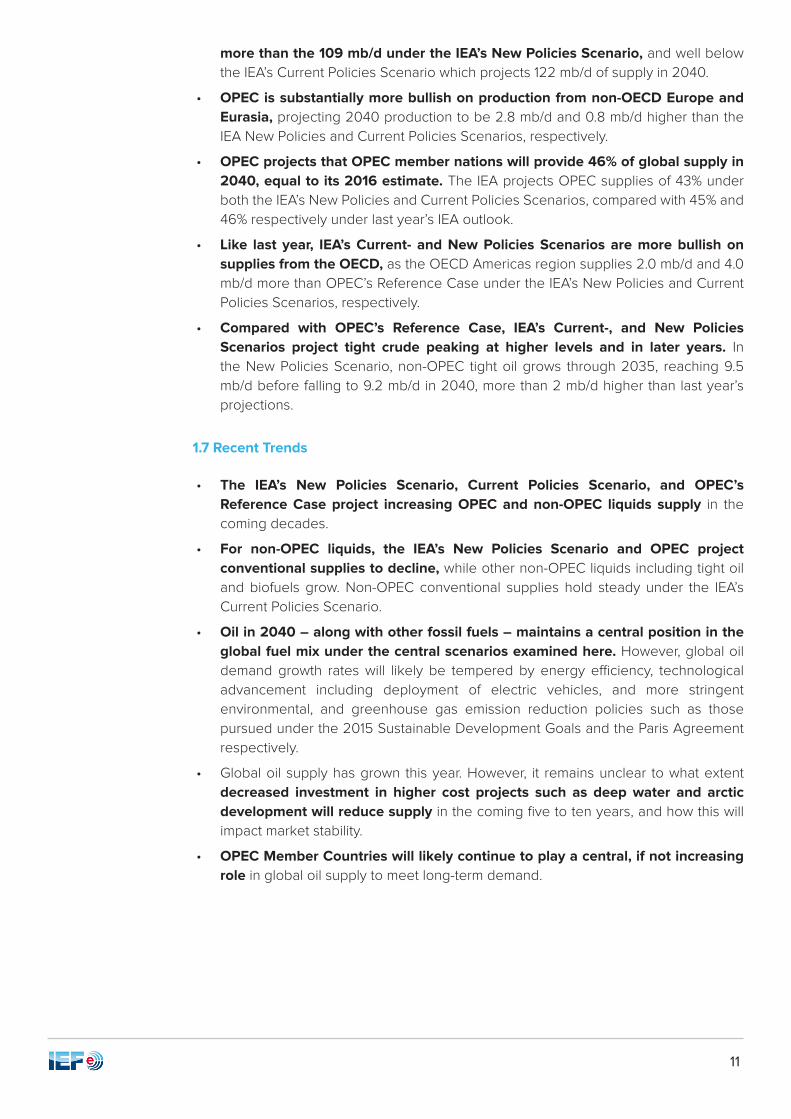
• Compared with OPEC’s Reference Case, IEA’s Current-, and New PoliciesScenarios project tight crude peaking at higher levels and in later years. Inthe New Policies Scenario, non-OPEC tight oil grows through 2035, reaching 9.5mb/d before falling to 9.2 mb/d in 2040, more than 2 mb/d higher than last year’sprojections.
1.7 Recent Trends
• The IEA’s New Policies Scenario, Current Policies Scenario, and OPEC’sReference Case project increasing OPEC and non-OPEC liquids supply in thecoming decades.
• For non-OPEC liquids, the IEA’s New Policies Scenario and OPEC projectconventional supplies to decline, while other non-OPEC liquids including tight oiland biofuels grow. Non-OPEC conventional supplies hold steady under the IEA’sCurrent Policies Scenario.
• Oil in 2040 – along with other fossil fuels – maintains a central position in theglobal fuel mix under the central scenarios examined here. However, global oildemand growth rates will likely be tempered by energy efficiency, technologicaladvancement including deployment of electric vehicles, and more stringentenvironmental, and greenhouse gas emission reduction policies such as thosepursued under the 2015 Sustainable Development Goals and the Paris Agreementrespectively.
• Global oil supply has grown this year. However, it remains unclear to what extentdecreased investment in higher cost projects such as deep water and arcticdevelopment will reduce supply in the coming five to ten years, and how this willimpact market stability.
• OPEC Member Countries will likely continue to play a central, if not increasingrole in global oil supply to meet long-term demand.

12
2. Background and Introduction
The International Energy Agency (IEA) and the Organization of the Petroleum Exporting Countries (OPEC) track global energy market trends to produce short-, medium- and long-term energy outlooks. Their insights shape perceptions on how energy markets might evolve and influence important policy and investment decisions around the world.
In light of their influence, the Joint Statement of the Jeddah Energy Meeting (2008) called for shared analyses of the oil market trends and outlooks produced by the IEA and OPEC. The Cancun Ministerial Declaration (2010) recognised the IEF’s role as a platform for sharing insights and exchanging views about energy market trends, and called for the IEA, IEF, and OPEC to organise an annual Symposium on Energy Outlooks at the IEF Secretariat1. The three organisations held their First Symposium in 2011 and have collaborated since then to advance understanding of the factors that drive energy supply and demand.
An introductory paper comparing the most recent outlooks prepared by the IEA and OPEC has accompanied each Symposium. This paper is for the Eighth Symposium and takes as reference the outlooks published by both organisations in 2017. As in previous editions, the objectives of this analysis are:
• To identify similarities and differences in estimates for short-, medium-, and long-term oil demand and supply;
• To contrast the long-term outlooks for primary energy demand and the globalenergy mix; and
• To better understand the methodologies, definitions, and assumptions behindthese projections and outlooks.
An on-going challenge in the comparison of energy outlooks concerns the different use each organisation makes of historical data, definitions, and geographical classifications. The introductory paper of the Seventh Symposium identified opportunities to harmonise a number of variables:
• Reduce and, ideally, eliminate the differences in world liquids demand andsupply baselines. These differences relate almost entirely to the non-OECDregion and propagate over assessment periods.
• Better align the publication dates of the medium-term oil market outlooks bythe IEA and OPEC. Currently they are separated by a 10-month interval.
• Enhance consistency in the classification of liquid fuels at regional and globallevels. There are issues with maritime and aviation fuels, as well as biofuelsclassifications and units.
• Continue dialogue at the expert level on assumptions and methodologiesto deepen understanding of the impact that different price assumptions anddifferent views on the evolution of policy, technology and economic growth haveon longer term oil supply and demand balances, particularly as this relates to therole of unconventional production and other energy sources.
• Finally, the addition and subtraction of certain OPEC member countries in 2016highlighted the importance of the regional classifications by OPEC of itsmember country’s liquid fuel demand data and projections to facilitate aneffective comparison with IEA data.
1 Attachment II of the Cancun Declaration identifies specific areas of collaboration through a trilateral Programme of Work.

13
The IEA and OPEC continue to make progress on some of these areas. Similar to last year, they used the same baseline years for long-term energy projections in the outlooks published this year: 2015 for primary energy demand and 2016 for oil (though the IEA also includes estimates for 2016 primary energy). In addition, they agreed to share and review historical baseline supply and demand data for the years 2008 to 2014 for those non-OECD countries where apparent differences are largest. These efforts reflect the successful cooperation of the IEA and OPEC and the established practice of discussing and reviewing their methods and approaches on a regular basis, for instance by verifying the sensitivity of their models to variations in historical baseline data.
Table 1 lists the publications used for comparison in this introductory paper. Note that the IEA Medium-Term Oil 2017 report was published in February 2017, ten months earlier than the release of OPEC’s Medium-Term projections in its 2017 World Oil Outlook (WOO2016).
Table 1. IEA and OPEC Outlooks Analysed in this Introductory Paper
The IEA, IEF and OPEC work together to mitigate
discrepancies and ensure consistency in
their different outlooks.
IEA OPEC
Report Type Report Name Publication Date Report Name Publication Date
Short-term Oil Market Report (OMR) Dec. 2017 Monthly Oil Market
Report (MOMR) Dec. 2017
Medium-term Oil 2017 Feb. 2017 World Oil Outlook (WOO 2017) Nov. 2017
Long-term World Energy Outlook (WEO) Nov. 2017 World Oil Outlook
(WOO 2017) Nov. 2017

14
Ongoing dialogue has led to improvements
in harmonisation of baseline data, but more work needs to be done.
3. Baseline 2016 Liquids Data
The harmonisation of baseline historical data between the IEA and OPEC is a necessary step to enhance the comparability of their outlooks. Table 2, Table 3, and Table 4 compare IEA and OPEC base year (2016) demand, supply, and stock change data, respectively, using the IEA’s December OMR and OPEC’s December MOMR, both short-term outlooks. Note that as an outcome of the collaborative work on historical baseline data the IEA and OPEC have mutually consistent base year oil demand data in their reports.
As shown in Table 2 and Table 3, differences in world liquids demand and supply baselines remain fairly high, diverging by 0.9 mb/d for demand and 1.3 mb/d for supply. These differences are smaller than those identified in previous years, particularly for demand, which last year stood at 1.7 mb/d. For 2016 world liquids demand, the IEA estimates 96.3 mb/d whereas OPEC estimates 95.4 mb/d. For supply, the IEA estimates 97.0 mb/d and OPEC estimates 95.8 mb/d. These data indicate a modest stock build during 2016, with estimates of 0.4 mb/d for OPEC and 0.7 mb/d for the IEA, significantly lower than in last year’s report when both organisations estimated a net stock build of about 2 mb/d during 2015.
Table 2 provides details on the IEA’s and OPEC’s estimates for baseline liquids demand data by region. Similar to last year’s assessment, the historical difference is completely attributable to non-OECD nations, including from Asia, the Middle East, FSU nations, and Africa. Smaller differences in demand estimates emerge for Latin America.
Table 2. Liquids Demand in 2016 (mb/d)
Table 2 data sources: IEA OMR Dec 2017, Table 1; OPEC MOMR Dec 2017, Table 4-1, 4-2.Table 2 notes: Sums may not total due to rounding.
As for world liquids supply, Table 3 shows that the IEA-OPEC difference in 2016 data lies primarily in OPEC supply (0.9 mb/d). Outside of the OECD, where historical data aligns, the greatest discrepancies emerge for FSU nations (0.3 mb/d) and the non-OPEC region
IEA OPEC Difference (IEA-OPEC)
Total OECD 46.9 46.9 0.0
OECD Americas 24.7 24.7 0.0
OECD Europe 14.0 14.0 0.0
Asia Oceania 8.1 8.1 0.0
Total Non-OECD 49.4 48.5 0.9
Asia 24.8 24.7 0.1
China 11.9 11.8 0.1
Other non-OECD Asia 12.9 12.9 0.1
Middle East 8.3 8.0 0.3
Latin America 6.6 6.5 0.1
FSU 4.8 4.6 0.1
Non-OECD Europe 0.7 0.7 0.0
Africa 4.3 4.1 0.2
World 96.3 95.4 0.9

15
(0.4 mb/d), the latter slightly less than the discrepancy recorded last year (0.6 mb/d).
Different treatment of biofuels means that comparing regional non-OPEC supply forecasts between the IEA and OPEC requires adjustments. While OPEC includes biofuels in each region’s total liquids supply, the IEA only includes global biofuels supply in its monthly reports. However, the IEA’s Medium-Term Oil 2017 report publishes 2016 biofuels production by region, which we include here. This paper adds these regional biofuels data – both historical and forecast data – to each region’s oil supply data. To ensure consistency, we verified that global biofuels supply data of the IEA’s Medium-Term Oil 2017 report were roughly equal to the OMR estimates.
Regarding supply from OPEC Member Countries, there is a notable gap between the IEA’s and OPEC’s estimates of OPEC NGLs and unconventionals supply (0.7 mb/d). Compared to NGLs and unconventionals, the difference in OPEC crude oil supply estimates between the IEA and OPEC is more modest (0.2 mb/d). Note that IEA and OPEC have different definitions for NGLs and unconventionals. IEA reports in its OMR that NGLs and unconventionals supply includes OPEC condensates, oil from non-conventional sources (e.g., Venezuelan Orimulsion) and non-oil inputs to Saudi Arabian methyl tertiary butyl ether (MTBE), while OPEC provides less detail about the specific components of this category that may well be more restrictive.
Different treatment for biofuels and alternate
definitions for NGL’s and unconventionals make
it difficult to compare OPEC and non-OPEC
supply.

16
Due to market rebalancing, stock
changes for both IEA and OPEC are below
2014-2015 figures.
2 Table 11-1 refers to the table titled “World Oil Supply and Demand Balance, mb/d”. This was labeled as Table 10.3 in previous years and in the January and February 2017 OMRs. It was alternatively labeled Table 12–1 and Table 13–1 between March and August. We will refer to this as Table 11–1 in our references.
Table 3. Liquids Supply in 2016 (bm/d)
Table 3 data sources: IEA OMR Dec 2017, Table 1; IEA Oil 2017, Tables 5, 5a; OPEC Dec 2017, Table 5-1, 11-12 . Table 3 notes: Sums may not total due to rounding. IEA liquids supply calculated by summing IEA oil and IEA biofuel estimates.IEA (a) IEA’s “OPEC NGLs” includes condensates, oil from non-conventional sources (e.g. Venezuelan Orimulsion) and non-oil inputs to Saudi Arabian MTBE.Total OPEC (b) Equals total liquids demand minus non-OPEC supply minus OPEC NGLs/unconventionals.
Table 4 presents stock changes and other items that account for the difference between supply and demand data in the IEA and OPEC reports. Both the IEA and OPEC report data on commercial oil stock changes and strategic petroleum reserve (SPR) changes from reporting OECD countries. “Oil-on-water” is oil used in floating storage and water transit. The remainder of the gap between total supply and total demand is allocated to a “miscellaneous to balance” item, which covers both stock changes in non-OECD countries and other items. As Table 4 shows, both organisations estimate a modest stock increase in 2016, with OPEC estimating stock growth of 0.3 mb/d and the IEA estimating 0.7 mb/d. Highlighting the extent of market rebalancing, these stock changes are well below those of 2015-2014, when stock builds of 2.0 mb/d and 1.7 mb/d were respectively reported by OPEC and the IEA. Since the IEA and OPEC have similar estimates about OECD stock and “Oil-on-water” items, the difference in total stock change is thus reflected in the constructed “miscellaneous to balance” item.
IEA (a) OPEC Difference (IEA-OPEC)
Total OECD 24.8 24.8 0.0
OECD Americas 20.6 20.6 0.0
OECD Europe 3.8 3.8 0.0
Asia Oceania 0.4 0.4 0.0
Total Non-OECD 30.3 30.0 0.3
Non-OECD Asia 7.8 7.8 0.0
China 4.1 4.1 0.0
Other non-OECD Asia 3.7 3.7 0.0
Middle East 1.3 1.3 0.0
Latin America 5.2 5.1 0.1
FSU 14.2 13.9 0.3
Non-OECD Europe 0.1 0.1 0.0
Africa 1.7 1.8 -0.1
Processing gains 2.3 2.2 0.1
Total Non-OPEC 57.4 57.0 0.4
Total OPEC (b) 39.6 38.7 0.9
OPEC crude 32.8 32.6 0.2
OPEC NGLs + unconventionals 6.8 6.1 0.7
World 97.0 95.8 1.3

17
Table 4. Stock Change and Miscellaneous Items (2016-2015) (mb/d)
Table 4 data sources: IEA OMR Dec 2017, Table 1; OPEC MOMR Dec 2017, Table 11-1.Table 4 notes: Sums may not total due to rounding. Miscellaneous to balance (a) OPEC miscellaneous to balance is computed as the difference between total OPEC stock change/misc. and other reported stock changes.
IEA OPEC Difference (IEA-OPEC)
Reported OECD 0.0 0.0 0.0
Industry/commercial 0.0 0.0 0.0
Government/SPR 0.0 0.0 0.0
Oil-on-water 0.1 0.2 -0.1
Miscellaneous to balancea 0.5 0.0 0.5
Total stock change & misc. 0.7 0.4 0.3
18
4. Short-Term Oil Outlooks
Short-term oil market reports from the IEA and OPEC forecast oil demand and supply up to 18 months in the future based on regular monitoring of macroeconomic and energy market conditions, technology, and policy developments. Monthly oil market reports also include statistics and analyses of other topics that we do not focus on in this paper, such as fluctuations in benchmark oil prices, oil stocks, movements in product markets, and trade flows. Both the IEA and OPEC capture market-moving events and offer in-depth analyses in their respective reports. Notably, both December reports acknowledge the November 2017 extension of the agreement from 2016, when OPEC and several non-OPEC nations agreed to adjust production by roughly 4.5% from their late 2016 levels. However, consideration of this extension in projections of 2018 oil production by IEA are unclear. In particular, OPEC projects 10.98 mb/d in output from Russia in 2018, while the IEA projects 11.14 mb/d for the same year.
Compliance with these adjustments averaged 91% in 2017, according to the IEA December OMR. The agreement was extended until the end of 2018, subject to further adjustment in June. In this section, we summarise and compare their perspectives on short-term macroeconomics, as well as oil demand and supply outlooks3 .
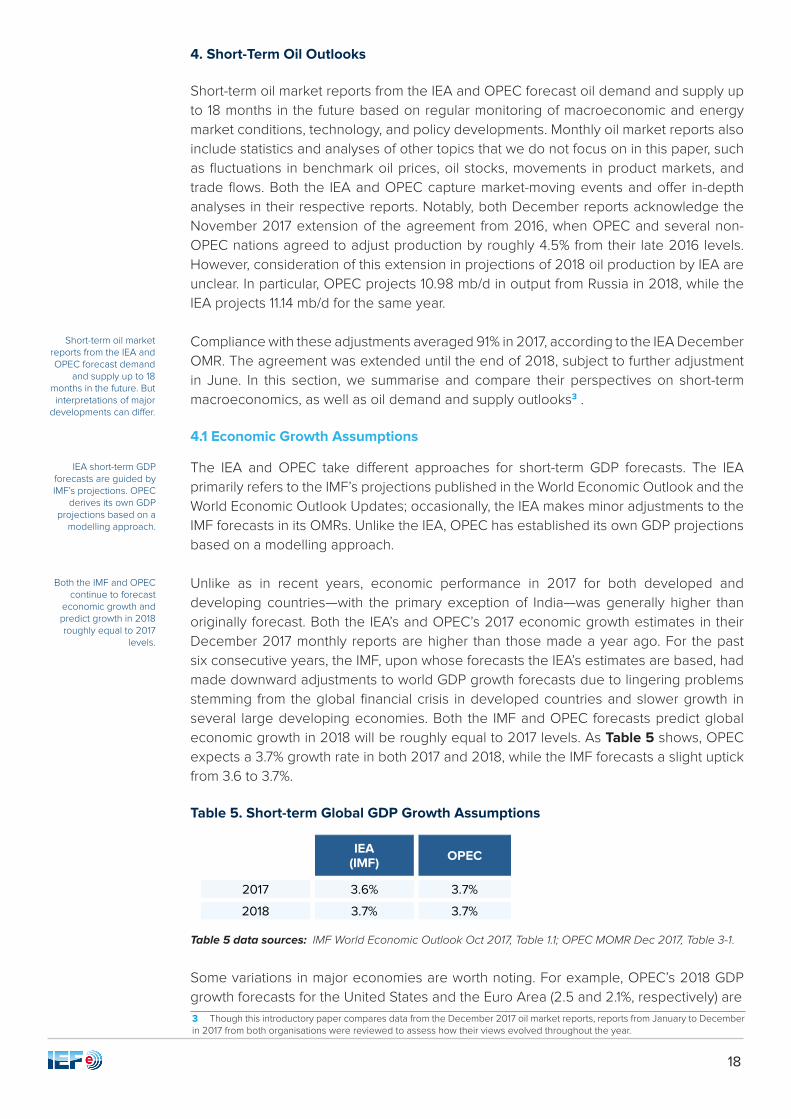
4.1 Economic Growth Assumptions
The IEA and OPEC take different approaches for short-term GDP forecasts. The IEA primarily refers to the IMF’s projections published in the World Economic Outlook and the World Economic Outlook Updates; occasionally, the IEA makes minor adjustments to the IMF forecasts in its OMRs. Unlike the IEA, OPEC has established its own GDP projections based on a modelling approach.
Unlike as in recent years, economic performance in 2017 for both developed and developing countries—with the primary exception of India—was generally higher than originally forecast. Both the IEA’s and OPEC’s 2017 economic growth estimates in their December 2017 monthly reports are higher than those made a year ago. For the past six consecutive years, the IMF, upon whose forecasts the IEA’s estimates are based, had made downward adjustments to world GDP growth forecasts due to lingering problems stemming from the global financial crisis in developed countries and slower growth in several large developing economies. Both the IMF and OPEC forecasts predict global economic growth in 2018 will be roughly equal to 2017 levels. As Table 5 shows, OPEC expects a 3.7% growth rate in both 2017 and 2018, while the IMF forecasts a slight uptick from 3.6 to 3.7%.
Table 5. Short-term Global GDP Growth Assumptions
Table 5 data sources: IMF World Economic Outlook Oct 2017, Table 1.1; OPEC MOMR Dec 2017, Table 3-1.
Some variations in major economies are worth noting. For example, OPEC’s 2018 GDP growth forecasts for the United States and the Euro Area (2.5 and 2.1%, respectively) are3 Though this introductory paper compares data from the December 2017 oil market reports, reports from January to December in 2017 from both organisations were reviewed to assess how their views evolved throughout the year.
Short-term oil market reports from the IEA and OPEC forecast demand
and supply up to 18 months in the future. But interpretations of major
developments can differ.
IEA short-term GDP forecasts are guided by IMF’s projections. OPEC
derives its own GDP projections based on a
modelling approach.
Both the IMF and OPEC continue to forecast
economic growth and predict growth in 2018 roughly equal to 2017
levels.
IEA (IMF) OPEC
2017 3.6% 3.7%
2018 3.7% 3.7%

19
higher than the IMF’s estimates (1.9 and 2.3%, respectively). OPEC’s 2018 growth forecast for Japan (1.4%) is substantially higher than the IMF’s (0.7%). Both organisations project 2018 economic growth in China and India of 6.5% and 7.4%, respectively.
4.2 Short-Term Liquids Demand
Both the IEA and OPEC revise their short-term liquids demand forecasts monthly, based on market and policy movements, as well as comparison between actual data and changes in macroeconomic conditions. In addition, they occasionally revise methodologies for calculating demand for specific regions, which may also result in changes to demand forecasts.
As Figure 1 illustrates, the IEA and OPEC both saw modest revisions to their global liquids demand growth estimates over the course of the year. Overall, the IEA increased its estimates by 0.2 mb/d during 2017, with projections for OECD demand growth seeing a wider range of estimates than non-OECD nations, where projections decreased in the middle of the year and then remained relatively constant. For OPEC, global demand growth projections increased by 0.4 mb/d, composed of modest gains in non-OECD nations and larger gains in the OECD. The dotted- and dash lines in Figure 1, reflecting non-OECD and OECD country assessments respectively, show that the increases for both the IEA and OPEC came primarily from OECD countries. The IEA’s upward revisions were further offset by a decrease in the non-OECD region from May to December, while OPEC’s overall increase was supported by a slight increase in the non-OECD over the course of the year.
Figure 1. Monthly Revisions of Annual Estimates for 2017 World, OECD, and Non-OECD Liquids Demand Growth (mb/d)
Figure 1 data sources: IEA OMR Jan–Dec 2017, Table 1; OPEC MOMR Jan–Dec 2017, Table 11-1.
Looking forward in Figure 2, the IEA projects global demand growth of 1.3 mb/d in 2018, slightly lower than OPEC’s projection of 1.5 mb/d. These liquids demand forecasts are more similar than in previous years, in which data differences and differing perspectives on liquids demand led to larger variation in demand forecasts. The IEA’s change in their 2017 forecast relative to the WEO 2016 is just 0.2 mb/d, while OPEC has increased their projection by 1.3 mb/d. The resulting difference between the two organisations’ 2017 forecasts is 0.9 mb/d in 2017 and 0.7 mb/d in 2018, compared to differences in 2016
The IEA increased its liquids demand by
0.2 mb/d during 2017, with OECD demand
growth seeing greater fluctuations than non-
OECD nations. For OPEC, global demand
growth projections increased by 0.4 mb/d,
with larger gains in OECD and modest gains
in non-OECD nations.
0.2
0.0
0.2
0.4
0.6
0.8
1.0
1.2
1.4
1.6
Jan Feb Mar Apr May Jun Jul Aug Sep Oct ov Dec
mb/d
IEA (World) IEA (Total Non-OECD) IEA (Total OECD)
OPEC (World) OPEC (Total Non-OECD) OPEC (Total OECD)
IEA and OPEC liquid demand forecasts are more similar this year
than in years previous. The difference between
IEA’s and OPEC’s 2017 forecasts is 0.9 mb/d
in 2017 and 0.7 mb/d in 2018.

20
projections of 1.9 mb/d for 2016 and 2.0 mb/d for 2017.
Figure 2. Short-Term World Liquids Demand: 2016-2018 (mb/d)
Figure 2 data sources: IEA OMR Dec 2017, Table 1; OPEC MOMR Dec 2017, Table 11-1.Figure 2 notes: 2016 are historical data and 2017/2018 are projections. Sums in data callouts may not total due to rounding.
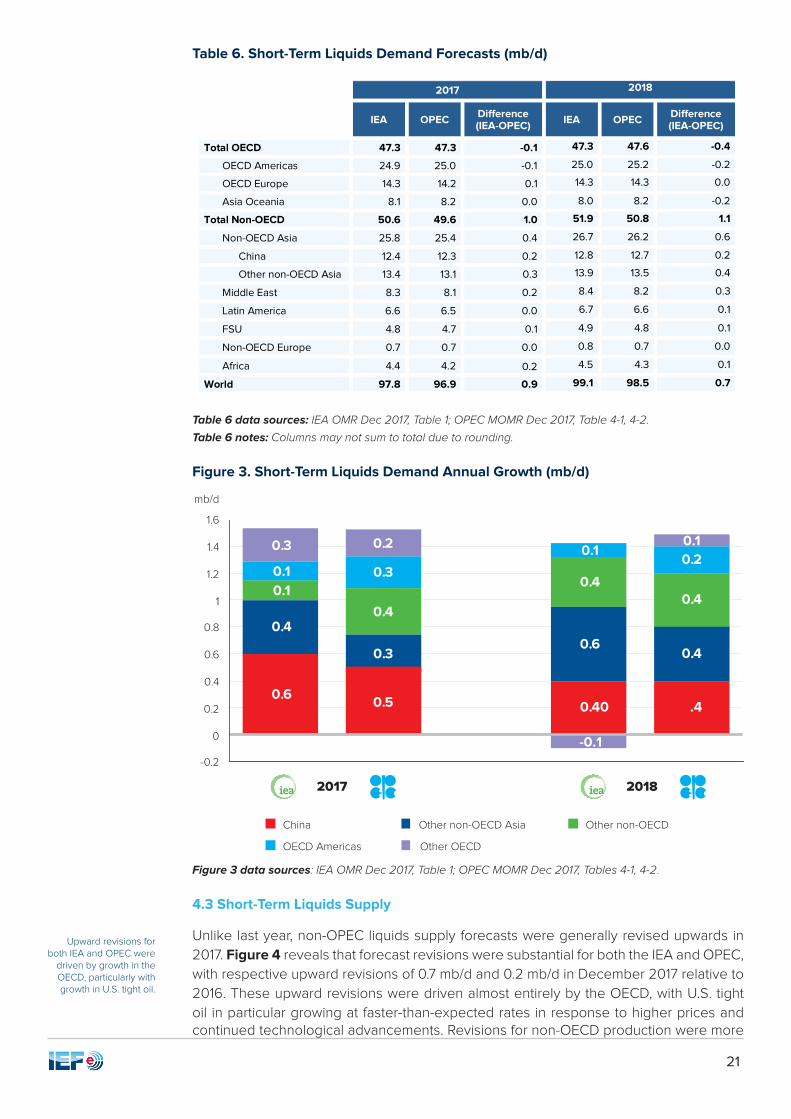
The IEA’s and OPEC’s regional liquids demand outlooks for 2017 and 2018, as well as the differences between them, are summarised in Table 6. These short-term demand outlooks have historically varied greatly in regions that have large differences in historical data – particularly in non-OECD regions including China, other non-OECD Asian nations, and the Middle East (see Table 2). This year, differences are more modest in magnitude.
Both the IEA and OPEC believe non-OECD regions will continue to lead global demand growth, particularly China and other non-OECD Asia. Despite these similarities, some regional discrepancies also appear in Table 6 and are highlighted in Figure 3. In particular, the IEA has substantially more bullish estimates than OPEC about demand growth in non-OECD Asia, with most of the difference explained by Asian nations other than China. The IEA also projects moderately stronger growth than OPEC in the Middle East and Africa in 2017 and 2018. In contrast, OPEC is slightly more bullish on growth in the OECD Americas and for OECD Asia Oceania.
OPEC’s and IEA’s regional liquids demand
outlooks for 2017 and 2018 vary in regions
with large historical data differences. This year,
the differences are more modest.
Different growth estimates for 2017 and 2018 further contribute to regional differences. The IEA is more bullish
than OPEC about demand growth in
non-OECD Asia. OPEC is slightly more bullish
on growth in the OECD Americas and for OECD
Asia Oceania.
mb/d
93
94
95
96
97
98
99
100
2016 2017 2018
98.5
96.9
95.4
99.1
97.9
96.3
1.0
0.9
0.6
21
Table 6. Short-Term Liquids Demand Forecasts (mb/d)
Table 6 data sources: IEA OMR Dec 2017, Table 1; OPEC MOMR Dec 2017, Table 4-1, 4-2.
Table 6 notes: Columns may not sum to total due to rounding.
Figure 3. Short-Term Liquids Demand Annual Growth (mb/d)
Figure 3 data sources: IEA OMR Dec 2017, Table 1; OPEC MOMR Dec 2017, Tables 4-1, 4-2.
4.3 Short-Term Liquids Supply
Unlike last year, non-OPEC liquids supply forecasts were generally revised upwards in 2017. Figure 4 reveals that forecast revisions were substantial for both the IEA and OPEC, with respective upward revisions of 0.7 mb/d and 0.2 mb/d in December 2017 relative to 2016. These upward revisions were driven almost entirely by the OECD, with U.S. tight oil in particular growing at faster-than-expected rates in response to higher prices and continued technological advancements. Revisions for non-OECD production were more
Upward revisions for both IEA and OPEC were
driven by growth in the OECD, particularly with growth in U.S. tight oil.
2017 2018
IEA OPEC Difference (IEA-OPEC) IEA OPEC Difference
(IEA-OPEC)
Total OECD 47.3 47.3 -0.1 47.3 47.6 -0.4
OECD Americas 24.9 25.0 -0.1 25.0 25.2 -0.2
OECD Europe 14.3 14.2 0.1 14.3 14.3 0.0
Asia Oceania 8.1 8.2 0.0 8.0 8.2 -0.2
Total Non-OECD 50.6 49.6 1.0 51.9 50.8 1.1
Non-OECD Asia 25.8 25.4 0.4 26.7 26.2 0.6
China 12.4 12.3 0.2 12.8 12.7 0.2
Other non-OECD Asia 13.4 13.1 0.3 13.9 13.5 0.4
Middle East 8.3 8.1 0.2 8.4 8.2 0.3
Latin America 6.6 6.5 0.0 6.7 6.6 0.1
FSU 4.8 4.7 0.1 4.9 4.8 0.1
Non-OECD Europe 0.7 0.7 0.0 0.8 0.7 0.0
Africa 4.4 4.2 0.2 4.5 4.3 0.1
World 97.8 96.9 0.9 99.1 98.5 0.7
0.4
0.6
0.2
0.2
0.3
0.4
0.4
0.2
0.3
0.6
0.4
0.3
0.5
0.2
-0.2
0
0.2
0.4
0.6
0.8
1
1.2
1.4
mb/d
1.6
China Other non-OECD Asia Other non-OECD
OECD Americas Other OECD
2017 2018
0.4
0.3
0.3
-0.1
0.4
0.4
0.2
0.6
0.4
0.40 .4
0.1
0.4
0.5
0.2
0.6
0.10.1
0.3 0.1

22
modest throughout the year.
Figure 4. Monthly Revisions of Annual Estimates for 2017 Non-OPEC Liquids Supply Growth (mb/d)
Figure 4 data sources: IEA OMR Jan-Dec 2017, Table 1; OPEC MOMR Jan-Dec 2017, Table 11-1. 2017 revisions are relative to 2016 data. Equatorial Guinea officially joined OPEC in May, 2017. It was included in the data as an OPEC member beginning in July 2017. For reference, Equatorial Guinea produced 160,000 b/d in 2016 according to OPEC’s December 2017 MOMR.
After a slow-down in growth in 2015, non-OPEC liquids supply declined in 2016 before rebounding in 2017 by larger increments than the IEA and OPEC projected in 2016 (0.3 mb/d and 0.2 mb/d respectively, compared to 0.7 mb/d and 0.2 mb/d according to latest 2017 assessments). As Figure 5 indicates, non-OPEC liquids supply growth is projected to increase further still in 2018. However, there is a substantial difference of 0.6 mb/d between IEA and OPEC projections.
Although both IEA and OPEC forecast non-
OPEC supply growth in 2018, a notable
difference of 0.6 mb/d exists.
-0.2
0
0.2
0.4
0.6
0.8
1
mb/d
Jan Feb Mar Apr May Jun Jul Aug Sep Oct Nov Dec
IEA (Total Non-OPEC) IEA (Non-OECD) IEA (OECD)
OPEC (Total Non-OPEC) OPEC (Non-OECD) OPEC (OECD)

23
Figure 5. Short-Term Non-OPEC Liquids Supply Annual Growth (mb/d)
Figure 5 data sources: IEA OMR Dec 2017, Table 1; OPEC MOMR Dec 2017, Table 11-1.Figure 5 notes:: Equatorial Guinea officially joined OPEC in May, 2017. It was included in the data as an OPEC member beginning in July, 2017. For reference, Equatorial Guinea produced 160,000 b/d in 2016 according to OPEC’s December 2017 MOMR
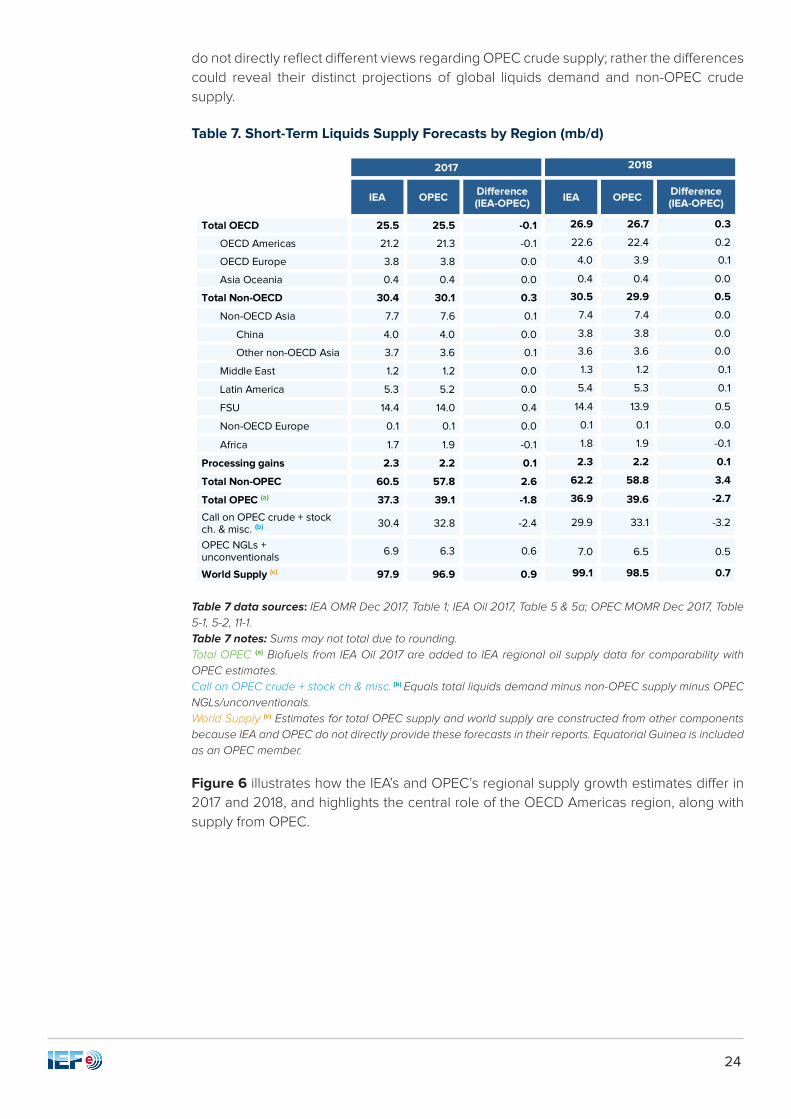
Table 7 displays a detailed comparison of short-term liquids supply outlooks by region. The IEA-OPEC difference in non-OPEC supply increases from the difference in baseline (2016) supply data of 0.4 mb/d (see Table 3) to 2.6 mb/d in 2017 and to 3.4 mb/d in 2018. The largest regional differential (0.4 mb/d in 2017 and 0.5 in 2018) comes from FSU nations, stemming from differences in historical data along with different projections for the extension of production adjustments in coordination with OPEC. Another difference (-0.1 mb/d in 2017 and 0.2 mb/d in 2018) appears in projections from OECD Americas, highlighting different estimates about North American unconventional supply volumes, in addition to growth rates highlighted in Figure 5.
Variation also emerges between the two estimates for OPEC unconventionals + NGLs, with the IEA projecting 0.6 mb/d and 0.5 mb/d higher supply in 2017 and 2018, respectively. This difference reflects a slight narrowing of the substantial difference in baseline (2016) data of 0.7 mb/d, as shown in Table 3.
Neither the IEA nor OPEC make projections for short-term OPEC crude, but the difference between their constructed estimates for OPEC supply has grown from 0.9 mb/d in 2016 (the baseline year) to 1.8 mb/d in 2017 and 2.7 mb/d in 2018, with higher projections from the IEA. This merits further discussion. “OPEC crude” in Table 3 is an estimate based on reported supply data from OPEC Member Countries, whereas the Table 7 item “Call on OPEC crude + stock ch. & misc” is a constructed item. This item is calculated by subtracting total non-OPEC supply as well as OPEC NGLs and unconventionals supply from world liquids demand projections, since neither the IEA nor OPEC projects OPEC crude production in their monthly oil market reports. Therefore, differences between the IEA and OPEC in the “Call on OPEC crude + stock ch. & misc” item and “Total OPEC” item
The largest differential in non-OPEC liquids
supply outlooks resides in the FSU due to the
difference in historical baseline data. Another
difference is noted in OECD Americas.
More discussion on OPEC supply is
required to minimize discrepancies in growth
estimates.
-1.0
-0.5
0.0
0.5
1.0
1.5
2.0
2015 2017 20182015
1.5
1.00.8
1.6
0.6
1.5
-0.7-0.7
2016
mb/d
24
do not directly reflect different views regarding OPEC crude supply; rather the differences could reveal their distinct projections of global liquids demand and non-OPEC crude supply.
Table 7. Short-Term Liquids Supply Forecasts by Region (mb/d)
Table 7 data sources: IEA OMR Dec 2017, Table 1; IEA Oil 2017, Table 5 & 5a; OPEC MOMR Dec 2017, Table 5-1, 5-2, 11-1.Table 7 notes: Sums may not total due to rounding.Total OPEC (a) Biofuels from IEA Oil 2017 are added to IEA regional oil supply data for comparability with OPEC estimates.Call on OPEC crude + stock ch & misc. (b) Equals total liquids demand minus non-OPEC supply minus OPEC NGLs/unconventionals.World Supply (c) Estimates for total OPEC supply and world supply are constructed from other components because IEA and OPEC do not directly provide these forecasts in their reports. Equatorial Guinea is included as an OPEC member.
Figure 6 illustrates how the IEA’s and OPEC’s regional supply growth estimates differ in 2017 and 2018, and highlights the central role of the OECD Americas region, along with supply from OPEC.
2017 2018
IEA OPEC Difference (IEA-OPEC) IEA OPEC Difference
(IEA-OPEC)
Total OECD 25.5 25.5 -0.1 26.9 26.7 0.3
OECD Americas 21.2 21.3 -0.1 22.6 22.4 0.2
OECD Europe 3.8 3.8 0.0 4.0 3.9 0.1
Asia Oceania 0.4 0.4 0.0 0.4 0.4 0.0
Total Non-OECD 30.4 30.1 0.3 30.5 29.9 0.5
Non-OECD Asia 7.7 7.6 0.1 7.4 7.4 0.0
China 4.0 4.0 0.0 3.8 3.8 0.0
Other non-OECD Asia 3.7 3.6 0.1 3.6 3.6 0.0
Middle East 1.2 1.2 0.0 1.3 1.2 0.1
Latin America 5.3 5.2 0.0 5.4 5.3 0.1
FSU 14.4 14.0 0.4 14.4 13.9 0.5
Non-OECD Europe 0.1 0.1 0.0 0.1 0.1 0.0
Africa 1.7 1.9 -0.1 1.8 1.9 -0.1
Processing gains 2.3 2.2 0.1 2.3 2.2 0.1
Total Non-OPEC 60.5 57.8 2.6 62.2 58.8 3.4
Total OPEC (a) 37.3 39.1 -1.8 36.9 39.6 -2.7
Call on OPEC crude + stock ch. & misc. (b) 30.4 32.8 -2.4 29.9 33.1 -3.2
OPEC NGLs + unconventionals 6.9 6.3 0.6 7.0 6.5 0.5
World Supply (c) 97.9 96.9 0.9 99.1 98.5 0.7

25
Figure 6. Short-Term Liquids Supply Net Annual Growth Forecasts (mb/d)
Figure 6 data sources: IEA OMR Dec 2017, Table 1; IEA Oil 2017, Table 5, 5a; OPEC MOMR Dec 2017, Table 5-1, 5-2, 11-1.Figure 6 notes: IEA(a) Biofuels from the IEA Oil 2017 report are added to IEA regional oil supply data for comparability with OPEC estimates.OPEC crude (b) IEA and OPEC do not forecast OPEC crude; this estimate is constructed as the “call on OPEC crude” including “stock change and miscellaneous”. Equatorial Guinea is included as an OPEC member.
mb/d
-1.0
-0.5
0
1.0
0.5
1.5
2.0
(a)(a)
OECD AmericasOther OECDNon-OECD
OPEC NGLs + unconventionalsOPEC crudeProcessing gains
1.5 1.5
2017 2018
1.3 1.5
(b)

26
5. Medium-Term Oil Outlooks
Our comparison of medium-term outlooks assesses the IEA’s Oil 2017 published in February 2017, and OPEC’s World Oil Outlook (WOO) published in November 2017 (Table 1). Both organisations make their medium-term projections through 2022, using 2016 as a base year. However, there is a nine-month gap between publication dates of the two reports, and given the dynamic nature of market conditions, this gap complicates the comparison of the projections.
5.1 Oil Price and Economic Growth Assumptions
5.1.1 Oil Price
The price of oil is one of the primary factors influencing the projections of oil demand. This year, OPEC has not published its oil price assumptions for the medium or long term, preventing detailed comparison between the IEA and OPEC.
As in previous years, the IEA and OPEC use different price proxies. In the WOO series, OPEC makes assumptions for an OPEC Reference Basket (ORB) price, which is a production-weighted average price of a number of representative OPEC crudes driven by the cost estimates of marginal supply. The IEA uses an “IEA Average Import Price”, which reflects the IEA’s perspective on its member countries’ future crude import prices.
The IEA utilises market information – the Brent futures price curve – to derive its medium-term price assumptions. From the IEA’s perspective, Brent futures prices reflect what market players will accept to pay in the future, which in turn shapes the medium-term demand and supply outlook. In previous years, OPEC’s medium-term price assumptions mainly reflect its assumptions on the ORB price detailed above, while its longer-term price assumptions have also taken into account its estimates of the cost of supplying the marginal barrel.
As Figure 7 illustrates, the IEA’s medium-term 2017 Oil Report, published in early 2017, shows the nominal “IEA Average Import Price” growing through 2018 to US$/bbl then remaining roughly flat, reaching US$59/bbl in 2023. These projections are noticeably lower than those made by the IEA in 2016, which showed prices reaching US$80/bbl in 2020 and 2021.
Both organisations make their medium-term
projections through 2022 using 2016 as a
base year.
This year, OPEC has not published its oil price
assumptions for the medium or long term.
IEA and OPEC use different price proxies.
The IEA uses an Average Import Price
while OPEC makes assumptions for an
OPEC Reference Basket price.

27
Figure 7. Medium-Term Oil Price Assumptions (nominal US$)
Figure 7 data sources: Historical OPEC ORB price from http://www.opec.org/opec_web/en/data_graphs/40.htm?selectedTab=annually; Annual average IEA import price provided via internal communication and Brent history from https://www.quandl.com/data/ODA/POILBRE_USD-Brent-Crude-Oil-PriceFigure 7 notes: History (a) Only historical prices up to the time IEA and OPEC wrote their reports were includedIEA(b) IEA Average Import Price assumption is based on the Brent futures strip, gradually increasing from 2017 to 2022.
5.1.2 Economic Growth
Both the IEA and OPEC have modestly adjusted their expectations for medium-term global economic growth compared to last year. The IEA (based on IMF forecasts) lowered its growth estimate throughout the forecast period, decreasing from 3.6% to 3.4% in 2017 and from 4.0% to 3.8% in 2021. OPEC’s expectations for growth changed more modestly, increasing for 2018 from 3.4% to 3.5%, and remaining constant in 2021 at 3.7% (Table 8). Note that in its subsequent October 2017 update, the IMF adjusted its growth forecast to 3.6% in 2017. This brighter outlook on world economic growth is not reflected in the IEA’s Medium-Term Oil Report that was published in February 2017, even though OPEC revisions account for this development in the medium-term economic growth projections of the World Oil Outlook released in November 2017.
Table 8. Medium-Term Annual GDP Growth Assumptions
Table 8 data sources: IEA Oil 2017, Table 1.2; OPEC WOO2017, Table 1.2. IEA’s forecast relies on IMF’s January 2017 World Economic Outlook Update.
Under both projections, most OECD and non-OECD economies expand over the medium-term, though non-OECD nations continue to grow at a faster rate. For the OECD, growth prospects under OPEC’s assumptions have improved since last year, with notable upward revisions for OECD Europe and OECD Asia Oceania and steady growth in OECD Americas. Under the IEA’s assumptions, growth in developed
Both IEA and OPEC have modestly adjusted
medium-term GDP growth compared to
2016.
OPEC Reference Basket (ORB) IEA Average Import Price assumption / Brent history
$/b
bl
0
20
40
60
80
100
120
2004 2006 2008 2010 2012 2014 2016 2018 2020 2022
Assumption History
(b)
(a)
2017 2018 2019 2020 2021 2022
OPEC 3.6% 3.5% 3.5% 3.6% 3.7% 3.7%
IEA 3.4% 3.6% 3.7% 3.7% 3.8% not provided

28
economies is more modest, with growth rates declining through 2021. For most non-OECD nations, growth expectations continue to be strong, led by developing Asia. Under OPEC’s assumptions, growth prospects for the Middle East and Africa, including OPEC nations, have declined, due in part by sustained lower oil prices. Like in previous years, geopolitical risk will continue to affect economic growth, particularly in the Middle East and parts of South America, with impacts potentially spilling over to energy and other commodities markets.
5.2 Medium-Term Liquids Demand
5.2.1 Global and Regional Demand Growth
Similar to last year’s assessment, both the IEA and OPEC expect robust medium-term growth in global liquids demand. As Table 9 shows, the IEA projects annual average growth of 1.2 mb/d in global liquids demand, reaching 103.8 mb/d by 2022. OPEC also projects a demand growth rate of 1.2 mb/d but reaches a lower figure of 102.3 mb/d in 2022 due primarily to a lower baseline (Figure 8(a)). This baseline difference arises primarily from non-OECD nations, with a difference of 1.2 mb/d in 2016, as shown in Figure 8(b). The IEA projects average annual demand growth of 1.4 mb/d in the non-OECD, compared with OPEC’s growth forecast of 1.2 mb/d.
Regarding OECD liquids demand, the IEA projects a slow decline while OPEC sees moderate growth through 2018, then a plateau and decline through 2022. Starting from a similar 2016 baseline (46.7 mb/d for the IEA and 46.8 mb/d for OPEC), OPEC’s projection in 2022 is 1.3 mb/d higher than the IEA’s. The divergence in oil demand growth between OECD and non-OECD nations reinforces how global oil markets have transformed, with non-OECD nations easily outstripping demand in the OECD in the years to come.
Figure 8. Medium-Term Liquids Demand (mb/d)
IEA and OPEC expect a robust medium-term
growth in global liquids demand.
IEA and OPEC both project decline in OECD
demand and increase in non-OECD demand
albeit at different rates.
The divergence in oil demand growth
between OECD and non-OECD nations
reinforces how global oil markets have
transformed.
(a) World Liquids Demand
94
95
96
97
98
99
100
101
102
103
mb/d
104
2016 2017 2018 2019 2020 2021 2022

29
Figure 8. Medium-Term Liquids Demand (mb/d)
Figure 8 data sources: IEA Oil 2017, Table 2; OPEC WOO2017, Table 3.1.
Table 9 presents a detailed comparison of the IEA and OPEC medium-term liquids demand outlooks for comparable regions. Notable differences arise in projected 2022 demand across numerous regions, with OPEC’s projections generally higher for OECD regions, and the IEA’s projections generally higher for the non-OECD. Comparison of non-OECD regions is complicated by the fact that, in the WOO medium-term projections, OPEC excludes its member countries from regional groupings and publishes OPEC liquids demand separately. The IEA does not make a similar distinction. To allow for comparison across the regions where OPEC members are located, we group together the Middle East, Africa and Latin America for regional demand projections, which allows for the inclusion of all OPEC members into this category.
Direct comparison of Middle East, Africa
and Latin America is challenging because of
differences in how OPEC and IEA define regions.
OPEC Non-OECD
IEA Non-OECDIEA OECD
OPEC OECD
44
46
50
48
52
54
56
58
mb/d (b) OECD and Non-OECD Liquids Demand
60
2016 2017 2018 2019 2020 2021 2022

30
Table 9. Medium-Term Liquids Demand Forecasts (mb/d)
Table 9 data sources: IEA Oil 2017, Table 2; OPEC WOO2017, Table 3.1.Table 9 notes: Sums may not total due to rounding.Middle East, Africa & Latin America (a) OPEC calculates demand from OPEC member countries as a whole by excluding them from corresponding geographical region. To allow for comparison across the regions where OPEC members are located, we group together the Middle East, Africa and Latin America for regional demand projections, which allows for the inclusion of all OPEC members into this category.
5.2.2 Sectoral Demand
The WOO2017 provides sectoral oil demand projections for the years 2016 and 2020, then for five-year intervals through 2040. In the WOO2017, road transport accounts for the largest share of oil demand at roughly 45% through 2020. Petrochemicals and other industrial uses each account for roughly 13% of demand over the medium- term in OPEC’s projection. The IEA’s medium-term Oil 2017 report does not include detailed global sectoral data. However, the report does discuss some key shifts in oil market dynamics. Key points include more modest projections of consumption growth in transportation fuels due to increasing vehicle efficiency standards in the OECD and increasingly in China and India. It also notes the slowing of demand growth in China due to structural economic shifts from exports and heavy industrial consumption towards services and domestic consumption. Nonetheless, the overarching driver of medium-term demand growth continues to be transportation, followed by petrochemicals and industrial demand.
5.3 Medium-Term Liquids Supply
5.3.1 Liquid Fuels Classification and Projection Methodology
For their medium-term liquids supply outlooks, both the IEA and OPEC take a “bottom-up” approach of assessing field-level supply capabilities for each country. However, they may take different upstream oil production projects into account and estimate different levels of productivity for each field. Differing supply projections between the
The main drivers of medium-term demand
growth according to both IEA and
OPEC, continues to be transportation,
petrochemical and industrial use.
2022 Avg. annual growth (2016-2022)
IEA OPEC IEA OPEC Difference (IEA-OPEC)
Total OECD 45.5 46.8 -0.2 0.0 -0.2
OECD Americas 24.2 24.9 -0.1 0.0 -0.1
OECD Europe 13.5 14.0 -0.1 0.0 -0.1
Asia Oceania 7.8 7.9 -0.1 0.0 0.0
Total Non-OECD 58.3 55.5 1.4 1.2 0.3
Asia 30.1 29.1 0.9 0.7 0.1
China 13.7 13.7 0.3 0.3 0.0
India 5.9 5.6 0.3 0.2 0.1
Other non-OECD Asia 10.5 9.8 0.3 0.2 0.1
Middle East, Africa & Latin Americaa 22.0 20.5 0.5 0.3 0.1
Europe & Eurasia 6.2 5.5 0.1 0.1 0.1
World 103.8 102.3 1.2 1.2 0.1

31
of liquid fuels is necessary to enhance comparison of their projections. Figure 9(a) and (b), respectively, illustrate the IEA’s and OPEC’s distinct liquids classification systems.
First, the two institutions differ in their categorisation of certain types of unconventional oil supplies. Figure 9(a) shows that the IEA groups together conventional crude oil, NGLs (including conventional and unconventional supplies) and condensate into one category, and “unconventional oil,” including tight oil, into another. OPEC, as shown in Figure 9(b) accounts for tight crude in its “crude oil” category, and distinguishes between conventional and unconventional NGLs. It groups other unconventional liquids such as oil sands and oil shale into its “non-crude supply” category.
Figure 9. Liquid Fuels Categorisation by the IEA and OPEC(a) IEA Liquid Fuels Schematic
Figure 9(a) source: Resources for the Future and IEF based on IEA WEO 2017, Figure C.1. Tight Oil (a) IEA previously referred to “tight oil” as “light tight oil”.
(b) OPEC Liquid Fuels Schematic
Figure 9(b) source: Resources for the Future and IEF based on WOO2017 and internal communication.
Understanding the differences in the IEA’s and OPEC’s
categorisation of liquid fuels is necessary to
ensure fair comparison.
(a) IEA Liquid Fuel Schematic
Liquids
supply
Conventional Oil
Unconventional
Oil
Other Crude
Oil sands
Ethane, propane, butanes and
pentane
Condensate
Extra heavy oil
Crude Oil
NGLs
Tight Oil (a)
Gas to liquids
Coal to liquids
Kerogen oil
Additives
Extra-heavy oil
and bitumen
Oil Supply
Biofuels
supply
Oil Production
Refinery
processing gains
Ethanol
Biodiesel
Other biofuels
Liquids
supply
Crude oil and NGLs
Non-crude supply
Processing gains
NGLs
Crude Oil
Biofuels
Oil sands
Conventional NGLs
Ethanol
Conventional Crude(inc. Venezuelean extra heavy
Oil Shale
Unconventional NGLs
Biodiesel
Tight Crude
Gas to liquids
Coal to liquids
(b) OPEC Liquid Fuels Schematic

32
5.3.2 Global and Regional Liquids Supply
As oil prices have recovered somewhat over the last year, non-OPEC supply increased in 2017 after declining in 2016. This was driven by increased production in OECD Americas and, to a lesser extent, Latin America and non-OECD Europe and Eurasia (Figure 10(a) and Figure 10(b)). OPEC estimates 2017 net growth of roughly 0.6 mb/d, substantially more than the IEA’s estimate of 0.3 mb/d. Similarly, OPEC’s projections for supply growth through 2022 are substantially higher than the IEA’s.
Cumulatively, OPEC projects a net increase of 5 mb/d in non-OPEC production by 2022, while the IEA forecasts 3.3 mb/d. The bulk of this difference is explained by the OECD Americas, which in the WOO2017 grows its production by 4.0 mb/d over the projection period, compared to 2.5 mb/d of growth in the IEA’s Oil 2017 report. Both projections show steady growth in non-OPEC Latin America, with net gains of 0.9 mb/d estimated by OPEC and 1.1 mb/d by the IEA. The forecasts also agree that production from other non-OECD regions will decline, driven by non-OECD Asia.
Both IEA and OPEC project steady medium-
term growth in non-OPEC production driven
by OECD Americas.

33
Figure 10. Medium-Term Non-OPEC Liquids Supply Annual Growth (mb/d)
Figure 10 data sources: IEA Oil 2017, Table 3, Table 5, Table 5a; OPEC WOO 2017, Table 4.1. Sums may differ due rounding.Figure 10 notes: Other OECD is the sum of data from OECD Europe and Asia Oceania; Other Non-OECD is the sum of data from Middle East & Africa and Non-OECD Asia. Equatorial Guinea, which joined OPEC in May 2017 and produces 126,000 b/d according to OPEC’s October Oil Market Report, is included in the IEA’s
data but excluded from OPEC’s because of the timing of the relevant publications.
Table 10 provides a detailed regional comparison of medium-term liquids supply between the two outlooks. As noted above, OPEC’s projections show substantially stronger non-OPEC supply growth than the IEA, particularly for the OECD Americas. OPEC projects 24.6 mb/d from OECD Americas in 2022, up 3.1 mb/d from last year’s forecast of 21.6 mb/d in 2021. The IEA’s projection for the region of 23.0 mb/d in 2022 is quite similar to last year’s forecast of 22.9 mb/d in 2021. As with other areas of comparison, this divergence may be explained in part by the later publication date of OPEC’s outlook.
-0.4
-0.2
0
0.2
0.4
0.6
0.8
1.0
1.2
1.4
2017 2018 2019 2020 2021 2022
OECD Americas
Total Non-OPEC
Other OECD L. America
Non-OECD Europe & EurasiaOther Non-OECD Processing gains
0.4
1.3
0.3 0.30.2
0.8
(a) IEA Outlookmb/d
(b) OPEC Outlook
-0.4
-0.2
0
0.2
0.4
0.6
0.8
1.0
1.2
1.4
2017 2018 2019 2020 2021 2022
OECD Americas Other OECD L. America
Non-OECD Europe & EurasiaOther Non-OECD Processing gains
0.6
1.0
1.2
0.70.6
0.9
mb/d
Total Non-OPEC

34
In total, the IEA forecasts 60.9 mb/d in supplies from non-OPEC nations in 2022, while OPEC estimates 62.0 mb/d, a 1.1 mb/d difference. These IEA projections imply supply from OPEC member nations of 42.9 mb/d, 2.4 mb/d higher than the assessments by OPEC. This difference arises from two major factors: first, in the IEA’s forecast, global supplies in 2022 are 1.3 mb/d higher than OPEC’s. Second, the IEA’s relatively low supply forecast for OECD Americas leads to a larger demand for OPEC crude in 2022. Under the IEA’s scenario, OPEC supplies 41% of global liquids in 2022, compared with 39% under OPEC’s WOO. Notably, the IEA’s forecast does not include Equatorial Guinea as a member of OPEC because IEA’s Oil 2017 report was published before that nation re-joined in May 2017. Equatorial Guinea produced roughly 0.1 mb/d of crude oil in 2017.
Average annual growth figures shown in Table 10 are somewhat complicated by divergent baseline (2016) data for certain regions. For example, the IEA’s estimates for non-OECD supplies in 2016 are 0.4 mb/d higher than OPEC’s, driven by a 0.3 mb/d difference in Europe and Eurasia. Similarly, the IEA estimates that total OPEC supplies are 0.9 mb/d higher than OPEC in 2016, explained primarily by a difference in OPEC NGLs and unconventionals (see Table 3).
Table 10. Medium-Term Liquids Supply Forecasts (mb/d)
Table 10 data sources: IEA Oil 2017, Tables 3, 5, and 5a; OPEC WOO2017, Table 4.1.Table 10 notes: Sums may not total due to rounding.OPEC Crude (a) The IEA includes Equatorial Guinea, which joined OPEC in May 2017 and produces 126,000 b/d according to OPEC’s October Oil Market Report, in its estimates for the “Africa” region, while OPEC groups it in the “OPEC” category in WOO2017. IEA (b) For IEA includes stock change and miscellaneous. OPEC also includes stock change in medium-term and long-term projections. IEA regional supply estimates include biofuels, based on IEA Oil 2017 Tables 5 and 5a.Total OPEC & World IEA (c) Estimates for total OPEC supply and world supply are constructed from other components because IEA does not directly provide these forecasts in their reports.
OPEC’s projections show stronger non-OPEC
supply growth than the IEA, particularly for the
OECD Americas.
2022 Avg. annual growth (2016-2022)
IEA (b) OPEC IEA OPEC Difference (IEA-OPEC)
Total OECD 27.3 28.8 0.4 0.7 -0.2
OECD Americas 23.0 24.6 0.4 0.7 -0.3
OECD Europe 3.8 3.8 0.0 0.0 0.0
Asia Oceania 0.6 0.5 0.0 0.0 0.0
Total Non-OECD 31.1 30.8 0.1 0.1 0.0
Asia 7.3 7.1 -0.1 -0.1 0.0
China 3.8 3.6 0.0 -0.1 0.0
Other non-OECD Asia 3.4 3.5 0.0 0.0 0.0
Middle East & Africa 3.1 3.3 0.0 0.0 0.0
Latin America 6.2 6.0 0.2 0.2 0.0
Europe & Eurasia 14.5 14.3 0.0 0.1 0.0
Processing Gains 2.4 2.4 0.0 0.0 0.0
Total Non-OPEC 60.9 62.0 0.5 0.8 -0.3
Total OPEC 42.9 (c) 40.5 0.6 0.3 0.3
OPEC crude (a) 35.9 33.5 0.5 0.1 0.4
OPEC NGLs + unconventionals 7.0 7.0 0.1 0.2 -0.1
World 103.8 (c) 102.5 1.1 1.1 0.0
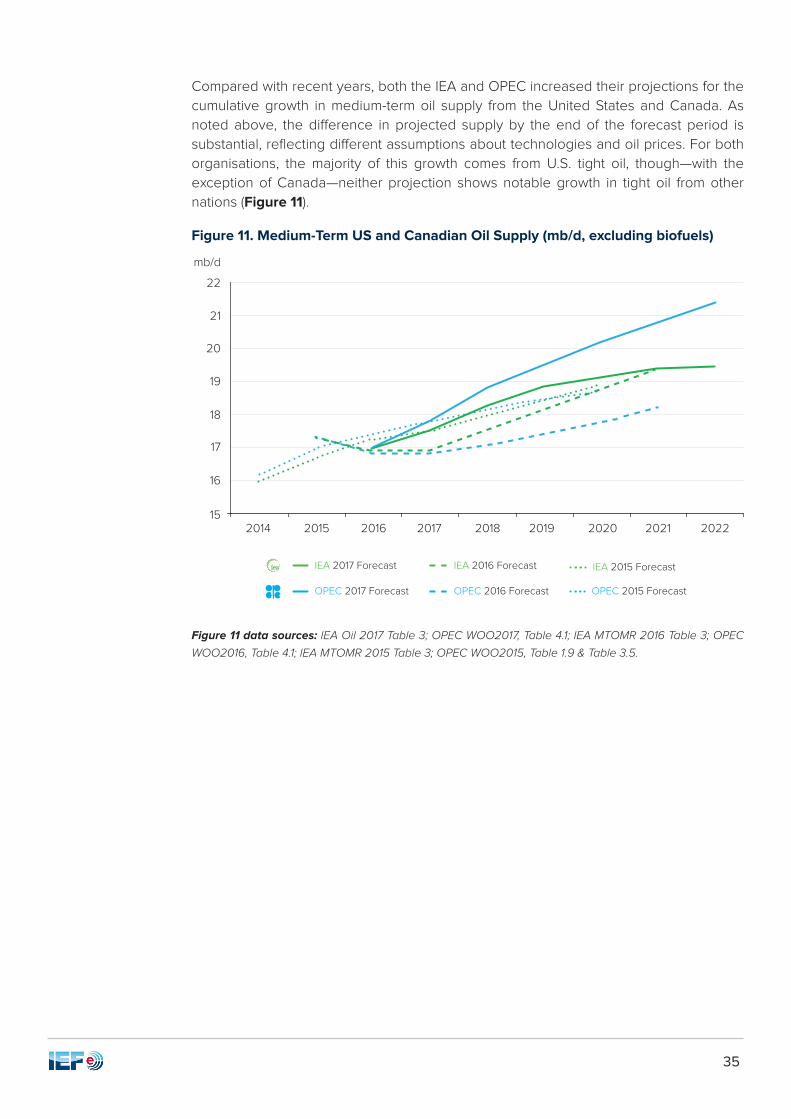
35
Compared with recent years, both the IEA and OPEC increased their projections for the cumulative growth in medium-term oil supply from the United States and Canada. As noted above, the difference in projected supply by the end of the forecast period is substantial, reflecting different assumptions about technologies and oil prices. For both organisations, the majority of this growth comes from U.S. tight oil, though—with the exception of Canada—neither projection shows notable growth in tight oil from other nations (Figure 11).
Figure 11. Medium-Term US and Canadian Oil Supply (mb/d, excluding biofuels)
Figure 11 data sources: IEA Oil 2017 Table 3; OPEC WOO2017, Table 4.1; IEA MTOMR 2016 Table 3; OPEC
WOO2016, Table 4.1; IEA MTOMR 2015 Table 3; OPEC WOO2015, Table 1.9 & Table 3.5.
IEA 2017 Forecast IEA 2016 Forecast IEA 2015 Forecast
OPEC 2017 Forecast OPEC 2016 Forecast OPEC 2015 Forecast
mb/d
15
16
17
18
19
20
21
22
2014 2015 2016 2017 2018 2019 2020 2021 2022
36
6. Long-Term Energy Outlooks
The following comparison of long-term outlooks evaluates the IEA’s World Energy Outlook 2017 (WEO2017) and OPEC’s World Oil Outlook 2017 (WOO2017). In these reports, the IEA and OPEC make projections extending through 2040, with both using baseline years of 2015 for primary energy demand and 2016 for oil (though the IEA also includes 2016 estimates for primary energy). However, differences between the two organisations in their choice of units for primary energy demand create challenges in making comparisons. OPEC uses million barrels of oil equivalent per day (mboe/d), while the IEA most frequently uses million tons of oil equivalent (mtoe) per year. Where necessary, we convert the IEA’s units of primary energy from mtoe per year to mboe/d by multiplying by 7.374 mboe/mtoe and dividing that total by 365 days per year, yielding a conversion factor of 0.0202 mboed/mtoe.
A new challenge in comparing long-term outlooks this year arises from differences in regional groupings between the IEA and OPEC. While OPEC continues to report its main regional results in terms of OECD status (i.e., OECD Americas, OECD Europe, non-OECD Asia, etc.), the IEA has altered its classifications, and does not group countries according to OECD status in its main results and Annex tables. The IEA has graciously provided additional data for this report to enhance comparability. However, such comparisons were not available for certain areas, such as biofuels. In these cases, we describe our methods to enhance comparability in the main text and table notes.
6.1 Key Assumptions
6.1.1 Scenarios and Sensitivity Cases
As in previous years, the IEA presents three scenarios on the future of energy. Alternatively, OPEC focuses on a single Reference Case, then provides a more limited range of sensitivity analyses to address uncertainties through 2040. Table 11 lists key assumptions for core scenarios included in the WEO2017 and WOO2017. A more detailed comparison is provided in Annex 1, and a comparison of key outlook results for each scenario is featured in Annex 2.
Table 11. Long-Term Scenario Key Assumptions
IEA and OPEC make projections extending
through 2040 using the same baseline data but
differences in unit choice create challenges for making comparisons.
The IEA has altered its regional classifications,
and does not group countries according to
OECD status
4 IEA, Oil Information 2015, IV.93.
IEA WEO Scenarios OPEC WOO Scenarios
Current Policies Scenario: Only considers policies that have been enacted as of mid-2017
Reference Case: Only considers policies that have been enacted, but also accepts that the policy process will evolve over time
New Policies Scenario: Considers both policies in place and commitments announced
Sensitivity Analysis: Considers cases with higher or lower economic growth, adoption of alternative vehicles, deployment of energy efficiency technologies, and non-OPEC oil supplies
Sustainable Development Scenario: Includes the energy-related objectives included in the UN’s Agenda for Sustainable Development

37
The IEA has retained two of its core scenarios—the New Policies Scenario (NPS) and Current Policies Scenario (CPS)—while updating its third scenario, shifting from the 450-ppm Scenario, associated with the pledges to reduce greenhouse gas emissions of the 2015 Paris Agreement to the new Sustainable Development Scenario (SDS) associated with the wider ranging Sustainable Development Goals of the 2030 Agenda adopted by the UN in 2015. The New Policies Scenario, the central scenario in the WEO series, considers both policies in place as well as policies that have been announced. The Current Policies Scenario is provided as a baseline scenario to show how the global energy market might evolve without further policies. Finally, the SDS creates an energy path consistent with the United Nations’ Sustainable Development Goals, and projects carbon dioxide emissions from fossil fuel consumption of 18.3 billion metric tonnes in 2040, 0.6% below the levels envisioned in the WEO 2016 450 Scenario. All three IEA scenarios share the same GDP and population assumptions, while variations in policy affect technological development and energy markets.
OPEC employs sensitivity analysis to examine specific issues in the WOO2017, building upon OPEC’s World Energy Model (OWEM) for upstream liquids demand and supply projections. In the WOO series, the Reference Case is the central scenario. The Reference Case not only considers enacted policies, but also accepts that the policy process evolves over time, with regional policy assumptions highlighted in chapter 1 of WOO2017. Because OPEC’s Reference Case is not strictly based on energy policies already in place, it is challenging to find a single counterpart in IEA’s WEO2017 for comparison. As a result, we compare the WOO2017 Reference Case with both the IEA’s Current Policies Scenario and the New Policies Scenario, selectively providing other scenarios and sensitivity cases for additional context.
OPEC examines several sensitivity cases for specific topics in WOO2017. The first focuses on alternative economic growth rates, with lower and higher assumptions about global labour productivity and employment growth, which in turn affect global oil demand. A second sensitivity case focuses on the penetration of alternative vehicles, with electric vehicle sales growing to 26% of the global passenger car fleet by 2040, compared with 12% under the Reference Case. Third, OPEC examines a case with accelerated deployment of energy efficiency, reducing oil demand across a variety of sectors. Finally, as in previous years, the WOO2017 includes a sensitivity analysis of higher and lower non-OPEC oil supplies, where the largest contributor to higher or lower global supplies is the United States, with substantial upside and downside potential also emerging from Canada, Russia, and Brazil.
6.1.2 Demography
As in previous outlooks, both the IEA and OPEC base their demographic assumptions primarily upon projections made by the United Nations Department of Economic and Social Affairs Population Division. Direct comparison is complicated by different base years of 2016 for the IEA and 2015 for OPEC, and by different regional groupings. Globally, the IEA projects growth of 0.9% per annum through 2040, while OPEC projects annual average growth of 1.0%. This difference is partly due to different baseline population levels, with OPEC using 7.35 billion people in 2015 and the IEA using 7.42 billion in 2016. In 2040, the IEA assumes 9.14 billion and OPEC assumes 9.16 billion people.
For both outlooks, the large bulk of new population comes from developing countries. According to the IEA’s assumptions, population growth rates from 2016 to 2040 are highest in Africa (2.2% p.a.), the Middle East (1.4% p.a.), and India (0.9% p.a.). OPEC makes
The IEA long-term scenarios include
the Current Policies Scenario, the New
Policies Scenario and the Sustainable
Development Scenario.
OPEC employs sensitivity analysis
to examine specific issues in the WOO2017,
building upon OPEC’s World Energy Model
(OWEM) for upstream liquids demand and supply projections.
Both the IEA and OPEC base their demographic
assumptions primarily upon projections made
by the United Nations Department of Economic
and Social Affairs Population Division
(UNDP).

38
similar assumptions, with population growth rates from its non-OPEC Middle East and Africa grouping at 2.9%, OPEC nations at 2.3%, and India at 1.0%. India is likely to overtake China as the world’s most populous country in the 2020s, growing to a population of more than 1.6 billion by 2040.
In addition to population growth assumptions, urbanisation continues to accelerate under both projections, with the share of people living in cities growing from 54% in 2016 to 63% in 2040. The trend occurs most rapidly in Africa and non-OECD Asia, with China in particular accelerating urbanisation from a rate of 57% in 2016 to 73% by 2040. Other crucial demographic factors that may impact energy consumption include age structure and global migration patterns. For example, energy demand projections will be higher if demographic assumptions include a larger percentage of working-age population and more immigrants from non-OECD nations to OECD nations.
6.1.3 Economic Growth
The IEA and OPEC take similar approaches in deriving GDP assumptions. For medium-term projections, both use internal expertise in combination with economic forecasts published by the IMF, World Bank and other organisations. Their long-term projections, however, are based on assumptions about working population and productivity levels, key factors in determining economic growth rates. The IEA and OPEC use slightly different assumptions, and their projections for annual average global economic growth through 2040 vary modestly, with OPEC assuming 3.5%, and the IEA assuming 3.4%, identical to last year’s assumptions.
The IEA and OPEC both use 2016 as a base year and make GDP assumptions in Purchasing Power Parity (PPP) terms5. However, the two organisations use different projection years in their outlooks to calculate compound average annual growth. OPEC publishes growth assumptions from 2016-2040, with increments of 2016-2022, 2022-2030, and 2030-2040. The IEA also publishes assumptions from 2016-2040, but with increments of 2016-2025, and 2025-2040.
To allow for comparability, we use standardised annual economic growth estimates from 2016-2040 in Figure 12. As noted above, comparisons between regions are complicated by different regional groupings and by OPEC’s separation of its member countries into a distinct “OPEC” category. Still, some comparisons are instructive. For example, OPEC projects annual average growth in OECD Americas of 2.5%, compared with 2.1% for the IEA’s North America grouping (which differs from OECD Americas by not including Chile). OPEC is also notably more bullish in other regions, including China, India, and OECD Europe (compared below to the IEA’s European Union grouping). This trend reverses when examining other non-OECD Asian nations, where OPEC’s projection of 3.8% is well below the IEA’s forecast of 4.5% in its “Southeast Asia” grouping.
Urbanisation is forecast to accelerate under both projections. The share of people living in cities will
grow from 54% in 2016 to 63% in 2040.
IEA and OPEC use slightly different
assumptions to project economic growth rates.
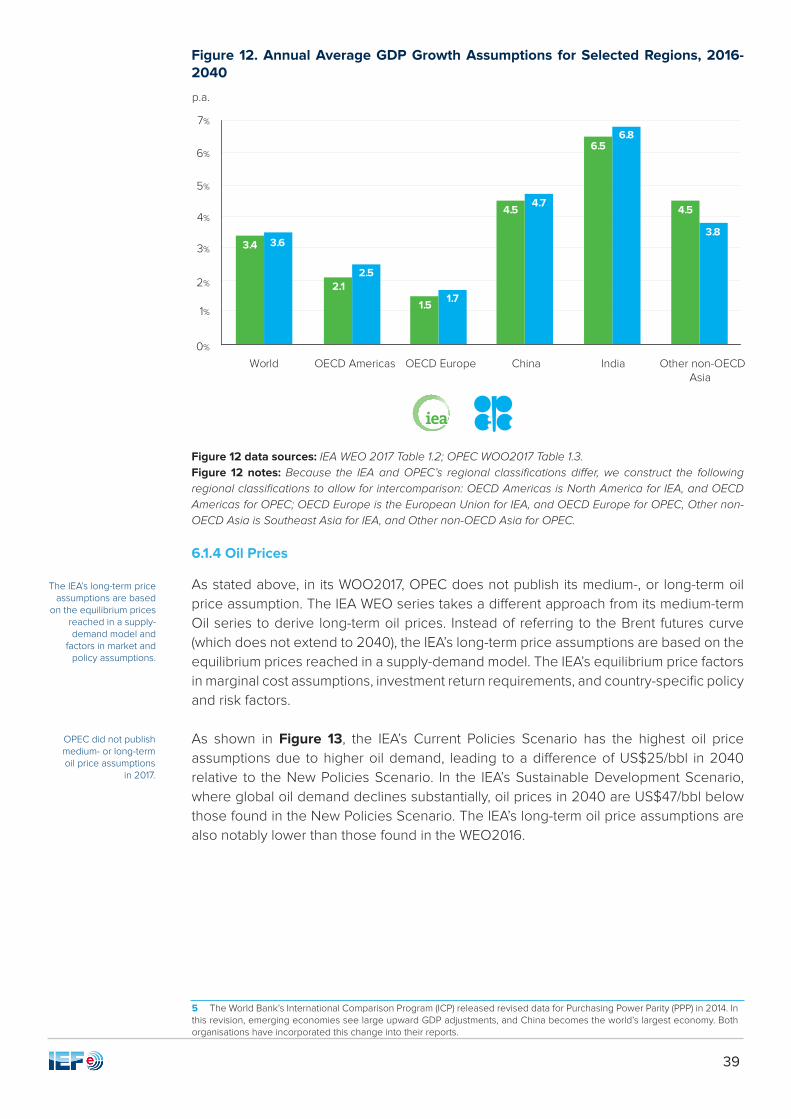
39
Figure 12. Annual Average GDP Growth Assumptions for Selected Regions, 2016-2040
Figure 12 data sources: IEA WEO 2017 Table 1.2; OPEC WOO2017 Table 1.3. Figure 12 notes: Because the IEA and OPEC’s regional classifications differ, we construct the following regional classifications to allow for intercomparison: OECD Americas is North America for IEA, and OECD Americas for OPEC; OECD Europe is the European Union for IEA, and OECD Europe for OPEC, Other non-OECD Asia is Southeast Asia for IEA, and Other non-OECD Asia for OPEC.
6.1.4 Oil Prices
As stated above, in its WOO2017, OPEC does not publish its medium-, or long-term oil price assumption. The IEA WEO series takes a different approach from its medium-term Oil series to derive long-term oil prices. Instead of referring to the Brent futures curve (which does not extend to 2040), the IEA’s long-term price assumptions are based on the equilibrium prices reached in a supply-demand model. The IEA’s equilibrium price factors in marginal cost assumptions, investment return requirements, and country-specific policy and risk factors.
As shown in Figure 13, the IEA’s Current Policies Scenario has the highest oil price assumptions due to higher oil demand, leading to a difference of US$25/bbl in 2040 relative to the New Policies Scenario. In the IEA’s Sustainable Development Scenario, where global oil demand declines substantially, oil prices in 2040 are US$47/bbl below those found in the New Policies Scenario. The IEA’s long-term oil price assumptions are also notably lower than those found in the WEO2016.
5 The World Bank’s International Comparison Program (ICP) released revised data for Purchasing Power Parity (PPP) in 2014. In this revision, emerging economies see large upward GDP adjustments, and China becomes the world’s largest economy. Both organisations have incorporated this change into their reports.
p.a.
0%
2%
4%
6%
7%
5%
3%
1%
World OECD Americas OECD Europe China India Other non-OECDAsia
3.4 3.6
2.12.5
1.51.7
4.54.7
6.56.8
4.5
3.8
The IEA’s long-term price assumptions are based
on the equilibrium prices reached in a supply-demand model and
factors in market and policy assumptions.
OPEC did not publish medium- or long-term oil price assumptions
in 2017.
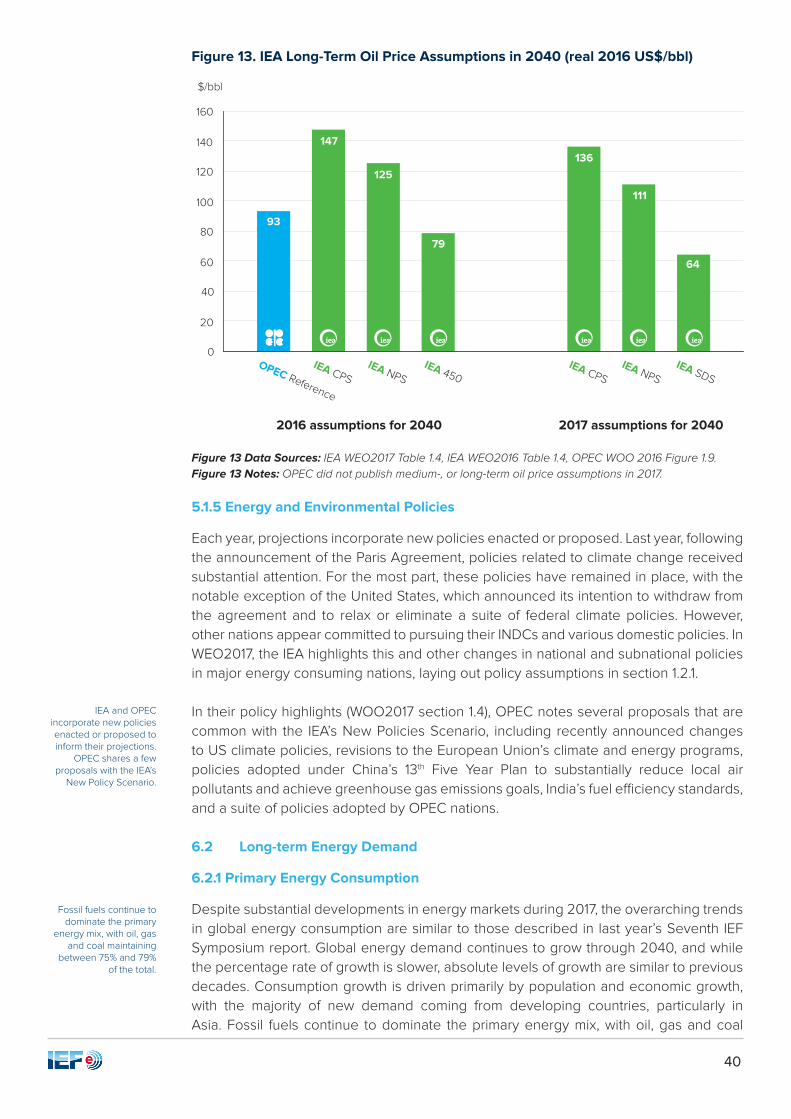
40
Figure 13. IEA Long-Term Oil Price Assumptions in 2040 (real 2016 US$/bbl)
Figure 13 Data Sources: IEA WEO2017 Table 1.4, IEA WEO2016 Table 1.4, OPEC WOO 2016 Figure 1.9. Figure 13 Notes: OPEC did not publish medium-, or long-term oil price assumptions in 2017.
5.1.5 Energy and Environmental Policies
Each year, projections incorporate new policies enacted or proposed. Last year, following the announcement of the Paris Agreement, policies related to climate change received substantial attention. For the most part, these policies have remained in place, with the notable exception of the United States, which announced its intention to withdraw from the agreement and to relax or eliminate a suite of federal climate policies. However, other nations appear committed to pursuing their INDCs and various domestic policies. In WEO2017, the IEA highlights this and other changes in national and subnational policies in major energy consuming nations, laying out policy assumptions in section 1.2.1.
In their policy highlights (WOO2017 section 1.4), OPEC notes several proposals that are common with the IEA’s New Policies Scenario, including recently announced changes to US climate policies, revisions to the European Union’s climate and energy programs, policies adopted under China’s 13th Five Year Plan to substantially reduce local air pollutants and achieve greenhouse gas emissions goals, India’s fuel efficiency standards, and a suite of policies adopted by OPEC nations.
6.2 Long-term Energy Demand
6.2.1 Primary Energy Consumption
Despite substantial developments in energy markets during 2017, the overarching trends in global energy consumption are similar to those described in last year’s Seventh IEF Symposium report. Global energy demand continues to grow through 2040, and while the percentage rate of growth is slower, absolute levels of growth are similar to previous decades. Consumption growth is driven primarily by population and economic growth, with the majority of new demand coming from developing countries, particularly in Asia. Fossil fuels continue to dominate the primary energy mix, with oil, gas and coal
IEA and OPEC incorporate new policies enacted or proposed to inform their projections.
OPEC shares a few proposals with the IEA’s
New Policy Scenario.
Fossil fuels continue to dominate the primary
energy mix, with oil, gas and coal maintaining
between 75% and 79% of the total.
$/bbl
0
20
40
60
80
100
120
140
160
OPEC Reference
IEA CPSIEA NPS
IEA 450IEA CPS
IEA NPSIEA SDS
2016 assumptions for 2040
93
147
125136
64
111
79
2017 assumptions for 2040

41
maintaining between 75% and 79% of the total share in all the scenarios excluding the IEA Sustainable Development Scenario, where fossil fuels satisfy 61% of global demand. As always, significant uncertainties remain regarding policy and technological development, which will play important roles in shaping the pace of demand growth as well as the composition of the fuel mix.
However, there are some important differences between 2017 and 2016 projections. Total primary energy demand projections for all major scenarios are lower this year than in 2016, and lower still from 2015’s outlooks. In OPEC’s WOO2017 Reference Case, demand grows by 35% from 2015-2040, compared with 40% growth from 2014-2040 in WOO2016 and 49% growth from 2013-2040 in WOO2015. IEA Scenarios generally show more modest changes, with the Current Policies Scenario growing by 42% from 2015-2040, compared with last year’s projection of 43% growth from 2014-2040. The IEA’s 2016 New Policies Scenario projects growth of 29%, compared with 2016’s projection of 31% growth. The Sustainable Development Scenario projects global demand growth up to 2040 of just 3%, compared with 9% in last year’s 450 Scenario.
Figure 14 provides a comparison of projections for total primary energy supply by energy source, highlighting a number of differences. Of the three major Scenarios, the IEA’s Current Policies Scenario projects the most robust growth in energy demand, followed by OPEC’s Reference Case and the IEA’s New Policies Scenario. The IEA’s Current Policies Scenario projection for coal, oil, and gas consumption is 16 mboe/d, 10 mboe/d, and 1 mboe/d higher, respectively, than OPEC’s Reference Case. Under the IEA’s New Policies Scenario, consumption for all fossil fuels is lower than OPEC’s Reference Case, with the largest difference again seen in coal (-7 mboe/d), natural gas (-5 mboe/d), and oil (-3 mboe/d). The IEA’s Sustainable Development Scenario includes substantially slower growth in overall primary energy demand approximating a halt in demand growth over the projection period, with a notable decrease in the share of fossil fuels in the primary energy mix. As the scenarios tighten to meet GHG goals, coal is the biggest loser of relative market share.
Total primary energy demand projections for all major scenarios are lower this year than in
2016, and lower still from 2015’s outlooks.

42
Figure 14. World Primary Energy in 2015 and Outlook for 2040 (mboe/d)
Figure 14 data sources: IEA WEO 2017, Annex Tables; OPEC WOO2017, Table 2.2.Figure 14 notes: a IEA primary energy is converted from mtoe per year to mboe/d by multiplying by 0.0202 mboed/mtoe.
Figure 15 presents the share of each fuel in the global energy mix in 2015, along with projections for 2040. In the IEA’s Current Policies Scenarios, OPEC’s Reference Case, and the IEA’s New Policies, oil is expected to maintain its position as the leading fuel in 2040, though its share shrinks to 28%, 27%, and 27%, respectively. In the IEA’s Current Policies Scenario, the share of coal declines modestly during the projection period from 28% to 26%, while it drops more rapidly to 23% in the OPEC Reference Case and 22% in the IEA’s New Policies Scenario. Natural gas is set to grow the fastest among fossil fuels in absolute and percentage terms under all scenarios, including the IEA Sustainable Development Scenario. However, unlike either of the last two years, OPEC’s Reference Case does not project natural gas emerging as the leading primary energy source by 2040. The share of renewables, which is currently dominated by biomass, is projected to increase in all scenarios from 14% in 2015 to 16% under the IEA’s Current Policies Scenario, 18% in OPEC’s Reference Case, and to 20% under the IEA’s New Policies Scenario. Virtually all of this growth comes from renewable electricity such as wind, solar, and hydro.
2015 2040
mboe/d
0
50
100
150
200
250
300
350
400
CPS NPS SDS Ref
Coal Oil Gas Nuclear Hydro Biomass Other renewables
390
355
284
372
276275
(a)

43
Figure 15. World Primary Energy Fuel Shares in 2015 and Outlook for 2040
Figure 15 data sources: IEA WEO 2017, Annex Tables; OPEC WOO2017, Table 2.2.Figure 15 notes: IEA (a) IEA primary energy is converted from mtoe per year to mboe/d by multiplying by 0.0202 mboed/mtoe. Sums in the data callouts may not total due to rounding.
6.2.2 Liquids Demand
Even more so than in previous year’s assessments, it is a challenge to directly compare liquids demand between the WEO and WOO reports. First, as noted above, regional classifications in the two reports now vary more substantially than in previous years.
Second, as in previous years, the IEA and OPEC diverge on their classification of biofuels. The IEA groups biofuels into the renewables category, and projects demand for biofuels and oil separately. OPEC includes biofuels in the liquids category, as the IEA does in its short-, and medium-term outlooks (but not in the WEO). To adjust for this difference, we aggregate the IEA’s oil and biofuels demand for each region, making the numbers comparable with OPEC’s6. We also must convert IEA biofuels data in energy equivalent units to volumetric units for comparison with OPEC7.
Third, the IEA and OPEC define bunker fuels differently. While the IEA reports international marine bunker and aviation fuel as a distinct “bunker” group – not attributable to any country or region – OPEC includes bunker and aviation fuel in each region’s oil demand, just as it does with biofuels. In addition, OPEC does not differentiate between international and domestic aviation fuels. Aggregating total marine bunker and aviation fuel demand from the WOO2017 leads to a substantially larger number than that reported under the “bunkers” category in the WEO2017. For this reason, we do not compare bunker and aviation fuels between the IEA and OPEC, although we do show “bunkers” as a category
6 These biofuels projections are aggregated from Annex A Tables. 7 We use a conversion factor of 0.02083 mbd/mtoe for biofuels. This conversion factor is derived from IEA’s published estimates of global biofuels demand from the Annex Tables (expressed in mtoe) and its published estimates of global biofuels demand in Table 4.2 (expressed in energy-equivalent volumes in mbd). While the conversion rates vary slightly from year to year and between scenarios, we use this single estimate, based on the 2025 conversion factor under the New Policies Scenario, for simplicity.
It is challenging to compare oil demand
between the WEO and WOO because of different regional definitions and fuel
classifications.
0%
10%
20%
30%
40%
50%
60%
70%
80%
90%
100%
2015 2040
CPS NPS SDS Ref
Coal Oil Gas Nuclear Hydro Biomass Other renewables
(a)
28%
32%
22%
5%
1% 1%
2%
4% 6% 5%
10%
28% 26% 22%13%
23%
27%
25%
6%
10%
23%
25%
14%
10%
11%
27%
25%
6%
10%
28%
24%
5%
9%
31%
21%
5%
10%
2%3%
3%
4%
3%

44
for the IEA’s world oil demand projections.
Fourth, although OPEC disaggregated its member countries demand data to improve direct comparison with IEA’s outlook, an inconsistency still exists within the Middle East & Africa regions as reported in the two outlooks. While IEA reported Middle East and Africa regions separately, OPEC groups them together as a single category. This paper aggregates the Middle East and Africa in WEO2017 to more directly compare oil demand projections between the two organisations.
Incorporating the adjustments described above, Table 12 presents a comparison of long-term world liquids demand projections using the three central cases. Although the share of oil in the world primary energy mix is expected to decrease, the level of oil demand still enjoys robust growth over the projection period. In IEA’s New Policies Scenario and OPEC’s Reference Case, world liquids demand reaches 109 mb/d and 111 mb/d, respectively, by 2040. In the IEA’s Current Policies Scenario, 2040 world liquids demand grows to 122 mb/d (Figure 16). These projections are quite similar to those made in 2016, when projections for global liquids demand in 2040 were 110 mb/d under the IEA’s New Policies Scenario, 109 mb/d under OPEC’s Reference Case, and 122 under the IEA’s Current Policies Scenario.
The difference between the highest (IEA Current Policies Scenario) and lowest (IEA Sustainable Development Scenario) projections for 2040 world liquids demand is nearly 42 mb/d. Just like last year’s outlooks, OPEC’s Reference Case projects annual growth for liquids demand of 0.7 mb/d, slightly more than the IEA’s New Policies Scenario projection of 0.6 mb/d, but well below the IEA’s Current Policies Scenario forecast of 1.1 mb/d per year. Figure 16 also suggests that demand growth will slow in the coming decades. Both the IEA and OPEC estimate slower annual demand growth after 2025 relative to 2016-2025 under all scenarios, including OPEC’s High and Low Economic Growth Sensitivity Cases.
IEA and OPEC define bunker fuels differently
and group the Middle East and Africa regions
differently.
Although the share of oil in the world primary
energy mix is expected to decrease, the level of
oil demand still grows over the projection
period.

45
Table 12. Long-Term Liquids Demand Forecasts (mb/d)
Table 12 data sources: IEA WEO 2017, Table 4.2, Annex A Tables, and internal communication; OPEC WOO2017, Table 3.2.Table 12 notes: Sums may not total due to rounding. IEA and OPEC regional classifications differ. IEA oil demand figures that align with OPEC’s regional classification system were provided via internal communication. IEA NPS (a) Biofuels from IEA WEO 2017 Annex A are added to IEA regional oil demand data for comparability with OPEC estimates, after converting from mtoe to mb/d. However, the regional groupings provided by the IEA for biofuels do not match OPEC’s. We take the following steps to create comparable groups: Direct comparability is available for World, Total OECD, Total non-OECD, China, India, Middle East, Africa; OPEC’s OECD Americas category is compared to IEA’s North America category; OPEC’s OECD Europe category is compared to IEA’s European Union category; OPEC’s OECD Asia-Oceania category is compared to IEA’s Japan; OPEC’s non-OECD Americas category is compared to IEA’s Central and South America category; OPEC’s non-OECD Europe category is compared to IEA’s Europe category, minus the European Union contribution; OPEC’s non-OECD Asia category is compared to IEA’s China + India + Southeast Asia category. Bunkers (b) Bunkers in the IEA WEO include international marine bunkers and aviation fuels. In the OPEC WOO, all bunkers are within regional demand.
2040 Growth p.a. (2016-2040) Difference (IEA-OPEC)
IEA NPS (a)
IEA CPS
OPEC Ref.
IEA NPS
IEA CPS
OPEC Ref. NPS CPS
Total OECD 33.0 37.4 37.9 -0.4 -0.2 -0.4 0.0 0.1
OECD Americas 19.7 22.2 20.2 -0.2 0.0 -0.2 0.0 0.1
OECD Europe 8.3 9.8 11.5 -0.2 -0.1 -0.1 -0.1 0.0
Asia Oceania 5.0 5.4 6.2 -0.1 -0.1 -0.1 0.0 0.0
Total Non-OECD 64.6 71.9 73.2 0.8 1.1 1.0 -0.2 0.1
Asia 35.0 39.1 40.9 0.5 0.7 0.7 -0.2 0.0
China 16.0 17.3 17.8 0.2 0.2 0.3 -0.1 0.0
India 9.9 10.0 10.3 0.2 0.2 0.2 0.0 0.0
Other non-OECD Asia 9.2 11.8 12.8 0.1 0.2 0.2 -0.1 0.0
Middle East & Africa 7.6 8.3 7.3 0.1 0.1 0.1 0.0 0.0
Latin America 16.9 18.9 6.4 0.2 0.3 0.1 0.1 0.2
Europe & Eurasia 5.5 6.0 6.2 0.0 0.0 0.0 0.0 0.0
Bunkers(b) 11.1 12.8 n/a 0.1 0.2 n/a n/a n/a
World 109.0 122.1 111.1 0.6 1.1 0.7 -0.1 0.5
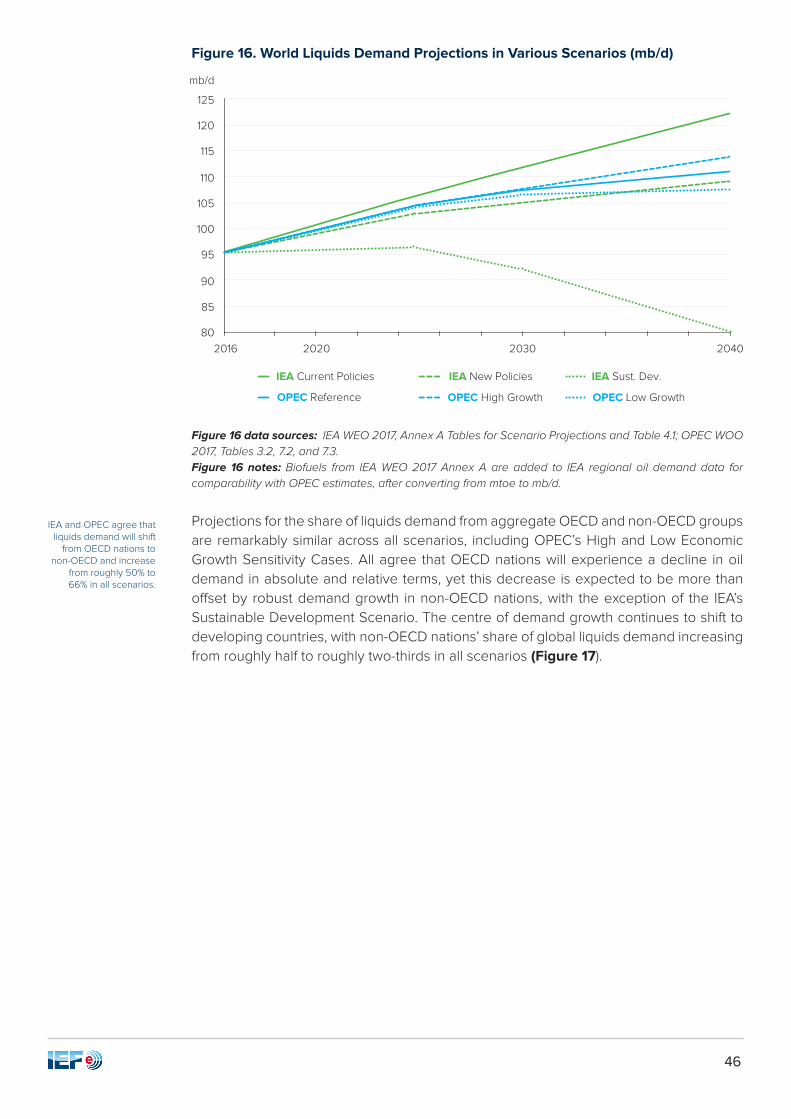
46
Figure 16. World Liquids Demand Projections in Various Scenarios (mb/d)
Figure 16 data sources: IEA WEO 2017, Annex A Tables for Scenario Projections and Table 4.1; OPEC WOO 2017, Tables 3.2, 7.2, and 7.3. Figure 16 notes: Biofuels from IEA WEO 2017 Annex A are added to IEA regional oil demand data for comparability with OPEC estimates, after converting from mtoe to mb/d.
Projections for the share of liquids demand from aggregate OECD and non-OECD groups are remarkably similar across all scenarios, including OPEC’s High and Low Economic Growth Sensitivity Cases. All agree that OECD nations will experience a decline in oil demand in absolute and relative terms, yet this decrease is expected to be more than offset by robust demand growth in non-OECD nations, with the exception of the IEA’s Sustainable Development Scenario. The centre of demand growth continues to shift to developing countries, with non-OECD nations’ share of global liquids demand increasing from roughly half to roughly two-thirds in all scenarios (Figure 17).
IEA and OPEC agree that liquids demand will shift
from OECD nations to non-OECD and increase
from roughly 50% to 66% in all scenarios.
mb/d
80
85
90
95
100
105
110
115
120
125
IEA Current Policies IEA New Policies IEA Sust. Dev.
OPEC Reference OPEC High Growth OPEC Low Growth
2016 2020 2030 2040

47
Figure 17. OECD and Non-OECD Shares of Liquids Demand in 2016 and Outlook for 2040
Figure 17 data sources: IEA WEO 2017, Annex A Tables for Scenario Projections & Table 4.1; OPEC WOO 2017, Tables 3.2, 7.2 and 7.3. Figure 17 notes: (a) The “bunkers” group in the IEA’s WEO report is excluded from calculation for OECD and non-OECD oil demand shares. (b) Biofuels from IEA WEO 2017 Annex A are added to IEA regional oil demand data for comparability with OPEC estimates. See Table 12 notes for details.
For specific regions and nations, the IEA and OPEC share similar views on overarching trends of oil demand, with some moderate differences. For instance, both project that non-OECD Asia will lead consumption growth over the forecast period. Figure 17a shows projected oil demand for China, India, and other non-OECD Asia in 2040. OPEC’s projections appear substantially more bullish than the IEA’s, even under the Current Policies Scenario. However, direct comparisons between regions are challenging, because OPEC includes bunker fuels within these regional estimates, while the IEA does not.
0%
20%
40%
60%
80%
100%
66%66%66%
51%
66%
34%34%33%34%34%
49%
OECDNON OECD
CPS NPS SDS Ref High Low
2016 2040
51%
49%
66%
34%
67%

48
Figure 17a. Non-OECD Asia Oil Demand in 2040
Figure 17a data sources: IEA WEO 2017, Annex A Tables for Scenario Projections & Table 4.1; OPEC WOO 2017, Tables 3.2, 7.2 and 7.3. Figure 17a notes: Regional demand projections from OPEC WOO 2017 include bunker fuels, while the IEA does not. Biofuels from IEA WEO 2017 Annex A are added to IEA regional oil demand data for comparability with OPEC estimates. See Table 12 notes for details.
Perspectives on sectoral trends are broadly consistent between the IEA and OPEC. Transportation and the petrochemicals industry are expected to remain the largest oil consumers and contribute the majority of demand growth. Oil consumption for power generation is projected to decrease in all regions. As a result, shares of oil consumption in transport and petrochemical sectors become larger.
For natural gas, the IEA forecasts that industrial uses will be the leading sector for demand growth, followed closely by demand for gas in power generation. In a special focus of the WEO 2017, the IEA highlights strong demand growth from the power sector in China and the Middle East, along with industrial and heating demand in China. OPEC’s WOO 2017 does not detail its assumptions about sectoral gas demand, though it does note that consumption is likely to grow most substantially in China and other developing countries.
6.3 Long-Term Oil Supply
6.3.1 Mathematical Models
In Section 3, we noted that both the IEA and OPEC base their medium-term supply projections on bottom-up approaches. However, their long-term supply projection methodologies are more distinct.
In its WOO series, OPEC uses a resources-to-production (R/P) model to verify estimates of annual future oil production based on variables including discovery rates, development cost, profitability and drilling footage. In this model, the focus is on estimating the economic accessibility of oil resources in each country. OPEC primarily relies on U.S. Geological Survey (USGS) data (updated most recently in 2012) for country-level estimates of Ultimately Recoverable Resources (URR), supplemented by regional updates and other sources. The advantage of using R/P to verify estimates is its simplicity and ease of understanding. However, URR estimates are subject to substantial uncertainty, and past research has identified cases where URR estimates may be low due to the
IEA and OPEC perspectives on sectoral
trends are overall consistent.
Natural gas will be a key fuel for industrial uses
and power generation.
IEA and OPEC long-term supply methodologies
are very different.
OPEC uses a resources-to-production (R/P)
model in combination with other factors to
project supply.
0
2
4
6
8
10
12
14
16
18
China India Other non-OECD Asia
IEA NPS IEA CPS OPEC Ref
mb/d
16
9.91 0 10.39.2
11.812.8
17.3 17.8

49
possible exclusion of new discoveries and underestimates of reserve growth8. In addition, unanticipated technological advancements may substantially affect the economic viability of known resources.
Like the previous two years, the WOO2017 includes a detailed assessment of active unconventional plays in North America. And similar to last year, it includes an “upside” and a “downside” sensitivity case for oil supply (WOO2017 Section 7.1.4), incorporating both conventional and unconventional sources.
The IEA employs a bottom-up modelling approach for its long-term oil supply projection. Unlike in the IEA Medium-Term Oil 2017 Report, however, the IEA takes a country-by-country approach instead of the field-by-field approach (though the first five years of the long-term projection employs field-by-field analysis). For the long-term projections, production in each country is derived by simulating the investment process, considering existing and potential resources, global oil demand, and a net present value (NPV) ranking of possible projects in that country.
Another important difference between the IEA’s long-term supply forecast and its medium-term forecast lies in the methodology for calculating OPEC supply. As shown in Table 10, OPEC crude is constructed by subtracting non-OPEC supplies and OPEC NGLs/unconventionals supply from total world oil demand in IEA’s Oil 2017 report. In the long-term WEO model, however, supplies from OPEC Member Countries are projected using the same methodology used for non-OPEC nations.
6.3.2 Liquids Supply
Table 13 summarises long-term liquids supply outlooks for the IEA’s New Policies and Current Policies Scenarios and OPEC’s Reference Case. The IEA’s New Policies Scenario and OPEC’s Reference Case forecast similar global supply in 2040 of 109.0 mb/d and 111.3 mb/d, respectively, while the IEA’s Current Policies Scenario projects 122.0 mb/d. These projections vary modestly from those made in 2016, when projections for 2040 were 109.9 mb/d under the IEA’s New Policies Scenario, 109.6 mb/d under OPEC’s Reference Case and 122.5 mb/d under the IEA’s Current Policies Scenario.
Other differences emerge regarding regional supplies. First, the IEA’s projections for supplies from the OECD Americas under the New Policies and Current Policies Scenarios are respectively 2.0 mb/d and 4.0 mb/d higher than OPEC’s Reference Case in 2040. This is particularly interesting given OPEC’s stronger projections for OECD Americas supplies in the medium term. In other cases, OPEC is more bullish on production, such as from non-OECD Europe and Eurasia, projecting 2040 production to be 2.7 mb/d and 0.8 mb/d higher than the IEA New Policies and Current Policies Scenarios, respectively. OPEC also projects that OPEC member nations will provide 46% of global supply in 2040, higher than the respective shares of 43% and 44% under the IEA’s New Policies and Current Policies Scenarios.
The IEA employs a bottom-up country-
by-country modelling approach for its long-
term supply projection.
8 Adam R. Brandt, Review of mathematical models of future oil supply: Historical overview and synthesising critique, Energy, Volume 35, Issue 9, September 2010, Pages 3958-3974, ISSN 0360-5442, http://dx.doi.org/10.1016/j.energy.2010.04.045.

50
Table 13. Long-Term Liquids Supply (mb/d)
Table 13 data sources: IEA WEO 2017, Annex A Tables, Tables 4.6 and 4.7, and internal communication; OPEC WOO2017, Tables 4.7 and 4.10.Table 13 notes: Sums may not total due to rounding.OPEC Ref. (a) The IEA WEO does not include regional biofuels supply. Regional biofuels supply (OPEC WOO2017 Table 4.10) is therefore subtracted from each of OPEC’s regional total liquids supply (OPEC WOO2017, Table 4.7) and only world biofuels supply is provided. OPEC crude (b) The IEA WEO classifies Venezuela extra-heavy oil as “OPEC unconventionals,” while OPEC classifies it as “OPEC crude.” We have adjusted IEA data to match OPEC’s definition. As a result, the “OPEC crude” category includes Venezuelan extra heavy oil.
OPEC and the IEA differ somewhat in their projections for global unconventional supplies. Both organisations project growth in tight oil supplies, with OPEC estimating global tight crude supplies reaching a peak of 9.2 mb/d in 2030, and the IEA showing tight crude reaching 9.5 mb/d in 2035 in the New Policies Scenario and 10.1 mb/d in 2030 under the Current Policies Scenario. In each of these scenarios, tight oil production is dominated by the U.S. and Canada.
Recall from Figure 9 (Section 3) that the IEA and OPEC use different classification systems for liquids fuels, presenting challenges when comparing long-term supply forecasts. Analysis of the IEA’s and OPEC’s views about the composition of world supply by fuel type, as shown in Figure 18 and Figure 19, also yields notable points. Figure 18 shows that all three scenarios project increasing liquids supply both from OPEC and non-OPEC sources. Consequently, Figure 19 shows OPEC’s share of global supply rising under all scenarios, from the current level of around 41% to roughly 43% in the IEA’s New Policies Scenario, 44% in the Current Policies Scenario, and 46% in OPEC’s Reference Case. For non-OPEC liquids, conventional supplies decline in most scenarios (excluding the IEA Current Policies Scenario), while other non-OPEC liquids including tight crude/oil and
IEA and OPEC use different classification
systems for liquid fuels, making it difficult to compare long-term
supply forecasts.
2040 Growth p.a. (2016-2040) Difference (IEA-OPEC)
IEA NPS
IEA CPS
OPEC Ref. (a)
IEA NPS
IEA CPS
OPEC Ref. NPS CPS
Total OECD 27.7 30.0 25.4 0.2 0.3 0.1 0.1 0.2
OECD Americas 24.5 26.5 22.5 0.2 0.3 0.1 0.1 0.2
OECD Europe 2.4 2.5 2.4 0.0 0.0 0.0 0.0 0.0
Asia Oceania 0.9 1.0 0.5 0.0 0.0 0.0 0.0 0.0
Total Non-OECD 74.1 85.3 28.2 0.2 0.7 0.0 0.2 0.7
Non-OECD Asia 5.8 7.0 5.3 -0.1 0.0 -0.1 0.0 0.1
Middle East, Africa & Latin America 56.2 64.3 8.2 0.4 0.7 0.0 0.4 0.7
Europe & Eurasia 12.1 14.1 14.9 -0.1 0.0 0.0 -0.1 -0.1
Processing Gains 3.1 3.5 3.0 0.0 0.1 0.0 0.0 0.0
World Biofuels supply 4.1 3.2 3.8 0.1 0.1 0.1 0.0 0.0
Total Non-OPEC 55.2 62.0 60.4 0.1 0.4 0.1 0.0 0.2
Total OPEC 46.7 53.4 50.9 0.3 0.6 0.5 -0.2 0.1
OPEC crude (b) 36.9 40.0 41.4 0.2 0.3 0.4 -0.2 -0.1
OPEC NGLs + unconventionals 10.0 11.2 9.5 0.1 0.2 0.1 0.0 0.0
World Supply 109.0 122.0 111.3 0.5 1.1 0.6 -0.1 0.4

51
biofuels grow under all three.
Figure 18. Liquids Supply Sources in 2016 and Outlook for 2040 (mb/d)
Figure 18 data sources: Internal communication with IEA; IEA WEO2017 Tables 4.6 and 4.7; OPEC WOO2017, Tables 4.7 and 4.10.Figure 18 notes: The IEA WEO classifies Venezuela extra-heavy oil as “OPEC unconventionals,” while OPEC classifies it as “OPEC crude.” We have adjusted IEA data to match OPEC’s definition. As a result, the “OPEC crude” category includes Venezuelan extra heavy oil.
2016 2040
OPEC crude (incl. venezuela extra-heavy)
Biofuels
OPEC NGLs + unconventionals
Non-OPEC crude & NGLs (excl. LTO)Non-OPEC other liquids (incl. LTO)
Processing gains
mb/d
0
25
50
75
100
125
12.7
40.8
9.5
41.4
17.9
45.4
11.2
42.5
15.5
40.6
10.0
36.9
7.4
45.2
6.1
32.7
7.5
2.3 / 1.7 2.2 / 2.2
3.1 / 4.1
3.5 / 3.2
3 / 3.8
45.4
6
32.8
NPS CPS REF

52
Figure 19. Shares of Liquids Supply by Types in 2016 and Outlook for 2040
Figure 19 data sources: See Figure 18. Figure 19 Notes: Sums in the data callouts may not total due to rounding.
Finally, Figure 20 presents a comparison of world liquids supply forecasts from the three WEO2017 scenarios, the WOO2017 Reference Case, and the WOO2017 Upside and Downside Supply sensitivity cases. This figure highlights how dramatically world supply outlooks can be affected by different scenario assumptions. The IEA primarily varies its assumptions by adjusting key energy and environmental policies, affecting all types of liquids supply. In WOO2017, the key variable that drives differences in the scenarios are production levels from non-OPEC nations, with OPEC supplies adjusted accordingly. The OPEC upside and downside sensitivity cases do not provide estimates of OPEC NGLS and unconventionals.
0%
20%
40%
60%
80%
100%
2016 2040
OPEC crude (incl. venezuela extra-heavy)
Biofuels
OPEC NGLs + unconventionals
Non-OPEC crude & NGLs (excl. LTO)Non-OPEC other liquids (incl. LTO)
Processing gains
NPS CPS REF
34% 34% 37%
9%9%9%
37%
14%
37%
14%
37%
11%
6%
47%
8%2%2%
34%
6%
47%
8%
33%
2%2%
4% 3%3% 3%3%
3%

53
Figure 20. 2040 Liquids Supply Outlook in Different Scenarios (mb/d)
Figure 20 data sources: Internal communication from IEA; IEA WEO2017 Tables 4.6 and 4.7; OPEC WOO2017, Figures 7.12, 7.15, 7.16, and 7.17. Figure 20 notes: IEAa: The IEA WEO classifies Venezuela extra-heavy oil as “OPEC unconventionals,” while OPEC classifies it as “OPEC crude.” We have adjusted IEA data to match OPEC’s definition. As a result, the “OPEC crude” category includes Venezuelan extra heavy oil. OPECb: The Upside and Downside Scenarios do not provide estimates for OPEC NGLs and unconventionals. The level of NGLs production and total production comes from internal communication with OPEC.
Non-OPEC(incl. biofuels and processing gains)
(a) (b)
OPEC crude(incl. Venezuela extra heavy)
OPEC (NGLs + unconventionals)
0
25
50
75
100
125
mb/d
SustainableDevelopment
Scenario
NewPoliciesScenario
CurrentPoliciesScenario
Downside Upside ReferenceCase
83
123
111 112 111109 11.2
44.9
67.3
9
45
57
10
41
60
37
10
65
8
38.9
62.4
8.8
26
48.1

54
6. Final Remaks
2017 witnessed further recovery in global oil prices from their lows in early 2016 near $30/bbl, mostly ranging in the $50/bbl to $60/bbl range for 2017. This steady increase in prices is attributable to a range of factors, including the continued global economic recovery and coordinated adjustments to production by OPEC members in collaboration with several non-OPEC countries. At the same time, robust supplies from OPEC and non-OPEC members have kept prices from rising rapidly despite strong demand growth.
While for some countries low oil prices support economic growth, the prospect of “lower for longer” oil prices triggered concerns elsewhere, including negative spill-over effects on financial markets, decreased investment in large projects, and weakened economic growth prospects, heightening risk of fiscal and political stresses in some major oil-producing countries. Rising prices are likely to ease some of these pressures on major oil producers, though many uncertainties remain.
Notwithstanding these short-term uncertainties, some long-term fundamentals are clear. Economic expansion and population growth will continue to boost global oil demand, with the majority of growth contributed by non-OECD nations, particularly non-OECD Asia, the Middle East and Africa. Unless policies or technologies change significantly more than currently known, oil in 2040 – along with other fossil fuels – is currently on a path to maintain a central position in the global fuel mix. However, as major emerging economies mature, new and more efficient technologies are deployed, and environmental efforts pledged under the Paris Agreement come into effect, global oil demand growth rates will likely be tempered.
Looking to 2018, markets will continue to be influenced by the decisions taken by OPEC and non-OPEC nations with regard to the potential extension of production adjustments. Other key areas of interest will include the growth rate of U.S. tight oil supplies, political stability in key oil-producing nations, and global economic growth rates.
The key questions for long-term oil supply are which nations and what types of oil production are likely to supplant production declines from existing conventional projects and support demand growth. After declining in 2016, non-OPEC supply from unconventional plays has rebounded rapidly, driven by U.S. tight oil. The industry has made efficiency gains to cope with lower oil prices, though it is unclear how sustained low prices will affect capacity and what price levels would be sufficient to support faster growth rates. In addition, it is unclear to what extent declining investment in higher cost conventional projects such as deepwater and arctic development will reduce supply in the coming five to ten years. Nonetheless, to meet long-term demand, OPEC member countries will likely continue to play a central, if not increasing role in global oil supply as high cost non-OPEC supplies remain under pressure from market volatility, moderate growth in prices, and shifting consumer preferences.
This introductory paper seeks to enhance understanding of views and methodologies from two widely acknowledged information providers, the IEA and OPEC, by comparing their outlooks over corresponding time horisons. Various similarities and differences between their historical data, assumptions and projections are described in this paper. Our objective is not to harmonise all assumptions or to eliminate differences in perspectives. Instead, the goal is to pursue higher-quality data and insight and control for differences in convention in order to better inform stakeholders worldwide.
As a continuous effort, the Eighth IEA-IEF-OPEC Symposium on Energy Outlooks aims to provide an open platform to facilitate consumer-producer dialogue on global energy

55
security. After a careful comparison of the IEA’s and OPEC’s multi-horison outlooks, this paper proposes the following issues for further discussion at the symposium:
• Advancing efforts to standardise regional classifications across long-term outlooks;
• Advancing efforts to increase comparability of medium-, and long-term oil priceassumptions;
• Ongoing analysis of differences in historical data, particularly in non-OECD demand,as well as FSU and OPEC crude and OPEC NGLs/unconventionals supply;
• Advancing efforts to standardise liquids fuel supply categories;
• Adopting consistent approaches in classifying fuels at regional versus global levels(e.g. biofuels, bunkers);
• Understanding policy assumptions made in each long-term energy outlook;
• Sharing viewpoints on oil supply forecast models, and analysing potentialenhancement of long-term oil supply projection models, particularly with respect tounconventional resources; and
• Standardising unit conversion processes across mb/d, mboe/d, and mtoe.

56
Annex 1: Long-Term Outlook Assumptions
OPEC IEA
Variables Reference Case New Policies Current Policies Sustainable Development
Global Economic Growth Rate (2016-2040)
3.43% 3.40% Same as New Policies
Same as New Policies
Population, Billion (2016-2050) From 7.3 to 9.1 From 7.3 to 9.1 Same as New
Policies Same as New Policies
Oil Price Assumptions (in 2016 $)
Not Specified 2025: $83/bbl; 2040: $111/bbl
2025: $97/bbl; 2040: $136/bbl
2025: $72/bbl; 2040: $64/bbl
Oil Investment (2017-2040 in 2016 $)
Upstream: $7.9 trillion; Midstream and Downstream: $2.6 trillion
Upstream: $9.8 trillion; Midstream and Downstream: $2.3 trillion
Upstream: $12.6 trillion; Midstream and Downstream: $2.9 trillion
Upstream: $5.8 trillion; Midstream and Downstream: $1.2 trillion
Energy and Environmental Policies
Primarily considers policies that have been enacted, but also acknowledges potential impacts from policy proposals
Considers both policies in place and announced intentions
Only policies enacted by mid-2017
Universal energy access by 2030; CO2 prices in all advanced economies; all fossil fuel subsidies phased out by 2035.
Carbon Prices Not Specified
2040: $24 in S. Africa, $35 in China, $45 in Canada, $48 in EU and Korea
2040: $31 in Canada, $40 in EU and Korea
2040: $125 in Brazil, China, Russia, S. Africa; $140 in advanced economies

57
Annex 2: Long-Term Outlook Results
Annex 2 Notes: Global Energy Demand (a) IEA primary energy is converted from mtoe per year to mboe/d by multiplying by a factor of 0.0202 mboed/mtoe. Non-OPEC Supply (b) Includes biofules and processing gains. OPEC Crude (c) OPEC crude includes Venezuela extray-heavy oil.
OPEC IEA
Base Year 2040 Ref. Case Base Year
2040 Scenario
New Policies
Current Polices
Sustainable Development
Global Energy Demand (mboe/d) (a) (2015-2040)
276 371.6 275.3 335.1 389.7 284.4
Global Liquids Demand (mb/d) (2016-2040)
95.4 111.1 95.5 109.1 122.1 80.3
Non-OPEC Supply (mb/d) (b) (2016-2040)
57 60.4 56.9 62.4 7.3 48.1
OPEC Crude (mb/d) (c) (2016-2040) 32.7 41.4 31.9 38.9 44.9 26
OPEC NGLs and Other Liquids (mb/d) (2016-2040)
6.1 8.9 7.7 8 11.2 8.8

64
EIGHTH IEA IEF OPEC SYMPOSIUM ON ENERGY OUTLOOKS
International Energy Forum in partnership with Resources for the Future