eileen kwei - conferencesconferences.pionline.com/uploads/conference_admin/945_dcw15_mon_g...for...
TRANSCRIPT

Moderator:Eileen Kwei, Director, Artisan Partners
Speakers:Jeffrey Coons, President, Manning & Napier
Craig Keim, Director, DC Investment Relationship ManagementT. Rowe Price
Stuart Odell, Assistant Treasurer of Retirement Investments, IntelTony Tomich, Head of Pension Investments, Farmers Insurance Group
The Hidden Challenges of Customization

Which of these features are in your DC plan?
1. Open architecture (non-proprietary funds)2. White-labeled funds with 1 underlying manager3. White-labeled funds with multiple underlying managers4. Custom Target Date Fund5. Tiered Investment Menu6. A combination of some of the above7. None of the above
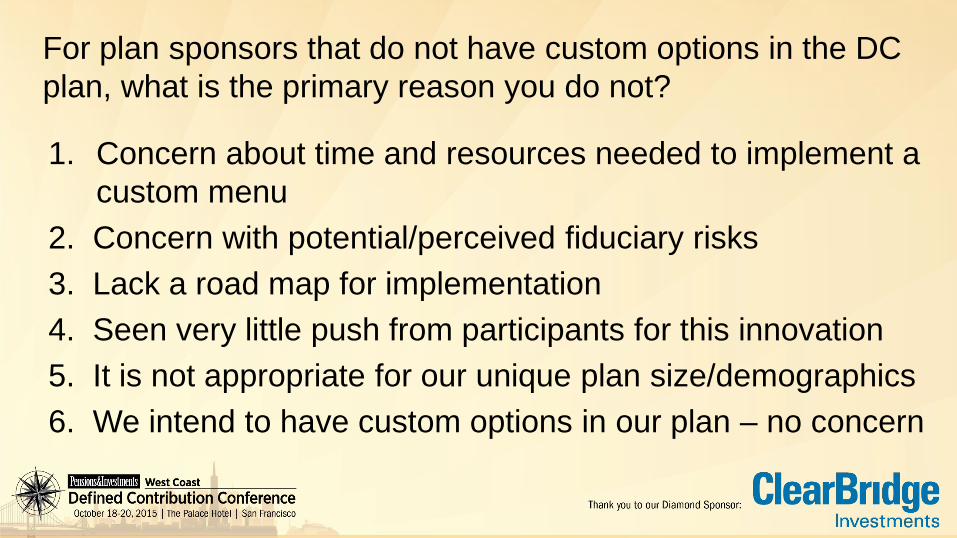
For plan sponsors that do not have custom options in the DC plan, what is the primary reason you do not?
1. Concern about time and resources needed to implement a custom menu
2. Concern with potential/perceived fiduciary risks3. Lack a road map for implementation4. Seen very little push from participants for this innovation5. It is not appropriate for our unique plan size/demographics6. We intend to have custom options in our plan – no concern

Customized DC Options - Benefits• Simplify decision making • Increase participation• Improve diversification• Best in class investment managers• Incorporates plan specific demographics• Cost efficiencies• Flexibility to change managers• Integrate retirement income solutions

Customized DC Options - Considerations• Investments• Fees• Operations/Administration• Participant Communication• Accounting/Audit• Legal/Regulatory • Governance

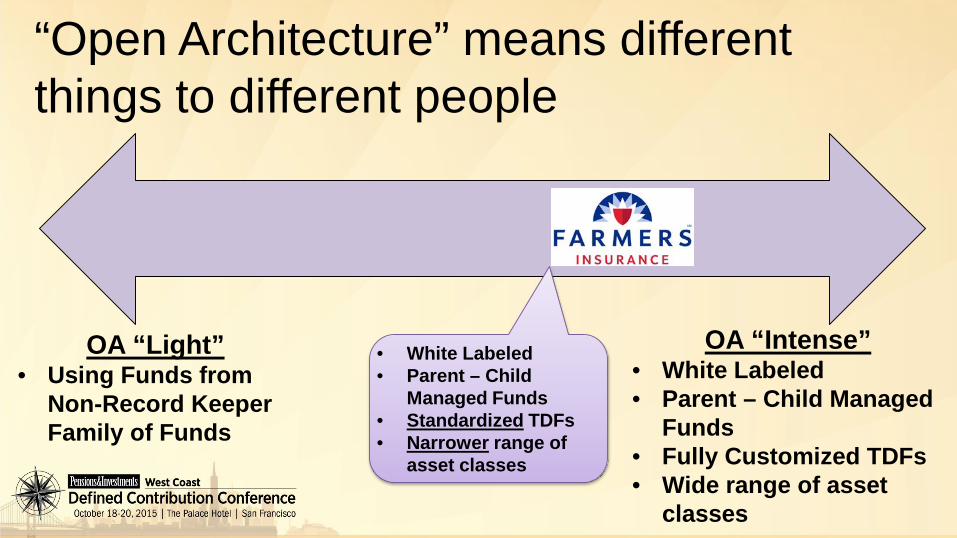
“Open Architecture” means different things to different people
OA “Light”• Using Funds from Non-Record
Keeper Family of Funds
OA “Intense”• White Labeled• Parent – Child Managed Funds• Fully Customized TDFs• Wide range of asset classes
Wide Spectrum of Definitions
“Open Architecture” means different things to different people
OA “Light”• Using Funds from
Non-Record Keeper Family of Funds
OA “Intense”• White Labeled• Parent – Child Managed
Funds• Fully Customized TDFs• Wide range of asset
classes
• White Labeled• Parent – Child
Managed Funds• Standardized TDFs• Narrower range of
asset classes

Farmers’ DC Plan has 4 Tiers & 7 Participant Options
Farmers DC Plan
Tier 1: TDFs
Tier 2: Passive
Farmers Stock Index Fund
Farmers Bond Index Fund
Tier 3: Active
Farmers Active Stock Fund
Farmers Active Bond Fund
Farmers Active Stable Value Fund
Tier 4: Brokerage Window

Plan customization requires a significant amount of work by Sponsor Team
23 Webcast Meetings
735 # of PP Attendees at Webcast meetings
7 # of Pension & Benefit Committee Meetings
55 # of Formal Project Meetings
26 Newly negotiated legal agreements
110 On-Site PP Meetings
1,548 # of PP Attendees at On-site Meetings6 # of Project Steering
Committee Meetings
6# of Conference Calls over the Conversion Weekend
31Pieces of Communication collateral (including a new website and 6 videos)
~26K Plan Participants (“PPs”) converted $2.0B Assets
converted

Lessons LearnedTHOUGHT EVOLUTION LESSONS LEARNED HIDDEN CHALLENGES1. Investigated Cheaper Share
Classes2. Vision of Fully Customized,
Open Architecture structure across DC TDFs, Tier 2 & 3, and Pension
3. Cost Rationalization and Expense Ratio Hurdles
• New Operational Platform requires much more Sponsor commitment and resources than originally estimated
• Bring in outside experts: assistance with thought leadership & Governance
• Document, Document, & then Document some more
• Formal Project Meetings (& Minutes) with all Partners at the same time
• Custom TDF: who does what and how much does that cost?
• Trustee vs Custodian vs Recordkeeper
• Re-enroll vs Fund Mapping?• Define Roles &
Responsibilities of all Partners• Biggest concern for
Governance: Participant Communication
• Fiduciary Risk vs Perceived Fiduciary Risk of Governance
• Many moving pieces at one time

Intel Corporation – U.S. DC Plans
• ~50,000 Participants• $7.5B 401(k) / $6B Profit Sharing (DC)
Plan/DB Floor Offset Plan• Custom Target-Date Funds as 401(k) Default• Multi-Manager White Label Core Options
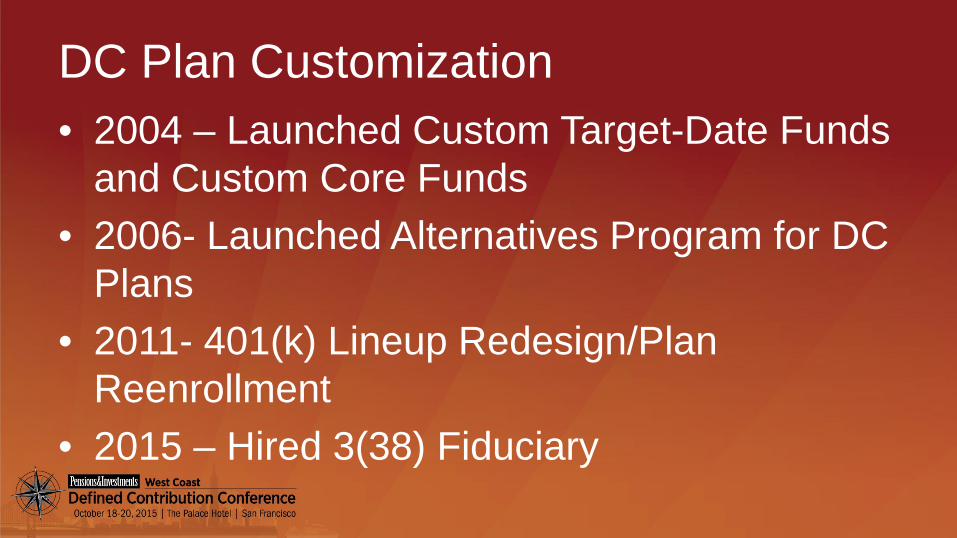
DC Plan Customization• 2004 – Launched Custom Target-Date Funds
and Custom Core Funds• 2006- Launched Alternatives Program for DC
Plans• 2011- 401(k) Lineup Redesign/Plan
Reenrollment• 2015 – Hired 3(38) Fiduciary

Why Did Intel use Customization?
• Flexibility/Control– Glidepath, Asset Classes, Managers
• Access to Institutional/Best in Class Products– Separate accounts/CIT’s– Alternatives (incl private equity, hedge funds)
Lessons Learned from Intel
• Benchmarking/Peer group • Investment Fees/Fee disclosure• Recordkeeper/Custodian• Participant Education/Investment Materials

Spectrum of Investment CustomizationLess Complex More Complex
Downstream Operational Impacts/Considerations
Remove Brand Names Single Manager, generic name by asset class, i.e. “International Equity Fund”
Blended Managers, Single Asset Class Fund of funds within a specific asset class, i.e. combine separate developed and emerging markets options to create “International Equity Fund”
Packaged Asset Classes Create limited number of fund of fund portfolios by asset class or objective, i.e. “Growth Portfolio” comprised of domestic and international equity managers, active and passive
Custom Target Date Create full suite of target dated portfolios using various asset class building block vehicles that follow an allocation glidepath which requires ongoing rebalancing
+Communications Fact Sheets, Websites, Phone Systems, Enrollment Kits & Forms, Statements, 404a Notices
+Performance Does it carry over?
+Custody, Trading and AccountingRecordkeeper or 3rd Party?
+Audit Complexity+Advice Provider Models+Benchmarks+Participant access to 3rd party data
+RebalancingSponsor or 3rd Party?
+Glidepath Design and Monitoring Sponsor or 3rd Party?+ + +

Key Questions to Explore1. What is my goal for customization?
– Lower Costs• Pooling assets from other plans/master trust?• Consider potential additional non-investment costs (consultant, custodian, etc.)
– Streamline lineup for easier participant understanding and usage• Who is the target audience? Tradeoffs for the engaged minority?
– Flexibility and ease of manager changes• More disclosure or less? How frequently?
– Access to asset classes in a controlled structure• Allocate enough to have meaningful impact?
2. How unique actually is my plan/population?– Demographics? Needs? Goals? Behaviors?– How durable is my uniqueness?– How much to optimize?

Key Questions to Explore
3. Do I have the right internal resources? Or willing to outsource?– Required time, expertise and ongoing involvement can be underestimated
4. Have I considered all impacted processes and consulted all involved parties?
– Engage with all partners early on in the design phase– Listen to best practices and multiple viewpoints
C12E1B7NT
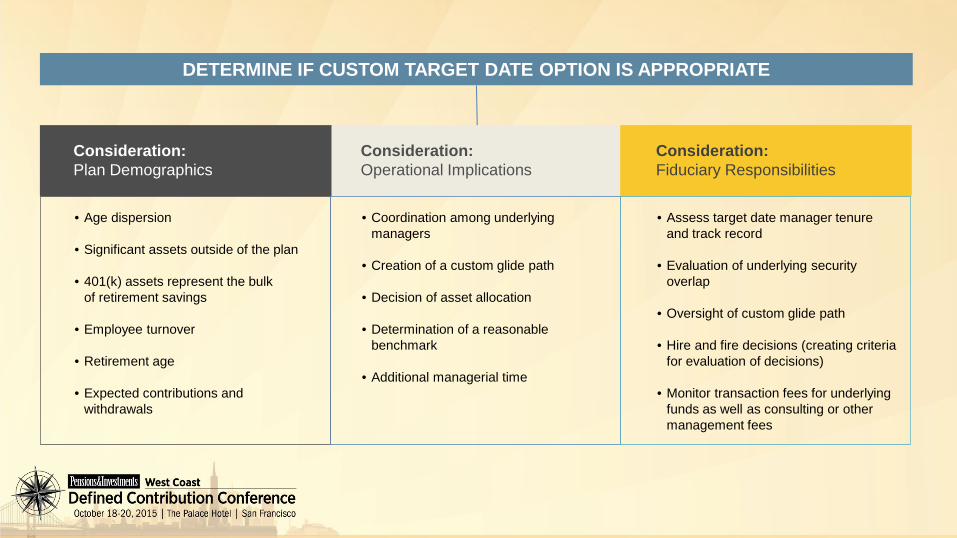
DETERMINE IF CUSTOM TARGET DATE OPTION IS APPROPRIATE
Consideration:Plan Demographics
Consideration:Operational Implications
Consideration:Fiduciary Responsibilities
• Age dispersion
• Significant assets outside of the plan
• 401(k) assets represent the bulk of retirement savings
• Employee turnover
• Retirement age
• Expected contributions and withdrawals
• Assess target date manager tenure and track record
• Evaluation of underlying security overlap
• Oversight of custom glide path
• Hire and fire decisions (creating criteria for evaluation of decisions)
• Monitor transaction fees for underlying funds as well as consulting or other management fees
• Coordination among underlying managers
• Creation of a custom glide path
• Decision of asset allocation
• Determination of a reasonable benchmark
• Additional managerial time

Market Environment
Active vs. Passive
Availability/Vehicles
Recent Performance Results
Brand
Firm/Management Experience
The Custom Decision and Retirement Outcomes
Participant Demographics
Proprietary vs. Best in Class
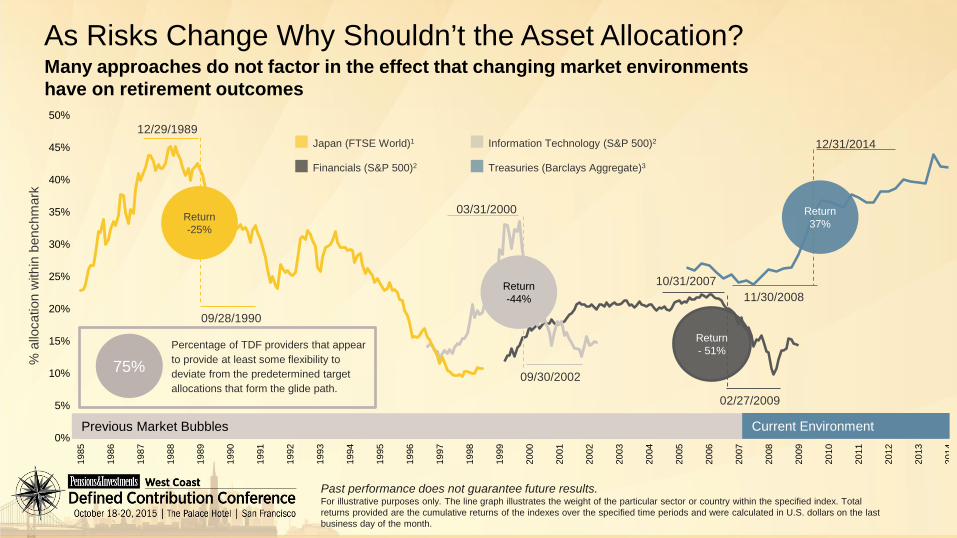
Many approaches do not factor in the effect that changing market environments have on retirement outcomes
As Risks Change Why Shouldn’t the Asset Allocation?
Past performance does not guarantee future results. For illustrative purposes only. The line graph illustrates the weight of the particular sector or country within the specified index. Total returns provided are the cumulative returns of the indexes over the specified time periods and were calculated in U.S. dollars on the last business day of the month.
0%
5%
10%
15%
20%
25%
30%
35%
40%
45%
50%
1985
1986
1987
1988
1989
1990
1991
1992
1993
1994
1995
1996
1997
1998
1999
2000
2001
2002
2003
2004
2005
2006
2007
2008
2009
2010
2011
2012
2013
2014
Return-25%
Return-44%
Japan (FTSE World)1
Financials (S&P 500)2 Treasuries (Barclays Aggregate)3
Information Technology (S&P 500)2
Previous Market Bubbles Current Environment
% a
lloca
tion
with
in b
ench
mar
k
12/29/1989
09/28/1990
03/31/2000
09/30/2002
10/31/2007
02/27/2009
11/30/2008
12/31/2014
Percentage of TDF providers that appear to provide at least some flexibility to deviate from the predetermined target allocations that form the glide path.
75%
Return- 51%
Return37%
-11.02%
-20.56%
17.26% 15.54%
-40.43% -41.39%
20.42% 21.87%
7.24%4.15%
-45%
-40%
-35%
-30%
-25%
-20%
-15%
-10%
-5%
0%
5%
10%
15%
20%
25%
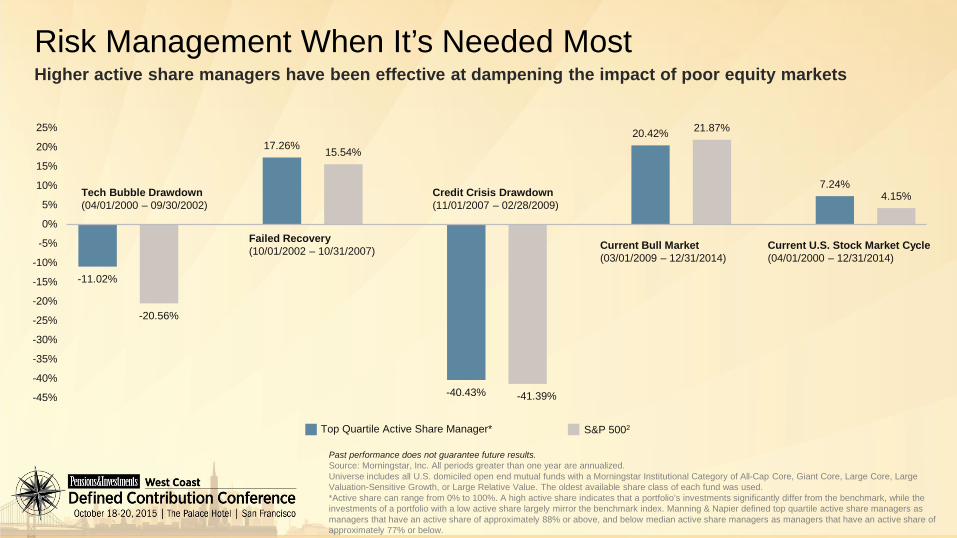
Past performance does not guarantee future results. Source: Morningstar, Inc. All periods greater than one year are annualized.Universe includes all U.S. domiciled open end mutual funds with a Morningstar Institutional Category of All-Cap Core, Giant Core, Large Core, Large Valuation-Sensitive Growth, or Large Relative Value. The oldest available share class of each fund was used.*Active share can range from 0% to 100%. A high active share indicates that a portfolio’s investments significantly differ from the benchmark, while the investments of a portfolio with a low active share largely mirror the benchmark index. Manning & Napier defined top quartile active share managers as managers that have an active share of approximately 88% or above, and below median active share managers as managers that have an active share of approximately 77% or below.
Top Quartile Active Share Manager* S&P 5002
Tech Bubble Drawdown (04/01/2000 – 09/30/2002)
Failed Recovery (10/01/2002 – 10/31/2007)
Credit Crisis Drawdown (11/01/2007 – 02/28/2009)
Current Bull Market(03/01/2009 – 12/31/2014)
Current U.S. Stock Market Cycle (04/01/2000 – 12/31/2014)
Higher active share managers have been effective at dampening the impact of poor equity marketsRisk Management When It’s Needed Most

Dynamic U.S. Equities
Manager
Planning For The Unexpected
Core Menu Options Target-Date Funds
For illustrative purposes only.
Large Cap Stocks
Mid Cap Stocks
Small CapStocks
Implementing meaningful dynamic asset allocation into a DC planChanging or extreme market environments impact both core menu options and target date funds• Allocating a portion of a portfolio to a “dynamic”, risk aware manager can be done via a core/satellite approach• Can work in most broad asset classes (Fixed Income, U.S. Equity, International Equity)• Or via a glide range within a traditional equity glide path
STOCKS
BONDS
DYNAMIC RANGE/MANAGER

DisclosuresManning & Napier Advisors, LLC (Manning & Napier) provides a broad range of investment solutions including mutual funds and collective investment trust funds. For more information about any of the Manning & Napier Fund, Inc. Series, you may obtain a prospectus at www.manning-napier.com or by calling (800) 466-3863. Before investing, carefully consider the objectives, risks, charges and expenses of the investment and read the prospectus carefully as it contains this and other information about the investment company.
Manning & Napier’s target date offerings include mutual funds (Manning & Napier Fund, Inc. Target Series) and affiliate collective investment trust (CIT) funds (Manning & Napier Retirement Target CIT Funds and MANNING & NAPIER GOAL® CIT Funds).
Because target date funds invest in both stocks and bonds, the value of your investment will fluctuate in response to stock market movements and changes in interest rates. Investing in target date funds will also involve a number of other risks, including issuer-specific risk, foreign investment risk, and small-cap/mid-cap risk as the underlying investments change over time. Investments in options and futures, like all derivatives, can be highly volatile and involve risks in addition to the risks of the underlying instrument on which the derivative is based, such as counterparty, correlation and liquidity risk. Also, the use of leverage increases exposure to the market and may magnify potential losses. Additionally, some target date funds invest in other funds and therefore, may have additional risks associated with the underlying funds. Principal value is not guaranteed at any time, including at the target date (the approximate year when an investor plans to stop contributions and start periodic withdrawals).
©2015 Morningstar, Inc. All rights reserved. The information contained herein: (1) is proprietary to Morningstar and/or its content providers; (2) may not be copied, adapted or distributed; and (3) is not warranted to be accurate, complete or timely. Neither Morningstar nor its content providers are responsible for any damages or losses arising from any use of this information, except where such damages or losses cannot be limited or excluded by law in your jurisdiction. Past financial performance is no guarantee of future results.
1The FTSE All-World ex US Index is one of a number of indexes designed to help investors benchmark their international investments. The index comprises Large and Mid cap stocks providing coverage of Developed and Emerging Markets excluding the US. The index is derived from the FTSE Global Equity Index Series (GEIS), which covers 98% of the world’s investable market capitalization. Data provided by FactSet.2The S&P 500 Total Return Index (S&P 500) is an unmanaged, capitalization-weighted measure of 500 widely held common stocks listed on the New York Stock Exchange, American Stock Exchange, and the Over-the-Counter market. The Index returns assume daily reinvestment of dividends and do not reflect any fees or expenses. S&P Dow Jones Indices LLC, a subsidiary of the McGraw Hill Financial, Inc., is the publisher of various index based data products and services and has licensed certain of its products and services for use by Manning & Napier. All such content Copyright © 2015 by S&P Dow Jones Indices LLC and/or its affiliates. All rights reserved. Neither S&P Dow Jones Indices LLC, Dow Jones Trademark Holdings LLC, their affiliates nor their third party licensors make any representation or warranty, express or implied, as to the ability of any index to accurately represent the asset class or market sector that it purports to represent and none of these parties shall have any liability for any errors, omissions, or interruptions of any index or the data included therein. Data provided by FactSet.3The Barclays U.S. Aggregate Bond Index (BAB) is an unmanaged, market-value weighted index of U.S. domestic investment-grade debt issues, including government, corporate, asset-backed, and mortgage-backed securities, with maturities of one year or more. Data provided by Interactive Data and BondEdge.
Manning & Napier Advisors, LLC (Manning & Napier) provides investment advisory services to Exeter Trust Company (ETC), Trustee of the Manning & Napier Collective Investment Trust funds. The Collectives are available only for use within certain qualified employee benefit plans. The Manning & Napier Fund, Inc. is managed by Manning & Napier. Manning & Napier Investor Services, Inc., an affiliate of Manning & Napier and ETC, is the distributor of the Fund shares.
Approved FUNDCIT-INSTL-SEM006 (9/15)

Moderator:Eileen Kwei, Director, Artisan Partners
Speakers:Jeffrey Coons, President, Manning & Napier
Craig Keim, Director, DC Investment Relationship ManagementT. Rowe Price
Stuart Odell, Assistant Treasurer of Retirement Investments, IntelTony Tomich, Head of Pension Investments, Farmers Insurance Group
The Hidden Challenges of Customization