eissn 2231-279x impact factor(gif): 0.376 issn 2249-0280
TRANSCRIPT

Editor-in-Chief
Dr. V. S. More Ex-Dean Dept. of Commerce, University of Pune, Pune Director, Institute of Management & Research, Nasik (India)
Associate Editors
Dr. Saroj Dash Dr. Surendra Sisodia Mr. Abdul Rahman
Assistant Editors Ms. Swati Chauhan Ms. Ashu Bhojwani Managing Editor
Dr. Arif Anjum (India) Frequency :
Quarterly-Four Issues Per Year
Correspondence Address:
Indian Journal of Management Science, S.N.21, P.N.24, Mirza Ghalib Road, Malegaon Nasik, Maharashtra – 423203 (India) Contact: 0919764558895 Email: [email protected] Website: www.scholarshub.net
Impact Factor: The Global Impact Factor (GIF) provides quantitative and qualitative tool for ranking, evaluating and categorizing the journals for academic evaluation and excellence. This factor is used for evaluating the prestige of journals. The evaluation is carried out by Global Impact Factor, Australia. Disclaimer: The views expressed in the journal are those of author(s) and not the publisher or the Editorial Board. The readers are informed, editors or the publisher do not owe any responsibility for any damage or loss to any person for the result of any action taken on the basis of the work. © The articles/papers published in the journal are subject to copyright of the publisher. No part of the publication can be copied or reproduced without the permission of the publisher in any form.
EISSN 2231-279X Impact Factor(GIF): 0.376 ISSN 2249-0280
INDIAN JOURNAL OF
MANAGEMENT SCIENCE
Volume – III Issue – 3 July 2013
Volume I Issue 1 August 2011 EDITORIAL BOARD
Rohaizat bin Baharun Department of Management Faculty of Management Universiti Teknologi Malaysia Yasser Mahfooz, PhD Department of Marketing, College of Business Administration, King Saud University, Riyadh, Saudi Arabia Edhi Juwono Perbanas Economics School for Management Information Systems, Indonesia Dr.Mu.Subrahmanian Professor & Head, Department of Management Studies, Naya Engineering College, Chennai Prof. D. P. Singh Delhi college of engineering, Delhi Dr. Nafis Alam, School of Business, University of Nottingham, Malaysia Michael Sunday Agba, Department of Public Administration, Federal Polytechnic, Nigeria.


INDIAN JOURNAL OF MANAGEMENT SCIENCE (IJMS) EISSN 2231-279X – ISSN 2249-0280
www.scholarshub.net Vol.– III, Issue – 3, July 2013
INDEX
SN TITLE PAGE
NO.
1.
The Application of Effective Coaching Techniques in Designing a Coaching Plan for
Performance Improvement in Graduate Assistants Tracie V. Cooper & Donovan A. McFarlane (UUSSAA)
01-07
2.
A Hybrid Data Mining Approach to Construct the Target Customers Choice
Reference Model Shih-Chih Chen & Ruei-Jr Tzeng (TTaaiiwwaann)
08-15
3.
The Used of it Balanced Scorecard to Build the Performance Measurement Model of
Academic Information Systems (Case Study Academic Information System of Satya
Wacana) Paskah Ika Nugroho, Prihanto Ngesti Basuki & Evi Maria (IInnddoonneessiiaa)
16-22
4. Increasing the Accountability of the Institution through the Whistle Blowing System
Jony Oktavian Haryanto, Yefta Andi Kus Nugroho,
Rizal Edy Halim & Rizal Edwin Manansang (IInnddoonneessiiaa) 23-33
5. Agricultural TFP and R&D Spending in Iran
Solmaz Shamsadini, Saeed Yazdani & Reza Moghaddasi (IIrraann) 34-41
6. Ranking Indian Domestic Banks with Interval Data – The Dea Application
Dr. T. Subramanyam & Dr. R.V.Vardhan (IInnddiiaa) 42-47
7.
The Effects of Financial Reporting Quality on Stock Price Delay & Future Stock
Return Azam Pouryousof, Hilda Shamsadini & Mina Abousaiedi (IIrraann)
48-52
8. Gold Price Movements in India and Global Market
Shaik Saleem, Dr. M. Srinivasa Reddy & Shaik Karim (IInnddiiaa) 53-60
9.
The Kerala Building and other Construction Workers Welfare Fund Board – Social
Impact on Members Dr. Abdul Nasar VP & Dr. Muhammed Basheer Ummathur (IInnddiiaa)
61-70
10. A Study of Socio Economic Condition of Child Labour Engaged in Rag-Picking at
Silchar Shima Das, Dr. Amit Kumar Singh & Bidhu Kanti Das (IInnddiiaa)
71-78
11. Stock Market Anomalies: Empirical Evidence from Weekend Effect on Sectoral
Indices of Indian Stock Market Potharla Srikanth & P. Srilatha (IInnddiiaa)
79-85
12. Internet Banking: Does it Really Impacts Bank’s Operating Performance
Rajni Bhalla (IInnddiiaa)) 86-89

INDIAN JOURNAL OF MANAGEMENT SCIENCE (IJMS) EISSN 2231-279X – ISSN 2249-0280
www.scholarshub.net Vol.– III, Issue – 3, July 2013
1
THE APPLICATION OF EFFECTIVE COACHING TECHNIQUES
IN DESIGNING A COACHING PLAN FOR PERFORMANCE
IMPROVEMENT IN GRADUATE ASSISTANTS
Tracie V. Cooper,
Faculty Support Coordinator
H. Wayne Huizenga School of Business
and Entrepreneurship
Nova Southeastern University,
Fort Lauderdale, Florida, USA
Donovan A. McFarlane,
Adjunct Professor of Marketing,
Nova Southeastern University
Adjunct Professor of Leadership Studies,
Bethune-Cookman University
Adjunct Professor of Business Administration,
Broward College
Visiting Professor of Management,
Keller Graduate School – DeVry University
Professor of Business Administration & Business
Research, Fredrick Taylor University
Faculty Blog Manager, Huizenga School of Business
Director, The Donovan Society, LLC, USA.
ABSTRACT
This paper examines effective coaching techniques that could potentially be incorporated into a coaching
plan to improve the performance of new-start graduate research assistants in an academic school and department at a university. From the perspective of a supervisory or managerial capacity, the authors play
the role of the prospective “Coach” responsible for faculty support, and therefore attempt to meet the
requirements of this office by working collaboratively through and with hired work-study graduate students
who serve as graduate research assistants in an academic department and school at a university. The opportunity for coaching unfolds in the scenario where four new start graduate students from the schools of
business and computer sciences are hired as research assistants in an academic department and must
effectively meet the needs of the faculty in being able to competently perform several tasks related to research. Most of the tasks are already within the ability-scope of these graduate students. However,
blending into their roles as newly hired employees and research assistants to the faculty support coordinator
and professors in this department and school requires developing familiarization with organizational
culture, process protocol, work study portfolio organization and competence in their new roles. This presents an opportunity for coaching using several techniques to address familiarization, competence, and
motivational and work-process issues. Thus, examining the literature on effective coaching and coaching
techniques, the authors in a coaching capacity will develop, design, and implement a Coaching Plan or program to address these competencies and work-needs-skills in this situation based on practical guidelines
or recommendations of previous research. This paper describes this opportunity for effective coaching and
presents relevant literature on coaching techniques and effectiveness, recommends a viable coaching plan and resolution to identify issues, and draws conclusion based on what constitutes success or effectiveness
in real-life situations. Additionally, broader implications for coaching strategies and techniques applied to
real problems, opportunities, or issues in organizational contexts and examined.
Keywords: Coaching, Coaching plan, Coaching Techniques, International Coach Federation (ICF),
Motivation, Performance.

INDIAN JOURNAL OF MANAGEMENT SCIENCE (IJMS) EISSN 2231-279X – ISSN 2249-0280
www.scholarshub.net Vol.– III, Issue – 3, July 2013
2
Introduction:
Coaching is becoming more and more important as a process and performance improvement method and approach in
organizations across all fields. Coaching can be defined as “a process that enables learning and development to occur and thus
performance to improve” (Parsloe, 1999, p.8). Coaching effectiveness is what is important in today’s organizations as coaching
becomes both a corrective process and action to address performance, behavioral, and other issues across organizational
boundaries, and more and more managers attune to the coaching process and its application. According to Parsloe (1999), “To be a successful coach requires a knowledge and understanding of process as well as the variety of styles, skills and techniques
that are appropriate to the context in which the coaching takes place” (p. 8). Managers or supervisors must use effective
coaching techniques that cater to individual and group, as well as organizations needs.
The International Coach Federation [ICF] (2011) defines coaching as “partnering with clients in a thought-provoking and
creative process that inspires them to maximize their personal and professional potential” (p. 1). This definition takes a service-
provision or orientation to coaching, and coaching is in fact based on service-philosophy to individuals and organizations with
the end result being to improve performance and productivity. Coaching is indeed a creative process and it is the responsibility
of the coach to ensure that creative techniques or methods are used to address different coachee needs. Coaching is especially
important in helping new hires or new organizational members to improve their present skills levels as they are coached by
experienced organizational members and managers to perform important tasks effectively and efficiently to meet organizational
goals. While this is the case, most application of coaching seems to be in contexts involving organizational members or employees with significant time onboard, but lingering problems that affect attitude and work morale; hence, performance.
Literature Review:
The performance benefits of coaching are becoming more widely known and accepted and “coaching is [now] seen as having
clear and unique advantages, and is establishing itself alongside related activities, such as mentoring and counselling, as a key
development technique” (Phillips, 1996, p. 29). Coaching in organizational contexts fills several roles and confers several
benefits. According to the International Coach Federation [ICF] (2011) “Individuals who engage in a coaching partnership can
expect to experience fresh perspectives on personal challenges and opportunities, enhanced thinking and decision making skills,
enhanced interpersonal effectiveness, and increased confidence in carrying out their chosen work and life roles” (p. 1). The
benefits gained from coaching depend on how well the coach uses effective techniques that cater to individual skills
development or developing top talent that will serve the organization (Hunt & Weintraub, 2011). The coaching interaction is an important factor in considering coaching techniques as managers need to recognize that employees have a need to express
themselves as they influence organizational policy and decisions without authority.
According to Cohen and Bradford (2005) influence is important in human social interaction, and the coaching process involves
two-way influence, a process where the coach is influencing the coachee to make some form of change, progress, or
improvement; and a process where the coachee without vested managerial authority influences the views, decisions, and
strategies of the coach. Leadership coaching in organizations requires influence, and Wakefield (2006) argues that “Leadership
coaching is a vital tool for developing talent in organizations. Hunt and Weintraub (2011) certainly concur with this view.
Managers and supervisors who facilitate coaching must also recognize that both tasks and relationship are important in coaching
(Hunt & Weintraub, 2005). Thus, important concepts such as trust which functions to achieve influence and cooperation should be
integrated into the approach to coaching, especially where employees or coachees depend on their manager or coach to hone their
skills to maximize their performance and job security. According to Hunt and Weintraub (2005), “good relationships make it easier
to gain cooperation, it pays to be generous and engage in win-win exchanges” (p. 23). Managers and leaders who engage the coaching process to address performance-related individual and organizational opportunities and challenges must build effective
relationships with their employees in order to facilitate progress and get results.
Wakefield (2006) suggests engaging the four P’s that will help employees become more innovative problem solvers during the
coaching process. These four P’s are: (i) partnering for technological collaboration; (ii) possibilities for turning necessity into
opportunity; (iii) perspective by providing opportunity for individuals to broaden their problem-solving skills and experiences;
and (iv) practicing innovation throughout the coaching process and the organization using total quality management (TQM).
Coaching is a social process and the coach must bear in mind that people are the most important of organizational assets.
According to Case and Kleiner (1993), this fact must be recognized before managers can begin coaching their employees
effectively. Case and Kleiner (1993) assert that there are many methods or techniques to facilitate coaching. With this
understanding, they argue that coaching is not a method, but a combination of methods or practices applying different tactics
and strategies that are used to guide employees towards maximizing their potential in organizational work settings. Case and Kleiner (1993) list several techniques that they argue are coaching techniques: rewards, compensation, training, employee
development programs, goal setting, discipline, employee participation, and group participation problem solving.
Megginson and Clutterbuck (2005) describe coaching techniques from a goal-setting orientation. They believe that it is the
responsibility of the coach to help learners find a vision and the path towards achieving that vision. As such, coaching involves
techniques such as identifying, visioning, and motivation and must be effectively coordinated around timing. Megginson and

INDIAN JOURNAL OF MANAGEMENT SCIENCE (IJMS) EISSN 2231-279X – ISSN 2249-0280
www.scholarshub.net Vol.– III, Issue – 3, July 2013
3
Clutterbuck (2005) believe that effective coaching involves the ability to influence employees who are able to identify
individuals who have been “helpful” in their career and have influenced them in ways which contribute to success or
performing successfully in their organizational roles. The process of visioning as a technique in coaching can be used in many
situations, and is especially powerful in goal-setting. According to Megginson and Clutterbuck (2005), the core of effective visioning is engaging all the learner’s senses and inner emotion. This inner emotion affects the individual coachee’s perceptions
and attitudes toward the coaching process. Visioning involves a process of visualization that asks questions such as: (a) where
do you want to be? (b) what do you see around you in terms of the environment and people? (c) how do you appear? (d) what
are you doing and why? and (e) how do you feel and why do you feel this way? Among other questions that attune the coachee
to the present situation, the need for change, and the goal or vision of what he or she wants to accomplish from the coaching
relationship or training are important.
Megginson and Clutterbuck (2005) believe that “Visioning is best used when the learner is relatively relaxed” (p. 12), and that
the technique requires the coach to engage the coachee to focus his or her whole consciousness into placing the self in a
possible future. This stands to reason, as coaching for performance improvement involves developing talent in the organization
to a certain optimum or to meet certain standards. Individuals and groups must be able to display certain levels of performance,
attitudes, work morale and skills to effectively increase productivity and organizational competitiveness. Therefore, the coach
must use this technique to foster a sense of potential and demonstrate to the coachee the ability to develop and apply the skills to reach that potential in a reasonable time frame. Organizational rewards and compensation can be used as techniques that
supplement this process, and Case and Kleiner (1993) argue that these not only serve in the roles of feedback, but as motivators
since “everyone in an organization gives of his or her abilities and efforts in exchange for rewards given by the organization”
(p. 8). Thus, rewarding and compensating; the manner in which these are done as performance-based indices, can significantly
contribute to overall coaching effectiveness and success.
In coaching individuals to improve their performance in the work setting, coaches must focus on building those defined set of
business or work-related skills that will affect individuals’ abilities to work independently, as well as part of teams and groups
(Butler, Forbes, & Johnson, 2008). As Case and Kleiner (1993) note, there are many methods or techniques of effective
coaching available to managers, but managers must be able to choose the best methods or techniques suited for particular
employees or subordinates. This requires remembering that people are individuals. Case and Kleiner (1993) argue that
coaching methods or techniques used must be refined or should be “changed in the event of continued poor morale and performance to ensure that resources are not merely being wasted” (p. 10).
Contemporary techniques in coaching are being developed across various organizations by managers and leaders to address
individual and organization specific performance and challenges. This includes the increasing use of the telephone to facilitate
coaching. According to Gaskell (2006) and Sparrow (2006), as confidence and expertise grow in coaching as a development
intervention, the telephone option is being increasingly used as a viable alternative to face-to-face meeting for coaching.
Gaskell (2006) argues that telephone coaching is catching on because it is convenient and less expensive. Managers are
increasingly conducting one-to-one coaching over the telephone and are getting significant results. This means that telephone
coaching is becoming more and more popular, and there are different companies and individuals using this technique. Sparrow
(2006) shows how telephone coaching forms the basis of account manager development programs at Elizabeth Arden, cosmetic
giant company. According to Sparrow (2006), telephone coaching has been successfully used by this company’s managers to
deal with professional and personal tensions in an effective manner. Telephone coaching holds good promise as a technique because of its cost-saving advantage, flexibility and convenience as
managers can be in different locations while providing instructions to employees as to performance on various issues.
According to Gaskell (2006) “Telephone coaching can work because there is something powerful about the voice entering the
mind of the coachee more directly” (p. 24). The coach on the other side of the line must however be a very good communicator
since the absence of face-to-face interaction sometimes creates communication problems in similar scenarios. The use of
telephone coaching also gives consideration to other coaching techniques making use of different technologies including the
computer, videos, and other forms of applied communication techniques.
Coaching is a highly dynamic process whose techniques depends on the coaching scenario and needs of the coachee and
organization, the expertise and creativity of the coach, and the duration of the coaching and level of knowledge required. Other
factors also come into play as well. Coaching can be applied at different levels within an organization, and coaching for
leadership succession is becoming an importantly recognized need in large corporations and businesses. Whatever the coaching
purpose or the techniques used, the coach must bear in mind that he or she is dealing with individuals and that individuals are unique and require different levels of training, communication, and assistance to improve their professional and personal skills.
Coaching involves influence and managers or supervisors responsible for coaching subordinates must develop the ability to
influence. This requires having technical expertise, excellent interpersonal and communication skills, and the understanding
that coaching does not mean control, but is a process of facilitating progress and opportunities for self-improvement. Coaching
requires setting clear goals, having objectives, developing an action plan, drafting a project schedule, giving employees
direction, giving reinforcement, keeping employees informed, resolving conflicts, delegating power, and promoting risk taking
where such has far more benefits than costs in the performance and personal improvement process (Case & Kleiner, 1993; see

INDIAN JOURNAL OF MANAGEMENT SCIENCE (IJMS) EISSN 2231-279X – ISSN 2249-0280
www.scholarshub.net Vol.– III, Issue – 3, July 2013
4
Appendix 1: Steps in Effective Coaching Plan).
Methodology:
This article examines effective coaching techniques that could potentially be incorporated into a coaching plan to improve the
performance of new-start graduate research assistants in an academic school and department at a university. Four new-start graduate students from the schools of business and computer sciences were hired as research assistants in an academic
department and school of a university to effectively meet the needs of the faculty in being able to competently perform several
tasks related to research. From the perspective of a supervisory or managerial capacity, the authors play the role of the
prospective “Coach” responsible for faculty support, and therefore attempt to meet the requirements of this office by working
collaboratively through and with hired work-study graduate students who serve as graduate research assistants in an academic
department and school at a university.
The opportunity for coaching unfolds in the scenario where four new start graduate students from the schools of business and
computer sciences are hired as research assistants in an academic department and must effectively meet the needs of the faculty
in being able to competently perform several tasks related to research. Most of the tasks are already within the ability-scope of
these graduate students. However, blending into their roles as newly hired employees and research assistants to the faculty
support coordinator and professors in this department and school requires developing familiarization with organizational culture, process protocol, work study portfolio organization and competence in their new roles. This presents an opportunity for
coaching using several techniques to address familiarization, competence, and motivational and work-process issues. Thus,
examining the literature on effective coaching and coaching techniques, the authors in a coaching capacity will develop, design,
and implement a Coaching Plan or program to address these competencies and work-needs-skills in this situation based on
practical guidelines or recommendations of previous research. This article describes this opportunity for effective coaching and
presents relevant literature on coaching techniques and effectiveness, recommends a viable coaching plan and resolution to
identify issues, and draws conclusion based on what constitutes success or effectiveness in real-life situations. Additionally,
broader implications for coaching strategies and techniques applied to real problems, opportunities, or issues in organizational
contexts and examined.
The Coaching Opportunity:
Four new-start graduate students from the schools of business and computer sciences were hired as research assistants in an
academic department and school of a university to effectively meet the needs of the faculty in being able to competently
perform several tasks related to research. Most of the tasks are already within the ability-scope of these graduate students.
However, blending into their roles as newly hired employees and research assistants to the faculty support coordinator and
professors in this department and school requires developing familiarization with organizational culture, process protocol, work
study portfolio organization and competence in their new roles. The job performance of graduate assistants requires them to be
competent in performing the basic functions in described Table 1 below.
Table 1: Graduate Assistant General Job Description
Source: CareerPlanner.com, (2011).
Different skills set and competence levels will require assistance in meeting some of the assigned tasks given to graduate
assistants by professors and faculty support coordinator. Generally, faculty support coordinators are responsible for training or
coaching graduate assistants in meeting their job roles and in becoming familiar with different aspects of their jobs related to
organizational culture and the tools and equipment they will use to meet their job roles. The need for proficiency in these areas
(Table 1) and becoming part of the organizational culture provide opportunities for coaching and the development of coaching
relationships. The coaching opportunities from graduate assistant jobs allow coaches not only to develop their own coaching
skills, but to coach these graduate assistants who may become future faculty support coordinators or faculty support trainers
and managers. Thus, the benefits can be seen immediately in performance as well as, as an investment in organizational future. This coaching opportunity with graduate assistants provides for application of coaching skills and techniques on several levels.
The Coaching Plan:
The proposed Coaching Plan to address the opportunity of training these four graduate assistants to function at their maximum
and in an effective capacity will be based on “Solution-Focused Coaching”, which involves using a variety of techniques
Assists department chairperson, faculty members or other professional staff members in college or university, by performing any combination of following duties: Assists in library, develops teaching
materials, such as syllabi and visual aids, assists in laboratory or field research, prepares and gives
examinations, assists in student conferences, grades examinations and papers, and teaches lower-
level courses. May be designated by duties performed, or equipment operated.

INDIAN JOURNAL OF MANAGEMENT SCIENCE (IJMS) EISSN 2231-279X – ISSN 2249-0280
www.scholarshub.net Vol.– III, Issue – 3, July 2013
5
described above to facilitate their skills and abilities in effectively performing their job functions and assigned tasks. The
dominant techniques that that will be used include telephone coaching, rewarding and compensation, and what could be called
instructional-face-to-face coaching. A combination of techniques will be used according to the specific needs of these
individuals and their levels of skills. It is reasonable to assume that some of these graduate assistants will have differing skills in terms of job-specific required competences and that their learning levels and communication skills might require unique
consideration in the application of coaching techniques. However, based on experience and the nature of their job functions,
instructional face-to-face coaching and telephone coaching are the core coaching techniques that will serve best to meet
coaching goals in both physical and virtual environments.
Instructional face-to-face coaching will probably be the most dominant techniques since the graduate assistants will mainly
need hands-on or technical skills to function in their current roles. For example, these graduate assistants must know how to
construct PowerPoint presentations, photocopy papers, scan and attached papers in emails, fax papers, use the Scantron, access
electronic databases for research and retrieval of articles and data, format papers for professional presentation and publication,
compile materials and folders for specific courses according to professors’ request, and perform other related academic
functions which may require the use of programs not limited to Excel, Access, and other functions in Microsoft Office, and
even use statistical software such as SPSS and PSPP.
Instructional face-to-face coaching will be a daily on-the-job process where the faculty support coordinator or other qualified and immediate supervisors in the department, including professors can coach graduate research assistants to improve their
current skills set and competences to meet their job requirements. This also provides opportunity to build lasting influence
relationships as these graduate assistants go on to further their education and even become faculty or future administrators.
Telephone coaching where the faculty support coordinator can provide instructions to graduate assistants in performing certain
job functions is an effective technique where face-to-face consultation is not an option. For example, at any specific time where
a faculty support manager or coordinator or supervisor over the graduate assistant is not present in the immediate office and a
graduate assistant needs direction in performing a task, for example scanning a document to email, a simple phone instructional
session could facilitate this. This also applies to more complex tasks which the graduate assistant might not be familiar with.
With experience and knowledge about all the required tasks and functions a graduate assistant may be asked to perform, an
experienced and knowledgeable faculty support manager or coordinator or graduate assistant supervisor can provide effective
telephone coaching that improves graduate assistants’ skills and performance almost immediately or over a very short period of time. Thus, as Sparrow (2006) demonstrates, telephone coaching is extremely useful in the coaching process.
Coaching Plan Resolution:
The above coaching techniques described in the literature review are designed to provide quick solutions with immediate
results, and in such an organizational setting and work situation, coaching is an applied-results oriented process where the
coachee immediately puts into practices those skills communicated or demonstrated by the coach, and this, mainly through an
instructional coaching approach. The overall coaching plan for responding to the coaching opportunity in this paper could be
described as a “Solution-Focused Coaching” because of the need for practical and applied performance skills by the coachees
to perform their jobs functions as graduate assistants.
Facilitating performance development and training through coaching requires understanding impacting variables of time,
responsibility, performance requirements on the part of coach and coachees, the level of skills training and assistance required, and the available and appropriate coaching techniques that will produce the best results from both human relations and
scientific viewpoints. Using the coaching plan described above, the coach should consider keeping the coaching brief and
solution-based (Wakefield, 2006). This does not only save organizational time as a valuable resource, but also will ensure that
both coach and coachee stay motivated and have a realistic time frame in which to bring the performance coaching session to
its close.
Effective and brief solution-focused coaching helps people to tap into their own resources to deal effectively with challenges by
making positive changes that can lead to success both personally and for their organizations (Wakefield, 2006). Furthermore, it
is based on finding solutions and this alone allows for the coach to focus specifically on resolving or addressing specific
problems and challenges rather than engaging in “umbrella coaching”. The aim of coaching in the case opportunity presented
in this paper requires applying specific techniques that address specific problem-solving issues and task necessitation. For
example, graduate assistants must conduct research and know how to identify and retrieve academic peer review articles from electronic databases. While most students at the graduate level would have some knowledge of this, fostering maximum skills
development in this task requires the coach to teach by demonstration; that is, showing and doing the required task as an
example. This will also provide opportunity for fostering further required competences such as compiling bibliographic lists
through the citation function, using exporting and importing functions, and other functions in electronic database for search and
retrieval during assigned research.
Given the functional responsibilities of graduate assistants as support to the faculty in research and other academic tasks, and
their current levels of skills, the types of coaching techniques that should be used should allow for practice and independence.
These students being in graduate schools would not require extensive training in performing academic functions. Thus,

INDIAN JOURNAL OF MANAGEMENT SCIENCE (IJMS) EISSN 2231-279X – ISSN 2249-0280
www.scholarshub.net Vol.– III, Issue – 3, July 2013
6
instructional face-to-face coaching and occasional telephone coaching are the best and most applicable techniques. Additionally,
graduate assistants tend to develop many research and technical skills on their own through troubles-shooting and applying
problem solving techniques from their programs of study. Furthermore, through observation and mentorship, they will grow
into their roles naturally. Using telephone and instructional face-to-face coaching provides for communication and interaction and the appropriate levels of relationship that will foster the development of self and performance improvement. Telephone
coaching will also provide for a significant degree of independence, which is a major competence that faculty and
administrators in colleges and universities search for in students as potential graduate assistants.
Summary & Conclusion:
Coaching can represent a great opportunity for facilitating and fostering change through communication and interpersonal
interaction. Coaching as an effective work-motivation and performance enhancing process has been increasingly applied to
various organizations at different levels and in all kinds of industries. The benefits of coaching can be tremendous in terms of
its ability to boost worker morale, motivation, increase job performance and skills levels, and reduce employee turnover. When
coaching is effectively applied to address deficiencies in an organizational setting it not only serves as a diagnostic, curative,
and preventative approach to workplace problems and their consequences, but also adds value to human and capital resources. Coaching graduate assistants certainly requires having a good knowledge and understanding of the coaching process and
various techniques because of their levels of education, the special nature of their job requirements and responsibilities, and the
fact that they are working in academic environments where they are perhaps very familiar with coaching and already have
trainable skills sets required for their job roles. The different coaching techniques presented in this paper can be used at
different points to address specific coaching situations and individual needs. However, telephone coaching and face-to-face
instructional coaching techniques are ideal in meeting the coaching needs of graduate assistants and can facilitate the building
of relationships and performance improvement with convenience and effectiveness. The coach must remember that these
individuals have varying skills and needs and must develop a coaching plan with clear goals, objectives, and a reasonable time-
frame in which coachees acquire skills. Most importantly, they must provide clear directions and reinforcement and delegate
power to graduate assistants to foster independent problem solving and decision making skills.
Recommendations:
Before developing a coaching plan to address what is perceived to be performance related problems, the prospective coach
must first engage in several activities. These activities will serve both as diagnostic and assessment indicators that allow the
coach to gauge the levels of communication, interaction, develop appropriate coaching plan, and apply the most effective
techniques for success from an understanding of coachee needs, standards, and organizational goals. Thus, it is recommended
that the prospective coach develop an agenda which has the following components and plan of action:
1. An assessment of present skills sets and needs of the prospective coachee.
2. Clear understanding of what is important in a coaching relationship.
3. Develop trust that will build the relationship required for successful coaching.
4. Identify the coachee’s weaknesses and strengths, as well as the critical skills set needed to address existing performance gap.
5. Establish a clear and controlled objective for coaching and the coaching process. 6. Apply those techniques with the highest potential for instilling desired change and improvement.
7. Develop an effective plan for coaching that has assessment standards and procedures, as well as a clear time frame.
8. Make feedback and communication continuous; and most importantly,
9. Foster independence throughout the coaching process since the aim is to equip the individual for autonomous self-growth.
Coaching is an effective tool for performance improvement and the techniques available are diverse, and their successful
application will depend on the scenario, coachee readiness, the skills of the coach and a variety of internal and external
individual and organizational factors.
References:
[1] Butler, D., Forbes, B., & Johnson, L. (2008). An examination of a skills-based leadership coaching course in an MBA
program. Journal of Education for Business, Marc/April 2008, pp. 227-232; Taylor & Francis Inc. Retrieved from http://search.proquest.com/docview/202821891?accountid=14129
[2] CareerPlanner.com. (2011). Graduate Assistant: Job Description and Jobs. Retrieved from
http://www.careerplanner.com/DOT-Job-Descriptions/GRADUATE-ASSISTANT.cfm
[3] Case, T., & Kleiner, B.H. (1993). Effective coaching of organizational employees. International Journal of Productivity
and Performance Management, May/Jun 1993; 42, 3, pp. 7-10. Emerald Group Publishing, Limited. Retrieved from
http://search.proquest.com/docview/218430873?accountid=14129
[4] Cohen, A.R., & Bradford, D.L. (2005). Influence without authority, Second edition. Hoboken, NJ: John Wiley & Sons, Inc.
[5] Gaskell, C. (2006). Hello, how are you? It’s your coach calling. Training & Coaching Today, April 2006, p. 24. Reed

INDIAN JOURNAL OF MANAGEMENT SCIENCE (IJMS) EISSN 2231-279X – ISSN 2249-0280
www.scholarshub.net Vol.– III, Issue – 3, July 2013
7
Business Information UK. Retrieved from http://search.proquest.com/docview/231093282?accountid=14129
[6] Hunt, J.M., & Weintraub, J.R. (2011). The coaching manager: Developing top talent business, 2nd edition. Thousand
Oaks, CA: SAGES Publications, Inc.
[7] International Coach Federation [ICF]. (2011). About Coaching. Lexington, KY: International Coach Federation. Retrieved from http://www.coachfederation.org/intcoachingweek/about-coaching/
[8] Parsloe, E. (1999). The Manager as Coach and Mentor. London, England: Chartered Institute of Personnel &
Development.
[9] Phillips, R. (1996). Coaching for higher performance. Journal of Workplace Learning, Vol. 8 Iss: 4, pp.29 – 32.
[10] Megginson, D., & Clutterbuck, D. (2005). Goal-seekers. Training & Coaching Today, September 2005, p. 12. Reed
Business Information UK. Retrieved from http://search.proquest.com/docview/231098307?accountid=14129
[11] Sparrow, S. (2006). Case Study. Training & Coaching Today, April 2006, p. 24. Reed Business Information UK.
Retrieved from http://search.proquest.com/docview/231093282?accountid=14129
[12] Wakefield, M. (2006). New views on leadership coaching. The Journal for Quality and Participation, Summer 2006, 29,
2 pp. 9-12. Association for Quality and Participation. Retrieved from
http://search.proquest.com/docview/219091474?accountid=14129
Appendix 1: Steps in Coaching Plan
*Set clear goals. It is essential that every employee knows what the project goal is. A good job cannot be done if the goal is not
clear. This requires good communication between the manager and his subordinates. The goal must be very specific and to do
this it must be measurable.
* Have objectives. Objectives must be created for every employee or group involved in a project. This breaks down the goals
into precise duties for each group or individual employee. Employees are more able to recognize their contributions towards
the goal when objectives are set. Objectives also serve as daily reminders of what is to be accomplished
* Develop an action plan. Action plans detail what is to be done and also monitor progress towards project completion. An
action plan should consist of checkpoints, activities, relationships and time. Checkpoints monitor progress towards completion.
Short-term checkpoints establish frequent feedback methods. More importantly, checkpoints help employees to monitor their own progress. Activities are the methods used from one checkpoint to the next. Highly detailed activities will save time in the
long run. Relationships imply the sequence of activities. Some activities may be done simultaneously. Sequencing requires
careful consideration. Finally, the time of project from start to finish must be estimated. This requires accurate estimates of
activity time.
* Draft a project schedule. The two most common methods of scheduling used are the Gantt Chart and the PERT Chart. Both
are disciplines of management science.
* Give employees direction. Managers cannot do large projects by themselves. Therefore they require a team of supporters and
collaborators. Developing a support group takes skill and an understanding of the perspective of others. Managers must be
open-minded and need to realize that people are alike and all have like needs. Employees must be treated as individuals in
order to be motivated.
* Give reinforcement. Allow people to volunteer for work. People who sign up do not need to be coerced to work. Give people opportunities to develop goals and objectives. This will build commitment to their work. Give encouragement to employees.
People like to be noticed and appreciated. so managers should not hesitate to give an “attaboy”.
* Keep them informed. Effective communication is required to keep employees informed. Some organizational structures can
be a barrier to good communication. This can create ambiguity, which will result in faulty information dispersal. People should
be regularly informed and this requires monitoring and feedback. Managers must also learn to be better listeners. Keeping
employees informed of progress will reduce anxiety and increase performance.
* Resolve conflicts. Disagreements between groups or individuals are unavoidable, since projects require the integration of
work from many people. Conflict is actually desirable, when it is used as a way of unleashing creativity and imagination.
Reasoning and logic must be used to resolve conflicts. Managers must gain acceptance by providing sound rationale for their
positions.
* Delegate power. Giving employees power encourages them to put in their best effort, ability and initiative. When managers share power, people at all levels feel that they contribute greatly towards reaching the previously set goals and objectives.
Managers must also be honest and competent as well as give direction and inspiration.
* Promote risk taking. Organizations should stress the rewards of success rather than the consequences of failure. Time should be allowed
for experimentation and creativity. Innovation requires support and should be enhanced by communication and open exchange of ideas.
Source: Thomas J. Case & Brian H. Kleiner. (1993). “Effective coaching of organizational employees” in International
Journal of Productivity and Performance Management, pp. 7-8.
****

INDIAN JOURNAL OF MANAGEMENT SCIENCE (IJMS) EISSN 2231-279X – ISSN 2249-0280
www.scholarshub.net Vol.– III, Issue – 3, July 2013
8
A HYBRID DATA MINING APPROACH TO CONSTRUCT THE
TARGET CUSTOMERS CHOICE REFERENCE MODEL
Shih-Chih Chen,
Assistant Professor
Department of Accounting Information
Southern Taiwan University of Science and
Technology, Taiwan
Ruei-Jr Tzeng,
Department of Information Management
Tatung University, Taiwan
ABSTRACT
Marketing, the prevailing commercial activity of enterprises, is an important strategy to increase
customer loyalty and potential customer for more profit. To maximize profit with limited resources, it would be more profitable for enterprises to choose the right target customers. Therefore, it is necessary
to build up an efficient, objective and accurate target customer choice model. Using data mining
techniques to find the target customers is a traditional way. However, most studies in the past mainly focused on finding the high accuracy classifier, but different classifiers perform differently in varied
situations. So this study is to propose a target customer choice model by integrating support vector
machine, neural network and K-Means algorithm into a two-phase analysis methodology. The research results indicate that the integrated methodology is effective in simultaneously enhancing classification
accuracy and reducing Type I and Type II errors.
Keywords: Data Mining, Support Vector Machine, Neural Network, K-Means.

INDIAN JOURNAL OF MANAGEMENT SCIENCE (IJMS) EISSN 2231-279X – ISSN 2249-0280
www.scholarshub.net Vol.– III, Issue – 3, July 2013
9
Introduction:
With the business environmental change and increasingly fierce competition, the enterprise must face how to
improve the interests of business and make enterprise more competitive. The previous mass marketing is already
out of date, now enterprise must to search niche market and create the merchandise that fit it. Peppers (1999) mentioned that one-to-one economic system will become mainstream in the future, this economic model emphasize
the customized production and one-to-one marketing. Therefore, for the future changes, quickly and accurately to
find the target customers, maximize the interests of marketing with limited resources is important.
In the past, find target customer always using the different classifiers to improve classification accuracy, but don’t consider the classification error. For instance, when a customer wanted to buy products, but the classifier
misjudgment him, this produces Type I error. When a customer didn’t want to buy products, but the classifier
misjudgment him, this generates Type II error. This study proposes a two-stage target customers choice model to upgrade classification accuracy and reducing statistical Type I and Type II error. So this study proposed a two-stage
data mining methodology. First, we separately compute the accuracy with support vector machine and neural
network. Second, by using K-Means algorithm to re-classification target customers, we can upgrade the classification accuracy and reduce Type I and Type II error results.
Literature Review:
Data Mining:
The principle of data mining is to find useful information or knowledge from the data, it’s also known as data archeology, data model analysis. Technology Review (2001) awarded data mining is one of the ten emerging
technologies that affect human life in the 21st century, this shows the importance of data mining. Fayyad et al.
(1996) defined data mining is a process that using automatic or semi-automatic methods to analyze large amounts of data. The research (Scott, 2006) that should take advantage of information technology systems, make all users
can depend on their needs to find really useful information rather than search for useless message.
In the analysis of data mining functions, Berry & Linoff (1997) proposed six analysis functions, this is a brief
description of the various analysis functions: (1) Classification: Without first giving the characteristics of each category and clearly defined, and then through
the prepared training data to build a model, Let yet classified data to be classified in each category.
(2) Algorithm: Let the high homogeneous data be clustered in the same group, the principle is that the same group has high homogeneity and between the different group has highly heterogeneous.
(3) Prediction: Speculate value may be incurred in the future or the future trend.
(4) Estimation: To deal with the continuity value, according the existing continuity value to estimate the unknown continuity data. (5) Affinity Grouping: To explore an event or data will appear in a same time, this is used to generate association rules.
(6) Description and Visualization: At different angles or different levels to describe complex data, help to make decisions.
Support Vector Machine:
Support vector machine is a machine learning technique that based on statistical learning theory and follow the structural risk minimization principle, now widely used in classification problems. Vapnik (1995) proposed SVM,
this is the principle of support vector machine, letting the independent variables and the dependent variable from
the original nonlinear corresponding relationship elevated to the high dimensional vector space, and looking for a hyperplane to separate the data into two class in this vector space, making distance between the two class farthest in
feature space to achieve the best classification results.
Since support vector machine has performed very well in classification problems, it is widely used in document
classification (Joachims, 1998), image recognition (Pontil & Verri, 1998) and biological technology (Yu et al., 2003). The advantages of support vector machine is good summarized ability and training speed, and the SVM's
architecture is based on solving a binary programming problem, it can make up for local extreme problem in neural
network, therefore, the study will use support vector machine with neural network to analyze.
Neural Network:
Neural network theory originated in the 1950s, by the 1980s, Hopfield proposed neural network, by this time, expert
system encountered a bottleneck, neural network has gradually taken seriously. neural network simulated biological

INDIAN JOURNAL OF MANAGEMENT SCIENCE (IJMS) EISSN 2231-279X – ISSN 2249-0280
www.scholarshub.net Vol.– III, Issue – 3, July 2013
10
nervous system to build a simplified neural system mode, using parallel computing that similar to human brain and
self-learning ability, and making system can be accumulated experience through repeated training to achieve the
learning effect. Until today, neural network still has new architecture and theories been proposed, because operational speed of computer is more quickly, making neural network more powerful and more widely used.
Research on neural network developed rapidly in recent years, application fields include industrial management,
biology, medicine, business and credit Scoring (Stern, 1996; Vellido & Vaughan, 1999; Zhang & Hu, 1998), neural network is very suitable for classify and predict because it can self-organizing, self-learning and generalization.
K-Means Algorithm:
K-Means algorithm was first proposed by James MacQueen in 1967. The k-means approach to algorithm performs
an iterative alternating fitting process to from the number of specified clusters. It is one of the simplest unsupervised learning algorithms. With the advantage of good efficiency and simple concept, K-Means algorithm is
widely used in various types of data mining and statistical analysis software.
K-Means algorithm is often applied in a variety of researches such as document algorithm (He et al., 2003), data watermarking (Zhang et al., 2001), and graphic retrieval (Kanungo et al., 2000). In multivariate perspective, if the
attribute of the real world be abstracted into a vector, it will be able to be calculated by K-Means algorithm. A
variety of studies use K-Means algorithm as the analytical tool because of its abstract application.
Research Methodology:
The purpose of this research is to enhance the accuracy when choosing target customers, and meanwhile reduce
misspecification rate (including type I and type II errors) when classifying. To achieve the goal, a two-phase target
customer choice model is proposed. First of all, we classify the customer data as control group and tested group, and then step into the first phase. Input the data of control group into neural network and support vector machines
class models. Run the models and calculate the class accuracy. Compare the results of neural network and support
vector machines, if the results are identical, it will be the finale result whether consists with the original data or not,
else we will step into second phase to analyze data by using K-Means algorithm. The second phase purposes to cluster the unclassified data by using K-Means algorithm. We divide the customer
data into two clusters, including good customer cluster and bad customer cluster. Then calculate the distance
between the unclassified data and the cluster centers of two clusters by using K-Means algorithm. In this research, we define the distance between the unclassified data and the cluster center of the good customer cluster as VG
(value of distance from cluster (good)’s center to data), and the distance between the unclassified data and the
cluster center of the bad customer cluster as VB (value of distance from cluster (bad)’s center to data). When VG<VB, the data has higher similarity with the good customer cluster, and be clustered to the target customer
cluster; otherwise be clustered to un-target customer cluster. Finally, we pour the consistent result from the first
phase output and the re-judgment result form the second phase back to the customer data. We calculate the accuracy
by support vector machine and neural network again, and observe the effectiveness. The process architecture shows in Figure 3.1.
Fig. 3.1: Target customer choice model
In this study, we use IBM SPSS Modeler, which is a popular data mining tool in recent years, in the windows environment. SPSS Modeler was originally named SPSS Clementine (PASW Modeler), and was since acquired by

INDIAN JOURNAL OF MANAGEMENT SCIENCE (IJMS) EISSN 2231-279X – ISSN 2249-0280
www.scholarshub.net Vol.– III, Issue – 3, July 2013
11
IBM in 2009. Today, we call the new version modeler as IBM SPSS Modeler in which was renamed by IBM in
2010. We choose SPSS Modeler as the data mining tool, because it products directly help improve business
processes in many real-life cases. For example, Cablecom GmbH, is the largest cable network operator in Switzerland. By using SPSS Predictive Analytics, Cablecom has continuously seen customer churn rates decrease
from 19 percent to 2 percent. In another case, through the use of SPSS Modeler, Dutch insurance
firm FBTO Verzekeringen, has also increased conversion rates by 40 percent and decreased its direct mailing costs by 35 percent. Base on the effect of the real-life cases, in this study, we attempted to use SPSS Modeler as a data
analyzing and model building platform.
The first phase analysis:
Support Vector Machine:
The support vector machine operation process is divided into two parts, operates as following:
Construct the classification system:
The data from this study is nonlinear partitioned dataset, can’t find a hyperplane in the original space, required through kernel function to covert the data from the original space to the high dimensional feature space, and
classifying it in this space. We can simplify the complex computational problem become through kernel function.
There are four commonly used kernel functions:
Linear: ( , ) ,T
i j i jK x x x x
Polynomial: ( , ) ( )T d
i j i jK x x x x r ,
>0
Radial Basis Function: ( , ) exp( )d
i j i jK x x x x ,
>0
Sigmoid: ( , ) tanh( )T
i j i jK x x x x r
Kernel function is the key to construct a good performance support vector machine, but the different problems need different kernel function. In this research, we adopt polynomial kernel to construct the classification system because
it is good to obtain higher benefit in nonlinear and high dimensional data, and the parameter that we adjust only C
value and Gamma value, it's not easy to have too much deviation. (Hsu et al., 2003) Using different C value and Gamma value will generate different accuracy rate, we through SPSS Modeler to find
the best parameter, then we can get better classification performance.
Calculate the correct rate:
Using the support vector machine with set parameter to classify data and calculate the correct rate.
Neural Network:
The neural network has different modes. e.g., back propagation network, Hopfield network and radial basis
function network, and back propagation network is the method that is the most commonly used in commercial research (Vellido et al., 1999). Therefore, we using the multilayer perception in back propagation network to
analyze data.
Back propagation network is a multilayer feedforward network and it has input layer, hidden layer and output layer.
Input layer neurons major role in transmission, and hidden layer and output layer are neurons that really work. Input layer neurons expressed as the number of input variables, in this study, the number of input layer neurons
represent variables of customer data, the output layer represent determine customer that is target customer or not,
when the output shows “yes”, represents this data attributable to target customer, if the output shows “no”, represents this data can’t attributable to target customer, and hidden layer represents the interaction between
processing unit in input layer.
The second phase analysis:
In order to reduce Type I and Type II errors in the classification system, we perform the class predictions by using
support vector machine and neural network in first phase. The method will step into the second phase if the class

INDIAN JOURNAL OF MANAGEMENT SCIENCE (IJMS) EISSN 2231-279X – ISSN 2249-0280
www.scholarshub.net Vol.– III, Issue – 3, July 2013
12
predictions from two classifiers are not the same. In the second phase, we devoted to cluster the customer data by
using K-Means algorithm. We compare the unclassified data with target customer cluster and non-target customer
cluster. The unclassified data will be clustered into the cluster according to their similarity. To begin with, we define the cluster centers of each cluster by using K-means algorithm and vector the unclassified data. Then
compare the distance between the unclassified data and the cluster centers of each cluster by using a mathematical
calculation known as the Euclidean distance (Buttrey & Karo, 2002; Davidson, 2002). After the VG and VB of the unclassified data are calculated by K-means algorithm, the unclassified data is able to
be clustered. When VG<VB, the data has higher similarity with the good customer cluster, and therefore be
clustered to the target customer cluster; otherwise be clustered to un-target customer cluster.
This study using K-means algorithm in the second phase because of it won’t be affected by the quality of training data. K-means algorithm clusters data not based on the pre-defined categories but based on the similarity of the
data, and the methods in the first phase may produce errors due to the quality of training set. Therefore, in the
second phase, we analyze the inconsistent data from the first phase by using K-means algorithm to get the better results.
The Analysis of Case:
This study uses the data of a Portuguese banking institution that from the UCI machine learning database. The bank
marketing data set contains 4521 instances and 17 attributes. There use 16 attributes to describe the customer data and the condition of the bank marketing (phone cells), including 7 numeric attributes, 6 categorical attributes and 3
binary attributes. The target attribute represents whether the customers subscribe the long-term bank deposits or
not, including 521 “yes” and 4000 “no”. We define the customer in which has subscribed as the target customer, and process analysis.
To begin with, we divide the data set into training set and test set. The result of proportion show about 80% and
20% for training set and test set. Training set contains 3604 samples, including 418 “yes” and 3186 “no”. Test set contains 917 samples, including 103 “yes” and 814 “no”.
The first phase analysis:
Support Vector Machine:
In this study, we use the SVM modules of SPSS Modeler to classify, and select polynomial kernel to construct the classification system. After repeated tests and cross-validation, we find that when the value C=2 and Gamma=0.3
will achieve the best classification results. Using support vector machine with set parameter to classify the test set.
Fig. 4.1 shows, the average accuracy of test set is 85.5%, the classification accuracy of 817 samples “no” is 91.2%, the classification accuracy of 103 samples “yes” is 40.8%%, Type I error is 59.2% and Type II error is 8.8%.
Table 4.1: Support vector machine classification result
Original class Classified class
NO YES
NO 742(91.2%) 72(8.8%)
YES 61(59.2%) 42(40.8%)
Neural Network:
In this research, we use the multilayer perception of SPSS Modeler to analyze. In this case, the number of input
layer neurons expressed as 16 attributes of customer data, and the number of output layer neurons expressed as target attribute. Setting the hidden layer of multilayer perception to two levels, after repeated tests and cross-
validation, we setting the first level of hidden layer to 3, and setting the second level of hidden layer to 4, using the
neural network with set parameter to classify test set and calculate the accuracy of classification. Fig. 4.2 shows, the average accuracy of test set is 90.4%%, the classification accuracy of 817 samples “no” is 96.6%%, the
classification accuracy of 103 samples “yes” is 41.7%%, Type I error is 58.3% and Type II error is 3.4%.

INDIAN JOURNAL OF MANAGEMENT SCIENCE (IJMS) EISSN 2231-279X – ISSN 2249-0280
www.scholarshub.net Vol.– III, Issue – 3, July 2013
13
Table 4.2: Neural network classification result
Original class Classified class
NO YES
NO 786(96.6%) 28(3.4%)
YES 60(58.3%) 43(41.7%)
The second phase analysis:
In this phase, we compare the classification results from support vector machine and neural network. If the two
classifications are consistent, the classification will be the finale result whether it consists with the original data or
not. Otherwise, the procedure will step into second phase, to analyze data by using K-Means algorithm. First, to divide the customer data into good customer cluster and bad customer cluster. We calculate the VG (value of
distance from cluster (good)’s center to data) and VB (value of distance from cluster (bad)’s center to data) of the
unclassified data by using K-means algorithm. When VG<VB, the data has higher similarity with the good customer cluster, and will be clustered to the target customer cluster; otherwise will be clustered to un-target
customer cluster.
NO.98 customer in Figure 4.1, for example, is the data that classed by support vector machine and neural network.
We compared the classification results produced from two classifiers, and found that they are not the same. Next, we calculate the data by using K-means algorithm of SPSS Modeler, and figure out VG=1.852, VB=2.042. If
VG<VB, the no.98 customer is similar to the target customer cluster. Therefore, it comes to a conclusion that no.98
customer is clustered to the target customer cluster.
Figure 4.1: K-Means algorithm flowchart
Through support vector machine and neural network classification, there are 814 samples that judgment is same, output them for result. And 103 samples that judgment is not same, the original data as "yes" are 35 samples, as
"no" are 68 samples. Importing this data to second phase analysis, through K-Means algorithm, there are 53
samples be clustered to non-target customer cluster, 50 samples be clustered to target customer cluster.
For example, in Table 4.3, the five data are not clustered to the target customer cluster in original. After analyze data by using K-means algorithm, we get the four data that can be clustered to the target customer cluster because
of their VG<VB. The rest of the unclassified data may be deduced by analogy.
Table 4.3: Examples of reassigned results
NO. VG VB Original Reassigned
98 1.852 2.042 no yes
180 1.558 1.603 no yes
201 1.623 1.703 no yes
224 1.433 1.477 no yes
346 1.843 1.793 no no

INDIAN JOURNAL OF MANAGEMENT SCIENCE (IJMS) EISSN 2231-279X – ISSN 2249-0280
www.scholarshub.net Vol.– III, Issue – 3, July 2013
14
Finally, to verify the effect, we analyze customer data of the two-phase model output by using support vector
machine and neural network. As shown in Table 4.4 and Table 4.5, after analysis, we get the classification
accuracies as 98.91% and 94.55%. Both of them are higher than the initial classification accuracies from support vector machine and neural network. Also, Type I error and Type II error are reduced. Consequently, the simulations
show that two-phase target customer choice model in this study not only increasing the accuracy of classification
but also reducing the Type I and Type II error.
Table 4.4: Using SVM to verify the result of two-phase model
Original class Classified class
NO YES
NO 786(99.6%) 3(0.4%)
YES 7(5.5%) 121(94.5%)
Table 4.5: Using NN to verify the result of two-phase model
Original class Classified class
NO YES
NO 772(97.9%) 17(2.2%)
YES 30(23.4%) 98(76.6%)
Conclusion:
Increasing global competition is changing the environment facing most enterprises today. For any enterprise, it is
an important issue that how to reduce costs, promote the interests of marketing, or find out the potential customers.
In recent years, various data mining methods have been widely used in marketing and customer relationship management fields. If a enterprise is able to collect a lot of customer data and analysis useful information, it will
become a leader of the field.
In this research, we presents a two-phase target customer choice model. First, we perform the class predictions by using support vector machine and neural network. Comparing the class predictions, if the judgment is not the same,
it will proceed to the next phase. The second phase attempts to analysis the customer data by K-Means algorithm.
We cluster the customers by comparing VG and VB. The simulations show that our methods not only increasing
the accuracy of classification but also reducing the Type I and Type II error. The proposed approach appears an excellent performance, and shows that this study has contribution on practice and academic value at the same time.
To believe firmly, the advantages of our two-phase target customer choice model are helpful to reduce marketing
costs, find out the potential customers and increase enterprise profits for the enterprises.
References:
[1] Berry, M.J.A., & Linoff, G. (1996). Mastering Data Mining, the Art and Science of Customer Relationship
Management. NY: John Wiley and Sons.
[2] Buttrey, S.E. & Karo, C. (2002). “Using K-nearest- neighbor classification in the leaves of a tree,” Computational Statistics and Data Analysis, 40(1), 27-37.
[3] C. W. Hsu, C. C. Chang and C. J. Lin (2003). “A Practical Guide to Support Vector Classification,”
Technical Report, Department of Computer Science and Information Engineering, University of National Taiwan, Taipei, 1-12.
[4] Davidson, I. (2002). “Understanding K-means non-hierarchical clustering,” SUNY Albany Technical Report, 2-25.
[5] Fayyad, U. & Piatetsky-Shapiro, G. &Smyth, P. (1996). “From Data Mining to Knowledge Discovery in Databases,” Advances in Knowledge Discovery and Data Mining, Calif.: AAAI Press, 37–54.
[6] H. Zha, C. Ding, M. Gu, X. He, and H.D. Simon. (2001). “Spectral rlaxation for k-means clustering,” Neural
Information Processing Systems vol.14 (NIPS), 1057–1064.
[7] He, J., A. Tan, C. L. Tan, and S. Y. Sung, (2003). “On quantitative evaluation of clustering systems,” Clustering and Information Retrieval Anonymous, 105-134.
[8] IBM SPSS Modeler 15 Applications Guide (2011).

INDIAN JOURNAL OF MANAGEMENT SCIENCE (IJMS) EISSN 2231-279X – ISSN 2249-0280
www.scholarshub.net Vol.– III, Issue – 3, July 2013
15
[9] J. B. MacQueen (1967). “Some Methods for classification and Analysis of Multivariate Observations,”
Proceedings of 5-th Berkeley Symposium on Mathematical Statistics and Probability, Berkeley, University of
California Press, 1, 281-297. [10] Joachims, T. (1998). “Text categorization with support vector machines,” In Proceedings of European
conference on machine learning (ECML). Chemintz, DE, 137–142.
[11] Kanungo, T., Mount, D., Netanyahu, N., Piatko, C., Silverman, R., and Wu (2000).“An efficient K-means clustering algorithm: Analysis and implementation,” IEEE Transactions on Pattern Analysis and Machine
Intelligence, 24(7), 881–892.
[12] Peppers, D. and Rogers, M. (1999), The One to One Future, Doubleday, N.Y.
[13] Pontil, M. & Verri, A. (1998). “Support vector machines for 3D object recognition.,” IEEE Transactions on Pattern Analysis and Machine Intelligence, 20(6), 637–646.
[14] S. Moro, R. Laureano and P. Cortez. (2011). “Using Data Mining for Bank Direct Marketing: An Application
of the CRISP-DM Methodology,” In P. Novais et al. (Eds.), Proceedings of the European Simulation and Modelling Conference - ESM'2011, 117-121.
[15] Scott, N. (2006). The basis for bibliomining: frameworks for bringing together usage-based data mining and
bibliometrics through data warehousing in digital library services. Information Processing and Management, 42, 785-804.
[16] Stern, H. S. (1996). “Neural Networks in Applied Statistics,” Technometrics, 38, 205-216.
[17] UC Irvine Machine Learning Repository, http://archive.ics.uci.edu/ml/
[18] Vapnik, V. (1995). The Nature of Statistical Learning Theory, Springer-Verlag, New York. [19] Vellido, A., Lisboa, P. J. G., & Vaughan, J. (1999). “Neural networks in business: a survey of applications
(1992–1998),” Expert Systems with Applications, 17, 51-70.
[20] Yu, G. X., Ostrouchov, G., Geist, A., & Samatova, N.F. (2003). “An SVM-based algorithm for identification of photosynthesis-specific genome features,” In 2nd IEEE computer society bioinformatics conference, CA,
USA, 235–243.
[21] Zhang, G., Patuwo, B. E., & Hu, M. Y. (1998). “Forecasting with artificial neural networks: the state of the
art,” International Journal of Forecasting, 14, 35-62.
****

INDIAN JOURNAL OF MANAGEMENT SCIENCE (IJMS) EISSN 2231-279X – ISSN 2249-0280
www.scholarshub.net Vol.– III, Issue – 3, July 2013
16
THE USED OF IT BALANCED SCORECARD TO BUILD THE
PERFORMANCE MEASUREMENT MODEL OF ACADEMIC
INFORMATION SYSTEMS (CASE STUDY ACADEMIC
INFORMATION SYSTEM OF SATYA WACANA)
Paskah Ika Nugroho,
Faculty of Economics and Business
Satya Wacana Christian University, Indonesia.
Prihanto Ngesti Basuki,
Faculty of Information Technology
Satya Wacana Christian University
Indonesia.
Evi Maria,
Faculty of Information Technology
Satya Wacana Christian University
Indonesia.
ABSTRACT
The aim of this research is to make a model of performance measurement of academic information
system to facilitate the auditors in conducting a periodically performance measurement of Satya
Wacana Academic Information System using IT Balanced Scorecard. SI performance measurement model was developed through systematic measures in the form of the action process, reflection,
evaluation, and innovation by applying the method of survey research, development, experiments ,
and evaluation. Performance measurement modeling of Academic Information Systems (SIASAT) in SWCU has been done by making a framework model which was developed by considering the
following parameters: (a) the duties and functions of the university, (b) the aspects of university
management, (c) the duties and functions of the IT organization in university, (d) the need of
information system for academic activities, and (e) the methodology of IT basic framework used, which is the IT Balanced Scorecard (IT-BSC).
Keywords: IT Balanced Scorecard, Academic Information System, Performance Measurement.

INDIAN JOURNAL OF MANAGEMENT SCIENCE (IJMS) EISSN 2231-279X – ISSN 2249-0280
www.scholarshub.net Vol.– III, Issue – 3, July 2013
17
Introduction:
The use of Information Technology (IT) in Higher Education institutions especially for the use of information systems and the
Internet can not be separated due to the demands of the stakeholders (Indrajit, 2006). IT Management in Higher education
institution is a Critical Success Factor (CSF) for leaders and partners of Higher education institutions (Henderi, 2010).
However, the complexity of IT implementation makes the leaders of the various levels in the Higher education institutions and
stakeholders have difficulty in managing the IT. The complexity of IT implementation in higher education institutions in
Indonesia happens because the higher education institution does not have a specific framework model when establishing the
information system (Mutyarini and Sembiring, 2006). As a result, the benefits of using IT is not comparable to the investments
value which has already been incurred.
Satya Wacana Christian University is one of the universities, which has already used IT as an infrastructure and facility to provide services for students, lecturers and all the staff, and also assists the running of the activities around the work units. In
carrying out its main activity, that is to provide educational services, SWCU has supported by IT of Satya Wacana Academic
Information Systems (SIASAT). IT management has been applied in SWCU, but it has not been applied using a well-structured
method and approach. On the other hand, IT implementation must be controlled because the control provides reasonable
assurance to management that the implementation process has been done in accordance with the plans and goals of the
organization (Maria, 2011).
Each IT process requires a controlled IT measurement to indicate the performance of IT in achieving the control objectives and
facilitate the management to make improvements to the performance of IT. IT performance measurement can be performed by
using IT Balanced Scorecard IT where the IT performance is measured from 4 perspectives: corporate contribution, user
orientation, operational excellence, and future orientation (Van Grembergen, 2000). IT Balanced Scorecard is an effective
method of managing IT organizations as well as evaluating the success and development of the system/application, the
development of computer and network investment, quality of products and IT services, as well as improving the quality of human resources, even though, most universities in Indonesia have not been using this method (Prabowo, 2007).
In addition, monitoring and evaluating towards SIASAT performance has not been done periodically, but only if there are
complaints from the working units about the SIASAT service (Maria and Haryani, 2011). This condition is not consistent with
the results of Maniah and Surendro’s research (2005) which stated that SI performance measurement must be done
periodically to ensure the sustainability of IT operations used by the organization or company as well as to assess the
sustainability between the planning and implementation of the system. Since the importance of SI performance measurement
should be done periodically, this research will try to make a model of performance measurement of academic information
system to facilitate the auditors in conducting a periodically performance measurement of SIASAT using IT Balanced
Scorecard.
Literature Review:
IT Balanced Scorecard:
The balanced scorecard can be applied to the IT function and its processes as Gold (1994) and Willcocks (1995) have conceptually
described and has been further developed by Van Grembergen and Van Bruggen (1997) and Van Grembergen and Timmerman (1998).
IT-BSC has four perspectives: (1) Corporate Contribution, contains a measure which indicates how the management (the manager)
evaluates/views the IT organization; (2) User orientation contains a measure which indicates how users evaluates/sees the results of
the IT organization, (3) Operational Excellence contains a measure of the effectiveness and efficiency of the IT process, and (4)
Future orientation contains a measure which describes how IT position within the next challenge.
Performance Measurement:
Mulyadi (2001) defines performance measurement as a process of assessment on the company operational activities in a
particular period, whether it has been done based on the defined goals or not. The main purpose of the performance measurement is that the leader of the company has an objective basis in giving the compensation in accordance with the
achievement which has been done by each department as a whole. It is expected that all of these will give motivation and
stimulation in each section to work more effectively and efficiently.
Previous Researches:
IT model development and performance measurement can adopt IT standards such as ITIL, ISO/IEC 17799, COSO dan
COBIT (O’Donnell, E, 2004). Van Grembergen’s research (2000) discussed about how the IT balanced scorecard (IT-BSC) can
be linked to the business balanced scorecard (BU-BSC) and in this way support the IT/business governance and alignment
processes. The considered aspects in the IT application in IT-BSC method are corporate contribution, customer (user)
orientation, operational excellence and future orientation. IT-BSC method used to measure the performance of the
implementation system of Enterprise Resource Planning systems (ERP) at the University. The method was continuously developed to make a strategic plan which is in accordance with the mission of educational institutions to continue in surviving

INDIAN JOURNAL OF MANAGEMENT SCIENCE (IJMS) EISSN 2231-279X – ISSN 2249-0280
www.scholarshub.net Vol.– III, Issue – 3, July 2013
18
in the business competition (Sa'adi and Suhardi, 2006).
IT Balanced Scorecard has not been widely used to measure the performance of information systems in universities in
Indonesia, but actually this method is very effective for managing the IT organization and evaluating its success (Prabowo,
2007). This is because the Universities in Indonesia did not have a specific model of the framework when they build their
academic information system (SI), so Mutyarini and Sembiring (2006) created an academic architecture Information system
model by adapting the architecture of Monash University which used TOGAF in order to achieve the mission of Tri Dharma
higher education.
The previous research on IT in SWCU as the research object, including the study of Maria and Haryani (2011) who found that the
supervision and the assessment towards the IT performance in SWCU has not been carried out periodically, just only if there are complaints from the users (the working units) about the IT service. This research produced a model of information audit system
which is developed using the COBIT framework especially for delivery and support (DS) domain. Maria‘s research (2011) also
found that so far the IT management in SWCU has been done, but it has not been done using the structured method and approach.
This research also choose to use COBIT framework in doing the comparison among the academic information systems because
COBIT can notice the link between the business goals without neglecting the IT process as the focus. Maria’s research, et al
(2012) found that IT in SWCU has been well managed where IT processes to support business goals has been standardized,
documented and communicated well. There should be a continuous monitoring and evaluation of the IT in SWCU, so the quality
of IT services in SWCU can be improved day by day in accordance with what is expected.
Research Methodology:
This type of research is a combination of descriptive studies that describes the phenomenon that actually occurs in an event or population and exploratory research that found a model of the SI Academic performance measurement done by doing an
approach on the "Research and Development", that was a research program which was followed up by doing some
development programs. SI performance measurement model was developed through systematic measures in the form of the
action process, reflection, evaluation, and innovation by applying the method of survey research, development, experiments ,
and evaluation.
The location of this study, Satya Wacana Christian University Salatiga Indonesia, was chosen on purpose. Primary data of this
study was the results of guided interviews and observation. While secondary data such as documents, reports and policies are
taken based on the SIASAT
The steps of this study are as follow:
a. Preliminary studies
In the initial study, there were prelimanary research on previous studies, literature and standards that support the research topic, guided questionnaire drafting, and SIASAT understanding.
b. Data collection
At this stage, the data was obtained by interview, observation, and questionnaires given to the relevant units and users of
SIASAT. The secondary data is also collected from related units of SIASAT.
c. Development of performance measurement model of IS
At this stage, development of performance measurement of IS was managed by interviews, observation and related
documents to state parameters and Critical Success Factor (CSF), which will be used as constraints to determine criteria of
performance measurement of SIASAT based on IT BSC perspective. Then we mapped the steps to measure the
performance of acedemic information systems.
d. Conclusions
In the final stage of this research, a conclusion from all research processes was stated.
Result and Discussion:
Brief description of the Satya Wacana Academic Information Systems:
The internet-based of SWCU Academic Information System (SI), known as SIASAT , is an application used to record data
from each student's academic administration from the entry (admission) to the exit (graduation). This application can be
accessed easily via the SWCU homepage, http://www.uksw.edu address, then go to the SIASAT menu in the ACADEMIC
group, or directly go to http://siasat.uksw.edu. These applications provide an online and a real time of academic information.
All students who are listed as SWCU students, have the right to access the application via the homepage institution. It is
important for SWCU students to know and master this application and its operations in order to see the financial obligations
that they have to pay, course registration, and see the results of their study for each semester.
SIASAT Performance Measurement Model by Using IT Balanced Scorecard:
Pyle (2003) stated that the development of performance measurement model will be based on one of modelings, i.e. the model
which is developed by its constituent components, such as business processes and their correct data components. Performance
measurement modeling of Academic Information Systems (SIASAT) in SWCU has been done by making a framework model

INDIAN JOURNAL OF MANAGEMENT SCIENCE (IJMS) EISSN 2231-279X – ISSN 2249-0280
www.scholarshub.net Vol.– III, Issue – 3, July 2013
19
which was developed by considering the following parameters: (a) the duties and functions of the university, (b) the aspects of
university management, (c) the duties and functions of the IT organization in university, (d) the need of information system for
academic activities, and (e) the methodology of IT basic framework used, which is the IT Balanced Scorecard (IT-BSC). These
parameters are expected to be the factors that determines the performance of academic information systems which were
observed, and how these parameters can be controlled and regulated, in order to obtain a desired performance system. The
relationship between the 5 parameters in creating the measurement model of academic information system performance by
using IT-BSC is presented in Figure 1.
Figure 1. The relationship between the parameters in creating the performance measurement model
The main parameters of duties and functions of university in this research is the implementation Tridharma High Education,
such as lectures, working in laboratory, practical work, the implementation of the final project, research and training, and the
implementation of community service. Those are the things that encourage the chief of SWCU to formulate its business goals
by using four perspectives of Balance Scorecard (BSC). The business goals of SWCU are presented in Table 1. To achieve
those business goals, IT infrastructure is provided in the form of the use of computers, information systems implementation,
and the use of internet technology. The information system was built in accordance with the internal business processes of
SWCU starting from prospective new students since they enroll, be accepted, join the lectures, until graduate.
Table 1. Business goals SWCU
BSC Perspective SWCU Business Goals
Financial
1 Provide a good return on investment of IT-enabled business investments
2 Manage IT-related business risk
3 Improve corporate governance and transparency.
Customer
1 Improve customer orientation and service
2 Offer competitive products and services
3 Establish service continuity and availability
4 Create agility in responding to changing business requirements
5 Achieve cost optimisation of service delivery
Internal
1 Improve and maintain business process functionality
2 Lower process costs
3 Provide compliance with external laws, regulations and contracts
4 Provide compliance with internal policies
5 Improve corporate governance and transparency
6 Manage business change
7 Improve and maintain operational and staff productivity
Learning &Growth Manage product and business innovation
SWCU leaders also formulate the main aspects that need to be considered in the management of a university. University management
should pay attention to the availability of resources, the process aspects and the content aspects. These parameters need to be
formulated, since universities in Indonesia do not have a standard framework for building and managing academic information
system (Mutyarini and Sembiring, 2006). Those aspects will be managed by the organization's culture, values and work ethic and are

INDIAN JOURNAL OF MANAGEMENT SCIENCE (IJMS) EISSN 2231-279X – ISSN 2249-0280
www.scholarshub.net Vol.– III, Issue – 3, July 2013
20
manifested in the form of organization structure and management systems in universities as presented in Table 2.
The parameters of IT management organization in SWCU are handled by the Bureau of Information Systems Technology
(BTSI). IT developments are constantly increasing, so that SWCU must make arrangement in the IT management organization.
BTSI plays an important role for the success of the implementation process. This is because BTSI not only manage the
technical aspects of IT but also play a role in determining the organizational culture in SWCU in using IT. BTSI consists of 2
parts: (1) IT section which is in charge of audio-visual section, parts of the communication network and the Internet, and parts
of computer, (2) information system section which is in charge of software parts, parts of information systems management,
parts of flexible learning & web, and parts of documentation and training. The functions which are managed by BTSI are: (1)
the function of technology development and the application of information systems, (2) the function of maintenance of information systems applications, database, digital documentation of information system, the content of learning resources,
networks and computers, (3) the functions of settings and monitoring of IT implementations in the form of change management
and user relationship, release system and audit.
Table 2. The key aspects of Universitites Management
Organizational Culture, Values and Work Ethics
Resources Process Content
Lecturers and Non-
lecturers resources
Funds
Facilities and
Infrastructure
IT Infrastructure
The key process is to run Tri Dharma University,
which consists of:
1. Education and Teaching
2. Researches
3. Community Service
The curriculum and its management,
which consist of instructional materials,
the results of the study, the results of
community service, scientific forums. Supporting processes, which include the
processes of: academic administration, students
and alumni, financial administration, cooperation
and external relations, and promotion
Information Systems Knowledge Management both tacit
knowledge and explicit knowledge.
Organizational Structure and Management Systems in Universities
On the other hand, the parameters of the IT framework methodology used in this study use IT Balanced Scorecard (IT BSC).
Based on those IT organization functions in SWCU, it is necessary to establish IT Balanced Scorecard for each of those
functions which is essentially a derivative of the IT Balanced Scorecard for universities. The process of identifying Critical
Success Factor (CSF) is needed to determine the limits of performance measurement criteria in each IT process. The CSF of
Academic Information Systems is presented in Table 3.
Table 3. The Critical Success Factors of Academic Information System based on IT-BSC Perspective
IT-BSC Perspective CSF Academic Information System
Business Contribution Control costs, increase revenue and improve service coverage
User Orientation Customer value proposition that includes the rates, quality, service provided, service
and partnerships
Operational Excellence Improvement of internal processes by implementing the operations management,
customer management and innovation.
Future Orientation Enhanced capabilities and skills through the strengthening of human capital,
strengthening of information capital, and strengthening of organization capital
For the parameters of the IS (Information System) requirements related to academic activities of universities which consist of
information about admissions, student registration, course registration, grades, and graduation. Admission information consists of
information regarding enrollment of prospective new students which covers registration process, the data inputting, photo-taking, selection, selection, announcement of selection result, printing of Rector Decree about new admission and information regarding re-
signing up includes taking an acceptance letter, registration payment, informing a bank payment receipt, filling out a registration form,
and obtaining student’s number. The importance of IS related to student registration such as providing information about types of
registration, information of procedures, requirements, and student registration deadline. Student registration is an activity of
registration or recording of active-status as the University's student and must be done by students each semester.
Course registration is a subject registration process as a participant of a course in the current semester. Subject registration
process includes academic supervision, financial (dispensation), internet, course registration schedule of study
program/department. IS ought to provide information related to grade of subject for each student and each semester which will
be presented either in a study result card or an academic transcript. As for graduation activities, IS should provide information
includes registration, graduation ceremony, and diploma delivery.
After determination of the CSF and know the needs of IS for the academic activities, it should begin mapping the steps what needs to be done in order to measure the performance of academic information system. The methods of academic information

INDIAN JOURNAL OF MANAGEMENT SCIENCE (IJMS) EISSN 2231-279X – ISSN 2249-0280
www.scholarshub.net Vol.– III, Issue – 3, July 2013
21
system performance measurement based on IT BSC Perspective are presented in Table 4.
Table 4. The Methods of Academic Information System Performance measurement based on IT BSC Perspective.
IT-BSC Perspective Academic Information System Measurement
Business Contribution
1. Performing control towards IS, for example by comparing with the actual budget, analysing
the use of budgets, calculating the cost of IS per number of staff.
2. Calculating the financial benefits derived from selling products and services.
3. Doing business assessment of the projected new IS when the university will create and
develop IS, for example by evaluating business based on economical information and
performing financial evaluation based on Return on Investment (ROI), Net Present Value
(NPV), Internal Rate of Return (IRR), Payback Time (PB).
4. Doing business assessment of IS functions such as calculating the percentage of capacity
related to IT strategy projects, analyzing the relationship between development/new
infrastructure and the investment/investment displacement.
User Orientation
1. Assessment towards BTSI associated with applications that have been addressed, the
percentage of applications that have been completed, etc..
2. Cooperation with the users of information systems when it will carry out the functions of IT
organization, for example by calculating the number of users involved in the manufacturing
process and the development of IS application. 3. Analyzing the IS’s user satisfaction by measuring the level of user friendliness on the
application, calculating the index of user satisfaction, counting the number of applications
and system availability.
Operational
Excellence
1. Conducting an analysis towards the efficiency of software development, for example in terms of the average increase of unexpected budget, maintenance activities, the average
number of delayed response of the application.
2. Conducting an analysis towards the efficiency of such operations by computing network
availability, response time per category per person, the percentage of work which is done
ontime, the ratio of operating costs of the system used.
3. Conducting an analysis towards the acquisition and application of personal computers if
there is any upgrade.
4. Conducting an analysis towards problem sloving if the system is on trouble, for example by
calculating the average charge time, troubleshooting time, the percentage of problems
answered in a timely manner.
5. Conducting an analysis towards the training of the IT users.
Future Orientation
1. Conducting an analysis towards the training and expertise of IT staff both in terms of the
budget which is owned by institutions and trained individuals based on the age, expertise,
etc.
2. Conducting an analysis towards the age of the applications and opportunities for investment in new technologies.
SWCU Academic Information System Measurement Model by using the IT-BSC is illustrated in Figure 2:
Universities’ Business Goals by
using BSC Perspective
Aspects of IT management in
University
Critical Success Factor
The methods of Academic IS
performance measurement
The Methodology of IT Framework
(IT BSC Perspective)
Resources, Process, and Content
IT Management organization
The need of IS for academic
activities in Universities
Business Contribution
User Orientation
Operational Excellence
Future Orientation
Figure 2. Academic SWCU SI measurement model using IT BSC.

INDIAN JOURNAL OF MANAGEMENT SCIENCE (IJMS) EISSN 2231-279X – ISSN 2249-0280
www.scholarshub.net Vol.– III, Issue – 3, July 2013
22
Conclusion:
Based on those IT organization functions in SWCU, it is necessary to establish IT Balanced Scorecard for each of those
functions which is essentially a derivative of the IT Balanced Scorecard for universities. The process of identifying Critical
Success Factor (CSF) is needed to determine the limits of performance measurement criteria in each IT process. After
determination of the CSF and know the needs of IS for the academic activities, it should begin mapping the steps what needs to
be done in order to measure the performance of academic information system.
References:
[1] Dorian Pyle. (2003). Business Modeling and Data Mining. Morgan Kaufmann Publishers, ISBN:155860653X.
[2] Gold, C. (1994). US measures — a balancing act. Boston: Ernst & Young Center for Business Innovation.
[3] Henderi. (2010). Good IT Governance: Framework and Prototype for Higher Eduation. Creative Communication and
Inovative Technology Journal vol 3, no.2 ISSN: 1978-8282.
[4] Indrajit, Eko. (2006). Mengukur Tingkat Kematangan Pemanfaatan Teknologi Informasi untuk Institusi Pendidikan
(Suatu Pendekatan Kesiapan Pemegang Kepentingan/Stakeholder). Conference proceeding of ICT for Indonesia,
Bandung: 3-4 May 2006, 116-120.
[5] ISACA. (2004). COBIT Student Book. IT Governance Institute.
[6] Maniah and Surendro. (2005). Usulan Model Sistem Informasi (Studi Kasus: Sistem Informasi Perawatan Pesawat
Terbang). National Seminar of Information Technology Application, Yogyakarta: 18th June 2005.
[7] Maria. (2011). Perbandingan Sistem Informasi Akademik Universitas Kristen Satya Wacana Menggunakan COBIT Framework. Journal of Eonomic Foccus, Vol X, Issue-2, 140-149.
[8] Maria, dan Haryani. (2011). Audit Model Development of Academic Information System: Case Studi on Academic
Information System of Satya Wacana. Journal of Art, Science & Commerce, Researchers World, Vol II, Issue-2, 12-24.
[9] Maria, et al. (2012). The Measurement of Information Technology Performance In Indonesian Higher Education Institutions in
The Context of Achieving Institutional Business Goals Using COBIT Framework Version 4.1: Case Studi Satya Wacana
Christian University Salatiga. Journal of Art, Science&Commerce, Researchers World, Vol III, Issue-3(3), 9-19.
[10] Mulyadi. (2001). Balanced Scorecard. Jakarta: Salemba Press: p 416-420.
[11] Mutyarini and Sembiring. (2006). Arsitektur Sistem Informasi Untuk Institusi Perguruan Tinggi Di Indonesia.
Conference proceeding of ICT for Indonesia, Bandung: 3-4 May 2006, 102-107.
[12] O’donnell, E. (2004). Discussion of Director Responsibility for IT Governance: A Perspective on Strategy. International
Journal of Accounting Information Systems 5: p 101-04.
[13] Prabowo, Harjanto. (2007). Implementasi IT Balance Scorecard di Perguruan Tinggi. National Seminar of Information Technology Application, Yogyakarta: 16st June 2007.
[14] Sa’adi and Suhardi. (2006). Pengukuran Kinerja Penerapan Sistem Enterprise Resource Planning (ERP) di Universitas
dengan Metode IT-Balaced Scorecard (IT-BSC). Conference proceeding of ICT for Indonesia, Bandung: 3-4 May 2006.
[15] Van Grembergen, W. and Van Bruggen, R. (1997). Measuring and improving corporate information technology through
the balanced scorecard technique. Proceedings of the Fourth European Conference on the Evaluation of Information
Technology, Delft: October 1997, 163-171.
[16] Van Grembergen, W. and Timmerman, D. (1998). Monitoring the IT process through the balanced scorecard. Proceedings
of the 9th Information Resources Management (IRMA) International Conference, Boston: May 1998, 105-116.
[17] Van Grembergen, W. (2000). The Balanced Scorecard Technique and IT Governance. Accessed in
http://www.isaca.org/Certification/CGEIT-Certified-in-the-Governance-of-Enterprise-IT/Prepare-for-the-Exam/Study-
Materials/Documents/The-Balanced-Scorecard-and-IT-Governance.pdf
[18] Willcocks, L. (1995). Information Management. The Evaluation of Information Systems Investments. London: Chapman & Hall.
****

INDIAN JOURNAL OF MANAGEMENT SCIENCE (IJMS) EISSN 2231-279X – ISSN 2249-0280
www.scholarshub.net Vol.– III, Issue – 3, July 2013
23
INCREASING THE ACCOUNTABILITY OF THE INSTITUTION
THROUGH THE WHISTLE BLOWING SYSTEM
Jony Oktavian Haryanto,
Satya Wacana Christian University,
Indonesia.
Yefta Andi Kus Nugroho,
Satya Wacana Christian University,
Indonesia.
Rizal Edy Halim,
University of Indonesia, Indonesia.
Rizal Edwin Manansang,
Coordinating Ministry for Economic
Affairs Republic of Indonesia, Indonesia.
ABSTRACT
Along with the development of the organization, the organization's control can no longer rely on a structural approach that is run through a top-down approach but must be pursued through non-
structural, bottom-up approach. Whistleblowing system presents to answer this challenge considering
that this system puts the control nodes of an organization on all its members. This study is specifically trying to find a whistleblowing system model that can become a guide in the implementation for
companies in Indonesia. This research is done by using surveys and interviews starts at a state-owned
enterprise, two government agencies and two multinational companies in Indonesia which have
whistleblowing system. Research results indicate that the empirical model of whistleblowing system is more suitable for the conditions of Indonesia.
Keywords: organizational control, structural approach, non-structural approach, whistleblowing system.

INDIAN JOURNAL OF MANAGEMENT SCIENCE (IJMS) EISSN 2231-279X – ISSN 2249-0280
www.scholarshub.net Vol.– III, Issue – 3, July 2013
24
Introduction:
Organization’s control has a strategic role in achieving organizational goals. According to Ouchi (1979), it is
described as the organization's control mechanism on what an organization can be managed to achieve its
objectives and targets. Meanwhile, according to Anthony and Govindarajan (2001) also Lowe and Machin (1988), the control of the organization is a process of examination both formal and informal to help managers ensure that
all resources are used efficiently and effectively to achieve the goals of the organization (company). In the end, the
control is intended to keep the employees from doing something the organization does not want them to do, or not
to fail to do something on what they should do. In line with the growth of an organization, the control system must keep up to it to suit the needs. Organizational
control systems not only ensure their objectives are achieved, but at the same time pressing the cheating behavior of
its members which can cause huge losses, possibly will lead to the failure to achieving company’s goals. In essence, an effort to avoid cheating behavior should also be done as part of the organization's control.
Various types of control with vertical structural approach have been applied, but fraud committed by the
corporation's board of directors or employees which caused huge losses still happened. Some of these scandals are Enron, Tyco, Arthur Anderson, Lehman's Brothers, etc. Different interests often lead to fraud (deviation). Just an
example, Enron is an ambitious company that was claimed destroyed by the lack of confidence in the company,yet
it did not leave any traces but the angry employees and shareholders. Sadly falling from a prestigious place to place
so contemptible in a fairly short time (Greenspan, 2008). Cheating behavior due to the performance of the parties in an organization can occur because of strong personal
interests. To overcome this, the individuals in the organization are well-rewarded with incentives based on
performances. However, despite of being given a great reward, corruption scandals still happen such as those shown above. Motivation diverse of all members of the organizations or companies not necessarily correspond to
the interests of the company, as well as opportunistic behavior and limitations of principal agent to convince the
agent in order to perform all the activities for the benefit of shareholders or principals, those make organization’s control even more important.
But in reality, the function of the existing control is not always successful. Fraud or corporate scandals that aims to
enrich themselves or a group, still occur, causing loss or bankruptcy for the company. Structured vertical control
mechanism between superiors and subordinates and the establishment of Internal Control Unit (ICU), also the code of conduct which has been available in some companies, as well as some programs strengthening the corporate
culture are not yet capable on performing the function of an optimal control. The existence of organizational control
mechanisms require a form or sharpening of theory and practice. One of the control mechanisms that organizations need is a whistleblowing system.
Whistleblowing system is not a new system. From the observation of researchers, there are only few companies in
Indonesia who implement this system. This fact suggests that there may be things that are not compatible between
this system and companies in Indonesia. On the other hand, there is the possibility of indifference from companies in Indonesia about the importance of applying this whistleblowing system. Whereas control system will work well
if there is support from the performers as well as its appropriateness to the local environment. Exploration of
environmental conditions in the implementation of whistleblowing system will help dissemination of application and system development in Indonesia.
Literature Review:
Definition, Meaning, and Nature of Organizational Control:
An understanding of the organization's control system is very diverse, starting from the approach that only focuses
on aspects of accounting, to the concept of a broad organizational control , including any actions taken by managers
to achieve organizational goals. In the editorial, the understanding of the organization's control was first placed on
the term 'control'. Control is the process used to ensure that all members of the organization doing their best in achieving the goals of the organization (Schendel and Hofer, 1979). Therefore, controls as a system is the basis of
the structure of the organization. This occurs because of the complexity of an organization that is affected by
several factors, such as internal and external conditions that require changes in organizational control systems. Organization's control system was first introduced by Anthony (1965) with the notion of the process by which
managers ensure that resources are obtained and used effectively and efficiently in the accomplishment of the
organisation's objectives'. While Langfield-Smith (1997) considered to limit further research that considers the

INDIAN JOURNAL OF MANAGEMENT SCIENCE (IJMS) EISSN 2231-279X – ISSN 2249-0280
www.scholarshub.net Vol.– III, Issue – 3, July 2013
25
control of the organization that includes the extent of control by using the report based planning and monitoring
activities.
Control practices arise from the consciousness of managers and integrated informal mechanisms of a spontaneous reaction from employees all the time. One thing that is integrated is a complex matter and the potential for escape
from a network established over time to address various managerial needs. When combined, all the elements will
affect the attitudes, motivations, perceptions and behavior of employees (Marginson, 2002; Simons, 1995) Specific mechanisms to achieve control described by Cirka (1997) by dividing it into: simple controls, control on
technology, bureaucracy and administration control, and concertive and culture control. Control on concertive and
culture associated with shared values, norms and conformity to social systems and beliefs. Efforts to control the
behavior represents a complex and elusive activities in order to try to apply the self control to every human being. Social standards and group interaction of a formal control system explain there is a control on behaviour within the
organization (Davilia, 2000).
Lowe and Machine (1988) stated that, if an organization sets its goals in written and unwritten terms, explicit and implicit, plus the possibility for contradiction and conflict , then how could they plan and build a coherent and
effective control system? Therefore, ultimate controls intended to keep the employees from doing something the
organization does not want them to do, or not to fail to do something the employee should do. In fact, the variety of human nature and organizational behavior make this control as a daunting task.
The Evolution of Organizational Control Systems:
In addition to the internal demands as an organization grows larger and becomes more complex, the control system
must also reflects the needs of the ever-changing external environment. Contingency theory explains, when the external environment becomes more complex and dynamic, the uncertainty increases and the appropriate
organizational structures and control strategies must also be changed to fit the situation. Contingency theory within
the larger organization serves to examine the relationship between organizational characteristics, such as organizational structure or control system of an organization which depends on the specific conditions of the
organization (Donaldson, 2001)
According to Van de Ven and Drazin (1985), when the conditions of task uncertainty increases, it needs to be
coordinated with programming and hierarchical manner, which is substituted with horizontal communication channels. Lawrence and Lorsch (1967) proposed that a dynamic environment tends to lead to adaptation with less
formalized control system. Govindarajan (1988) concluded that for each task has various uncertainties, the behavior
needed to achieve effective performance is also very diverse. So because the differences affect differences in behavior control system, superior performance can be achieved by performing a control system adapted to the
uncertainty of the task. According to Galbraith (1975) and Davilla (2000) the effectiveness of formal control
systems are only suitable for the limited uncertainty situation or circumstances. While the use of control systems
with social and informal mechanisms are more appropriate. According to Harrison and McKinnon (1999) and Van der Stede (2001) on the evolution, there is no mutual
decision that underlines the dimension of the control system. When one of the parties convey some dimensions that
can be used as the underlines for some characteristics of control systems, others deliver some of the literature that is still there and it is against it. There are three dimensions that have been identified and associated with control
strategies and operational phases of a company. The first dimension is the dimension of formal and informal. This
dimension indicates how far an organization believes in an explicit mechanism, written and documented (eg, regulations, procedures, and policies) in guiding resource and employee behavior (Cirka, 1997; Ferner 2000; Floyd
and Lane, 2000; Galbraith, 1975, Harrison and McKinnon, 1999; Thomas, 1998; Whitley, 1999). The second
dimension is the flexibility - inflexibility of a manager. This dimension indicates how far will the authority be given
to junior managers in determining a decision while interpreting the rules and procedures in doing his job (Covin dan Slevin, 1991; Geary dan Dobbins, 2001; Govindarajan, 1988; Harrison dan McKinnon, 1999; Marginson, 2002;
Whitley, 1999). Finally, the dimensions of stringency or budget flexibility, which refers to how far the budget will
restrict an activity of resource allocation and the conduction of performance evaluation (Geary and Dobbins, 2001; Govindarajan, 1988; McKnight et al., 2001; Simons, 1995; Shih and Yong, 2001)
Although some of the above dimensions are frequently presented, but there are several examples of other
dimensions, such as about how far the control system is centralized or decentralized, a clear and unequivocal regulation (hint) from the center that must be obeyed, priority is given to self-control, the relative emphasis on
compliance and compliance (conformance) as well as the level of detail and complexity.

INDIAN JOURNAL OF MANAGEMENT SCIENCE (IJMS) EISSN 2231-279X – ISSN 2249-0280
www.scholarshub.net Vol.– III, Issue – 3, July 2013
26
Whistleblowing System:
The definition of whistleblowing is a disclosure done by organization members (either still active or retired), to
those who are entitled to do corrective actions, about the illegal, immoral behaviour or other illegal practices
committed by members of the organization (Dandekar, 1990; Goldberg, 1987, James, 1984. Micelli and Near, 1992; Near and Micelli, 1985). According to Bowie (1982) the disclosure is only based on consciousness, not a hidden
agenda or greed.
Whistleblowing is considered as a voluntary thing in disclosing the fraud as part of a pro-social behavior (Dozier
and Miceli 1985; Miceli and Near 1985; Trevino and Weaver 2001). Furthermore, Trevino and Weaver (2001) refer that whistleblowing as an organization citizenship behavior (organizational citizenship behavior (OCB) - a subset of
pro-social behavior (Organ, 1990). Basis of organization citizenship is voluntary , being useful to society, and extra
behavior in an organization (Organ, 1990). Justice in an organization is as antecedent of organizational citizenship behavior (Moorman 1991; Bies and Tripp, 1993; Eskew 1993; Greenberg 1993; Moorman et al. 1993; Podsakoff
and MacKenzie 1993; Robinson and Morrison 1995).
Chung et al. (2004) described a manipulation between a state of the organization with regulatory approach or principle approaches. In the approach to the rules, an organization emphasizes the need for adherence to various
types of organization regulations, while the principle-based approach emphasizes the importance of individual
values and independent views (opinions). They found that generally the individuals within an organizations that
perform rule-based approach tend to dislike whistleblowing system when compared with individuals who are in the organization with the principles-based approach.
Management Accounting and Internal Control System (Internal Auditor) has no role and function to report
wrongdoings in the organization. If they do so, it will put them at risk of losing their jobs and or career as a revenge from the reported or offended parties (Porter 2003). Organization’s pro-social behavior is a more inclusive
construction than the OCB (Organ, 1990). Pro-social behavior could be needed (eg, because of his role) or
voluntary (extra role) and is defined as an action within the organization who tries to help a person to whom it should be directed (Brief and Motowidlo, 1986).
OCB can only be defined as an extra role and is defined as behavior that depends on a person's freedom and
wisdom. It is not directed or explicitly recognized by the formal system of incentives and hence aggregately will
promote the effectiveness and functioning of an organization. This behavior is not required to be done as part of the job description, but only as a personal choice (Organ, 1988; Organ, 1990). So the disclosure made by the internal
auditor is not considered as an OCB. Instead, disclosures made by the accountant is an OCB behavior because such
action is not a part of his duties and obligations. Studies on the willingness of a person to conduct cooperation in the organization when it is not required, first
proposed by Barnard (1938). He said there are five major categories: 1) cooperation with others, 2) to protect the
organization, 3) voluntary for constructive ideas, 4) self training, and 5) maintain the character or good behavior
towards the organization (Katz, 1964) . The five categories are narrowed and called OCB (Bateman and Organ, 1983). A common listing of OCB used by Researchers is altruism, conscientiousness, civic virtue, courtesy, and
sportsmanship (Smith et al., 1983; Graham 1986a; Organ 1988; Moorman 1991; Niehoff and Moorman 1993;
Podsakoff and Organ, 2000; Cohen-Charash and Spector 2001). Altruism (to prioritize others), as the opponent to egoism is also a pillar for preparation of whistleblowing system.
The OCB of altruism is defined as helping others specifically in face to face situations. Prudence
(conscientiousness) represented by obeying all norms as a good employee and do something extra of what should be done (Organ, 1988; Schnake et al., 1993; Lepine and Van Dyne, 2002). Civic virtue is described as participating
in the management of an organization's governance, although it will cost or put them at risk (Graham, 1986b;
Podsakoff and Organ, 2000). So, whistleblowing is an example of civic virtue OCB not only for internal auditors
but also for employees. Courtesy as a form of communication with others before taking action can be elaborated by not complaining for things that are trivial or insignificant (Organ, 1988; Lepine et al., 2002). Examples of OCB
such as making constructive statements about the department, training for new employees, making suggestions for
improvement of the organization, and respecting the spirit of the rules (Bateman and Organ, 1983). Whistleblowing leads to a dilemma for managers and is often perceived as a threat. But in the era of appreciation
and utilization of employee involvement, the authors believe that it is time for the manager to see that
whistleblowing can be a valuable resource. If one is considered as a committed employee who can provide useful information as part of problem solving mechanism, then the manager can take action in ways that will help out the
company. Whistleblowing can be characterized as an OCB, a responsive action for justice in an organization, and

INDIAN JOURNAL OF MANAGEMENT SCIENCE (IJMS) EISSN 2231-279X – ISSN 2249-0280
www.scholarshub.net Vol.– III, Issue – 3, July 2013
27
motivation to do so is based on social exchange (Micelli and Near, 1992). Although some states in the U.S. provide
an incentive to embellish the whistleblowing program, most of the whistleblowers who reported fraud, based their
reports on the expectation that violations or unethical behavior must be stopped (Miceli and Near, 1992).
The Connection Between Organizational Control System with Whistleblowing:
When controlling an organization, a manager regularly and personally participate in the decision making and
problem solving with their subordinates. This system is called the interactive control system that can be done in
person as face to face (Simons, 1995a). On the other hand, the organization's control system as a tool can also be based on action control (based on behavioral constraints such as sorting duties and authorities, preaction reviews
such as monitoring the expenditures, action accountability in terms of clarity of communication, and redundancy).
These can be done with personal control (selection and placement, training, and job design and provision of necessary resources), cultural control (codes of conduct, group-based rewards, intraorganizational transfers,
physical and social arrangements, and the tone at the top) and result control (performance measurement and linking
performance to compensation) (Merchant and Van der Stede, 2007; Simons, 1994). Control of organization is a tool to carry out the internal monitoring mechanism. The linkage between the
whistleblowing and organization control system should consider the effectiveness of formal control systems which
is applied only on a limited situation or uncertainty. While the use of control systems with social and informal
mechanisms are more appropriate (Galbraith, 1975). Furthermore, contingency theory explains that when the external environment becomes more and more complex and dynamic, the uncertainty increases, thus the
appropriate organizational structures and control strategies must also be changed to adjust. Next, Van de Ven and
Drazin (1985) found that when task uncertainty increases, programming and coordination by hierarchy are substituted with horizontal communication channels. Lawrence and Lorsch (1967) proposed that a dynamic
environment tends to lead to adaptation with less formalized control system. Finally, whistleblowing programs as a
subset of organizational citizenship behavior theory and pro-social behavior which shall report fraud charges ,(it is) not put as obligation in a job description, but considered peripheral. Subjects who come to report do not have to be
superiors to subordinates, but any employee can do so if any indications of fraud committed by members of the
organization occur ( this can be colleagues or superiors). Cheating behavior should be agreed as a deviation from
the norms and values of the organization. Indonesia has unique conditions that must be observed. Compared to some previous studies, Indonesia has a
uniqueness as a developing country which rules of law and regulations have not been so well-implemented,
including weak system of witness protection. So this study aims to map the factors that affect whistleblowing program in strengthening the organization's control system in Indonesia.
Research Methods:
Research Type and Design:
This research is descriptive research with the aim to obtain an overview of the effects of the antecedents of individual commitment, organizational work purposes, and the whistleblowing to organizational performance.
This study is a qualitative research, with in-depth interviews with 5 (five) managers from several companies that
have implemented a whistleblowing system to explore the variables related to the effectiveness implementation of whistleblowing systems, advantages and disadvantages and implementation practices in the real business world,
especially in the context of Indonesia. We can not mention the name of these 5 companies due to privacy and
request from the managers who are interviewed. The method used for this research is a qualitative method used in exploring the construction that will be examined
as well as to try to explain more about these relationships. Qualitative research methods are also used to explore the
relationships between variables in a preliminary study. In-depth interviews carried out to check the relationship
between the construct and to test the extent to which an understanding of the concepts used in this study.
Results and Discussion:
From the interviews stated above, it was found that virtually every organization has a system of reporting fraud.
Although not exactly the same with the concept of whistleblowing that is developed in Western countries, but the bottom line is that organizations have serious concerns to identify fraud committed by its members. For example, in
one of the largest state-owned enterprises in Indonesia (later on we call PT X), they have adopted a policy of "Clean

INDIAN JOURNAL OF MANAGEMENT SCIENCE (IJMS) EISSN 2231-279X – ISSN 2249-0280
www.scholarshub.net Vol.– III, Issue – 3, July 2013
28
Company”. Through this program, any employee can report fraud without fear of identity revealed. Organizations
outsource to a third party in handling complaints and incoming information. Outsourcing is done in order to ensure
the identity of the complainant and to ensure that all statements in accordance with the order of priority followed up by the company. The system of third-party filter any incoming information and then forward it to the relevant
parties. In the period of time when the report was not followed up, the system will continue to warn that there
would be a real act of leadership on such information. The advantage of this system is its independence and ensure the confidentiality of the complainant. But on the other hand, these systems have drawbacks in terms of costs ,to the
involvement of external parties in the company's internal problems which are often highly sensitive and confidential.
In an interview with one of the leaders of foreign private bank (later on we call Bank Z), found that organizational
commitment and leadership are the keys to success or to fail the whistle blowing system. When there is a strong commitment from the organization and leadership to encourage members to report every fraud, the record shows an
increasing reports which is very good sign. For example in the year 2011 as many as 70% of cases were
successfully dismantled, those were originating from this report. In the coming year, the organization is thinking to give awards to each entry and report that can be proved. Award in the form of financial support as much as three
million rupiah (U.S. $ 300) is an example of the organization's commitment to encourage reporting. Viewed from
the theoretical standpoint this award actually is a deviation from its own system of whistle blowing (Miceli and Near, 1992). Trevino and Weaver (2001) stated that the initial concept of whistleblowing reports aimed at
improving the performance of organizations and not for individual awards. Organization's commitment and strong
leadership will create awareness of all members of the organization about the importance of reporting any fraud.
One of the cement companies which is the Multi National Corporation (MNC) has a reporting system since 2010. This system is a fairly new as a response to the company's desire to have a system of fraud reporting. Any reports
flow in, are directed to the chief executive officer (CEO) for them to set priorities and conduct further investigation.
The advantage of this system is that all reports are handled directly by the CEO without many parties involved to make the investigation remain confidential. In addition to it, CEO will quickly respond to any reports which tend to
cause larger damage to the company. While the weakness of the system is a busy CEO will possibly run slow to
look into various reports coming in.
Given the research is done in large organizations, it was found that most of the fraud committed by members of the organization will eventually be caught. This is often as a result of inequities in the benefit distribution obtained
through fraud.
The whistleblowing system development are focused on socialization and fostering awareness.
Among the many types of violations, a good example comes from one of the biggest private
bank in Indonesia which focuses on fraud and violation of code of conduct. It is based on the analysis that those may hurt the company in the future. In this bank, whistleblowing is handled
by the whistleblowing system called fraud and complain. The principle of whistleblowing
system that runs through the whistleblower hotline is that no matter how trivial the
information may seem, such as the anonymous letter, should not be ignored.
Whistlebowing system at one of the biggest state-owned company which has been initiated
since 2006 and officially launched In August 2008. The system oversees six violations, namely: regulatory violations, theft, fraud, corruption, bribery, and deceptions. Implementation
was undertaken by a task force team to follow up all reports received. This company uses an
outsourcing from Delloitte, to act as reports beneficiary, processing and reporting incoming information to the management. The principle that must be obeyed in using 3rd party is
transparency, independence, and confidentiality. It has also been through a process of
consultation with forensic experts, and technology applications.
It actually shows that no matter how big the organization is and or how neat a fraud committed, as long as it has a
system that allows members of the organization to report, the fraud would have no chance to escape. Thus the
company does need to have mechanisms that can be realized in the form of a special phone line, email, complaint letters, etc. But amid efforts to organize a good whistleblowing system, the organization also has disadvantages as
revealed in the following interview:

INDIAN JOURNAL OF MANAGEMENT SCIENCE (IJMS) EISSN 2231-279X – ISSN 2249-0280
www.scholarshub.net Vol.– III, Issue – 3, July 2013
29
Constraints in the implementation of whistleblowing systems in goverment are (1) the work is
administrative, not many willing to do it, and (2) Reduction of the authority of the Inspectorate
investigation field. The impact is, designed nomenclature changes to the establishment investigation agents, which makes whistleblowing centered only in one party. This can trigger
public unrest and internal Finance department unrest worrying about the objectivity.
After getting feedback from the interviews, there shows a more comprehensive picture about the implementation of
whistleblowing which has been done in these organizations. What no less important is the result of interviews,
pointing a theoretical basis that is generally used to examine the phenomenon of whistleblowing, which is theories
of power (Blau and Scott, 1962) or the theory of justice (Moorman, 1991). However, in the Indonesian context, it seems both of these theories are not strong enough to describe the phenomenon. Power approach, clearly not
suitable for the conditions in Indonesia because Indonesia is a democratic country. Awareness of this condition has
been initiated in the past decade and is reflected in the social life of the community. Next is justice approach which suggests the company to organize all of the existing system to a well-defined, transparent system ,in order to make
the employees treated fairly. Perceptions of justice has not been realized in Indonesia noticing the circumstances
haven’t been reflecting an ideal conditions related to justice. For example, witness protection in Indonesia is still very weak. This makes the organization avoids sanctioning, instead,merely raises awareness and vigilance. Here are
excerpts of this interview:
Compared to most existing whistleblowing systems, whistleblowing systems in PT X has a unique, objective system that does not focus on the search for who is at fault but (focus on ) the
growing awareness among the employees of the company, as well as the lack of an incentive
system. It is due to the weakness of witness protection programme in Indonesia.
The implementation of whistleblowing systems in Indonesia should be approached with the Social Learning Theory.
This theory was originally proposed by Bandura (1977), which stated that the learning process occurs when there is
an interaction between the environment, behavior, and experience (Pfeffer, 1982). Whistleblowing system formed from experience, the everchanging environement, and the effort to show the behavior.
Based on some analysis and consideration of the above, then draft is made about a whistleblowing system
implementation model as shown in the following figure.
Whistleblowing Model Implementation ( picture1)
Leadership
Organization’s
commitment
Organization’s
understanding
Compliance
Organization’s
awareness
Whistle BlowingPerformance of
the Organization
Conclusion:
It is important for organizations to continue to develop whistleblowing system as one of the mechanisms on reporting fraud committed by its members. System implemented in state-owned PT X and PT Y and Bank Z as
multinational companies, suggests that organizations should initiate and develop their existing reporting systems to
whistleblowing systems. Implementation of whistleblowing systems adopt all subordinate statements and followed

INDIAN JOURNAL OF MANAGEMENT SCIENCE (IJMS) EISSN 2231-279X – ISSN 2249-0280
www.scholarshub.net Vol.– III, Issue – 3, July 2013
30
up by a special section or directly to the CEO. Thus the company can differentiate between slander and trustable
reports worth following-up. In addition to the involvement of high-level management is to reduce the potential
conflicts of interest and ensure the direct action of the leaders. The study also showed that in order to implement whistleblowing systems, it requires the organization's
commitment to clean up the company and reduce the potential for fraud that may be committed by its members.
Without a strong commitment from the organization to do the cleaning and facilitate all reports ,the implementation will surely experience problems.
On the other side, leadership is also a positive influence on the successful implementation of whistleblowing.
Without a shift in mindset about the importance for companies to adopt whistleblowing system, it will become
difficult to apply and face many obstacles. This often occurs because the application left without strong leadership and a true understanding of the system. If this occurs then the whistleblowing would just be a "lip service" , not a
strong-willed implementation.
References:
[1] Agung, I.G.N. (2004). Manajemen Penulisan Skripsi, Tesis, dan Disertasi. Jakarta: PT. Raja Grafindo Persada.
[2] Anthony, R. N. (1965). Planning and Control Systems: Framework for Analysis. Boston: Graduate School of
Business Administration Harvard University.
[3] Anthony, R.N., and Govindarajan, V. (2001). Management Control System. Irwin-McGrawHill. [4] Barnard, C. I. (1938). The functions of the executive. Cambridge, Mass: Harvard University Press.
[5] Bateman, T. S., and Organ, D. W. (1983). Job Satisfaction and the Good Soldier: The Relationship Between
Affect and Employee Citizenship. Academy of Management Journal. Vol. 26 (4), pp. 587–595. [6] Bies, R.J., and Tripp, T.M. (1993). Revenge in Organizations: The Good, the Bad, and the Ugly. In RW.
Griffins, A. O’Leary-Kelly and J.M. Collins (Eds.) Dysfunctional Behavior in Organizations: Violent and
Deviant Behavior. pp. 49-68. Stanford, CT: JAI Press. [7] Blau, P., and Scott, M.K. (1962). Exchange and Power in Social Life. New York: Wiley.
[8] Bowie, C.E. (1982). Whistle Blowing: Literature and Resource Materials. Public Administration Review, Vol.
43, No. 3, pp. 271-276.
[9] Brief, A.P., and Motowidlo, S. (1986). Pro social Organizational Behaviors. Academy of Management Review. Vol. 11, pp. 710-725.
[10] Callahan, E.S., and Dworkin, T.M. (1992). Do Good and Get Rich: Financial Incentives for Whistle-blowing
and the False Claims Act. Villanova Law Review. Vol. 37. pp. 273-336. [11] Chung, J., G. Monroe, and Thorne, L. (2004). An Examination of Factors Affecting External and Internal
Whistle-blowing By Auditors. Working Paper. York University, Toronto, CN.
[12] Cirka, C.C. (1997). A Piece of the Puzzle: Employee Responses to Control Practices and Effects on Firm
Control Strategy. Philadelphia, PA: Temple University Press. [13] Cohen-Charash, Y., and Spector, P. E. (2001). The Role of Justice in Organizations: A Meta-Analysis.
Organizational Behavior and Human Decision Processes. Vol. 86, pp. 278–321.
[14] Covin, J.G., and Slevin, D.P. (1991). A Conceptual Model of Entrepreneurship. Homewood, IL: Irwin. [15] Dandekar, N. (1990). Can Whistle-blowing be Fully Legitimated? A Theoretical Discussion. Business &
Professional Ethics Journal. Vol. 10. pp. 89-108.
[16] Davilia, T. (2000). An Empirical Study of the Drivers of Management Control System Design in New Product Development. Accounting, Organizations and Society. Vol. 25 (4). Pp. 383-409.
[17] Deborah, J.O. (2006). Whistle Blowing and Morality. Journal of Business Ethics (2008), Vol. 81. Pp. 579–585.
[18] Demski, J., and Feltham, G. (1978). Economic Incentives in Budgetary Control Systems. Accounting Review.
Vol. 53. pp. 336-359. [19] Ding, A.L., and Ponemon, L. (1995). Internal Auditors’ perceptions of Whistle-blowing and the Influence of
Moral Reasoning: An Experiment. Auditing: A Journal of Practice & Theory. Vol 10 (2):, pp. 1-15.
[20] Donaldson, D.J. (2001). A comparison of the ethical behavior of American, French, and German managers. Columbia Journal of World Business (Winter), pp. 87-95.
[21] Dozier, J.B. and Miceli, M.P. (1985). Potential Predictors of Whistle-Blowing: A Prosocial Behavior
Perspective. The Academy of Management Review. Vol. 10, No. 4. pp. 823-836. [22] Dworkin, T. M. and Baucus, M. S. (1998). Internal vs. External Whistleblowers: A Comparison of
Whistleblowing Processes. Journal of Business Ethics. Vol. 17 (12). pp. 1281-1298.

INDIAN JOURNAL OF MANAGEMENT SCIENCE (IJMS) EISSN 2231-279X – ISSN 2249-0280
www.scholarshub.net Vol.– III, Issue – 3, July 2013
31
[23] Dworkin, T.M., Near, J.P., and Callahan, N.P. (1995). A Better Statutory Approach to Whistle-Blowing.
Business Ethics Quarterly. Vol. 7, No. 1, pp. 1-16.
[24] Eisenhardt, K.M. (1985). Control: Organizational and Economic Approaches. Management Science, Vol. 31, No. 2, pp. 134-149.
[25] Eskew, D. E. (1993). The Role of Organizational Justice in Organizational Citizenship Behavior. Employee
Responsibilities and Rights Journal 6(3), 185–194. [26] Ferner, A. (2000). The Underpinnings of Bureaucratic Control Systems: Human Resource Management in
European Multinationals. Journal of Management Studies. Vol. 37 (4). pp. 521-539.
[27] Floyd, S.W., and Lane, P.J. (2000). Strategizing Throughout the Organization: Management Role Conflict in
Strategic Renewal. Academy of Management Review. Vol. 25 (1). pp. 18-33. [28] Galbraith, Jay. (1975). Designing Complex Organizations. Organization Development Series. Addison-
Wesley, Reading, Mass.
[29] Geary, J.F., and Dobbins, A. (2001). Team working: A New Dynamic in the Pursuit of Management Control. Human Resource Management Journal. Vol. 11 (1). pp. 56-71.
[30] Goldberg, V. P. (1987). Quantity and Price Adjustment in Long-term Contracts: A Case Study of Petroleum
Coke. Journal of Law and Economics. Vol. 30. pp. 369-398. [31] Govindarajan, V. (1988). A Contingency Approach to Strategy Implementation at the Business-Unit Level:
Integrating Administrative Mechanism With Strategy. Academy of Management Journal. Vol. 31 (4). pp. 828-853.
[32] Graham, J. W. (1986a). Organizational Citizenship Informed by Political Theory. Paper Presented at the
Annual Meeting of the Academy of Management, Chicago, IL. [33] Graham, J. W. (1986b). Principled Organizational Dissent: A Theoretical Essay. In Research in
Organizational Behavior. Vol. 8, Ed. L. L. Cummings and B. M. Staw. Greenwich, CT: JAI Press.
[34] Greenberg, J. (1993). Anxiety Concerning Social Exclusion: Innate Response or One Consequence of the Need for Terror Management. Journal of Social and Clinical Psychology. Vol. 9, pp. 202-213.
[35] Greenspan, A. (2008). The Age Of Turbulence: Adventures In A New World. New York: The Penguin Press.
[36] Griener, L. (1972). Evolution and Revolution as Organization Grow. Harvard Business Review. Vol. 50 (4), pp. 37-46.
[37] Hair, J. F., R. E., Anderson, R. L. Tatham, and Black, W. C. (1998). Multivariate Data Analysis. 5th edition.
Upper Saddle River, NJ: Prentice Hall.
[38] Harrison, G.L., and McKinnon, J.L. (1999). Cross Cultural Research in Management Control System Design:
A Review of the Current State. Accounting, Organizations and Society. Vol. 24 (5). pp. 78-101. [39] James, W. (1984). Principles of Psychology. Vol. 1. New York: Dover Publication.
[40] Katz, D. (1964). The motivational basis of organizational behavior. Behavioral Science. Vol. 9, pp. 131-146.
[41] Kerlinger, F.N. (1986). Foundations of Behavior Research. 2nd
Edition. Fortworth: Harcourt College Publishers. [42] Langfield-Smith, K. (1997). Management control systems and strategy: a critical review, Accounting,
Organizations and Society, vol. 22, no. 2, pp. 207-232.
[43] Lawrence, P. R., and Lorsch, J.W. (1967). Organization and Environment: Managing Differentiation and
Integration. Dissertation: Harvard University, Graduate School of Business Administration, Boston, Mass. [44] Lepine, J.A., and Van Dyne, L. (2002). Foundations of Behavior Research. 2
nd Edition. Fortworth: Harcourt
College Publishers.
[45] Lowe, G.A., and Machin, S.C. (1988). Whistle Blowers in the Federal Civil Service: New Evidence of the Public Service Ethic. Journal of Public Administration Research and Theory, Vol. 8, No. 3. Pp. 413-439.
[46] Machin, L.J. (1988). New Perspectives in Management Control. London UK: Macmillan Press.
[47] Malhorta, Naresh K. (2004), Marketing Research: An Applied Orientation. 4th Edition, New Jersey: Prentice
Hall, Inc.
[48] Malin, M.H. (1983). Protecting the Whistle-blower From Retaliatory Discharge," University of Michigan
Journal of Law Reform. Vol. 16. pp. 277-318.
[49] March, J., and Simon, H. (1958). Organizations. New York: Wiley. [50] Marginson, D.E. (2002). Management Control System and Their Effects on Strategy Formulation at Middle
Management Levels: Evidence for a UK Organization. Strategic Management Journal. Vol. 23 (11). pp. 1019-1031.
[51] Mayo, D. (1945). Equity, Equality, and Need: What Determines Which Value Will be Used as the Basis of Distributive Justice? Journal of Social Issues. Vol. 31. pp. 137-150.
[52] Merchant, K.A., and Van der Steede, W.A. (2007). Management Control Systems – Performance,
Measurement, Evaluation and Incentives. 2nd ed., Essex: Prentice Hall.

INDIAN JOURNAL OF MANAGEMENT SCIENCE (IJMS) EISSN 2231-279X – ISSN 2249-0280
www.scholarshub.net Vol.– III, Issue – 3, July 2013
32
[53] McKnight, D.H., Ahmad, S., and Schroeder, R.G. (2001). When Do Feedback, Incentive Control, and
Autonomy Improve Morale? Journal of Managerial Issues. Vol. 13 (4). pp. 33-52.
[54] Miceli, M.P., and Near, J.P. (1985). The Relationships among Beliefs, Organizational Position, and Whistle-Blowing Status: A Discriminant Analysis. The Academy of Management Journal, Vol. 27, No. 4, pp. 687-705.
[55] Miceli, M.P. ,and Near, J.P. (1992). Who Blows the Whistle and Why. Industrial and Labor Relations Review.
Vol. 45, No. 1, pp. 113-130. [56] Miceli, M. P., and J. P. Near. (1994). The Relationship Among Beliefs, Organizational Position, and Whistle-
blowing Status: A Discriminant Analysis. Academy of Management Journal. Vol. 27. pp. 687-705.
[57] Moorman, R. H.(1991). Relationship Between Organizational Justice and Organizational Citizenship
Behaviors: Do Fairness Perceptions Influence Employee Citizenship?. Journal of Applied Psychology. Vol. 76(6), pp. 845–855.
[58] Moorman, R. J., B. P. Niehoff, and D. W. Organ. (1993). Treating Employees Fairly and Organizational
Citizenship Behaviors: Sorting the Effects of Job Satisfaction, Organizational Commitment, and Procedural Justice. Employee Responsibilities and Rights Journal. Vol. 6(3). pp. 209–225.
[59] Nader, R., Petkas, P.J., and Blackwell, K. (Eds.). (1972). Whistle-Blowing: The Report of the Conference on
Professional Responsibility. New York: Grossman Publishers. [60] Near, J.P., and Miceli, M.P. (1985). Organizational Dissidence: The Case of Whistle-Blowing. Journal of
Business Ethics. Vol. 4, pp.1-16.
[61] Niehoff, B. P., and R. H. Moorman. (1993). Justice as a Mediator of the Relationship Between Methods of
Monitoring and Organizational Citizenship Behavior. Academy of Management Journal. Vol. 36. pp. 527-556. [62] Organ, D. W. (1988). Organizational Citizenship Behavior: The Good Soldier Syndrome. Lexington Books,
Lexington, MA.
[63] Organ, D. W. (1990). The Motivational Basis of Organizational Citizenship Behaviors. in L. L. Cummings and B. M. Straw (eds.), Research in Organizational Behavior (JAI, Greenwich, CT), pp. 43–72.
[64] Otley, P.R.. (1999). Organizational Justice and Human Resource Management. Thousand Oaks, CA: Sage Publications.
[65] Ouchi, W.G. (1979). A Conceptual Framework for the Design of Organizational Control Mechanism.
Management Science. Vol. 25, No. 9. [66] Ouchi, W.G. (1980). Markets, Bureaucracies, and Clans. Administrative Science Quarterly. Vol. 25, pp. 129-141.
[67] Pfeffer, Jeffrey. (1982). Organizations and Organization Theory. Stanford University.
[68] Pinchot, G. (1993). Intrapreneuring. New York, NY: Harper and Row. [69] Podsakoff, P. M., and Organ, D. W. (2000). Self-Reports in Organizational Research: Problems and Prospects.
Journal of Management. Vol. 12(4). Pp. 531–544.
[70] Posakoff, P. M., and MacKenzie, S. B. (1993). Organizational Citizenship Behaviors and Sales Unit Effectiveness’, Journal of Marketing Research. Vol. 31(3). Pp. 351–363.
[71] Porter, G. L. (2003). Whistleblowers a rare breed. Strategic Finance. Vol. 85 (2). Pp. 50-53.
[72] Robinson, S. L., and Morrison, E. W. (1995). Psychological Contracts and OCB: The Effect of Unfulfilled
Obligations on Civic Virtue Behavior. Journal of Organizational Behavior. Vol. 16. (3). pp. 289-298. [73] Sanyal, R., and Guvenli, T. (2000). Introducing Management Control Techniques in an Economy in
Transition. Mid Atlantic Journal of Business. Vol. 36 (4). pp. 1-16.
[74] Schnake, M., Dumler, M.P., and Cochran, D.S. (1993). The Relationship Between Traditional Leadership, Super Leadership, and Organizational Citizenship Behaviors. Group and Organization Management. Vol. 18, pp. 352-365.
[75] Schendel, L.S., and Hofer, G.W. (1979). Whistle-Blowing: Professionals' Resistance to Organizational
Authority. Social Problems. Vol. 28, No. 2, pp. 149-164. [76] Sekaran, U. (2003). Research Methods For Business. 4
th Edition. New York: John Wiley And Sons, Inc.
[77] Shih, M.S. and Yong, L.C. (2001). Relationship of Planning and Control Systems With Strategic Choices: A
Closer Look. Asia Pasific Journal of Management. Vol. 18 (4). pp. 481-494.
[78] Simon, H. A. (1945). Rationality as Process and as Product of Thought. American Economic Review. Vol. 68, pp. 1-16. [79] Simons, H.A. (1994). Ethical Decision Making in Organizations: A Management Employee- Organization
Whistleblowing Model. Research on Accounting Ethics. Vol. 1. pp. 291-313.
[80] Simons, T. L. (1995). Behavioral Integrity: The Perceived Alignment Between Managers’ Words and Deeds as a Research Focus. Organization Science. Vol. 3(1), pp. 18–35.
[81] Smith, C. A., D. W. Organ, and Near, J. P. (1983). Organizational Citizenship Behavior: Its Nature and
Antecedents. Journal of Applied Psychology. Vol. 68(4). pp.653–663.

INDIAN JOURNAL OF MANAGEMENT SCIENCE (IJMS) EISSN 2231-279X – ISSN 2249-0280
www.scholarshub.net Vol.– III, Issue – 3, July 2013
33
[82] Tannenbaum, A. (1988). Control in Organizations. McGraw-Hill, New York.
[83] Thiesen, J. D. (1998). The Use of Nonparametric Methods in Tax Research. The Journal of the American
Taxation Association. Vol. 15 (1). pp. 110-120. [84] Thomas, A.B. (1988). Does Leadership Make a Difference to Organizational Performance? Administrative
Science Quarterly, Vol. 33, pp. 388-400.
[85] Timmons, C.N. (1999). Adelphia Founder and One Son are Found Guilty; Jury Remains Deadlocked on Second Son, Acquits Former Assistant Treasurer. Wall Street Journal (July 9): A1.
[86] Trevino, L. K., and Weaver, G. R. (2001). Organizational Justice and Ethics Program “Follow- Through”:
Influences of Employees’ Harmful and Helpful Behavior. Business Ethics Quarterly. Vol. 11 (4). pp. 651-671.
[87] Van de Ven, A., and Drazin, R. (1985). Alternative Forms of Fit in Contingency Theory. Administrative Science Quarterly. Vol. 30 (5). pp. 514-539.
[88] Van der Stede, W. (2001). Measuring Tight Budgetary Control. Management Accounting Research. Vol. 12
(1). pp. 119-137. [89] Whitley, J. H. (1999). Whistle-Blowing. Science New Series. Vol. 240, No. 4858 pp. 1389-1411.
[90] Wiharto, B.W. (2002). Mengukur Kontribusi SDM dalam Pencapaian Strategi Perusahaan. Manajemen,
Desember, pp. 33-34. [91] Winfield, M. (1994). "Whistle-blowers as Corporate Safety Net" in Whistle-blowing: Subversion or
Corporate Citizenship, G. Vinten, ed. (New York: St. Martin's Press), pp. 33-41.
[92] Wood, Robert, and Bandura, Albert. 1989. Social Cognitive Theory of Organizational Management. Academy
of Management Review, Vol. 14, No. 3, pp. 361-384. [93] Zikmund, W. G. (2000). Business Research Method. 6
th edition. Forth Worth: The Dryden Press.
****

INDIAN JOURNAL OF MANAGEMENT SCIENCE (IJMS) EISSN 2231-279X – ISSN 2249-0280
www.scholarshub.net Vol.– III, Issue – 3, July 2013
34
AGRICULTURAL TFP AND R&D SPENDING IN IRAN
Solmaz Shamsadini,
Ph.D. Student,
Department of Agricultural Economics,
Science and Research Branch, Islamic Azad University, Tehran, Iran.
Saeed Yazdani,
Professor,
Department of Agricultural Economics,
Science and Research Branch,
Islamic Azad University, Tehran, Iran.
Reza Moghaddasi,
Assistant Professor,
Department of Agricultural Economics,
Science and Research Branch,
Islamic Azad University, Tehran, Iran
ABSTRACT
Investing in research and development spending (R&D) affects total factor productivity (TFP).
Recently new theories of economic growth have emphasized the relationship between R&D and TFP
and also identified a number of channels through which a country’s R&D affects TFP of its trade
partner. This study seeks to estimate the effect of agricultural R&D and education spending and some other factors on agricultural TFP in Iran during 1971 to 2011. Agricultural TFP is calculated using
Kendrick Index and the model is estimated by OLS method using E-Views 7.0.
all explaining variables in the model, effect on agricultural productivity in different lags positively with 5% confidence. The optimum lag is determined using Akaike information, Schwarz and Hannan-
Quinn criterion. The results show elasticity of R&D spending in agriculture, education expenditure in
agriculture, government investing in agriculture and rainfall is 0.13 by 5 lags, 0.10 by 2 lags, 0.14 by 1
lag and 0.17 at the same time in agriculture TFP function. R&D spending in other sectors (except agriculture) and import of capital inputs in agriculture are contained in the model as research spill-over.
The elasticity of these two factors is estimated 0.09 by 5 lags and 0.04 by 2 lags. Rainfall with highest
elasticity (0.17) is the most effective factor in agriculture TFP model.
Keywords: Agricultural Research and Development, Total Factor Product, spill-over.

INDIAN JOURNAL OF MANAGEMENT SCIENCE (IJMS) EISSN 2231-279X – ISSN 2249-0280
www.scholarshub.net Vol.– III, Issue – 3, July 2013
35
Introduction:
Productivity growth is an important consideration in agriculture. One way to stimulate the productivity growth rate is to
increase the rate of spending in agricultural R&D.
Recently a large body of research has considered the importance of research and development (R&D) in influencing output
growth and total factor productivity. Most of these literatures provide theoretical and empirical models that cumulative R&D
spending is the main engine of technological progress and productivity growth (see Aghion and Howitt (1998), Grossman and
Helpman (1991) and Romer (1990).
R&D investments are still central to agricultural productivity growth. Alston et al. (1999) in the introduction of their recent
book on the theme underline that “Throughout the twentieth century improvements in agricultural productivity have been
closely linked to investments in agricultural R&D and to policies that affect agricultural R&D”.
Pardy, P. G., et al. (2012) showed Countries with larger (smaller) agricultural economies are likely to invest more (less) in
agricultural R&D simply because of a congruence effect (Pardey, Kang and Elliott 1989) and concluded that the intensity at
which the Asia & Pacific region invests in agricultural R&D has grown much more modestly from 0.43 percent of agGDP
(agriculture share of GDP) in 1960 to 0.52 in 2009. While this region has sustained growth in agricultural R&D spending at a
comparatively rapid pace, averaging 5.1 percent per year since 1960, agricultural output has grown at reasonably rapid rate as
well (3.71 percent per year). Thus the growth in spending on agricultural R&D has more than kept pace with the growth in the
value of output, such that the region’s research intensity has inched up over time and increasingly so after the mid-1990s.
Given the importance of agricultural R&D to the growth of the sector, many works have been devoted to reporting measures of
the returns to domestic agricultural R&D (see recently Esposti (2000) and for a survey Alston et al. (2000). But in a world
where the international trade of agricultural products and the dissemination of knowledge are widespread, domestic agricultural
productivity depends not only on domestic R&D but also on foreign R&D efforts. This point has been fully recognised, among others, by Hayami and Ruttan (1985) where they emphasise that a country can acquire substantial gains in agricultural
productivity by borrowing advanced technology which exists in other countries.
An empirical evidence has been provided by Coe and Helpman’s (1995) seminal contribution where they find that accumulated
spending on R&D by a country and by its trade partners helps to explain the growth of total factor productivity.
Coe, D. T. (2008) considered that the importance of international R&D spillovers has long been recognized, although estimates
of their empirical significance at the macroeconomic level were often elusive. The search for R&D spillovers across countries
received a boost in the 1990s with the development of new growth models by Romer (1990), Grossman and Helpman (1991),
and Aghion and Howitt (1992), and by the application of the ideas from these models together with new empirical techniques
to expanded data sets by Coe and Helpman (1995) and Coe, Helpman, and Hoffmaister (1997).
Gutierrez, L. and Gutierrez, M. M. (2005) analyses, within the new growth theory framework and using panel co-integration
techniques, the effect of agricultural international technological spillovers on total factor productivity growth for a sample of 47 countries during the period 1970-1992. They concluded that the United States R&D capital stock has the strongest effect on
total factor productivity of its trade partners. A 1 per cent increase in the R&D capital stock in this country increases total factor
productivity by an average of 0.087 per cent for the full sample of 47 countries. The effect is stronger for the subset of
countries located in temperate zones, where the elasticity rises to 0.123, whereas tropical countries are less influenced by R&D
in the United States. European countries are well integrated. A 1 per cent increase in the R&D capital stock in France increases
total factor productivity in Italy by 0.09 per cent, in the Netherlands by 0.14 per cent, in UK by 0.08 per cent. Japan and the
USA are less influenced, with elasticities respectively of 0.003 and 0.005 per cent. Similar effects are easily verifiable for an
increase in R&D capital stock in Italy, in the Netherlands and in UK.
Khaksar, H. and Karbasi, A. (2005) have computed agricultural TFP of Iran during 1978-2002 using turn-quist Index and considered
the impact of agricultural R&D spending on it using Almon Distributing Lag. They concluded that if agriculture R&D spending
increases 1 percent, agriculture TFP will increase 0.28 percent by 5 lags in long-run and the impact will remain to 3 years.
Bagherzadeh, A. and Komeijani, A. (2010) considered the impact of agriculture R&D spending on agricultural TFP of Iran during 1979-2009 using Almon Distributing Lag and concluded that the long-run elasticity of this factor is 0.17 percent and rate of return of
investing in agricultural R&D spending is 0.36 percent that is much lower comparing the world mean rate (0.51) [7].
Mehrabi, H. and Javdan, E. (2011) have investigated the relationship between agricultural R&D expenditure and agricultural
TFP for Iran during 1974-2007 using Auto Regression Distributing lag model. They computed agricultural TFP using
Kendrick’s Index for selected data and concluded that R&D spending has positive significant effect on TFP in both long-run
and short run in agriculture sector. That is 1 percent increase in agricultural R&D spending will increase agricultural TFP 0.1
percent. They suggest R&D spending is one of the main factors to improve agriculture growth.
Agricultural R&D spending in Iran:
Agricultural research and the agricultural extension organization in Iran were inaugurated in 1930. This organization began to
investigate weather conditions, reallocation of cultivated crops, introducing new production methods and new efficiency factors and promoting new agricultural technologies. The Government determined financial expenditure annually. As Table 1

INDIAN JOURNAL OF MANAGEMENT SCIENCE (IJMS) EISSN 2231-279X – ISSN 2249-0280
www.scholarshub.net Vol.– III, Issue – 3, July 2013
36
shows, expenditure for agricultural research increased from 26% to 50% during the period. Spending on agricultural education
was mostly at college level and increased over the period. Total agricultural research expenditure had negligible growth (1 per
cent per year) from 1980 to 1987 because of the circumstances induced by war.
Table1: Averages of Total Research Expenditure, Agricultural Research Expenditure and
agricultural education Expenditure in Iran in 1971- 2010 (million Rials)
Year Research expenditures Agricultural research expenditures Agricultural education expenditures
1971-1980 8797.26 2366.82 7385.64
1981-1990 34097.64 13525.26 12944.39
1991-2000 505272.5 255254.7 110335.8
2001-2011 2748634.7 1385762.74 792654.3
Iran Annual budget
Methodology:
This section presents a theoretical model that links TFP to the spending on R&D in agricultural sector as Gutierrez et.al (2005)
are considered. Assume that agricultural output is produced in a competitive environment and has a Cobb-Douglas production form that contains two important factors; Labor and Capital; and also non durable intermediate inputs.
, α, β>0 , α+β<1 (1)
Where Y is agricultural output, A is a constant, K is capital and L is the amount of labor used to product the final agricultural
output. Output is a function of the Xj non durable intermediate inputs, numbered from 1 to N, used in the production process.
From equation1, we not first that the production function shows diminishing marginal productivity for each input K,L and Xj
and constant returns to scale in all inputs together. Second, the marginal productivity of intermediate input j is dependent of the
quantity employed of intermediate input j. thus the innovation of new types of intermediate inputs do not tend to make any
existing types obsolete. The technological progress can be seen as improvements in the number N of intermediate inputs and
we assume that this advance requires purposive effort in the form of R&D.
Defining the price of intermediate input as pj and setting output price py=1, from profit function maximization we can derive
the demand for input j.
(2)
In these models, the inventor of new intermediate goods is usually seen as a monopolist who retains a monopoly right over the
production and sale of the good that uses his/her design. Assuming a marginal unit cost to produce the intermediate goods, a
monopolist will set the price maximizing the following expression.
Max (Pj-1)Xj (3)
Substitiuting (2) in (3), the solution for monopoly price is
Pj = P = [1/(1-α-β)]>1 (4)
We can now introduce (4) in (2) and utilizing the result in (1) we end with the following production function
(5)
Where a=α/(α+β), b=β/(α+β) and by definition (α+β)=1, i.e. the production function shows constant returns to scale on the two
inputs K and L. the variable F, usually defined as total factor productivity, can be written as
(6)
Given α and β as well as A values, it is clear from the above expression that in this model total factor productivity depends on the
available assortment of intermediate inputs N: the more intermediates are used in production, the higher is total factor productivity.
If the flow of these intermediate goods is proportional to real spending on research and development Re, we have that
(7)
Where δ is a parameter that links, in each period, the growth rate of the number of intermediate inputs to the R&D spending.
We therefore have a relationship between current total productivity and cumulative R&D investment. This is central to the
innovation based endogenous model and our empirical specification.
Until now innovation has been associated with an expansion in the range of intermediate products used in the production process. We
can think of this activity as basic innovation which means new kinds of goods or method of production. Aghion and Howitt (1992)
and Grossman and Helpman (1991, Ch. 4) also introduce innovation as improvements in the quality of intermediate inputs.
If we assume that in each period the improvements in the quality of products are proportional to real spending in R&D, then a
link between total factor productivity and cumulative R&D expenditure can be found once more.

INDIAN JOURNAL OF MANAGEMENT SCIENCE (IJMS) EISSN 2231-279X – ISSN 2249-0280
www.scholarshub.net Vol.– III, Issue – 3, July 2013
37
Agricultural Total Factor Productivity:
Kendrick Index:
Kendrick's index of total factor productivity for the case of value added as output, and two inputs can be written as:
(8)
Where TFP, VA, L, K and E stand for total factor productivity, value added, labor, capital stock and energy use in agriculture
sector respectively. α, β and δ denote the elasticity of labor, capital stock and energy use with respect to value added
respectively in the base year.
Naturally we have
constancy of factor elasticities over time. The assumption of constant returns has recently received empirical support from Mundlak et al. (1997).
Parametric approach consists in econometric estimation of production functions to infer contributions of different factors and
of an autonomous increase in production over time, independent of inputs. This later increase which is a shift over time in the
production function can be more properly identified as technological progress. It is one of the factors underlying productivity
growth. Cobb-Douglas Specification is applied for agriculture production function:
VA=ALαK
βE
δ (9)
Where, VA, L, K and E refer to value added, labor, capital stock and energy use in agriculture sector. α, β and δ give factor
shares respectively for labor, capital stock and energy use in agriculture. A describes initial conditions. Log-linear form this
function can be written as:
lnVA = lnA + αlnL + βlnK +δlnE (10)
where lnVA, lnL, lnK and lnE present logarithm of value added, labor, capital stock and energy use in agriculture.
Finally, agriculture TFP function is estimated using OLS method. 6 explaining factors are contained in the model to be estimated how much they can affect agriculture TFP in selected period of time. The model is written as:
ln(TFP)t= f {ln(Re)t,ln(Ed)t, ln(OR)t, ln(Imca)t, ln(Ra)t, ln(Aginv)t } (11)
Equation1 represents the total factor productivity function in the agricultural sector that has been computed by the Kendrick’s
index for the selected time period and contains three factors; capital stock, labor and energy use. In this equation, lnTFP, lnRE,
lnEd, lnRa, and lnAginv present respectively logarithm of agriculture total factor productivity, agricultural research and
development spending, agricultural education expenditure, rainfall and government investing in agriculture sector respectively.
Two other factors are also contained in the model to show research spill-over effects on agriculture sector; lnOR and lnImca
that represent logarithm of research and development expenditure in other sectors (except agriculture) and import of
agricultural inputs respectively. The following other studies have also investigated the effects of these variables on agricultural
TFP Ali. S(2004), Huffman. W. E and Evenson. R. E (2001), Kiani. A. K, Iqbak. M and Javad. T (2008), . Rosegrant, M. W.
and Evenson, R. E. (1995).
Data:
All the variables used in this study are collected as time series data for 1971 to 2011. Agricultural TFP is calculated using the
Kendrick’s Index that contains agricultural value added and three important factors; agricultural capital stock, labor and energy use.
Data for agricultural value added is collected from the Statistics Center of Iran. Data for agricultural capital stock and labor is
obtained from Central Bank of Iran for selected time period. Data for energy use in agriculture is obtained from Energy balance
sheet of Iran. Data for research and development expenditure in agriculture and other sectors, and also spending on agricultural
education are collected from annual budget books of Iran. Government investment in agriculture and import of capital inputs in
agriculture sector data is collected from Statistics Center of Iran. Rainfall data is collected from aerology website.
Results:
First step of using data for variables in the model is to test the stationary because we have used time series data for all variables. Augment
Dicky-Fuler test (ADF), Philips-Peron test (P-P) and KPSS test are applied for the variables and the results are shown in table3.
Table3. Testing stationary using ADF, P-P and KPSS tests.
Logarithm of Variable Abbreviated name ADF test P-P test KPSS test Integration degree
Agricultural capital stock lnK -6.09 -6.13 0.08 I(1)
Agricultural labor lnL -3.58 -6.07 0.13 I(1)
Energy use in agriculture lnE -4.68 -4.81 0.18 I(1)
Agriculture value added lnVA -8.05 -12.94 0.3 I(1)
Agricultural total factor productivity lnTFP -2.37 -6.08 0.09 I(1)
Research and development spending
in Agriculture lnRe -5.26 -6.27 0.09 I(1)
Education spending in agriculture lnEd -7.65 -7.59 0.1 I(1)

INDIAN JOURNAL OF MANAGEMENT SCIENCE (IJMS) EISSN 2231-279X – ISSN 2249-0280
www.scholarshub.net Vol.– III, Issue – 3, July 2013
38
Research and development spending
in other sectors lnORe -7.89 -7.89 0.19 I(1)
Import of capital goods in
Agriculture lnImca -4.24 -4.05 0.06 I(0)
Government investiment in
agriculture sector lnAginv -7.52 -7.57 0.06 I(1)
Raining lnRa -6.39 -6.48 0.07 I(0)
Source: Calculated by the author.
As results in table 3 shows, logarithm of Import of capital goods in Agriculture and rainfall are stationary at level and logarithm
of Agricultural capital stock, Agricultural labor, energy use in agriculture, Agricultural total factor productivity, Research and
development spending in Agriculture, Education spending in agriculture and Research and development spending in other
sectors are stationary by first difference.
As Engle-Granger and Sargan and Bhargava (1983) indicate, we can be use variables that they are not in the same level of stationary, if the residuals are stationary and the variables have long run relationship. So we have to analysis Engle-Granger test
and co-integration regression Durbin-Watson tests on the residuals of the models that will be regressed in last section
(Noferesti, 1995).
Agriculture Total Factor Productivity:
For computing agricultural TFP, production function must be estimated as presented in previous section. A Cobb-Doglaus
function including agriculture capital stock, labor and energy use in agriculture is estimated considering constant return to scale
in this part. The results are shown in table 4. The coefficients present the production elasticity of each factor.
Table4: Agriculture Cobb-Daglaus production function estimation
lnE lnK lnL Constant Parameters
0.15 0.17 0.67 -3.67 Coefficient
0.07 0.04 0.08 1.14 Std-Error
2.10 4.00 7.92 -3.19 t-Statistic
R2: 0.98 h-Durbin-Watson:1.96
Source: Calculated by the author
As results in table 4 shows, all coefficients are positive and significant in 5% confidence. Agricultural labor is the most
effective in estimated production function. As the production elasticity of labor, capital stock and energy use in agriculture is
0.67, 0.17 and 0.15 percent respectively. Sum of these elasticities equals 1 and they can be used as factor share of value added for computing Kendrick total factor productivity index.
Agricultural Total Factor Productivity is calculated for 1971 to 2011 using Kendrick’s Index. The results are shown in table 5.
Table5. Agriculture Total Factor Productivity in Iran (Kendrick’s Index).
TFP Year TFP Year TFP Year TFP Year TFP Year TFP Year
3.66 2006 3.48 1999 2.76 1992 2.07 1985 2.24 1978 1.88 1971
3.80 2007 3.56 2000 3.10 1993 2.09 1986 2.19 1979 1.95 1972
3.58 2008 3.44 2001 3.23 1994 1.97 1987 2.28 1980 2.05 1973
3.68 2009 3.71 2002 3.57 1995 2.12 1988 2.26 1981 2.14 1974
3.76 2010 3.76 2003 3.69 1996 2.03 1989 2.26 1982 2.28 1975
3.86 2011 3.52 2004 3.63 1997 2.38 1990 2.21 1983 2.36 1976
- 2012 3.62 2005 3.84 1998 2.48 1991 2.21 1984 2.36 1977
Source: Calculated by the author
In the last part, equation 11 is estimated to determine the effective factors that effect on agriculture TFP. OLS method is applied
to estimating the model using E-Views 7.0. The results are shown in table 6.

INDIAN JOURNAL OF MANAGEMENT SCIENCE (IJMS) EISSN 2231-279X – ISSN 2249-0280
www.scholarshub.net Vol.– III, Issue – 3, July 2013
39
Table6: Estimated coefficients of rural poverty index of Iran
Regsessor Coefficient Standard Error t-statistic
Constant 1.97 0.22 8.95
lnRe(-5) 0.13 0.03 4.09
lnEd(-2) 0.10 0.04 2.60
lnORe(-5) 0.09 0.04 2.14
lnImca(-2) 0.04 0.02 2.49
lnRa 0.17 0.06 2.77
lnAgInv(-1) 0.14 0.04 3.77
R-squared :0.95 Durbin-Watson :1.71
Source: Calculated by the author
As table 6 shows, all explaining variables in the model, effect on agricultural productivity in different lags positively with 5%
confidence. The optimum lag is determined using Akaike information, Schwarz and Hannan-Quinn criterion. All the variables
used in the model are in logarithm form, so the coefficients are presented as the elasticity of each factor on dependant variable.
According to table 6, rainfall is the most effective factor in agricultural TFP, that is, 1 percent increase in rainfall (millimeter
per year) will increase agriculture TFP 0.17 percent. Bagherzadeh, A. and Komeijani, A. (2010) obtained a 0.18 percent elasticity of rainfall in agriculturae TFP model in Iran. It is obvious enhancement in raining prepares better condition for
cropping. In a country like Iran that is facing droughts some years a major problem is irrigating agricultural lands and rainfall
plays an important role in production process. Storing water in dams is suggested to such countries to provide a favorable
condition for agriculture.
1 percent increase in agricultural R&D, will enhance agricultural TFP 0.13 percent by 5 lags. As Alston, J. M. and Pardey, G. P.
(2007) are considered, best lag period for R&D spending is 2 to 7. Khaksar Astaneh, H. and Karbasi, A. (2005) and Thirtle, C. ,
Lin, L. and Piesse, J. (2003) obtained the best lag of R&D efficiency is 5 lags. Bagherzadeh, A. and Komeijani, A. (2010)
concluded agricultural R&D spending affects TFP by 6 lags in Iran. Research and development spending does not effect on
agricultural growth and TFP immediately, but R&D outputs must be learnt, accepted and applied by farmers.
A large amount of new technologies used in agriculture, are borrowed from developed countries that are trade partners. While
we have contained these foreign technologies in the model as spill-over; import of capital inputs in agriculture. Spending on Import of such capital goods is borrowing and using knowledge and more efficiency factors in production process. That is, 1
percent increasing in import of capital inputs in agriculture sector will improve agricultural TFP 0.04 percent by 2 lags in Iran.
Importing modern agricultural machines has a large share of this factor and usually is accepted by farmers after 1 year to be
used for next cropping year.
Another spill-over factor that is contained in the model is R&D spending in other sectors (except agriculture). Because of the
relationship between agriculture sector with other economic sectors; Industry, Services and Oil sector, any improvement in
these sector may affect agricultural input productivity. As result show, 1 percent increase in R&D spending in other economic
sectors will increase agricultural TFP 0.09 percent by 5 lags. R&D spending in agriculture is more effective than other sectors
on agricultural input productivity.
Education spending in agriculture is one of the most important factors that cause improvement in agriculture and input
productivity. New technologies are often not accepting by rural farmers immediately. Teaching, training and extending the
usages of modern findings and research outputs plays the impotent role in applying the new technology in rural agriculture. As results show, 1 percent increase in education expenditure in agriculture will increase agricultural TFP 0.10 percent after 2 years.
Research outputs are not usable without training and extending to the farmers and 2 lags show the acceleration applying new
technologies by training farmers.
Last factor that is contained in the model is government investment in agriculture and is presented positive effectively.
Agricultural TFP will increase 0.14 percent, if government increases investing in agriculture 1 percent after 1 year. Mehrabi,B.
H. and Javdan, E. (2011) shows a 0.17 percent elasticity for this factor in TFP model in long-run in agriculture sector in Iran.
Totally, we have tested the stationary of residual of the estimated model. The results are shown in table 7.
Table7: Engel-Granger and CRDW test.
Dependent Variable Engle-Granger test CRDW
LTFP -4.23** 2.84*
The null hypothesis has a unit root at 1% (**) and 5% (*).
Source: Calculated by the author
According to table7, residual time series of the previous estimated model is stationary in level and as Engle-Granger and Sargan and Bhargava (1983) indicate, the results are reliable .

INDIAN JOURNAL OF MANAGEMENT SCIENCE (IJMS) EISSN 2231-279X – ISSN 2249-0280
www.scholarshub.net Vol.– III, Issue – 3, July 2013
40
Conclusions:
This paper addresses how much do agriculture R&D and R&D spill-over affect total factor productivity in the agricultural
sector In Iran. Although this is not a new question, only recently has the new economic growth literature provided theoretical as
well as empirical models to analyse this field of research.
This paper answers to this problem by computing total factor productivity in the agricultural sector during the period 1971-
2011 using Kendrick’s Index and uses this variable to analyse its relationship with domestic and foreign public R&D spending
in agriculture. Results show agriculture total factor productivity is positively and significantly influenced not only by its
domestic R&D capital stock but also by the foreign R&D capital stock of its trade partners. 6 factors are contained in the agriculture TFP model; agriculture R&D spending, agriculture education expenditure,
government investing in agriculture and rainfall; and two factors as spill-over; R&D spending in other sectors and import of
capital inputs in agriculture.
Augment Dicky-Fuler, Philips-Peron and KPSS test is applied for all variables used in the model to test their stationary.
Logarithm of import of capital inputs in agriculture and rainfall time series data are stationary in level and all other variables
are stationary by first difference.
We estimated agriculture TFP model using OLS model by E-Views 7.0 and the results are shown in table 6. All explain
variables show positive significantly effect on TFP by different lags. 1 percent increase in R&D spending in agriculture,
education expenditure in agriculture, R&D spending in other sectors, import of capital inputs in agriculture, government
investing in agriculture and rainfall will increase agriculture TFP respectively 0.13 percent by 5 lags, 0.10 percent by 2 lags,
0.09 percent by 5 lags, 0.04 percent by 2 lags, 0.14 percent by 1 lags and 0.17 percent at the same time.
R&D spending in agriculture is more effective than R&D spending in other sectors. Rainfall is the most effective and import of capital inputs in agriculture is the least effective factor in agriculture TFP model.
Refrences:
[1] Aghion, P., and P. Howitt, 1992, “A Model of Growth Through Creative Destruction,” Econometrica, 60, pp. 323–51.
[2] Aghion, P., and Howitt, P. (1998). Endogenous Growth Theory. Cambridge MA, MIT Press.
[3] Ali. S (2004), Total Factor Productivity Growth in Pakistan’s Agriculture: 1960-96, Pakistan Development Review.
43(4): 493-513.
[4] Alston, J.M., P.G. Pardey, and V.H. Smith eds (1999), Paying for Agricultural Productivity, Baltimore, Johns Hopkins
University Press.
[5] Alston, J.M., Chan-Kang, C., Marra, M., Pardey, P.G., and Wyatt, T. (2000). A Meta-Analysis of Rates of Return to
Agricultural R&D. Washington D.C.: International Food Policy Research Institute. [6] Alston, J. M. and Pardy, G.P. (2007). Attribution and other problems in assessing the returns to agricultural R&D.
Agricultural Economics, 25: 212-254
[7] Bagherzadeh, A. and Komeijani, A., 2010, Measurement and Analysis of investment rate of return on agricultural
research of Iran, agricultural Economy, no.2.
[8] Coe, D.T. and Helpman, E. (1995). International R&D Spillovers. European Economic Review, 39: 859-887.
[9] Coe, D., and E. Helpman and A. Hoffmaister, 1997, “North-South R&D Spillovers,” Economic Journal, 107 (January),
pp. 134–149.
[10] Coe, D. T., Helpman, E. and Hoffmaister,A. W., 2012, International R&D Spillovers and Institutions, IMF Working
Paper Asia and Pacific and European Departments, 2008 International Monetary Fund.
[11] Engele, R.F. and C.W.J Granger, 1987. Co-integration and Error Correction: Representation, Estimation and Testing,
Econometrica Journal, 55: 251-276. [12] Esposti, R. (2000). Public R&D and Extension Expenditure on Italian Agriculture: an Application of a Mixed
Parametric-Nonparametric Approach. European Review of Agricultural Economics, 27(3): 365-384.
[13] Grossman, G. and Helpman, E. (1991). Innovation and Growth in the Global Economy. Cambridge, MA: MIT Press.
[14] Gutierrez, L., and Gutierrez, M. M., 2005, International R&D Spillovers and Productivity Growth in the Agricultural
Sector, A Panel Cointegration Approach, Department ofAgricultural EconomicsUniversity of Sassari, Italy
[15] Hayami, Y. and Ruttan, V. W. (1985). Agricultural Development, an International Perspective. Baltimore: The John
Hopkins University Press.
[16] Huffman. W. E and Evenson. R. E (2001), Structural and Productivity Change in US Agriculture: 1950–1982,
Agricultural Economics, 24(2):127–47.
[17] Khaksar,A. H. and Karbasi, A., 2005, calculating investment marginal rate of return on research in agriculture of Iran,
Agricultural Economy and Develpement, no. 50.
[18] Kiani. A. K, Iqbak. M and Javad. T (2008), Total Factor Productivity and Agricultural Research Relationship: Evidence from Crops Sub-Sector of Pakistan’s Punjab, European Journal of Scientific Research, 23 (21), 87-97.
[19] Mehrabi,B. H. and Javdan, E., 2011, Impact of research and development on growth and productivity in agriculture
sector of Iran, Journal of Agricultural Economics and Development Vol. 25, No. 2, Summer 2011, P. 172-180

INDIAN JOURNAL OF MANAGEMENT SCIENCE (IJMS) EISSN 2231-279X – ISSN 2249-0280
www.scholarshub.net Vol.– III, Issue – 3, July 2013
41
[20] Mundlak, Y., Larson, D. and Butzer, R. (1997). The Determinants of Agricultural Production Function : a Cross-
Countries Analysis. World Bank Working Paper, 1827. Washington, DC: World Bank.
[21] Noferesti, M., 1995. Unit Root and Co-integration in Price of Rural Area. Econometrics.
[22] Pardey, P.G., M.S. Kang, and H. Elliott. "The Structure of Public Support for National Agricultural Research Systems:
A Political Economy Perspective." Agricultural Economics 3(4)(December 1989): 261-278.
[23] Philip G. Pardey, Julian M. Alston, and Connie Chan Kang, 2012, Agricultural Production, Productivity and R&D over
the Past Half Century: An Emerging New World Order, International Association of Agricultural Economists (IAAE)
Triennial Conference, Foz do Iguaçu, Brazil, 18-24 August, 2012.
[24] Romer, P. (1990). Endogenous Technical Change. Journal of Political Economy, 98: 71-102. [25] Mark W. Rosegrant and Robert E. Evenson, 1995, Total Factor Productivity and Sources of Long- Term Growth in
Indian Agriculture, International Food Policy Research Institute 1200 Seventeenth Street, N.W.Washington, D.C.
20036-3006 U.S.A.
[26] Sargan, J.D. and A. Bhargava, 1983. Testing Residual from Least Square Regression for Being Generated by the
Gaussian Random Walk. Econometrica Journal, 51: 153-174.
[27] Thirtle1, C., Lin, L. and Piesse, J., 2003, The Impact of Research Led Agricultural Productivity Growth on Poverty
Rrduction in Africa, Asia and Latin America, 25th International Conference of Agricultural Economists (IAAE), ISBN
Number: 0-958-46098-1
****

INDIAN JOURNAL OF MANAGEMENT SCIENCE (IJMS) EISSN 2231-279X – ISSN 2249-0280
www.scholarshub.net Vol.– III, Issue – 3, July 2013
42
RANKING INDIAN DOMESTIC BANKS WITH
INTERVAL DATA – THE DEA APPLICATION
Dr. T. Subramanyam,
Guest Faculty, Dept. of Statistics,
Pondicherry University, Pondicherry, India.
Dr. R.V.Vardhan,
Assistant Professor, Dept. of Statistics,
Pondicherry University, Pondicherry, India.
ABSTRACT
Data Envelopment Analysis (DEA) is a non-parametric approach used to measure the relative efficiency of organizational units where multiple inputs and outputs make comparison difficult. The
present study aims at evaluating the relative efficiency of decision making units (DMUs) with interval
data. In this case the relative efficiency will lie within an interval. In this paper we constructed the relative efficiency bounds. The DMUs were classified into different categories. A ranking method was
proposed to rank the DMUs in each category to identify the best performing banks in each category.
This new methodological techniques were applied for the data relating to the Indian Domestic Banks.
Keywords: Banks, Data Envelopment Analysis, Interval Data, Ranking, Efficiency.

INDIAN JOURNAL OF MANAGEMENT SCIENCE (IJMS) EISSN 2231-279X – ISSN 2249-0280
www.scholarshub.net Vol.– III, Issue – 3, July 2013
43
Introduction:
Data Envelopment Analysis is the optimization method of mathematical programming, based on linear
programming technique for measuring the performance of organizational units where the presence of multiple
inputs and outputs makes comparison difficult. DEA was first introduced by Charnes et.al, in the year 1978 to measure the relative efficiency of DMUs. Theoretical development of DEA has been quite remarkable, because of
its use in different public and private sector issues.
In DEA, CCR (1978) and BCC (1984) are the basic models to measure the efficiency of DMUs in constant (CRS)
and variable returns to scale (VRS) environments respectively. DEA alone classifies the DMUs into two dichotomous groups: efficient and inefficient. Efficient group receives the score 1 and inefficient group score lies
between 0 and 1. These basic models have some weakness in ranking the DMUs. Since all the efficient DMUs
having the equal score 1, one cannot decide which DMU having the better rank in their respective environment. In order to differentiate the efficient units Anderson & Peterson (A&P) developed super efficiency ranking method. In
spite of its popularity there were several criticisms about the A&P ranking method. Cooper & Tone developed
another ranking method based on the slack variables of the dual problem. All these methods were utilized to evaluate the efficiency and rank the DMUs using accurate data. If the data is an
inaccurate, these models disallowed to calculate the efficiency and to rank the DMUs. Inaccurate data may be
probabilistic, interval, ordinal or fuzzy. In this case the efficiency of a particular DMU will lie within an interval.
In recent years, in different applications of DEA, inputs and outputs have been observed whose values are indefinite. Such indefinite data are called „inaccurate data‟. A Few number of researchers devoted their findings to develop the
theoretical methodology with interval data to identify the bounds of the relative efficiency of the DMUs (Despoits
et.al, 2002; Jahanshahloo et.al, 2004). The present paper focused on evaluating the efficiency and ranking the DMUs using interval data. To rank the
DMUs the basic method applied is A&P super efficiency ranking method. The present paper is divided into six
sections. After introduction, section-I includes a brief review of literature about the basic CCR-DEA model. The DEA models with interval data are discussed in section-II. Section-III is devoted to discuss the DEA ranking
methods using interval data. In section IV we discussed about the Indian Domestic banks and input, output
selection. An empirical application with Indian Domestic banks is discussed in section-V. Section-VI presents the
concluding remarks of the present study.
Basic Data Envelopment Analysis Model:
Charnes, Cooper and Rhodes (1978) introduced a linear programming technique to measure the efficiency of
Decision Making Units (DMUs) in a competitive environment where similar inputs are employed to produce similar outputs.
Suppose, we have „n‟ decision making units (DMUs) with „m‟ inputs and „s‟ outputs. Let nj ,....,2,1,DMUj is
to be evaluated under investigation with the input and output vectors mjjjj xxxX ,..., 21 and
sjjjj yyyY ,..., 21 where 0Y and 0 jjX .
The basic CCR model to evaluate the input technical efficiency of kDMU is
n1,2,....,j m;1,2,...,i1,2,...n;jε;v,u1;xv; 0xvyu :yuMaxθ ji
m
1i
iki
s
1r
m
1i
ijirjr
s
1r
rkrk
------------- (1)
jv and iu are the input and output weights computed by solving the equation (1). The kDMU is said to be an
efficient with the optimum weights **,vu if and only if ,1* otherwise kDMU is said to be an inefficient.
Interval Data Envelopment Analysis Models:
For any, it is possible to construct a class interval by identifying the lower and upper bound of the given input and
output variables. The lower and upper bound of the ith input of the jDMU be
L
ijx and U
ijx . Let L
rjy and U
rjy be the

INDIAN JOURNAL OF MANAGEMENT SCIENCE (IJMS) EISSN 2231-279X – ISSN 2249-0280
www.scholarshub.net Vol.– III, Issue – 3, July 2013
44
lower and upper bound of the rth output of the
jDMU respectively. For every lower and upper bound the following
conditions are to be satisfied. U
ij
L
ij xx and U
rj
L
rj yy .
i.e., U
ij
L
ijij xxx , and U
rj
L
rjrj yy y ,
The CCR Model for evaluating the efficiency of kDMU with the given interval data is as follows:
n1,2,....,j m;1,2,...,i1,2,...n;j
; εv,u1, x, xv, 0 x, xvy ,y u:y ,y uMaxθ
ji
m
1i
U
ik
L
iki
s
1r
m
1i
U
ij
L
iji
U
rj
L
rjr
s
1r
U
rj
L
rjr
k
---------- (2)
The above problem doesn‟t allow the researcher to evaluate the efficiency. Whenever a researcher deals with an
interval data the efficiency itself lie within an interval. For each and every DMU it is possible to identify two relatively efficient bounds. i.e., lower and upper bound. The following are the two LPP models to evaluate the two
bounds.
Upper Bound of the Relative Efficiency:
The upper bound of the relative efficiency of kDMU is evaluated by solving the following linear programming problem:
n1,2,....,j m;1,2,...,i k;j 1,2,...n,j
εv,u1;xv0;xvyu, 0xvyu:yuMaxθ
ri
m
1i
L
iki
s
1r
m
1i
L
iki
U
rkr
s
1r
m
1i
U
iji
L
rjr
s
1r
U
rkrU
k
------------- (3) In this problem, the particular DMU is evaluated in its best condition and the other DMUs are evaluated in their
worst condition, such that U
k k .
Lower Bound of the Relative Efficiency:
To obtain the lower bound of the relative efficiency of kDMU , we solve the following linear programming problem:
n1,2,....,j m;1,2,...,i ,k;j 1,2,...n,j
εv,u; 1xv , 0xvyu , 0xvyu:yuMaxθ
ri
m
1i
U
iki
s
1r
m
1i
U
iki
L
rkr
s
1r
m
1i
L
iji
U
rjr
s
1r
L
rkrL
k
---------- (4)
In the above problem the DMU is evaluated in its worst condition and the other DMUs in their best
condition. The obtained efficiency will always satisfy the condition
L
k k . Therefore, we observe that
U
k
L
k ,k .
Classification of DMUs:
We classify the DMUs into three categories. In category-I, all the DMUs are efficient both in their best and worst
conditions 1 U
j
L
j , which is denoted by E++. In category-II, the DMUs are efficient in their best condition
and inefficient in their worst condition 1 ,1 U
j
L
j which is represented as E+ and category-III contains all
inefficient DMUs which are inefficient in their best and worst conditions 1 ,1 U
j
L
j and is denoted by E-.

INDIAN JOURNAL OF MANAGEMENT SCIENCE (IJMS) EISSN 2231-279X – ISSN 2249-0280
www.scholarshub.net Vol.– III, Issue – 3, July 2013
45
Ranking DMUS:
Ranking of DMUs with interval data seems to be very difficult. In other words, if two or more DMUs fall under
same category, how one can decide which bank is functioning in better environment with the better rank than the
other? To overcome this difficulty we suggest a two stage DEA method removing the boundedness conditions from the general LPP methods (3) and (4).
The following are the two stages to evaluate the possible efficiency scores.
Stage-I: DMU under evaluation is in its worst condition and the other DMUs in their best condition.
knj1,2,....,j m;1,2,...,i
1,2,...n,j ε;v,u 1;xv , 0xvyu:yuMaxθ
ri
m
1i
U
iki
s
1r
m
1i
L
iji
U
rjr
s
1r
L
rkr1
k
Stage-II: DMU under evaluation is in its best condition and the other DMUs in their worst condition.
n1,2,....,j m;1,2,...,ik;j 1,2,...n,j
ε;v,u; 1xv , 0xvyu:yuMaxθ
ri
m
1i
L
iki
s
1r
m
1i
U
iji
L
rjr
s
1r
U
rkr2
k
In the above two problems, we relaxed the boundedness condition of the objective function from the constraints to
get the possible maximum score of the objective function. The average score is calculated by using the relation
n,1,2,k ,2
θθθ
2
k
1
kR
k
From the above criteria we suggested that, if any DMU having the greater efficiency will be awarded with a better
rank and so on.
Indian Domestic Banks:
In India commercial banks were operating under three different ownerships, namely, government, private and
foreign. In public sector we have 27 commercial banks, in private 23 commercial banks and 28 commercial banks
were functioning under foreign ownership. According to the report of ICRA limited, a rating agency, the public sector banks hold over 75 percent of total assets of banking industry. It indicates the importance of the Indian
domestic banks. To know which domestic bank is functioning under efficient environment, we must evaluate the
efficiency. To gauge the efficiency of a commercial bank, first we model a commercial bank appropriately to meet the needs and objectives of the analyst.
To model a commercial bank we have two basic approaches. i.e., intermediate and production approach. In
intermediate approach banks viewed as intermediate funds between depositors and borrowers. In production approach a commercial bank resources produce services to the customers.
In the present study we pursued production approach to model a commercial bank. The inputs that it employs are
Number of Employees, Fixed Assets, outputs that produces are Deposits, Advances, and Investments.
Inputs Outputs
1. No. of Employees
2. Fixed Assets
1. Deposits
2. Advances
3. Investments
Empirical Applications:
The present study devoted to investigate the efficiency of Indian Domestic Banks. In India 27 public sector banks
were operating under the government ownership. The data collected from the RBI Bulletins for the academic years
2008 and 2009. The performance of each bank is evaluated with the interval data. The basic model to evaluate the lower and upper bound is CCR-CRS model. The results are shown in the Table (1).
We evaluated the relative efficiency bounds by assuming 2008 and 2009 data as lower and upper bound respectively.

INDIAN JOURNAL OF MANAGEMENT SCIENCE (IJMS) EISSN 2231-279X – ISSN 2249-0280
www.scholarshub.net Vol.– III, Issue – 3, July 2013
46
The DMUs were classified into three categories on the basis of the efficiency score of the lower and upper bounds.
From the table (1), we observe that the only one bank, i.e., IDBI, Ltd., is fully efficient which falls under the
category E++. Under category E+ we have 52 percent (14 out of 27) banks and 44 percent banks (12 out of 27) fall under the category E -.
Category E++ E+ E- Total Banks
No. of Banks 01 14 12 27
The two stage DEA model employed to gauge the possible efficiency scores of the DMUs in each category. We
calculated the average efficiency score for each DMU and basing on this average score corresponding ranks are also given in Table (1).
Conclusions:
This study attempts to investigate the efficiency and ranking the Indian Domestic banks with interval data. The main aim of this paper is to construct the relative efficiency bounds of efficiency score and also to rank the DMUs
which fall under the same category. This ranking method helps us to know which bank is functioning in the
efficient environment comparing to the other banks in the same category. The study states that the only one bank
IDBI, Ltd. is the fully efficient bank among all the Indian Domestic banks which is assigned with Rank „one‟. The remaining banks in number 14 and 12 fall under the category E+ and E- respectively.
Overall, the present study facilitates the ranking method whenever the interval data appears in the literature. This
will help as the base for ranking the decision making units with interval data.
References:
[1] Andersen A and Petersen, N.C., 1993. A procedure for ranking efficient units in data envelopment
analysis.Mgmt.Sci.39, 1261-1264. [2] Banker, R.D., Charnes, A., Cooper, W.W., (1984), Some Models for estimating technical and scale
inefficiencies in data envelopment analysis: Management Science 30, pp 1078-1092.
[3] Berg, S.A., Forsund, F.R., Hjalmarsson. L., and Suominen, M. 1993. Banking efficiency in the Nordic
countries, Journal of Banking and Finance 17: 371 – 388. [4] Charnes, A., Cooper, W.W., and Rhodes, E. 1978. “Measuring the efficiency of decision making units”,
European Journal of Operational Research 2, 429-444.
[5] Despotis, D.K., Smirlis, Y.G., 2002. “Data Envelopment Analysis with Imprecise data”, European Journal of Operational Research 140, 24-36.
[6] Jahanshahloo, G.R., Hosseinzadeh Lotfi, F., and Moradi, M., 2004. “Sensitivity Analysis and stability analysis
in DEA with interval data”, App. Math. Comput, 156, 463-477.
[7] Mlima, A.P., Hjalmarsson, L., 2002. Measurement of Inputs and Outputs in the Banking industry. Tanzanet Journal 3(1): 12-22.
[8] Sealey, Jr. C.W., and Lindley, J.T., 1977. Inputs, outputs and a theory of production and cost at depository
financial institutions. Journal of Finance 4: 1251-1266.
Table (1)
Bank Name L
k U
k Category 1
k 2
k R
k Ranks
State Bank of India 0.5606 1.0000 E+ 0.5606 1.2117 0.8862 9
State Bank Bikaner & Jaipur 0.7178 1.0000 E+ 0.7178 1.0683 0.8931 8
State Bank of Hyderabad 0.6977 1.0000 E+ 0.6977 1.2826 0.9902 6
State Bank of Indore 0.8525 1.0000 E+ 0.8525 1.3094 1.0810 4
State Bank of Mysore 0.3657 1.0000 E+ 0.3657 1.2645 0.8151 11
State Bank of Patiala 0.7996 1.0000 E+ 0.7996 1.3148 1.0572 5
State Bank of Travancore 0.7809 1.0000 E+ 0.7809 1.1354 0.9582 7
Allahabad Bank 0.4847 0.9219 E- 0.4847 0.9219 0.7033 20

INDIAN JOURNAL OF MANAGEMENT SCIENCE (IJMS) EISSN 2231-279X – ISSN 2249-0280
www.scholarshub.net Vol.– III, Issue – 3, July 2013
47
Andhra Bank 0.5574 1.0000 E+ 0.5574 1.1613 0.8594 10
Bank of Baroda 0.5384 1.0000 E+ 0.5384 1.0699 0.8042 13
Bank of India 0.5005 0.9735 E- 0.5005 0.9735 0.7370 16
Bank of Maharashtra 0.4257 1.0000 E+ 0.4257 1.1422 0.7840 15
Canara Bank 0.4498 0.8606 E- 0.4498 0.8606 0.6552 22
Central Bank of India 0.3921 0.7546 E- 0.3921 0.7546 0.5734 27
Corporation Bank 0.7562 1.0000 E+ 0.7562 1.6149 1.1856 2
Dena Bank 0.4838 0.9378 E- 0.4838 0.9378 0.7108 19
IDBI Ltd. 1.0000 1.0000 E++ 1.7243 3.7483 2.7363 1
Indian Bank 0.3910 0.8105 E- 0.3910 0.8105 0.6008 26
Indian Overseas Bank 0.4407 0.9421 E- 0.4407 0.9421 0.6914 21
Oriental Bank of Commerce 0.6699 1.0000 E+ 0.6699 1.5008 1.0854 3
Punjab & Sind Bank 0.3760 0.8649 E- 0.3760 0.8649 0.6205 25
Punjab National Bank 0.4338 0.8238 E- 0.4338 0.8238 0.6288 24
Syndicate Bank 0.5585 1.0000 E+ 0.5585 1.0404 0.7995 14
UCO Bank 0.4985 0.9377 E- 0.4985 0.9377 0.7181 18
Union Bank of India 0.4519 0.9989 E- 0.4519 0.9989 0.7254 17
United Bank of India 0.5062 0.7833 E- 0.5062 0.7833 0.6448 23
Vijaya Bank 0.6000 1.0000 E+ 0.6000 1.0227 0.8114 12
****

INDIAN JOURNAL OF MANAGEMENT SCIENCE (IJMS) EISSN 2231-279X – ISSN 2249-0280
www.scholarshub.net Vol.– III, Issue – 3, July 2013
48
THE EFFECTS OF FINANCIAL REPORTING QUALITY
ON STOCK PRICE DELAY & FUTURE STOCK RETURN
Azam Pouryousof,
Department of Management,
Accounting, Payame Noor University, I.R., Iran.
Hilda Shamsadini,
Department of Accounting, Bam Branch,
Islamic Azad University, Bam, Iran.
Mina Abousaiedi,
Department of Accounting, Kerman Branch,
Islamic Azad University, Kerman, Iran.
ABSTRACT
The purpose of this research is to survey the effects of financial reporting quality on stock price delay
and future stock return. In capital markets with poor or medium efficiency, cross-sectional disclosure
of stock price and as a result the stock price will mainly delay. In this research we also study this question: does the quality of accounting information have influence on the reflection delay of
accounting information in stock price? On the other hand stock price delay is risky for investors, so
investors return premium to compensate this adverse selection. Therefore, the second question arises: does stock price delay relate to the association of financial reporting quality & future stock returns?
The statistical populations in this research are all firms accepted in Tehran stock exchange, using
elimination method in sampling; the firm was elected as a sample, received information such as: financial reporting quality, future stock return and stock price delay which were analyzed through
model …….. and the findings indicated that there is no significant association between financial
reporting quality and stock price delay. But there is such significant association between financial
reporting quality and future stock return.
Keywords: stock price delay, financial reporting quality and future stock return.

INDIAN JOURNAL OF MANAGEMENT SCIENCE (IJMS) EISSN 2231-279X – ISSN 2249-0280
www.scholarshub.net Vol.– III, Issue – 3, July 2013
49
Introduction:
In capital markets with poor or medium efficiency, cross-sectional disclosure of information and as a result stock price to
newly-arrived information will delay. On the other hand stock price delay is risky for investors; therefore, we survey this
question in this research: does the quality of accounting information as a kind of information imperfection have influence on
accounting information reflection delay in stock price? And can we relate stock price delay to the association between financial
reporting quality and future stock returns?
Theoretical principals:
In efficient capital market (complete disclosure of information and rational investors) stock price is balanced on the basis of
newly-arrived information. Therefore, the main volume of financial research surveys the information imperfection such as information asymmetry and incomplete information (Barry and Brown 1984; Merton, 1987; Easley et al., 2002; Hou and
Moskwitz, 2005; Lambert et al., 2007).
In incomplete information, cross-sectional disclosure of stock price and as a result stock price adjustment will delay.
(Verrecchia, 1980; Callen, 2000). In this research we also survey this question: does the quality of accounting information (as a
kind of information imperfection) have influence on accounting information reflection delay in stock price?
Stock price delay is risky for investors because it may be in contrary to the general information which appears in price.
Therefore, investors return premium to compensate this adverse selection. The second question: is stock price delay related to
the association of financial reporting quality and future stock return?
Since stock price delay is related to both accounting and non-accounting information, and return premium for delay is
associated with financial and non-financial indexes of the firm, this research will impel us to analyze return premium (due to
delay) and accounting & non-accounting sources. Therefore, we must seek documents to show the association between expenses, capital and financial reporting quality.
In this research, the quality of financial reporting is defined as the effect of financial reporting in the prediction of stockholders’
salary in future cash flow. And it is expected that the poor quality of financial reporting is economically costly and will result in
a decrease in the adjustment of stock price and an increase in the firm capital expenses. When the pre-existing information set
is poor or imprecise, investors’ cash flow forecasts are poor or imprecise, and there is also likely heterogeneity in investor
opinion about the amounts, timing and uncertainty of future cash flows.
In this research, we distinguish between stockholders’ available information and newly-arrived information. Stockholders use
the existing information to forecast cash flow, then they can estimate stock price and by disclosure of newly-arrived
information, they will be able to update cash flow forecast in order to determine stock price. Here we supposed that accounting
information is part of information which is used to forecast cash flow by investors.
As a result, poor quality of financial reporting is related to poor quality of existing information and it decreases the quality of
cash flow forecast. After publishing the related new information, the investors revise their forecast of cash flow so; stock price estimation is accompanied by uncertainty, because investors are interested in stock price revaluation based on increasing
awareness or imitation of other investors. These revaluations are continued until prices cover the main values. (Verrecchia,
1980; Callen, 2000). Therefore, in this research we determine stock price delay with difference in the quality of the existing
accounting information.
This research is based on Verrecchia studies; he has determined the speed of stock price adjustment based on the quality of newly-
arrived information. He supposed that the quality of existing information of investors is fixed. But in this research, based on the
experiments in other similar studies, stock price speed is determined with difference in the quality of existing accounting information
and the quality of newly-arrived information is supposed to be the same as the quality of existing information.
Stock price delay is measured on the basis of the firm return rate correlation with general return of the market and the quality of
financial reporting is determined using the general information of financial statements. To evaluate the quality of financial
reporting, some models are presented based on accrual quality, special items quality, recent continuous losses and unexpected profits. (Li, 2008). In this research we use accrual quality to evaluate financial reporting quality, because it is more robust scale
in associated with variability control of cash flow and operational uncertainty index.
Hypothesis:
The effects of financial reporting on future cash flow forecasts, shows financial reporting quality; when the pre-existing
information set is poor or imprecise, investors’ cash flow forecasts are poor or imprecise, and there is also likely heterogeneity
in investor opinion about the amounts, timing and uncertainty of future cash flows. As a result, the poor quality of financial
reporting is related to the poor quality of existing information; then it decreases the quality of cash flow forecasts.
After publishing the related new information, the investors revise the cash flow forecasts so; stock price estimation is
associated with uncertainty, because investors are interested in stock price revaluation based on increasing awareness or
imitating other investors. These revaluations are continued until prices reflect the main values. Therefore, in this research, delay in stock price adjustment is determined with difference in the quality of existing accounting information and we expect
that the stock price adjustment (stock price revaluation by investors) to have higher delay in the condition that the quality of

INDIAN JOURNAL OF MANAGEMENT SCIENCE (IJMS) EISSN 2231-279X – ISSN 2249-0280
www.scholarshub.net Vol.– III, Issue – 3, July 2013
50
financial reporting is poor. Therefore, the first hypothesis of this research is as follows:
1- There is a significant association between financial reporting quality and stock price delay.
Since, it is expected that stock price adjustments has higher delay in the condition that the quality of financial reporting is poor,
the investors ask for higher return in this condition. Because stock price delay is risky for investors, because it may be in
contrary to that general information which appears in prices; therefore, investors return premium to compensate this adverse
selection. Therefore, the second hypothesis of this research is as follows:
2- Investors predict higher future stock return, when the quality of financial reporting is poor.
It is worth noting that the research data in this article is cross-sectional and analysis of collected data based on correlation
method. Moreover, this research is a kind of relation-finding research in the field of capital market. For the research hypothesis to be tested at first we analyze the research information through Kolmogorov- Smirnov Test, if the
information distribution is normal, Pearson Test is used and if it is not normal Spearman Rank Correlation Test is used.
The statistical populations in this research are: all firms accepted in Tehran stock exchange, using systematic elimination
method in sampling; some firms were elected as samples which:
- Their fiscal year is leading to 19/03/2012
- Their relative data such as 3-month reports are available
- Two weeks after publishing the 3-month reports, their stock will be exchanged
Previous studies:
In a research, Verrecchia, R (1980), surveyed the association of price adjustment speed with the quality of accounting
information. He supposed that the quality of existing information is fixed and indicated that the speed of price adjustment will increase due to increasing the quality of newly-arrived information.
Callen et al (2000) examined stock price delay and future stock return, relation of financial reporting quality & the delay of
stock price adjustment in a research under the name of Accounting Quality. The result suggested poor accounting quality
causes the stock price adjustment to have higher delay and investors evaluate higher future stock return in poor accounting
quality condition.
Research Variables:
A) Independent Variable:
Financial reporting quality is defined as financial reporting effects on forecasting stockholder’s equity in future cash flow. In
this research we use Accrual Quality to evaluate financial reporting quality, according to (Francis et al 2005; Dechow and Dicher 2002; McNichols 2002) studies as following model:
CAcct = γ1,t + γ2,t CFOt-1 + γ3,t CFOt + γ4t CFOt+1 + γ5,t Δrev + γ6,t PPEt + et
CAcct = Current Accrual (or Changes in Capital Flow)
CFO = Cash Flow at the Beginning
Δrev = Changes in Incomes at the end of period in respect of the beginning
PPE = Properties & Equipments
All the variables in the above-mentioned model, to eliminate the inflation effect, are balanced through collecting assets; it
means that the variables are divided to assets collection.
B) Dependent Variable:
1- Stock Price Delay: Investors use all the existing data to forecast the company cash flow and as a result the company value. Following to disclosure of new data concerning the company, investors will update their estimation of cash flow and reach a
new price for the stocks. Based on traditional paradigms of efficient capital markets, price adjustment occurs quickly and
completely, but the results of the observational research indicate that the effect of finding new data on price stock is appeared
with a delay.
In Hou and Moskowitz, 2005 model, stock price delay average is calculated through the sold stock return and market return in
4 times (after publishing 3-month financial reporting) as follows:
Ri, t = ai + βi Rm,t + Σn=1 to 4 δi,n Rm,t-n + εi,t
Ri,t = Stock Return (i) in Period (t)
Rm, t = Market Return in Period (t)
If information reflects with delay in stock price, some of δi,n shall not be zero and market return will be added to stock pr ice
after publishing 3-month reports (uncontrolled price adjustment).
Above equation is calculated another time with this restriction that all δi,n are zero, in other words we supposed that newly-arrived information have influence on stock price speedily (controlled price adjustment). Then price delay of D is calculated as
follows:
D = 1- (R2 restricted / R2 unrestricted)

INDIAN JOURNAL OF MANAGEMENT SCIENCE (IJMS) EISSN 2231-279X – ISSN 2249-0280
www.scholarshub.net Vol.– III, Issue – 3, July 2013
51
D is similar to Fisher test about the importance of accrual correlation in Hou and Moskowitz model. If the variation percent of
discussed return in this model is higher, D will be higher too. Hence, new information reflection delay in stock price (Stock
price delay) will increase D.
Hypothesis Test:
First Hypothesis: There is a significant association between financial reporting quality and the firms’ stock price delay.
To examine this hypothesis, we calculated the correlation coefficient between financial reporting quality and stock price delay
of the firms for the period of seven years separately. The results are as follows:
Firms Stock Price Delay
2002 2003 2004 2005 2006 2007 2008
Financial
Reporting
Quality
Correlation Coefficient -0.011 0.017 0.008 -0.024 -0.12 -0.029 0.005
Statistic t -0.093 0.145 0.0683 -0.205 -1.032 0.247 0.0427
Significance Level 0.926 0.887 0.947 0.841 0.305 0.806 0.969
Table 1- correlation coefficient between financial reporting quality and firms’ stock price delay during the years 2001 to 2007
Correlation coefficient is negative during the years: 2002, 2004, 2005 & 2006. Therefore, during the said years there is a
reverse relation between financial reporting quality and firms’ stock price delay, in other word during these years the delay
amount of price adjustment has decreased due to increasing the quality of financial reporting. Certainly since in all years
discussed here, the Significance Level is higher than 0/05, there is no significant association between the above-mentioned
variables. In other words the first hypothesis is not confirmed.
Second Hypothesis:
Investors forecast higher future stock returns for firms when the quality of financial reporting is poor:
To examine this hypothesis, we calculate the correlation coefficient between financial reporting quality and firms’ future stock
returns. The results are as follows:
Firms Future Stock Returns
2002 2003 2004 2005 2006 2007 2008)
Fin
an
cia
l
Rep
orti
ng
Qu
ali
ty
Correlation
Coefficient -0.044 -0.361 0.065 -0.014 0.027 -0.117 0.084
Statistic t -0.376 -3.307 0.55 -0.119 0.231 -1.0065 0.72
Significance Level 0.705 0.001 0.58 0.905 0.817 0.319 0.472
Table 2- correlation coefficient between financial reporting quality and firms’ stock price delay during the years 2001 to 2007
Correlation coefficient between the said variables is negative during the years: 2008, 2002, 2004 & 2006. This shows that the
second hypothesis is accepted. Correlation coefficient in 2001, 2002, 2004 & 2006 is positive; hence, there is a direct but
incomplete association between financial reporting quality and future stock returns.
Regression Analysis:
Using simple linear regression analysis, we want to study the association between the mentioned variables and determining appropriate paradigm from relation between financial reporting quality with stock price delay and firms’ future stock returns
for future research and presenting forecast model. In this research two simple linear regression models are presented; in the
first model, financial reporting quality has been considered as an independent variable and the firms’ stock price delay as a
dependent variable.
(Financial Reporting Quality) × 0.02 – 7.731E – 10 = Stock Price Delay
Table 3: Regression Coefficient Estimation for stock price delay against firms’ financial reporting quality
Regression
Estimation
Standard Deviation
Coefficient Statistics T
P-Value
Significance Level
Constant Coefficient 0.02 0.015 1.348 0.178
Financial Reporting Quality -7.731E-10 0.00 -0.024 0.981

INDIAN JOURNAL OF MANAGEMENT SCIENCE (IJMS) EISSN 2231-279X – ISSN 2249-0280
www.scholarshub.net Vol.– III, Issue – 3, July 2013
52
The above table indicates that as financial reporting quality increases one unit (7.731, ×10-10) the amounts of stock price delay decreases.
The second regression model is as follows: in this model, financial reporting quality has been considered as an independent
variable and future stock returns as dependent variables.
(Financial Reporting Quality) 27.651-2.424×10-6= Future Stock Returns
Table 4- Regression Coefficient Estimation for future stock returns against firms’ financial reporting quality
Regression
Estimation
Standard Deviation
Coefficient
Statistics T P-Value
Significance Level
Constant Coefficient 27.651 3.059 9.039 0.00
Financial Reporting Quality -2.424E-6 0.00 -0.365 0.715
Considering the fact that significance level pertaining to financial reporting quality in the above model is more than 0.05, with
95 percent assurance, we can say that the above model is not efficient and appropriate. After studying the hypothesis, we came to the conclusion that there is no significant linear association in the level of %95
between financial reporting quality and stock price delay. But, considering that the correlation coefficient between financial
reporting quality and future stock returns is negative, investors forecast higher future stock returns when the quality of financial
reporting is poor. Its model is as follows:
Future stock returns = 27.651 – 2.424 × 10⁻⁶
(financial reporting quality)
Conclusion:
In efficient and half-efficient capital market, when the related new information is published, investors revise their forecast of
cash flow. Hence, stock price estimation is accompanied by uncertainty, because investors are interested in revaluation of stock
price base on increasing awareness or imitation of other investors. These revaluations are continued until prices cover the main
values. Therefore, it is expected that, delay in stock price adjustment shall be determined by difference in the existing accounting information quality and we may observe more delay in stock price adjustment (stock price revaluation by investors)
when the quality of financial reporting is poor.
Our expectation of existing reverse relation between financial reporting quality and stock price delay was confirmed, but
association between above-motioned variables is not statistically significant as we cannot relate stock price delay to financial
reporting quality. Lack of association between financial reporting quality and stock price delay may be due to the restriction
which exits in Delay measurement model in stock price adjustment or market inefficiency. Seemingly, we need more extensive
research to reach a final conclusion: because measuring the delay variable in stock price adjustment has no record in Iran; on
the other hand, as we saw the detailed results of the first hypothesis in chapter four, is has been confirmed that there is no
association between financial reporting quality and stock price delay in 2008, 2004, 2005 & 2006 and there has been positive
association between financial reporting quality and stock price delay in 2002, 2003 & 2007.
Since, it is expected that we observe more delay in stock price adjustment while the quality of financial reporting is poor; investors ask more returns in this condition. Because stock price delay is risky for investors and it may be contrary to such
general information which appears in prices. Therefore, it is expected that investors return premium to compensate this adverse
selection. As we expected, reverse association between stock returns and financial reporting quality was confirmed. Of course,
detailed statistical results indicates that reverse association between stock returns and financial reporting quality was confirmed
only for years: 2008, 2002, 2004 & 2006; and investors forecast higher future stock returns as the financial reporting quality
increases in years 2003, 2005 & 2007. Certainly, considering the records of this hypothesis test in Iran capital market, we can
conclude that as financial reporting quality deceases, investors forecast higher future stock returns. Acceptance the above
conclusion will lead us to accept that stock exchange is efficient.
References:
[1] Callen at al.(2010), Accounting Quality, Stock Price Delay and Future Stock Returns, Journal of Accounting and Economics, 5:63-92.
[2] Callen at al, (2000), large time and small noise asymptotic results for mean reverting diffusion Processes with
applications, Economic theory, 16:401-419.
[3] Dechow, Patricia and Ilia Dichev. (2002), the quality of accruals and earning, The Accounting Review, 77:35-39.
[4] Hou, Kewei and Tobias Moskowitz, (2005), Market frictions, Price delay and the cross- Section of expected returns,
Review of Financial studies, 18(3): 981-1020.
[5] Li, Feng, (2008). Annual report readability: current earning and earning persistence. Journal of Accounting and
Economics, 45:221-247.
[6] Vettecchia, Robert. (1980), the rapidity of price adjustments to information, Journal of Accounting and Economics, 2:63-92.
****

INDIAN JOURNAL OF MANAGEMENT SCIENCE (IJMS) EISSN 2231-279X – ISSN 2249-0280
www.scholarshub.net Vol.– III, Issue – 3, July 2013
53
GOLD PRICE MOVEMENTS IN INDIA
AND GLOBAL MARKET
Shaik Saleem,
Research Scholar, Department of Management Studies,
Sri Venkateswara University, Tirupati, Andhra Pradesh, India.
Dr. M. Srinivasa Reddy,
Professor,
Department of Management Studies, Sri Venkateswara University,
Tirupati, Andhra Pradesh, India.
Shaik Karim,
Research Scholar,
GITAM School of International Business,
GITAM University, Visakhapatnam,
Andhra Pradesh, India.
ABSTRACT
The price of gold varies from country to country as there are some very influential factors to affect its
rate nationally and internationally. In the international markets when in gold is traded online, its price depends upon the dominated currency that is US Dollar in most of the online trading markets. In
online commodity exchanges, the Live Gold Rates are updated time to time whereas in the physical
markets the prices changes and vary from country to country. This paper attempts to study the gold prices movement in INR and Key Currencies, impact of exchange rate, inflation rate and gold reserves
on gold prices movement in India. It was found that there exists positive and significant correlation
between the gold prices movement in INR and Key Currencies and there exists seasonal variation in
gold prices movement between INR and key currencies. The study also shows significant impact of exchange rate, inflation rate and gold reserves on gold prices movement in India.
Keywords: Currencies, Exchange rate, Gold reserves, India, Inflation rate, Seasonal variation.

INDIAN JOURNAL OF MANAGEMENT SCIENCE (IJMS) EISSN 2231-279X – ISSN 2249-0280
www.scholarshub.net Vol.– III, Issue – 3, July 2013
54
Introduction:
Thousands of years ago people found shiny rock in a creek and thereby human race got introduced to the Gold for first time.
Gold, the metal, particularly the yellow metal witnessed a drastic change in its characteristics. In ancient days it was luxurious
for the mankind; today the same gold is the need for mankind. People they prefer the need to have the investment in the gold
for various reasons. It is evident from the history the importance of gold as the best medium of exchange between countries,
but today gold has lost its importance as there was an end of determining foreign exchange rate in terms of gold in Bretton
Woods Agreement.
The price of gold varies from country to country as there are some very influential factors to affect its rate nationally and
internationally. In the international markets when in gold is traded online, its price depends upon the dominated currency that is
US Dollar in most of the online trading markets. In online commodity exchanges, the Live Gold Rates are updated time to time whereas in the physical markets the prices changes and vary from country to country. The variations in Gold Rates are similar
to price of crude oil. The crude oil rate changes in the international markets and conversely affects the national markets of the
different countries. The crude oil price is given in US Dollars and then the countries calculated their local price of petroleum
products on various factors. Countries have different policies for the export and import of the goods that is why they design the
policies accordingly which results in unlike gold rates among their neighboring and other countries. The variation in prices is
due to the cost of physical delivery, storing and ordering cost, local taxation and conversion of price from US Dollar to
local currency. Following are some of the factors that affect the prices in different countries.
Inflation affects the gold rate:
Gold is an inflation hedge that is used by the countries to secure their economy by hedging gold against their inflation rate.
Mostly the developed countries hedge gold to balance their economy that may be disturbed by the increase in inflation. The gold rate goes up with the increase in inflation rate and the countries that hedge gold against inflation will not face recession. It
is one of the financial instruments that help the economy in stabilizing its position in the international community. Some of the
developing countries have increased inflation rates that may be affected by the decrease in the foreign currency rate. Every
country has its own policy-makers who advent economic policies according to the needs of the country to bring out the
maximum result in developing their economy that's why the price of gold varies from country to country.
Import tax and duties affect gold rates:
Countries impose tax to force the investors and importers contribute in the national economy. Some of the taxes are imposed
directly while some of them are indirectly levied. Gold is a premium commodity that brings more revenue to the tax authorities
and stability in the economy. India's revenue from import of gold almost doubled in 2010-11 as compared to the previous year,
revenue turnover in respect of customs duty collected from the import of gold was Rs 2,553.52 crore in 2010-11 against Rs 1,567.64 crore in 2009-10. The gold rates are therefore subject to increase with the addition of import tax and duties. Every
country has its own Income Tax ordinance and rules to charge tax over the imports of global homogenous commodities. Gold is
one of those durable commodities that are taxed differently indifferent countries. That's why the Live Gold Rates tend to vary
from country to country.
Central Banks affect the gold rates:
The central bank of a country plays a leading role in setting the price of gold as it often hedge the gold against its central
reserves. The banks and gold mining companies can manipulate the gold prices as they have a large amount of raw and refined
gold in their reserves. Banks can affect the rate in case they undergo the sale or purchase of gold in bulk or the mine-owners
increase the production or reduce the output of gold. Gold is traded internationally but it is treated in a dissimilar way when it
is comes to the national boundaries. The central banks have the amount of gold and they may buy more gold when they find a decrease in their gold reserves against their holdings.
Hence, in this context this study is undertaken to observe any relationship in gold price movements in India and the Global
Market and to observe the impact of various factors on gold prices in India.
Objectives of the Study:
1. To study the trend in gold price movements in Indian rupee and key currencies of the world.
2. To identify the association between gold price movement in Indian rupee and key currencies of the world.
3. To study the impact of foreign exchange rate between INR/USD, Inflation rate and Gold Reserves on gold prices in India.
Literature Review:
There are many studies Koutsoyiannis (1983), Sjaastad (1986), Cengiz Toraman (2011) and Sujit (2011) investigating the price
of gold in the literature. These studies dealt with different variable and determined the relationship between gold prices and US

INDIAN JOURNAL OF MANAGEMENT SCIENCE (IJMS) EISSN 2231-279X – ISSN 2249-0280
www.scholarshub.net Vol.– III, Issue – 3, July 2013
55
dollar, inflation rate, stock return and oil prices in general. Most of studies deal with gold price movements in US and other
developed countries, Indian based studies are less in number, and these studies are mostly in relation to stock market. Hence,
there was a need to carry this study.
Research Methodology:
For the purpose of study to make comparison between the gold price movement in Indian market and Global market, historical
gold prices in INR, USD, GBP, JPY, CAD, EUR and CHF on monthly and yearly basis were taken for 32 years from 1981 to
2012 from World Gold Council. And historical exchange rates of INR/USD, Inflation rates in India and Gold Reserves in Metric tons in India from 1981 to 2012 were taken. Data were analyzed in this study by using seasonal index by simple average
method, correlation analysis, and regression analysis and for interpreting the results of hypothesis testing student’s t-test and
ANOVA have been used.
Hypotheses:
As the study is about knowing the gold price movements in various markets, which may show variations in the trend of all
markets. Hence, following hypotheses were developed:
1. To test the significance of the value of Karl Pearson co-efficient between the gold price movement in INR and key
currencies, the following hypothesis has been developed. H0: There is no association between gold price movements in INR and key currencies.
H1: There is an association between gold price movements in INR and key currencies.
2. To test the significance of seasonal variability of Gold prices in Indian and Key currencies market, following hypothesis
has been developed:
H0: Seasonal variability of gold prices in all the markets does not differ significantly.
H1: Seasonal variability of gold prices in all the markets does differ significantly.
Results and Discussion:
Seasonal Variation in the Gold Prices in Indian and Key Currencies market:
The present study is a time series study covering a period from 1981 to 2012. This period was chosen because it covers both
pre and post liberalization period, which may show a good variability as before 1991 the gold prices were not determined by
the market forces but rather fixed by the Government from time to time and also cover the period of crisis in financial markets.
From the exhibit -1 it is clear that the gold price movements shown a downward trend in the years 1981 - 1982, and thereafter
showing increasing trend up to 1996. From 1997 again the gold prices in India started falling down and geared up from 2000
and continuing the same trend till. Further, the gold price movements in US Gold Market is not showing a constant trend over a
period of time from 1980 – 2004. From 2004 it is observed a good increasing trend in gold price in US at higher pace.
Exhibit – 1: Gold Price Movements in INR and Key Currencies from 1981 to 2012
Year INR USD EUR JPY GBP CAD CHF
1981 3969.5 459.7 361.0 100991.2 226.8 551.2 902.8
1982 3560.1 375.8 345.7 93804.8 215.8 463.2 765.8
1983 4279.2 424.2 440.3 100874.6 279.6 523.1 890.3
1984 4066.2 360.4 425.7 85459.1 269.7 466.2 844.2
1985 3888.6 317.3 394.2 75457.9 246.4 433.0 776.7
1986 4615.5 367.5 351.0 61646.3 250.9 510.5 657.3
1987 5751.8 446.5 365.9 64389.5 272.4 591.6 664.5
1988 6041.6 437.0 351.9 55981.8 245.5 538.1 638.2
1989 6154.4 381.4 325.6 52580.7 233.0 451.6 623.1
1990 6695.9 383.5 282.8 55491.7 215.9 447.5 533.2
1991 8205.2 362.2 278.0 48692.8 205.3 414.9 518.8
1992 9632.6 343.7 253.5 43546.7 195.7 415.3 483.2
1993 11189.9 359.8 301.1 39894.6 239.6 464.4 531.7
1994 12047.1 384.0 319.5 39243.0 250.8 524.3 524.9
1995 12450.7 384.2 292.0 36109.8 243.5 527.3 453.9
1996 13713.1 387.7 300.8 42140.0 248.7 528.7 478.9
1997 12006.5 331.1 292.3 40022.4 202.3 458.0 480.2

INDIAN JOURNAL OF MANAGEMENT SCIENCE (IJMS) EISSN 2231-279X – ISSN 2249-0280
www.scholarshub.net Vol.– III, Issue – 3, July 2013
56
1998 12128.9 294.2 264.3 38473.8 177.5 436.2 426.4
1999 12001.6 278.8 261.5 31666.5 172.2 414.2 418.5
2000 12530.1 279.0 302.6 30073.4 184.2 414.3 471.0
2001 12786.8 271.0 302.8 32914.8 188.2 419.7 457.2
2002 15056.0 310.0 328.2 38760.5 206.4 486.6 481.6
2003 16915.2 363.5 321.2 42060.3 222.3 508.3 488.5
2004 18517.4 409.2 329.1 44230.2 223.3 531.9 508.0
2005 19624.6 444.9 358.6 49117.4 245.1 538.4 555.2
2006 27372.2 604.3 480.8 70233.8 327.9 685.2 756.4
2007 28733.2 696.7 507.4 81849.4 347.7 745.0 833.9
2008 37768.7 871.7 593.3 90251.5 472.3 925.5 941.3
2009 47025.2 973.0 697.8 90862.3 621.9 1105.7 1053.4
2010 55973.2 1224.7 925.1 107171.6 792.5 1261.1 1274.1
2011 73394.9 1568.6 1128.4 124770.9 979.1 1553.5 1388.6
2012 89061.5 1668.1 1297.2 133141.5 1052.2 1666.7 1563.5
Source: World Gold Council
It is evident from the exhibit - 1 that the gold price movements in European Gold Market follows the same line of trend of US gold market, fluctuations in the gold prices from 1980 – 2004 and thereafter a high speed increasing trend in gold prices. But it
was found decreasing trend in the gold prices in the Japan gold market from 1981 – 1995, bit increase in the gold prices in the
year 1996 and again down trend up to 2001. Thereafter increasing trend is observed in the gold prices. London gold market
had witnessed fluctuations from 1980 to 2004 and from 2005 onwards an increasing trend is noticed in the gold prices in
London. The gold markets in Canada and Switzerland also show fluctuations in gold prices from 1981 to 2000, later years
increasing trend in gold prices is observed.
From the exhibit-1 it is clear that somehow seasonal variations are there in the Indian gold market and the other markets further
the seasonality is not varying at high rate in all the markets on an average. The demand for gold is somewhat high in and
changing time to time in India; this may be due to India is one of the major countries of consumer of gold. Further the demand
for gold in India increases from the August and continue up to December as these are the festivals months, people consider
purchasing of gold as good act during these months. As the seasonal indices observed with minimum of 93.68% and maximum
of 108% is varying more than the other countries seasonal indices having a range between 99% as minimum to 103% as maximum on an average.
It was found high positive correlation between the gold price movements in INR and USD, EUR, GBP, CAD, CHF and JPY of
0.961, 0.944, 0.954, 0.967, 0.804 and 0.634 respectively. Showing increase in gold price in said currencies will lead to increase
in the gold price in INR at higher proportion in same direction or vice-versa. Further on testing the significance of correlation,
the relationship between INR and USD, EUR, GBP, CAD, CHF AND JPY is found to be significant in exhibit - 2 at 5% level
of significance. Hence, there is a correlation between gold price movements in INR and USD, EUR, GBP, CAD and CHF.
With the help of ANOVA it was found that the gold price movements in all the currencies do not differ significantly at 5% level
of significance shown in Exhibit – 3. If to observe the prices in months then there exists significant variability.
Exhibit – 2: Correlation analysis between Gold Price in INR and Key Currencies
INR USD EUR JPY GBP CAD CHF t value p-value
INR 1
USD 0.961 1
19 0
EUR 0.944 0.983 1
15.59 0
JPY 0.634 0.792 0.821 1
4.49 0
GBP 0.954 0.991 0.99 0.78 1
17.51 0
CAD 0.967 0.995 0.982 0.771 0.992 1
20.78 0
CHF 0.804 0.915 0.943 0.956 0.916 0.904 1 7.39 0
Exhibit – 3: Average Seasonal Indices of Gold Prices in INR, USD, EUR, JPY, GBP, CAD and CHF
Month INR USD EUR JPY GBP CAD CHF
Jan 93.7 97.7 97.3 99.6 97.3 98.9 99.1
Feb 95.3 98.5 98.7 100.3 98.7 99.7 100.5

INDIAN JOURNAL OF MANAGEMENT SCIENCE (IJMS) EISSN 2231-279X – ISSN 2249-0280
www.scholarshub.net Vol.– III, Issue – 3, July 2013
57
Mar 95.6 97.8 97.5 99.2 98.4 98.6 98.9
Apr 95.5 98.3 97.9 100.1 97.8 98.5 99.4
May 97.7 98.8 99.1 99.6 98.6 98.9 100.2
Jun 98.4 98.3 99.3 99.3 98.5 98.4 99.6
Jul 99.1 98.5 99.2 99.1 98.2 98.1 98.8
Aug 100.9 99.8 100.5 99.8 99.5 99.3 99.3
Sep 104.2 102.1 102.5 101.5 102.3 101.3 101.4
Oct 104.7 102.6 102.1 100.6 102.8 101.9 100.8
Nov 107.3 103.6 103.0 100.4 103.7 103.0 101.2
Dec 107.7 103.7 103.0 100.5 104.2 103.5 100.9
ANOVA
Source of
Variation SS df MS F P-value F critical
Months 344.6166283 11 31.32878439 13.6777363 0.00 1.936958
Currencies 0.000623457 6 0.00010391 0.00 1 2.23948
Error 151.1726593 66 2.290494837
Total 495.789911 83
Fig. 1.2 : Seasonal Indices of Gold Prices in INR, USD, EUR, JPY, GBP, CAD and CHF
It was found in the study from exhibit - 4 that the correlation between the gold price movement in India and exchange rate
between INR/USD works out to 0.64, low positive correlation of 0.08 found between inflation rate and gold price movement
and high positive correlation of 0.86 found between gold reserve in metric tons in India and gold prices in India. Further it was
found significant relationship between exchange rate and gold prices in India. If exchange rates goes up there is possibility that the gold prices in India will move up relatively high. This could be because of in International Market the value of gold is
determine in US Dollar and US is one of the major gold producers of world. And countries they purchase gold from IMF as
reserve which is also denominated in US Dollars. Moreover there is a significant relationship between gold reserves and gold
prices in India and gold prices in India is having insignificant relationship with the inflation. Indicates changes in the gold
reserves will cause good change in gold prices and change in inflation rate may cause less change in gold prices.
Exhibit – 4: Correlation between Gold Price Movements in India and Exchange Rate between
INR/USD, Inflation rate and Gold Reserves
INR INR/USD
Inflation
Rate
Gold
Reserves t value p-value
INR 1
INR/USD 0.641 1
4.57 0
Inflation Rate 0.08 -0.313 1
0.43 0.66
Gold Reserves 0.86 0.69 0.078 1 9.22 0
Impact of Exchange rate INR/USD on Gold Prices in India:
The impact of Exchange rate on gold prices movement in India is change in Re. 1 in exchange rate will cause change of Rs.

INDIAN JOURNAL OF MANAGEMENT SCIENCE (IJMS) EISSN 2231-279X – ISSN 2249-0280
www.scholarshub.net Vol.– III, Issue – 3, July 2013
58
882.42 in the gold prices in India through regression analysis shown in exhibit – 5. And the effect of exchange rate on gold
price movement in India found significant by using both t-test and ANOVA at 5 % level of significance.
This may be because currency plays a very important role in determining commodity prices and rupee depreciation has been a
major factor that has affected prices of commodities in the Indian markets. Taking the example of gold itself, the yellow metal
has witnessed sharp gains in the Indian markets as a weaker rupee supported gains. And as many countries they import gold
from international market, which is mostly represented in terms of US Dollar.
Exhibit – 5: ANOVA
df SS MS F Significance F
Regression 1 5409004657 5.41E+09 20.91757 7.74447E-05
Residual 30 7757599406 2.59E+08
Total 31 13166604064
Coefficients
Coefficients Standard Error t -Stat P-value
Intercept -9383.353924 6820.790917 -1.3757 0.1791
INR/USD 882.4184812 192.9385298 4.573573 7.74E-05
Impact of Inflation rate on Gold Price Movement:
The impact of inflation rate on gold prices movement in India is change in 1% in inflation rate will cause change of Rs. 506.14
in the gold prices in India through regression analysis shown in exhibit – 6. And the effect of inflation rate and gold price
movement in India found insignificant by using both t-test and ANOVA at 5 % level of significance.
This may be due to rupee depreciation stresses upon imports becoming expensive. As in the international market gold prices
are denominated in US dollars, the rise in the exchange rate could affect the commodity prices which are imported from the
other countries. Later athese imports become expensive this can cause rises in the domestic prices of the commodities.
Exhibit – 6: ANOVA
ANOVA
df SS MS F Significance F
Regression 1 77832580.48 77832580 0.17839546 0.675767669
Residual 30 13088771483 4.36E+08
Total 31 13166604064
Coefficients
Coefficients Standard Error t Stat P-value
Intercept 14899.84164 10327.81593 1.44269 0.159468126
Inflation Rate 506.1440585 1198.346036 0.422369 0.675767669
Impact of Gold Reserves in metric tons in India on Gold Price Movement in India:
The impact of Exchange rate on gold prices movement in India is change in 1 unit in gold reserve will cause change of Rs.
236.96 in the gold prices in India through regression analysis shown in exhibit – 7. And the impact of gold reserves on gold
price movement in India found significant by using both t-test and ANOVA at 5 % level of significance.
It was in the year 2009 when RBI purchased 200 metric tons worth $6.7 billion of gold from International Monetary Fund
(IMF) as part of the foreign exchanges reserves management operations, which was highest share in the total gold reserves sold
by the IMF. And made the gold prices to go up in the international market and national market.
Exhibit – 7: ANOVA
ANOVA
df SS MS F Significance F
Regression 1 9735181805 9735181805 85.11207077 2.88845E-10
Residual 30 3431422259 114380742
Total 31 13166604064

INDIAN JOURNAL OF MANAGEMENT SCIENCE (IJMS) EISSN 2231-279X – ISSN 2249-0280
www.scholarshub.net Vol.– III, Issue – 3, July 2013
59
Coefficients
Coefficients Standard Error t Stat P-value
Intercept -66043.75651 9407.29945 -7.02047988 8.39171E-08
Gold Reserve 236.9617285 25.685181 9.225620346 2.88845E-10
Impact of Exchange rate INR/USD, Inflation rate and Gold Reserves on Gold Prices in India:
The joint impact of exchange rate between INR/USD, Inflation rate and Gold Reserves in metric tons on gold price movement
in India is studied through multiple regression and results presented in exhibit – 8. Further the regression statistics found
significant at 5 per cent level of significance for 3 and 28 degrees of freedom. The effect of inflation rate and exchange rate on
gold price movement in India found insignificant because it is rupee depreciation which is reflected in inflation and inflation rate later affects the exchange rate. And the impact of gold reserves in metric tons on gold price movement in India found
significant.
Exhibit – 8: Impact of Exchange rate INR/USD, Inflation rate and Gold Reserves on Gold Prices in India
Regression Statistics
Multiple R 0.864016481
R Square 0.746524479
Adjusted R Square 0.719366388
Standard Error 10917.56747
Observations 32
ANOVA - Table
df SS MS F Significance F
Regression 3 9829192240 3.28E+09 27.48810528 1.71138E-08
Residual 28 3337411824 1.19E+08
Total 31 13166604064
Coefficients
Coefficients Standard Error t Stat P-value
Intercept -65602.30028 10592.78596 -6.19311 1.09018E-06
INR/USD 184.9683459 210.1672976 0.880101 0.386296514
Inflation Rate 401.8976552 729.9445275 0.550587 0.586283509
Gold Reserve 210.1479148 40.04108164 5.248308 1.407E-05
Conclusion:
From the present study it is clear that there exists no significant difference in gold price movements in INR and Key Currencies
but, if month wise to consider then there exists significant difference. Further the relationship between the gold price
movement in India and Key currencies market were found significant, which may affect the gold price movement in India due
to change in gold price of that particular currency. Further the change in INR/USD does effect significantly the gold price
movements in India in a higher manner i.e., change in exchange rate INR/USD will bring comparatively much change in the
gold price in India.
The impact of inflation rate found lesser than exchange rate and also insignificant as it is having low degree of association, further gold reserves is having lesser impact than exchange rates and inflation rates, still it has significant impact due to high
degree of association with gold price movements. When the joint impact of exchange rate, inflation rate and gold reserves
studied together on gold price movements in India, also shows significant and considerable impact. Moreover, if INR get start
floating in the International Market then there is possibility that change in INR/USD will affect more the gold prices in India.
References:
[1] Aggarwal, R., & Soenen, L. A. (1988). The nature and efficiency of the gold market. The Journal of Portfolio
Management, 14, 18-21.
[2] Baur, D. G., & Thomas K. McDermott (2010). Is Gold a Safe Haven? International Evidence, Journal of Banking &
Finance, 34, 1886–1898.
[3] Cengiz Toraman et.al. (2011). Determination of Factors Affecting the Price of Gold: A Study of [4] MGARCH Model. Business and Economic Journal, 2(4), 37-50.
[5] Deutsche, W. (2011). Central banks and major investors join gold rush. Retrieved from http://www.dw-
world.de/dw/article/0,,15292029,00.html.

INDIAN JOURNAL OF MANAGEMENT SCIENCE (IJMS) EISSN 2231-279X – ISSN 2249-0280
www.scholarshub.net Vol.– III, Issue – 3, July 2013
60
[6] Koutsoyiannis, A. (1983). A Short-Run Pricing Model for a Speculative Asset, Tested with Data
[7] from the Gold Bullion Market, Applied Economics, 15, 563–581.
[8] Lakshmi K (2007). Should India add more Gold to its Foreign Exchange Reserves, Retrieved from
http://ssrn.com/abstract=977127.
[9] Mahdavi, Saied & Zhou, S., (1997). Gold and Commodity Prices as Leading Indicators of Inflation: Tests of Long-run
Relationship and Predictive Performance, Journal of Economics and Business, 49, 475-489.
[10] Mani Ganesh & Srivyal Vuyyuri (2004). Gold Pricing in India: An Econometric Analysis, Retrieved from
http://ssrn.com/id=715841.
[11] Salent, S., & Henderson, D. (1978). Market Anticipation of government policies and the price of gold, Journal of Political Economy, 86, 227-249.
[12] Sjaastad, L., & Scacciavillani, F., (1996). The price of gold and the exchange rate, Journal of International Money and
Finance. 15, 879-897.
[13] Sujit, B. & Rajesh Kumar, B (2011). A Study on Dyanamic Relationship Among Gold Price, Oil Price, Exchange Rate
and Stock Market Returns, International Journal of Applied Business and Economic Research, 9(2), 145-165.
[14] Tandon, K., & Urich, T. (1987), International Market Response to Announcements of U.S. Macroeconomic Data,
Journal of International Money and Finance, 6(1), 7l-84
[15] World Gold Council (2009, 2010 and 2011), Quarterly Gold Demand Trends, Retrieved from (http:www.gold.org).
****

INDIAN JOURNAL OF MANAGEMENT SCIENCE (IJMS) EISSN 2231-279X – ISSN 2249-0280
www.scholarshub.net Vol.– III, Issue – 3, July 2013
61
THE KERALA BUILDING AND OTHER CONSTRUCTION
WORKERS WELFARE FUND BOARD –
SOCIAL IMPACT ON MEMBERS
Dr. Abdul Nasar VP,
Associate Professor, Department of Commerce,
KAHM Unity Women’s College,
Manjeri, Kerala, India
Dr. Muhammed Basheer Ummathur,
Associate Professor & Head, Department of
Chemistry, KAHM Unity Women’s College,
Manjeri, Kerala, India
ABSTRACT
This paper looks into the social dimensions of Kerala Building and Other Construction Workers
Welfare Fund Board (KBOCWWFB) from the members’ perspective. The study is presented on a member-non-member basis. To pinpoint the regional differences a district wise analysis is also
attempted. The analysis showed that the Board has made positive impact on training and job
satisfaction of the members and education of their children. The study also revealed that the trade unions in the construction sector play a dominant role in the enrolment and disbursement of benefits to
the members.
Keywords: Construction industry, Members and non-members, Educational assistance, Trade Unions.

INDIAN JOURNAL OF MANAGEMENT SCIENCE (IJMS) EISSN 2231-279X – ISSN 2249-0280
www.scholarshub.net Vol.– III, Issue – 3, July 2013
62
Introduction:
The Kerala model of development accords a prominent position to provide security to the working population in the
informal sector1. At present, there are 24 Welfare Fund Boards run by Tripartite Boards consisting of
representatives of workers, employers and the Government. In most Boards, the Government has retained the powers to give directions on policy matters. While successive State Governments continued to earmark substantial
resources and efforts to strengthen the Welfare Fund system, the present crisis afflicting many of the Boards needs
to be seen as an opportunity to reform the system. Even though the efforts made by Kerala in the field of social
service sector is laudable and appreciable; several questions arise now, such as approach, coverage, real content of the scheme, financial aspects, future operational efficiency and its impact on the workers. By following a
development policy entirely different from that of the other States in the country, the maintenance and improvement
of the quality of social services in Kerala have become extremely difficult2.
Realising the need for Social Security Schemes for the unorganised sector workers, Kerala Government has
initiated several progressive measures to provide Social Security to workers in the unorganised sector such as
agricultural workers, toddy workers, cashew workers, construction workers, etc. Among these, Kerala Building and Other Construction Workers Welfare Fund Board (KBOCWWFB or the Board) is unique in nature and worth
emulating for other unorganised sector workers3. Implemented in 1990, the Board has so far covered 14 lakhs
employees out of 16 lakhs working in the construction sector. Even though the coverage is satisfactory to a certain
extent, there is conflicting views regarding the impact of the scheme on the employees and the way in which the schemes are implemented. The success of a Welfare Fund Board has to be evaluated not merely on the basis of
number of members enrolled to it but also on the basis of the impact it has made on the socio-economic conditions
of its beneficiaries.
Review of Literature:
Vijaya Sankar, P. S. (1986) in a study on Head Load workers4 states that the basic objective of all Welfare Funds is
to provide a measure of social security and insurance for workers who are vulnerable to risks and uncertainties and
do not have any other institutional protection arising from their employment status. Vijaya Kumar, S. (1986) in his case study
5 found that trade unionism emerged as an insurance against job security and wage bargaining, but
subsequently it accentuated the process of segmentation in the labour market. In the process, workers belonging to
the powerful union established their working right in dominant sector while the weak were pursued to the less dominant segment. Anand, S. (1986) pinpointed the difficulties in providing welfare facility to the migrant
construction workers in Kerala due to the mobility of construction workplaces6. Jayasree, S. (1994) examined the
socio-economic and health status of women construction workers in the unorganised sector7 and found the impact
of welfare measures implemented by the Government and the extent of union participation among them. Women in
this sector suffer more due to their powerlessness, immobility and lack of bargaining power. Duvvury, Nata & Sabu
M George (1997) made an evaluation of the Welfare Funds in Kerala8. But the study makes only an overall
evaluation of all welfare schemes and not any specific one. A study on unemployment by Dolly Sunny (2000) found that in Kerala high priority was given for expansion of social and general services while production and
employment-oriented projects were either neglected or ignored9. Ignatius Pereira (2003) discussed reports
10 about
the seriousness of the role of labour mafia with the backing of powerful trade unions. He observed that trade unions are compelling to give employment to the workers given in the list supplied by them in some parts of Kerala. John,
C.P. (2004) through a socio-psychological analysis of the pensioners of KBOCWWFB showed that the breakdown
of the joint family and the emergence of nuclear family system create socio-psychological tensions in the lives of the elderly population
11. Personal and family liabilities compel a good proposition of the elderly construction
workers to engage in some kind of economic activities. Programmes will have to be developed to promote family
values and invigilate the young generation on the necessity and desirability of inter-generational bonding and
continuity. He offers some comments and suggestions to improve the welfare of the construction workers and the activities of KBOCWWFB.
Review of literature on construction industry shows that only few studies have been undertaken in India. These
studies highlight the general socio economic background of the construction workers and the nature and functioning of construction labour markets. In Kerala, despite the burgeoning construction and related activities, surprisingly
very few studies have been made to analyse the different dimensions of construction industry as a major form of
economic activity.

INDIAN JOURNAL OF MANAGEMENT SCIENCE (IJMS) EISSN 2231-279X – ISSN 2249-0280
www.scholarshub.net Vol.– III, Issue – 3, July 2013
63
Methodology:
A well-drafted interview schedule was used to collect data from the respondents. The first part of the interview
schedule evaluates the socio-cultural, educational and family background of the construction workers and the
second part is entirely devoted to questions, which indirectly measure the impact of the Board on its members. The data for the study were collected from the construction workers; both members and non-members. The performance
and functioning of the Board was primarily analysed by collecting data from the offices of KBOCWWFB, offices
of other Welfare Fund Boards in Kerala, Labour Department; Government of Kerala, the publications and records
of various trade unions, Department of Economics and Statistics, Kerala Planning Board and other related agencies. The districts selected for the study were Thiruvananthapuram (Trivandrum) as the capital of the State, Ernakulam
as the district in which construction activities take place on a mass scale, Malappuram as the district where the
people spent a major portion of their earnings from gulf countries on construction activities and Wayanad as the district having least construction activities and lowest number of membership in the Welfare Fund Board. Stratified
random sampling technique was used for the purpose of the sampling. The sample size is selected under
proportional allocation method. Equal number of members and non members (300 each) were selected from Thiruvananthapuram, Ernakulam and Malappuram districts. As a district having the least construction activity, only
100 members each were selected from Wayanad. The period of this study covers the whole life of the Board since
its inception in 1990. However, the fieldwork for the study was conducted during 2005-2007.
Results and Discussion:
Role of the Board on the Recruitment Pattern:
Mode of getting the job is an important factor influencing the socio-economic conditions of workers in any sector.
In the past, most of the jobs were ancestral and reserved for certain castes or families. But this situation has changed now. Due to the regular availability of jobs, reduction in the job opportunities in other sectors and
comparatively higher wage rates, there is an influx of new workers into this sector.
It is quite natural that the Board has its influence on the mode of recruitment of the people in to the industry. More
than one-third of the members and one half of the non-members got their present job by their own effort (Table 1). Labour contractors play a significant intermediary role in getting the job. Whenever, any contractor, employer or
owner wants employees, these labour contractors are ready to supply them. But for this, they charge commission
either in the form of reduction in the wages paid to the workers or ‘tips’ from the owners or contractors.
Table 1: Mode of Recruitment to the Industry (Percentage)
Mode of Recruitment Member Non-member Total
Own efforts 34.2 56.3 45.25
Labour contractor 13.8 6.9 10.35
Labour society 3 1.6 2.3
Other workers 14.4 15.8 15.1
Union 6.8 0 3.4
Welfare Fund Board 10.3 0 5.15
Employment exchange 4 0.7 2.35
Local influence 4.5 3.4 3.95
Political influence 1.3 0.6 0.95
From father/ancestors 5.6 12.9 9.25
Others 2.1 1.8 1.95
Total 100 100 100
The percentage of members who got job through Welfare Fund Board is only 10.30. This shows that the role of the
Board in recruiting people to the industry is too meager and insignificant. In fact, the Board should design a
scientific system of recruitment in order to obtain higher levels of workmanship. This can go a long way in improving the goodwill and public image of the Board.
The enrolment of traditional caste to the Board is also meager mainly because of the fact that trade union leaders
are least interested to enroll them due to their lack of political association to the union. At the same time there is

INDIAN JOURNAL OF MANAGEMENT SCIENCE (IJMS) EISSN 2231-279X – ISSN 2249-0280
www.scholarshub.net Vol.– III, Issue – 3, July 2013
64
complaint from the trade union leaders that a practice is emerging among individuals belonging to certain caste in
many parts of the State to enroll the persons belonging to a particular caste to the Board even though they are not
doing the construction job. Only 6.80 per cent of members got work through the trade unions and none of the respondents belonging to non-members agree trade union leaders have some role in procuring job to them. From
the workers’ point, it is advantageous as it ensures more employment and better wages. But, on the other hand, it
also enhances conflict with the public because they have to pay a higher wages. The study reveals that the role of the trade unions and the Welfare Fund Board is negligible in procuring job to the workers in this sector. The trade
union authorities are not giving due attention in this regard and concentrate mainly on the enhancement of the
number of employees enrolled to the Board through their union for the purpose of enhancing their political base.
Impact of Training on the Workers:
The technological revolution taking place in every field has its impact in this sector also. The method and technology of
different stages of construction work are changing frequently. The employees can cope up with these changes only through
training. Apart from creating confidence among workers, training improves their work efficiency. Towards this end the Board has launched an Advanced Building Technology Training Institute at Thiruvananthapuram. However, the institute has
not been successful in realising its objectives. The members and their children were not ready to undergo training even at
free cost offered by the Board. In fact, the Board has offered certain amount as stipend to the trainees. The members were of
the opinion that since ample employment opportunities exist in the sector, even to non trained workers, the time spent for training will be a waste which could otherwise be utilised for earning wages. Thus, the majority of the employees or their
children are not willing to spare few weeks for getting training. They get jobs without training and hence are not ready to
forego the wages of the training period. The stipend given by the Board is not attractive to the workers. Those who were trained by the Institute responded that the training has great impact on their workmanship. About 34 per
cent of the Institute trained members got better offer in multinational companies immediately after the training. Thus, the
Board has immense impact on its members in sharpening their skills which ultimately leads to better job prospects. Since non-members have no affiliation with the Board, they have no chance for free training offered by the Board.
Any similar training programmes offered by outside agencies are highly expensive and unaffordable to them.
Satisfaction of Members with the Construction Work:
The satisfaction in continuing a job depends on many factors such as regularity of employment, wage rate, working conditions,
future prospective, social security, etc. Large numbers of workers are attracted to the organised sector solely because of the
security provided by the sector such as regularity of work12
, leave with pay, provision for the future, etc. The Welfare Fund Boards are mainly constituted to provide social security to the workers in the unorganised sector. As revealed by the survey
(Table 2) the welfare fund for the workers in construction sector has succeeded in providing some satisfaction to members.
Table 2: Level of Satisfaction of the Board Members with the Existing Work
Scale Level of Satisfaction Members (percentage)
1 Well satisfied 41
2 Fairly satisfied 27
3 Unsatisfied 16
4 Fairly unsatisfied 6
5 Neutral 10
Total 100.00
The reasons to stick on the construction work are given in Table 3.
Table 3: Reasons for Satisfaction in the Construction Work
Reasons for Satisfaction Percentage of Members
Regularity of employment 23.25
Higher wage rate 14.55
Welfare benefits of the Board 26.40
Good working conditions 04.55
Future prospective 10.60
Other reasons 20.65
Total 100.00

INDIAN JOURNAL OF MANAGEMENT SCIENCE (IJMS) EISSN 2231-279X – ISSN 2249-0280
www.scholarshub.net Vol.– III, Issue – 3, July 2013
65
Social security measures offered by the Board seem to be one of the main reasons for satisfaction with the existing
work. It must be noted that there is hectic construction activities going on in Kerala due to the influx of petro-dollar
to the State. Thus, there is persistent demand for construction workers.
Couples working together:
If the workers are getting sufficient income, they usually do not like to see their spouse working especially in fields
like construction where manual labour is required. However, in some construction sites couples are working. The
survey revealed that the wives of 25.70 per cent of respondents are working either in construction field or other fields. Table 4 shows that family responsibility acts as a major hindrance to majority of the wives in undertaking any job.
The general belief is that the wife has to go for work only when the income of the family head is not adequate. In
some traditional communities, there is no practice of women participating in outdoor activities.
Table 4: Reasons for Wife Not Working (Percentage)
Reasons Members Non-members Total
Wife employed 23.30 28.10 25.70
Adequate income 7.90 2.70 5.30
Family responsibility 32.00 31.20 31.60
Unwillingness to do work 6.40 10.40 8.40
Non availability of suitable job 16.30 9.70 13.00
No practice of going for work 8.20 7.80 8.00
Other reasons 5.90 10.10 8.00
Total 100.00 100.00 100.00
Pearson Chi-square: 148.683, df = 17, p = . 000000
Further, as the calculated p value is less than 0.05, there exists significant difference among members and non-
members in the reasons of their wife not going for work.
Child Labour in Construction Industry:
Even though child labour is prohibited in India, due to the availability of job suitable to the children and
comparatively higher wages of the industry, children are working in the construction sector. There is no provision either in the Central or State Acts to enroll these child workers to the Welfare Fund Board. However, it may be
noted that children of 15 years and above are allowed to enroll as per the Tamil Nadu Act.
When the working conditions are good, wage rate is attractively high and there is regularity of employment, people
like to continue their ancestral job. About ¾ of the members and non-members do not like to see their children working in the construction sector as in Table 5.
Table 5: Child Labour and Workers’ Willingness
Workers’ willingness Member Non-member Total
Like to see children working in the
construction field 24.90 25.10 25.00
Do not like to see children working in the construction sector
74.60 72.80 73.70
Not responded 0.50 2.10 1.30
Total 100.00 100.00 100.00
Pearson Chi-square = 16.2465, df = 3, p = . 001011 Thus, even after 15 years of establishment of the Welfare Fund Board, it has failed to create a sense of security even
among the members. As the Chi-square = 16.2465, df = 3, p =. 001011; since calculated value p < 0.05, there is no
significant difference among members and non-members in seeing their children working in the construction sector.
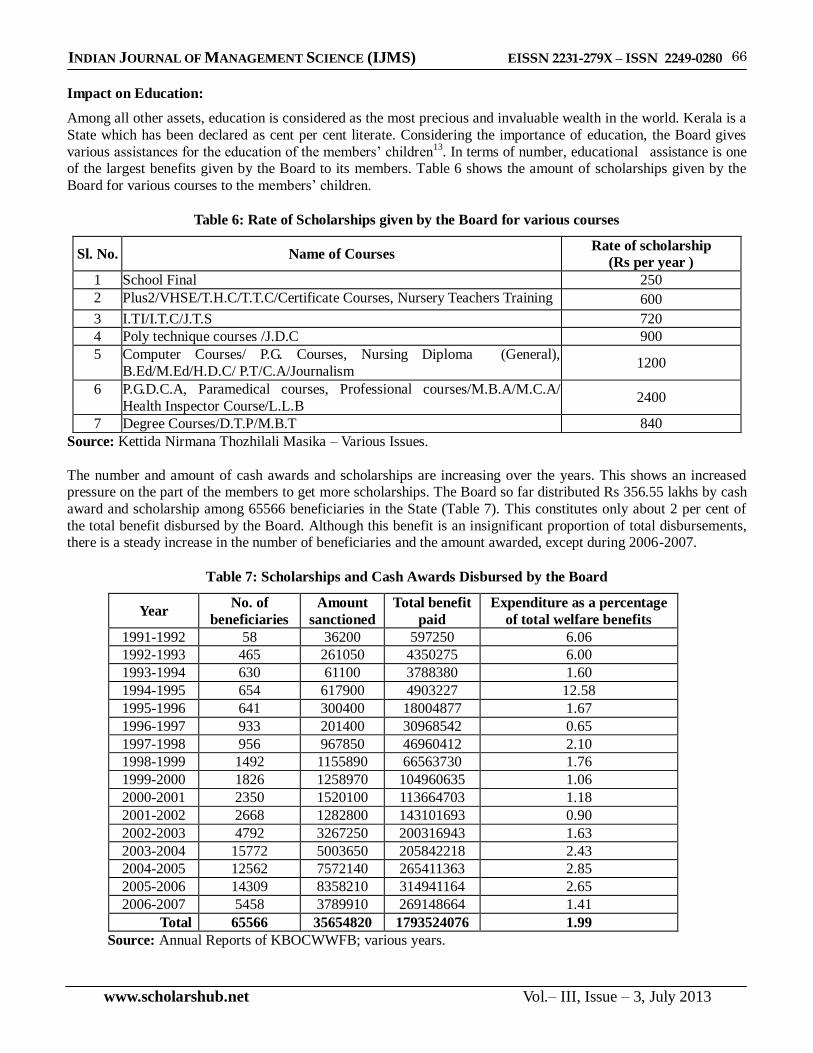
INDIAN JOURNAL OF MANAGEMENT SCIENCE (IJMS) EISSN 2231-279X – ISSN 2249-0280
www.scholarshub.net Vol.– III, Issue – 3, July 2013
66
Impact on Education:
Among all other assets, education is considered as the most precious and invaluable wealth in the world. Kerala is a
State which has been declared as cent per cent literate. Considering the importance of education, the Board gives
various assistances for the education of the members’ children13
. In terms of number, educational assistance is one of the largest benefits given by the Board to its members. Table 6 shows the amount of scholarships given by the
Board for various courses to the members’ children.
Table 6: Rate of Scholarships given by the Board for various courses
Sl. No. Name of Courses Rate of scholarship
(Rs per year )
1 School Final 250
2 Plus2/VHSE/T.H.C/T.T.C/Certificate Courses, Nursery Teachers Training 600
3 I.TI/I.T.C/J.T.S 720
4 Poly technique courses /J.D.C 900
5 Computer Courses/ P.G. Courses, Nursing Diploma (General),
B.Ed/M.Ed/H.D.C/ P.T/C.A/Journalism 1200
6 P.G.D.C.A, Paramedical courses, Professional courses/M.B.A/M.C.A/
Health Inspector Course/L.L.B 2400
7 Degree Courses/D.T.P/M.B.T 840
Source: Kettida Nirmana Thozhilali Masika – Various Issues.
The number and amount of cash awards and scholarships are increasing over the years. This shows an increased pressure on the part of the members to get more scholarships. The Board so far distributed Rs 356.55 lakhs by cash
award and scholarship among 65566 beneficiaries in the State (Table 7). This constitutes only about 2 per cent of
the total benefit disbursed by the Board. Although this benefit is an insignificant proportion of total disbursements, there is a steady increase in the number of beneficiaries and the amount awarded, except during 2006-2007.
Table 7: Scholarships and Cash Awards Disbursed by the Board
Year No. of
beneficiaries
Amount
sanctioned
Total benefit
paid
Expenditure as a percentage
of total welfare benefits
1991-1992 58 36200 597250 6.06
1992-1993 465 261050 4350275 6.00
1993-1994 630 61100 3788380 1.60
1994-1995 654 617900 4903227 12.58
1995-1996 641 300400 18004877 1.67
1996-1997 933 201400 30968542 0.65
1997-1998 956 967850 46960412 2.10
1998-1999 1492 1155890 66563730 1.76
1999-2000 1826 1258970 104960635 1.06
2000-2001 2350 1520100 113664703 1.18
2001-2002 2668 1282800 143101693 0.90
2002-2003 4792 3267250 200316943 1.63
2003-2004 15772 5003650 205842218 2.43
2004-2005 12562 7572140 265411363 2.85
2005-2006 14309 8358210 314941164 2.65
2006-2007 5458 3789910 269148664 1.41
Total 65566 35654820 1793524076 1.99
Source: Annual Reports of KBOCWWFB; various years.

INDIAN JOURNAL OF MANAGEMENT SCIENCE (IJMS) EISSN 2231-279X – ISSN 2249-0280
www.scholarshub.net Vol.– III, Issue – 3, July 2013
67
Even though in terms of number, educational assistance is the second largest (next to pension), the amount is the
least. On an average only 1 to 2 per cent of the total benefits are paid as educational assistance. It was highest
during the year 1994-1995. However, in the next year it was declined. During the years 1996-1997 and 2001-2002, it is even less than one percentage. Thus, the educational assistance is very meagre especially under the present
situation where people give more emphasise for the education of their children. Further, the cost of education is
increasing at a higher rate. Hence, it requires an increase in the various assistances provided by the Board to the education of the members’ children.
Educational Qualification of the Children of the Respondents (Above 5 Years of Age):
Educational assistance is one of the main attracting benefits of the Board members. The various schemes of
assistance are mainly framed to promote the educational status of the members’ children. As the Board gives assistance for the education from high school level onwards, 69.30 per cent of members have children studying
from high school level to professional courses while among non-members it is only 38.80 per cent (Table 8).
Further, during the survey, the members reported that the scholarship granted by the Board were of immense use in meeting the educational expenses of their wards.
Table 8: The Educational Qualification of the Members’ Children
Children Illiterate Lower
Primary
Upper
Primary HS HSS Degree
Professional
degrees Total
Member 1.20 15.70 13.80 41.60 17.20 8.60 1.90 100
Non-Member 2.70 29.40 29.10 27.10 8.30 2.10 1.30 100
Total 1.95 22.55 21.45 34.35 12.75 5.35 1.60 100
Aspiration of the Members Regarding the Education of their Children:
Education of children is considered as the main concern of people irrespective of level of income and socio-
economic status as most of the members and non-members have great aspirations regarding the education of their children. Even though most of them are satisfied with the existing conditions of work, many of them do not like to
see their children as workers in the construction sector. There is a feeling among the employees in this sector that
they were compelled to select this work due to lack of education and this should not happen to their children. However 15 per cent of members’ and 18.50 per cent of nonmembers’ children could not go for education as they
assist their parents in the construction work. The percentage of members having no children at the age of education
is 6.88 and that of non-members is 8.66. In this context the educational scholarships and cash awards introduced by
the Board become more relevant. Table 9 depicts a picture of the educational aspirations of members and non-members about their children.
Table 9: Aspirations Regarding Higher Education of Children (Percentage)
Aspiration for higher education Member Non-Member Total
Not interested 3.10 1.70 2.40
SSLC 5.60 12.80 9.20
Plus 2 14.70 17.50 16.10
Degree 37.20 29.70 22.10
Post Graduation 13.70 11.30 12.50
Professional education 21.20 14.80 18.00
Technical work 2.30 5.80 4.05
Not responded 2.20 6.40 4.30
Total 100.00 100.00 100.00
Pearson Chi-square: 189.404, df = 9, p = 0.00000.
As the calculated value of Pearson Chi-square = 189.404, df = 9, p = 0.00000; since P < 0.05, the association between
members and non-members is highly significant with regard to educational aspiration regarding the higher education

INDIAN JOURNAL OF MANAGEMENT SCIENCE (IJMS) EISSN 2231-279X – ISSN 2249-0280
www.scholarshub.net Vol.– III, Issue – 3, July 2013
68
of their children. Majority of the members responded that the educational assistance of the Board has influenced their
educational aspirations and they are confident in meeting the educational expenses of their children.
Satisfaction of the Board Members about Educational Assistance:
Majority of the members agree that the Board assistance has promoted the education of their children (Table 10).
Table 10: Satisfaction of the Board Members about Educational Assistance
Satisfaction Percentage of members
Satisfied 62.00
Unsatisfied 28.00
Neutral 10.00
Total 100.00
Trade Union Activity:
Construction workers are enrolled to the Board only on the production of a certificate from the contractor, labour
officer or registered trade union leader to the effect that the worker has worked for a minimum of 90 days
construction work during the previous year. But the contractors and labour officials are generally reluctant to issue such certificates due to the fear of future unfavorable consequences. But the trade union leaders are generally ready
to issue such certificates to any person, even without a ‘construction back ground’. They consider this as a medium
to propagate their political ideology and thus to increase their union membership. The survey (Table 11) reveals that
all the Board members are also members of the trade union. Among non-members only 16.80 per cent are members of a trade union and the majority is not affiliated to any political union.
Table 11: Trade Union Activity
Trade union membership Member Non-member Total
Member of trade union 100.00 16.80 58.40
Not a member 0.00 83.20 41.60
Total 100.00 100.00 100.00
Status of Membership:
During the survey an attempt was also made to analyse the level of union activities of the Board members. About one-third of the Board members are office bearers of various trade unions and the remaining two- third are only
primary members in various unions. Among non-members, only 8.33 per cent are office bearers while 91.67 per
cent have only primary membership in trade unions (Table 12).
Table 12: Status of Membership
Status of membership Member Non-member Total
Member 67.60 91.67 71.06
Office bearer 32.40 8.33 28.94
Total 100.00 100.00 100.00
This shows that there is high political involvement among Board members compared to non-members. It is quite
natural since the Board itself is a politically motivated one and trade union leaders control it, the members have to
be part and parcel of these trade unions. It was also found that compared to non-members, members occupy key positions in the trade union leadership.
Working Area of Trade Union:
The study also looked into the intensity of the trade union activities among the Board members. It is a common fact that
there are trade union leaders among the Board members and non-members working from local to national levels (Table 13).

INDIAN JOURNAL OF MANAGEMENT SCIENCE (IJMS) EISSN 2231-279X – ISSN 2249-0280
www.scholarshub.net Vol.– III, Issue – 3, July 2013
69
Table 13: Working Area of the Workers in the Trade Union
Area Members Non-members Total
Local 32.40 43.20 37.80
Taluk 20.28 18.36 19.32
District 28.80 27.17 27.98
State 14.35 10.12 12.24
National 4.17 1.15 2.66
Total 100.00 100.00 100.00
The Role of Trade Union Leaders in the Enrolment and Disbursement of Benefits The trade unions in the construction sector play a dominant role in the enrolment as well as disbursement of
benefits. The enrolment is mainly done through the trade union leaders and in most cases the members approach the
trade union leaders for getting benefits from the Board. However, there is difference of opinion among the members about the role of trade unions. Table 14 gives a picture of the extent of satisfaction among the members about the
role of trade union leaders.
Table 14: Satisfaction of the Members about the Role of Trade Union
Role of trade union Ernakulam Malappuram Wayanad Thiruvananthapuram Total
Satisfied 90.00 88.33 75.00 54.33 77.30
Not Satisfied 10.00 11.67 25.00 45.67 22.70
Total 100.00 100.00 100.00 100.00 100.00
Almost all members in the Board are enrolled through trade unions. In the disbursement of benefits also the trade union leaders assist the members in filling the application form, submission of application for benefits in the
District Executive Office of the Board and also in processing the application in the office.
Reasons for Dissatisfaction of the Trade Union Leadership:
The various reasons for dissatisfaction among the members about the role of trade unions are analysed in Table 15.
It was observed that 32.16 per cent of the members are dissatisfied due to the delay in submitting documents for enrolment and disbursement of benefits even after collecting the documents from members. The trade union leaders
reported that they usually wait for getting more applications from members so that the transaction cost could be
reduced. About one-fourth of the sample members find over politicalisation of membership as their cause of dissatisfaction. Once membership in the Board is taken through trade unions, it becomes a political trap. The trade
union leaders may compel the members to participate in the various programmes organised by the political parties.
In Wayanad district 80 per cent of members see over politicalisation of membership while in Thiruvananthapuram
district it is only 13.87 per cent.
Table 15: Reasons for Dissatisfaction about the Trade Unions
Reasons for dissatisfaction Ernakulam Malappuram Wayanad Thiruvananthapuram Total
Over politicalisation of membership 26.67 25.71 80 13.87 24.67
Cheating of members 20 14.29 20 20.44 19.38
Delay to submit documents 36.66 22.86 0 39.42 32.16
Over charging of members 0 14.28 0 21.9 15.42
Other reasons 16.67 22.86 0 4.37 8.37
Total 100 100 100 100 100
Pearson Chi-square: 120.233, df = 18, p = . 000000
There is a practice among trade union leadership to collect some additional amount to the union fund in addition to
their usual monthly subscription. This, according to them, is to meet the administrative cost of the union. There are many complaints against the unions that the members are overcharged.

INDIAN JOURNAL OF MANAGEMENT SCIENCE (IJMS) EISSN 2231-279X – ISSN 2249-0280
www.scholarshub.net Vol.– III, Issue – 3, July 2013
70
Conclusion:
This paper explains the district wise analysis of various social impacts by the Kerala Building and Other
Construction Workers Welfare Fund Board (KBOCWWFB) among its members. The data are also compared with
non-members to understand the effectiveness of the Board. The districts selected for the study are Thiruvananthapuram, Ernakulam, Malappuram and Wayanad. The study reveals that the role of the trade unions
and the Welfare Fund Board is negligible in procuring job to the workers in this sector. The Board has launched an
Advanced Building Technology Training Institute at Thiruvananthapuram. Those who were trained by the Institute
responded that the training has great impact on their workmanship and most of them got better offer in multinational companies immediately after the training. In terms of number, educational assistance is one of the
largest benefits given by the Board to its members. Majority of the members responded that the educational
assistance of the Board has influenced their educational aspirations and they are confident in meeting the educational expenses of their children. The trade unions in the construction sector play a dominant role in the
enrolment as well as disbursement of benefits. The enrolment is mainly done through the trade union leaders and in
most cases the members approach the trade union leaders for getting benefits from the Board. It is also found that compared to non-members, members occupy key positions in the trade union leadership. As revealed by the survey,
the Board has succeeded in providing satisfaction to 68 per cent of the members.
References:
[1] A. Sivananthiran & C.S. Venkata Ratnam. (2005). Informal Economy: The Growing Challenge for Labour Administration. Indian Industrial Relations Association (IIRA), New Delhi, International Labour Organization.
[2] K. K. George. (1993). Limits to Kerala Model of Development: An Analysis of Fiscal Crisis and its
Implications. Centre for Development Studies, Thiruvananthapuram. Monograph Series, p. 133. [3] Abdul Nasar, V. P., Aboobacker Sidheeque, K. T. & Muhammed Basheer, U. (2013). Kerala Building and
Other Construction Workers Welfare Fund Board – A Macro Picture. International Journal of Research
in Commerce and Management, 3(3), 25-38.
[4] Vijaya Sankar, P. S. (1986). The Urban Casual Labour Market in Kerala – A Study of the Head-Load Workers of Trichur (M. Phil Thesis). Centre for Development Studies, Thiruvananthapuram.
[5] Vijaya Kumar, S. (1986). Working Conditions and Wage Rates of Head load Workers -A Case Study (M. Phil
Thesis). University of Kerala, Thiruvananthapuram. [6] Anand, S. (1986). Migrant Construction Workers: A Case Study of Tamil Nadu Workers in Kerala (M. Phil
Thesis). Centre for Development Studies, Thiruvananthapuram.
[7] Jayasree. S. (1994). Women in the Unorganised Sector – A Case Study of Women Unorganised Workers in Kerala (Ph. D Theses). University of Kerala, Thiruvananthapuram.
[8] Duvvury, Nata & Sabu. M. George. (1997). Social Security in the Informal Sector - A Study of Labour
Welfare Funds in Kerala. Centre for Development of Imaging Technology, Thiruvananthapuram.
[9] Dolly Sunny. (2000). Unemployment and Employment of Educated Youth in Kerala. The Indian Journal of Labour Economics, International Series No: ISSN 0971-7927, Volume 43, Number 4, December.
[10] Ignatius Pereira. (2003). Law to curb `labour mafia' soon. The Hindu daily, Kollam, May 25.
[11] John C. P. (2004). Social Security and Labour Welfare with Special Reference to Construction Workers in Kerala. Discussion paper 65, Kerala Research Programme on Local Level Development, Centre for
Development Studies, Thiruvananthapuram.
[12] Labour Welfare and Social Security. Chapter 3.5, Tenth Five Year Plan, 2002-07, National Development Council. [13] Human Development Report .(2005). State Planning Board, Government of Kerala, Prepared by Centre for
Development Studies, Thiruvananthapuram, Kerala.
****

INDIAN JOURNAL OF MANAGEMENT SCIENCE (IJMS) EISSN 2231-279X – ISSN 2249-0280
www.scholarshub.net Vol.– III, Issue – 3, July 2013
71
A STUDY OF SOCIO ECONOMIC CONDITION OF CHILD
LABOUR ENGAGED IN RAG-PICKING AT SILCHAR
Shima Das,
Research Scholar,
Department of Management Mizoram University,
Aizawl, India
Dr. Amit Kumar Singh,
Assistant Professor, Department of Management
Mizoram University, Aizawl, India
Bidhu Kanti Das,
Assistant Professor, Department of Management
Mizoram University, Aizawl, India
ABSTRACT
A more serious and vulnerable group of the urban poor that is growing rapidly in the towns and cities is that of working children, with a home or without a home. Many of them may be just runaways, as a
result of broken home, allure by the city life, migration of their families, and have no other alternative
than to work. In this paper we made an attempt to find out the socio economic condition of child labour engaged rag picking in Silchar. Also, we try to find out the forcing factor for the children to
choosing the work and solution to solve this problem.
Keywords: Rack-pikers, child labour, Child work.

INDIAN JOURNAL OF MANAGEMENT SCIENCE (IJMS) EISSN 2231-279X – ISSN 2249-0280
www.scholarshub.net Vol.– III, Issue – 3, July 2013
72
Introduction:
The term ‘child labour’ means different things to different societies. A universally accepted definition of child
labour is not available. There are differences between child labour and child work. ‘Child work’ refers to occasional
light work done by children which in most of the societies is considered to be an integral part of the child’s socialization process. While helping parents at home and in family farms, children learn to take responsibility and
pride in their own activities, acquire certain skills and prepare themselves for the task of adulthood. ‘Child labour’
implies children prematurely leading adult lives, working long hours for low wages under conditions damaging to
their health and to their physical and mental development, sometimes separated from their families, frequently deprived of meaningful educational and training opportunities that could open up for them a better future.
It is true that if one wants to see a nation, he should see its children. No doubt work is worship but it never meant
the child labour. The problem of child labour is a burning problem of the world, and largest share of child labour of the world is in India. From the time immemorial, it had been a concern of the social reformers, the legislators, the
jurists, the philosophers, the politicians and economists, etc. Children’s are blooming flowers of the nation, nobody
should be allowed to pluck these flowers, rather they need their protection from the worst conditions prevailing in any society. The smile on their lips and innocence in their eyes required to grow further. As poverty is the root
cause of the child labour and India where more than thirty percent of the people leaves below the poverty line, two
meals in a day is the biggest worry of the people, where to have sufficient meals two times in a day is the goal of
life. It is not only the feeding of his own self, but feeding of his children too. These leads to the migration of the poor people in urban areas and putting their children at work where no other option left behind. Apart from it, the
long illness, death of earning member of the family, breaking down of family, left and run away children leads to
the problem of child labour in urban places. A more serious and vulnerable group of the urban poor that is growing rapidly in the towns and cities is that of
working children, with a home or without a home. Many of them may be just runaways, as a result of broken home,
allure by the city life, migration of their families, and have no other alternative than to work. Again they may not have sufficient skill and knowledge to work in an establishment. Also law prohibits the employer to employ them.
So, they take picking recyclable rags from dustbins, dumping grounds and other unhygienic places and selling it for
their livelihood.
Objectives:
The present study have the following objectives
1. To highlight the socio-economic background of children engaged in rag picking in Silchar.
2. To identify the health condition of children engaged in rag picking in Silchar. 3. To suggest measures to improve the conditions of the children in rag-picking work.
Research Methodology:
The present study is descriptive in nature and following are the outline of the methodology.
Sources of Data: in this study we utilized both primary and secondary data. The primary data was collected through direct interview, observation, schedules and case studies. The primary data sources were visiting different places of
Silchar town where child rag-pickers are accessible and working. The secondary data sources comprises of reports
published by government and NGOs, books, news papers, magazines and journals. The whole Silchar town was taken as universe of the study. The purposive sampling method was employed to select the sample for the study. It
is estimated that there are 300 child rag pickers in Silchar, therefore; 150 child Rag pickers (both boys and girls)
was selected for the present study.
Literature Review:
For the study of socio economic conditions of child labour engaged in rag picking at silchar following literature
were consulted to get an fair idea about the national scenario about the child labour working in different sectors and
its similarities with silchar. Assam. A survey of children at work (Mendelvich, 1979) tries to highlight the problem of child labour in India and its
causes. In fact, the problem of child labour in India may be seen as the result of traditional attitudes, urbanisation,
industrialisation, migration, and lack of schools or the reluctance of parents to send their children to schools, etc. In

INDIAN JOURNAL OF MANAGEMENT SCIENCE (IJMS) EISSN 2231-279X – ISSN 2249-0280
www.scholarshub.net Vol.– III, Issue – 3, July 2013
73
the ultimate analysis, main case is extreme poverty and agriculture being the main occupation of the majority of
population requiring more hands.
A report on the committee on child labour (ministry of Labour, Government of India, December, 1979) indicated that in our country, the tradition of educational learning outside home was confined to the upper caste, the
privileged classes. Children of the producing classes learnt the necessary skills and work in the family. Step by step
these children get steeped in the ethos of labour. Thus poverty and child labour always make each other and tend to reinforce themselves in families and communities. For a number of tasks, employers prefer children to adults.
Children can be put on non-status, even demeaning jobs, without much difficulty. Children are more amenable to
discipline and control. Child labour is also cheaper to buy and is a greater source of profit. In fact child workers are
not organised on lines of trade unions which can be militantly fight for their cause. Child labour is also justified on the ground that it trains the child's fingers in the required skill.
Taking the case of Haryana State, a study conducted on the working children in Hisar (Sharma, 1982) revealed that
a majority of the child workers joined the labour force due to acute poverty of their family, death and chronic illness of the earning members there was no source to supplement their family income. Children came from
different states. About 4/5 of the children came from the families whose average monthly income was less than Rs.
300 and the size of the family was 8 on an average. The social circumstances which also motivated the child workers to seek jobs were company of friends, rude behaviour of father and lack of affection in the family.
Another study on the working condition of children employed in unorganised sector (CSIR, 1984) which was based
on the sample of 900 male and female child worker below the age of 16 years indicated that the majority of children
employed in match units in Sivakasi were girls (67 percent). Only 8 percent were children below 10 years of age and a majority of the child workers (71 percent) were in the age group of 13-16 years.
A study on working children in urban Delhi (ICCW, New Delhi, 1997) has tried to examine the extent, causes and
consequences of child labour practices in Delhi. The study found that most of the children were employed in workshops and the children employed in tea stalls, dhabas and as domestic servants come from Uttar Pradesh and
Bihar. The average monthly income of their families was Rs. 321.50 and the average size of the household with
working children was 5. The number of working children per household generally increased with family size. The
daily hours of work in most of the establishments were 6-10; and against the maximum of six hours (for young person’s between the ages of 12 and 18) laid down in the Delhi Shops and Establishment Act. Nearly 50 percent of
the children in registered tea stalls and dhabas worked for more than 12 hours a day. The environment and working
conditions are unsatisfactory and most of the establishments are situated in the walled city and are located in lanes and by-lanes. The lighting and ventilation in these working areas are just sufficient to carry on the work but
sanitation and hygiene cannot be simply thought of in such conditions. Children engaged in manufacturing and
servicing earned less than Rs. 60, domestic workers earned 26-50 and those in shops and dhabas earned 26-50. The child workers in auto repair and cycle repair shops are being given Rs. 30 as wages. These children have to be
satisfied with low status
Gangrade and Ghatia’s (1983) reports on women and child workers in unorganised sector indicate that India has the
largest number of working children. The brick kiln industry in Stwarigaon near Delhi attracts poor rural families who work from October to June when there is no agriculture work. Families are paid on a piece work basis ranging
from Rs. 18-21 per 1000 bricks. So they use their children to increase their production. The children risk injury
from the work as well as silicosis of the lungs after three or four years of exposure to brick dust. A study on the child labour - a socio-economic perspective by Singh (1990) revealed that economic conditions of
41.5 percent of the worker's families forced them to undertake carpet weaving, 14 percent of the child workers
parents felt motivated to put their children in labour market who were getting in it bad company and in case of 13 percent child workers, they themselves wanted to earn and live like their colleagues in the community. A majority
of children 62.1 percent were illiterate and in rest of them education varied from first standard to eight standard. Of
the total child labour force, 72.5 percent of the child workers came from backward caste families, 19.1 percent from
scheduled caste and 5.5 percent from upper caste families. The employer’s preference to have child labour indicates that 33.5 percent preferred to employ children because they work hard. For 18.5 percent of the employers, child
labour is cheaper then adult workers and for 15 percent of the employers motivation has been that they can be put to
any job. It is also indicates that 39.9 percent child workers earned between Rs. 151 and Rs. 200 per month, 35.4 percent between Rs. 101-150, 44 percent between Rs. 51-100, 4.1 percent earned Rs. 50 or less whereas 18
respondents did not earn anything. It is also found that majority of the child workers accepted that they worked for
11 or more than 11 hours per day.

INDIAN JOURNAL OF MANAGEMENT SCIENCE (IJMS) EISSN 2231-279X – ISSN 2249-0280
www.scholarshub.net Vol.– III, Issue – 3, July 2013
74
Maurya (2001) in his study ‘Child Labour in India’ highlights about the legal provisions against exploitation of
child labour. This paper talks about the government of India’s ratification of six ILO Conventions concerning
working children and enacted appropriate laws for protecting them from economic exploitation and from performing any work that is, in a way, likely to be hazardous or harmful to their health or physical, mental,
spiritual, moral and social development. There are a number of enactments in the country which protect and
safeguard the interests of child labour. The employment of children below 14 years of age has been prohibited under (i) the Children (Pledging Labour) Act, 1933 (ii) The Factories Act, 1948 (iii) The Mines Act, 1952 (iv) The
Motor Transport Workers Act, 1961 (v) The Bidi and Cigar Workers ( Condition of Employment) Act,1966 (vi)
The plantation Labour Act, 1951 and (vii) The Child Labour (Prohibition and Regulation) Act, 1986. Apart from all
these legal provisions he found there is still a need to expand network of enforcement machinery required for enforcing various existing laws on child labour in the country. He said in his paper, this exercise, if done, will
certainly go a long way in saving the precious future of millions of working children in India.
Association for Development (2004) conducted a study on the problems of street and working children living railway stations in Delhi. The main objectives were to identify the needs and problems in the day-to-day life of
these children as well as abuse by various authorities and other sections of the society. The study was conducted
among children staying at New Delhi, Old Delhi and Hazrat Hizamuddin railway stations. A random sample of 100 respondents was taken for the study in the age group of 4-17 years. The findings of the study shown that 39 % of
the children were from U. P. followed by 26% from Bihar, 7% were from Delhi. Some of the children did not know
the name of their village. Most of them were from families belonging to the lower income group. 47% mentioned
abused by parents as the reason for leaving their home. Out of 100 respondents 52% did not desire to go back to their families. 36% replied in the affirmative to go to any institution like a home, and the remaining 64% said they
wish to remain on the street. It was also seem that most of the respondents often travelled to places outside Delhi
due to lack of home or a permanent place to stay. The major problems of these children faced in their daily life were harassment by police and lack of basic need of shelter most of these children were addicted to drugs also.
There is not any available data on the status of child labour in Silchar, hopefully this may be the first study to get
the socio economic condition of child labour engaged in rag picking.
Findings of the study:
Statistics deal with large mass of inter-related data. To make the study more useful and collection of most reliable
data, efforts have been taken to collect and arrange it in a systematic way. Collection of statistical data necessitates
a pre-consideration of the type of sampling to be undertaken. If a detailed and exhaustive enquiry is to be made, the census type of enquiry is unavoidable; but if the case is otherwise, other techniques of sampling may be effectively
used. As the scope of investigation in my study is large, it is difficult to apply census method for collection of
primary data. Therefore, the sample method of enumeration and collection have been used. For collection of
primary data, field survey was conducted by canvassing personal interview and response were filled up in an interview schedule. 150 child rag-pickers were interviewed, and there response were recorded and scrutinized. On
the basis of the data so collected, tabulation, analysis, and interpretation have been made as follows:
Table: 1 Analysis of data
Parameters Total no of
respondent Divisions
Chi-square
value
Age 150
4Years - 6 Years 11
31.867 7 Years - 9 Years 37
10 Years -12 Years 59
13 Years - 15 Years 43
Religion 150
Hindu 87
73.560 Muslim 60
Christian 3
Literacy Level 150 Illiterate 105
24 Literate 45
Attending schools 150 Yes 2
142.107 No 148

INDIAN JOURNAL OF MANAGEMENT SCIENCE (IJMS) EISSN 2231-279X – ISSN 2249-0280
www.scholarshub.net Vol.– III, Issue – 3, July 2013
75
Reasons for not attending
schools 148
Can’t afford 88 Analysis were made on
percentage
Parents did not send 6
Others 54
Native Place of the
Respondents 150
Silchar 84 Analysis were made on
percentage Outside silchar 66
Types of family 150 Nuclear 141 Analysis were
made on
percentage Alone 9
Years of Working as Rag Pickers
150
0 -1 year 10 2
Analysis were
made on
percentage
1 – 3 year 20 10
3 – 5 years 46 5
5- 7 years 46 0
7 - More 11 0
Age of the child when
started rag picking 150
Age Male Female
Analysis were made on
percentage
3 - 5 2 0
6 – 8 31 7
9 - 11 95 10
12 – 14 5 0
Reasons for preferring the Job
150
Reason Male female
Analysis were
made on
percentage
Getting Money 33 4
Getting food 91 13
Getting freedom 2 0
Don’t know 7 0
Forcing factor to join
Rag picking 150
Voluntarily 2 Analysis were
made on
percentage
Parents 41
Relatives 33
Self 74
Nature of Work 150
Regular 105 Analysis were made on
percentage
Part time 43
Occasional 2
Daily working hours of
Child rag Pickers 150
Working hours Full time Part time or
occasional Analysis were made on
percentage
3 - 5 13 9
5 - 8 50 34
8 - 12 42 2
Daily collection of Rags 150
Analysis were made on
percentage
1 – 3 Kg 24 6
4 – 6 Kg 44 29
7 – 9 Kg 28 9
10 – 12 Kg 9 1
Types of House 150
Own 27 Analysis were made on
percentage
Rent 89
Others (specify) 25
Sanitation facility 150
Yes 33 Analysis were
made on percentage
No 117
Daily Income 150
Rs.01 – Rs.30 72
72.773 Rs.31 – Rs.60 52
Rs.61 – Rs.90 21

INDIAN JOURNAL OF MANAGEMENT SCIENCE (IJMS) EISSN 2231-279X – ISSN 2249-0280
www.scholarshub.net Vol.– III, Issue – 3, July 2013
76
Rs.91-Rs.120 5
Contribution to
family/parents 150
Yes 108 Analysis were
made on
percentage No 42
Personal Habits 150
Chewing of pan/saada 129
Analysis were
made on
percentage
smoking 99
Drinking alcohol 45
Using drugs 03
Consume tea/coffee 150
Sickness/injury of child
rag pickers 150
Any other 83 8.640
No 57
Physical Appearance 150
Dirty & unclean 54 Analysis were
made on
percentage
Looking suffering from some disease/ Malnourished
90
Good health 6
Relation with
Community People 150
Friendly 10 Analysis were
made on
percentage Rejected 120
Others 20
Perception of social
status (affected by this
profession)
150
Yes 2 Analysis were
made on
percentage
No 13
Cann’t say anything 135
Job Satisfaction 150 Yes 35
42.667 No 115
Response Regarding the
State of Abuse 150
Abused 135 96
Not Abused 15
Source: Field study conducted in Silchar in 2010
The child rag pickers are started rag picking at the tender age of four. A vast majority of them are found in the
age group of 7 to 12 years, It was found that a vast majority of them are male, and a small portion of them are
female. Female child participation in this work is very less because of high level of risk involvement in work
place.
Majority of child rag pickers are Hindus and a sizeable percent of them are Muslim also. A negligible percentage
of Christan children were also found working as rag picker.
A vast majority of the rag pickers are illiterate; rest of them can write their name. Very few of them completed
primary level. Except few all of them are not attending school.
Majority of them are not attending school, because they can’t afford. Others are not attending school because of
various reasons like, parents were not sending, they have to earn their livelihood and contribute in their families.
Majority of the child rag pickers were from Silchar. Others were migrated from different parts of Barak valley
either with family or without family.
A vast majority of the child rag pickers were belonging to nuclear families with a large number of siblings. It was
found that few of them have grandparents also.
Majority of the child rag pickers were staying in rented houses and other places. Only a small percent of them are
living in their own home.
A small percent of street children had been found. They were generally staying at railway stations, bus stops and
other places; they are not staying at any fixed place. Generally other people are also staying with them.
Majority of them are collecting rag for last 3 years to five years. A small percent of them were working for one
years or less than that. And majority of them had started rag picking at the age of 2 to 11 years. Few of them have
started even at the age of four. They are working mainly for two reasons i.e., getting food and getting money.
Majority of them had chosen this work by their own. Other prominent portion was put in this work by their parents. These children’s are generally collecting plastic, papers including news papers, tins and irons, bottles

INDIAN JOURNAL OF MANAGEMENT SCIENCE (IJMS) EISSN 2231-279X – ISSN 2249-0280
www.scholarshub.net Vol.– III, Issue – 3, July 2013
77
canes, and food items also. It is found that majority of them are generally working five to eight hours; another
sizable percent were working even more than eight hours.
A vast majority of them are regular full time rag pickers. A sizable percent of them are working as part time rag
pickers. Part time rag pickers are generally involved with others job also, like begging, working as a coolie or part time helper at tea stalls or shops at footpaths.
A vast majority of them are collecting 3 to 5 Kg rags per day. And a sizeable percent of them are collecting 5 Kg
or less then it, and a small percent of them are collecting more than 5 kg.
Vast majority of the child rag-pickers are selling their rags to adult rag-pickers for variety of reasons like, rag
dealers are far away from the place of collection, and it needs extra cost to them. A sizable percent are selling directly to rag-dealers only.
A vast majority of the child rag picker and their family are living either on rented house or other places. A small
percent is found to living in their own houses. Again majority of them are living in a one room.
It is found a vast majority of them didn’t have any sanitary facility, they used to go river bank, open fields or
public toilets in bus stops, railway station, or any such places where the facility is provided for general people.
Except few all of them didn’t have electric facility in their home.
It is found that majority of them are earning Rs.30 or less then Rs. 30 per day. Majority of them are spending
their money for fooding, lodging only. A vast majority of them are contributing in their family.
A small percent of them were saving money for their future purposes.
A vast majority of the child rag pickers responded that their income is sufficient for their livelihood.
It is found that a sizable percent of the child rag pickers are engaged with other income also. They are generally
working as beggar, coolie part time helper at tea stall or other establishments. Others are working as full
time/regular rag-picker.
Majority of them have personal habits like, consuming tea, chewing pan or saada, and smoke.
A vast majority of them had some sickness or injuries in last six months.
Majority of them are suffering from skin disease or Cut and injury. Other is suffering from Respiratory problems
and frequent fever.
It is found that a vast majority they had consulted for their disease either doctors in government hospitals or
medicine shops. Remaining who had not consulted for their illness, they fell it was not necessary, or other
worker/parents has given some medicine or advised for curing that illness. Regarding affordability of the medication expenses, them had said, they can afford the medication expenses.
It was found only 3.33 percent of child rag-pickers are physically disabled. Remaining of them is physically fit.
Maximum child rag-pickers are dirty and unclean, they also seems to be suffering from some disease or highly
malnourished.
It is found that all of the child rag pickers are interacting with the people of community/ society. Vast majority of
them feel that community peoples behavior are rejecting in nature. Only a small percent of them had responded that they find community people are friendly. And a very small percent of the child rag-pickers were feels that
due to their profession, their social life is affected. And all most all of them were not able to say anything
regarding their social life.
A vast majority of the child rag-pickers were not satisfied with their job.
It was observed that except few all of the child rag pickers were the victim of different kinds of abuse, majority
of them are generally abused by adult rag pickers, buyers, shop-owners, and adult people. Kind of abuses faced by them were generally economic and physical.
Conclusion:
The study which was conducted on socio economic condition of child labour engaged in rag picking at Silchar, Assam found that majority of the respondents were belonging to the street children or the children from the family which are
below poverty line. As well as these children were suffering from various diseases like skin diseases, prolonged caugh &
colds. Majority of the children have bad habits like chewing tobacco, pan and smoke. They are dirty unclean and not
satisfied with their job. To reduce this problem government and non government organization intervention is required. Specially, government should provide boarding schools where these children can be accommodated.

INDIAN JOURNAL OF MANAGEMENT SCIENCE (IJMS) EISSN 2231-279X – ISSN 2249-0280
www.scholarshub.net Vol.– III, Issue – 3, July 2013
78
References:
[1] Ahmed, I. (1999). Getting Rid of Child Labour. Economic and Political Weekly , 34 (27), 1815-1822.
[2] Association for Development. (2004). A Study on the Problems of Street and Working Children at railway
station in Delhi. New Delhi: Association for Development. [3] Baruah, A. (2003). Child Abuse. New Delhi: Reference Publications.
[4] Bhadra, M. (1999). Girl Child in Indian Society. New Delhi: Rawat Publications.
[5] Brick, C. P. (2002). Street Children, Human Rights and Public Health: A Critique and Future Directions.
Annual Review of Anthropology , 31, 147-171. [6] Chaitanya, K. (1991). Child Labour among Digaru of Arunachal Pradesh. Economic and Political Weekly ,
26 (36), 2084-2085.
[7] CSIR (1984). (2005). Working Condition of Children Employed in Unorganised Sector. In M. R. Biju, Human Right in a Developinf Society (pp. 294-295). New Dehi: Mittal Publications.
[8] Dak, T. M. (2000). Child Labour in India. New Delhi: Serial Publication.
[9] Gangrade, K. D., & Gahtia, J. A. (1983). Women & Child Workers in unorganized sectors. New Delhi: Concept Publishing Co.
[10] Government of India. (1969). Report of the National Commission on Labour. New Delhi: Ministry of Labour,
Governemnt of India.
[11] Gunn, S. E., & Ostos, Z. (1992). Dilemmas in tackling child labour: The case of scavenger children in the Philippines. International Labour Review , 131, 629-646.
[12] I.C.C.W. (1997). Working Children in Urban Delhi. New Delhi: Indian Council for Child Welfare.
[13] Joshi, S. C. (2006). Child labour: Issues, Challanges and Law. New Dehi: Akansha Publishing House. [14] Kak, S. (2004). Magnitude and profile of child labour in 1990s - Evidence from the NSS data. Social Scientist , 32, 43-73.
[15] Khandelwal, A., Raj, N., & Ghosh, R. (1998). Child Labour in the Sports Goods Industry: Jalandhar - a case
study. Noida: V.V. Giri National Labour Institute. [16] Kumar, K. (1991). Banning Child Labour. Economic and Political Weekly , 26 (52), 2983.
[17] Madan, G. R. (1993). Indian Social Problem: Social Disorganization and Reconstruction. New Delhi: Allied
Publishers Limited.
[18] Mahajan, P. (2006). Status of Child Labour. New Delhi: Adhyan Publishers. [19] Mahanti, N. (2005). Educational Rehabilitation of Rag-Picker Children in Seemapuri - A Dream Come True.
New Delhi: Inter India Publications.
[20] Margaret, G., & Smit, R. F. (2004). The Children of Neglect When No One Care. New York: Routledge. [21] Nangia, P. (1987). Child Labour: Cause - Effect Syndrome. New Delhi: Janak Publishers.
[22] NIPCCD. (1993). Statistics on Children in India. New Delhi: National Institute of Public Cooperation &
Child Development.
[23] Pati, R. M. (Ed.). (1991). Rag Picking Children: Rehabilation of Child Labour in India. New Delhi. [24] Payal, G. (2008). Social Dimensions of Child Labour in India. New Delhi: Om Publications.
[25] Psacharopoulos, G. (1997). Child Labor versus Educational Attainment Some Evidence from Latin America.
Journal of Population Economics , 10 (4), 377-386. [26] Rao, K. H., & Rao, M. M. (1998). Employers' View of Child Labour. Indian Journal of Industrial Relations , 34 (1), 15-38.
[27] Sahoo, U. C. (1995). Child Labour in Agrarian Society. Jaipur: Rawat Publications.
[28] Sen, R. K., & Dasgupta, A. (2003). Problems of Child Labour in India. New Delhi: Deep & Deep Publications. [29] Sethi, G. R. (2004). Street Children: A Windo to the Reality. Indian Pediatrics , 41, 219-220.
[30] Sharma, C. K., & Singh, R. (1982). Working Children in Hisssar. Social Welfare , XXXIX (4), 22.
[31] Singh,A &SinghM(2012).Economic Efficiency of Human Values in Industries. Asian Journal of Management
Research,Vol.2,Issue 2,769-777 [32] Singh, A. N. (1990). Child Labour In India: A Socio Economic Perspective. New Delhi: Shipra Publication.
[33] Singh, S. (1982). Problem of Social Service Needs of Child Labour in Agriculture in U.P. Lucknow:
Department of Social Work, Lucknow University, . [34] Taira, K. (1969). Urban Poverty, Rag Pickers, and the "Ant Villa" in Tokyo. Economic Development and
Cultural Change , 17, 155-65.
[35] UNDP. (2000). Human Development Report. New York: Oxford University Press.
****

INDIAN JOURNAL OF MANAGEMENT SCIENCE (IJMS) EISSN 2231-279X – ISSN 2249-0280
www.scholarshub.net Vol.– III, Issue – 3, July 2013
79
STOCK MARKET ANOMALIES:
EMPIRICAL EVIDENCE FROM WEEKEND EFFECT
ON SECTORAL INDICES OF INDIAN STOCK MARKET
Potharla Srikanth, M.Com., M.Phil., UGC-NET., ACMA., PGDT., PGDIBO., PGDFM., NCFM., (Ph.D.)
Assistant Professor
Dept. of Commerce, Post Graduate College,
Constituent College of Osmania University,
Secunderabad. A.P., India
P. Srilatha, M.Com, PGDBA.,(Ph.D).
Ph.D. Scholar,
Department of Management,
JNTU, Hyderabad, India
ABSTRACT
The objective of the present study is to analyze the existence of a week-end effect in the selected CNX
indices. The present study considers the week-end effect in the selected sectoral CNX indices such as
Banking, the FMCG (Fast Moving Consumer Goods), the IT (Information Technology) and Pharma (Pharmaceuticals) during the period of 10 years from 1
st April, 2001 to 31
st March, 2011. The analysis
reveals that out of five week days, the highest returns were generated in Banking and Pharma sectors
on Wednesday; Thursday in the IT and Friday in the FMCG sectors. Under simple OLS (Ordinary Least Squares) regression, only the IT sector is experiencing week-end effect whereas under the
GARCH method, all the sectors except the IT are experiencing weekend effect.
Keywords: Stock market anomalies, weekend effect, CNX sectoral indices.

INDIAN JOURNAL OF MANAGEMENT SCIENCE (IJMS) EISSN 2231-279X – ISSN 2249-0280
www.scholarshub.net Vol.– III, Issue – 3, July 2013
80
Introduction:
Many studies documented evidence to support the view that there is randomness in stock prices of the Indian stock market. The
volatility in the stock prices is due to many factors viz., speculation, inflation, rising oil prices, interest rates, announcement of
corporate results/announcements, Government regulations, corporate restructuring, goods prices, money supply, exchange rates,
other political, social, economic and global events. Thus, the stock market in India is not fully efficient yet. Besides, there exist
anomalies such as calendar effect, week-day effect, week-end effect and market sentiments, creating, thereby, opportunities for
arbitrage. Hence, the study of capital market volatility assumes great importance to the Indian investors, regulators, brokers,
policy makers, dealers and researchers especially in the developing countries like India. The present study attempts to scrutinize the existence of a week-end effect in the selected CNX indices. The present study
considers the week-end effect in the selected sectoral CNX indices such as Banking, FMCG (Fast Moving Consumer Goods),
IT (Information Technology) and Pharma (Pharmaceuticals).
Literature Review:
Vipul Kumar Singh and Prof.Naseem Ahmad (2011) investigated volatility forecasting performance of the GARCH(1,1)
class models on different time series with and without parameter restrictions comprising closing prices of 1900 daily
observations of Nifty index for 23 sectors during 1st June 2001 to 31st December 2008. The sum of the GARCH coefficient is
close to one in almost all cases indicating the persistence of conditional variance. It is found that the TGARCH and PGARCH
specification to be preferred as it more reliably describes the Nifty index volatility processes1. Abhijeet Chandra (2011)
examined various seasonal patterns in returns in the stock markets across the world. These patterns often referred to as anomalies, can be seasonal. Results reveal that the turn-of-the-month effect and the time-of-the-month effect have significantly
existed in BSE SENSEX returns. Returns in the first few days of the month are found to be positively significant compared to
the remaining days of the month. Different time segments of a month, however, witness significantly varying returns. The
evidence of this study strongly supports the existence of calendar effects in the returns of the BSE SENSEX2. Manpreet Kaur
(2011) observed seasonal anomalies existing in stock returns in India. The daily closing prices of two indices- BSE 500 and
S&P CNX 500 have been used to examine the presence of month-of-the-year and day-of-the-week effects in the Indian stock
market during January 2002 to December 2009. The findings show presence of month-of-the-year effect but absence of day-of-
the-week effect in Indian stock market. This indicates that the Indian stock market is not fully efficient yet. The existence of
month-of-the-year effect may provide opportunities to formulate profitable trading strategies so as to earn the increased return
that does not commensurate with the risk3. Pratap Chandra Patri (2008) examined the stylized facts of stock returns, model
and estimate the time varying volatility, persistence of Indian stock market and the asymmetric impact of shock on volatility.
There is evidence of non-normality, time varying conditional volatility, and volatility clustering and leverage effect in Indian stock market. There is evidence of predictable time varying volatility. Periods of high/low volatility tend to cluster and
volatility showed high persistence. Negative shock increases the future volatility more than the positive shocks of the same
magnitude. The GJR-GARCH (1, 1) is the best volatility model according to the log likelihood value and to the diagnostic test
of the model's residuals. The GJR-GARCH model reduced the kurtosis level the most and had the lower Jarque-Bera statistic
value4. P K Mishra (2010) investigated the nature and characteristics of stock return volatility in the capital market of India in
the aftermath of global market slowdown by using the GARCH class models. The results provide the evidence of time varying
stock return volatility over the sample period spanning from January 1991 to August 2009. It is further found that the effect of
bad news is relatively greater in causing market volatility in India5.
Objective of the study:
The objective of this paper is to examine week-end effect in the returns of S&P CNX sectoral indices. The study also focuses on identifying the non-randomness of the selected sectoral indices returns during the trading days in a week.
Hypothesis:
In order to attain the above stated objective, the following hypothesis has been formulated:
Null hypothesis (H0): There is no week-end effect on S&P CNX sectoral indices.
Alternative hypothesis (H1): There is a week-end effect on S&P CNX sectoral indices.
Data and Methodology of the study:
The study covers a period of 10 years from 1st April, 2001 to 31st March, 2011. An attempt has been made to analyze the week-end
effect on the selected sectors. Sectors selected for the study are Banking, FMCG, IT and Pharma. CNX-Bank Index is used as proxy for Banking sector; CNX-FMCG for the FMCG Sector; CNX-IT for the IT sector; and CNX-Pharma for Pharmaceutical sector.
The study considers daily prices of the selected sectoral indices of the NSE. The indices daily prices are converted into natural
logarithmic returns and the same is used as inputs for statistical analysis. It is the general practice to use log returns for making
research with time-series data relating to financial markets as the log returns will take into account the compounding effect of

INDIAN JOURNAL OF MANAGEMENT SCIENCE (IJMS) EISSN 2231-279X – ISSN 2249-0280
www.scholarshub.net Vol.– III, Issue – 3, July 2013
81
returns. Descriptive statistics are used to provide simple summaries about the sample data. The measures used to describe the
data set are measures of central tendency and measures of variability or dispersion such as mean, standard deviation, Skewness
and Kurtosis. Simple Ordinary Least Squares (OLS) Regression equation has been estimated by taking log returns of daily
prices of selected indices as dependent variable and all the week-day dummy variables (except Friday) as predictors. A constant
(C) is included in the following equation as exogenous variable to represent week-end effect.
Following French (1980), daily dummy variables are created to test for the day-of-the-week effect by estimating the following equation:
Rit = α1iD1 + α2iD2 + α3iD3 + α4iD4 + C + εt
Where D1…D4 are the days of the week; α1i-α4i = coefficients to be estimated and εt = Random error term for day t.
In the above equation, D1 is a dummy variable which takes the value 1 if day t is a Monday and 0 for all other days of the week (days fall on Monday = 1; days falls on other days = 0); D2 is dummy variable which takes the value 1 if day t falls on Tuesday and 0 for all other days of
the week (days fall on Tuesday = 1; days fall on other days = 0); The remaining dummy variables are defined in the same manner.
The standard error measures the statistical reliability of the coefficient estimates. The value of t-statistic evaluates the contribution of
each independent variable to regression model. R-squared measures the success of the regression in predicting the values of the
dependent variable within the sample while Adjusted R-squared attempts to correct R-squared to more closely reflect the goodness of
fit of the mode in the population. Durbin –Watson (DW) Statistic for autocorrelation of the AR (1) type measures the auto-correlation
of the residuals. Autocorrelation refers to the correlation of a time series with its own past and future values.
After estimating regression equation under simple OLS method, again the regression equation has been estimated by using
Autoregressive conditional Heteroskedasticity (ARCH) method which categorizes predictors into two equations i.e., mean
equation and variance equation. Week-day dummy variables and constant are classified under mean equation; and under
variance equation, unconditional volatility is represented by constant (C); the effect of news on the log returns of daily prices of selected indices is denoted by one period lagged squared residuals [RESID (-1) ^2] and the effect of old news or conditional
volatility is represented by GARCH (-1). After arriving at the results under the ARCH regression, comparison has been made
between the results under simple OLS regression and the results under the ARCH regression.
Results and Discussion:
Based on the methodology discussed above, the analysis revealed the following results:
Descriptive Statistics for log return of sector indices: Descriptive Statistics like mean, standard deviation, skewness and Kurtosis have been computed to describe the characteristics
of the sample data.
Table 1: Descriptive Statistics for log return of Sectoral Indices
Week day
CNX
Sectoral
indices
N Mean Std.
Deviation Skewness Kurtosis
N Statistic Statistic Statistic Std. Error Statistic
Monday
BANK 499 0.0009570 0.0250786 -0.138 0.109 8.100
FMCG 499 0.0004657 0.0163316 -1.032 0.109 8.883
IT 499 0.0004318 0.0260096 0.062 0.109 6.829
PHARMA 499 0.0004093 0.0151469 -0.251 0.109 9.179
Tuesday
BANK 499 0.0005560 0.0203976 0.292 0.109 3.624
FMCG 499 0.0005716 0.0141258 -0.099 0.109 4.530
IT 499 0.0010571 0.0214997 0.442 0.109 3.556
PHARMA 499 0.0005548 0.0134316 -0.539 0.109 5.609
Wednesday
BANK 498 0.0016914 0.0198363 0.201 0.109 1.962
FMCG 498 0.0002795 0.0134729 0.225 0.109 2.437
IT 498 0.0005042 0.0238025 -0.463 0.109 9.075
PHARMA 498 0.0013590 0.0127047 -0.073 0.109 1.368
Thursday
BANK 499 0.0007111 0.0194559 -0.285 0.109 1.632
FMCG 499 0.0003068 0.0133516 -0.176 0.109 2.629
IT 499 0.0010922 0.0239565 -1.563 0.109 16.142
PHARMA 499 0.0001882 0.0126437 -0.445 0.109 2.367
Friday
BANK 489 0.0010265 0.0219534 -0.979 0.11 6.246
FMCG 489 0.0007876 0.0144468 -0.149 0.11 2.550
IT 489 -0.0050136 0.1089919 -20.71 0.11 447.826
PHARMA 489 0.0007818 0.0136050 -0.561 0.110 5.153
Source: Authors‟ calculations

INDIAN JOURNAL OF MANAGEMENT SCIENCE (IJMS) EISSN 2231-279X – ISSN 2249-0280
www.scholarshub.net Vol.– III, Issue – 3, July 2013
82
Table 1 presents the basic statistics of returns series from the four sectoral indices. The mean return is positive on all days for
all the sectors except on Friday for the IT. The highest return is reflected on Wednesday in Banking and Pharma; on Friday in
the FMCG; and on Thursday in the IT. The lowest return is reflected on Tuesday in Banking; on Wednesday in the FMCG; on
Thursday in Pharma; and negative returns on Friday in the IT sector. The standard deviation of daily log returns is highest on
Monday and lowest on Thursday for Banking, FMCG and Pharma sectors. On the contrary, it is interesting to note that the
standard deviation is highest on Friday and lowest on Tuesday for the IT sector. This is due to obvious reason that Monday,
being the first day-of-the-week, the stock market is highly volatile and closes with a low variance eventually. Thus, based on
the means of daily log returns for sectoral indices, the best return sectors are in the order of Bank, Pharma and IT followed by
FMCG sectors. However, based on the standard deviations, the risky sectors follow the order of IT, Bank, FMCG and Pharma. Further, the week-end effect (Friday effect) is quite apparent in the IT sector caused by negative mean returns and higher
standard deviation.
The kurtosis of all sectors investigated shows consistently positive value, suggesting that the series are leptokurtic that means
all series have a thicker tail and higher peak than a normal distribution. The Skewness of the distribution of log returns of
selected sectoral indices prices is found to be negative on almost all the days indicating that the left tail is longer; the mass of
the distribution is concentrated on the right of the figure and it has relatively few low values. This signifies the high probability
of relatively more number of large returns in the distribution of the series.
Estimation of Regression equation under Simple OLS method:
Table 2: Simple OLS Regression equation for estimating log returns of CNX sectoral indices daily prices
Dummy Variable Sectoral indices Coefficient Std. Error t-Statistic Prob.
Monday
BANK -0.0000695 0.001364 -0.050930 0.9594
FMCG -0.0003220 0.000915 -0.351650 0.7251
IT 0.0054450 0.003365 1.618357 0.1057
PHARMA -0.0004670 0.000855 -0.546334 0.5849
Tuesday
BANK -0.0004700 0.001364 -0.344827 0.7303
FMCG -0.0002160 0.000915 -0.236018 0.8134
IT 0.0060710 0.003365 1.804205 0.0713
PHARMA -0.0003210 0.000855 -0.376035 0.7069
Wednesday
BANK 0.0006650 0.001365 0.487106 0.6262
FMCG -0.0005080 0.000916 -0.554822 0.5791
IT 0.0055180 0.003366 1.639057 0.1013
PHARMA 0.0004830 0.000855 0.564683 0.5723
Thursday
BANK -0.0003150 0.001364 -0.231105 0.8173
FMCG -0.0004810 0.000915 -0.525297 0.5994
IT 0.0061060 0.003365 1.814644 0.0697
PHARMA -0.0006880 0.000855 -0.805064 0.4209
Constant
BANK 0.0010260 0.000970 1.058618 0.2899
FMCG 0.0007880 0.000651 1.210667 0.2261
IT -0.0050140 0.002391 -2.096646 0.0361
PHARMA 0.0008760 0.000604 1.451448 0.1468
Source: Authors‟ calculations
On Monday, Tuesday and Thursday, regression coefficients of all the sectors except CNX IT are negative indicating negative
impact on the daily log returns of the sectors indices; and on Wednesday only regression coefficients of FMCG is negative and
that of other sectors is positive. On all the weekdays, highest standard error is recorded only in the case of log returns of daily
prices of CNX-IT indices which indicates that the volatility in the distribution of log returns of CNX-IT is very high compared
to other selected sectors. The results of the study disclose that none of the week days have statistically significant impact on the
log returns of daily prices of selected sectoral indices. However, Tuesday, Wednesday and Thursday are documenting a
significant impact on log returns of daily prices of CNX IT index (P<0.10). In the regression equation, weekend effect has
been included as constant (C). „p‟ value of constant (C) is significant only in the case of CNX IT sector, indicating the week-
end effect only in the CNX-IT sector.

INDIAN JOURNAL OF MANAGEMENT SCIENCE (IJMS) EISSN 2231-279X – ISSN 2249-0280
www.scholarshub.net Vol.– III, Issue – 3, July 2013
83
Table 3: R-squared, Adjusted R-squared and Durbin-Watson Statistic under simple OLS Regression
CNX Sectoral indices R-squared Adjusted
R-squared Durbin-Watson statistic
BANK 0.000332 -0.001281 1.746765
FMCG 0.000167 -0.001447 1.930864
IT 0.001919 0.000309 2.001626
PHARMA 0.000909 -0.000695 1.826558
Source: Authors‟ calculations
From Table 3, it is observed that the R-squared value is almost equal to zero indicating that the proportion of variance in
dependent variable explained by the regression model is very poor. Adjusted R-squared is negative in all the sectors except IT,
indicating that the predictors are statistically not useful in fitting the regression model. Durbin-Watson test results reveals that
the log returns of daily prices of CNX-IT sector index are not experiencing any autocorrelation in its series, because the test
statistic value is very close to 2. Further, there is a presence of positive autocorrelation in the case of other selected sectoral indices.
Estimation of Regression equation under GARCH (1, 1) model:
After finding the presence of heteroskedasticity in the series of log returns of selected sectoral indices, ARCH method is used
in estimating the regression equation.
Table 4: Regression under GARCH (1,1) equation for estimating log returns of CNX sectoral indices daily prices
Mean Equations
Dummy Variable CNX Sectoral indices Coefficient Std. Error z-Statistic Prob.
Monday
BANK 0.000195 0.000978 0.199255 0.8421
FMCG -0.000300 0.000674 -0.444748 0.6565
IT 0.000804 0.001206 0.666755 0.5049
PHARMA 0.000145 0.000570 0.253658 0.7998
Tuesday
BANK -0.000619 0.001040 -0.595284 0.5517
FMCG -0.000247 0.000744 -0.331956 0.7399
IT -0.000749 0.001212 -0.618016 0.5366
PHARMA -0.000502 0.000709 -0.708532 0.4786
Wednesday
BANK -0.000133 0.001025 -0.130201 0.8964
FMCG -0.000636 0.000744 -0.854722 0.3927
IT 0.001335 0.001417 0.941789 0.3463
PHARMA 0.000488 0.000647 0.753027 0.4514
Thursday
BANK -0.000336 0.001021 -0.328544 0.7425
FMCG -0.000386 0.000723 -0.533999 0.5933
IT 0.000799 0.001102 0.724967 0.4685
PHARMA -0.000202 0.000656 -0.307379 0.7586
Constant
BANK 0.001579 0.000706 2.235130 0.0254
FMCG 0.001106 0.000509 2.175069 0.0296
IT 0.000277 0.000918 0.301815 0.7628
PHARMA 0.000910 0.000441 2.060715 0.0393
Variance Equation
CNX Sectoral Indices
BANK FMCG IT PHARMA
Constant
Co-efficient 0.00000872 0.0000133 -0.00000771 0.0000171
Standard Error 0.00000145 0.00000164 0.00000075 0.00000248
z-statistic 6.0274920 8.1064460 -10.276020 6.8898930
Prob. 0.000001 0.000001 0.000001 0.000001
RESID(-1)^2
(ARCH)
Co-efficient 0.107985 0.159811 0.372222 0.175544
Standard Error 0.008618 0.010789 0.020454 0.014592
z-statistic 12.52957 14.81176 18.19829 12.03017

INDIAN JOURNAL OF MANAGEMENT SCIENCE (IJMS) EISSN 2231-279X – ISSN 2249-0280
www.scholarshub.net Vol.– III, Issue – 3, July 2013
84
Prob. 0.000001 0.000001 0.000001 0.000001
GARCH (-1)
Co-efficient 0.876385 0.779128 0.851701 0.733536
Standard Error 0.009206 0.012901 0.007094 0.024717
z-statistic 95.19243 60.39307 120.0651 29.67704
Prob. 0.000001 0.000001 0.000001 0.000001
Source: Authors‟ calculations.
As shown in table 4, the regression coefficients for the selected sectors are positive except FMCG on Monday; on Tuesday, the
regression coefficients are reflecting negative impact on log returns of daily prices of all the selected indices; on Wednesday,
Banking and the FMCG sectors are experiencing negative impact while the IT and Pharma are experiencing positive impact; on
Thursday, all the sectors except the IT are experiencing negative impact. Constant in the regression equation is positive thus
indicating a positive weekend effect on log returns of daily prices of all the selected sectors.
Just as in the case of OLS regression, highest standard error is recorded for IT sector confirming comparatively highest
volatility in the log returns of daily prices of IT sector index. Z-test results are showing that none of the week days are
exhibiting statistically significant impact on the log returns of daily prices of selected sector indices. However, all the selected sectors, except the IT, are experiencing weekend effect.
Under variance equation, regression coefficient of ARCH shows the effect of news on the market and GARCH Coefficient
shows the effect of old news on the market. The coefficient of constant is a measure of unconditional volatility. The coefficients
of both the ARCH and GARCH variables in the Variance Equation are highly statistically significant (P<0.01) and the sum of
ARCH and GARCH is close to one. It indicates that shocks to the conditional variance are highly persistent.
Table 5: R-squared, Adjusted R-squared and Durbin-Watson Statistic under ARCH Regression
CNX Sectoral
indices R-squared
Adjusted
R-squared Durbin-Watson statistic
BANK -0.000312 -0.003140 1.746286
FMCG -0.000325 -0.003153 1.929995
IT -0.000338 -0.003166 2.000636
PHARMA -0.000060 -0.002874 1.826566
Source: Authors‟ calculations
From Table 5, it is observed that R-squared value is negative indicating that the proportion of variance in dependent variable
explained by the regression model is very poor. Adjusted R-squared is also negative in all the sectors indicating that the predictors are statistically not useful in fitting the regression model.
Comparison of regression equation results under simple OLS regression and GARCH (1, 1) regression model:
Under simple OLS regression method, Monday and Tuesday are revealing negative impact on all sectors except the IT, whereas
under GARCH (1, 1) method, Monday is exhibiting positive impact on all the sectors except the FMCG. Under OLS regression
method, Tuesday is exhibiting a negative impact on all the sectors except IT, whereas under GARCH (1, 1) method, IT has
negative impact on all the sectors. Under simple OLS regression method, Wednesday is showing a positive impact on all the
sectors except the FMCG, whereas under GARCH(1,1) Banking and the FMCG are experiencing negative impact while the IT
and Pharma are experiencing positive impact. Under both the methods of regression, Thursday is exhibiting negative impact
on all the sectors except the IT. Also, under simple OLS regression, the results of t-test reveal that none of the above week days
have statistically significant impact except on the IT sector(P<0.10) whereas under GARCH(1,1) none of the above week days have statistically significant impact on any of the selected sectors. Under simple OLS regression, none of the sectors except the
IT are showing a weekend effect, whereas under GARCH (1, 1) in contrast, all the sectors except IT are experiencing week-end
effect. The main reason for such opposite results obtaining under two different methods can mainly be attributed to the
presence of heteroskedasticity in log returns of daily prices of the selected sectoral indices. The results of the study prove that
simple OLS regression results will be spurious when heteroskedasticity is present in the time series data.
Conclusion:
The main purpose of the present study is to capture the stock market anomalies present in the form of week-end effect on the
stock prices. The analysis reveals that Banking and Pharma sectors have provided highest return on Wednesday; the IT sector
has provided highest return on Thursday; and FMCG has provided highest return on Friday.
Under simple OLS regression method, none of the selected sectoral indices are experiencing week-day effect except the IT, whereas regression results under GARCH method reveal that all the selected sectoral indices except the IT sector are experiencing weekend
effect. The regression results under GARCH clearly indicate the presence of conditional volatility in the selected sectors. This

INDIAN JOURNAL OF MANAGEMENT SCIENCE (IJMS) EISSN 2231-279X – ISSN 2249-0280
www.scholarshub.net Vol.– III, Issue – 3, July 2013
85
explains the rationale behind occurrence of altogether different results under simple OLS regression method.
The study discloses the fact that the stock prices of the IT sector are relatively very highly volatile which is reflected in highest
value of standard error. It is mainly because this sector is highly determined by the Foreign Institutional Investors on a large
scale besides its excessive dependence on exports, which are, in turn, influenced by the international market conditions. The
reasons for the presence of week-end effect in Indian stock market may be attributed to certain factors like short- selling,
investors‟ optimism between Monday and Friday, release of some good or bad news by corporate bodies on Friday.
On identifying the anomalous behavior of stock market in the form of week-end effect on the selected sectors in Indian stock
markets, it can be concluded that still the Indian stock market is not informational efficient. Thus, short term investors like
portfolio managers, mutual funds, institutional investors and other individual investors should keep in mind such type of market anomalies while managing their portfolios in the Indian stock market.
References:
[1] Vipul Kumar Singh and Prof.Naseem Ahmad (2011),” Modeling S&P CNX Nifty Index Volatility With GARCH Class
Volatility Models: Empirical Evidence From India”, Indian Journal of Finance, Vol.5, No.2, pp.34.
[2] Abhijeet Chandra (2011), “Stock Market Anomalies: A Test of Calendar Effect in the Bombay Stock Exchange (BSE)”,
Indian Journal of Finance, Vol.5, No.5, May 2011, pp.23.
[3] Manpreet Kaur (2011), “Seasonal Anomalies in Stock Returns: Evidence From India”, Indian Journal of Finance, Vol.5,
No.5, May 2011, pp.43.
[4] Pratap Chandra Patri (2008) “Econometric modeling of time-varying conditional heteroskedasticity and asymmetry in
volatility using GARCH and non-normal distribution: the case of National Stock Exchange of India”, Indian Journal of Economics and Business, Vol.7, No.1, pp.129-143.
[5] P K Mishra (2010), “A GARCH model approach to capital, market volatility: the case of India”, Indian Journal of
Economics and Business, Vol.9, No.3, pp.631-641.
****

INDIAN JOURNAL OF MANAGEMENT SCIENCE (IJMS) EISSN 2231-279X – ISSN 2249-0280
www.scholarshub.net Vol.– III, Issue – 3, July 2013
86
INTERNET BANKING: DOES IT REALLY IMPACTS
BANK’S OPERATING PERFORMANCE
Rajni Bhalla,
Assistant Prof. in Commrece
Panjab University Constituent College,
Nihal Singh Wala, Moga, India.
ABSTRACT
The development of the electronic banking industry can be discovered to the early 1970s. Information
technology has introduced new ways of providing banking services to the customers, such as ATMs and Internet banking. The concept and scope of e-banking is at nascent stage. But still Internet
banking is one of the major developments in the financial service sector in recent years. It is a tool to
attract as well as to retain the customers in the global banking sector. Internet banking enables its various users to use different alternatives available for different purposes like to retrieve account
information online, to make different transactions using internet banking technology or to get
information regarding any type of financial product or service. At first sight the Internet is the best medium for carrying out banking activities as it cut down the cost and accelerate the speed of
information transmission. There is an extent of dissimilarities in the services which are offered by the
banks with the coming out of internet banking services. So, it has been tried with the help of this paper
to study the nature, expansion and degree of internet banking services and also how these services put impact on the operational performance of banks. The present study is an attempt to scrutinize how
internet banking impacts operational performance of Indian Banks. This paper also includes critical
analysis of various peer reviewed, scholarly literature on the subject of the impact of internet banking on operating performance of banks.
Keywords: Internet Banking, Operational performance, Indian Banks, Information Technology.

INDIAN JOURNAL OF MANAGEMENT SCIENCE (IJMS) EISSN 2231-279X – ISSN 2249-0280
www.scholarshub.net Vol.– III, Issue – 3, July 2013
87
Introduction:
The development of the electronic banking industry can be discovered to the early 1970s. Technology has
introduced new ways of providing banking services to the customers, such as ATMs and Internet banking (Singh,
Chhatwal, & et al., 2002). This concept of internet banking is still in the halfway stage. But still Internet banking is one of the major developments in the financial service sector in recent years. It is a tool to attract as well as to retain
the customers in the global banking sector (Sharma, 2011). Internet banking enables its various users to use
different alternatives available for different purposes like to retrieve account information online, to make different
transactions using internet banking technology or to get information regarding any type of financial product or service. IT Act, 2000 (Information Technology Act) enacted by India to provide legal recognition to electronic
transactions and other related means of electronic commerce (Srivastva, 2007). ICICI bank is the initiator of
providing internet banking services in India. Now various public and private sector banks are delivering internet services to their customers. These banks currently offer “Fully Transactional Websites” to its customers. The
facilities which are enjoyed by the through internet banking facility includes: account summary, online shopping,
online payment of bills, mobile recharge, inter account transfer, seeking products and their rates information, apply for loans online, payment of taxes online, cheque book request, credit card payments/ statements, facilities to
contact account managers, etc. (Geetha and Malarvizhi, 2012).
At first sight the Internet is the best medium for carrying out banking activities as it cut down the cost and
accelerate the speed of information transmission. There is an extent of dissimilarities in the services which are offered by the banks with the coming out of internet banking services. So, it becomes necessary to study the nature,
expansion and degree of internet banking services and also how these services put impact on the operational
performance of banks.
Role of E–Banking in the Indian Banking Sector:
„Any time, Any Where Banking‟ i.e. Internet Banking is a replacement of banks traditional offerings to the
customers. Initially the internet banking services were launched in the metropolitan cities and banks situated in the
urban areas of India but as time passes these services were also introduced in the semi urban areas and rural areas (Keivani, Jouzbarkand, and et al., 2012). The use of internet banking is one of the factors having influence in the
growth of Indian banking industry. Today no one can imagine his or her life without internet banking because our
daily needs are now directly depend upon the e-banking. Whether we are going for the shopping or whether we want to pay our monthly bills, e-banking is now providing a great help to us to do all this no time. The use of
internet banking has placed the banking personnel out of scene due to which the customers find it difficult to
undergo with the transaction offered by the banks to the customers. (E-Banking and its role in today‟s society). The internet banking also provides new opportunities to the banks to explore the new ways of providing value added
services to the customers to expand their customer base as well as business (TNO Report on E-Commerce in
Banking Sector, 2001).
Internet Banking and Operational Performance of the Banks:
As internet banking is now a vital element of the banking sector then it can be rightly said that it is an inseparable
part of the banks. Internet banking has a great impact on the operational performance of the banks. Internet banking
has quite high initial set-up costs following highly savings in future. Internet banking has changed the methods and techniques of marketing, advertising, pricing, financing etc. Revenues of the banks have increased after the
adoption of internet banking as banks have provided the information regarding their e-products to the customers on
the websites in detail. Research proves that the processing time of the transactions has been considerable reduced
with the introduction of internet banking and also workload of the employees has been decreased due to the division of work and less processing time (Kaushal, 2011). In today‟s world the bank having modern and high
technology are treated as brand banks. Customers also presume that it becomes necessary for the banks to follow
new and modern technology to become a brand. The competitive ability of the banks is also augmenting due to the increasing competition in the banking sector which also has a positive influence on the operating efficiency of the
banking sector. Where internet banking offers relief to the customers at the same time it provides cost cutting to the
banks by eradicating physical documentation. Cost of communication through WWW i.e. World Wide Web is also least as compared to other means of communication. Internet banking saves time of bank as well as those of
customers (Kaushik, 2012).

INDIAN JOURNAL OF MANAGEMENT SCIENCE (IJMS) EISSN 2231-279X – ISSN 2249-0280
www.scholarshub.net Vol.– III, Issue – 3, July 2013
88
The use of internet in the banking sector has direct relationship with the profitability. Ceteris paribus, the profit
margin of banks increased with the investment in electronic banking and also reduction in costs and increase in
non-interest income also increases the ROA and ROE (Gupta and Islamia, 2008). Compared to the traditional methodology, online banking is an economical forthright way to conduct banking business, exchange of
personalized information and buying and selling of goods and services from any place at any time (Jalal, Marzooq,
and et al., 2011). This only is sufficient reason for banks to congregate to Internet and to provide maximum of their services through Internet and as soon as possible. In order to maintain the cost efficiency, banks have to constantly
upgrade the changing and well- tested technologies. The banking sector also has to consider the additional security
measures in the internet banking because internet is a public domain and demands sufficient and additional security
measures (Report on Internet Banking by RBI, 2008).
Operational Performance of the Banks: Internet and Non-Internet Banks:
The internet banking has simply added another delivery channel to the already available existing channels. Due to
this the number of banks providing financial services through internet is increasing at a rapid rate in India. Now customers without leaving their homes or place of business can use their banking services easily. But the banks
which are still not using the internet as a medium of banking i.e. non-internet banks are lacking in operational
efficiency and performance as compared to the internet banks. As the internet banks are providing trading services
to their customers with the help of fully transactional websites which results in the more revenue generations to these banks as their customer base has been increased and also non- interest income has been improved. But the
non-internet banks are only dependent upon the customers who can physically visit their banks and such banks also
find difficult to expand their customer base because now customers are looking for the more comfortable services which the non-internet banks are looking hard to provide with great efficiency as internet banks are providing. The
asset quality of the internet banks is also higher than the non-internet banks (Malhotra, Singh, 2009). The Internet
delivery channel of banks serves as complementary mean of transacting with customers rather than a substitute for physical branches. Despite the large investment in the Internet as a channel of distribution, the branch network
remains an important channel for retail banking product and it adds more in the operational efficiency of the
internet banks (Hernando, Nieto, 2006).
Conclusion:
The present paper is an attempt to study the impact of internet banking on the operational performance of the banks
in India. The analysis indicates that the internet banks are more efficient and showing better performance in terms
of profitability, asset quality, reduction in overhead expenses etc. as compared to non-internet banks. From the research I come to know that internet banking is really a way forward to the Indian banking industry. Where the
internet banking is providing comfortable services to customers on one hand, also on the other side, it helps in
cutting down cost. The main aim of the banking sector to shift towards electronic means is to increase their
clientage, to serve the customers with best of the services, to facilitate them and to boost customers‟ loyalty.
References:
[1] E-Banking and its role in today‟s society accessed from http://www.articlesbase.com/finance-
articles/ebanking-online-banking-and-its-role-in-todays-society-40435.html as on 05-05-2012. [2] Geetha, K.T., and Malarvizhi, V., (2012), “Acceptance of E-Banking Among Customers: An Empirical
Investigation in India,” Journal of Management and Sciences, 2(1), p. 2.
[3] Gupta, P.K. and Islamia, J. M., (2008), “Internet Baking in India- Consumer Concerns and Bank Strategies,”
Global Journal of business Research, 2(1), p. 44. [4] Hernando, I., Nieto, M. J., (2006), “Is the Internet Delivery Channel Changing Banks´ Performance? The
Case of Spanish Banks,” Journal of Banking and Finance, pp. 2-16.
[5] Jalal, A., Marzooq, J. and et al., (2011), “Evaluating The Impact of online banking factors on motivating the process of E- Banking,” Journal of Management and Sustainability, 1(1), p. 33.
[6] Kaushal, R. (2011), “Impact of E-Banking on the Operational Performance and Service Quality of Banks,”
Ph.D. Thesis, Punjabi University Patiala, Punjab, pp.205-06. [7] Kaushik, A. K., (2012), “E-Banking System in the SBI,” International Journal of Multidisciplinary Reseach,
2(7), pp. 90-96.

INDIAN JOURNAL OF MANAGEMENT SCIENCE (IJMS) EISSN 2231-279X – ISSN 2249-0280
www.scholarshub.net Vol.– III, Issue – 3, July 2013
89
[8] Keivani, F.S., Jouzbarkand, M. and et al.,(2012), “A General View on the E-Banking,” Proc.ICFME
2012,Singapore, p.63.
[9] Malhotra, P., Singh, B. K. (2009), “The Impact of Internet Banking on Bank Performance and Risk: The Indian Experience”, Eurasian Journal of Business and Economics, 2(4), p- 53.
[10] Report on Internet Banking by RBI, (2008), pp. 3-14.
[11] Sharma, H., (2011), “Bankers perspective on E-Banking,” National Journal of Research in Management, 1(1), pp. 71-72.
[12] Singh, S., Chhatwal, S. S. & et al., (2002), “Dynamics of Innovation in E-Banking,” Proc. ECIS 2002: The
Xth European Conference on Information Systems, Poland, pp. 1527-28.
[13] Srivastva, R. K., (2007), “Customer‟s Perception on usage of Internet Banking,” Journal on Innovative Marketing, 3(4), p. 67.
[14] TNO Report on E-Commerce in Banking Sector (2001), p. 21.
****