el nino & la nina tam 2013-22
TRANSCRIPT
EL NINO & LA NINA
R. THANUSHATAM/13-22Dept GPBR
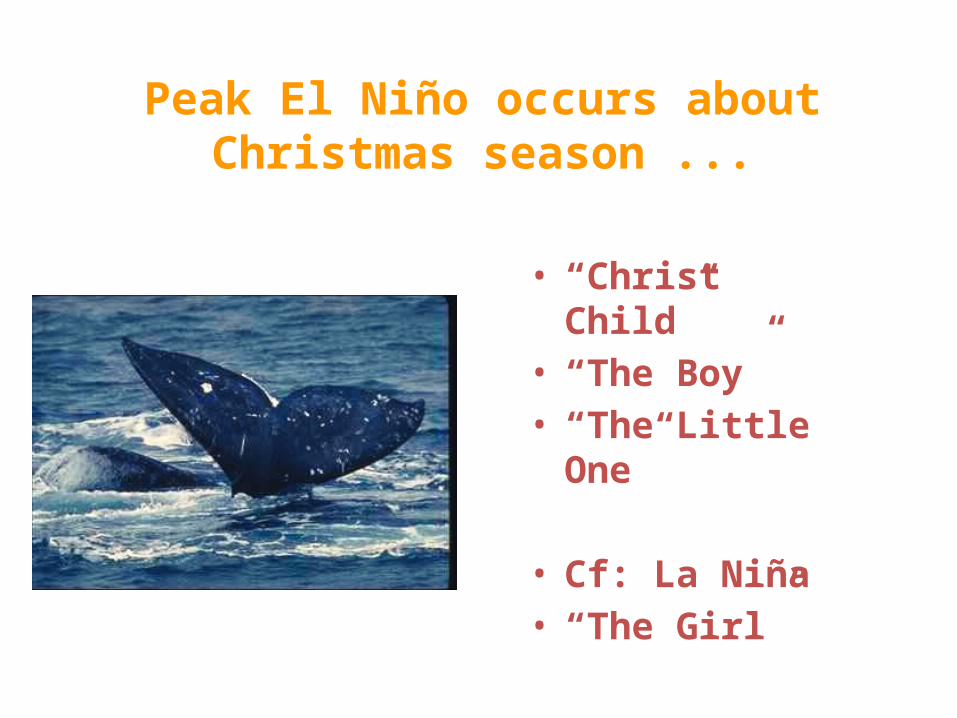
Peak El Niño occurs about Christmas season ...
• “Christ Child”• “The Boy”• “The Little
One”
• Cf: La Niña• “The Girl”
State Agricultural Response Team 9
• El Niño Phase – Warmer than normal sea surface temperature in the Pacific Ocean near the equator
Example: Strong El Niño phases in 1982-83 and 1997-98 caused excessive rainfall on the West Coast and the Gulf coast
• La Niña Phase – Cooler than normal sea surface temperature in the Pacific Ocean near the equator
Example: 1998-99 and 1999-2000 La Niña phases caused drier and warmer winters in Florida. Result: increase forest fires; drier and warmer than usual temperatures in other parts of the U.S.
El Niño and La Niña Phases
El Niño and La Niña: What are they?
State Agricultural Response Team 8
• Caused by changes in sea surface temperature (SST) in the equatorial Pacific Ocean
• Strongly influence climate around the world
• Return every 2 to 7 years but do not always follow each other
• Affect production of winter vegetables and other crops in the southeast U.S.
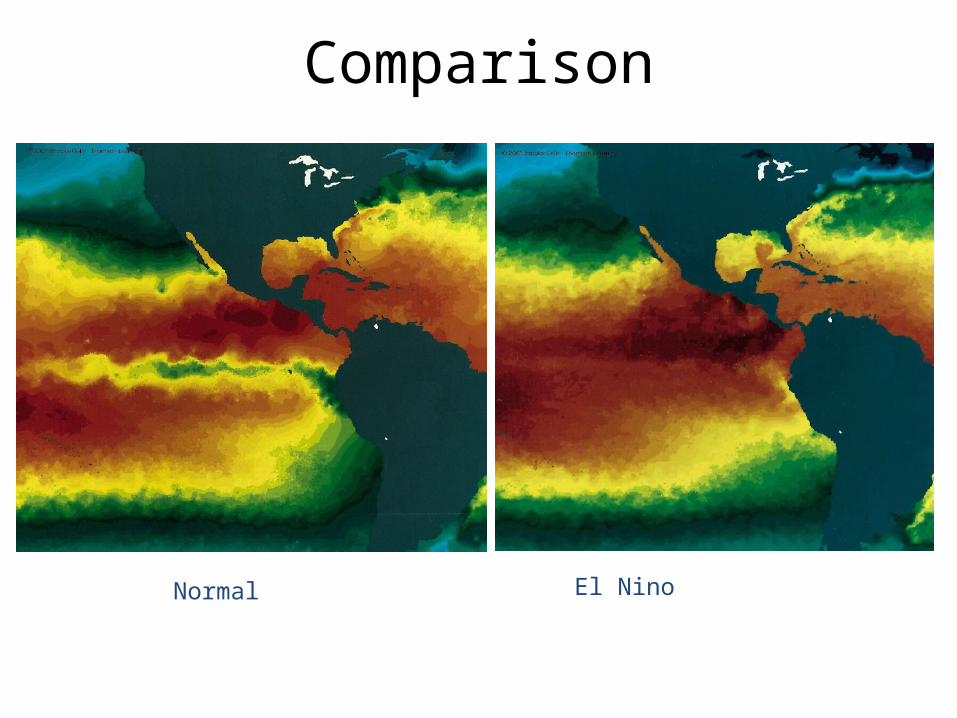
Comparison
Normal El Nino
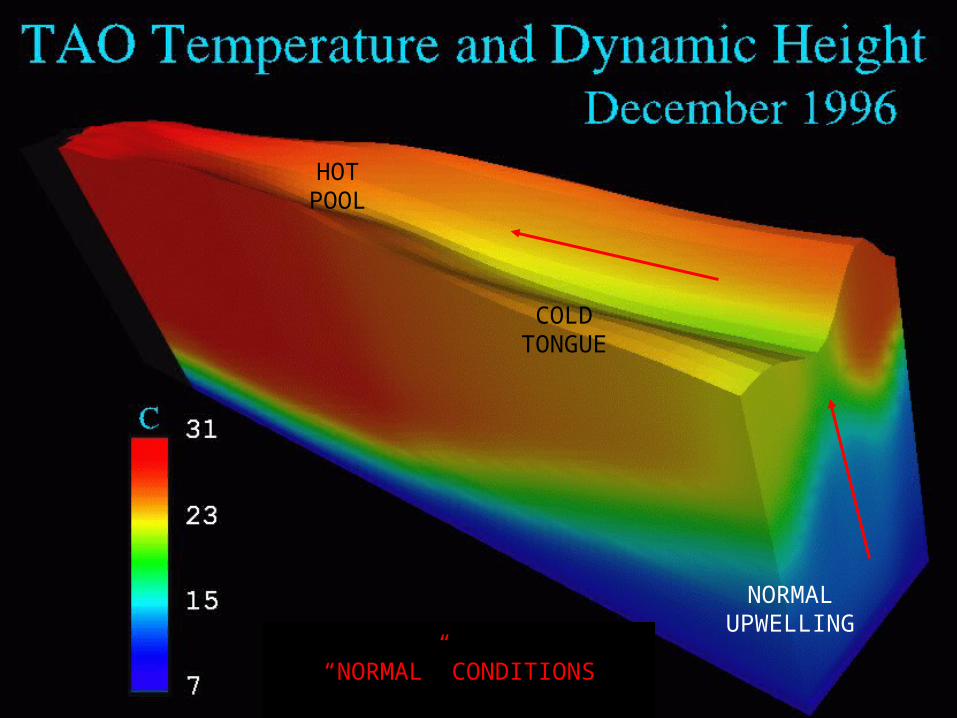
“NORMAL” CONDITIONS
HOTPOOL
COLDTONGUE
NORMALUPWELLING
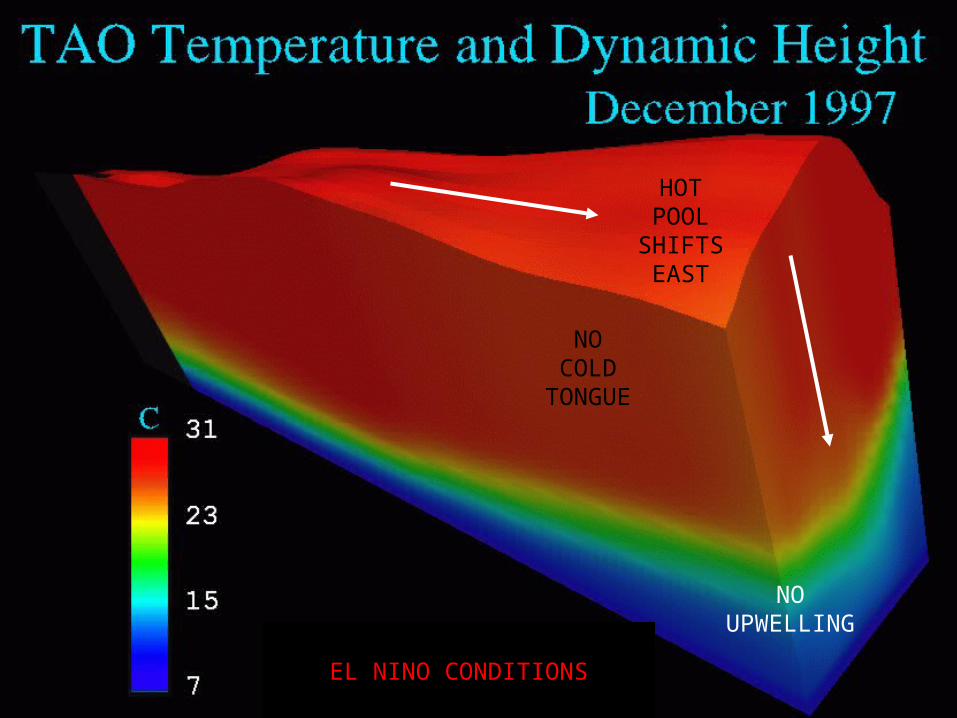
EL NINO CONDITIONS
HOTPOOL
SHIFTSEAST
NOCOLD
TONGUE
NOUPWELLING
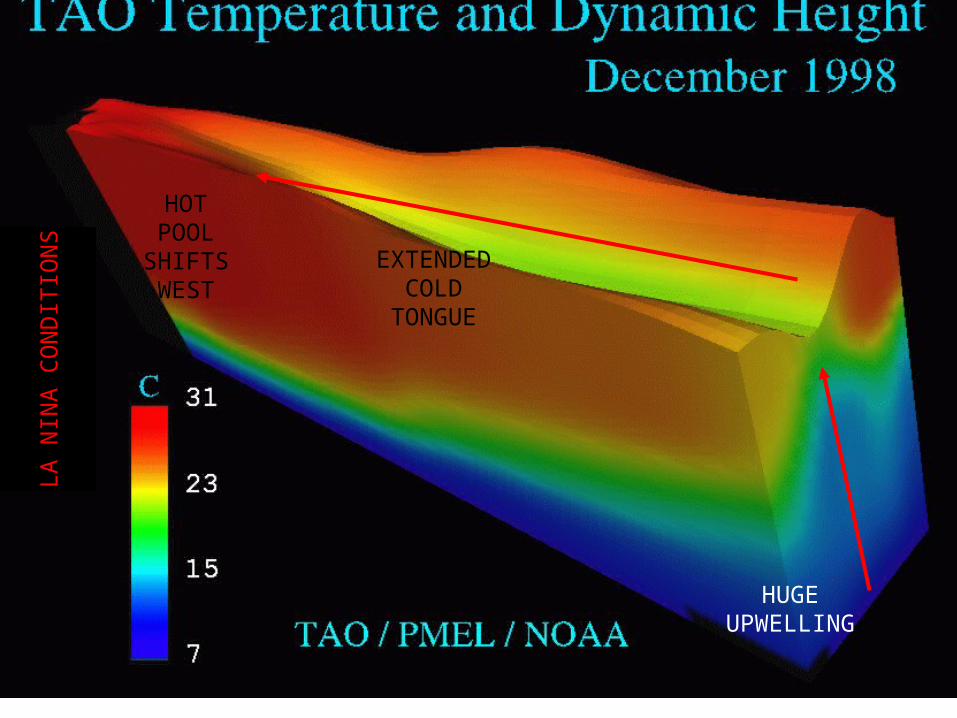
LA N
INA
CO
ND
ITIO
NS
HUGEUPWELLING
HOTPOOL
SHIFTSWEST
EXTENDEDCOLD
TONGUE
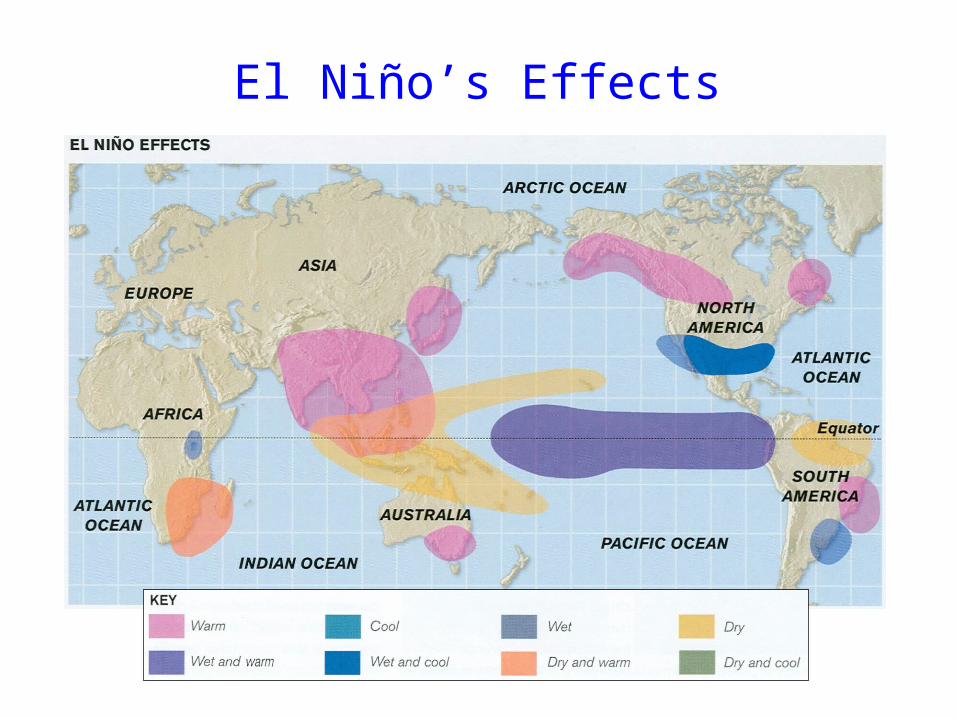
El Niño’s Effects
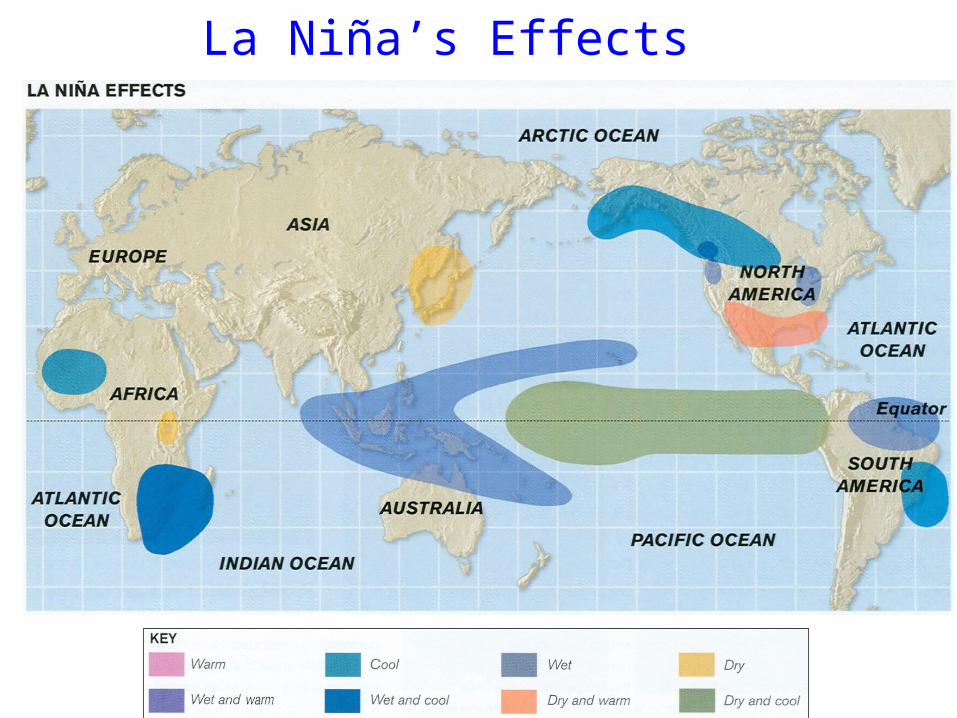
La Niña’s Effects
Neutral Years
State Agricultural Response Team 11
• Neither El Niño nor La Niña phases exist
• Surface water temperatures (SSTs) normal or near normal; SSTs are different at different times of the year but are usually from 75˚F to 80˚F in December through February
• Neutral phases are twice as likely to happen as either El Niño and La Niña
State Agricultural Response Team 12
El Niño and La Niña – Impact on
RainTemperatureHurricanesWild firesCrop
production
State Agricultural Response Team 16
El Niño and La Niña and Temperature
• El Niño Phase – Temperature 2˚F to 3˚F below normal in Florida and Gulf Coast during the winter
• La Niña Phase – Temperatures 2˚F to 4˚F above normal December through April and increase farther north in Florida
― La Niña phase average daily minimum temperatures June through August likely to be lower than normal in south Florida
El Niño and La Niña and Hurricanes
21
• El Niño Phase – Fewer hurricanes because upper level winds over Atlantic Ocean are not suitable; chance of a hurricane striking the U.S. is less likely
• La Niña Phase – Helps hurricanes develop in the Atlantic Ocean; greater chance that a hurricane may hit the U.S.
Chance of 2 hurricanes hitting the U.S.:
• 28% in El Niño• 48% in Neutral• 66% in La Niña
La Niña and Wild Fires
State Agricultural Response Team 23
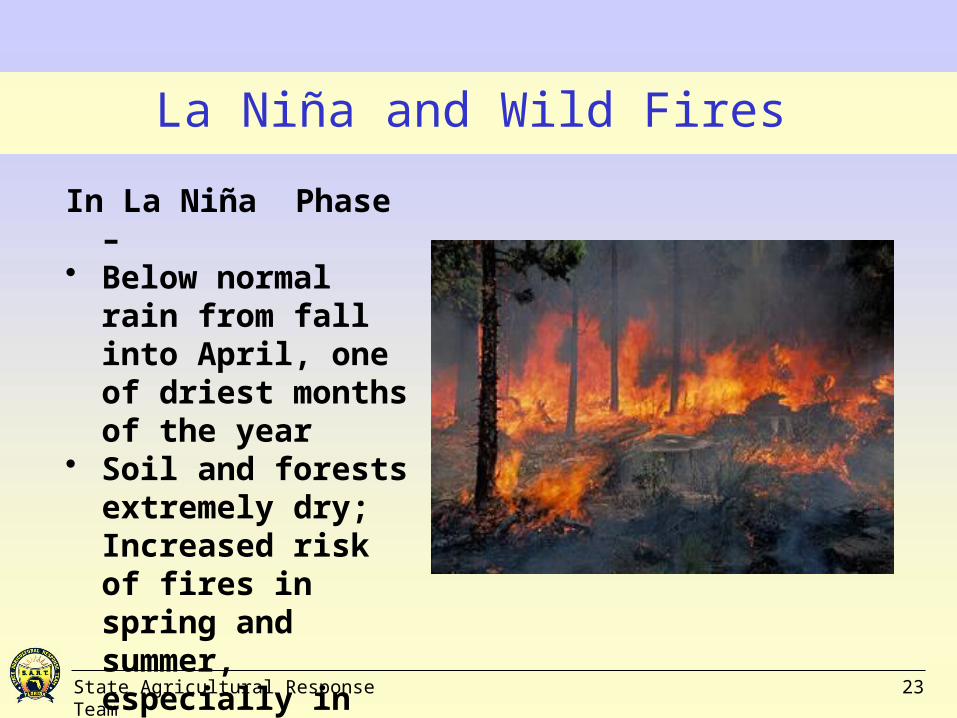
In La Niña Phase – • Below normal
rain from fall into April, one of driest months of the year
• Soil and forests extremely dry; Increased risk of fires in spring and summer, especially in South Florida
State Agricultural Response Team 24
Wild Fires
• In El Niño Phase -- Wet winters seem to lower the risk of wild fires
• Wild fires usually not a problem in western Panhandle -- this area gets more rain than rest of state
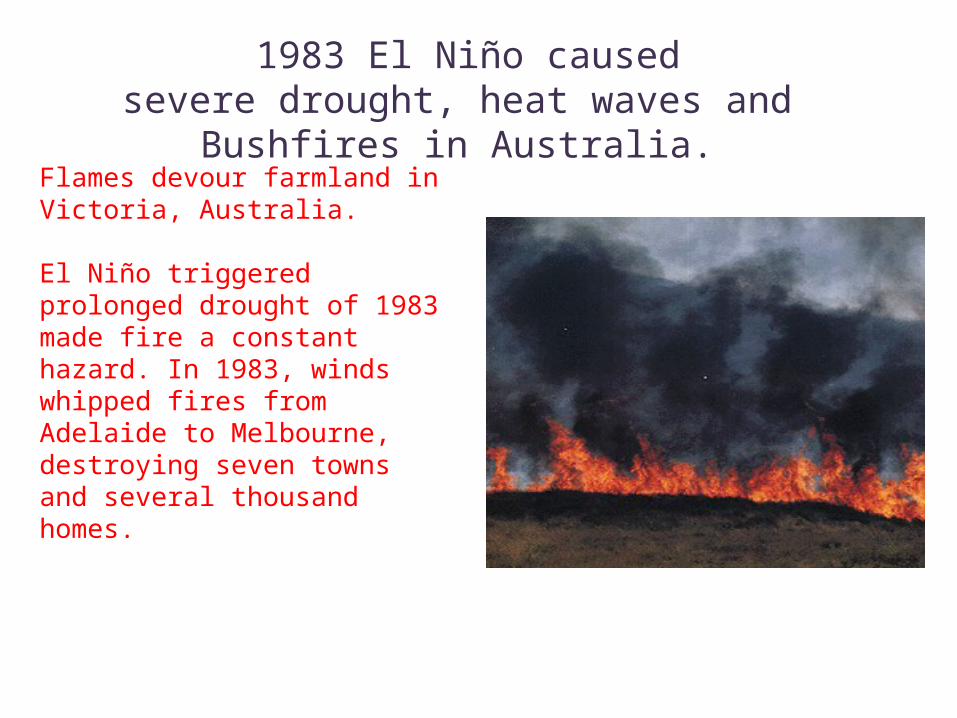
1983 El Niño causedsevere drought, heat waves and
Bushfires in Australia.
Flames devour farmland in Victoria, Australia.
El Niño triggered prolonged drought of 1983 made fire a constant hazard. In 1983, winds whipped fires from Adelaide to Melbourne, destroying seven towns and several thousand homes.
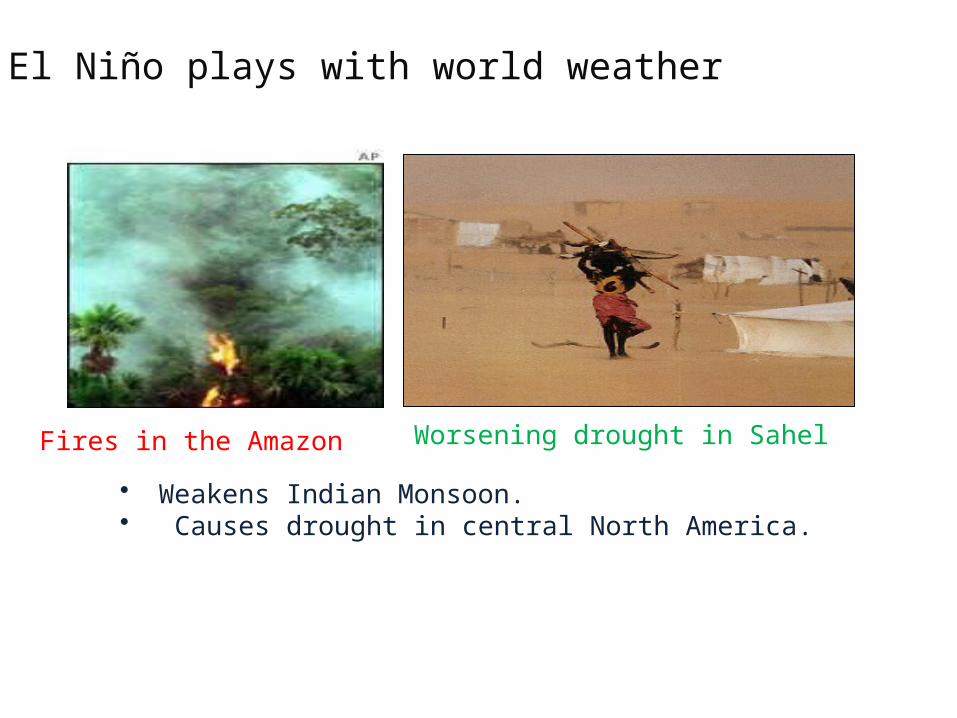
• Weakens Indian Monsoon. • Causes drought in central North America.
El Niño plays with world weather
Fires in the Amazon Worsening drought in Sahel
What the heck causes El Niño and La Niña?
Major theories
• Recharge oscillator: Several mechanisms have been proposed where warmth builds up in the equatorial area, then is dispersed to higher latitudes by an El Niño event. The cooler area then has to "recharge" warmth for several years before another event can take place.
• Western Pacific oscillator: In the western Pacific, several weather conditions can cause westerly wind anomalies. For example, cyclones north and south of the equator force west-to-east winds between. Such wind may counteract the typical easterly flows across the Pacific and create a tendency toward continuing the eastward motion. A weakening in the westward currents at such a time may be the final trigger needed to shift into an El Nino.
• Equatorial Pacific Ocean may tend to be near El Niño conditions, with several random variations affecting behavior. Weather patterns from outside the area or volcanic events may be some such factors.
• Global warming
Forecasts are presented in terms of possible conditions for South
America:
1) near normal conditions,
2) a weak El Niño with a slightly wetter than normal growing season,
3) a full blown El Niño with flooding,
4) cooler than normal waters offshore, with higher than normal chance of drought in South America.
Once the forecast is issued, management of agriculture, water supplies, fisheries, and other resources can be modified.
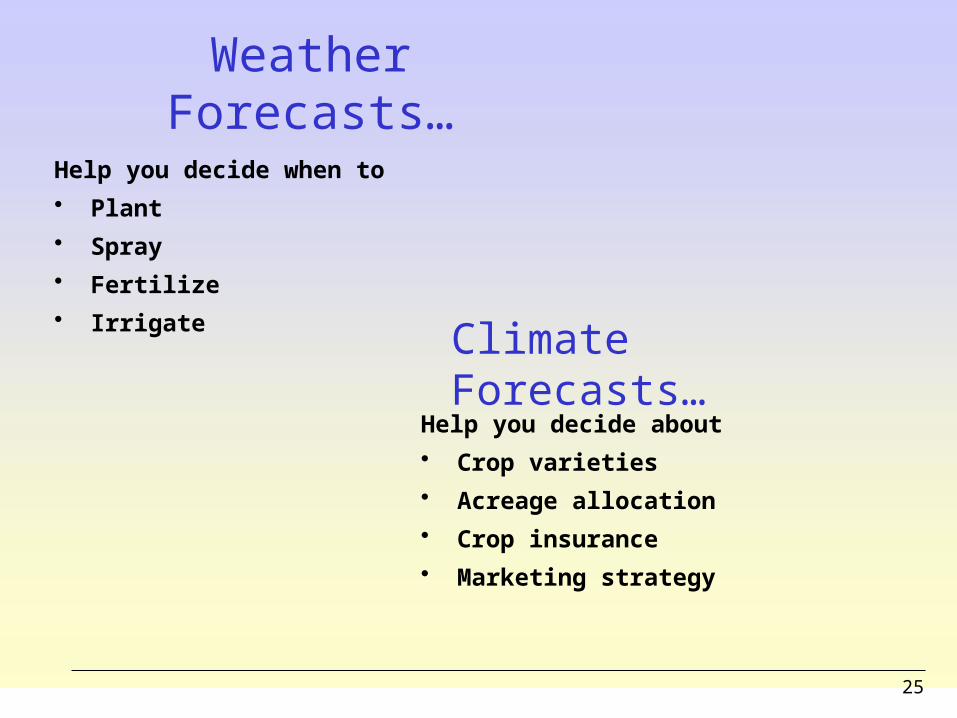
Weather Forecasts…
25
Help you decide when to • Plant• Spray• Fertilize• Irrigate Climate
Forecasts…Help you decide about • Crop varieties• Acreage allocation• Crop insurance• Marketing strategy
State Agricultural Response Team 27
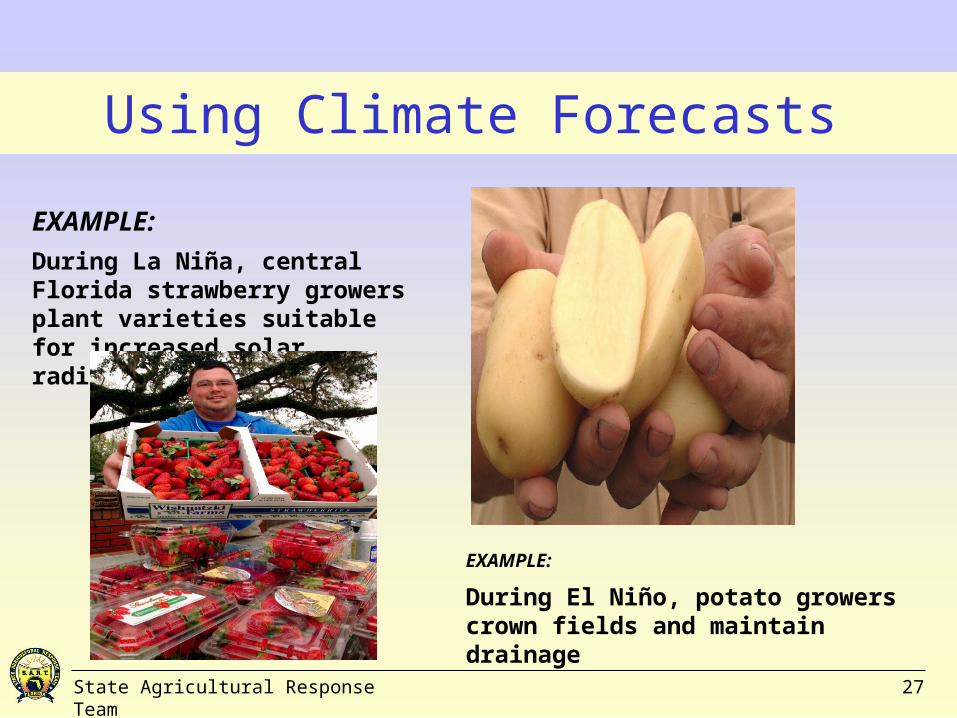
Using Climate Forecasts
EXAMPLE:
During La Niña, central Florida strawberry growers plant varieties suitable for increased solar radiation
EXAMPLE:
During El Niño, potato growers crown fields and maintain drainage
State Agricultural Response Team 29
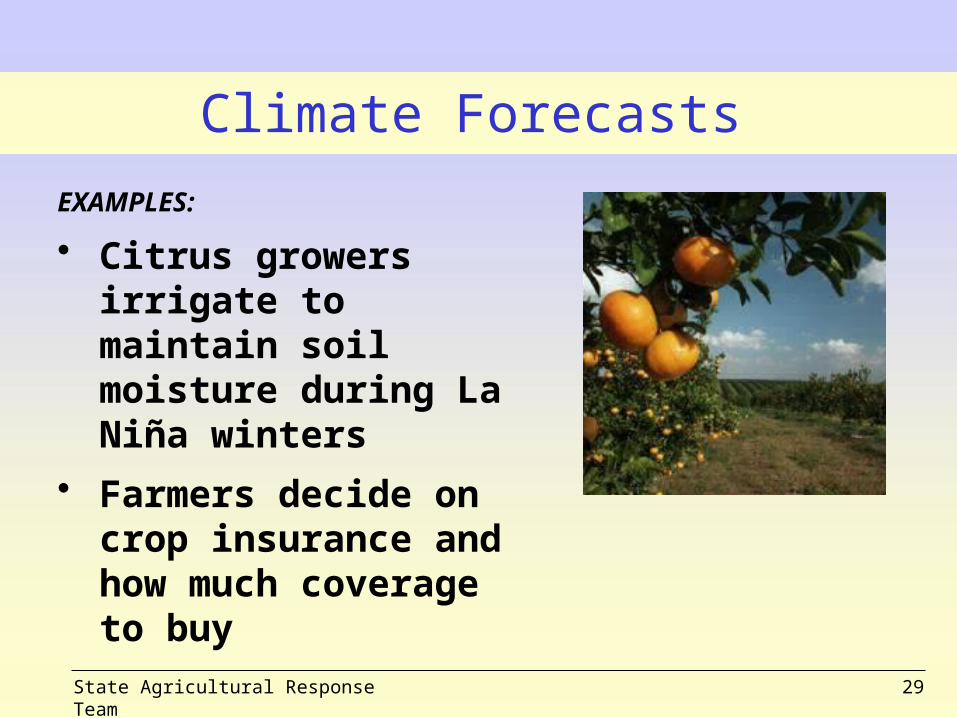
Climate Forecasts
EXAMPLES:
• Citrus growers irrigate to maintain soil moisture during La Niña winters
• Farmers decide on crop insurance and how much coverage to buy
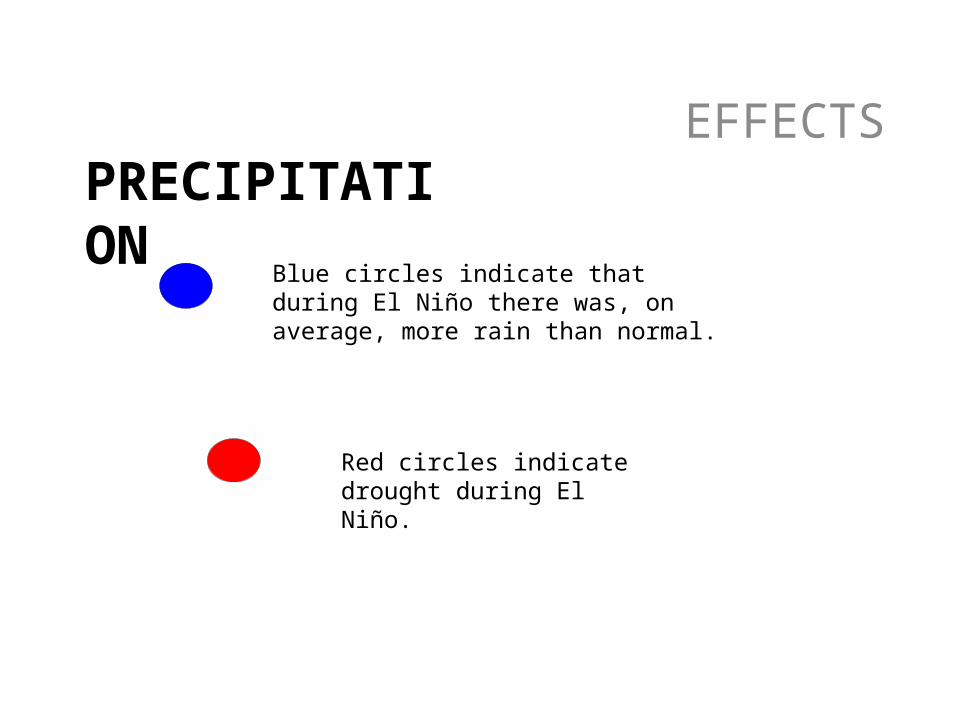
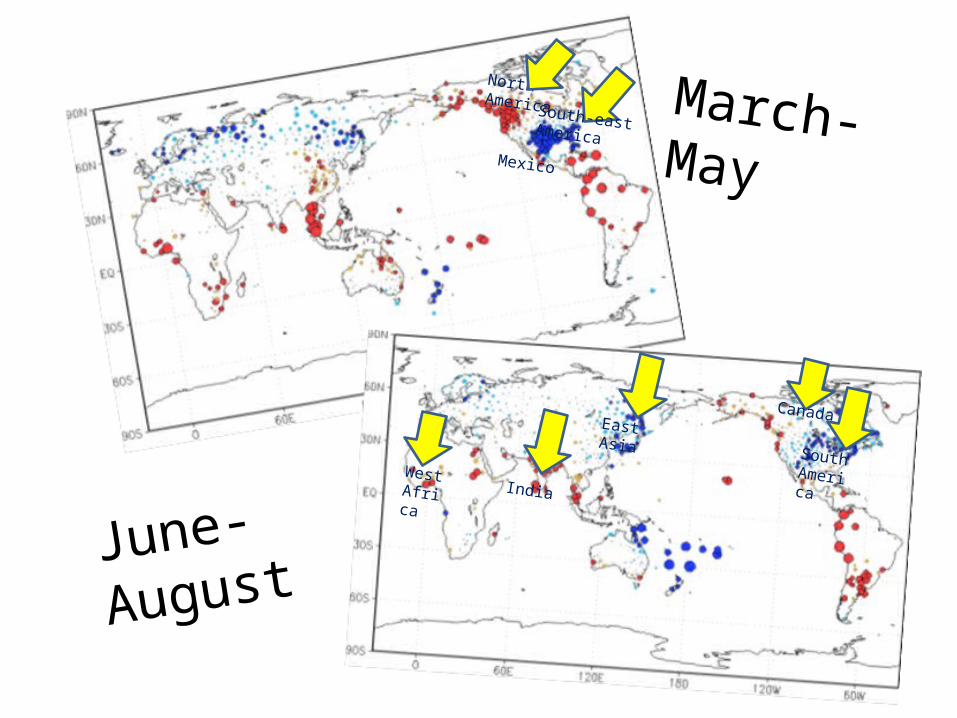
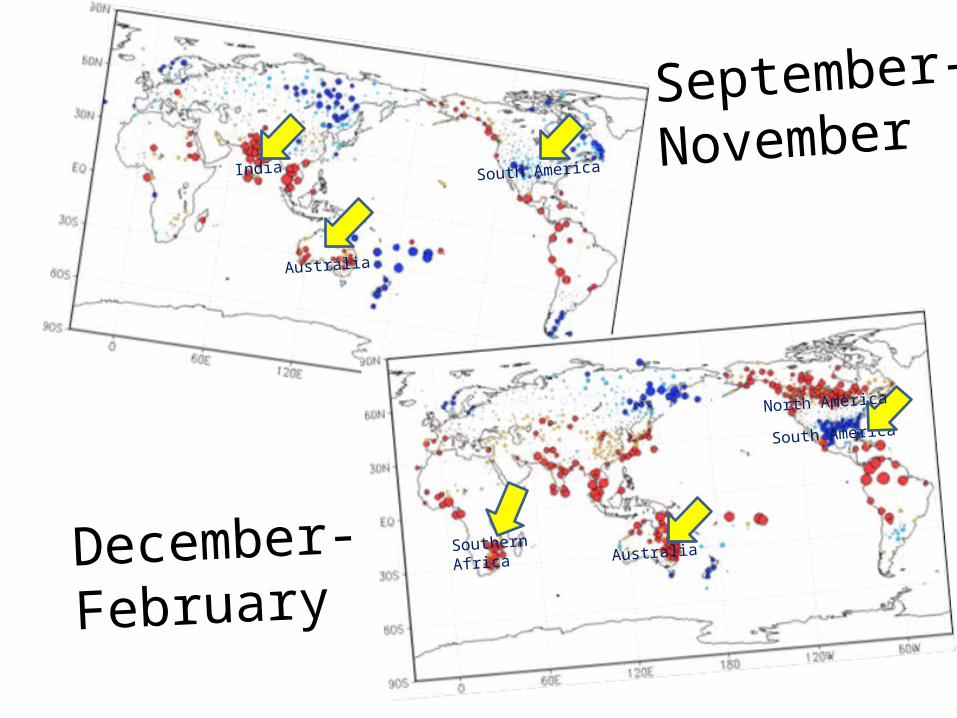
PRECIPITATIONEFFECTS
Red circles indicate drought during El Niño.
Blue circles indicate that during El Niño there was, on average, more rain than normal.
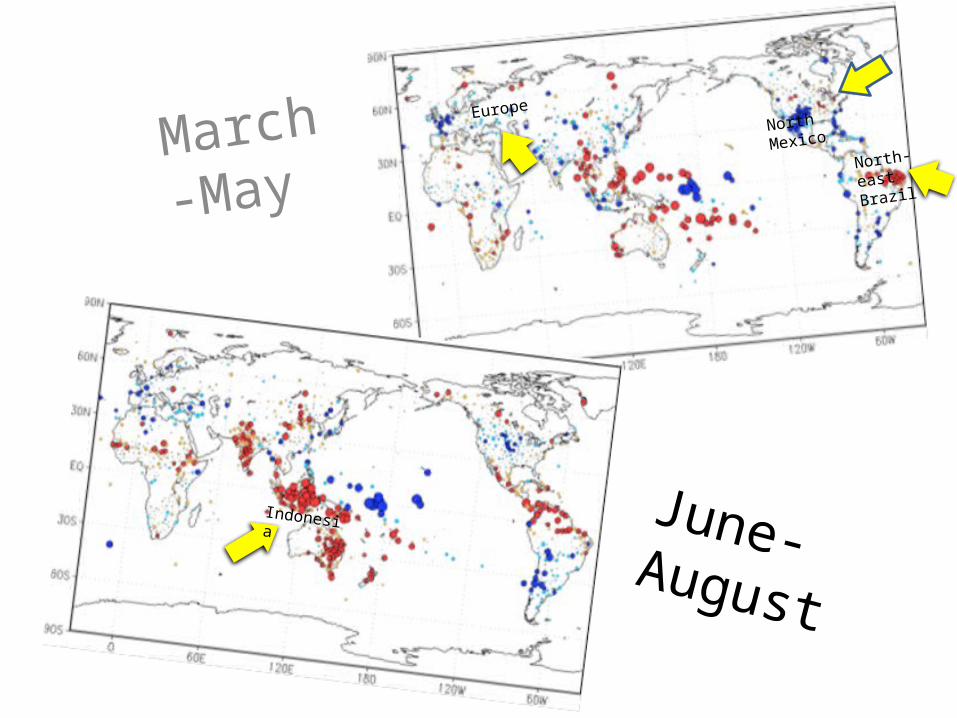
March-
May
June-August
North Mexico
North-east
Brazil
Europe
Indonesia
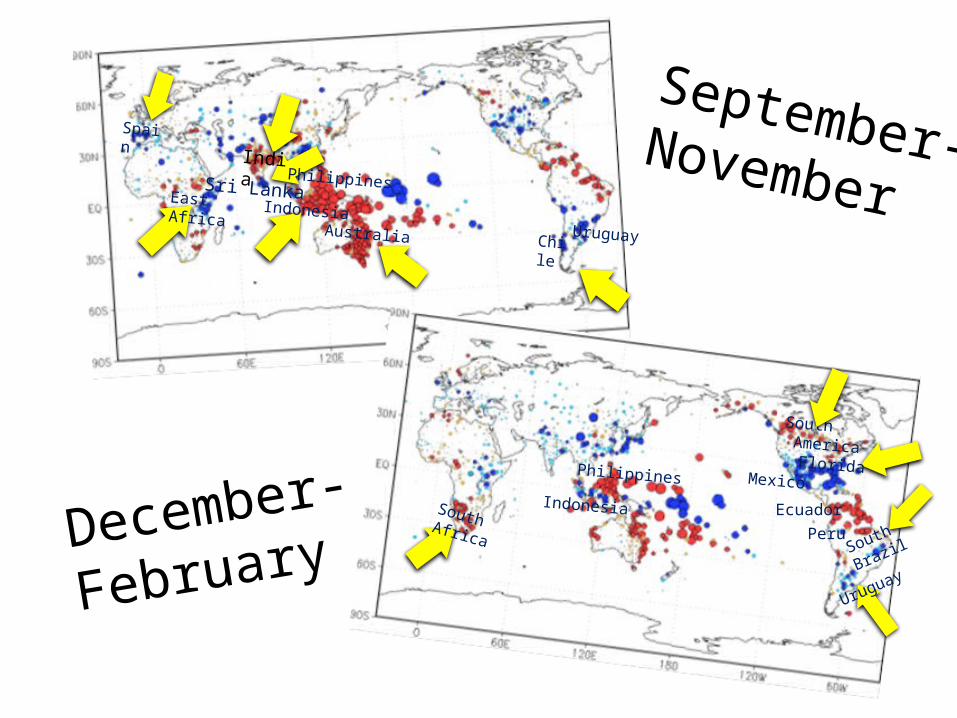
September-November
December-
February
Spain
IndiaSri Lanka
Philippines
IndonesiaAustralia Chile
EastAfrica
SouthAfrica
Uruguay
MexicoFlorida
EcuadorPeru
Philippines
Indonesia
South America
Uruguay
South
Brazil
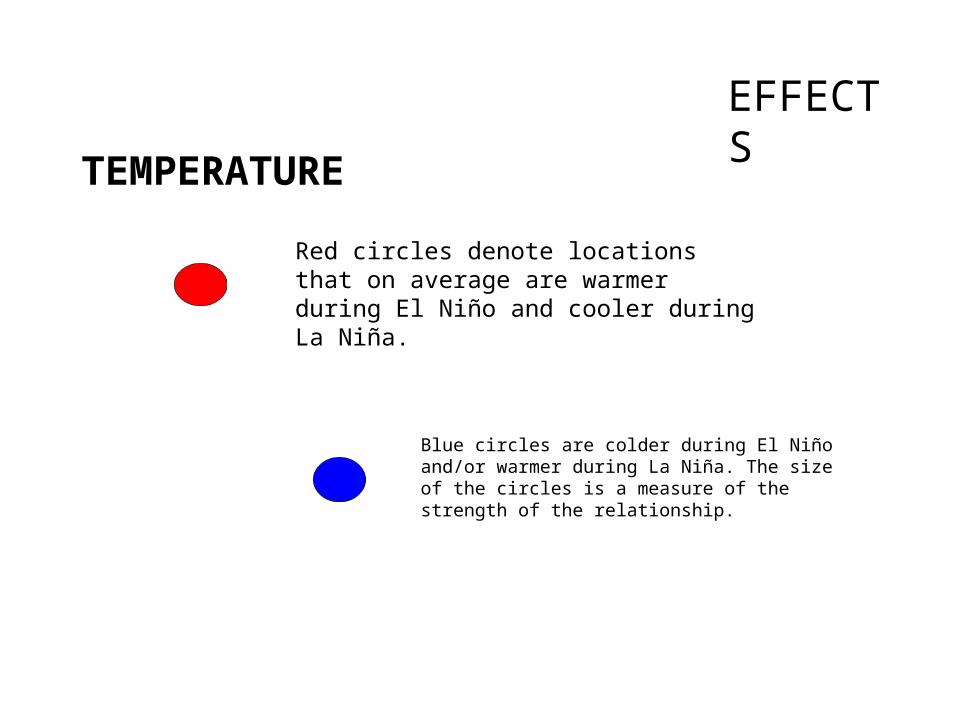
TEMPERATURE
Blue circles are colder during El Niño and/or warmer during La Niña. The size of the circles is a measure of the strength of the relationship.
Red circles denote locations that on average are warmer during El Niño and cooler during La Niña.
EFFECTS
March-May
June-August
NorthAmerica
Mexico
IndiaWest Africa
South America
CanadaEast Asia
South-eastAmerica
September-November
December-February
South AmericaIndia
Australia
South America
North America
AustraliaSouthern Africa
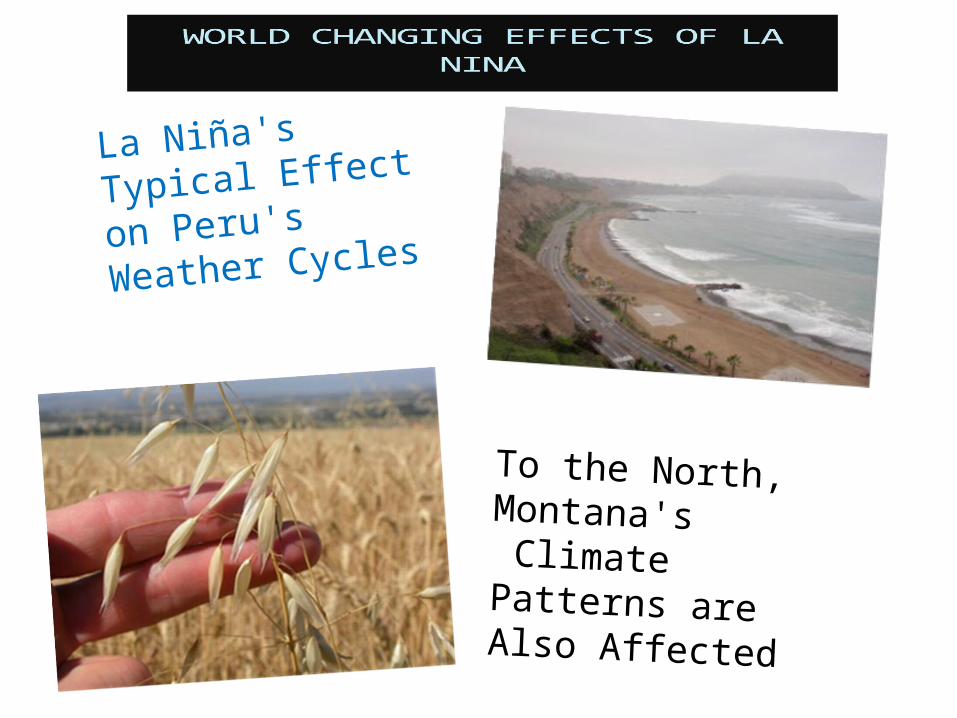
La Niña's Typical Effect
on Peru's Weather
Cycles
To the North, Montana's Climate Patterns are Also Affected
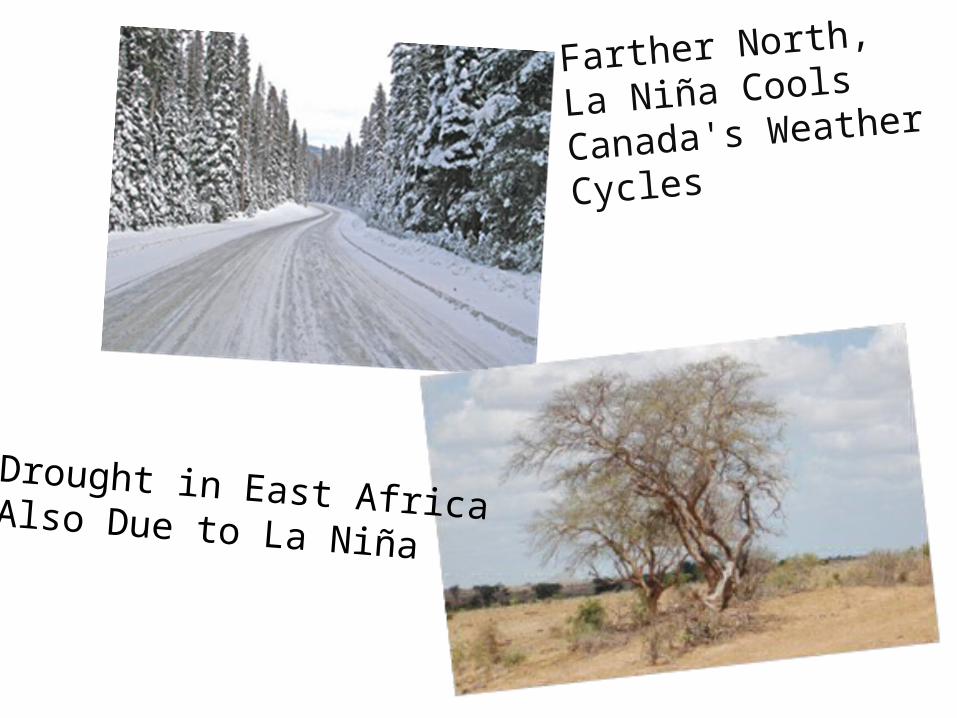
Farther North, La Niña
Cools Canada's Weather
Cycles
Drought in East Africa Also Due to La Niña
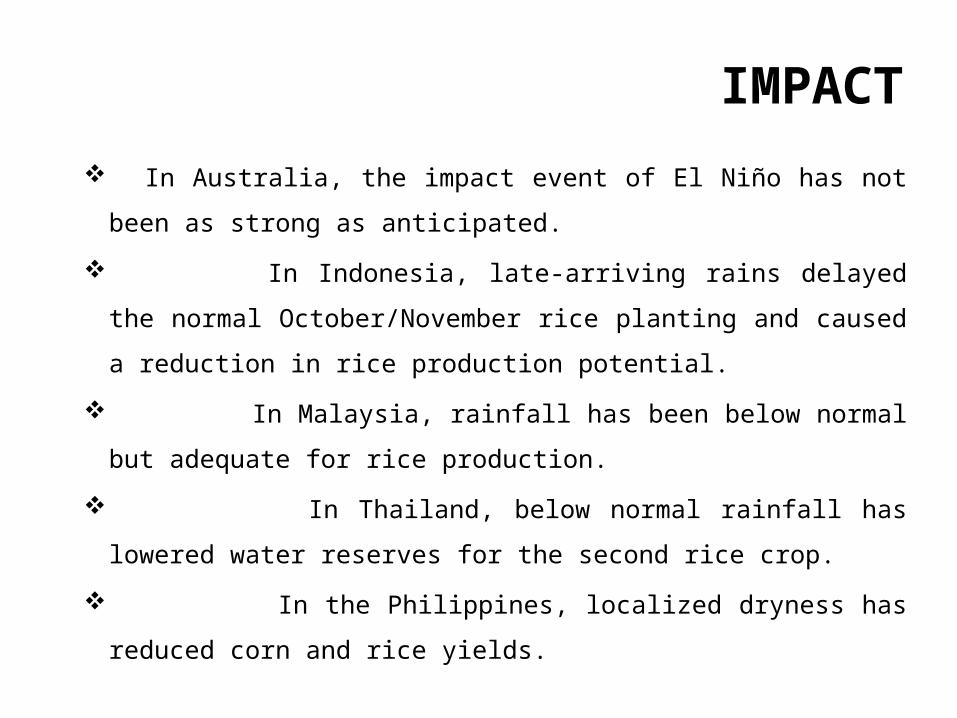
IMPACT In Australia, the impact event of El Niño has not been as strong as
anticipated.
In Indonesia, late-arriving rains delayed the normal
October/November rice planting and caused a reduction in rice
production potential.
In Malaysia, rainfall has been below normal but adequate for rice
production.
In Thailand, below normal rainfall has lowered water reserves for
the second rice crop.
In the Philippines, localized dryness has reduced corn and rice
yields.
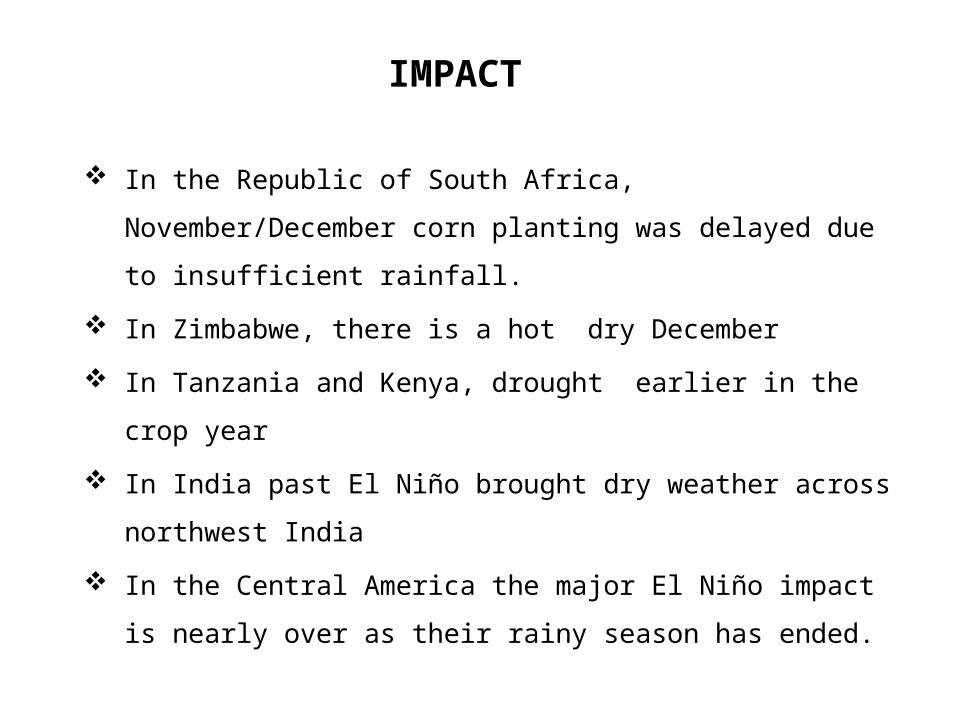
IMPACT
In the Republic of South Africa, November/December
corn planting was delayed due to insufficient rainfall.
In Zimbabwe, there is a hot dry December
In Tanzania and Kenya, drought earlier in the crop year
In India past El Niño brought dry weather across
northwest India
In the Central America the major El Niño impact is
nearly over as their rainy season has ended.
Detection and Prediction
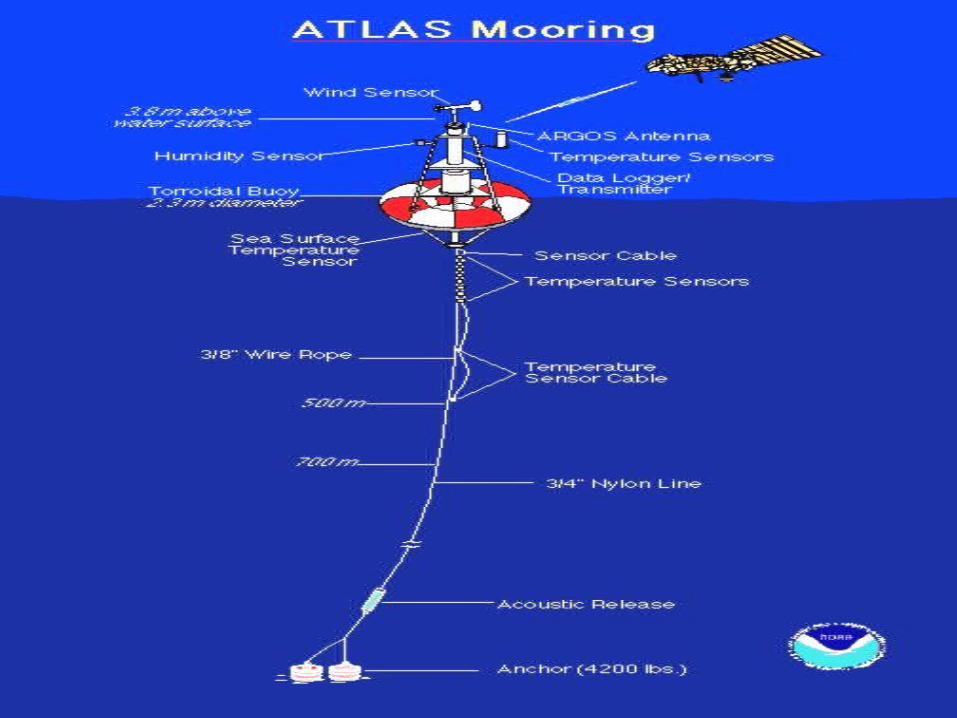
There are several means used for El Niño detection; satellites, moored ATLA and PROTEUS buoys, drifting buoys, sea level analysis, and XBT's. Since El Niño influences global weather patterns and affects human lives and ecosystems, prediction of an El Niño event is becoming increasingly important. For short term prediction (up to 1 year) of climate variations, current observation in the Tropical Pacific are vital. Numerical models are used in many places for El Niño prediction and research. Here are some of the latest El Niño forecasts.
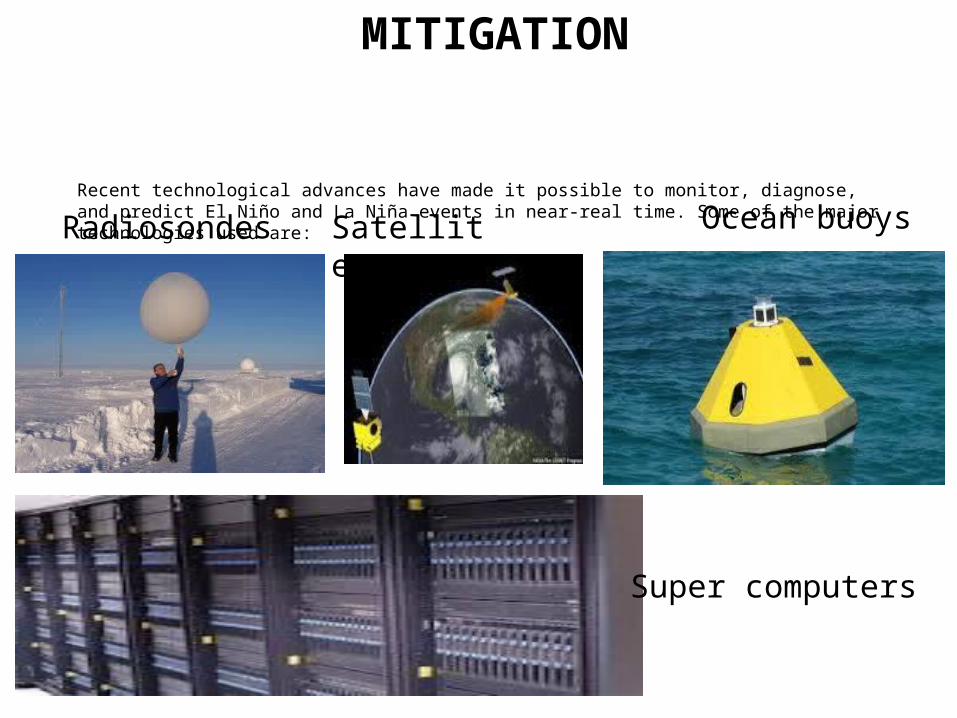
MITIGATION
Recent technological advances have made it possible to monitor, diagnose, and predict El Niño and La Niña events in near-real time. Some of the major technologies used are:
Satellite Ocean buoysRadiosondes
Super computers
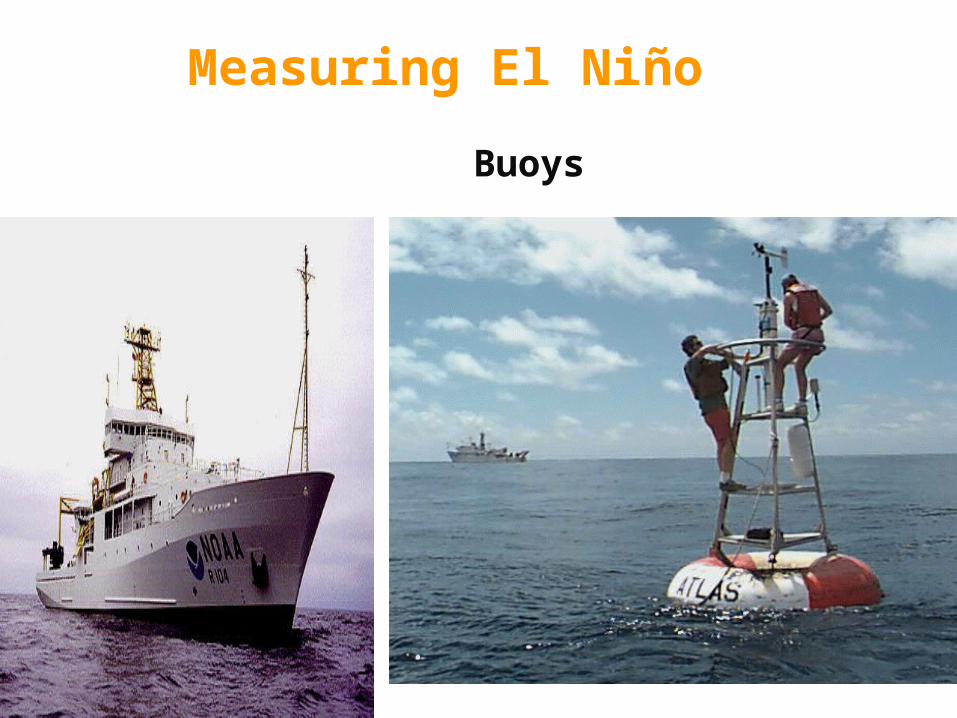
Measuring El Niño
Buoys
Given that numerical models predicting El Niño must do so months in advance,
they are not as reliable as those used in predicting the weather, which forecast only days in advance. They have, however, progressed to the point where they can reproduce the characteristics of a typical El Niño event and some industries use these forecasts as an indicator of the coming fish harvest.
Why is predicting El Niño and La Nina so important?
Better predictions of the potential for extreme climate episodes like floods and droughts could save the United States billions of dollars in damage costs.
Predicting the life cycle and strength of a Pacific warm or cold episode is critical in helping water, energy and transportation managers, and farmers plan for, avoid or mitigate potential losses.
Advances in improved climate predictions will also result in significantly enhanced economic opportunities, particularly for the national agriculture, fishing, forestry and energy sectors, as well as social benefits.
Thank you for listening