eldholm, o., thiede, j., taylor, e., et al., 1989
TRANSCRIPT
Eldholm, O., Thiede, J., Taylor, E., et al., 1989 Proceedings of the Ocean Drilling Program, Scientific Results, Vol. 104
4 1 . M A G N E T I C P O L A R I T Y T R A N S I T I O N Z O N E S AT T H E B R U N H E S / M A T U Y A M A A N D U P P E R O L D U V A I B O U N D A R I E S : P R E L I M I N A R Y R E S U L T S F R O M O D P L E G 104 1
Gunther Schonharting,2 P. V. Sharma, 3 and Steen Kentved3
ABSTRACT
Two hundred samples were taken across the Brunhes/Matuyama (B/M) and Matuyama/Upper Olduvai (M/O) boundaries from cores of ODP Leg 104 Holes 642B, 642C, 643A, and 644A to study the behavior of the Earth's magnetic field during these polarity transition zones. Samples from Hole 644A were of limited value due to secondary magnetization overprint. Correlation of various magnetic and sedimentological properties allowed a comparison of boundaries on a centimeter scale between holes.
Durations for the polarity switch and for a zone of greatly reduced intensity values for the B/M boundary were found to be 1800 and 5300 yr, respectively. An aborted excursion-like event was noted in the Brunhes chron immediately above the B/M polarity boundary and within the zone of reduced intensity values.
For the M/O boundary, durations of the polarity switch and for a zone of reduced intensity values were obtained as 2800 and 4500 yr, respectively. The major finding for the Olduvai subchron, however, is a drastic two-fold decrease in intensity about 20,000 years before the M/O boundary. This is accompanied by about a 20-fold increase of intensity values immediately below this zone.
INTRODUCTION
There are as yet sparse data on magnetic polarity transition zones at the Brunhes/Matuyama (B/M) and Upper Olduvai boundaries, and this study attempts to provide further information on the duration and paleointensities of these zones for high-latitude areas. The magnetostratigraphy established from ODP Leg 104 sites (Eldholm, Thiede, Taylor, et al., 1987) can be used as a guide for detailed investigations of core samples for this purpose.
Shipboard measurements of directions and intensity of natural remanent magnetization (NRM) were performed during ODP Leg 104 for the sediment series of Holes 642A through 642D, Hole 643A, and Holes 644A and 644B. Virtually all core sections were checked for NRM properties with the pass-through cryogenic magnetometer; however, intensities in the Pleistocene sequence often exceeded the range of the cryogenic magnetometer. In these cases, determinations of NRM directions and intensities were done on discrete samples.
Most polarity boundaries could only be established after proper AF demagnetization. During the ongoing shipboard investigation and, generally, after preliminary analysis of NRM, polarity boundaries could be identified within about 30 to 60 cm of a core interval. Successive sampling at these locations provided material to study the B/M boundary transition zones at Holes 642B, 642C, 643A, and 644A. The Upper Olduvai transition zone was sampled from Holes 642B and 642C.
Some of the investigated zones have sampling gaps at critical locations. One of the reasons for sampling gaps was competitive sampling, but other gaps resulted from obvious disturbances in the sediments, mostly caused by the drilling itself, resulting in the greatest deformation close to the cylindrical walls or, more severely, water flow penetration downward into deeper sections in the middle of the core.
1 Eldholm, O., Thiede, J., Taylor, E.„ et al., 1989. Proc. ODP, Sci. Results, 104: College Station, TX (Ocean Drilling Program).
2 Institute of General Geology, Copenhagen University, Ostervoldgade 10, 1350 Copenhagen K, Denmark.
3 Institute of Geophysics, Copenhagen University, Haraldsgade 6, 2200 Copenhagen N, Denmark.
Because of sampling limitations, only the B/M transition zone could be sampled at all three sites. This sample coverage provides a transect with vastly different sedimentation rates over a distance of 160 km across the Vdring Plateau. The Leg 104 site locations are shown in Figure 1. Sedimentation rates are highest at Site 644 and lowest at Site 643, with average values at the B / M boundary around 2 cm/k.y. and 10 cm/k.y., respectively. Altogether more than 200, 6-cm3 samples were taken for investigation of the transition zones. The samples were measured on the ship for NRM properties and susceptibilities with a spinner magnetometer (Molspin) and a Bartington MSI susceptibility meter, respectively. Samples were subsequently packed in plastic bags to preserve their natural water content. They were transported as personal luggage from Stavanger to Copenhagen, where they were remeasured for NRM and afterwards treated for AF-demagnetization and other experiments at the laboratories of the Institute of Geophysics and the Institute of General Geology of Copenhagen University. From demagnetization results, the authors have the impression that damage during transport and consequent storage and treatment was minimal in the majority of cases.
PREVIOUS STUDIES OF QUATERNARY A N D PLIOCENE MAGNETOSTRATIGRAPHY
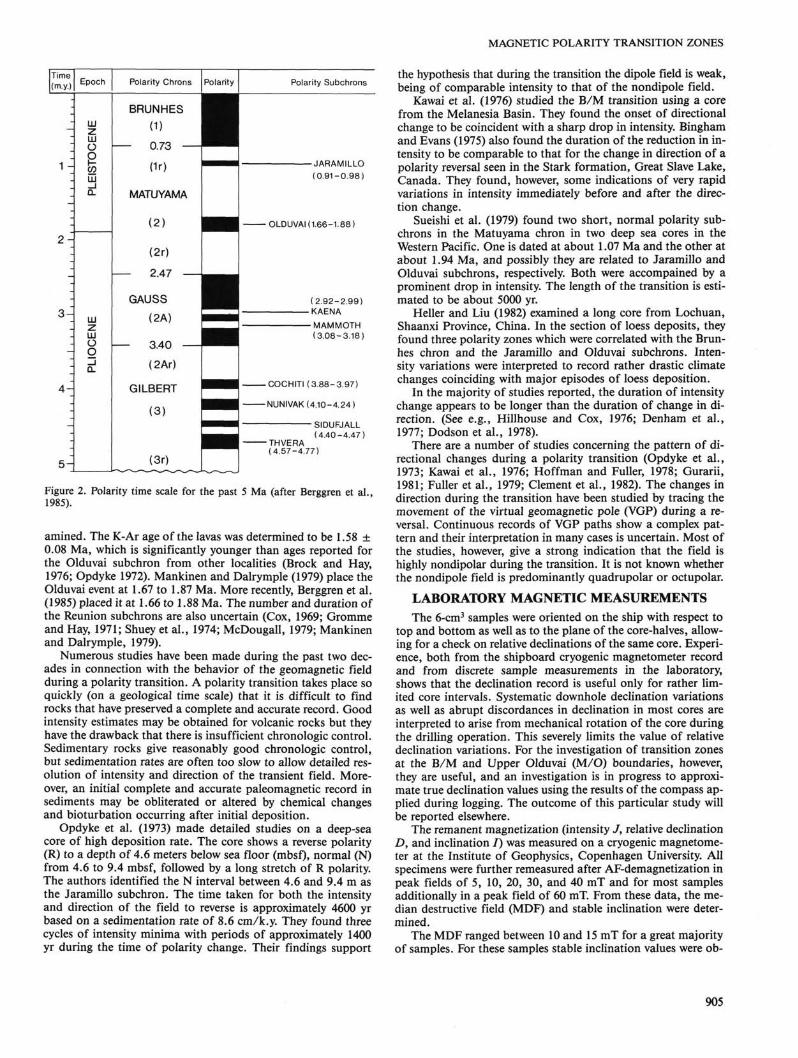
Since 1964 when the first magnetic polarity time scale (Cox et al., 1964) was developed, there have been several revisions of the polarity time scale extending back to 4 Ma (Tarling and Mitchell, 1976; LaBrecque et al., 1977; Mankinen and Dalrym-ple, 1979; McDougall, 1979; Harland et al., 1982). More recently, Berggren et al.(1985) have published a revised polarity time scale for the Paleogene, using a significant amount of new data. Figure 2 shows the late Cenozoic polarity time scale with ages of the various chrons (epochs) and subchrons (events) occurring within the chrons. Their revised value for the age of the Brunhes/Matuyama boundary is 0.73 Ma. This boundary has become important for the interpolation of ages in younger deep-sea sedimentary rocks. None of the short-duration polarity subchrons (formerly called events) reported from the sedimentary record during the Brunhes chron (Laschamp? Blake? etc.) are sufficiently authenticated worldwide to be included in the polarity time scale. Although there is agreement on the broad aspects
903

G. SCHONHARTING, P. V. SHARMA, S. KENTVED
65° N
Figure 1. Bathymetry map (contours, 100 fm) and location of ODP Leg 104 Sites 642, 643, and 644, at the Wring Plateau in the Norwegian Sea.
of the time scale, considerable uncertainty still exists as to the number, age, and duration of normal polarity subchrons in the Matuyama reversed polarity chron. For example, the Jaramillo normal polarity subchron has been estimated by Cox and Dal-rymple (1967) as extending from 0.85 to 0.97 Ma, Opdyke (1972) placed it between 0.87 and 0.92 Ma, Mankinen and Dal-rymple (1979) placed it between 0.90 and 0.97 Ma, and more recently Berggren et al. (1985) have placed it between 0.91 and 0.98 Ma.
There has also been considerable controversy as to whether the Olduvai and Gilsa normal subchrons are separate or one
event. Data from deep-sea sediment cores that penetrate the Matuyama are inconsistent (see, e.g., Opdyke, 1972; Watkins, 1972) and raise the question of the preservation of short-term subchrons in deep-sea sediments and the causes of spurious polarity reversals. In some cores two normal events are seen, although in the majority of cores only a single normal subchron can be identified and there has been much argument as to whether this represents the Olduvai or Gilsa event. Watkins et al. (1975) carried out a detailed paleomagnetic survey of rocks from the Jokuldalur area in Iceland, covering this period. Their work did not reveal a second polarity subchron in the section ex-
904
MAGNETIC POLARITY TRANSITION ZONES
Figure 2. Polarity time scale for the past 5 Ma (after Berggren et al. 1985).
amined. The K-Ar age of the lavas was determined to be 1.58 ± 0.08 Ma, which is significantly younger than ages reported for the Olduvai subchron from other localities (Brock and Hay, 1976; Opdyke 1972). Mankinen and Dalrymple (1979) place the Olduvai event at 1.67 to 1.87 Ma. More recently, Berggren et al. (1985) placed it at 1.66 to 1.88 Ma. The number and duration of the Reunion subchrons are also uncertain (Cox, 1969; Gromme and Hay, 1971; Shuey et al., 1974; McDougall, 1979; Mankinen and Dalrymple, 1979).
Numerous studies have been made during the past two decades in connection with the behavior of the geomagnetic field during a polarity transition. A polarity transition takes place so quickly (on a geological time scale) that it is difficult to find rocks that have preserved a complete and accurate record. Good intensity estimates may be obtained for volcanic rocks but they have the drawback that there is insufficient chronologic control. Sedimentary rocks give reasonably good chronologic control, but sedimentation rates are often too slow to allow detailed resolution of intensity and direction of the transient field. Moreover, an initial complete and accurate paleomagnetic record in sediments may be obliterated or altered by chemical changes and bioturbation occurring after initial deposition.
Opdyke et al. (1973) made detailed studies on a deep-sea core of high deposition rate. The core shows a reverse polarity (R) to a depth of 4.6 meters below sea floor (mbsf). normal (N) from 4.6 to 9.4 mbsf, followed by a long stretch of R polarity. The authors identified the N interval between 4.6 and 9.4 m as the Jaramillo subchron. The time taken for both the intensity and direction of the field to reverse is approximately 4600 yr based on a sedimentation rate of 8.6 cm/k.y. They found three cycles of intensity minima with periods of approximately 1400 yr during the time of polarity change. Their findings support
the hypothesis that during the transition the dipole field is weak, being of comparable intensity to that of the nondipole field.
Kawai et al. (1976) studied the B/M transition using a core from the Melanesia Basin. They found the onset of directional change to be coincident with a sharp drop in intensity. Bingham and Evans (1975) also found the duration of the reduction in intensity to be comparable to that for the change in direction of a polarity reversal seen in the Stark formation, Great Slave Lake, Canada. They found, however, some indications of very rapid variations in intensity immediately before and after the direction change.
Sueishi et al. (1979) found two short, normal polarity subchrons in the Matuyama chron in two deep sea cores in the Western Pacific. One is dated at about 1.07 Ma and the other at about 1.94 Ma, and possibly they are related to Jaramillo and Olduvai subchrons, respectively. Both were accompained by a prominent drop in intensity. The length of the transition is estimated to be about 5000 yr.
Heller and Liu (1982) examined a long core from Lochuan, Shaanxi Province, China. In the section of loess deposits, they found three polarity zones which were correlated with the Brun-hes chron and the Jaramillo and Olduvai subchrons. Intensity variations were interpreted to record rather drastic climate changes coinciding with major episodes of loess deposition.
In the majority of studies reported, the duration of intensity change appears to be longer than the duration of change in direction. (See e.g., Hillhouse and Cox, 1976; Denham et al., 1977; Dodson et al., 1978).
There are a number of studies concerning the pattern of directional changes during a polarity transition (Opdyke et al., 1973; Kawai et al., 1976; Hoffman and Fuller, 1978; Gurarii, 1981; Fuller et al., 1979; Clement et al., 1982). The changes in direction during the transition have been studied by tracing the movement of the virtual geomagnetic pole (VGP) during a reversal. Continuous records of VGP paths show a complex pattern and their interpretation in many cases is uncertain. Most of the studies, however, give a strong indication that the field is highly nondipolar during the transition. It is not known whether the nondipole field is predominantly quadrupolar or octupolar.
LABORATORY MAGNETIC MEASUREMENTS The 6-cm3 samples were oriented on the ship with respect to
top and bottom as well as to the plane of the core-halves, allowing for a check on relative declinations of the same core. Experience, both from the shipboard cryogenic magnetometer record and from discrete sample measurements in the laboratory, shows that the declination record is useful only for rather limited core intervals. Systematic downhole declination variations as well as abrupt discordances in declination in most cores are interpreted to arise from mechanical rotation of the core during the drilling operation. This severely limits the value of relative declination variations. For the investigation of transition zones at the B/M and Upper Olduvai (M/O) boundaries, however, they are useful, and an investigation is in progress to approximate true declination values using the results of the compass applied during logging. The outcome of this particular study will be reported elsewhere.
The remanent magnetization (intensity J, relative declination D, and inclination /) was measured on a cryogenic magnetometer at the Institute of Geophysics, Copenhagen University. All specimens were further remeasured after AF-demagnetization in peak fields of 5, 10, 20, 30, and 40 mT and for most samples additionally in a peak field of 60 mT. From these data, the median destructive field (MDF) and stable inclination were determined.
The MDF ranged between 10 and 15 mT for a great majority of samples. For these samples stable inclination values were ob-
905

G. SCHONHARTING, P. V. SHARMA, S. KENTVED
tained in an AF-demagnetizing field of 10 mT. However, for many samples from Hole 644A, MDF field values were above 300 mT, and stable inclinations have not been found for most of these samples.
To obtain estimates of relative paleointensity variation during polarity transition zones B/M and M/O, a number of tests were performed to study the usefulness of various normalizations of intensities of remanent magnetizations. First, the ratio of NRM intensity after AF-demagnetization at 10-mT peak field divided by magnetic low field susceptibility (J/k) was obtained for all samples and compared to normalizations with both an-hysteretic magnetization ARM and saturation remanence (Jr>sat). For this purpose ARM was produced in a field of 0.06 mT during AF-demagnetization in a peak field of 40 mT—after the samples had been completely AF-demagnetized in zero-field. A field of 300 mT was used for saturation remanence, and it was measured on a Digico-spinner magnetometer.
MAGNETIC RESULTS
Brunhes/Matuyama Boundary Inclination Record The inclination record for the B/M boundary is presented in
Figure 3 for Holes 642B, 642C, and 643A. While the boundary in these holes can be depicted quite clearly, there is considerable uncertainty with regard to Hole 644A. The inclination record at Hole 644A does not represent the true primary inclination at the time of sedimentation or shortly afterward, but instead shows the effect of normal component overprint. The overprint effect occurs selectively on material with higher susceptibility. This may be suggestive of secondary magnetization, during Brunhes time, of magnetite particles in place, possibly of a chemical remanence type during maghemitization. We are proceeding to investigate this issue further.
Depths (mbsf) are listed for the B/M and M/O boundaries for the different holes in Table 1. The interpretation for the B/ M boundary in Hole 644A is rather tentative. This boundary could fall between Sections 104-644A-9H-6 and -10H-1, as there may exist a recovery gap at the bottom of Core 104-644A-9H. Our tentative choice of the B/M boundary at 83.10 mbsf is the deepest possibility and could be too deep by a maximum amount of 2.1 m.
B / M Correlation Between Boreholes To arrive at common depth scales for the B-M transition
zones for Holes 642B, 642C, 643A, and 644A, depth scales were adjusted to the depth scale of Hole 644A. This hole was chosen because it has potentially the greatest resolution of features—it has the largest sedimentation rate. Adjustment was performed by assuming a sediment thickness/age ratio for the B/M boundary that is proportional to the mbsf depth of this boundary at each borehole (Table 1).
As seen in Figure 3, great similarities exist in the inclination trends for Holes 642B, 642C, and 643A. A further improvement in correlation was achieved by comparing relative changes in susceptibility (Fig. 4) as well as boundaries where color changes occur in cores from Holes 642B and 642C. The result is presented in Figure 5 and shows inclination features around the B / M boundary for the three holes on a centimeter scale.
An interesting feature obtained from this correlation is the recognition of an aborted polarity change shortly after Brunhes normal chron was established. It is unlikely that this feature was caused by secondary overprinting, as observed in Hole 644A. Support for this interpretation of aborted reversal is the correlation of this feature between widely separated sites, which in addition display different susceptibility characteristics (Fig. 4).
Table 1. B/M and M/O boundary locations with respect to core section number and in meters below seafloor (mbsf).
Boundary
Brunhes/ Matuyama
Matuyama/Upper Olduvai
Core-section-cm Depth (mbsf)
Core-section-cm Depth (mbsf)
642B
5-6-30 37.20
7-4-120 53.10
Hole
642C
5-1-105 33.85
7-1-63 51.55
643A
3-1-125 15.95
644A
10-1-40 83.10
B / M Boundary Intensity Variations Ratios of remanence intensity Jr with either susceptibility k,
saturation remanence, or anhysteretic remanence were compared to arrive at a record of paleointensity variation across the B/M boundary. Examples of this approach are given in Figure 6 for Hole 642B. The variation of all three ratios follows a similar pattern. For sake of convenience, the ratio Jr/k was chosen for comparison between the boreholes.
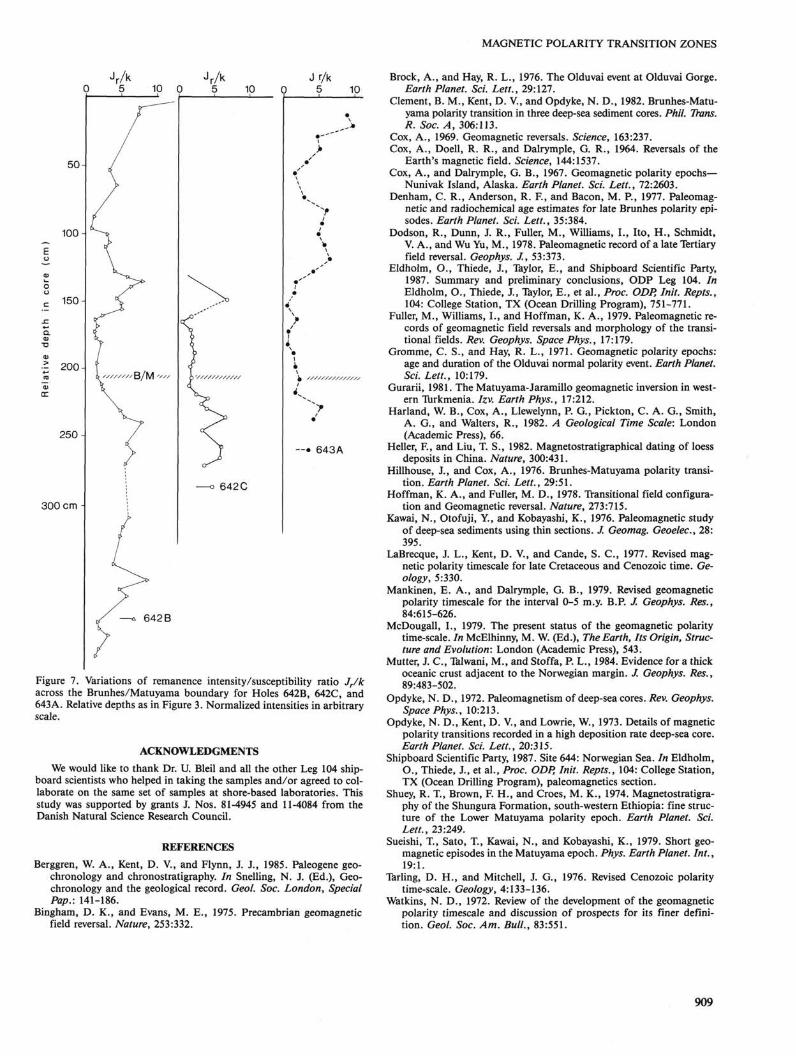
The ratios of all holes are presented in Figure 7. Holes 642B, 642C, and 643A show good agreement of the normalized intensity variation over the length of the record shown. A small downward shift of the uppermost part of the Hole 643A record with respect to Holes 642B and 642C would improve their correlation. Around the B/M boundary, intensity values are about one-third of the average values above and below this depth. The thickness of the low intensity zone across the B/M boundary is about 60 cm, which represents 5280 yr assuming an average thickness/age ratio of 11.4 cm/k.y. for Hole 644A from the surface down to the Jaramillo subchron (Shipboard Scientific Party, 1987). If we accept this duration of about 5280 yr as the transition time of the Earth's magnetic field around the B/M boundary, then it contrasts strongly with the much shorter time of polarity switch, namely 20 cm representing 1760 yr. We may, however, include the aborted reversal above the B/M boundary. This combined zone then becomes 50 cm wide, representing 4400 yr and approaching the duration of the B/M transition zone with respect to normalized intensities.
Upper Olduvai Boundary Inclination Record A total of 38 samples were obtained from Holes 642B and
642C covering the Matuyama/Upper Olduvai (M/O) boundary and the middle part of the Olduvai subchron. The susceptibility record (Fig. 8) as well as sediment color changes were extremely helpful in correlating the Upper Olduvai boundary in the two holes. Resolution is about 3 cm. Using the Hole 642B depth scale and adjusting the Hole 642C scale accordingly, a stable inclination record for both holes was established and is presented in Figure 9. The M/O boundary was well sampled only in Hole 642C. The outstanding feature in Figure 9 is the subdivision of the Olduvai subchron by a two-fold "excursion," which in both holes is characterized by reverse polarities at about 35 and 50 cm below the M/O boundary. This subdivision of the Olduvai subchron has been a controversial issue in earlier investigations (Opdyke, 1972; Watkins, 1972; Watkins et al., 1975).
Upper Olduvai Boundary Intensity Variation Tests used for the B/M boundary were applied to the M/O
boundary with regard to normalization of intensity. Again, Jr after AF demagnetization at 10 mT peak field, normalized with susceptibility, was chosen to represent paleointensity variation in Figure 10. There is reasonably good agreement between the intensity records of Holes 642C and 642B, although the latter was not sufficiently sampled across the M/O boundary.
906
MAGNETIC POLARITY TRANSITION ZONES
INCLINATION
50°-50° 0° 50°-50° 0°
100
2, 150
" 200-
= 250-
50°
B/M //s/<s-~?"s/s
300-
350
400
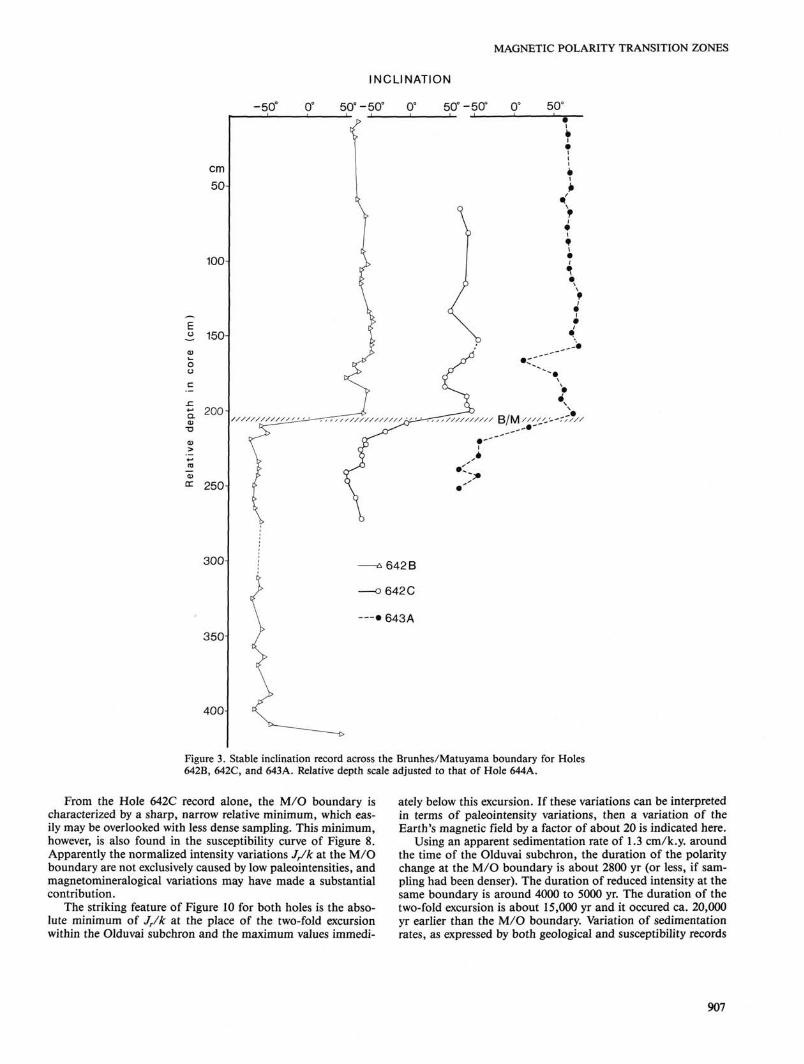
Figure 3. Stable inclination record across the Brunhes/Matuyama boundary for Holes 642B, 642C, and 643A. Relative depth scale adjusted to that of Hole 644A.
From the Hole 642C record alone, the M/O boundary is characterized by a sharp, narrow relative minimum, which easily may be overlooked with less dense sampling. This minimum, however, is also found in the susceptibility curve of Figure 8. Apparently the normalized intensity variations Jr/k at the M/O boundary are not exclusively caused by low paleointensities, and magnetomineralogical variations may have made a substantial contribution.
The striking feature of Figure 10 for both holes is the absolute minimum of J/k at the place of the two-fold excursion within the Olduvai subchron and the maximum values immedi
ately below this excursion. If these variations can be interpreted in terms of paleointensity variations, then a variation of the Earth's magnetic field by a factor of about 20 is indicated here.
Using an apparent sedimentation rate of 1.3 cm/k.y. around the time of the Olduvai subchron, the duration of the polarity change at the M/O boundary is about 2800 yr (or less, if sampling had been denser). The duration of reduced intensity at the same boundary is around 4000 to 5000 yr. The duration of the two-fold excursion is about 15,000 yr and it occured ca. 20,000 yr earlier than the M/O boundary. Variation of sedimentation rates, as expressed by both geological and susceptibility records
907
G. SCHONHARTING, P. V. SHARMA, S. KENTVED
50
150
200
NORMALIZED REMANENT INTENSITIES 1 2 3 4 5 6 7 8
2 5 0 c m -
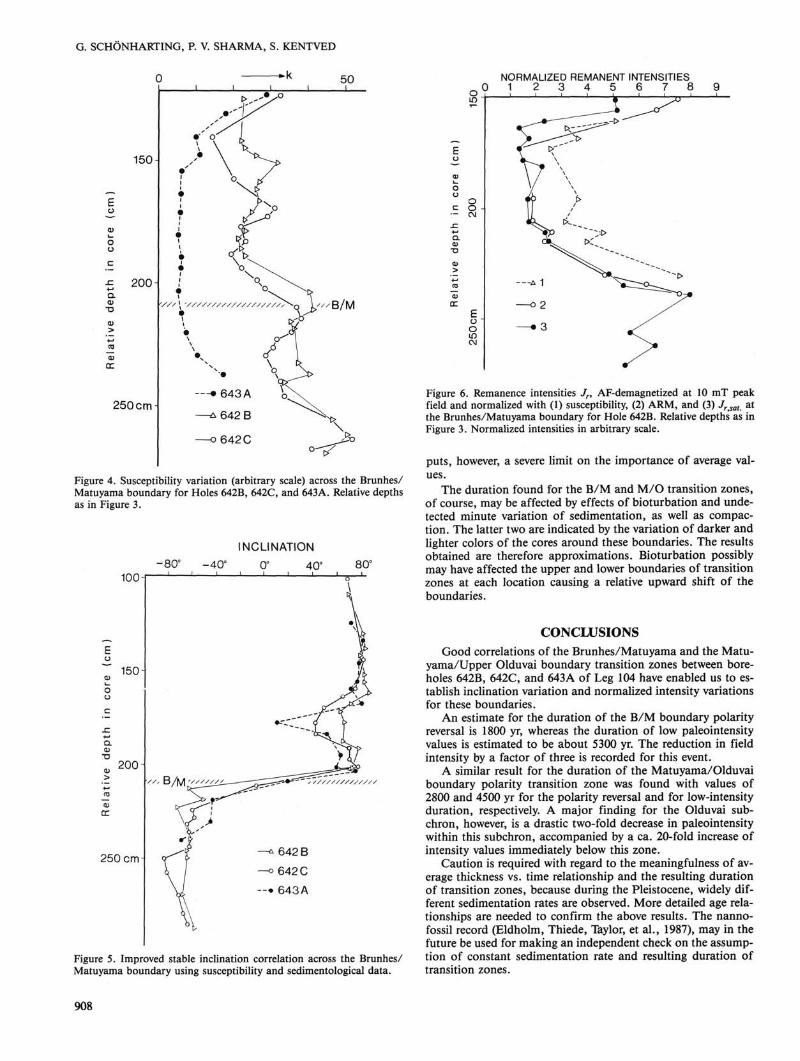
Figure 4. Susceptibility variation (arbitrary scale) across the Brunhes/ Matuyama boundary for Holes 642B, 642C, and 643A. Relative depths as in Figure 3.
-80° -40° INCLINATION
0° 40° 80° 1001
150-
200
250 cm
' - B / M
642 B
642 C
643 A
Figure 5. Improved stable inclination correlation across the Brunhes/ Matuyama boundary using susceptibility and sedimentological data.
Figure 6. Remanence intensities Jr, AF-demagnetized at 10 mT peak field and normalized with (1) susceptibility, (2) ARM, and (3) JrtSat. at the Brunhes/Matuyama boundary for Hole 642B. Relative depths as in Figure 3. Normalized intensities in arbitrary scale.
puts, however, a severe limit on the importance of average values.
The duration found for the B/M and M/O transition zones, of course, may be affected by effects of bioturbation and undetected minute variation of sedimentation, as well as compaction. The latter two are indicated by the variation of darker and lighter colors of the cores around these boundaries. The results obtained are therefore approximations. Bioturbation possibly may have affected the upper and lower boundaries of transition zones at each location causing a relative upward shift of the boundaries.
CONCLUSIONS Good correlations of the Brunhes/Matuyama and the Matu-
yama/Upper Olduvai boundary transition zones between boreholes 642B, 642C, and 643A of Leg 104 have enabled us to establish inclination variation and normalized intensity variations for these boundaries.
An estimate for the duration of the B/M boundary polarity reversal is 1800 yr, whereas the duration of low paleointensity values is estimated to be about 5300 yr. The reduction in field intensity by a factor of three is recorded for this event.
A similar result for the duration of the Matuyama/Olduvai boundary polarity transition zone was found with values of 2800 and 4500 yr for the polarity reversal and for low-intensity duration, respectively. A major finding for the Olduvai subchron, however, is a drastic two-fold decrease in paleointensity within this subchron, accompanied by a ca. 20-fold increase of intensity values immediately below this zone.
Caution is required with regard to the meaningfulness of average thickness vs. time relationship and the resulting duration of transition zones, because during the Pleistocene, widely different sedimentation rates are observed. More detailed age relationships are needed to confirm the above results. The nanno-fossil record (Eldholm, Thiede, Taylor, et al., 1987), may in the future be used for making an independent check on the assumption of constant sedimentation rate and resulting duration of transition zones.
908
MAGNETIC POLARITY TRANSITION ZONES
J r /k 5 10 0
J r /k 5
50
100
150
- 200
250
300 cm -
-B/M
10 J r/k
0 5 10
642 C
643A
642 B
Figure 7. Variations of remanence intensity/susceptibility ratio J/k across the Brunhes/Matuyama boundary for Holes 642B, 642C, and 643A. Relative depths as in Figure 3. Normalized intensities in arbitrary scale.
ACKNOWLEDGMENTS We would like to thank Dr. U. Bleil and all the other Leg 104 ship
board scientists who helped in taking the samples and/or agreed to collaborate on the same set of samples at shore-based laboratories. This study was supported by grants J. Nos. 81-4945 and 11-4084 from the Danish Natural Science Research Council.
REFERENCES Berggren, W. A., Kent, D. V, and Flynn, J. J., 1985. Paleogene geo-
chronology and chronostratigraphy. In Snelling, N. J. (Ed.), Geo-chronology and the geological record. Geol. Soc. London, Special Pap.: 141-186.
Bingham, D. K., and Evans, M. E., 1975. Precambrian geomagnetic field reversal. Nature, 253:332.
Brock, A., and Hay, R. L., 1976. The Olduvai event at Olduvai Gorge. Earth Planet. Sci. Lett., 29:127.
Clement, B. M., Kent, D. V., and Opdyke, N. D., 1982. Brunhes-Matu-yama polarity transition in three deep-sea sediment cores. Phil. Trans. R. Soc. A, 306:113.
Cox, A., 1969. Geomagnetic reversals. Science, 163:237. Cox, A., Doell, R. R., and Dalrymple, G. R., 1964. Reversals of the
Earth's magnetic field. Science, 144:1537. Cox, A., and Dalrymple, G. B., 1967. Geomagnetic polarity epochs—
Nunivak Island, Alaska. Earth Planet. Sci. Lett., 72:2603. Denham, C. R., Anderson, R. E , and Bacon, M. P., 1977. Paleomag-
netic and radiochemical age estimates for late Brunhes polarity episodes. Earth Planet. Sci. Lett., 35:384.
Dodson, R., Dunn, J. R., Fuller, M., Williams, I., Ito, H., Schmidt, V. A., and Wu Yu, M., 1978. Paleomagnetic record of a late Tertiary field reversal. Geophys. J., 53:373.
Eldholm, O., Thiede, J., Taylor, E., and Shipboard Scientific Party, 1987. Summary and preliminary conclusions, ODP Leg 104. In Eldholm, O., Thiede, J., Taylor, E., et al., Proc. ODP, Init. Repts., 104: College Station, TX (Ocean Drilling Program), 751-771.
Fuller, M., Williams, I., and Hoffman, K. A., 1979. Paleomagnetic records of geomagnetic field reversals and morphology of the transitional fields. Rev. Geophys. Space Phys., 17:179.
Gromme, C. S., and Hay, R. L., 1971. Geomagnetic polarity epochs: age and duration of the Olduvai normal polarity event. Earth Planet. Sci. Lett., 10:179.
Gurarii, 1981. The Matuyama-Jaramillo geomagnetic inversion in western Turkmenia. Izv. Earth Phys., 17:212.
Harland, W. B., Cox, A., Llewelynn, P. G , Pickton, C. A. G., Smith, A. G., and Walters, R., 1982. A Geological Time Scale: London (Academic Press), 66.
Heller, R, and Liu, T. S., 1982. Magnetostratigraphical dating of loess deposits in China. Nature, 300:431.
Hillhouse, J., and Cox, A., 1976. Brunhes-Matuyama polarity transition. Earth Planet. Sci. Lett., 29:51.
Hoffman, K. A., and Fuller, M. D., 1978. Transitional field configuration and Geomagnetic reversal. Nature, 273:715.
Kawai, N., Otofuji, Y , and Kobayashi, K., 1976. Paleomagnetic study of deep-sea sediments using thin sections. J. Geomag. Geoelec, 28: 395.
LaBrecque, J. L., Kent, D. V., and Cande, S. C , 1977. Revised magnetic polarity timescale for late Cretaceous and Cenozoic time. Geology, 5:330.
Mankinen, E. A., and Dalrymple, G. B., 1979. Revised geomagnetic polarity timescale for the interval 0-5 m.y. B.P. J. Geophys. Res., 84:615-626.
McDougall, I., 1979. The present status of the geomagnetic polarity time-scale. In McElhinny, M. W. (Ed.), The Earth, Its Origin, Structure and Evolution: London (Academic Press), 543.
Mutter, J. C , Talwani, M., and Stoffa, P. L., 1984. Evidence for a thick oceanic crust adjacent to the Norwegian margin. J. Geophys. Res., 89:483-502.
Opdyke, N. D., 1972. Paleomagnetism of deep-sea cores. Rev. Geophys. Space Phys., 10:213.
Opdyke, N. D., Kent, D. V., and Lowrie, W., 1973. Details of magnetic polarity transitions recorded in a high deposition rate deep-sea core. Earth Planet. Sci. Lett., 20:315.
Shipboard Scientific Party, 1987. Site 644: Norwegian Sea. In Eldholm, O., Thiede, J., et al., Proc. ODP, Init. Repts., 104: College Station, TX (Ocean Drilling Program), paleomagnetics section.
Shuey, R. T., Brown, F. H., and Croes, M. K., 1974. Magnetostratigra-phy of the Shungura Formation, south-western Ethiopia: fine structure of the Lower Matuyama polarity epoch. Earth Planet. Sci. Lett., 23:249.
Sueishi, T , Sato, T , Kawai, N., and Kobayashi, K., 1979. Short geomagnetic episodes in the Matuyama epoch. Phys. Earth Planet. Int., 19:1.
Tarling, D. H., and Mitchell, J. G , 1976. Revised Cenozoic polarity time-scale. Geology, 4:133-136.
Watkins, N. D., 1972. Review of the development of the geomagnetic polarity timescale and discussion of prospects for its finer definition. Geol. Soc. Am. Bull., 83:551.
909

G. SCHONHARTING, P. V. SHARMA, S. KENTVED
Watkins, N. D., Kristjansson, L., and McDougall, I., 1975. A detailed paleo-magnetic survey of the type location for the Gilsa geomagnetic event. Earth Planet. Sci. Lett., 27:436.
Date of initial receipt: 9 March 1987 Date of acceptance: 24 February 1988 Ms 104B-182
-80°
INCLINATION
-40° 0° 40° 80°
-►k 50
100-
150-
■///// M/O
100
120
140
160
180
200 cm
Figure 9. Stable inclination record across the Matuyama/Upper Olduvai boundary for Holes 642B and 642C. Relative depths as in Figure 8.
20 40 60 80 100
200cm
Figure 8. Susceptibility variation (arbitrary scale) across the Matuyama/ Upper Olduvai boundary for Holes 642B and 642C. Relative depth scale adjusted to that of 642B.
100
120
140
160
180
200 cm
Figure 10. Variation of remanence intensity/susceptibility ratios 3r/k across the Matuyama/Upper Olduvai boundary for Holes 642B and 642C. Relative depths as in Figure 8.
910