electric grid impact of pv and mitigation strategies - usea steffel pepco.pdf · electric grid...
TRANSCRIPT
Electric Grid Impact of PV and
Mitigation Strategies
December 4, 2012 United States Energy Assoc.
1

Overview
• Intro to Pepco Holdings, Inc & Renewable Activity
• Three Critical Areas for Creating Smart Energy
• Assessing the Impact of PV
• PV Issues with Different Size Systems, Case
• Large PV (Greater than 3 MWs)
• Medium PV (250 kW – 3 MW)
• Small PV (less than 250 kW)
• Hosting Capacity Study (EPRI)
• Voltage Regulation Strategy
• Utility Collaboration Efforts to Develop Advanced Solutions
2
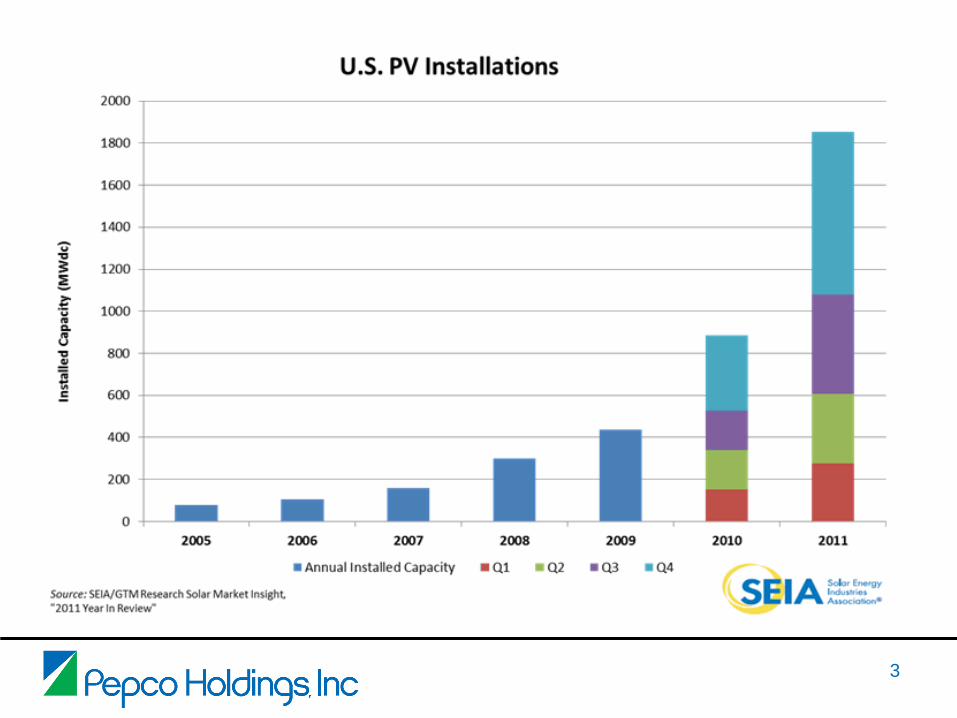
3

4
Combined Service Territory
Pepco Holdings, Inc. 3 states and Washington DC in mid-Atlantic US
5,400 sq mi (3,500 in MD)
498,000 cust (199,000 in MD)
4, 12, 25 and 34kV distribution
648 sq mi (575 in MD)
782,000 cust (528,000 in MD)
4 and 13kV distribution
2,700 sq mi
546,000 cust
4, 12, 23, and 34kV distribution
4

5
Active NEM PV Systems By Year
5
6
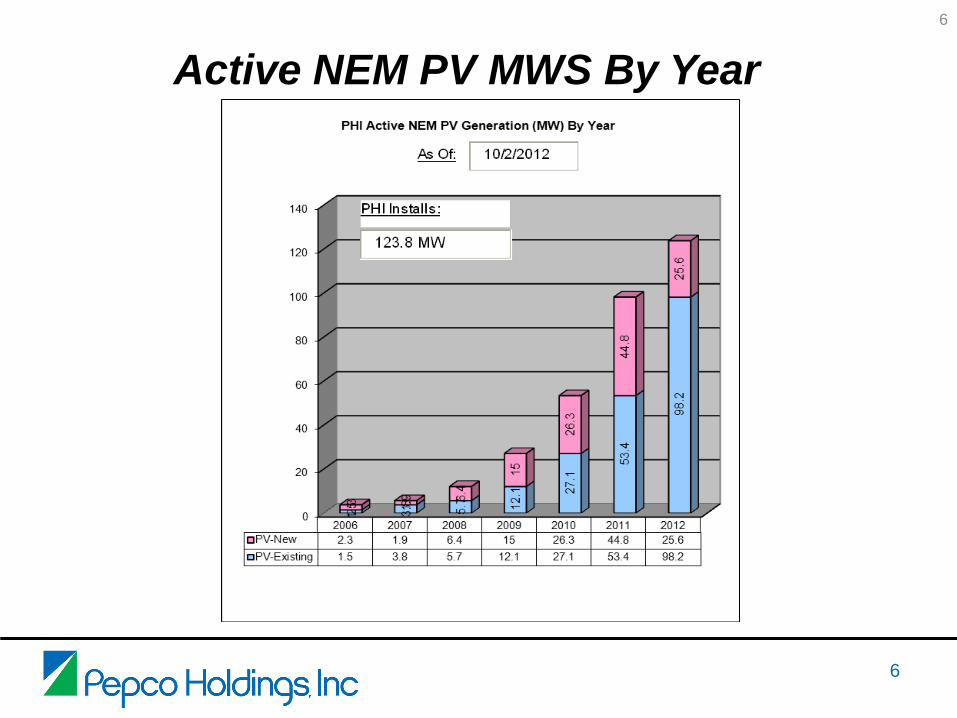
Active NEM PV MWS By Year
6

7
Pending Solar PV NEM
7

Pending Solar PV NEM (MWs)
8

Wholesale Facilities
9
Paradigm Changes in the US
● Edison, Tesla, Westinghouse -- AC wins out over DC
● Small Systems band together to make a large grid structure
● Power Plants got larger – Power flow one way – from central plants to end use customers
● Deregulation of Commodity while Delivery remained regulated
● Interest in Distributed Generation picks up – we see Land Fill gas, Wind, PV and other CHP applications
● Carbon reduction goals and government incentives bolster renewables – PV becoming the most popular
● People expect the grid to be a 2 way street
10

Smart Energy • SMART GRID
• ISO (Independent Sys.Operator)
– Bulk Generation
– Bulk Transmission • Synchrophasors
– Bulk Load Control
• LDC (Local Distribution Co.)
– Transmission
– Substation • Power Transformers
– Feeders • Distributed
Automation
• Conductors, ALE
• Line Transformers
• DMS, Advanced Fdr Mgmt
– DSM, DR
• AMI – Outage Mgmt
– Real Time Pricing
– Load Profile Info
– HAN (Home Area Network)
• Price and other comm.
• SMART PREMISE
• HEMS (Home Energy Mgmt
System)
– Pricing Signal Response
– Peak Load Control
• DER (Distributed Energy
Resource)
• Renewables, CHP, etc.
• Smart Thermostat
• Smart Appliances
• Smart HVAC – Thermal Storage
• EV – Controllable Charging, V2G
• Remote Access and Control
• Energy Efficiency & Controls
– Turn off Phantom Loads
– Vacant space mgmt.
• Direct Use of DC
• SMART INVERTER
• Voltage/Freq Ride Thru
• Ramp Rate Control
• Autonomous &
Centralized Control
-- VAR/PF Control
– Fixed/Dynamic
– Algorithm based
– Curtailment
– Remote Trip
• WITH BATTERY
– Premium Power
– Voltage Control
– Frequency Regulation
– Spinning Reserve
– Arbitrage (TOU or Real Time
Pricing)
– Demand Side Mgmt.
– Peak Demand Mgmt.

High Level System Impact Evaluation
● Pre-Screen: 50kW – 250kW
● Screen: 250kW and up (static load flow)
● Detailed Study: Time Series Study for projects
– With unresolved criteria violations (steady state or voltage fluctuations)
– Significant other generation
– Reverse Flow at Automatic Line Equipment, Feeder Terminal, or Substation Power Transformer
12

Large Solar – 3 MW to 20 MW
13
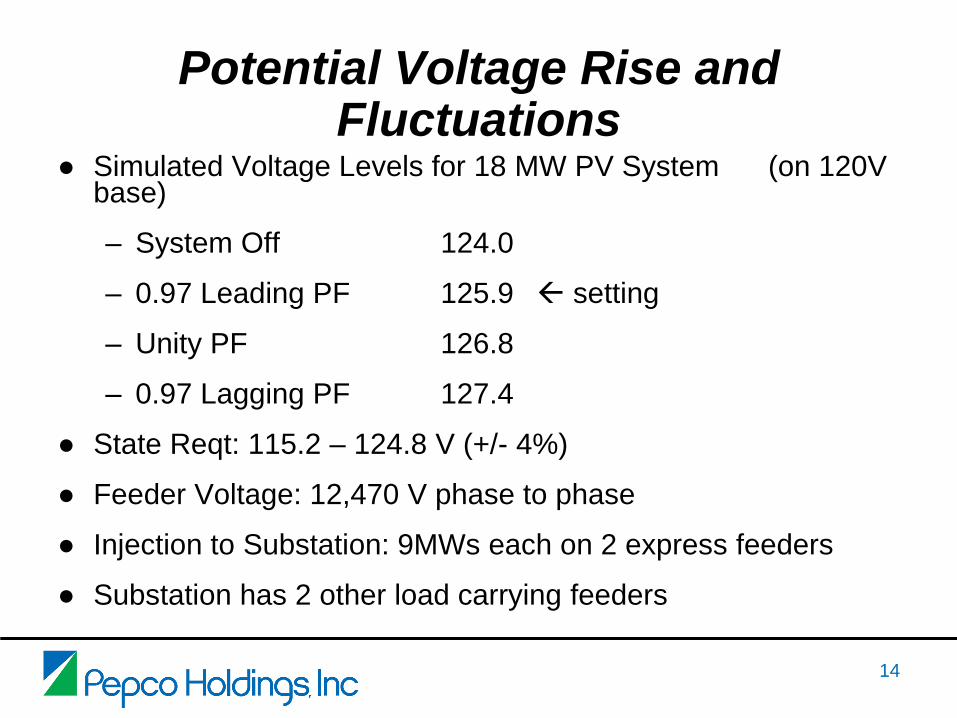
Potential Voltage Rise and Fluctuations
● Simulated Voltage Levels for 18 MW PV System (on 120V base)
– System Off 124.0
– 0.97 Leading PF 125.9 setting
– Unity PF 126.8
– 0.97 Lagging PF 127.4
● State Reqt: 115.2 – 124.8 V (+/- 4%)
● Feeder Voltage: 12,470 V phase to phase
● Injection to Substation: 9MWs each on 2 express feeders
● Substation has 2 other load carrying feeders
14

How Does an Absorbing PF help?
● Delta V = (Delta P/V1) R + (Delta Q/V1) x
● If the inverter maintains a constant absorbing PF, as the real (active) power export increases, the reactive power absorption also increases.
● For a sudden decrease in solar irradiance, the active power will drop as well as the Vars being absorbed.
● Benefits –
– Reduces steady state voltage rise
– Reduces voltage fluctuation significantly
– Helps prevent voltage sag or collapse if large amounts of solar are tripped off line at one time
15

Low Load VAR Fluctuation Impact
16

Harmonic Issue – Inverter Tripping
● 10 MW Solar System
● Voltage Rise causes the nominal voltage to be up to 1.05 pu
● Resonant with utility system - asymmetric 1.3 kHz harmonic oscillations superimposed on the inverter’s fundamental
● A number of times per day it caused some over voltages and unexpected tripping
● Capacitance was added to the inverters to resolve the situation
17

Reverse Flow on Substation Transformer
● Many Substation Power Transformers are Delta – Wye connected.
● When solar, wind, gas or other type of generation feeds into a fault on the high side of a delta winding the potential for creating an over voltage condition exists. If output was causing reverse flow at the critical time, it would then be back feeding through an ungrounded high side delta winding. Without the ground reference the voltages can "float“.
● The solution is a transfer trip package from the substation (sensing high side voltages) to the generator that will trip it for abnormal voltages.
18

Issues and Solutions for Large Solar
● Voltage Rise or Fluctuation on express feeder - Move interconnection to higher voltage level, lower the substation secondary bus voltage (if possible), set PF, future use of dynamic var control, limit ramp rate, curtailment, SCADA
● Voltage regulation for other feeders – smart LTC controls
● Losses – Move to higher voltage level, larger conductor and/or connect load to circuits
● System Stability – Low Voltage/Frequency Ride Through
● Getting Settings Correct – Insist on output readings. It can have a big impact
19

20
Medium Solar – 250 kW - 3 MW
20

21
DER Impacts to a Distribution Feeder
B R R R
R
POI
SOURCE
IMPEDANCE
(TRANSMISSION
AND
GENERATION
SYSTEM)
OTHER
CUSTOMERS
OTHER
CUSTOMERS
OTHER
CUSTOMERS
OTHER
CUSTOMERS
OTHER
CUSTOMERS
ACE
SUBSTATION
VOLTAGE
REGULATOR
VOLTAGE
REGULATOR
OTHER
CUSTOMERS
CAPACITOR
BANK
CAPACITOR
BANK
2 MW SOLAR
INSTALLATION
Impacts:
– Voltage – Steady state and fluctuations for customers and automatic line equipment
– Safety/Protection – Increased available fault currents, sympathetic tripping, reverse flow, reduction of protective reach
– Loading – Increases in unbalance, masking of demand, capacity overloads
– Control Equipment – potential for increased operations for voltage regulators, capacitors and under load tap changers
– Power Quality – potential for harmonic issues
Typical Distribution Feeder
Concentration of
small installations
could have similar
effect
21

22
Sunday April 25, 2010 (Before PV)
0.00
0.50
1.00
1.50
2.00
2.50
3.00
3.50
4.00
4.50
5.00
12:0
0 A
M
1:0
4 A
M
2:0
8 A
M
3:1
2 A
M
4:1
6 A
M
5:2
0 A
M
6:2
4 A
M
7:2
8 A
M
8:3
2 A
M
9:3
6 A
M
10:4
0 A
M
11:4
4 A
M
12:4
8 P
M
1:5
2 P
M
2:5
6 P
M
4:0
0 P
M
5:0
4 P
M
6:0
8 P
M
7:1
2 P
M
8:1
6 P
M
9:2
0 P
M
10:2
4 P
M
11:2
8 P
M
Time
MW
Sunday May 2, 2010 (Before PV)
0.00
0.50
1.00
1.50
2.00
2.50
3.00
3.50
4.00
4.50
5.00
12:0
0 A
M
1:0
4 A
M
2:0
8 A
M
3:1
2 A
M
4:1
6 A
M
5:2
0 A
M
6:2
4 A
M
7:2
8 A
M
8:3
2 A
M
9:3
6 A
M
10:4
0 A
M
11:4
4 A
M
12:4
8 P
M
1:5
2 P
M
2:5
6 P
M
4:0
0 P
M
5:0
4 P
M
6:0
8 P
M
7:1
2 P
M
8:1
6 P
M
9:2
0 P
M
10:2
4 P
M
11:2
8 P
M
Time
MW
Sunday May 23, 2010 (1.7 MW PV; 73 F and cloudy)
0.00
0.50
1.00
1.50
2.00
2.50
3.00
3.50
4.00
4.50
5.00
12:0
0 A
M
1:0
4 A
M
2:0
8 A
M
3:1
2 A
M
4:1
6 A
M
5:2
0 A
M
6:2
4 A
M
7:2
8 A
M
8:3
2 A
M
9:3
6 A
M
10:4
0 A
M
11:4
4 A
M
12:4
8 P
M
1:5
2 P
M
2:5
6 P
M
4:0
0 P
M
5:0
4 P
M
6:0
8 P
M
7:1
2 P
M
8:1
6 P
M
9:2
0 P
M
10:2
4 P
M
11:2
8 P
M
Time
MW
Sun. May 30, 2010 (1.7 MW PV; 89 F and sunny)
0.00
0.50
1.00
1.50
2.00
2.50
3.00
3.50
4.00
4.50
5.00
12:0
0 A
M
1:0
4 A
M
2:0
8 A
M
3:1
2 A
M
4:1
6 A
M
5:2
0 A
M
6:2
4 A
M
7:2
8 A
M
8:3
2 A
M
9:3
6 A
M
10:4
0 A
M
11:4
4 A
M
12:4
8 P
M
1:5
2 P
M
2:5
6 P
M
4:0
0 P
M
5:0
4 P
M
6:0
8 P
M
7:1
2 P
M
8:1
6 P
M
9:2
0 P
M
10:2
4 P
M
11:2
8 P
M
Time
MW
Distribution System Impacts (cont.) Sunday Load Profile Before and After 1.7 MW PV Installation as seen at Feeder Terminal
Cloud
Activity
Clear
Day
Monday
Holiday
No
Startup
Industrial
Load
Startup
Typical
Load
Curve w/o
PV
22

Feeder Load Profile – Before & After PV (Two PV systems 1.7 & 1.3 MWs)
Industrial
Load
Startup
Cloud
Activity Clear Day
23

24
Potential impact of PV on Load Profile 12 kV Distribution Feeder - June28 - July 4, 2009
0
1
2
3
4
5
6
0:0
0
6:0
0
12:0
0
18:0
0
0:0
0
6:0
0
12:0
0
18:0
0
0:0
0
6:0
0
12:0
0
18:0
0
0:0
0
6:0
0
12:0
0
18:0
0
0:0
0
6:0
0
12:0
0
18:0
0
0:0
0
6:0
0
12:0
0
18:0
0
0:0
0
6:0
0
12:0
0
18:0
0
Time (hrs)
(Lo
ad
(M
W)
Normal Load
Peak Shifted Load
24
25
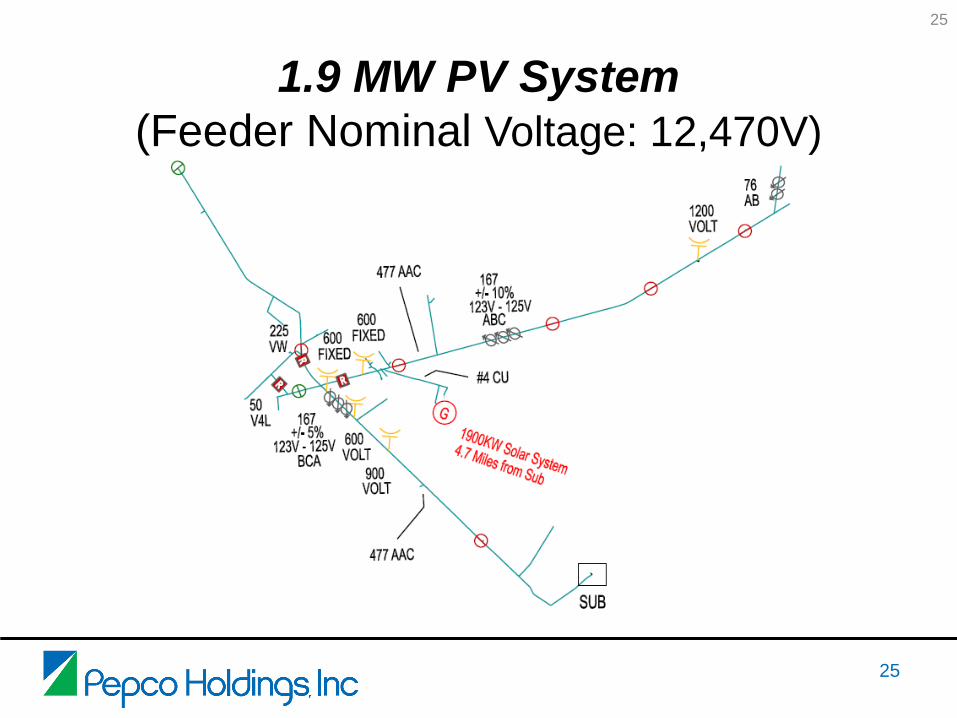
1.9 MW PV System
(Feeder Nominal Voltage: 12,470V)
25
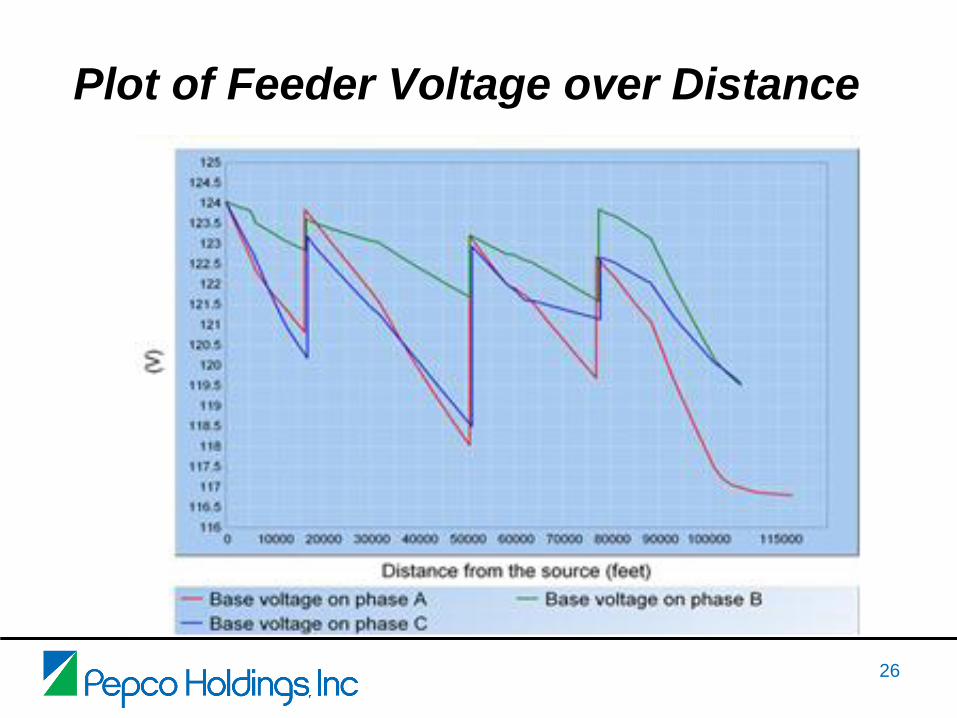
Plot of Feeder Voltage over Distance
26

27
1.9 MW PV System Voltage from Substation to PV POI
1.00 PF
123.8
124
124.2
124.4
124.6
124.8
125
125.2
125.4
125.6
125.8
0 5000 10000 15000 20000 25000
Distance from Source (ft.)
Fee
der
Vo
ltag
e (
V)
Phase A
Phase B
Phase C
Tariff Limit (124.8V)
Substation Lateral POI
27
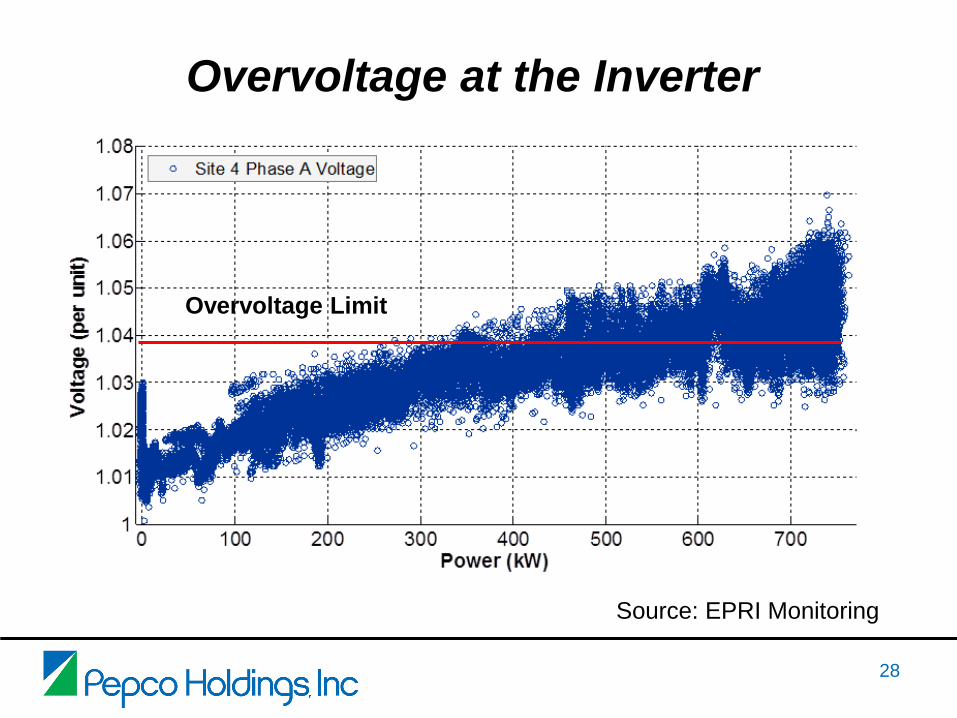
Overvoltage at the Inverter
28
Overvoltage Limit
Source: EPRI Monitoring

29
1.9 MW PV System 3 Options to Mitigate Voltage Issues
*All Maximum Steady State Voltages occurred during low load,
**Absorbing Power Factor of .97 was used for this study
***The battery storage solution is unlike the other solutions and may have other operating value streams but also may have maintenance and/or replacement costs over the life of the solar system. These have not been investigated and included in this comparison.
29

Voltage from Substation to PV POI
0.97 Leading PF
122.5
123
123.5
124
124.5
125
0 5000 10000 15000 20000 25000
Distance from Source (ft.)
Fee
der
Vo
ltag
e (
V)
Phase A
Phase B
Phase CSubstation Lateral POI
Tariff Limit (124.8V)
1.9 MW PV System
30

The Wrong PF was Implemented
31
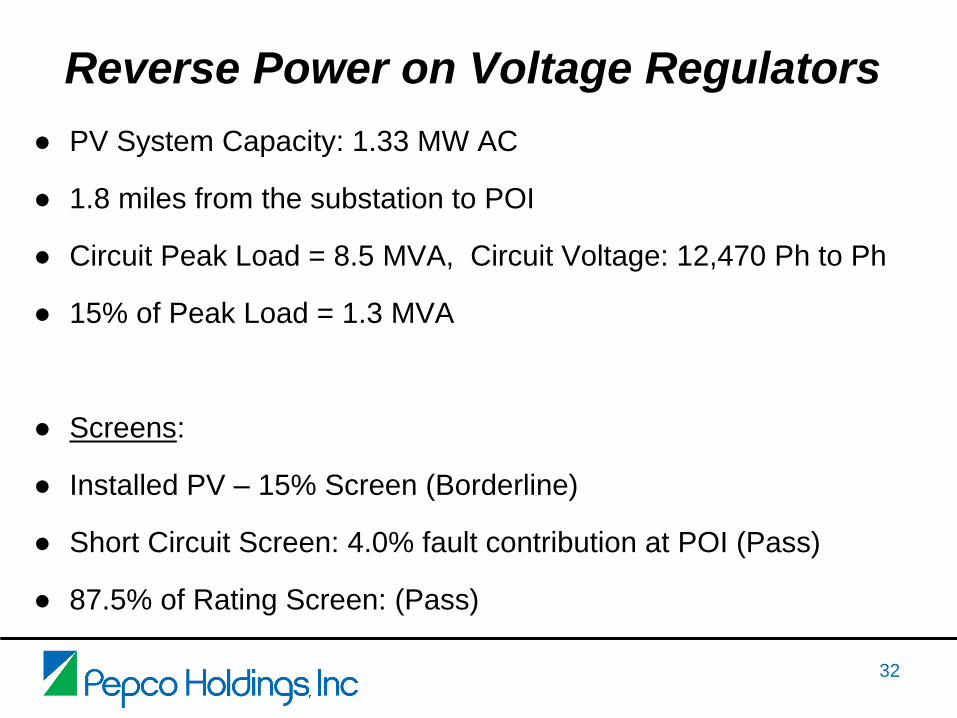
Reverse Power on Voltage Regulators
● PV System Capacity: 1.33 MW AC
● 1.8 miles from the substation to POI
● Circuit Peak Load = 8.5 MVA, Circuit Voltage: 12,470 Ph to Ph
● 15% of Peak Load = 1.3 MVA
● Screens:
● Installed PV – 15% Screen (Borderline)
● Short Circuit Screen: 4.0% fault contribution at POI (Pass)
● 87.5% of Rating Screen: (Pass)
32
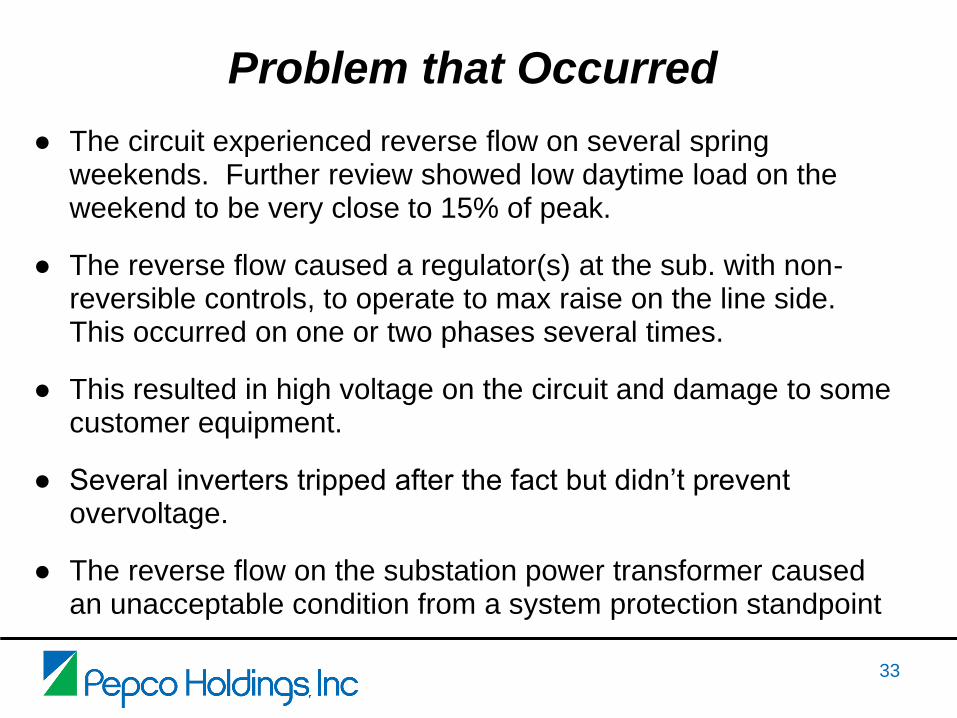
Problem that Occurred
● The circuit experienced reverse flow on several spring weekends. Further review showed low daytime load on the weekend to be very close to 15% of peak.
● The reverse flow caused a regulator(s) at the sub. with non-reversible controls, to operate to max raise on the line side. This occurred on one or two phases several times.
● This resulted in high voltage on the circuit and damage to some customer equipment.
● Several inverters tripped after the fact but didn’t prevent overvoltage.
● The reverse flow on the substation power transformer caused an unacceptable condition from a system protection standpoint
33
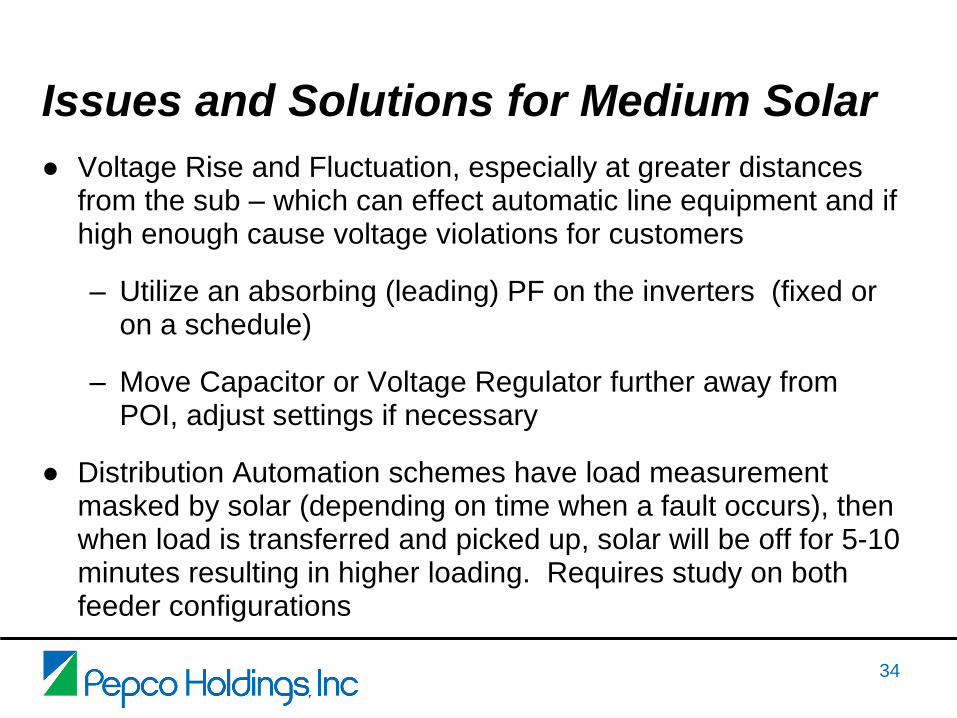
Issues and Solutions for Medium Solar
● Voltage Rise and Fluctuation, especially at greater distances from the sub – which can effect automatic line equipment and if high enough cause voltage violations for customers
– Utilize an absorbing (leading) PF on the inverters (fixed or on a schedule)
– Move Capacitor or Voltage Regulator further away from POI, adjust settings if necessary
● Distribution Automation schemes have load measurement masked by solar (depending on time when a fault occurs), then when load is transferred and picked up, solar will be off for 5-10 minutes resulting in higher loading. Requires study on both feeder configurations
34

Issues and Solutions for Medium Solar (cont.)
– Utilize battery storage
– Upgrade the conductor size
– Implement Advanced Feeder Management to reduce line voltage during peak solar output
– Utilize flexible load control to increase load at high solar output periods
– Utilize an SVC
– Reduce the size of the PV system
– Use of delta-wye transformer
35

36
Small Solar – 250 kW or less
36

37
TED 5000 installed in House Panel
and Line Transformer CTs
Current Transformers (CTs)
Voltage Sensing Lead
Neutral
Connection
MTU
MTU
Ne
utr
al
Connection
Vo
lta
ge
Se
nsin
g
Leads
37

38
System Diagram - Voltage Rise
Substation
T1
61.5/71.0 MVA
1200 kVAR
Switched
1200 kVAR
Switched
240 VAC
12/3 and #6 Cu Ground
73 Amp Max
Ground and
Surge Protector
Ground and
Surge Protector
2 – 2/0 Al
1 – 1/0 Neutral
1 – #2 Al Ground
100 Amp
Breaker
Disconnect
Meter
Junction
Box
House
Breaker
Panel
200 Amp
Outdoor 100 Amp Load
Center
With 6 – 15 Amp 240 VAC
breakers for solar and
1 – 20 Amp 120 VAC breaker
for outlet
240 VAC
2 – 4/0 Al
1 – 4/0 Neutral/Ground
Line Transformer (Pd. Mt.)
25 kVA
TED
5000
TED
5000
Voltage Rise
Electrical Diagram
Solar System
19.4 kW DC
17.1 kW AC
90 – 215 Watt Panels
90 – 190 Watt Microinverters
#8 Ground to each panel and inverter
477 AAC 397 AAC 477 AAC 397 AAC 397 AAC
Enphase Envoy
+4.08 Volts
1.7%
+0.96 Volts
0.4%
+3.96 Volts
1.7%
+2.64 Volts1.1%
240 V Base
175'
0.6%
1.033pu Typical
(103.3%)
1.05pu Typical
(105%)
25 kV Distribution Feeder
545' 2090' 1000' 600'
240 VAC
2 – 4/0 Al
1 – 4/0 Neutral/Ground
200'TED
5000
1.50 Volts
38
39
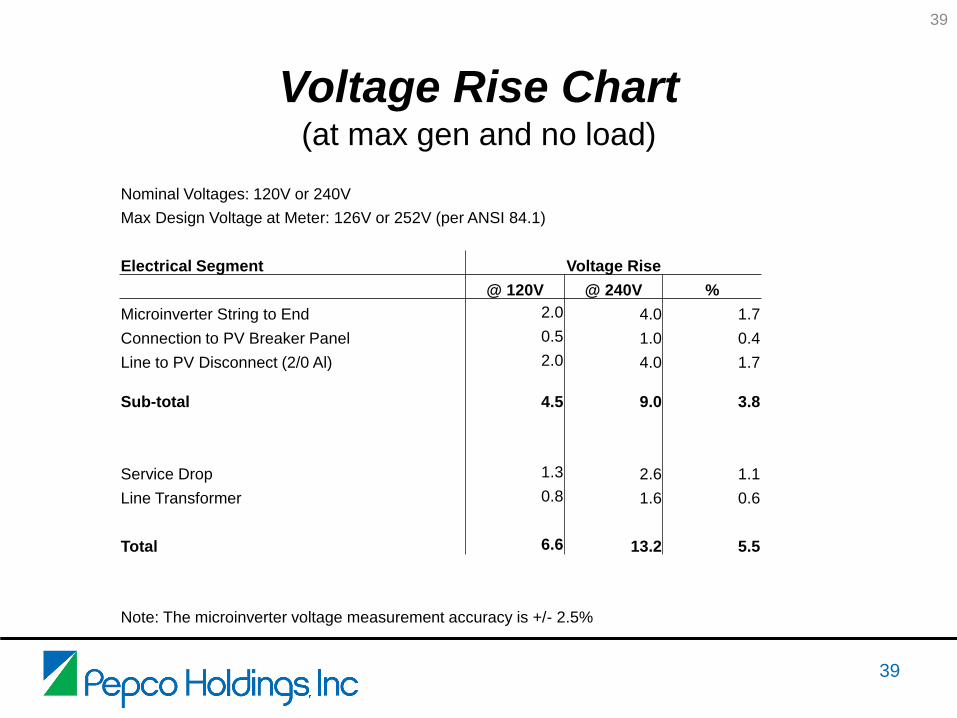
Nominal Voltages: 120V or 240V
Max Design Voltage at Meter: 126V or 252V (per ANSI 84.1)
Electrical Segment Voltage Rise
@ 120V @ 240V %
Microinverter String to End 2.0 4.0 1.7
Connection to PV Breaker Panel 0.5 1.0 0.4
Line to PV Disconnect (2/0 Al) 2.0 4.0 1.7
Sub-total
4.5 9.0 3.8
Service Drop 1.3 2.6 1.1
Line Transformer 0.8 1.6 0.6
Total 6.6 13.2 5.5
Note: The microinverter voltage measurement accuracy is +/- 2.5%
Voltage Rise Chart (at max gen and no load)
39

40
House
Load
Solar Output Turned PV
System Off
Net at Line
Transformer
Power vs. Time
40
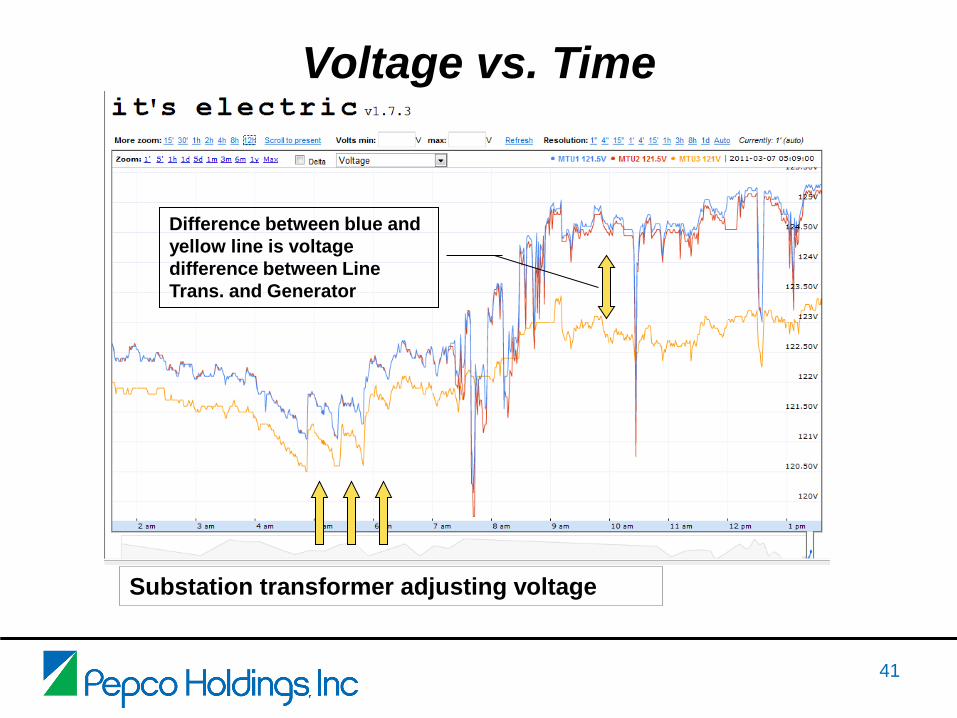
Voltage vs. Time
Substation transformer adjusting voltage
Difference between blue and
yellow line is voltage
difference between Line
Trans. and Generator
41
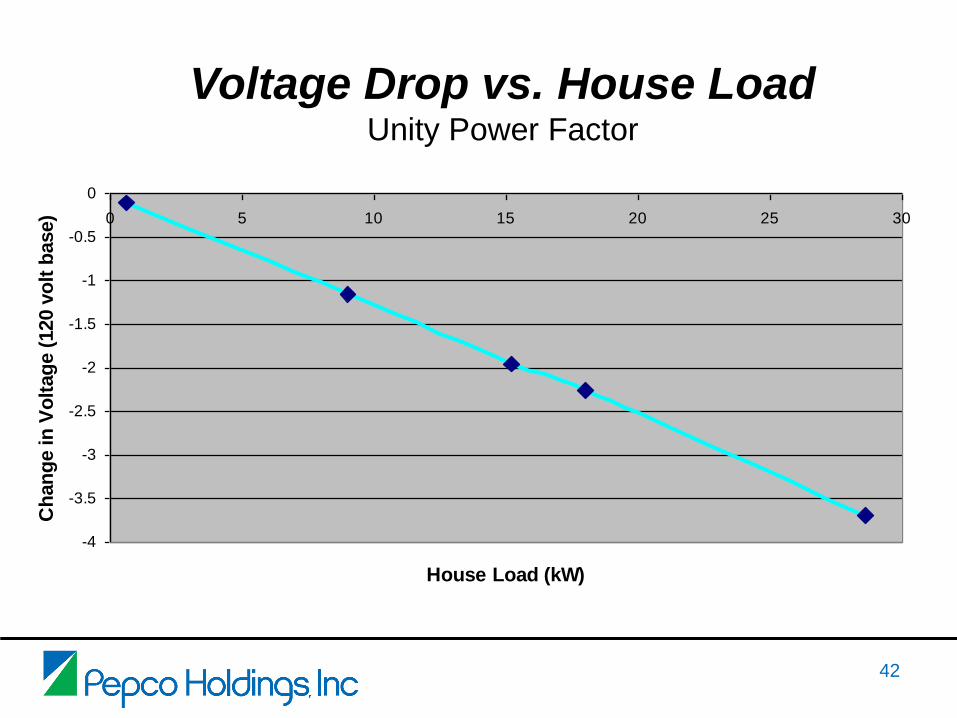
-4
-3.5
-3
-2.5
-2
-1.5
-1
-0.5
0
0 5 10 15 20 25 30
House Load (kW)
Ch
an
ge in
Vo
ltag
e (
120 v
olt
base)
Voltage Drop vs. House Load Unity Power Factor
42

The effect of cooling on the first 4
rows – about 14% increase in output
43

Issues and Solutions for Small Solar
● Voltage Rise - especially with small line transformer, long or small service, and with distance to the inverters – ths can cause inadvertent tripping of inverters and/or high voltage at the premise
– Contractor or home owner should do careful voltage rise calculation – include potential voltage rise across service and transformer
– Contractor or owner review design, using larger conductor, shorter distances, etc.
– Utilize an absorbing (leading) PF on the inverters (not common for single phase inverters)
44

Issues and Solutions for Small Solar (cont.)
– Use Home Energy Manager to move flexible loads to high output periods, and utilize signals from AMI
– Utility adjust settings on closest Capacitor or Voltage Regulator to reduce voltage a little at the customer meter if necessary
– Customer can utilize battery system to reduce peak output, take advantage of TOU rates (where available) and have premium power
– Inverter learns and adjusts PF during certain times of day
– Utility provides setting changes via AMI (PF or VARS and active power output)
45

46

47

48
49

50
51
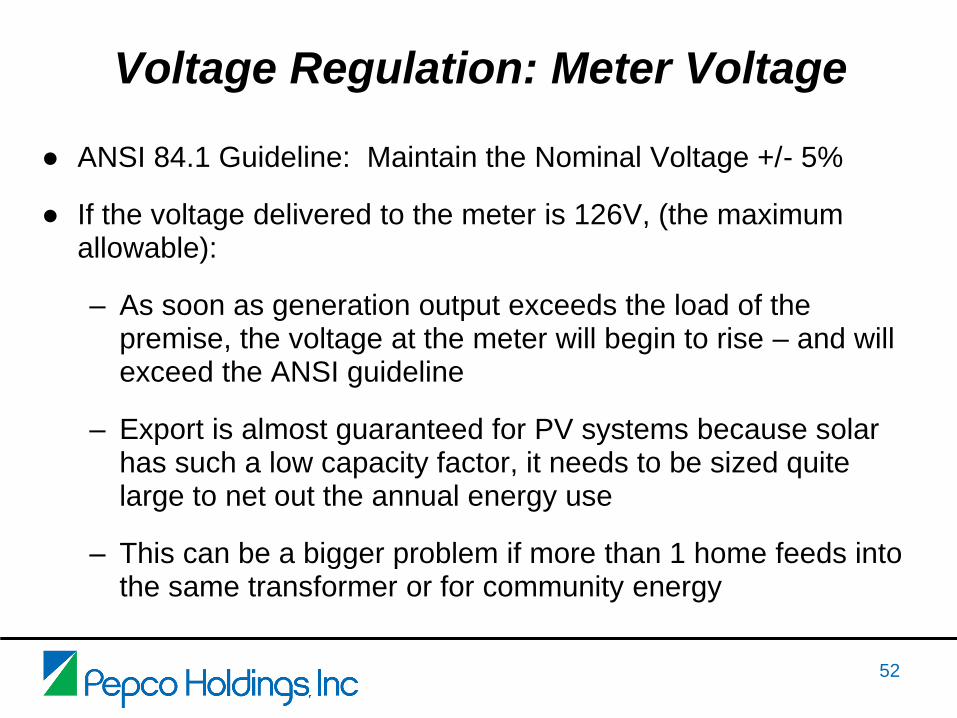
Voltage Regulation: Meter Voltage
● ANSI 84.1 Guideline: Maintain the Nominal Voltage +/- 5%
● If the voltage delivered to the meter is 126V, (the maximum allowable):
– As soon as generation output exceeds the load of the premise, the voltage at the meter will begin to rise – and will exceed the ANSI guideline
– Export is almost guaranteed for PV systems because solar has such a low capacity factor, it needs to be sized quite large to net out the annual energy use
– This can be a bigger problem if more than 1 home feeds into the same transformer or for community energy
52

53
From: Smart Distribution WIKI

Approximate Voltage Drop/Rise (%) @ Peak, Minimum Load & with PV
54
Approximate at
PEAK LOAD
without PV
Approximate at
MINIMUM LOAD
without PV
With PV Solar
Causing Export
(at minimal load)
Across Line
Transformer
- 0.5 to – 2.0% Negligible + 0.3 to +1.3%
On Secondary - 0.5 to -1.5% Negligible + 0.2 to +1.0%
On Service Drop - 1 to -1.5% Negligible + 0.5 to +1%
TOTAL - 2.0 to - 5.0% Negligible + 1.0 to + 3.3%
Note: Negative shows voltage dropping towards the premise and generation system.
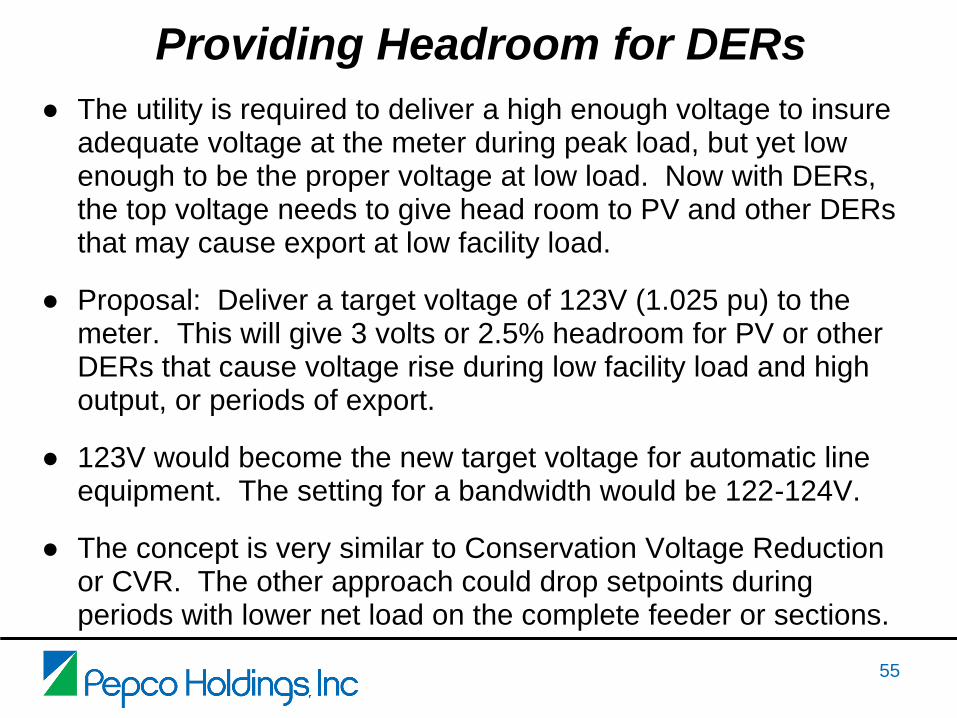
Providing Headroom for DERs
● The utility is required to deliver a high enough voltage to insure adequate voltage at the meter during peak load, but yet low enough to be the proper voltage at low load. Now with DERs, the top voltage needs to give head room to PV and other DERs that may cause export at low facility load.
● Proposal: Deliver a target voltage of 123V (1.025 pu) to the meter. This will give 3 volts or 2.5% headroom for PV or other DERs that cause voltage rise during low facility load and high output, or periods of export.
● 123V would become the new target voltage for automatic line equipment. The setting for a bandwidth would be 122-124V.
● The concept is very similar to Conservation Voltage Reduction or CVR. The other approach could drop setpoints during periods with lower net load on the complete feeder or sections.
55

Typical Voltage Regulation with Violations at the Meter
56

Voltage Regulation with “Headroom” to Mitigate Violations
57

Utility Collaborative Efforts to Develop Advanced Solutions
● New electric system model of both the T & D system that will run time series analysis with all renewables and other generation represented as well as load – will provide aggregate impact, large system impact studies and higher penetration studies
● Collaborative R & D on new anti-islanding scheme
● Collaborative R & D on dynamic var control, centrally controlled vars
● Hosting Tests of Advanced Volt/VAR Control
58

Utility Collaborative Efforts (cont.)
● Collaborative effort on collecting 1 second data from multiple points on a feeder and large PV system output to better understand impact on automatic line equipment and model penetration limit
● Collaborative effort to verify the accuracy of atmospheric data, both historical and predicted
● Effort to utilize AMI to monitor and possibly provide control signals to small size inverters
● Reviewing Cellular SCADA for large size systems
59
Utility Collaborative Efforts (cont.)
● Integrating PV output data into Distribution Automation schemes
● Reviewing feasibility of a completely online and automated way for applying and approving PV systems, reprogramming the meter, then transmitting output data automatically -- for very small/low impact systems in areas with AMI.
60

Outside Demo at ACE Training Yard with smart switch, incorporating load, and battery system.
(Work done with DOE SEGIS Grant to Petra Solar)
61

Outdoor Demo of Micro-grid mode – can operate off PV and battery, then resync with grid
(Work done with DOE SEGIS Grant to Petra Solar)
62

Steve Steffel, PE
Mgr, Distributed Energy Resources
Planning and Analytics