electrified africa - associated investments and costs1070760/fulltext01.pdf · with the initial...
TRANSCRIPT

EGI_2016:089 MSC Master of Science Thesis
KTH School of Industrial Engineering and Management Division of Energy Systems Analysis
SE-100 44 Stockholm
Electrified Africa - Associated
investments and costs
Author:
Ioannis Pappis
MSc Sustainable Energy Engineering
Supervisor:
Mark Howells
Director and Professor: Division of Energy Systems
Analysis
Royal Institute of Technology, Sweden (KTH-dESA)

2
Master of Science Thesis EGI 2016:089
Electrified Africa – Associated investments and costs
Ioannis Pappis
Approved
11 October 2016
Examiner
Mark Howells
Supervisor
Mark Howells
Commissioner
Contact person

3
Abstract Africa is a resource rich continent in both fossil fuels and renewable energy sources. Nevertheless,
its significantly underdeveloped electricity infrastructure and un-deployed power generation
potential lead to more than 620 million people to lack electricity access and the rest to face
shortages and high prices. Africa’s rapidly increasing electricity demand, from 621 TWh in 2012 to
about 1870 TWh in 2040, as well as rapid population growth, make urgent the necessity for national
and regional investments which will lead on reliable and affordable energy widely available and
achieve social and economic development. This thesis examines the national associated costs and
investments which are needed to electrify the current un-electrified population of the continent by
2030 and provide them to have an electricity consumption of 696kWh/household (TIER 3) that
year and 2195kWh/household (TIER 5) in 2050, as well as the continent to cover its electricity
demands for the period 2010-2050. To conduct this study, The Electricity Model Base for Africa
(TEMBA) [1] developed in the Open Source energy Modelling SYstem (OSeMOSYS) [2] is used,
with the initial modeling platform to remain the same but several parameters to be updated to the
latest up-to date source and the objective of the TEMBA study to differentiate. The parameters
which have been updated in this study for each country include: electricity demands (2010-2050),
existing and planned power plant capacities, technology costs, fuel availability and prices, national
fuel reserves, local transmission and distribution losses, and renewable resources potential.
Moreover, emission factors have been added into the model to estimate greenhouse gas emissions.
Different trade scenarios have been implemented to investigate the power generation potential and
the financial requirements which are needed by the continent to cover its electricity demands. An
expanded electricity trading scheme in Africa, as is being indicated in the Enhanced scenario,
exploits its country’s energy resource potential and lead to a decrease of the investment and fuel
costs as well as of the carbon dioxide emissions. The open-source nature of the model allows the
data and the model under which this study is being conducted to be publicly available for future
research.

4
Acknowledgments “You can make many speeches, but the real thing is when you dig a hole, plant a tree, give it water,
and make it survive. That’s what makes the difference.” Wangari Maathai (1940-2011), the first
African woman to receive the Nobel Peace Prize. This is the epitome for me, and with the outcome
of this thesis, I hope I will make a difference on more levels than just the theoretical.
First, I would like to thank the supervisor of my thesis Prof. Mark Howells, director of Energy
Systems Analysis (dESA) at the Royal Institute of Technology in Sweden, for his motivation, wide
knowledge in the energy field and with extensive experience in the energy sector of Africa,
encouragement, and valuable advices all this time.
I would also like to thank Constantinos Taliotis, PhD candidate in dESA, for his assistance and
support. His contribution and motivation to overcome the challenges of this thesis is greatly
appreciated.
Likewise, I am grateful that I have worked with Oliver Broad, Vignesh Sridharan, Abhishek
Shivakumar, Eunice Ramos, Dimitrios Mentis, Alexandros Korkovelos, Shahid Hussain Siyal,
Nicolina Lindblad, Caroline Sundin, and the rest of the dESA team. Except from their high
professional experience, their enjoyable, friendly, and goal motivated working attitude, alongside
their mortal support, is greatly appreciated.
Finally, I would like to deeply thank my parents and my sister who are always by my side and
support me in my goals, as well as my friends.

5
Table of Contents Abstract ........................................................................................................................................................... 3
Acknowledgments ......................................................................................................................................... 4
List of figures ................................................................................................................................................. 6
List of tables ................................................................................................................................................... 7
1. Introduction ................................................................................................................................ 8
2. Overview of Methodology .................................................................................................. 8
2.1 Methodology .......................................................................................................................... 8
2.2 The Open Source Energy Modelling System (OSeMOSYS) .................... 9
2.3 The Reference Energy System (RES) ................................................................. 10
3. Scenario Description ........................................................................................................... 12
4. Model Assumptions .............................................................................................................. 12
4.1 Overall Assumptions....................................................................................................... 12
4.2 Electricity Demand .......................................................................................................... 12
4.3 Power generation technologies ............................................................................... 15
Generic Renewable Power Generation Technologies .................................................................. 15
4.4 Technology emission factors .................................................................................... 18
4.5 Fuel Availability and Prices ........................................................................................ 18
4.6 Renewable Resource Potential ................................................................................ 19
4.7 Electricity generation options ................................................................................... 20
Existing electricity generating capacity ........................................................................................... 20
Identified electricity generation projects......................................................................................... 20
4.8 Local transmission and distribution technologies ....................................... 21
4.9 International Trade Links ............................................................................................ 21
5. Results .......................................................................................................................................... 22
5.1 Reference scenario .......................................................................................................... 22
5.2 Enhanced scenario ........................................................................................................... 25
5.3 Scenario comparison ...................................................................................................... 28
6. Conclusions ............................................................................................................................... 33
7. Limitations-Future work ................................................................................................... 34
8. Bibliography .................................................................................................................................. 35
Appendix A: Detailed Demand Data ...................................................................................... 37
Appendix B: Africa energy resource potential ................................................................ 40
Appendix C: Detailed Transmission Data ........................................................................... 44

6
Appendix D: Electricity trades among the countries .................................................. 51
List of figures Figure 1 Countries included in the model by sub-region. ....................................................................... 9
Figure 2 OSeMOSYS ‘blocks’ and levels of abstraction [2]. ................................................................ 10
Figure 3 Country power sector model structure. ................................................................................... 11
Figure 4 Number and share of population without access to electricity by country in 2016. ........ 13
Figure 5 Projected electricity demand in Africa and the share of those that gain access. ............... 15
Figure 6 Overnight investment costs for renewable technologies. ..................................................... 16
Figure 7 Total installed capacity per power pool in the Reference scenario the period 2020-2050.
........................................................................................................................................................................ 23
Figure 8 Electricity generation mix per power pool in the Reference scenario the period 2020-
2050. .............................................................................................................................................................. 24
Figure 9 Share of electricity generation mix by country in the Reference scenario in 2050. .......... 25
Figure 10 Total installed capacity per power pool in the Enhanced scenario the period 2020-
2050. .............................................................................................................................................................. 26
Figure 11 Electricity generation mix per power pool in the Enhanced scenario the period 2020-
2050. .............................................................................................................................................................. 27
Figure 12 Share of electricity generation mix by country in the Enhanced scenario in 2050. ........ 28
Figure 13 Comparison of the electricity generation mix per power pool the period 2020-2050:
Enhanced – Reference. ............................................................................................................................... 29
Figure 14 Comparison of the carbon dioxide emissions between the scenarios the period 2020-
2050. .............................................................................................................................................................. 30
Figure 15 Comparison of the annualized average of the total fuel costs between the scenarios the
period 2016-2050. ........................................................................................................................................ 31
Figure 16 Comparison of the annualized average investments costs between the scenarios the
period 2016-2050. ........................................................................................................................................ 32
Figure 17 Comparison of the total annualized electricity price between the scenarios the period
2010-2050. .................................................................................................................................................... 33
Figure 18 Electricity trades among the African countries in the Reference scenario 2020 (GWh).
........................................................................................................................................................................ 51
Figure 19 Electricity trades among the African countries in the Reference scenario 2030 (GWh).
........................................................................................................................................................................ 52
Figure 20 Electricity trades among the African countries in the Reference scenario 2040 (GWh).
........................................................................................................................................................................ 53
Figure 21 Electricity trades among the African countries in the Reference scenario 2050 (GWh).
........................................................................................................................................................................ 54
Figure 22 Electricity trades among the African countries in the Enhanced scenario 2020 (GWh).
........................................................................................................................................................................ 55
Figure 23 Electricity trades among the African countries in the Enhanced scenario 2030 (GWh).
........................................................................................................................................................................ 56
Figure 24 Electricity trades among the African countries in the Enhanced scenario 2040 (GWh).
........................................................................................................................................................................ 57
Figure 25 Electricity trades among the African countries in the Enhanced scenario 2050 (GWh).
........................................................................................................................................................................ 58

7
List of tables Table 1 Demand per power pool in TWh. .............................................................................................. 14
Table 2 Techno-economic parameters for power generating technologies. ...................................... 17
Table 3 Carbon dioxide emission factors per fuel. ................................................................................ 18
Table 4 Fuel Price Projections................................................................................................................... 19
Table 5 Existing power generating capacity by region. ......................................................................... 20
Table 6 Identified power generating capacity additions by region. ..................................................... 21
Table 7 Assumptions for Transmission and Distribution infrastructure ........................................... 21
Table 8 Carbon dioxide emissions per power pool. .............................................................................. 30
Table 9 Final electricity demands in each country (TWh). ................................................................... 37
Table 10 Electrified population 2016-2050. ............................................................................................ 38
Table 11 Electricity access in Africa (2012). ........................................................................................... 39
Table 12 Relative increase of the “others” electricity demand per power pool. ............................... 40
Table 13 Africa oil resources and reserves. ............................................................................................. 40
Table 14 Renewable Energy Potential by country. ................................................................................ 42
Table 15 Distance coastline factors of inland countries. ...................................................................... 43
Table 16 Local transmission and distribution losses. ............................................................................ 44
Table 17 International trade links. ............................................................................................................ 46

8
1. Introduction Africa is endowed with the widest possible range of energy resources all over the world, however
its electricity generation installed capacity is almost 165 GW and only 20% comes from renewable
technologies [3]. The power generation installed capacity of the world’s second-largest and second-
most populous continent is almost the same as the one the United States of America installs in five
years with a population of approximately one quarter of Africa’s or China installs in approximately
two-three years [4]. The significantly underdeveloped electricity infrastructure and un-deployed
power generation potential of the continent leads to more than 620 million people to lack electricity
access, around 50% of Africa’s total population, and the rest to face shortages and high prices [5].
The low electrification rates, 68% in urban and 26% in rural areas, nearly 60% of Africa’s
population to live in rural areas [5], associated with Africa’s significant projected population growth
and energy demand, 1.18 billion people and 589 TWh [6] [7] in 2013, and approximately 2.01 billion
people [8] and 1869 TWh in 2040 [9], make urgent the need for investments in the energy sector
to provide reliable and affordable energy widely available and environmentally sustainable.
Towards that direction and fully aware of continent’s energy sector challenges, forty-seven African
Member States signed the Paris Agreement under the United Nations Framework Convention on
Climate Change on 22 April 2016 [10] [11]. The outcomes of this agreement, source funding,
technology transfer, climate finance and capacity development is expected to help Africa to develop
its renewable energy resources and mitigate climate change. Also, two out of six pillars, science,
technology and innovation, and environmental sustainability natural resources management; and
disaster risk management, stated in the Common African Position (CAP) on the Post-2015
Development Agenda by the African leaders, indicate the development priorities in the continent
[12]. The UN Secretary-General Ban Ki-moon’s launch of Sustainability Energy for all in
September 2011, the United States of America President Obama’s launch of Power Africa, and the
UK’s Energy Africa campaign in 2015, are some additional significant steps which have been done
to provide help in Africa to face its challenges.
The objective of this thesis is to investigate the power generation potential and the financial
requirements which are needed to electrify the currently un-electrified population of Africa,
considered future newly electrified people and their energy intensity, as well as to meet the
electricity demands during the period 2010-2050. The electricity supply system of forty-seven
African countries modelled individually (TEMBA) in an open source long-term cost-optimization
tool (OSeMOSYS) to examine the less costly generation mix of each country has been updated [1].
Moreover, two trade scenarios have been implemented to investigate the effects of the international
grid interconnections in each country’s power generation infrastructure. Investments towards that
direction, extensive grid interconnections among the countries, could exploit each country’s
potential energy resources and lead to less fuel and investment costs, lower electricity prices, and
less carbon dioxide emissions.
2. Overview of Methodology
2.1 Methodology The Electricity Model Base for Africa (TEMBA) developed in the Open Source energy MOdelling
SYstem (OSeMOSYS) [1]. TEMBA includes the electricity supply systems of forty-seven African
countries, modeled individually and linked via trade links, to develop least cost system
configurations the period 2010-2050. The “least cost” is defined for the entire system, and for the
entire modeling period - not for each country individually.

9
In this thesis, the initial modeling platform remained the same but several parameters are updated
to the latest sources and the objective of the TEMBA study differentiated. The objective of this
thesis is to electrify Africa, except from covering each country’s electricity demands the period
2010-2050 as are included in the TEMBA study. The parameters which have been updated in this
study for each country are the following: electricity demands (2010-2050), existing and planned
power plant capacities, technology costs, fuel availability and prices, national fuel reserves, local
transmission and distribution losses, and renewable resources potential (hydro, solar, geothermal).
Moreover, emission factors have been added into the model to estimate greenhouse gas emissions.
The countries which are included in the analysis, forty-seven in total, have been divided in five
power pools, and are presented in Figure 1. South Sudan and Sudan have been included in the
model as one country, and Sao Tome and Principe, Madagascar, Mauritius, Seychelles, Cape Verde
have been excluded from the study since they are island states that do not affect trade potential
within the continent.
Figure 1 Countries included in the model by sub-region.
2.2 The Open Source Energy Modelling System
(OSeMOSYS) OSeMOSYS is a dynamic, bottom-up, full-fledged systems optimization model for long-run energy
planning [2]. Unlike long established energy systems (partial equilibrium) models, such as
MARKAL/TIMES (ETSAP (Energy Technology Systems Analysis Program), 2010), MESSAGE
(IAEA (International Atomic Energy Agency), 2010), PRIMES (NTUA (National Technical
University of Athens),2010), EFOM (Van der Voort,1982) and POLES (Enerdata,2010),
OSeMOSYS learning curve and time commitment to build and operate is significantly low. It builds
on an open source programming language (GNU MathProg) and uses the GNU Linear Programing
Kit (GLPK) solver, therefore, no upfront financial expenditures are needed. OSeMOSYS objective
function is to define the minimum operational cost of the system, by investigating the production

10
mix of technologies and fuels which required to meet the given energy demand, while satisfying all
the constraints which have been setted for the modelling period. Its block structure (Figure 2) and
flexibility, as well as its open source nature, allow the energy analyst to define his/her model
complexity and to elaborate a wide range of applications.
Figure 2 OSeMOSYS ‘blocks’ and levels of abstraction [2].
2.3 The Reference Energy System (RES) The schematic representation of the electricity supply system of each country included in the
modelling framework is represented in Figure 3. In the RES, the technologies are being represented
by boxes and the fuels by lines. Techno-economic (power plant capacities, capacity factors,
efficiencies, lifetime, costs) and environmental (CO2 emissions) parameters are assigned to the
technologies. Each final demand, has been divided into three sectors, and is being supplied by
different energy chains based on the least cost option for the whole continent computed by the
model the timeframe 2010-2050. The extraction or imports of fuel resources accordingly to each
country’s fuel availability define the “primary” level. The fuels which are supplied to the power
plants in the “secondary” level, transformed to generate electricity which will be transmited
through the national transmission network to the “tertiary” level, in order to be distributed and
meet each sector’s final demand. De-centralized technologies, unlike centralized ones, are not
connected to the national grid but generate and supply electricity directly to end-users. Also, in the
model electricity imports/exports from one country to another have been taken into account as
are presented in the Figure 3 below.

Figure 3 Country power sector model structure.

3. Scenario Description Scenario analysis is essential for energy and investment planning, financing needs, informing and
formulating energy policies, strategies, debates, decisions, as well as for academic purposes. In this
thesis two trade scenarios, Reference and Enhanced, are assessed to investigate the effects of the
international grid interconnections in each country’s power generation infrastructure the period
2010-2050. The expansion of the currently limited grid interconnections among the African
countries could exploit each country’s energy resources and lead to potential benefits for the
continent. The grid interconnection projects which are included in the model and assigned in each
country in each scenario are provided in Table 17 of Appendix C.
The Reference scenario includes the cross-border electricity interconnections among the
African countries which exist and are committed (Table 17,Appendix C). In this scenario,
no future potential trades are considered in the model. The future electricity generation
mix as well as the investments which are needed by the continent to cover its electricity
demands are examined based on the existing energy infrastructure.
The Enhanced scenario, additional to the existing and committed trades, includes the
planned uncommitted grid interconnections. Potential cross-border electricity
interconnections projects among neighboring countries are considered in the model after
2025 to investigate the least cost electricity generation mix of the system.
4. Model Assumptions
4.1 Overall Assumptions Overall assumptions across all scenarios are as follows:
The real discount rate is 5%.
The monetary unit is 2010 US$.
The timeframe of the model spans from 2010 to 2050, with yearly basis simulations.
In order to capture the key features of electricity demand load pattern, each year has been
splitted in two seasons, and each season in two blocks of equal demand, namely “day” and
“night”.
Transmission and distribution losses are defined on a national level. Different efficiency
improvements are assumed to be achieved during the model horizon based on each
country’s current status (Table 16, Appendix C).
4.2 Electricity Demand The main sources used for each country’s historic electricity demand (until 2013) are the Energy
Statistics and Balances of International Energy Agency [6] and the 2013 Electricity Profiles
published by United Nations Statistics Division [7]. National indicators, such as urban and rural
population [8], electrification rates [5], and energy intensities are used to derive the final electricity
demands. The electricity demand of Africa was 540.4 TWh in 2010 and based on the assumptions
of this study will be 3416 TWh in 2050. The values of each country’s electricity demand, after
transmission and distribution losses, can be found in Table 9 of Appendix A. Also, the number of
the un-electrified people and each country’s electricity access in 2016 considered in the model are
presented in the Figure 4 below.

13
Figure 4 Number and share of population without access to electricity by country in 2016.
The methodology which has been applied to calculate the electricity demand projections of each
country remains the same in all cases. The demand has been divided into “urban un-electrified”,
“rural un-electrified” and “others” categories as follows:
Urban un-electrified, the urban population who is currently un-electrified and gains
electricity access gradually through the period 2017-2030;
Rural un-electrified, the rural population who is currently un-electrified and gains
electricity access gradually through the period 2017-2030;
Others, refers to all the currently electrified portions of sectors in the economy. This
includes industry, transport, commercial and public services, agriculture, and residential.
The demand projection of “others” sector is based on the projected relative increase among the
years derived from the African Energy Outlook 2014 [5] for each power pool (Table 12, Appendix
A). The timeframe of the model spans after 2040, so the growth rate of period 2030-2040 is applied
for the years 2041-2050.
The “urban and rural un-electrified” demands represent the urban and rural population who is
currently un-electrified based on the electrification rates of 2012. It has been assumed that the
electrification rate of each country will be 100% in 2030, and the energy intensity for both urban
and rural population will be 696 KWh/household (TIER 3) in 2030 and 2195 KWh/household

14
(TIER 5) in 2050 [13]. Each household has been assumed to correspond to five persons. The
electrified population considered in the model for the period 2016-2050 as well as the electrification
rates of Africa in 2012 can be found in Table 10 and Table 11 of Appendix A correspondingly.
The total demand of the continent is increasing approximately six times 3416TWh in 2050,
compared to 540.4TWh in 2010 ( Table 1). All the population of Africa is electrified in 2030 and
have an electricity consumption of TIER 3. That year (2030) the total demand of the continent is
approximately two times higher than the 2010. The total demands of Central and Western African
power pool in 2030 are approximately three times higher than in 2010. This is mainly due to
Democratic Rep. of Congo and Nigeria’s low electrification rates and high population. The
electricity demands of these two countries constitute around 50% of their power pool’s total
demands in 2015. The Eastern African power pool represents the highest increase, approximately
by six times, of its total electricity demand in 2030. This is mainly due to Ethiopia, Kenya and
Sudan where these countries constitute around 60% of the power pool’s total demand.
Table 1 Demand per power pool in TWh.
TWh 2010 2015 2020 2030 2040 2050
CAPP 13.6 18.9 28 68.9 138.5 244.8
EAPP 22.2 38.1 62.3 180.7 378.3 698.0
NAPP 222.3 278.8 340.4 450 594.8 739.3
SAPP 242.6 256.4 295.6 400.8 552.4 760.5
WAPP 39.8 58.0 89.2 230.7 497.2 973.5
Africa 540.4 649.8 815.4 1331.0 2143.1 3416.0
The northern African countries have almost 100% electricity access, except from Mauritania which
has 21%, consequently their urban and rural un-electrified demands are relatively low. Countries
in West and East African power pool account for most of the un-electrified demand since they
have low electrification rates and high population. Figure 5 shows the evolution of the electricity
demand by sector in Africa the period 2010-2050. The total electricity demand in 2050 will be
approximately 6 times higher than the 2013 values. The share of the population that gain electricity
access in 2020 is approximately 2% of the total demand that year, and increases to 23% in 2050.

15
Figure 5 Projected electricity demand in Africa and the share of those that gain access.
4.3 Power generation technologies In an energy system, in order for the final demand to be covered, generic power generation
technologies are modeled to provide electricity through the grid. These technologies are being
categorized mainly in renewable and non-renewable, and in centralized (upstream of transmission)
and decentralized (upstream of distribution or site specific). Also, certain techno-economic
parameters are defined for each technology [9] [14] [15] [16].
Generic Renewable Power Generation Technologies The following renewable technologies are included into the model in addition to geothermal and
nuclear. Nuclear technology is avoided to be considered as a viable energy option into the model,
is available only in South Africa (there is already 1.8 GW of installed capacity) and Egypt, while
new additions of this technology can be done only from 2026 onwards. Only the distributed or
roof-top solar PV technology is decentralized, while all the other technologies are connected
upstream of transmission.
- Small hydro refers to the power plants which their capacity is less than 20 MW.
- Medium hydro represents the power plants with capacity which range between 20 – 100
MW.
- Large hydro represents the run of river and reservoir options for power plants with
capacity more than 100MW.
- On-shore wind is represented by two technologies based on their capacity factors, 25%
and 30%.
- Biomass include the co-generation technologies.
- Utility PV represent the PV farms which are managed by the utility. They are modeled to
produce electricity only during the day.
- Distributed or roof-top Solar PV are modeled to produce electricity only during the day.
They can supply urban-rural residential, commercial, and small industries demands.
0
500
1000
1500
2000
2500
3000
3500
4000
4500
2010 2020 2030 2040 2050
TWh
Electricity demand forecast by sector
Demand fromthose gainingaccess in UrbanareasDemand fromthose gainingaccess in Ruralareas

16
- Solar CSP no storage represents medium to large scale concentrated solar power plants.
They were modeled to produce electricity only during the day
- Solar CSP with storage are medium to large scale concentrated solar power plants with
thermal storage. They can produce electricity throughout the day.
The learning rates of the renewable technologies throughout the model period are anticipated to
be improved. It has been assumed that from 2035 onwards the costs remain constant. The
projection of the overnight investment costs of the renewable technologies are presented in Figure
6. Also, the techno-economic parameters of the renewables and fossil fuel power generation
technologies used in the model are presented in Table 2.
Figure 6 Overnight investment costs for renewable technologies.
0
1000
2000
3000
4000
5000
6000
7000
8000
2010 2020 2030 2040 2050Nuclear Geothermal Hydro
Small Hydro Wind onshore Biomass
Solar PV (utility) Solar PV (rooftop) Solar thermal no storage
Solar thermal with storage Solar thermal with gas co-firing
$/kW

Table 2 Techno-economic parameters for power generating technologies [9] [14] [15] [16].
Technologies Overnight capital cost (USD/kW)
Fixed cost ($/kW)
Variable cost ($/MWh)
Life (Yrs)
Efficiency Load factor
Construction time (Yrs)
2010 2020 2035 2010 2050 2010 2050 2010 2020 2035
Diesel centralized 708 708 708 8 8 2 2 25 35% 80% 2 2 2
Diesel 100kW system 659 659 659 - - 55 55 20 35% 80% 1 1 1
Diesel/Gasoline 1kW system
692 692 692 - - 33 33 10 21% 72% 1 1 1
HFO 1350 1350 1350 - - 15 15 25 35% 80% 2 2 2
OCGT 708 708 708 8 8 2 2 25 30% 85% 2 2 2
CCGT 1021 1021 1021 1 1 2 2 30 48% 85% 3 3 3
Goal 2080 2080 2080 27 27 35 37% 85% 4 4 4
Hydro small scale 5127 5075 5025 41 40 7 7 50 N/A Varies 4 4 4
Hydro medium scale 1777 1815 1929 26 26 5 5 50 N/A Varies 4 4 4 Hydro large scale 1777 1815 1929 22 24 4 4 50 N/A Varies 4 4 4
Biomass 4447 4325 4105 59 54 3 3 30 38% 50% 3 3 3 Nuclear 4480 4480 4480 112 112 2 2 60 33% 85% 7 7 7
Geothermal 4898 4769 4356 49 44 - - 25 100% 85% 4 4 4 Wind onshore 1940 1829 1743 37 33 - - 25 N/A Varies 2.5 2 1.5
Solar PV (utility) 1562 1158 935 25 22 - - 25 N/A 25% 1.5 1.5 1.5 Solar PV (rooftop) 1977 1461 1175 33 29 - - 25 N/A 20% 1 1 1
Solar CSP no storage 4988 3677 2860 200 114 - - 25 N/A 35% 3 2.8 2.5 Solar CSP with storage 6777 4074 3083 61 42 4 2 25 N/A 63% 3 2.8 2.5
Solar CSP with gas co-firing
1374 1374 1374 - - 16.4 16.4 25 53% 85% 3 2.8 2.5

4.4 Technology emission factors Fossil fuel technologies based on the fuel which are using to generate electricity emit different
levels of greenhouse gases which are harmful to the environment. In the model, different carbon
dioxide emission factors have been linked to each fuel, on the output of import and extraction
technologies in each country, and are presented in Table 3 [17]. These linkages help to identify the
total amount of carbon dioxide emissions being produced by each country.
Table 3 Carbon dioxide emission factors per fuel [17].
Fuel Mton/PJ
Diesel 0.0693
HFO 0.0747
Gas 0.0503
Coal 0.0893
4.5 Fuel Availability and Prices The categorization of the fuel prices has been done based on the location of each country (inland,
coastal), as well as their availability on fuels (domestic reserves, imports). The prices of the imported
fuels for the inland countries, compare to their domestic ones, were calculated based on their
distance from the closest coastal capital. The distance coastline factors of each country can be
found in Table 15 of Appendix B. Each country’s proven reserves in coal (bituminous, lignite),
crude oil and natural gas, which were added in the model can be found in Table 13 of Appendix B
[4].
Coal was/is distinguished based on its different energy content, in bituminous 27-30 GJ/ton, and
lignite 10-19 GJ/ton. Therefore, different prices are assumed for each country’s identified domestic
reserves. Morocco and Nigeria which have bituminous and lignite reserves, a weighted average
price was calculated for the coal domestic price.
Two types of crude oil products (heavy fuel oil, diesel) are assumed available for domestic use or
imports.
As far as it concerns the natural gas supply, the inland countries which don’t have imports, don’t
have a pipeline infrastructure, and don’t have domestic reserves, are not allowed to have any gas
imports at any point during the model horizon. The inland countries which have domestic reserves
but no future committed natural gas projects can have gas imports from 2025 onwards. Coastal
countries which currently don’t import natural gas can be supplied after 2025.
The fuel prices for coal, oil products, and gas are based on the World Bank Commodity Markets
Outlook [18] [19] [20] and World Energy Outlook 2015 [9]. It is assumed that all countries have
the same price as the South Africa’s coal (6,000 kcal/kg) until 2015. The period 2016-2025, the
price projections of coal are based on the projected growth rates of Australian coal (6,700 kcal/kg).
The period 2026-2040, the price projections of coal are based on the growth rates of coal price
projections of the World Energy Outlook 2015 for the Low Oil Price Scenario. The crude oil

19
prices, the period 2010-2025, are based on the World Bank Commodity Markets Outlook and are
assumed as import prices. The growth rates of crude oil price projections of the World Energy
Outlook 2015 for the Low Oil Price Scenario are implemented the period 2026 onwards. The crude
oil domestic prices are assumed to be 5% less than the imported ones the period 2010-2050. For
gas import prices, the period 2010-2025 the prices of Europe’s natural gas derived from World
Bank are assumed, and from 2026 onwards the growth rates of Europe’s natural gas imports price
projections of the World Energy Outlook 2015 for the Low Oil Price Scenario. The gas domestic
prices are assumed to be 5% less than the imported ones the period 2010-2050. As to biomass, it
is assumed to be scarce and its prices defined accordingly [21]. The assumed price evolutions for
fuels are summarized in Table 4.
Table 4 Fuel Price Projections [9] [18] [19] [20] [21].
USD/GJ (2010 real prices) 2015 2020 2030 2040
Crude oil (USD/bbl) 48 51.2 74.26 90.17
Coal (bituminous,domestic) 1.25 1.17 1.36 1.43
Coal (bituminous,imported,coastal) 1.88 1.75 2.03 2.14
Coal (lignite,domestic) 1.49 1.39 1.62 1.70
Diesel (domestic) 9.99 10.65 15.45 18.76
Diesel (imported,coastal) 10.51 11.21 16.26 19.75
HFO (domestic) 5.89 6.28 9.11 11.06
HFO (imported,coastal) 6.20 6.61 9.59 11.64
Gas (domestic) 6.92 5.91 7.72 9.88
Gas (imported) 7.28 6.22 8.12 10.40
Biomass (scarce) 1.50 1.50 1.50 1.50
4.6 Renewable Resource Potential Even though Africa has a substantial solar potential, only South Africa (1.5GW) and Algeria
(375MW) have done investments towards that direction. The same applies for wind potential,
where except the Northern African countries (1,5 GW) and South Africa (1GW), in the rest of the
continent this energy source remains unexploited [22]. Especially in countries, such as Somalia,
Kenya, Chad, Sudan, with wind speeds more than 9 m/s, wind investments are relatively low [23].
The continent’s technically exploitable resource potential from geothermal is about 18 GW and is
much smaller than any of the other primary fuel sources. Kenya and Ethiopia are the dominant
countries representing 83% of the total capacity [24].
Over the next decades, in order for Africa’s rapidly growing electricity demand to get covered, this
significantly renewable resource potential should be utilized. Estimates about each country’s
renewable resource potential: solar, wind, [22] and geothermal [24] [25] can be found in Table 14
of Appendix B. Hydro potential identified in country’s reports and other sources [25] [26].

20
4.7 Electricity generation options
Existing electricity generating capacity
Africa is significantly rich in renewable energy resources, nevertheless the power sector depends
on non-renewable power generation options and only around 19% comes from renewables.
Although in Central and Eastern Africa the renewable technology shares in the power sector are
65% and 63% in Northern and Southern Africa which are the dominant markets of Africa’s
electricity demand, their renewable shares are almost around 9% and 18%. The existing power
generating capacities by energy source and region until 2015 are summarized in Table 5 [3].
Table 5 Existing power generating capacity by region [3].
Region (MW)
Coal Diesel/HFO Gas Hydro Solar Wind Geothermal Biomass
Central Africa
0 658 873 2,886 5 0 0 3
Eastern Africa
26 3,210 766 5,930 33 242 691 22
Northern Africa
2,585 4,786 56,330 4,543 411 1,503 0 0
Southern Africa
41,289 2,963 1,375 7,624 1,585 1,010 0 7
Western Africa
68 3,242 13,292 5,025 55 12 0 10
Identified electricity generation projects
The penetration of renewable energy technologies in Africa’s future power sector are being highlighted in the identified future power generation projects. The future renewable capacities account for 53% of the total additions, and this is mainly due to hydro in Central (98%), and Eastern (84%) Africa. Northern African countries are expanding significantly their gas industries, only Egypt invests in coal power plants. Southern African countries are mainly investing in coal and gas power plants, especially South Africa (coal - 9740MW, gas - 4009MW) and Zimbabwe (coal - 5100MW), but their investments especially in hydro and wind represent 47% of the planned addition.
The summary of future power generation projects, committed or under consideration, by energy source and region are summarized in Table 6 [3]. Only the projects which are committed are forced to be used into the future energy system in the model, those which are under consideration are selected by the optimization process.

21
Table 6 Identified power generating capacity additions by region [3].
Region (MW)
Coal Diesel/HFO Gas Hydro Solar Wind Geothermal Biomass
Central Africa
500 6 471 48,034 212 0 0 0
Eastern Africa
3,176 757 2,312 30,361 561 1,086 1,310 64
Northern Africa
6,270 20 41,395 281 976 757 0 0
Southern Africa
21,064 868 7,047 21,231 2,167 2,359 0 72
Western Africa
7,390 106 17,524 10,971 839 420 0 45
4.8 Local transmission and distribution technologies Most African countries have unreliable grid networks with high losses, almost double than the
world average, and high electricity tariffs [5]. Each country’s national grid is represented in the
model by transmission and distribution technologies, defined by losses based on country’s
historical data. The off-grid technologies, since they don’t require transmission and distribution
infrastructure, they don’t have any losses and costs. In this study the transmission losses remain
constant over time. Different distribution losses and costs are assigned in each country and in each
of the three demand categories (Table 16, Appendix C). In distribution technologies efficiency
improvements are being made through the years. Table 7 shows the costs of transmission and
distribution infrastructure [16].
Table 7 Assumptions for Transmission and Distribution infrastructure [16].
Trans. & Dist. Cost
USD/KW Transmission (all sectors) 364.97 Others 840.4 Urban 2433.3 Rural 4233.6
4.9 International Trade Links A cross-border interconnected grid is one of the main driving factors that positively affect the
development process among the trading countries. It promotes security of electricity supply, in
case the country faces generation shortages, and gives incentives for lower electricity tariffs.
Countries which have low costs of generating electricity can provide low electricity prices to their
customers and concurrently export to other countries to increase their profits. Additionally, the
costs for the importing countries will be lower, rather than generating more expensive electricity
to cover their energy needs. However, the current grid infrastructure among the African countries

22
is limited and thus can’t support extensive trade. The following categories of international trade
technologies are considered in the model for the different scenarios (Table 17, Appendix C)[1].
Existing capacities: interconnections which are available from the base year of the model
or before, and operate throughout the model period. They are included in the Reference
scenario.
Future capacities:
- Committed: interconnections which are or will be constructed throughout the model
period and their operation year has been identified. They are included in the
Reference scenario.
- Planned: interconnections which will be constructed. Their operation year has been
identified, but uncertainties in the implementation process in some of the
infrastructure projects exclude their total capacities to be taken into account in the
Reference scenario. If the interconnections have been granted financing, they are
included in the Reference scenario. Otherwise they are only considered in the
Enhanced scenario.
- Assumed: future uncommitted interconnections projects which allow trade links
among neighboring countries from 2025 onwards, and not included in the existing
and committed projects. These capacities are included only in the Enhanced
scenario.
5. Results
5.1 Reference scenario The significant increase of population, and electricity access of Africa in the future increase on a
large scale the energy needs of the continent and thus investments required. The total installed
capacity of the African countries was 170GW in 2015, doubles to 364GW in 2030, at which point
the electricity access in the continent is 100%, and further increases to 785GW in 2050 (Figure 7).
In order for Sub-Saharan Africa to be electrified, its total installed capacity needs to be increased
from 96GW in 2015, to 238GW in 2030, and 595GW in 2050.
In 2015, the Northern African power pool (74GW) and Southern African power pool (58GW)
had the biggest share of the continent’s installed capacity. The Central African power pool (5GW),
Eastern African power pool (11GW), and Western African power pool (22GW) increase their
installed capacities in 2030 approximately four times compared to 2015 levels, and twelve times by
2050 to cover their energy needs. The Western African power pool’s (228GW) installed capacity,
followed by Northern African power pool (189GW), represent most of the continent’s installed
capacity in 2050. The enormous increase in the total capacity of Western African power pool is
due to the low electrification rates and high population which identify the power pool. This is also
reflected by the increase of Nigeria’s installed capacity from 14GW in 2015 to 109GW in 2050. In
Northern African power pool, the total installed capacity of Egypt 33GW in 2015, and 112GW in
2050, corresponds to most of power pool’s investments. Eastern African power pool followed by
Central African power pool have the biggest increase in their installed capacity, from 11GW, and
5GW in 2015, to 151GW, and 61GW in 2050, correspondingly. The installed capacities of Ethiopia,

23
and Sudan, 2.32GW, and 2.6GW in 2015, and 35.56GW, and 37GW in 2050, represent the biggest
shares of the installed capacities in the Eastern African power pool.
In 2050, hydro and CSP with storage technologies represent approximately 70% of the continent’s
total installed capacity. In Central African power pool, the investments in hydro represent around
75% of each year’s total installed capacity with the share of CSP with storage technologies to be
increased at the future. Also, several countries, like Egypt, Morocco, Kenya, and South Africa, have
started to harness their wind resources, and continent’s wind capacity increases from 7GW in 2020
to 42GW in 2050. Investments in geothermal technology are only held in Eastern African power
pool, and mainly by Kenya and Ethiopia, 8.2GW, and 2.5GW in 2040. Nuclear technology
investments held in Northern African power pool and Southern African power pool only by South
Africa and Egypt.
In the continent, gas investments are mainly in Northern African power pool, with Algeria, and
Egypt, 17GW, and 30GW, out of 57GW in total in 2030, to be responsible for most of this share.
In 2030, Western African power pool, and mainly Nigeria (11.6GW) constitutes most of the
continents gas installed capacity. The installed capacity of coal in Southern African power pool
decreases throughout the years, from 42GW in 2015 to 7GW in 2050, since South Africa’s coal
capacity decreases from approximately 39GW in 2015 to 3GW in 2050. Western African power
pool increases its coal capacity from 0.07GW in 2015 to 19GW in 2050, mainly due to Nigeria’s
high energy needs 510TWh in 2050. Nigeria shift its investments apart from renewable energy
technologies to coal as well, with country’s coal installed capacity to reach 11GW in 2050.
Figure 7 Total installed capacity per power pool in the Reference scenario the period 2020-2050.
The electricity generation in the continent increases from 734TWh in 2015 to 1498TWh in 2030,
and to 3854TWh in 2050 (Figure 8). The Northern (382TWh) and Southern (318TWh) African
power pools constitute most of the continent’s electricity generation in 2020. However, the
0
50
100
150
200
250
Cap
acit
y (G
W)
CAPP
BASE
Coal Diesel HFO Gas
Wind Solar PV Solar Thermal Hydro
Geothermal Nuclear Biomass Dist. PV
EAPP NAPP SAPP WAPP

24
Western (1110TWh) African power pool, and the Southern (820TWh) African power pool are
responsible for most of the continent’s electricity generation in 2050. Western and Eastern African
power pools present the largest increase in production of electricity throughout the years.
The penetration of renewable energy technologies, such as hydro, solar and wind, in the electricity
generation mix of the countries increases through the years. Countries such as, South Africa and
Morocco, where coal represented 90% and 54% of their total electricity generation in 2014 [6], at
the future they exploit their renewable energy potential, and these shares shift to approximately 1%
(Figure 9). Also, the electricity generation mix of Niger in 2014 was based on fossil fuels (coal, oil)
but through the years, hydro and solar technologies substitute these sources. The electricity
generation of the Central African power pool at the future is based on hydro, representing
approximately 82% of its total generation, and the rest comes mainly from solar thermal
technologies. The implementation of the Inga III (4.8GW) and Grand Inga (39GW) hydropower
projects in Democratic Rep. of Congo the upcoming years could exploit the enormous hydro
potential of the country.
The Central African power pool constitutes most of the continent’s electricity exports the period
2020-2050, 12TWh in 2020, and 42TWh in 2050. An increase which is mainly due to Democratic
Rep. of Congo hydropower potential since the other countries like Cameroon, and Congo have a
small share of the power pool’s net imports. Democratic Rep. of Congo exports most of its
electricity to Namibia and South Africa through the years. Southern African power pool presents
most of the continent’s net imports, where Eastern and Northern African power pool display a
relative increase of their net imports through the years. The share of each country’s electricity
generation mix in 2050 is presented in Figure 9, and the trades among the African countries
(2020,2030,2040,2050) can be found in Figure 18 - Figure 21 of Appendix D.
Figure 8 Electricity generation mix per power pool in the Reference scenario the period 2020-2050.
-200
0
200
400
600
800
1000
1200
Gen
era
tio
n (T
Wh
)
CAPP
BASE
Coal Diesel HFO Gas Wind
Solar PV Solar Thermal Hydro Geothermal Nuclear
Biomass Dist. PV Dist.Diesel Net Imports
EAPP NAPP SAPP WAPP

25
Figure 9 Share of electricity generation mix by country in the Reference scenario in 2050.
5.2 Enhanced scenario In this scenario, the total installed capacity of the African countries 170GW in 2015, increases to
361GW in 2030, and to 757GW in 2050 ( Figure 10). The potential cross-border electricity
interconnections project among neighboring countries are considered in the model after 2025. The
total installed capacity in Sub-Saharan Africa from 96GW in 2015, increases to 241GW in 2030,
and to 578GW in 2050. The total installed capacities of Central, Eastern, Southern, and Western
African power pool are 28GW, 53GW, 93GW, and 66GW in 2030, with these levels to increase to
72GW, 145GW, 141GW, and 220GW in 2050. The Central and Eastern African power pool
represent the highest increase in their installed capacities throughout the years, fifteen and thirteen
times correspondingly in 2050, compare to 2015 levels. The Western African power pool (220GW),
and Northern African power pool (179GW) in 2050 represent most of the continent’s total
installed capacity. Nigeria, and Egypt installed capacity is 100GW correspondingly in 2050,
representing approximately 26% of continent’s total capacity. The installed capacity of Democratic
Rep. of Congo 18GW in 2030, and 47GW in 2050, constitutes most of Central African power pool
power system.
The installed capacity of fossil fuels in the continent throughout the years is decreasing, 73GW in
2050 compare to 143GW in 2020. Western African power pool’s coal capacity increases from 1GW
in 2020 to 31GW in 2050, and constitutes most of the continent’s share the end year. This increase
is mainly due to the shift of Nigeria’s energy mix from gas 13GW in 2020, and 12GW in 2050, to
coal 0.3GW in 2020, and 25GW in 2050. In the continent, gas investments are decreasing, especially
in Northern African power pool, apart from Eastern African power pool, from 71GW in 2020 to
12GW in 2050, due to the shift of Egypt and Algeria to technologies such as solar, hydro, and
wind.
Hydro and CSP with storage technologies represent approximately 74% of the continent’s total
installed capacity in 2050. The installed capacity of geothermal in Eastern African power pool
-20%
0%
20%
40%
60%
80%
100%
Alg
eria
Ben
in
Bu
rkin
a Fa
so
Cam
ero
on
Ch
ad
DR
C
Djib
ou
ti
Equ
ato
rial
Gu
inea
Eth
iop
ia
Gam
bia
Gu
ine
a
Ken
ya
Lib
eri
a
Mal
awi
Mau
rita
nia
Mo
zam
biq
ue
Nig
er
Rw
and
a
Sier
ra L
eon
e
Sou
th A
fric
a
Swaz
ilan
d
Togo
Uga
nd
a
Zim
bab
we
BASE
Coal Diesel HFO Gas Wind
Solar PV Solar Thermal Hydro Geothermal Nuclear
Biomass Dist. PV Dist.Diesel Net Imports

26
increases from 1GW in 2020 to 18GW in 2050. This share increases mainly due to Ethiopia, and
Kenya, 5GW, and 10GW in 2050 correspondingly, since these countries have started to harness
their geothermal resources at a higher level. The installed capacity of wind potential in the continent
increases from 7GW in 2020 to 23GW in 2050, mainly due to its harnessing by Egypt (15GW),
Algeria(3GW) and South Africa(3GW) in 2050. South Africa and Egypt constitute for continent’s
total nuclear installed capacity.
Figure 10 Total installed capacity per power pool in the Enhanced scenario the period 2020-2050.
The electricity generation in the continent from 734TWh in 2015, increases to 1509TWh in 2030,
and to 3864TWh in 2050 (Figure 11). Most of the continent’s electricity generation in 2050 comes
by Western African power pool (1085GW), and Northern African power pool (852TWh).
However, Eastern, and Western African power pool represent the largest increase on their
generation, approximately eight and ten times correspondingly compare to 2020 values.
The generation from fossil fuels in 2020 constitute approximately 61% of continent’s electricity
production, with this share to drop to 9% in 2050. Only Western African power pool increases its
coal based electricity generation throughout the years. This is mainly due to Nigeria’s coal electricity
generation increase from 2TWh in 2020 to 160TWh in 2050, since Ghana’s coal electricity
generation decreases from 4TWh in 2020 to 2.5TWh in 2050. The coal electricity generation from
Nigeria throughout the model period represents approximately 86% of the power pool’s and 75%
of the continent’s coal electricity generation. Countries such as Egypt, and Morocco which
represent most of the Northern African power pool coal electricity generation in 2020, 14TWh
and 14TWh correspondingly, shift to renewable energy technologies at the future and these values
drop to 7TWh and 2TWh respectively.
0
50
100
150
200
250
Cap
acit
y (G
W)
CAPP
EXP
Coal Diesel HFO GasWind Solar PV Solar Thermal HydroGeothermal Nuclear Biomass Dist. PV
EAPP NAPP SAPP WAPP

27
South Africa starts to harness its renewable potential (hydro, solar, wind) at the future, and the
renewable’s share in country’s electricity generation mix present an enormous increase from 12%
in 2020 to 70% in 2050. In Northern African power pool is highlighted the penetration of wind
technologies in the electricity generation mix of the continent. Countries such as Algeria, and Egypt
produce 9TWh, and 34TWh correspondingly by this energy source in 2050.
Central African power pool represents most of the continent’s exports throughout the years with
an enormous increase from 21TWh in 2020 to 95TWh in 2050. Most of this increase, is based on
the increase of hydro electricity generation from 48TWh in 2020 to 290TWh in 2050, as well as on
CSP with storage 98TWh in 2050. Moreover, Eastern African power pool represents exports until
2040 mainly due to Ethiopia and Sudan. In 2020, Ethiopia constitutes the largest exporter in the
continent 25TWh, by harnessing its hydro and geothermal potential. Most of the country’s
electricity exports go to Sudan 23TWh, where Sudan export it as well to Egypt 17TWh. South
Africa is responsible for most of the continent’s electricity imports 53TWh in 2020 representing
approximately 28% of its total electricity generation. In 2050, Democratic Rep. of Congo represent
most of Africa’s electricity exports 106TWh based on its large hydro potential, with South Africa
24TWh and Namibia 24TWh to import most of this produced electricity.
The expansion of the cross-border electricity interconnections among African countries lead
several countries, such as Central African Rep., Eritrea, Gabon, Equatorial Guinea, Mauritania, and
Malawi to be included in the continent’s electricity trading scheme. These interconnections
contribute as well to the continent’s sustainable development through harnessing each country’s
energy resources. The share of each country’s electricity generation mix in 2050 is presented in
Figure 12, and the trades among the African countries can be found in Figure 22 - Figure 25 of
Appendix D.
Figure 11 Electricity generation mix per power pool in the Enhanced scenario the period 2020-2050.
-200
0
200
400
600
800
1000
1200
20202030204020502020203020402050202020302040205020202030204020502020203020402050
Gen
erat
ion
(TW
h)
CAPP
EXP
Coal Diesel HFO Gas WindSolar PV Solar Thermal Hydro Geothermal NuclearBiomass Dist. PV Dist.Diesel Net Imports
EAPP NAPP SAPP WAPP

28
Figure 12 Share of electricity generation mix by country in the Enhanced scenario in 2050.
5.3 Scenario comparison This thesis compares the two aforementioned scenarios based on the cross-border electricity
interconnection projects among the African countries. The total installed capacity of Africa in both
scenarios was 170GW in 2015. In 2030, the total installed capacity in the Reference scenario is
364GW compared to the Enhanced 361GW. In 2050, these values increase to 785GW, and
757GW correspondinly in each scenario. Between the two scenarios, the Central African power
pool represents the highest increase of its installed capacity through the years, in the Enhanced
more than in the Reference scenario, mainly due to the increase of Democratic Rep. of Congo
hydro installed capacity for more electricity exports. In contrast, the Southern and Northern
African power pool installed capacities represents the highest decrease between the two scenarios
mainly due to South Africa’s and Egypt’s decrease of their installed capacities, and increase of their
net imports.
The total electricity generation in the continent in both scenarios was 734TWh in 2015. In 2030,
the total electricity generation in the Reference scenario is 1498TWh and in the Enhanced one is
1509TWh, where in 2050 is 3855TWh, and 3864TWh correspondingly. The installed capacity of
the continent between the two scenarios decreases throughout the years. Nevertheless, in the
Enhanced scenario the electricity generation increases. This is mainly due to the expansion of the
trading scheme among the countries since further losses are included, and more efficient
technologies are being used.
The Central African power pool constitutes most of Africa’s electricity exports through harnessing
of its hydro and solar potential, with Democratic Rep. of Congo 42TWh in Reference, compared
to 106TWh in Enhanced in 2050, to be the largest electricity exporter in the continent. In the
Enhanced scenario, most of Democratic Rep. of Congo electricity is exported to Namibia
(25TWh), South Africa (24TWh) and Zambia (19TWh) in 2050, where Namibia exports 9TWh as
well to South Africa in 2050 helping the country to cover its energy needs. The effects of the
-40%
-20%
0%
20%
40%
60%
80%
100%EXP
Coal Diesel HFO Gas Wind
Solar PV Solar Thermal Hydro Geothermal Nuclear
Biomass Dist. PV Dist.Diesel Net Imports

29
expanded grid electricity interconnections among the African countries is more obvious in the
Southern African power pool. The net imports in this power pool are approximately doubled
throughout the years, and substistute the electricity generation based mainly on csp with storage
and less on wind technologies. In the Enhanced scenario, the role of Eastern African power pool
in the continent’s trading scheme is highlited, where by harnessing its hydro and geothermal
potential, represent a big electricity exporter in the continent until 2040. Ethiopia even that most
of its electricity is exported to Sudan 45TWh in 2030, Sudan exports as well 32TWh to Egypt that
year. Sudan covers approximately 13% of Egypt’selectricity demand in 2030 through its electricity
exports, and constitutes Egypt’s largest importer until 2040. This shift in the electricity generation
mix of Egypt, which is the largest electricity consumer in the Northern African power pool, affects
the exploitation of the power pool’s wind potential. The differences in the electricity generation
mix in each power pool between the two scenarios are presented in the Figure 13 below.
Figure 13 Comparison of the electricity generation mix per power pool the period 2020-2050: Enhanced – Reference.
The penetration of renewable energy technologies in the power sector of the continent is justified
in both Reference and Enhanced scenarios, where the decrease of fossil fuels shares in the
electricity generation mix in the first scenario from 64% in 2020 drops to 9% in 2050, and in the
second one from 61% in 2020 to 9% in 2050. These shares would have dropped at a higher scale
in 2050, if the Western African power pool, and mainly Nigeria’s fossil fuel electricity generation
which represents approximately 85% of continent’s fossil fuel electricity generation in 2050, had
been substituted by other renewable sources. The enormous increase of Nigeria’s electricity
demand the upcoming decades leads the country to exploit its significant identified recoverable
fossil fuel reserves. Also, even though South Africa’s net imports increase between the two
scenarios, the increase of the fossil fuel share in country’s total electricity generation from
-150
-100
-50
0
50
100
150
20202030204020502020203020402050202020302040205020202030204020502020203020402050
Gen
erat
ion
(TW
h)
CAPP
EXP-BASE
Coal Diesel HFO Gas Wind
Solar PV Solar Thermal Hydro Geothermal Nuclear
Biomass Dist. PV Dist.Diesel Net Imports
EAPP NAPP SAPP WAPP

30
approximately 1% in the Reference to 2% in the Enhanced scenario after 2040, constitute to most
of the carbon dioxide emissions increase in that specific power pool.
Hydro, and csp with storage tehcnologies are in both scenarios the main power generation
technologies of the continent and pillars of its sustainable development, representing around 65%
of its total electricity generation. Eastern African power pool has increased its electricity generation
based on geothermal potential approximately by 20% in the Enhanced scenario throughout the
years. The levels of biomass exploitation as an energy source for electricity generation in Southern
and Western African power pool remain constant in the two scenarios. The carbon dioxide
emissions per power pool as well as the total emissions of the continen between the two scenarios,
are presented in Table 8 and Figure 14 correspondingly. The carbon dioxide emissions are higher
in the Enhanced scenario compared to the Reference one the period 2040-2050, which does not
correspond with the comparison of the two scenarios in the period up to 2040. Additional
sensitivity analysis is needed to fully understand the dynamics of the model.
Table 8 Carbon dioxide emissions per power pool.
𝐂𝐎𝟐 emissions (Mt)
BASE scenario EXP scenario
2020 2030 2040 2050 2020 2030 2040 2050
CAPP 2.20 0.21 0.94 2.53 1.27 0.54 0.57 1.11 EAPP 5.79 6.49 2.32 4.37 4.52 5.90 3.13 4.48 NAPP 142.00 103.97 40.09 14.56 136.95 100.35 32.09 17.53 SAPP 160.99 69.38 22.68 9.22 156.32 65.54 18.68 12.54 WAPP 22.75 43.39 96.87 168.80 23.00 45.05 97.29 199.33
Total 𝐂𝐎𝟐 333.74 223.44 162.91 199.48 322.06 217.38 151.76 234.99
Figure 14 Comparison of the carbon dioxide emissions between the scenarios the period 2020-2050.
0
50
100
150
200
250
300
350
400
2020 2030 2040 2050
Mto
n
Carbon Dioxide Emissions
BASE EXP

31
The fuel costs of the continent throughout the years are increasing as the African countries boost
their electricity demands. In the period 2016-2020, the fuels costs in the Reference scenario are 131
billion USD compare to 125 billion USD in the Enhanced scenario, and the period 2046-2050 are
53 billion USD and 47 billion USD correspondingly (Figure 15). The expansion of the electricity
trading system among the countries, especially with the potential trading projects to be held after
2025, lead the continent to have less fuel costs between the two scenarios, from 5% decrease in
fuel costs in 2016-2020, this share to increase to 12% in 2046-2050. The exploitation of each
country’s renewable potential for electricity production in the Enhanced scenario increased the net
imports of the countries, and reduced the fuel costs. Also, the shift from gas to coal electricity
generation in the Western African power pool between the two scenarios affected the continent’s
fuel costs.
Figure 15 Comparison of the annualized average of the total fuel costs between the scenarios the period 2016-2050.
Africa in order to be fully electrified in 2030 and be able to cover its electricity demands,
investments of approximately 808 billion USD are needed between 2016 and 2030 in the Reference
scenario, compare to 819 billion USD in the Enhanced scenario. The annualized average of the
total investment costs between the two scenarios are represented in Figure 16. The total investment
costs the period 2010-2050, in the Reference scenario are 3332 billion USD and in the Enhanced
3302 billion USD. The electricity investment costs the period 2026-2035, in the Enhanced scenario
are 16billion USD more than in the Reference scenario. This increase is mainly due to the
investments of the cross-border electricity interconnections projects among the countries which
take place after 2025, since the installed capacity of the continent in the Reference scenario
(364GW) is higher than the Enhanced (361GW) in 2030. However, in the long term the total
investment costs in the Reference scenario are higher than in the Enhanced one. In the Enhanced
scenario, the increase of Northern and Southern African power pool net imports and decrease of
their installed capacities by 5% and 9% correspondingly from 2030 onwards, contribute to lower
the investment costs and highlight the role of the trading scheme in this scenario. The period 2016-
2020, the renewable investments constitute approximately 57% of the total investments that
2628
33 3235
42
53
2527
3128
31
37
47
0
10
20
30
40
50
60
2016-2020 2021-2025 2026-2030 2031-2035 2036-2040 2041-2045 2046-2050
Bill
ion
USD
Annualized average fuel costs
BASE EXP

32
period, with this share to increase to an average around 75% in the following years in both
scenarios.
Figure 16 Comparison of the annualized average investments costs between the scenarios the period 2016-2050.
The reduction of continent’s investment and fuel costs between the two scenarios for generating
electricity could significantly improve the overall energy supply in Africa. Strategic investments
towards the expansion of cross-border electricity interconnections projects among the African
countries estimate lower electricity tariffs for the continent. The electricity price of the continent
throughout the years represents a decrease of approximately 5% between the Reference and the
Enhanced scenario (Figure 17). The electricity price of the system is 0.046 USD/kWh in 2015,
increases to 0.06 USD/kWh in the Reference scenario compare to 0.057 USD/kWh in the
Enhanced scenario in 2030, and grows to 0.064 USD/kWh and 0.062 USD/kWh correspondingly
in 2050. The annualized electricity prices in each country vary, mainly due to differences in their
existing power system’s infrastructure and availability of energy resources.
38
52
71
96 91
129
162
38
52
74
10089
125
157
0
20
40
60
80
100
120
140
160
180
2016-2020 2021-2025 2026-2030 2031-2035 2036-2040 2041-2045 2046-2050
Bill
ion
USD
Annualized average investment costs
BASE EXP

33
Figure 17 Comparison of the total annualized electricity price between the scenarios the period 2010-2050.
6. Conclusions This thesis indicates that the associated investment and fuel costs which are needed to fully electrify
Africa until 2030, as well as the continent to cover its electricity demands the period 2010-2050,
are significantly affected by an expanded electricity trading scheme. Between the two scenarios, the
total costs are represented a total average decrease of 3%. Investments of approximately 808billion
USD are needed between 2016-2030 in the Reference scenario, compare to 819billion USD in the
Enhanced scenario. In the upcoming decades, the renewable investments will constitute
approximately an average of 75% of the total investments. The total fuel costs have decreased
approximately by 8% between the two scenarios the period 2010-2050. Less investment and fuel
costs contribute to reduce the electricity price of the continent throughout the years approximately
by 5% between the Reference and the Enhanced scenario.
The total installed capacity in Africa 170GW in 2015, in the Reference scenario increases to 785GW
compare to 757GW in the Enhanced scenario in 2050. The expansion of the continent’s trading
scheme allows the system to harness each country’s energy resource potential and use the most
efficient technologies. This lead to an increase of the total electricity generation from 3855TWh in
the Reference to 3864TWh in the Enhance scenario in 2050. In the Enhanced scenario the role of
the Central African power pool is being highlighted as the largest electricity exporter in the
continent by harnessing its signigicant hydro potential mainly by Democratic Rep. of Congo. The
implementation of a project such as Grand Inga would exploit country’s hydro potential and
become a key player in the continent’s trading scheme.
The penetration of renewable energy technologies in the power sector of the continent is
highlighted in both Reference and Enhanced scenarios the upcoming decades. The shares of fossil
fuels in the electricity generation mix of the continent are decreasing throughout the years. That
share from 65% in 2013 drops to 9% in 2050 [8]. An increase on the renewable capital investments
by approximately 87billion USD the period 2021-2025 compared to 2016-2020, around 25%
increase of the total investment in generation infrastructure, lead to a decrease of approximately
0
0.01
0.02
0.03
0.04
0.05
0.06
0.07
USD
/KW
h
BASE EXP

34
20% of continent’s carbon dioxide emissions. The total carbon dioxide emissions in both scenarios
are decreasing through the years, contribute to a more environmental friendly power generation
infrastructure which the African leaders pursue to achieve at the future. In 2050, the total carbon
dioxide emissions of the continent (199Mt) based on its electricity generation will be less than the
total carbon dioxide emissions of Spain (217Mt with emissions removals from land use, land-use
change and forestry) in 2013 [27]. As a conclusion, the expansion of the cross-border electricity
interconnections projects among the African countries as well as the promotion of renewable
generation will have a key role in forming Africa’s power sector and contribute to its sustainability
the upcoming decades.
7. Limitations-Future work In this section, the limitations, and the areas for future work, which identified in this thesis and will
help to have a broader understanding and a more detailed representation of Africa’s electricity
system, are highlighted. In this research, it has been assumed that the current unelectrified
population of Africa will reach a specific electricity consumption level in 2030 and 2050, without
taking into consideration the relationship between the economic growth and electricity
consumption of each country [28]. Also, the carbon dioxide emissions are higher in the Enhanced
scenario compared to the Reference one the period 2040-2050, which does not correspond with
the comparison of the two scenarios in the period up to 2040. Additional sensitivity analysis is
needed to fully understand the dynamics of the model. The future research can be focused on
improving national specific data (such as electricity demands, resource potentials), analyze explicitly
the security and trade by country, investigate the effects of different transmission costs and losses,
and developing regional integrated greenhouse gas mitigation cost curves and emissions trade.
Also, calculating power supply costs by country and region, understanding the impact of local or
technology constraints (such as hydro generation under a changing climate), and developing deep
analysis of potential intermittency and transmission constraints related to renewable energy
technologies deployment, could lead to better encapsulate the transition of the real world.
Moreover, the temporal resolution in the model was limited and the load curve should have
disaggregated into more levels (seasons, days) to capture better the variation in load and availability
of some of the renewable resources as well as the trades. This limitation was mainly due to the few
available national load curves as well as the increase in the computational time of the model.
Furthermore, a Monte Carlo technique should be used to understand the influence of the
parametric uncertainty and improve the reliability of the model as well as a sensitivity analysis. The
two scenarios assessed in this thesis are a starting point and more scenarios should be examined to
encapsulate the real-world transition. In future research efforts, several scenarios can be conducted
related to GHG constraints, fuel prices, technology cost assumptions, consumption growth rates,
as well as many others, so that uncertainties of energy modeling in future changes could be
minimized [29]. The open source (OSeMOSYS) toolkit which is used in this thesis provide an open
access to the public and therefore future work and formulation of the model beyond the scope of
this thesis can be attempted.

35
8. Bibliography [1] C. Taliotis, A. Shivakumar, E. Ramos, M. Howells, D. Mentis, V. Sridharan, O. Broad, and
L. Mofor, “An indicative analysis of investment opportunities in the African electricity supply sector — Using TEMBA (The Electricity Model Base for Africa),” Energy Sustain. Dev., vol. 31, pp. 50–66, Apr. 2016.
[2] M. Howells, H. Rogner, N. Strachan, C. Heaps, H. Huntington, S. Kypreos, A. Hughes, S. Silveira, J. DeCarolis, M. Bazillian, and A. Roehrl, “OSeMOSYS: The Open Source Energy Modeling System,” Energy Policy, vol. 39, no. 10, pp. 5850–5870, Oct. 2011.
[3] Platts, “World Electric Power Plants Database, December 2015.” . [4] U.S. Energy Information Administration (EIA), “International Energy Statistics,” Mar-2016.
[Online]. Available: https://www.eia.gov/cfapps/ipdbproject/iedindex3.cfm?tid=5&pid=53&aid=1&cid=regions&syid=2010&eyid=2015&unit=TBPD.
[5] International Energy Agency (IEA), Africa Energy Outlook: A focus on energy prospects in Sub-Saharan Africa. OECD/IEA, 2014.
[6] International Energy Agency (IEA) database, Mar-2016. [Online]. Available: http://www.iea.org/countries/non-membercountries/.
[7] United Nations Department of Economic and Social Affairs (DESA), 2013 Electricity Profiles. 2016.
[8] World Bank Group, “World DataBank,” Mar-2015. [Online]. Available: http://databank.worldbank.org/data/home.aspx.
[9] International Energy Agency (IEA), World Energy Outlook 2015. OECD/IEA, 2015. [10] United Nations Framework Convention on Climate Change(UNFCC),Paris, “Paris
Agreement,” 2015. [11] United Nations Framework Convention on Climate Change(UNFCC),Paris, “Climate
Change | Office of the Special Adviser on Africa, OSAA,” Aug-2016. [Online]. Available: http://www.un.org/en/africa/osaa/advocacy/climate.shtml.
[12] African Union, “Common African Position (CAP) on the Post-2015 Development Agenda,” Addis Ababa, 2015.
[13] M. Bhatia and N. Angelou, “Beyond Connections Energy Access Redefined,” Energy Sector Management Assistance Program (ESMAP),World Bank Group, 2015.
[14] National Renewable Energy Laboratory, “Energy Technology Cost and Performance Data for Distributed Generation,” Apr-2016. [Online]. Available: http://www.nrel.gov/analysis/tech_cost_data.html.
[15] International Energy Agency (IEA), OECD Nuclear Energy Agency (NEA), and Organisation for Economic Co-Operation and Development (OECD), Projected Costs of Generating Electricity 2015. OECD, 2015.
[16] A. Miketa and B. Merven, “Southern African Power Pool: Planning and Prospects for Renewable Energy,” IRENA Abu Dhabi, 2013.
[17] U.S. Energy Information Administration (EIA), “Voluntary Reporting of Greenhouse Gases Program,” Apr-2016. [Online]. Available: http://www.eia.gov/survey/form/eia_1605/emission_factors.html.
[18] “Commodity Markets Outlook 2013,” World Bank Group, Jan. 2013. [19] “Commodity Markets Outlook 2014,” World Bank Group, Oct. 2014. [20] “Commodity Markets Outlook 2015,” World Bank Group, Jan. 2015. [21] A. Miketa and B. Merven, “West African Power Pool: Planning and Prospects for
Renewable,” IRENA Abu Dhabi, 2013. [22] S. Hermann, A. Miketa, and N. Fichaux, “Estimating the Renewable Energy Potential in
Africa.,” IRENA-KTH working paper, International Renewable Energy Agency, Abu Dhabi, 2014.
[23] IRENA,Abhu Dabi, “Global Atlas for renewable energy,” Apr-2016. [Online]. Available: http://irena.masdar.ac.ae/#.
[24] J. Glenn and B. Matek, “The Status of Geothermal Power in Emerging Economies,” Geothermal Energy Assosiation, Oct. 2014.

36
[25] K. Ndhlukula, T. Radojičić, and S. Mangwengwende, “Africa Clean Energy Corridor: Analysis of Infrastructure for Renewable Power in Eastern and Southern Africa,” IRENA Abu Dhabi, 2015.
[26] World Energy Council, World Energy Resources 2013 Survey. London: World Energy Council, 2013.
[27] United Nations Framework Convention on Climate Change(UNFCC),Paris Agreement, “National greenhouse gas inventory data for the period 1990–2013,” 2015.
[28] Y. Bayar, H. A. Özel, and others, “Electricity consumption and economic growth in emerging economies,” J. Knowl. Manag. Econ. Inf. Technol., vol. 4, no. 2, pp. 1–18, 2014.
[29] E. Trutnevyte, “Does cost optimization approximate the real-world energy transition?,” Energy, vol. 106, pp. 182–193, Jul. 2016.

37
Appendix A: Detailed Demand Data Table 9 Final electricity demands in each country (TWh).
Region 2010 2015 2020 2030 2040 2050
Africa 540.4 649.8 815.4 1331.0 2143.1 3416.0 Algeria 33.5 47.4 57.8 76.3 97.7 125.1 Angola 4.7 5.6 6.9 13.6 25.6 43.2 Benin 0.8 1.2 1.8 5.2 11.3 21.5 Botswana 3.1 3.6 4.2 5.8 8.3 11.6 Burkina Faso 0.8 1.3 2.1 7.1 16.4 31.4 Burundi 0.2 0.3 0.7 3.3 8.2 15.8 Cameroon 4.9 6.2 8.8 17.8 32.6 56.0 Central African Rep.
0.1 0.2 0.3 1.3 2.9 5.0
Chad 0.2 0.2 0.5 3.5 8.9 16.6 Congo 0.5 1.0 1.4 3.1 5.9 10.3 Congo, Dem. Rep.
6.3 9.1 13.8 37.5 78.6 140.9
Cote d’Ivoire 4.1 6.2 9.2 21.7 44.6 85.9 Djibouti 0.3 0.4 0.6 1.3 2.6 4.7 Egypt 125.2 157.1 191.9 253.3 342.2 415.0 Equatorial Guinea
0.1 0.1 0.2 0.4 0.7 1.3
Eritrea 0.3 0.4 0.6 2.0 4.4 8.1 Ethiopia 3.8 7.7 13.0 41.3 87.9 160.1 Gabon 1.5 2.1 3.0 5.3 8.9 14.7 Gambia 0.2 0.3 0.5 1.2 2.7 5.2 Ghana 7.1 11.4 16.6 35.6 71.1 137.1 Guinea 0.6 0.6 1.1 4.1 9.6 18.0 Guinea-Bissau 0.03 0.03 0.1 0.4 1.0 1.9 Kenya 6.2 9.2 14.6 38.0 76.6 142.1 Lesotho 0.6 0.8 0.9 1.5 2.3 3.4 Liberia 0.2 0.3 0.5 1.8 4.0 7.5 Libya 25.4 24.6 30.1 39.7 50.9 65.1 Malawi 1.7 1.5 2.1 5.9 12.8 22.9 Mali 1.2 1.6 2.5 7.7 17.8 34.8 Mauritania 0.7 0.8 1.0 1.9 3.3 5.1 Morocco 23.9 32.7 39.9 52.7 67.4 86.3 Mozambique 9.8 14.1 21.6 46.8 82.3 139.8 Namibia 3.4 4.1 4.8 6.8 9.7 13.8 Niger 0.7 1.0 1.8 7.6 20.0 41.6 Nigeria 20.7 29.1 45.4 119.2 258.1 510.4 Rwanda 0.3 0.5 0.9 3.5 7.7 13.8 Senegal 2.5 3.7 5.6 13.0 27.2 53.1 Sierra Leone 0.1 0.1 0.2 1.4 3.3 5.8 Somalia 0.3 0.4 0.8 3.4 8.2 15.7 South Africa 202.8 205.6 229.9 281.6 350.5 433.7 Sudan and South Sudan
6.0 10.5 16.6 43.4 87.3 161.4
Swaziland 1.3 1.3 1.6 2.3 3.3 4.6 Tanzania 3.3 6.1 9.9 28.0 57.6 104.2 Togo 0.8 1.2 1.8 4.7 10.1 19.3 Tunisia 13.6 16.2 19.7 26.1 33.3 42.7 Uganda 1.5 2.6 4.6 16.5 37.8 72.1 Zambia 7.8 11.7 13.9 21.4 34.0 52.3

38
Zimbabwe 7.4 8.1 9.7 15.1 23.6 35.2
Table 10 Electrified population 2016-2050.
Region 2016 2030 2050
With electricity
access [million]
Without electricity access
[million]
With electricity access [million]
With electricity access [million]
Africa 479,059,770 707,947,230 1,642,653,000 2,424,287,000 Algeria 39,912,560 463,440 48,274,000 56,461,000 Angola 6,180,660 19,650,340 39,351,000 65,473,000 Benin 3,098,890 8,067,110 15,593,000 22,549,000 Botswana 1,494,240 809,760 2,817,000 3,389,000 Burkina Faso 3,346,020 15,286,980 27,244,000 42,789,000 Burundi 1,194,270 10,358,730 17,357,000 28,668,000 Cameroon 13,399,490 10,525,510 32,947,000 48,362,000 Central African Rep.
130,630 4,868,370 6,490,000 8,782,000
Chad 524,640 13,972,360 21,946,000 35,131,000 Congo 1,702,980 3,038,020 6,790,000 10,732,000 Congo, Dem. Rep.
8,684,620 71,038,380 120,304,000 195,277,000
Cote d’Ivoire 6,198,380 17,055,620 32,143,000 48,797,000 Djibouti 453,590 446,410 1,054,000 1,186,000 Egypt 92,852,790 530,210 117,102,000 151,111,000 Equatorial Guinea
574,650 295,350 1,238,000 1,816,000
Eritrea 1,762,680 3,589,320 7,311,000 10,421,000 Ethiopia 25,403,550 76,449,450 138,297,000 188,455,000 Gabon 1,061,420 701,580 2,321,000 3,164,000 Gambia 759,140 1,295,860 3,105,000 4,981,000 Ghana 20,402,180 7,630,820 36,865,000 50,071,000 Guinea 1,607,160 11,339,840 18,276,000 27,486,000 Guinea-Bissau 406,540 1,481,460 2,541,000 3,564,000 Kenya 9,832,400 37,418,600 65,412,000 95,505,000 Lesotho 595,580 1,564,420 2,486,000 2,987,000 Liberia 69,360 4,545,640 6,414,000 9,436,000 Libya 6,316,550 13,450 7,418,000 8,375,000 Malawi 1,705,380 16,044,620 26,584,000 43,155,000 Mali 5,348,740 12,786,260 27,370,000 45,404,000 Mauritania 1,216,420 2,949,580 5,666,000 8,049,000 Morocco 34,406,360 410,640 39,787,000 43,696,000 Mozambique 11,407,710 17,343,290 41,437,000 65,544,000 Namibia 822,390 1,691,610 3,272,000 4,322,000 Niger 3,112,640 17,602,360 35,966,000 72,238,000 Nigeria 83,619,450 103,367,550 262,599,000 398,508,000 Rwanda 2,787,710 9,095,290 15,785,000 21,187,000 Senegal 8,624,600 6,965,400 22,802,000 36,223,000 Sierra Leone 331,720 6,260,280 8,598,000 11,392,000 Somalia 1,729,310 9,349,690 16,493,000 27,030,000 South Africa 21,286,810 34,232,190 64,900,000 74,089,000 Sudan and South Sudan
9,707,970 44,201,030 74,253,000 106,139,000
Swaziland 357,440 946,560 1,507,000 1,792,000

39
Tanzania 15,268,210 39,886,790 82,927,000 137,136,000 Togo 1,998,780 5,497,220 10,489,000 15,681,000 Tunisia 11,236,000 0 12,527,000 13,271,000 Uganda 6,005,490 34,317,510 61,929,000 101,873,000 Zambia 4,484,650 12,232,350 25,313,000 42,975,000 Zimbabwe 5,637,020 10,329,980 21,353,000 29,615,000
Table 11 Electricity access in Africa (2012) [5].
Region National electrification rate
%
Urban electrification rate%
Rural electrification rate %
Africa 43% 68% 26% Algeria 99% 100% 96% Angola 30% 46% 6% Benin 28% 55% 6% Botswana 66% 75% 51% Burkina Faso 16% 54% 2% Burundi 10% 34% 7% Cameroon 54% 88% 17% Central African Rep.
3% 5% 1%
Chad 4% 16% 0% Congo 35% 52% 5% Congo, Dem. Rep.
9% 24% 1%
Cote d’Ivoire 26% 42% 8% Djibouti 50% 61% 14% Egypt Equatorial Guinea
66% 93% 48%
Eritrea 32% 86% 17% Ethiopia 23% 85% 10% Gabon 60% 64% 34% Gambia 35% 60% 2% Ghana 72% 90% 52% Guinea 12% 28% 3% Guinea-Bissau
20% 37% 6%
Kenya 20% 60% 7% Lesotho 28% 55% 17% Liberia 2% 3% 0% Libya 100% 100% 99% Malawi 9% 33% 5% Mali 27% 55% 12% Mauritania 21% 47% 2% Morocco 99% 100% 97% Mozambique 39% 66% 27% Namibia 30% 50% 17% Niger 14% 62% 4% Nigeria 45% 55% 35% Rwanda 17% 67% 5% Senegal 55% 90% 28% Sierra Leone 5% 11% 1% Somalia 15% 33% 4%

40
South Africa 85% 88% 82% South Sudan 1% 4% 0% Sudan 35% 63% 21% Swaziland 27% 40% 24% Tanzania 24% 71% 7% Togo 27% 35% 21% Tunisia 100% 100% 100% Uganda 15% 55% 7% Zambia 26% 45% 14% Zimbabwe 40% 80% 14%
Table 12 Relative increase of the “others” electricity demand per power pool [5].
Relative increase 2012-2020 2020-2030 2030-2040
North Africa 1.34% 1.32% 1.28%
West Africa 1.75% 2.02% 1.93%
Nigeria 1.84% 2.15% 1.99%
Central Africa 1.63% 1.73% 1.64%
East Africa 1.91% 2.16% 1.86%
Tanzania 1.88% 2.00% 1.65%
Southern Africa 1.26% 1.35% 1.38%
Mozambique 1.88% 2.00% 1.65%
South Africa 1.17% 1.20% 1.22%
Appendix B: Africa energy resource potential Table 13 Africa oil resources and reserves [4].
Country 2011
Recoverable Coal (million short tons)
Crude Oil (Billion Barrels)
Natural Gas (Trillion Cubic Feet)
Anthracite and Bituminus (million short tons)
Lignite
2011 2011 2015 2015
Africa 34833.03896 235.89463 126.50311 604.144
Algeria 65.03637 0 12.2 159.054 Angola NA NA 9.011 9.711 Benin NA NA 0.008 0.04 Botswana 44.09245 0 0 0 Burkina Faso NA NA 0 0 Burundi NA NA 0 0 Cameroon NA NA 0.2 4.77 Central African Rep.
0 3.30693 0 0
Chad NA NA 1.5 0 Congo NA NA 1.6 3.2 Democratic. Rep. of Congo
97.0034 0 0.18 0.035
Cote d’Ivoire NA NA 0.1 1

41
Djibouti NA NA 0 0 Egypt 17.63698 0 4.4 77.2 Equatorial Guinea
NA NA 1.1 1.3
Eritrea NA NA 0 0 Ethiopia NA NA 0.00043 0.88 Gabon NA NA 2 1 Gambia NA NA 0 0 Ghana NA NA 0.66 0.8 Guinea NA NA 0 0 Guinea-Bissau NA NA 0 0 Kenya NA NA 0 0 Lesotho NA NA 0 0 Liberia NA NA 0 0 Libya NA NA 48.363 53.183 Malawi 0 2.20462 0 0 Mali NA NA 0 0 Mauritania NA NA 0.02 1 Morocco 90.38953 44.09245 0.00068 0.051 Mozambique 233.69001 0 0 100 Namibia NA NA 0 2.2 Niger 77.1618 0 0.15 NA Nigeria 23.14854 186.29062 37.07 180.49 Rwanda NA NA 0 2 Senegal NA NA 0 0 Sierra Leone NA NA 0 0 Somalia NA NA 0 0.2 South Africa 33241.30136 0 0.015 NA Sudan and South Sudan
NA NA 5 3
Swaziland 158.73284 0 0 0 Tanzania 220.46227 0 0 0.23 Togo NA NA 0 0 Tunisia NA NA 0.425 2.3 Uganda NA NA 2.5 0.5 Zambia 11.02311 0 0 0 Zimbabwe 553.3603 0 0 0
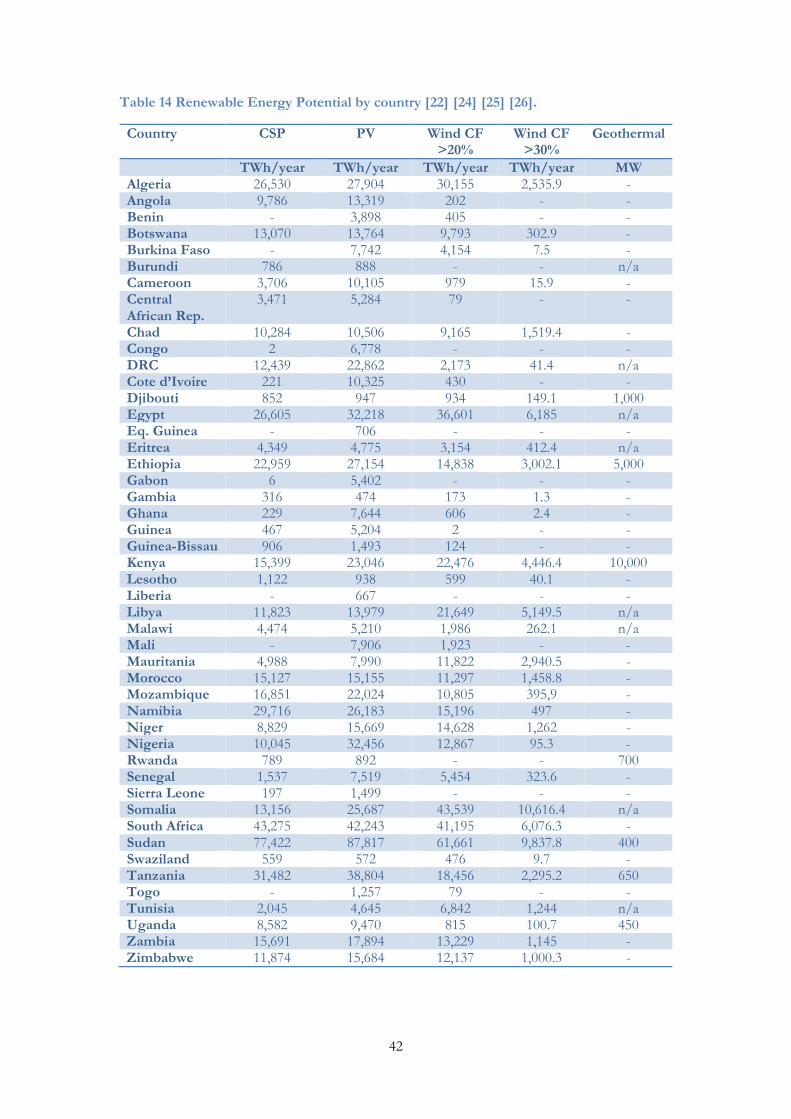
42
Table 14 Renewable Energy Potential by country [22] [24] [25] [26].
Country CSP PV Wind CF >20%
Wind CF >30%
Geothermal
TWh/year TWh/year TWh/year TWh/year MW Algeria 26,530 27,904 30,155 2,535.9 - Angola 9,786 13,319 202 - - Benin - 3,898 405 - - Botswana 13,070 13,764 9,793 302.9 - Burkina Faso - 7,742 4,154 7.5 - Burundi 786 888 - - n/a Cameroon 3,706 10,105 979 15.9 - Central African Rep.
3,471 5,284 79 - -
Chad 10,284 10,506 9,165 1,519.4 - Congo 2 6,778 - - - DRC 12,439 22,862 2,173 41.4 n/a Cote d’Ivoire 221 10,325 430 - - Djibouti 852 947 934 149.1 1,000 Egypt 26,605 32,218 36,601 6,185 n/a Eq. Guinea - 706 - - - Eritrea 4,349 4,775 3,154 412.4 n/a Ethiopia 22,959 27,154 14,838 3,002.1 5,000 Gabon 6 5,402 - - - Gambia 316 474 173 1.3 - Ghana 229 7,644 606 2.4 - Guinea 467 5,204 2 - - Guinea-Bissau 906 1,493 124 - - Kenya 15,399 23,046 22,476 4,446.4 10,000 Lesotho 1,122 938 599 40.1 - Liberia - 667 - - - Libya 11,823 13,979 21,649 5,149.5 n/a Malawi 4,474 5,210 1,986 262.1 n/a Mali - 7,906 1,923 - - Mauritania 4,988 7,990 11,822 2,940.5 - Morocco 15,127 15,155 11,297 1,458.8 - Mozambique 16,851 22,024 10,805 395,9 - Namibia 29,716 26,183 15,196 497 - Niger 8,829 15,669 14,628 1,262 - Nigeria 10,045 32,456 12,867 95.3 - Rwanda 789 892 - - 700 Senegal 1,537 7,519 5,454 323.6 - Sierra Leone 197 1,499 - - - Somalia 13,156 25,687 43,539 10,616.4 n/a South Africa 43,275 42,243 41,195 6,076.3 - Sudan 77,422 87,817 61,661 9,837.8 400 Swaziland 559 572 476 9.7 - Tanzania 31,482 38,804 18,456 2,295.2 650 Togo - 1,257 79 - - Tunisia 2,045 4,645 6,842 1,244 n/a Uganda 8,582 9,470 815 100.7 450 Zambia 15,691 17,894 13,229 1,145 - Zimbabwe 11,874 15,684 12,137 1,000.3 -

43
Table 15 Distance coastline factors of inland countries.
Country Distance coastline factor
Botswana 1.6
Burkina Faso 1.7
Burundi 1.1
Central African Rep. 1.1
Chad 1.1
Ethiopia 1.5
Lesotho 1.3
Malawi 1.5
Mali 1.6
Niger 1.7
Rwanda 1.1
Swaziland 1.1
Uganda 1.1
Zambia 1.8
Zimbabwe 1.4

Appendix C: Detailed Transmission Data Table 16 Local transmission and distribution losses.
Transmission [1] Distribution
Rural [1] Urban [1] Others 2010 2020 2040 2010 2020 2040 2010 2020 2040 Algeria 5.0% 30.0% 20.0% 20.0% 20.0% 15.0% 8.0% 12.0% 9.0% 5.0% Angola 5.0% 30.0% 20.0% 20.0% 20.0% 15.0% 8.0% 15.0% 10.0% 5.0% Benin 5.0% 25.0% 20.0% 20.0% 17.0% 10.0% 8.0% 16.0% 8.0% 6.0% Botswana 5.0% 20.0% 20.0% 20.0% 15.0% 10.0% 8.0% 9.0% 6.0% 6.0% Burkina Faso 5.0% 25.0% 20.0% 20.0% 17.0% 10.0% 8.0% 16.0% 8.0% 7.0% Burundi 1.4% 12.0% 12.0% 12.0% 1.6% 1.6% 1.6% 2.0% 2.0% 2.0% Cameroon 1.4% 12.0% 12.0% 12.0% 1.6% 1.6% 1.6% 1.0% 1.0% 1.0% Central African Rep.
1.4% 12.0% 12.0% 12.0% 1.6% 1.6% 1.6% 2.0% 2.0% 2.0%
Chad 1.4% 12.0% 12.0% 12.0% 1.6% 1.6% 1.6% 2.0% 2.0% 2.0% Congo 1.4% 12.0% 12.0% 12.0% 1.6% 1.6% 1.6% 2.0% 2.0% 2.0% Congo, Dem. Rep.
5.0% 20.0% 20.0% 20.0% 25.0% 10.0% 8.0% 15.0% 5.0% 4.0%
Cote d’Ivoire 5.0% 25.0% 20.0% 20.0% 17.0% 10.0% 8.0% 16.0% 8.0% 6.0% Djibouti 2.3% 12.0% 12.0% 12.0% 3.6% 3.6% 3.6% 3.0% 3.0% 3.0% Egypt 3.6% 12.0% 12.0% 12.0% 1.3% 1.3% 1.3% 5.0% 5.0% 5.0% Equatorial Guinea 1.4% 12.0% 12.0% 12.0% 1.6% 1.6% 1.6% 2.0% 2.0% 2.0% Eritrea 5.0% 30.% 20.% 20.% 20.0% 15.0% 8.0% 16.0% 10.0% 8.0% Ethiopia 3.4% 12.0% 12.0% 12.0% 4.4% 4.4% 4.4% 4.0% 4.0% 4.0% Gabon 1.4% 12.0% 12.0% 12.0% 1.6% 1.6% 1.6% 2.0% 2.0% 2.0% Gambia 5.0% 25.0% 20.0% 20.0% 17.0% 10.0% 8.0% 15.0% 8.0% 7.0% Ghana 5.0% 25.0% 20.0% 20.0% 17.0% 10.0% 8.0% 16.0% 8.0% 6.0% Guinea 5.0% 25.0% 20.0% 20.0% 17.0% 10.0% 8.0% 17.0% 4.0% 4.0% Guinea-Bissau 5.0% 25.0% 20.0% 20.0% 17.0% 10.0% 8.0% 17.0% 5.0% 5.0% Kenya 5.3% 12.0% 12.0% 12.0% 9.6% 9.6% 9.6% 9.0% 8.0% 7.0%

45
Lesotho 5.0% 25.0% 20.0% 20.0% 12.0% 10.0% 8.0% 11.0% 9.0% 7.0% Liberia 5.0% 25.0% 20.0% 20.0% 17.0% 10.0% 8.0% 17.0% 3.0% 3.0% Libya 5.0% 30.0% 20.0% 20.0% 20.0% 15.0% 8.0% 15.0% 11.0% 6.0% Malawi 5.0% 30.0% 20.0% 20.0% 20.0% 10.0% 8.0% 14.0% 8.0% 6.0% Mali 5.0% 25.0% 20.0% 20.0% 17.0% 10.0% 8.0% 16.0% 6.0% 5.0% Mauritania 5.0% 30.0% 20.0% 20.0% 20.0% 15.0% 8.0% 17.0% 11.0% 7.0% Morocco 5.0% 30.0% 20.0% 20.0% 20.0% 15.0% 8.0% 12.0% 9.0% 5.0% Mozambique 5.0% 30.0% 20.0% 20.0% 30.0% 15.0% 8.0% 10.0% 8.0% 5.0% Namibia 5.0% 25.0% 20.0% 20.0% 20.0% 10.0% 8.0% 9.0% 6.0% 5.0% Niger 5.0% 25.0% 20.0% 20.0% 17.0% 10.0% 8.0% 16.0% 7.0% 6.0% Nigeria 5.0% 25.0% 20.0% 20.0% 17.0% 10.0% 8.0% 16.0% 7.0% 6.0% Rwanda 1.8% 12.0% 12.0% 12.0% 0.7% 0.7% 0.7% 1.0% 1.0% 1.0% Senegal 5.0% 25.0% 20.0% 20.0% 17.0% 10.0% 8.0% 16.0% 8.0% 6.0% Sierra Leone 5.0% 25.0% 20.0% 20.0% 17.0% 10.0% 8.0% 7.0% 3.0% 3.0% Somalia 5.0% 30.0% 20.0% 20.0% 20.0% 15.0% 8.0% 16.0% 10.0% 8.0% South Africa 25.0% 20.0% 20.0% 17.0% 10.0% 8.0% 7.0% 5.0% 5.0% Sudan and South Sudan
7.0% 12.0% 12.0% 12.0% 10.5% 10.5% 10.5% 9.0% 9.0% 8.0%
Swaziland 5.0% 20.0% 20.0% 20.0% 15.0% 10.0% 8.0% 11.0% 7.0% 6.0% Tanzania 5.0% 25.0% 20.0% 20.0% 17.0% 10.0% 8.0% 14.0% 8.0% 6.0% Togo 5.0% 25.0% 20.0% 20.0% 17.0% 10.0% 8.0% 16.0% 8.0% 6.0% Tunisia 5.0% 30.0% 20.0% 20.0% 20.0% 15.0% 8.0% 11.0% 8.0% 5.0% Uganda 2.3% 12.0% 12.0% 12.0% 3.5% 3.5% 3.5% 3.0% 3.0% 3.0% Zambia 5.0% 30.0% 20.0% 20.0% 25.0% 15.0% 8.0% 12.0% 7.0% 4.0% Zimbabwe 5.0% 20.0% 20.0% 20.0% 17.0% 12.0% 8.0% 10.0% 7.0% 5.0%

Table 17 International trade links [1].
From To Capacity (MW) Investment cost ($/kW)
Status First year Included in Reference Trade scenario
Comments
Algeria Libya 1000 895 Assumed 2025 No
Algeria Morocco 1440 671 Assumed 2025 No
Algeria Mali 500 2014 Assumed 2025 No
Algeria Mauritania 500 2462 Assumed 2025 No
Algeria Niger 300 1865 Assumed 2025 No
Angola Botswana 1500 224 Planned 2020 No
Angola DRC 2100 137 Planned 2016 Partly-600MW
Angola Namibia 1900 240 Planned 2016 No
Angola Zambia 1000 1641 Assumed 2025 No
Benin Ghana 655 180 Assumed 2025 No
Benin Togo 300 142 Assumed 2025 No
Botswana Namibia 2100 75 Planned 2018 Partly-1500MW
Botswana South Africa 1300 205 Existing Partly-800MW
Botswana Zambia 600 1044 Assumed 2025 No

47
Botswana Zimbabwe 1250 75 Existing Partly-650MW
Burkina Faso Benin 300 746 Assumed 2025 No
Burkina Faso Mali 306 574 Planned 2015 No
Burkina Faso Togo 300 746 Assumed 2025 No
Burundi Rwanda 430 105 Existing Partly-100MW Burundi Tanzania 100 171 Assumed 2025 No Cameroon Gabon 500 522 Assumed 2025 No Cameroon Nigeria 1000 709 Assumed 2025 No Cameroon Chad 125 926 Planned 2020 Yes Central African Rep.
Congo 100 746 Assumed 2025 No
Central African Rep.
Cameroon 100 746 Assumed 2025 No
Central African Rep.
Sudan 100 2089 Assumed 2025 No
Central African Rep.
Chad 100 821 Assumed 2025 No
Cote d’ Ivoire Burkina Faso 327 Existing Yes Cote d’ Ivoire Ghana 982 137 Existing Yes Cote d’ Ivoire Guinea 500 895 Assumed 2025 No Cote d’ Ivoire Liberia 338 177 Committed 2014 Yes Congo Cameroon 300 1268 Assumed 2025 No Congo Gabon 600 725 Planned 2020 No DRC Burundi 475 107 Existing Yes DRC Central African
Rep. 100 203 Assumed 2025 No
DRC Congo 60 Existing Yes DRC Namibia 3000 203 Planned 2020 Partly-1500MW DRC Rwanda 527 71 Existing Yes

48
DRC Sudan 1000 2238 Assumed 2025 No DRC Tanzania 1000 603 Assumed 2025 No DRC Uganda 500 603 Assumed 2025 No DRC South Africa 3000 1405 Planned 2023 Partly-2500MW DRC Zambia 2310 603 Existing Partly-810MW Djibouti Eritrea 100 597 Assumed 2025 No Djibouti Somalia 100 1194 Assumed 2025 No Egypt Sudan 6000 517 Planned 2016 No Equatorial Guinea
Cameroon 600 244 Planned 2020 No
Ethiopia Djibouti 180 Existing Yes Ethiopia Eritrea 200 746 Assumed 2025 No Ethiopia Kenya 2000 423 Planned 2018 No Ethiopia Sudan 6600 190 Existing Partly-200MW Ethiopia Somalia 400 1044 Assumed 2025 No Gabon Equatorial
Guinea 600 494 Planned 2020 No
Gambia Guinea-Bissau 329 275 Planned 2022 Yes Ghana Burkina Faso 332 202 Planned 2017 No Ghana Benin 963 137 Existing Yes Ghana Togo 963 137 Existing Yes Guinea Mali 321 366 Committed 2020 Yes Guinea-Bissau Guinea 310 585 Planned 2022 Yes Guinea-Bissau Senegal 100 373 Assumed 2025 No Kenya Sudan 1000 1492 Assumed 2025 No Kenya Somalia 200 865 Assumed 2025 No Lesotho South Africa 360 50 Existing Partly-230MW Liberia Guinea 338 177 Planned 2020 Yes Liberia Sierra Leone 303 816 Planned 2017 Yes Libya Egypt 740 1514 Assumed 2025 No Libya Niger 300 2238 Assumed 2025 No Libya Sudan 1000 1492 Assumed 2025 No Libya Chad 200 1492 Assumed 2025 No

49
Libya Tunisia 1000 536 Assumed 2025 No Malawi Mozambique 900 117 Planned 2015 No Malawi Tanzania 500 895 Assumed 2025 No Malawi Zambia 200 416 Planned 2018 No Mali Cote d’Ivoire 320 428 Planned 2016 Yes Mali Mauritania 500 1044 Assumed 2025 No Mali Niger 500 1015 Assumed 2025 No Mali Senegal 429 288 Existing Yes Mauritania Senegal 250 380 Assumed 2025 No Morocco Algeria 1680 597 Assumed 2025 No Mozambique Swaziland 1450 Existing Yes Mozambique Tanzania 1000 1194 Assumed 2025 No Mozambique South Africa 3850 123 Existing Yes Mozambique Zambia 600 1268 Assumed 2025 No Mozambique Zimbabwe 1200 98 Existing Partly-700MW Namibia South Africa 4050 227 Existing Partly-2550MW Namibia Zambia 3800 75 Existing Partly-2900MW Namibia Zimbabwe 2100 220 Planned 2018 Partly-1500MW Niger Burkina Faso 638 393 Planned 2014 No Niger Benin 650 256 Planned 2014 No Niger Chad 200 1268 Assumed 2025 No Niger Togo 650 256 Planned 2014 Yes Nigeria Benin 1333 255 Existing Partly-686MW Nigeria Niger 832 219 Existing Yes Nigeria Chad 200 813 Assumed 2025 No Nigeria Togo 1333 255 Existing Partly-686MW Rwanda Tanzania 200 118 Assumed 2025 No Senegal Gambia 341 106 Planned 2017 Yes Senegal Guinea 286 1012 Planned 2017 Yes Sierra Leone Guinea 334 243 Planned 2014 Yes South Africa Swaziland 1900 16 Existing Partly-1450MW South Africa Zimbabwe 2750 220 Existing Partly-1250MW Sudan Eritrea 200 671 Assumed 2025 No

50
Sudan Chad 200 1768 Assumed 2025 No Sudan Uganda 500 1858 Assumed 2025 No Spain Morocco 1400 Existing Yes Tanzania Kenya 1920 77 Planned 2016 Partly-1520MW Tanzania Uganda 759 43 Existing Yes Tanzania Zambia 400 204 Planned 2017 No Togo Ghana 655 180 Planned 2020 Yes Tunisia Algeria 1680 597 Assumed 2025 No Uganda Kenya 858 161 Existing Partly-418MW Uganda Kenya 500 161 Assumed 2025 No Uganda Rwanda 250 Existing Yes Zambia Zimbabwe 2800 440 Existing Partly-2200MW

Appendix D: Electricity trades among the countries
Figure 18 Electricity trades among the African countries in the Reference scenario 2020 (GWh).

52
Figure 19 Electricity trades among the African countries in the Reference scenario 2030 (GWh).

53
Figure 20 Electricity trades among the African countries in the Reference scenario 2040 (GWh).

54
Figure 21 Electricity trades among the African countries in the Reference scenario 2050 (GWh).

55
Figure 22 Electricity trades among the African countries in the Enhanced scenario 2020 (GWh).

56
Figure 23 Electricity trades among the African countries in the Enhanced scenario 2030 (GWh).

57
Figure 24 Electricity trades among the African countries in the Enhanced scenario 2040 (GWh).
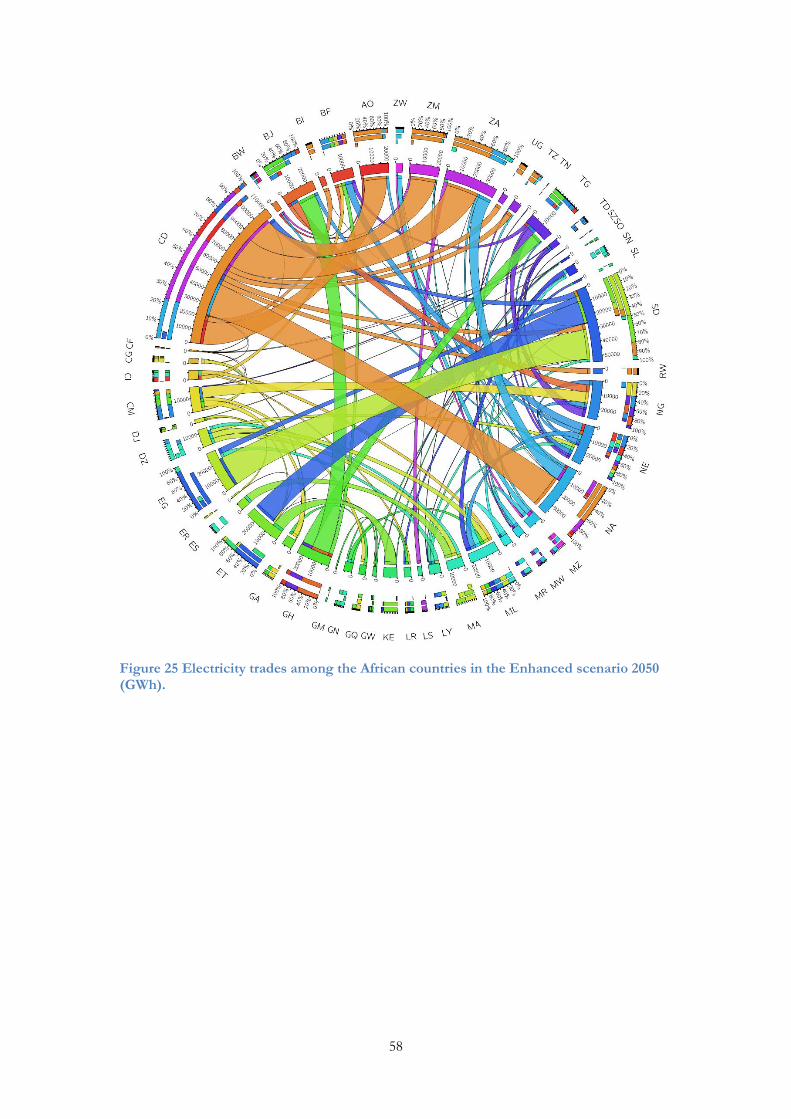
58
Figure 25 Electricity trades among the African countries in the Enhanced scenario 2050 (GWh).