electrochemical biosensors for plant volatile …
TRANSCRIPT
ELECTROCHEMICAL BIOSENSORS FOR PLANT VOLATILE ORGANIC COMPOUNDS
By
YI FANG
(Under the Direction of Ramaraja P. Ramasamy)
ABSTRACT
The increasing measure of agricultural losses due to plant diseases caused by pathogens and
pests is becoming a significant problem worldwide in the recent years. In order to produce
enough food to support the population growth, early detection of plant diseases is imperative to
reduce the crop spoiled during cultivation and harvest. Although many detection methods are
available for diseases, they require either expensive instruments, cumbersome procedures or
highly skilled operators. These disadvantages limit the applicability of these methods for on-field
detection and confine them to the laboratory. Therefore, an early detection method that is
different from the traditional practices is highly desired in the agricultural industry. Volatile
organic compounds (VOCs) are largely produced by plants when infected by pathogens and / or
infested by pests, and can be used as chemical markers for early detection of the onset of plant
diseases. Therefore, electrochemical biosensor devices, which are capable of detecting plant
diseases through measurement of VOCs, are proposed and established with the motives validated

by the interviews conducted during a NSF funded I-Corps project. A biosensor for detection of
4-ethylguaiacol, a common VOC, was established using metal oxide (TiO2 and SnO2)
nanoparticles. Another biosensor based on enzyme tyrosinase-immobilized on an electrode was
successfully developed for detection of 4-ethylphenol. Methyl salicylate (MeSA), a VOC that
plays important role in plant defense system, could be detected using alcohol oxidase /
peroxidase-immobilized bi-enzyme biosensor after chemical hydrolysis. Another version of
biosensor for MeSA detection was developed using a different bi-enzyme system involving
salicylate hydroxylase and tyrosinase, which improved sensitivity (30.61 µA·cm-2
·µM-1
) and
detection limit (13 nM). In addition, a tri-enzymatic biosensor consisting of an esterase in the
electrolyte and salicylate hydroxylase / tyrosinase-immobilized screen-printed electrode were
also developed for MeSA detection, yielding a sensitivity of 3.10 µA·cm-2
·µM-1
and limit of
detection of 750 nM. The platform for automatic VOC collection and temperature measurement
for MeSA detection were developed using Arduino Uno and MOSFET. Finally, the enzymatic
kinetic mechanisms were studied by initial rate measurements, and a mathematical model was
developed to simulate the performance of the biosensor under various operating conditions.
INDEX WORDS: Plant disease, Volatile organic compounds, 4-ethylguaiacol, 4-ethylphenol,
Methyl salicylate, biosensor, enzyme, Arduino Uno, MOSFET, mathematical modeling, enzyme
kinetics
ELECTROCHEMICAL BIOSENSORS FOR PLANT VOLATILE ORGANIC COMPOUNDS
by
YI FANG
B.E., Tianjin University of Science and Technology, China, 2010
M.S., Purdue University, U.S., 2012
A Dissertation Submitted to the Graduate Faculty of the University of Georgia in Partial
Fulfillment of the Requirements for the Degree
DOCTOR OF PHILOSOPHY
ATHENS, GEORGIA
2017

© 2017
Yi Fang
All Rights Reserved

ELECTROCHEMICAL BIOSENSORS FOR PLANT VOLATILE ORGANIC COMPOUNDS
by
YI FANG
Major Professor: Ramaraja P. Ramasamy
Committee: Mark A. Eiteman
Glen C. Rains
William B. Whitman
Electronic Version Approved:
Suzanne Barbour
Dean of the Graduate School
The University of Georgia
August 2017

iv
DEDICATION
To my mother, father and grandparents

v
ACKNOWLEDGEMENTS
I would like to express my sincere gratitude to my Ph.D. supervisor Dr. Ramaraja P. Ramasamy.
Since the day I joined in the lab, he has been supporting me throughout my entire career as a
Ph.D. student in College of Engineering at University of Georgia. In addition to his support in
my research work, he also guided me in multiple aspects such as manuscript writings, patent
applications, and other communication skills. Next, I would like to appreciate the help from my
Ph.D. committee members: Dr. William B. Whitman, Dr. Mark A. Eiteman and Dr. Glen C.
Rains. It was their experiences, suggestions and sincere help that made my research going
smoothly. I would like to express my appreciation to Dr. Sarah Lee and Dr. Hannah Bullock for
their help in the experiments during my Ph.D work. I would like to thank Dr. Yogeswaran
Umasankar, then post-doc in the laboratory, for helping and guiding the design and conduction
of the research work when I lacked of research experiences. Also I would like to thank Stefan R.
Schulze for his help during I-Corps program. I am very thankful to my laboratory members
whom I spent for more than four years – Narendran Sekar and Yan Zhou for not only offering
great help during the research work, but also spending the happiest moment with me. Last but
not the least; I would like to appreciate all my other friends for helping and supporting me
through the course of my Ph.D. work in the United States and China.
vi
TABLE OF CONTENTS
ACKNOWLEDGEMENTS…………………………………………………………………….…v
CHAPTER
1. INTRODUCTION……………………………………………………………………...…1
1.1 Background and significance………………………………………………………….3
1.2 New methods for disease detection………………………………………………...…8
1.3 Specific objectives and organization of chapters…………………………………....15
2. DETECTION OF 4-ETHYLGUAIACOL USING METAL OXIDE NANOPARTICLE –
MODIFIED ELECTRODES…………………………………………………………….18
2.1 Introduction of 4-ethylguaiacol and its detection………………………………....…20
2.2 Materials and methods…………………………………………………………….…22
2.3 Results and discussion…………………………………………………………….…24
2.4 Conclusion…………………………………………………………………………...35
2.5 Supplementary data………………………………………………………………….35
3. DETECTION OF 4-ETHYLPHENOL USING TYROSINASE – BASED
BIOSENSOR……………………………………………….……………………………38
3.1 Introduction of 4-ethylphenol and its detection….…………………………………..40
3.2 Materials and methods….…………………………………………………………....42
3.3 Results and discussion……..………………………………………………………...45
3.4 Conclusion…………………………………………………………………………...57

vii
4. DETECTION OF METHYL SALICYLATE USING ALCOHOL OXIDASE /
PEROXIDASE – BASED BIOSENSOR……………………………………….……….58
4.1 Introduction of methyl salicylate and its detection…………….…………….………60
4.2 Materials and methods……………………………….…………………….………...63
4.3 Results and discussion…………………………………………………..…………...66
4.4 Conclusion…………………………………………………………….……………..83
5. DETECTION OF METHYL SALICYLATE USING SALICYLATE HYDROXYLASE /
TYROSINASE – BASED BIOSENSOR………………………………………………..84
5.1 Introduction…………………………………………………………………………..86
5.2 Materials and methods…………………………………………………………….....89
5.3 Results and discussion..……………………………………………………...………96
5.4 Conclusion………………………………………………………………………….117
5.5 Supplementary data……………………………………………………...…………118
6. DIRECT DETECTION OF METHYL SALICYLATE USING ESTERASE /
SALICYLATE HYDROXYLASE / TYROSINASE – BASED TRIENZYMATIC
BIOSENSOR…………………………………………………………………………...120
6.1 Introduction………………………………………………………………...………121
6.2 Materials and methods……………………………………………………………...125
6.3 Results and discussion……………………………………………………………...127
6.4 Conclusion………………………………………………………………………….139
6.5 Supplementary data………………………………………………...………………140
7. COMPUTATIONAL MODELING OF BIENZYMATIC BIOSENSOR……………..143
7.1 Introduction………………………………………………………………………...144
viii
7.2 Materials and methods………………………………………………………….......145
7.3 Results and discussion……………………………………………………………...148
7.4 Conclusion………………………………………………………………………….159
8. COMMERCIALIZATION POTENTIAL FOR A PORTABLE PLANT DISEASE
DETECTION SYSTEM………………………………………………………………..160
8.1 Overview and motivation………………………………………………………......160
8.2 Discover the customer segments and value propositions………………………......164
8.3 Market opportunity………………………………………………………………....168
8.4 Conclusion………………………………………………………………………….171
9. CONCLUSIONS AND FUTURE DIRECTION………………………………………172
REFERENCES………………………………………………………………………………....177
APPENDICES………………………………………………………………………………….186

1
CHAPTER 1
INTRODUCTION
This chapter contains text modified from the following publication:
Yi Fang and Ramaraja P. Ramasamy. 2015. Biosensors 5: 537-561.
Reprinted here with permission of the publisher.

2
Abstract
Food losses due to crop infestations and infections from pathogens such as fungi, bacteria and
viruses are persistent issues in agriculture for centuries across the globe. In order to reduce the
disease-induced damages in crops during cultivation, harvest and postharvest process, as well as
improve the productivity and ensure agricultural sustainability, advanced disease detection and
prevention in crops are imperative. This chapter reviews the direct and indirect methods for plant
disease identification currently used in agriculture. Laboratory-based techniques such as
polymerase chain reaction (PCR), immunofluorescence (IF), fluorescence in-situ hybridization
(FISH), enzyme-linked immunosorbent assay (ELISA), flow cytometry (FCM) and gas
chromatography-mass spectroscopy (GC-MS) are some of the direct detection methods. Indirect
methods include thermography, fluorescence imaging and hyperspectral techniques. The chapter
also provides a comprehensive overview of biosensors based on highly selective bio-recognition
elements such as enzyme, antibody, DNA/RNA and bacteriophage as new tool for the early
identification of crop diseases. Finally, the application of volatile organic compounds released by
diseased plants for plant disease detection is introduced.
Keywords: Food loss, Plant pathogen, Volatile organic compound, Sensor, Enzyme, Antibody,
DNA/RNA, Bacteriophage.

3
1.1 BACKGROUND AND SIGNIFICANCE
1.1.1 Pathogen / Pest-induced food losses
In 1974, World Food Conference defined the word “food security” as the “availability at all
times of adequate world basic food supplies to sustain a steady expansion of food consumption
and to offset fluctuations in production and prices” (Clay 2002). Since then, food security,
determined by worldwide food supply and consumption has aroused public awareness. The
previous reports have indicated that over one billion people were suffering from various type of
malnutrition due to lack of food supply while another two billion people do not have access to
sufficient nutrients or vitamins that are required for daily life (Conway 2012). The enormous
population growth in recent decades has put another challenge for food security. The demand for
food will likely continue to increase for another 40 years and additional 70 % production will be
required to satisfy the need by 2050 (Godfray, Beddington et al. 2010). In addition to population
growth, food scarcity is also attributed to increased farming for biofuel generation and decreased
agricultural land for food production due to industrial land use (Vidal 2007, Mason 2013).
Although food insufficiency could be attributed to the aforementioned reasons, food damages
caused by pest infestations play an important role in agricultural losses throughout the world. In
addition to the pest infestation, agricultural losses are also attributed to infection from plant
pathogens such as bacteria, viruses and fungi. Just in the United States, pest infestation and plant
pathogen cause more than 40 billion dollars of economic losses and 20 % to 40 % of production
losses annually (Pimentel, Zuniga et al. 2005, Roberts, Schimmelpfennig et al. 2006, Savary,
Ficke et al. 2012). For example, 12 % of maize, barley, rice and soybean, 24 % of groundnuts
and potatoes, 50 % to 80 % of wheat and cotton are estimated to be lost to pest infestation and
pathogen-induced diseases (Oerke 2006). Apart from the agricultural losses during cultivation,

4
post-cultivation losses due to plant diseases and sub-standard quality during storage and
transportation are estimated to be 30 % to 40 % (Pimentel, Zuniga et al. 2005, Roberts,
Schimmelpfennig et al. 2006). Furthermore, pest infestation and pathogen-induced plant diseases
not only do damage to the pre- and post-cultivated crops directly, but they also drive the
excessive and unnecessary application of chemicals such as pesticides, bactericide and fungicide
which increase grower costs and eventually crop prices. Therefore, an early detection method of
pest infestation and pathogen-induced diseases is imperative to minimize the damages during
crop production and transportation as well as to minimize the spraying of chemicals to enable
precision agriculture, decrease the cost of food production and ensure agricultural sustainability.
1.1.2 Current detection methods
Pest infestation and plant disease early detection can be realized though both direct and indirect
methods based on the detection target. In direct detection, molecular, biological and serological
methods are applied to detect and identify the pathogens such as bacteria, viruses and fungi. On
the other hand, indirect methods to detect and identify the diseases through the various
parameters and symptoms such as the change of morphology, temperature, transpiration rate and
the volatile organic compounds (VOCs) released by plants under infestation and infection have
also been investigated widely by various researchers.
1.1.2.1 Direct detection methods
Deoxyribonucleic acid (DNA) is a molecule that carries the genetic instructions used in the
growth, development, functioning and reproduction of all organisms including bacteria, viruses
and fungi. Therefore, detection and identification of the sequence of pathogenic DNA provide
the firsthand information to predict the plant diseases. A Nobel Prize was awarded to Kary Banks

5
Mullis in 1993 for the development of amplification of nucleic acid sequences using the
technique of polymerase chain reaction (PCR). Based on the high fidelity of DNA hybridization
and replication, PCR was initially used to identify the bacteria and viruses causing disease (Cai,
Caswell et al. 2014). With the development of the technique, advanced PCR-based methods such
as reversed-transcription PCR (RT-PCR), multiplex PCR, real-time PCR, have also been
introduced for plant pathogen identification due to their high sensitivity and specificity, on-site
application and rapid diagnosis (Osiowy 1998, Pallisgaard, Hokland et al. 1998, James 1999,
Williams, Blake et al. 1999, Nassuth, Pollari et al. 2000, Schaad and Frederick 2002, Lievens,
Brouwer et al. 2006).
In addition to PCR, another molecular detection technique called fluorescence in-situ
hybridization (FISH) has been used to detect bacteria, viruses and fungi (Kempf, Trebesius et al.
2000, Hijri 2009, Kliot, Kontsedalov et al. 2014). Single-cell sensitivity can be achieved due to
the high affinity and specificity of the DNA probe. Other microscopy-based technique such as
immunofluorescence (IF) is reported for the analyses of microbial samples to detect infections in
plant tissue. For this technique, specific antibody conjugated with a fluorescent dye is used to
visualize the distribution of target molecule throughout the sample (Dewey and Marshall 1996).
Serological technique such as flow cytometry (FCM), a laser-based optical method used for cell
counting and sorting, biomarker detection and protein engineering, is also reported for
characterization of bacterial DNA and fungal spores (Chitarra and Van Den Bulk 2003).
In addition to aforementioned DNA-based techniques, an antigen-antibody conjugation-based
technique such as enzyme-linked immunosorbent assay (ELISA) is also widely used for
identification of diseases based on color change in the assay (Clark and Adams 1977). In this
method, antibodies conjugated with enzyme are made to bind specifically with the target

6
epitopes of the antigens from the bacteria, viruses and fungi of interest. The color change upon
the conjugation of antibody and targeted antigen is used to visualize the presence of the pathogen.
The performance of ELISA has improved significantly with the development of specific
monoclonal antibodies, for which J.F. Kohler and C. Milstein were awarded the Nobel Prize in
1984 (Clark and Adams 1977, Gorris, Alarcon et al. 1994, López, Bertolini et al. 2003).
1.1.2.2 Indirect detection methods
Apart from the direct methods discussed above, indirect methods, based on measuring plant
stress symptoms that profile plant diseases, have also been developed for identification of biotic
stresses (e.g. pathogenic diseases) during crop cultivation. In this regard, new types of sensors
providing detailed information based on different electromagnetic spectra have been developed
for prediction of plant health condition. Thermography, fluorescence imaging and hyperspectral
imaging are the most favorable techniques for crop health prediction.
Previous reports have demonstrated that loss of water regulated by stomata is affected by
infection, which renders the temperature change of plant leaves. Thermography allows imaging
the surface temperature of plant leaves and canopies, which can be scaled up for disease
monitoring without external temperature influences (Lindenthal, Steiner et al. 2005, Oerke,
Steiner et al. 2006, Chaerle, Leinonen et al. 2007, Stoll, Schultz et al. 2008, Oerke, Fröhling et al.
2011).
In addition to transpiration rate, the photosynthetic apparatus and photosynthetic electron
transport chain will also be affected upon plant pathogen infection. Therefore, fluorescence
imaging, based on measuring chlorophyll fluorescence of the leaves as a function of the incident
light and the change in the fluorescence parameters, can also be used for plant disease prediction.

7
This technique has already been approved for precise detection of leaf rust and powdery mildew
infections in wheat through the analyses of temporal and spatial variations of chlorophyll
fluorescence (Lindenthal 2005).
Recently, hyperspectral imaging has been used for plant phenotyping and crop disease
identification in large-scale agriculture. Hyperspectral imaging over a wide range of spectrum
from 350 to 2500 nm can be used for obtaining useful information about plant health parameters.
Furthermore, more accurate and detailed information about plant health across a large crop field
can be realized through the hyperspectral imaging camera which facilitates the 3D data
collection (Mahlein, Oerke et al. 2012). By measuring the reflectance changes resulting from the
changes in biophysical and biochemical characteristics due to infestation and infection,
hyperspectral techniques have been widely used for plant disease detection such as Magnaporthe
grisea infection of rice, Phytophthora infestans infection of tomato and Venturia inaequalis
infection of apple trees (Kobayashi, Kanda et al. 2001, Zhang, Qin et al. 2003, Delalieux, Van
Aardt et al. 2007).
1.1.3 Limitations of current detection methods
Although various detection techniques have been developed which have many advantages –
robust, rapid and detailed information, etc., the application for on-site detection of plant diseases
is still limited to laboratory-based methods due to a variety of reasons. First, many direct
detection methods, such as fluorescence in-situ hybridization, immunofluorescence, flow
cytometry, as well as indirect methods such as thermography, fluorescence imaging and
hyperspectral imaging, require expensive instruments which greatly increase the cost of disease
detection. Second, the requirement of cumbersome instruments implies that no on-site
measurements can be carried out; therefore, real-time information of plant health situation cannot
8
be provided by those techniques. Additionally, other techniques, such as PCR and ELISA, which
do not need cumbersome instruments, still require professional technicians to carry out the
detection which further confines their application to laboratory use. Therefore, a portable, robust
and user-friendly device to predict plant disease is needed.
1.2 NEW METHODS FOR DISEASE DETECTION
1.2.1 Volatile organic compounds as disease signature
Different from the direct and indirect methods of plant disease detection mentioned above, a
non-optical based indirect method by profiling the volatile signatures released by the plant is also
reported. Volatile organic compounds (VOCs), as phytohormones for communication and self-
defense, will be released by the plant upon infestation and infection. VOCs released by diseased
plants are different according to different pathogens as well as from those under healthy
condition. Thus, they are highly indicative of biotic stress types experienced by the plants (Fang,
Umasankar et al. 2014). For example, an infection by Phytophthora cactorum, the fungus that
causes crown rot in strawberries, results in the production of two specific VOCs – 4-
ethylguaiacol and 4-ethylphenol, in addition to other VOCs that also released under healthy
conditions. Other VOCs such as cis-3-hexenol, cis-hexenyl acetate and hexyl acetate are reported
to be released by green leaf plants under pathogenic and mechanical damages (i.e. herbivore
infestation and lawn mowing) (Umasankar, Rains et al. 2012). Analyses of these VOCs provide
the firsthand of information for identifying the nature of the infestations and infections (Fang,
Umasankar et al. 2014). Compared to other indirect methods like thermography and fluorescence
imaging, the type of released VOCs provides detailed information of the type and severity of
infections and infestations.

9
1.2.2 Current analysis of volatile organic compounds
Gas chromatography (GC), a common type of chromatography used in analytical chemistry for
separating and analyzing compounds that can be vaporized without decomposition, has been
used for analyzing the presence of the specific VOC that is indicative of a particular disease
(Jansen, Hofstee et al. 2009). To enhance the separation and analysis performance of VOCs, the
technique mass-spectrometry (MS) is often combined with GC, forming GC-MS to identify
unknown compounds in volatile samples produced by diseased plants (Isidorov, Zenkevich et al.
1985, Kesselmeier and Staudt 1999, Perera, Marriott et al. 2002). Compared to other optical-
based detection methods, such as thermography and fluorescence, GC-MS provides more
detailed and specific information which allows the prediction of certain plant diseases. It also
allows the detection of diseases in different evolving stages based on the quantity of specific
VOCs that plants produce. However, the application of GC-MS is still confined to the laboratory
study due to its non-portability. Even though some portable devices have been developed
recently, the requirement of sophisticated operator and analyzer still does not facilitate the use of
GC-MS by farmers.
1.2.3 Portable electrochemical biosensors
Unlike the bulky instruments mentioned above, sensors are portable, non-destructive and can
provide real-time measurements. Among different types of sensors, the application of sensors has
been developed as one of the most potential techniques due to its advantages such as portability,
low-cost, high accuracy, rapid detection, real time applicability, robustness, ultra-low limits of
detection and high specificity when biosensors are fabricated with electrodes modified by bio-
recognition elements (Bakker 2004). Biosensors, with modification of bio-recognition elements

10
such as DNA and antibody, have been developed for plant disease detection based on the
reaction of the bio-recognition elements and the target analyte (Sadanandom and Napier 2010).
1.2.3.1 Antibody-based biosensor
Antibodies are versatile and suitable for diverse immunosensing fabrications. Antibody-based
biosensors allow rapid and selective detection of a range of pathogens; therefore, they have been
used for food safety monitoring. With the similar mechanism, antibody-based biosensors hold
great potential for agricultural plant pathogen detection. The biosensors enable the pathogen
detection in air, water, soil and seeds with different platforms for greenhouse, on-field and
postharvest storage processes and distributors of crops and fruits (Skottrup, Nicolaisen et al.
2008). The principle of establishing an antibody-based biosensor lies in the coupling of specific
antibody with a transducer, which converts the binding event (the binding of the antibody
immobilized on the electrode with the antigen of interest) to a signal that can be interpreted.
Most antibody-based electrochemical biosensors can be categorized into four types:
amperometric, potentiometric, impedimetric and conductometric, which use electric current,
potential change, impedance change and conductance change, respectively, as the interpreting
signal (Leonard, Hearty et al. 2003, Palchetti and Mascini 2008, Byrne, Stack et al. 2009). Other
electrochemical techniques, such as quartz crystal microbalance (QCM) based on the
measurement of the change in frequency of a quartz crystal resonator upon specific binding of
antibody with antigen, are also reported. In addition to electrochemical techniques, other non-
electrochemical transducers for affinity biosensing have been developed and reported such as
surface plasmon resonance (SPR) and cantilever. During the past decades, many studies have
been published demonstrating the capability of antibody-based biosensors for plant pathogen
detection such as Cowpea mosaic virus, Tobacco mosaic virus, Lettuce mosaic virus, Puccinia

11
striiformis, Phytophthora infestans, orchid viruses and Aspergillus niger (Eun, Huang et al. 2002,
Dickert, Hayden et al. 2004, Torrance, Ziegler et al. 2006, Candresse, Lot et al. 2007, Nugaeva,
Gfeller et al. 2007, Skottrup, Frøkiær et al. 2007, Skottrup, Hearty et al. 2007).
1.2.3.2 DNA/RNA-based biosensor
Being different from antibody-based biosensors where hydrophobic, ionic and hydrogen bonds
play a role in the stabilization of antibody-antigen complex, DNA binding is dependent upon the
formation of stable hydrogen bonds between DNA (or RNA) chains. Therefore, a new type of
affinity biosensor uses nucleic acid fragments as bio-recognition elements for pathogen detection
has been developed. The detection of a specific DNA sequence is of significance in a variety of
applications such as clinical genetic disease detection, environmental protection, horticulture,
and foodborne disease analysis. Due to the possibility of detection at molecular level and the
fidelity of DNA hybridization, DNA-based biosensor enables early detection of diseases before
any visual symptoms appear. The application of specific DNA-based biosensors has been widely
used for detection of bacteria, viruses and fungi. Similar to antibody-based biosensor, DNA-
based biosensor can also be classified by the type of the transducers. The common type of
electrochemical biosensor is amperometric, which measures the current change with constant
applied potential upon the DNA hybridization. Other types of biosensors, such as piezoelectric
DNA biosensors that detect the analyte using a quartz crystal that oscillates at a specific
frequency at an applied oscillating potential, have been reported for detection of two orchids
viruses – Cymbidium mosaic virus (CymMV) and Odontoglossum ringspot virus (ORSV) (Eun,
Huang et al. 2002). Transducers other than electrochemical are also reported, such as molecular
beacons (MB) and surface plasmon resonance (SPR) for the detection of orchid viruses and
Fusarium culmorum (Eun and Wong 2000, Zezza, Pascale et al. 2006).
12
1.2.3.3 Applications of enzymatic biosensor
In addition to the affinity biosensor based on the specific combination of DNA and antibody /
antigen, enzymes as bio-recognition element can provide highly selective detection of the target
analyte due to the high specificity of enzyme-substrate combination. Therefore, the detection of
analyte can be realized through the bio-electrocatalytic reaction between the target and electrode,
which results in an amperometric signal (i.e. current) that can be used for quantitative detection
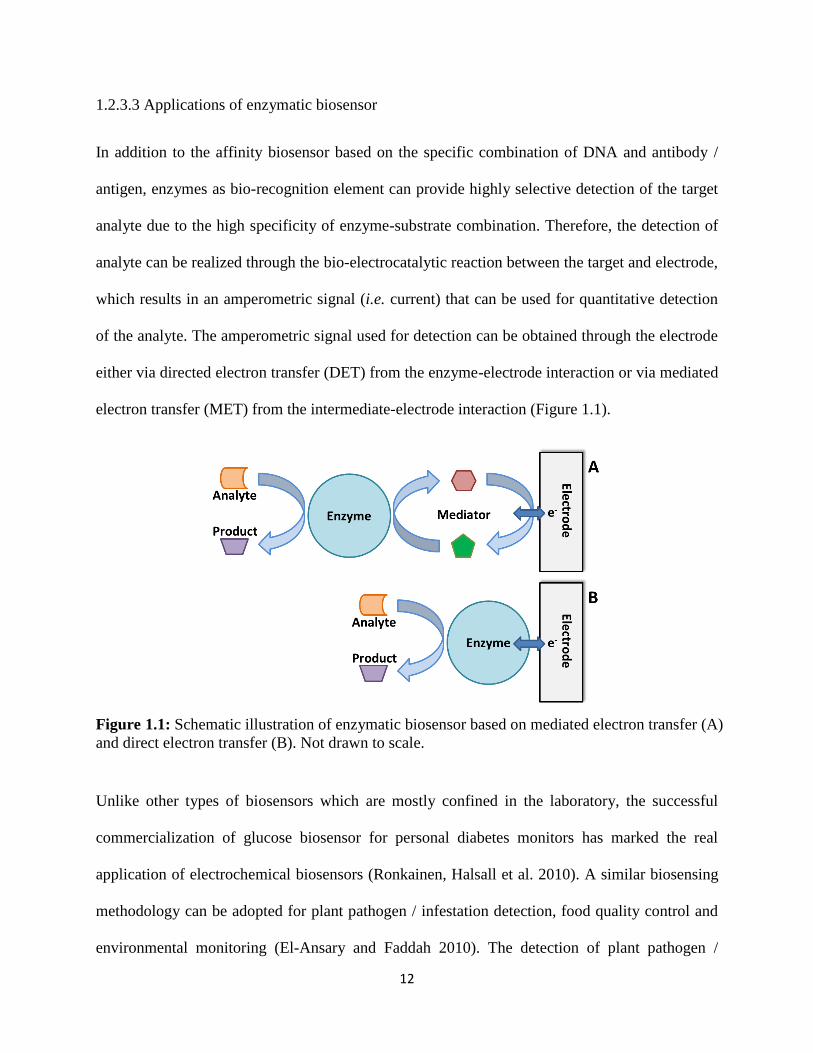
of the analyte. The amperometric signal used for detection can be obtained through the electrode
either via directed electron transfer (DET) from the enzyme-electrode interaction or via mediated
electron transfer (MET) from the intermediate-electrode interaction (Figure 1.1).
Figure 1.1: Schematic illustration of enzymatic biosensor based on mediated electron transfer (A)
and direct electron transfer (B). Not drawn to scale.
Unlike other types of biosensors which are mostly confined in the laboratory, the successful
commercialization of glucose biosensor for personal diabetes monitors has marked the real
application of electrochemical biosensors (Ronkainen, Halsall et al. 2010). A similar biosensing
methodology can be adopted for plant pathogen / infestation detection, food quality control and
environmental monitoring (El-Ansary and Faddah 2010). The detection of plant pathogen /

13
infestation can be realized through the detection of VOCs, as long as the plant VOCs could be
solubilized in a compatible liquid electrolyte. Previous research has demonstrated several
phytohormones released by the plants upon infections / infestations can react by a redox enzyme
to generate electrochemically active compounds (Sponsel and Hedden 2010). In addition to the
detection based on analyte-enzyme reaction, enzyme activity can also be deactivated by common
phytohormones such as auxin, cytokinins and gibberellins which indicate plant health. For
example, GA-2-oxidase can be inhibited by gibberellin which provides the potential for
gibberellin biosensor based on the inhibition of the enzyme (Thomas, Phillips et al. 1999).
1.2.3.4 Bacteriophage-based biosensor
Composed of protein capsid that encapsulates DNA or RNA genome, bacteriophage infects
bacteria, replicates within the bacterial cell and finally lyses the bacterial host to propagate.
Being able to lyse the bacterial, bacteriophages have been widely studied and used in phage
therapy to cure bacteria-caused infections and other diseases (Mc Grath and van Sinderen 2007).
In addition to phage therapy, bacteriophage also emerges as an alternative bio-recognition
element for biosensor development due to its highly specific binding with bacteria (Neufeld,
Schwartz-Mittelmann et al. 2003, Brigati and Petrenko 2005, Kretzer, Lehmann et al. 2007). The
detection of bacteria can be carried out through the impedance change of charge transfer
reactions at the interface of electrode upon specific binding of bacteriophage and target bacteria.
Recently, a bacteriophage-based diagnostic assay for detecting and identifying Pseudomonas
cannabina pv. Alisalensis from infected plants was reported by D. A. Schofield (Schofield, Bull
et al. 2013).

14
1.2.4 Application of nanomaterials to biosensor platforms
Recent breakthroughs in nanotechnology enable the preparation of various nanoparticles and
other nanostructures with few technical hurdles. Displaying fascinating physical, chemical,
electronic, and optical properties, nanoparticles synthesized with different types of materials
have been used for electronics and sensing applications (Shipway, Katz et al. 2000). The
popularity of nanomaterials for sensor development can be explained by the platform-property
provided by the nanomaterials. Nanomaterials such as carbon nanotubes (CNTs) are easy to
modify with the cross-linkers, providing the assembly of bio-recognition element (e.g. antibody
and enzyme introduced above), and eventually increase the specificity of detection. In addition,
limit of detection can be improved due to the high surface area and high conductivity resulting
from the nanomaterials used for sensor fabrication. The nanomaterials used for biosensor
construction include metal oxide nanoparticles, quantum dots, carbon nanomaterials such as
CNTs, carbon nanorods, graphene, as well as polymeric nanomaterials. With the development of
biosensors based on antibody, DNA and enzyme as recognition molecules as introduced above,
the nanomaterials could be used as support materials for recognition molecules and in some
cases transducers for the development of biosensors for detecting plant diseases. An example of
this is the detection of Xanthomonas axonopodis, which causes bacterial spot disease. Other
materials such as gold nanoparticles have been widely used due to their high electroactivity and
electronic conductivity for electron transfer (Cao, Ye et al. 2011, Mandler and Kraus-Ophir
2011).

15
1.3 SPECIFIC OBJECTIVES AND ORGANIZATION OF CHAPTERS
Chapter 2: DETECTION OF 4-ETHYLGUAIACOL USING METAL OXIDE
NANOPARTICLE – MODIFIED ELECTRODES
a) Exploration of the application of metal oxide nanoparticles such as titanium oxide (TiO2)
and tin oxide (SnO2) nanoparticles in sensor development for VOC detections.
b) Characterization of metal oxide-based sensor for 4-ethylguaiacol detection including
sensitivity and limit of detection.
c) Characterization of the specificity of the sensor through interference study.
d) Evaluation of the applicability of the sensor through simulated sample study.
Chapter 3: DETECTION OF 4-ETHYLPHENOL USING TYROSINASE – BASED
BIOSENSOR
a) Exploration of the enzyme reaction mechanism of tyrosinase, and its electrochemical
mechanism for biosensor application.
b) Exploration of the application of enzyme cross-linking technique for biosensor
fabrication.
c) Characterization of tyrosinase-based biosensor for 4-ethylphenol detection including
sensitivity and limit of detection.
d) Characterization of the specificity of the biosensor through interference study.
e) Evaluation of the applicability of the biosensor through simulated sample study.
Chapter 4: DETECTION OF METHYL SALICYLATE USING ALCOHOL OXIDASE /
PEROXIDASE – BASED BIOSENSOR.

16
a) Exploration of the enzyme reaction mechanism of alcohol oxidase and horseradish
peroxidase, and their electrochemical mechanism for biosensor application.
b) Characterization of alcohol oxidase / peroxidase-based biosensor for methyl salicylate
detection including sensitivity and limit of detection.
c) Characterization of the specificity of the biosensor through interference study.
d) Evaluation of the applicability of the biosensor through simulated sample study.
Chapter 5: DETECTION OF METHYL SALICYLATE USING SALICYLATE
HYDROXYLASE / TYROSINASE – BASED BIOSENSOR
a) Expression of salicylate hydroxylase from Escherichia coli transformed with
recombinant plasmid DNA.
b) Purification of salicylate hydroxylase from the crude extract, and derivation of
purification table for enzymatic parameters.
c) Exploration of the enzyme reaction mechanism of salicylate hydroxylase and tyrosinase,
and their electrochemical mechanism for biosensor application
d) Characterization of salicylate hydroxylase / tyrosinase-based biosensor for methyl
salicylate detection including sensitivity and limit of detection.
e) Characterization of the specificity of the biosensor through interference study.
f) Evaluation of the applicability of the biosensor through simulated sample study.
Chapter 6: DIRECT DETECTION OF METHYL SALICYLATE USING ESTERASE /
SALICYLATE HYDROXYLASE / TYROSINASE – BASED TRIENZYMATIC BIOSENSOR
a) Exploration the application of esterase for methyl salicylate hydrolysis.

17
b) Application of esterase for tri-enzymatic biosensor for direct methyl salicylate detection,
and the determination of sensitivity and limit of detection.
c) Design the computer-controlled platform for pre-concentration system using MOSFET,
and the computer hardware Arduino Uno.
Chapter 7: MATHEMATICAL MODELING OF BI-ENZYMATIC BIOSENSOR
a) Prediction of the mechanisms of the enzyme kinetics.
b) Derivation and calculation of the enzymatic kinetics parameters for mathematical
modeling.
c) Development of a principle mathematical model to describe the performance of the bi-
enzymatic biosensor by incorporating the influence of enzyme activity, concentration of
salicylate and other reactants.
d) Discussion the governing equations, initial conditions and boundary conditions for the
modelling.
Chapter 8: COMMERCIALIZATION POTENTIAL FOR A PORTABLE PLANT DISEASE
DETECTION SYSTEM.
a) Development of value proposition and customer segregation on business model canvas.
b) Preparation of both phone and in-person interviews to validate the value proposition and
customer segregation proposed on business model canvas.
c) Pivots from the results of the interview to re-establish the desired value proposition and
potential customer segregation.
d) Investigation of the potential market of early detection devices for plant disease detection.
Chapter 9: CONCLUSIONS AND FUTURE DIRECTIONS.

18
CHAPTER 2
DETECTION OF 4-ETHYLGUAIACOL USING METAL OXIDE NANOPARTICLE –
MODIFIED ELECTRODES
This chapter contains text modified from the following publication:
Yi Fang, Yogeswaran Umasankar, and Ramaraja P. Ramasamy. 2014. Analyst 139: 3804-3810.
Reprinted here with permission of the publisher.
19
Abstract
Nanoparticles of titanium oxide (TiO2) or tin oxide (SnO2) on screen-printed (SP) carbon
electrodes have been developed in this chapter for evaluating their potential in the
electrochemical sensing of volatiles in fruits and plants. These metal oxide (MOx) nanoparticle-
modified electrodes possess high sensitivity and low limit of detection for the detection of 4-
ethylguaiacol, a fingerprint compound present in the volatile signature of fruits and plants
infected with a pathogenic fungus Phytophthora cactorum. The electroanalytical data obtained
using cyclic voltammetry and differential pulse voltammetry showed that both TiO2 and SnO2
modified electrodes exhibited high sensitivity (0.17 – 0.19 μA·cm-2·μM
-1) and low limit of
detection (35 – 62 nM) for 4-ethylguaiacol detection. The amperometric detection was highly
repeatable with RSD values ranging from 2.48 to 4.85 %. The interference studies show that
other common plant volatiles do not interfere in the amperometric detection signal of 4-
ethylguaiacol. The results demonstrate that metal oxides are a reasonable alternation to
expensive electrode materials such as gold or platinum for amperometric sensor applications.
Keywords: Titanium oxide, Tin oxide, Volatile organic compound, 4-Ethylguaiacol, Sensor,
Phytophthora cactorum.
20
2.1 INTRODUCTION OF 4-ETHYLGUAIACOL AND ITS DETECTION
2.1.1 4-Ethylguaiacol in plant diseases
Leather rot, commonly known as crown rot, has been identified as a plant disease caused by
pathogenic fungus Phytophthora cactorum and results in the infection of a variety of cucurbit
crops as well as other crops such as strawberry in the southeastern United States (Jeleń,
Krawczyk et al. 2005). It is estimated that up to half of 1.3 million tons of strawberries produced
in the United States are affected by this disease which either results in total-loss or down grade
of the products every year (Ellis and Grove 1983). Due to the high cost of strawberry cultivation,
there is an imperative and ever-increasing demand for advanced crown rot detection prior to the
appearance of the symptoms. As many plants, volatile organic compounds (VOCs) with
distinctive unpleasant odor will be produced upon infection of Phytophthora cactorum. One such
symbolic VOC is 4-ethylguaiacol (Jeleń, Krawczyk et al. 2005). Therefore, detection of 4-
ehtylguaiacol released by strawberries infected by Phytophthora cactorum will be a useful
indication for confirmation of leather rot disease. However, in order to fulfill the capability of
early stage detection, the detection method should possess ultra-low limit of detection for 4-
ethylguaiacol.
2.1.2 Current methods for 4-ethylguaiacol detection
A variety of methods have been established for 4-ethylguaiacol detection including gas
chromatography-mass spectrometry (GC-MS), head space solid phase microextraction (SPME)
and high performance liquid chromatography (HPLC)-diode array detection (DAD)-fluorescence
(Pollnitz, Pardon et al. 2000, Martorell, Martı et al. 2002, Caboni, Sarais et al. 2007, Rayne and
Eggers 2007). Although a variety of methods have been established for 4-ethylguaiacol detection

21
as other VOCs introduced in Chapter 1, all those methods require detailed operation conducted
by professional technicians, thus cannot be widely used for real-time analysis.
2.1.3 Application of metal oxide nanoparticles for sensor fabrication
Electrochemical sensing of VOCs released from diseased plants is a popular technique for non-
destructive, real-time detection of target plant diseases as introduced in Chapter 1. Amperometric
electrochemical sensor possesses high sensitivity enables rapid detection, thus, are suitable for
the field application. Although application of bio-recognition improved sensitivity, non-
enzymatic biosensors that used for plant VOC detection have also been reported before (Zhuang,
Su et al. 2008, Suneesh, Chandhini et al. 2013). Gold nanoparticle-based electrochemical
sensors for VOCs such as methyl salicylate (MeSA), cis-3-hexen-1-ol, hexyl acetate and cis-3-
hexen-1-yl acetate were reported by Ramasamy’s group (Umasankar, Rains et al. 2012,
Umasankar and Ramasamy 2013). While gold nanoparticles and carbon nanotubes / rods have
been widely used for sensor application, metal oxide (MOx)-based sensors have not been fully
understood for electrochemical transducers. The rationale for adopting metal oxide nanoparticles
in this project is due to the advantages over other commonly used materials. The advantages are:
(1) metal oxide nanoparticles are catalysts for dehydrogenation of alcoholic compounds (e.g.
aliphatic alcohols, acetic acid, etc.), which could enhance the VOC reaction on the electrode, and
further increase the current generated (de Lacy Costello, Ewen et al. 1999), (2) compared to
other noble metal materials like gold and silver, metal oxides such as titanium oxide, tin oxide,
zinc oxide are inexpensive, which decreased the cost of fabrication (Diebold 2003), (3) some
metal oxides have a large band gap (greater than 3.3 eV) which make them suitable for
amperometric signal generation in aqueous solution, and (4) compared to other materials, the
preparation method for metal oxide nanoparticles in required size and shape is easier. In this

22
project, two commonly used metal oxides namely titanium (IV) oxide (TiO2) and tin (IV) oxide
(SnO2) are proposed as electrochemical detection elements for amperometric sensing. The
conceptual illustration of the detection mechanism can be found in Figure 2.1. Screen-printed
carbon (SP) electrodes are modified with nanoparticles of TiO2 and SnO2 and used for
electrochemical detection of 4-ethylguaiacol in simulated fruit volatile samples with three-
electrode system.
Figure 2.1: Schematic illustration of 4-ethylguaiacol detection on metal oxide modified screen-
printed carbon electrode with three-electrode system. Not drawn to scale.
2.2 MATERIALS AND METHODS
2.2.1 Materials
Tin (IV) oxide (<100 nm) and titanium (IV) oxide (~21 nm) nanoparticles purchased from
Sigma-Aldrich were used to prepare nanoparticle suspensions. 4-ethylguaiacol from Frinton
Laboratory, Inc (New Jersey, USA) was used as received. 4-ethylphenol from Sigma-Aldrich
and other compounds such as cis-3-hexenol, hexyl acetate, cis-hexen-1-yl acetate, 3-octanone
and 1-octen-3-ol purchased from TCI America (Portland, Oregon, USA) were used as received
in interference study and simulated sample studies. All chemicals in the project are of analytical
grade. All the aqueous solutions in this project were prepared in 18.2 MΩ nanopure de-ionized

23
(DI) water. The electrolyte of 0.1 M potassium hydrogen phthalate (KHP), pH 4, was prepared to
carry out all electrochemical experiments. All solutions were deoxygenated by purging with
nitrogen gas for 15 min prior to each set of experiments.
2.2.2 Apparatus
Cyclic voltammetry (CV) and differential pulse voltammetry (DPV) were performed using a CHI
model 920 c potentiostat. A conventional three-electrode cell system was applied for all the
electrochemical measurements. Three-electrode system consists of a working electrode, a screen-
printed (SP) carbon electrode modified with TiO2 or SnO2 nanoparticles, a 3 M Ag/AgCl
reference electrode and a platinum wire as a counter electrode. All experiments were carried out
at temperature of 25 ± 2 ºC.
2.2.3 Electrode preparation
TiO2 and SnO2 nanoparticle suspensions were prepared by ultrasonication of 1 mg of the
respective nanoparticles in 1 mL DI water. The TiO2 and SnO2 nanoparticle-based SP electrodes
were prepared by drop-casting 18 μL (three steps of 6 μL addition) of the nanoparticle
suspension on the SP electrode, followed by drying up at 70 ºC oven. CV and DPV were
performed in a 10 mL electrochemical cell containing N2-saturated 0.1 M KHP solution for
TiO2- or SnO2-modified SP electrodes. Voltammetry was scanned from -0.1 V to 0.7 V for both
CV and DPV. The scan rate for CV is 20 mV/s while the increment, amplitude, pulse width and
pulse period are 4 mV, 50 mV, 0.2 s and 0.5 s for DPV.

24
2.3 RESULTS AND DISCUSSION
2.3.1 Electrochemical response of 4-ethylguaiacol on MOx-modified SP electrodes
CV was applied to characterize the MOx-modified electrodes in the presence and absence of 4-
ethylguaiacol. Although acidic conditions favor 4-ethylguaiacol oxidation, a pH 4 of electrolyte
was used in this project to avoid reaction between metal oxides and electrolyte such as sulfuric
acid and hydrochloric acid. The cyclic voltammograms of SnO2- and TiO2-modified electrodes
in the presence and absence of 4-ethylguaiacol are shown in Figure 2.2, and the results
demonstrate the better sensitivity of 4-ethylguaicol detection by MOx-modified SP electrode
compared with an unmodified SP electrode (Figure 2.S1A).
Figure 2.2: CV responses of SnO2-SP (a and a’) and TiO2-SP (b and b’) with (a and b) and
without (a’ and b’) the presence of 0.17 mM 4-ethylguaiacol.
In the absence of 4-ethylguaiacol, TiO2-SP displayed no redox activity while a significant broad
redox peak in the potential window from -0.1 V to 0.4 V was observed, which can be explained
25
by the adsorption and desorption of phthalate ions, a better known behavior for SnO2 in KHP
electrolyte (Armstrong, Lin et al. 1976, Lian, Zhu et al. 2011). In the presence of 4-ethylguaiacol,
both TiO2- and SnO2-SP exhibited irreversible redox peaks – oxidation peak at 0. 62 V and
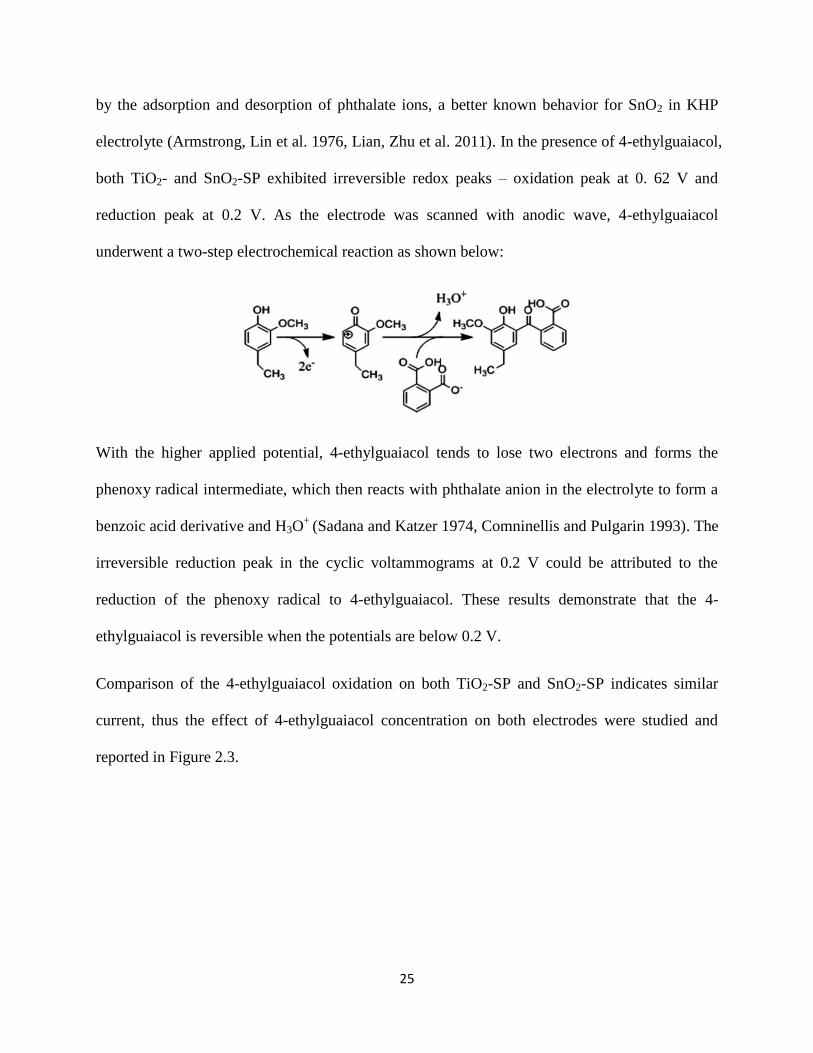
reduction peak at 0.2 V. As the electrode was scanned with anodic wave, 4-ethylguaiacol
underwent a two-step electrochemical reaction as shown below:
With the higher applied potential, 4-ethylguaiacol tends to lose two electrons and forms the
phenoxy radical intermediate, which then reacts with phthalate anion in the electrolyte to form a
benzoic acid derivative and H3O+
(Sadana and Katzer 1974, Comninellis and Pulgarin 1993). The
irreversible reduction peak in the cyclic voltammograms at 0.2 V could be attributed to the
reduction of the phenoxy radical to 4-ethylguaiacol. These results demonstrate that the 4-
ethylguaiacol is reversible when the potentials are below 0.2 V.
Comparison of the 4-ethylguaiacol oxidation on both TiO2-SP and SnO2-SP indicates similar
current, thus the effect of 4-ethylguaiacol concentration on both electrodes were studied and
reported in Figure 2.3.

26
Figure 2.3: Concentration effect of 4-ethylguaiacol at SnO2-SP (A) and TiO2-SP (B) electrodes
using CV.
The stepwise increase of 4-ethylguaiacol concentration from 0.2 μM to 2.6 mM in the
electrochemical cell was achieved by addition of 4-ethylguaiacol from series of standard
concentrations. The lowest concentration was determined based on the noticeable increase in
oxidation current upon the incremental addition of 4-ethylguaiacol, and the upper limit was
chosen based on the rate of decrease in the oxidation current during subsequent additions of 4-
ethylguaiacol. The CV results in Figure 2.3 demonstrate that an increase in the concentration of
4-ethylguaiacol leads to an increase of the oxidation peak current (Ipa) of 4-ethylguaiacol
oxidation on both SnO2- and TiO2-SPs. The initial response to 4-ethylguaiacol additions
displayed a potential shift in oxidation peak potential (Epa) from 0.62 V to 0.7 V, which could be
explained by the increase in acidity of the electrolyte due to more H3O+ produced during the
increase of 4-ethylguaiacol. The electrochemical parameters of the sensors for 4-ethylguaiacol
detection such as sensitivity, limit of detection (LOD), and limit of quantification (LOQ) at the
signal to noise ratio (S/N ratio) of 3 from both SnO2- and TiO2-SP, can be calculated from the
following equations.

27
Sensitivity =slope of calibration curve (A ∙ M−1)
Area of electrode (cm2)
LOD = 3.3 ×Standard deviation of peak current in absence of analyte (A)
Slope of calibration curve (A ∙ M−1)
LOQ = 10 ×Standard deviation of peak current in absence of analyte (A)
Slope of calibration curve (A ∙ M−1)
Comparison of the sensitivity values obtained from both SnO2-SP and TiO2-SP obtained from
cyclic voltammetry are given in Table 2.1 below.
Table 2.1: Comparison of sensitivity, linear range, LOD and LOQ for 4-ethylguaiacol detection
at SnO2-SP and TiO2-SP electrode using CV and differential pulse voltammetry (DPV).
Electrode Technique Epc (V) Linear range (R2)
Sensitivity
(μA·cm-2
·μM-1
)
LOD
(nM)
LOQ
(nM)
SnO2-SP CV 0.62 0.6 μM – 0.17 mM
(0.9954)
0.23 82 249
DPV 0.54 0.2 μM – 0.1 mM
(0.9932)
0.17 62 188
TiO2-SP CV 0.62 0.6 μM – 0.17 mM
(0.9972)
0.20 126 382
DPV 0.54 0.2 μM – 0.1 mM
(0.9934)
0.19 35 106
The results reveal that SnO2-SP electrode displayed higher sensitivity for 4-ethylguaiacol
detection and lower LOD and LOQ compared to TiO2-SP electrode. Although CV provides a
firsthand electrochemical information of the system, the sensor application requires either
constant potential amperometry (CPA) or pulse-based electrochemical technique to eliminate the
noise caused by the capacitance and resistance in order to improve the detection accuracy (i.e.
LOD and LOQ) (Settle 1997). Therefore, differential pulse voltammetry (DPV) was used in a

28
similar matter to CV for 4-ethylguaicol detection between -0.1 V to 0.7 V. Compared to
unmodified SP electrode, both SnO2-SP and TiO2-SP electrodes displayed a higher sensitivity for
4-ethylguaiacol detection (Figure 2.S1B). Similar to CV, DPV also displayed peaks in the
absence of 4-ethylguaiacol on SnO2-SP due to the absorption and desorption of phthalate ions. In
the presence of 4-ethylguaiacol, the oxidation peak was observed at 0.54 V (Epa) with similar
Ipa’s for both electrodes as shown in Figure 2.4.
Figure 2.4: DPV responses of SnO2-SP (a and a’) and TiO2-SP (b and b’) with (a and b) and
without (a’ and b’) the presence of 0.17 mM 4-ethylguaiacol.
The characteristic oxidation peak of 4-ethylguaiacol for both SnO2- and TiO2-SP was similar to
those of CV with a ~ 0.05 V negative shift due to the applied amplitude (0.05 V) during DPV
measurements. The peak currents (Ipa) for 4-ethylguaiacol oxidation were also observed
increased with the concentration increased from 0, 0.2 μM to 1.5 mM on both electrodes as
shown in Figure 2.5.

29
Figure 2.5: Concentration effect of 4-ethylguaiacol on SnO2-SP (A) and TiO2-SP (B) electrodes
using DPV.
The insets of Figure 2.5 show a linear dependency of Ipa on concentration. The empirical
electrochemical parameters derived from DPV data are also given in Table 2.1 for comparison
with CV. Due to the elimination of capacitance as well as the adsorption-desorption effect in
DPV (Figure 2.S2), the results demonstrated lower sensitivity, but better detection and
quantification limits for both SnO2- and TiO2-SP electrodes for DPV compared to their
corresponding CV values. Among the two modified SP electrodes, TiO2-SP exhibited better
sensitivity and limit of detection compared to those of SnO2-SP according to DPV, although the
difference is not significant (Table 2.1). DPV data are better representative of the sensing
characteristic of the electrodes due to the elimination of parasitic currents from the true oxidation
response of 4-ethylguaiacol. The results demonstrate that both SnO2- and TiO2-SP electrodes
could be used to fabricate an electrochemical sensor for 4-ethylguaiacol detection at
concentrations that relevant to typical infected fruit volatiles.

30
2.3.2 Repeatability and stability studies
Eight SnO2- and TiO2-SP electrodes were prepared using the same protocol introduced and
tested for 4-ethylguaiacol oxidation using DPV for repeatability evaluation. The DPV peak
currents (Ipa) at 0.54 V, for all eight electrodes were measured at a concentration of 2.5 mM. The
high concentration was chosen to ensure that even subtle changes in the measured currents can
be visualized, and the results (Table 2.S1) showed that the peak currents for all eight electrodes
varied between 2.5 % and 4.9 % for SnO2-SP and TiO2-SP electrodes, respectively. The low
variability indicates the high repeatability from both electrodes.
The stability of SnO2-SP and TiO2-SP electrodes was tested in a series of DPV experiments at a
4-ethylguaiacol concentration of 2.5 mM on consecutive days for a period of 15 days. The Ipa
from the 4-ethylguaiacol oxidation in DPVs was measured on day 1, 2, 3, 4, 5, 6, 10 and 15, and
the percentage of current retained compared to the current collected in day 1 was calculated. The
results (Table 2.S2) showed a loss of activity of up to 67 % and 81 % for SnO2-SP and TiO2-SP
electrode, respectively, in 15 days. Though the currents decreased significantly over time, the
rate of decrease slowed down after the first two days without large decrease beyond the first
week. The loss in stability could be attributed to the formation of surface oxides and other
adsorption effects from the ions present in the electrolyte that tend to impact the electrode over
the long term.
2.3.3 Interference study of 4-ethylguaiacol detection
The plant volatiles contain other chemical compounds that are non-specific to the infection that
are often released in equivalent or even higher concentrations compared to 4-ethylguaiacol. A
representative set of such VOCs was selected, and their interference effects on 4-ethylguaiacol
31
detection were studied using DPV. The compounds including 4-ethylphenol, 3-octanone, 1-
octen-3-ol, cis-3-hexenol, hexyl acetate and cis-hexen-1-yl acetate were tested in the interference
study. Among them 4-ethylphenol, 3-octanone and 1-octen-3-ol are present in the chemical
signature of the pathogen Phytophthora cactorum induced infection (Jeleń, Krawczyk et al.
2005). The other three compounds (cis-3-hexenol, hexyl acetate and cis-hexen-1-yl acetate) are
green leaf volatiles (GLVs) common to most plants (Umasankar, Rains et al. 2012). The fungi-
infected plants typically release 0.2 μM of 3-octanone, 0.2 μM of 1-octen-3-ol, 10 μM of cis-3-
hexenol, 1.2 μM of hexyl acetate and 20 μM of cis-hexen-1-yl acetate (Sunesson, Vaes et al.
1995, Umasankar, Rains et al. 2012). Therefore, concentrations higher than those
abovementioned were used in our interference study to simulate an extreme case of the
production of the interference compounds. The experiments were conducted separately for each
of 6 interference compounds where the low concentration of 4-ethylguaiacol (20.8 μM) was used
(still within the linear range of the detection obtained from DPV), and the DPV signal was
measured as introduced in Section 2.3.1. Then corresponding concentrations of the interference
compounds, as shown in Table 2.2 were mixed with 20.8 μM 4-ethylguaiacol and measured
using DPV. The currents collected from both pure 20.8 μM 4-ethylguaiacol and 20.8 μM 4-
ethylguaiacol with interference compounds were compared for the interference study. The results
demonstrated that the characteristic oxidation peak for 4-ethylguaiacol can be found even in the
presence of interference compounds as shown in Figure 2.6 for both SnO2-SP and TiO2-SP
electrodes.
32
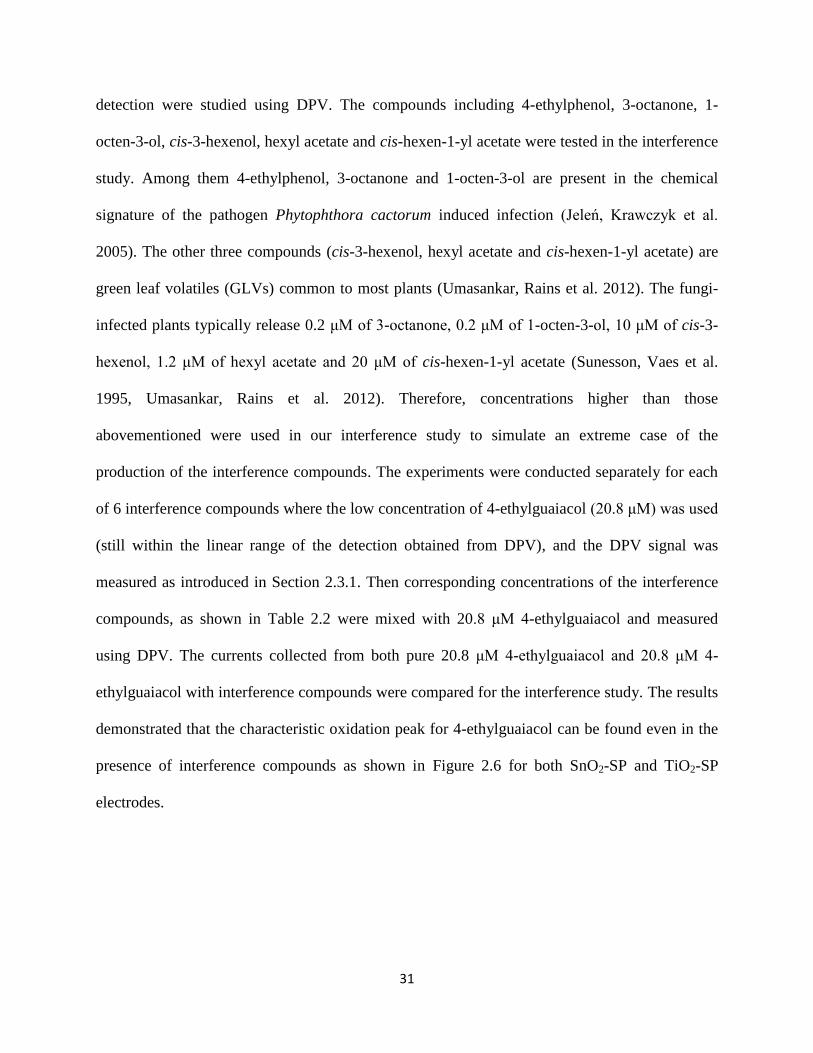
Figure 2.6: Interference study of 20.8 μM 4-ethylguaiacol with 6 different interference
compounds: 4-ethylphenol, cis-3-hexen-1-ol, hexyl acetate and cis-3-hexen-1-yl acetate, 3-
octanone and 1-octen-3-ol on SnO2-SP (A) and TiO2-SP (B) electrode by DPV.
For 4-ethylphenol, higher concentration (2.5 mM) was used due to the larger production rate
compared to other VOCs to simulate the extreme case. On both SnO2-SP and TiO2-SP electrodes,
the addition of 4-ethylphenol significantly changed the DPV wave above 0.55 V but not at the
peak oxidation potential (0.54 V) of 4-ethylguaiacol (Figure 2.6), therefore an oxidation peak
greater than 0.55 V for 4-ethylphenol can be speculated. As shown by the calculated Ipa values in
Table 2.2 below, 4-ethylphenol interference was limited to ± 6.7 % for SnO2-SP and TiO2-SP.
Less than 2 % interference was found on the 4-ethylguaiacol signal on TiO2-SP while up to 12 %
interference was observed on SnO2-SP with the addition of cis-hexen-1-yl acetate. Other
compounds such as 3-octanone, 1-octen-3-ol, cis-3-hexenol or hexyl acetate did not display any
significant interference on 4-ethylguaiacol detection. The interference study above demonstrates
that metal oxide-modified SP electrodes can be used for 4-ethylguaiacol detection without
significantly affected by the interference compounds.

33
Table 2.2: Interference study of 20.8 μM 4-ethylguaiacol with 6 different compounds: 4-
ethylphenol, cis-3-hexen-1-ol, hexyl acetate and cis-3-hexen-1-yl acetate, 3-octanone and 1-
octen-3-ol by DPV.
Interference Compound
Conc. of
Interference
compound
Current w/o
Interference
compound (μA)
Current with
Interference
compound (μA)
Found
(%)
SnO2-
SP
4-ethylphenol 2.5 mM 0.3212 0.3533 110.01
cis-3-hexen-1-ol 32 μM 0.2906 0.2956 101.73
hexyl acetate 2 μM 0.3249 0.3274 100.76
cis-3-hexen-1-yl acetate 32 μM 0.2672 0.2972 111.21
3-octanone 2 μM 0.3301 0.3320 100.57
1-octen-3-ol 2 μM 0.3381 0.3436 101.62
TiO2-
SP
4-ethylphenol 2.5 mM 0.3459 0.3227 93.30
cis-3-hexen-1-ol 32 μM 0.2783 0.2782 99.96
hexyl acetate 2 μM 0.3060 0.3092 101.08
cis-3-hexen-1-yl acetate 32 μM 0.3336 0.3400 101.91
3-octanone 2 μM 0.3334 0.3391 101.70
1-octen-3-ol 2 μM 0.3278 0.3308 100.90
2.3.4 Detection of 4-ethylguaiacol in simulated fruit volatiles
The capability of SnO2-SP and TiO2-SP for the determination of 4-ethylguaiacol in real infected
samples was evaluated using a simulated chemical mixture that mimics the composition of real
fruit volatile signature. As discussed in the interference study section, the chemical compounds
released that need to be detected can be both from the volatiles from the pathogen itself and from
the green leaf volatiles. Therefore, two sets of samples were used for simulations: (i) only
infected fruit volatiles and (ii) both infected fruit volatiles and GLVs. The composition of (i) was
2.5 mM 4-ethylguaiacol, 2.5 mM 4-ethylphenol, 2.5 μM 3-octanone and 2.5 μM 1-octen-3-ol.
The composition of (ii) contains all (i) in addition to 10 μM cis-3-hexen-1-ol, 1.25 μM hexeyl
34
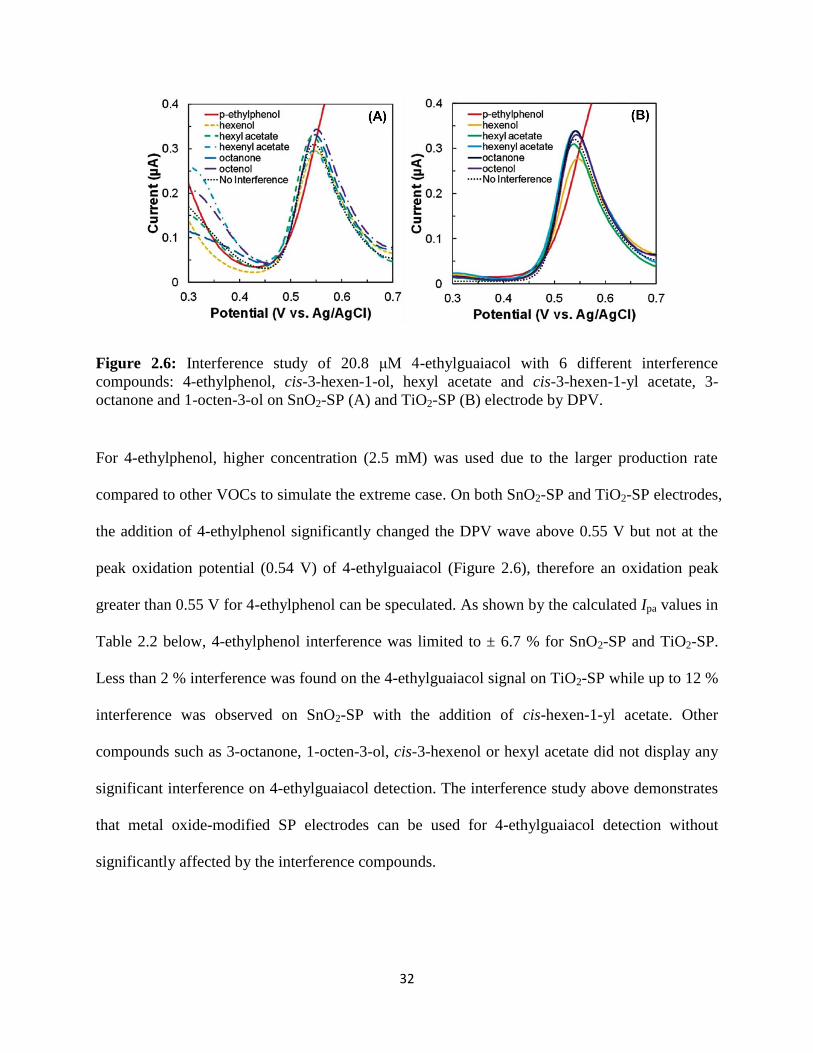
acetate and 25 μM cis-hexen-1-yl acetate. The concentrations were chosen based on the
composition of typical VOC signature of P. cactorum infection (Sunesson, Vaes et al. 1995,
Jeleń, Krawczyk et al. 2005). The experiments were conducted using DPV, and the 4-
ethylguaiacol in four different concentrations was measured as control. The currents collected
from four concentrations of 4-ethylguaiacol, and from both simulation samples (contains the
same concentration of 4-ethylguaiacol as in control), and the calculated recovery are listed in
Table 2.3.
Table 2.3: Simulated sample study using typical chemicals released by P. cactorum infected
plants with same concentration of 4-ethylguaiacol as control.
Electrode Sample Currents from 4-
ethylguaiacol (μA)
Currents from
simulated sample
(μA)
Recovery
(%)
SnO2-SP
Infected fruit
0.0455 0.0417 91.65
0.1942 0.1947 100.26
0.4816 0.4789 99.44
1.5130 1.5110 99.87
Infected fruit with plant
0.0455 0.0495 108.79
0.1942 0.2011 103.55
0.4816 0.4816 100.00
1.5130 1.4890 98.41
TiO2-SP
Infected fruit
0.0421 0.0389 92.40
0.2218 0.2019 91.03
0.5017 0.5021 100.08
1.6210 1.6500 101.79
Infected fruit with plant
0.0421 0.0399 94.77
0.2218 0.2070 93.33
0.5017 0.5067 101.00
1.6210 1.6420 101.30

35
The results from Table 2.3 shows that the recovery of 4-ethylguaiacol detection from both
simulated samples varies from 91 % to 101 % when compared to standard 4-ethylguaiacol
control experiments, therefore, demonstrating both electrodes – SnO2-SP and TiO2-SP can be
used for 4-ethylguaiacol determination during the on-field test in the future.
2.4 CONCLUSION
Both SnO2-SP and TiO2-SP electrodes have been demonstrated to exhibit similar detection
capabilities for 4-ethylguaiacol based on amperometric determination. Ultra-low limit of
detection was achieved by both metal-oxide nanoparticles-based electrodes and DPV
measurements. Both electrodes exhibited good repeatability towards 4-ethylguaiacol detection.
CV and DPV data along with chemical reactions established here elucidate the electrochemical
reaction mechanisms pertaining to the amperometric sensing of 4-ethylguaiacol. The
electroanalytical data presented in this chapter can be used for both qualitative and quantitative
determination of 4-ethylguaiacol. The synthetic sample studies presented here illustrate the
approach for the development of 4-ethylguaiacol detection during the initial stages of
Phytophthora cactorum infection.
2.5 SUPPLEMENTARY DATA
Table 2.S1: Repeatability of 4-ethylguaiacol (2.5 mM) oxidation at SnO2-SP and TiO2-SP
electrodes.
SnO2-SP electrode TiO2-SP electrode
Electrode 1 7.24 5.66
Electrode 2 7.10 5.39
Electrode 3 6.88 5.68
Electrode 4 7.02 6.01
Electrode 5 7.10 6.22

36
Electrode 6 7.34 6.16
Electrode 7 7.41 6.13
Electrode 8 7.39 6.14
Average 7.18 5.92
Standard Deviation 0.18 0.29
RSD 2.48 % 4.85 %
Table 2.S2: Stability of SnO2-SP and TiO2-SP electrodes for the determination of 2.5 mM 4-
ethylguaiacol.
Days SnO2-SP TiO2-SP
Current
retained (%)
Std. Relative Std. (%) Current
retained (%)
Std. Relative Std. (%)
1 100 100
2 72.40 0.92 16.01 60.94 1.21 24.27
3 53.11 1.29 25.60 49.52 1.34 30.81
4 53.80 1.27 27.30 33.11 1.53 40.48
5 40.04 1.39 32.57 22.52 1.67 50.48
6 32.01 1.50 38.24 16.60 1.74 59.57
10 29.49 1.54 42.45 17.41 1.74 65.28
15 32.19 1.53 44.19 18.99 1.70 68.56

37
Figure 2.S1: CV (A) and DPV (B) response of 0.17 mM and 0.1 mM 4-ethylguaiacol
respectively, at SnO2-modified (red), TiO2-modified (green) and unmodified (blue) SP electrodes.
The insets display the concentration effect within the linear range of 4-ethylguaiacol oxidation at
SnO2 (red), TiO2 (green) and unmodified SP (blue).
Figure 2.S2: CV response of SnO2- (red) and TiO2-modified (green) SP electrodes without 4-
ethylguaiacol.

38
CHAPTER 3
DETECTION OF 4-ETHYLPHENOL USING TYROSINASE – BASED BIOSENSOR
This chapter contains text modified from the following publication:
Yi Fang and Ramaraja P. Ramasamy. 2016. ECS Journal of Solid State Science and Technology
5: M3054-M3059.
Reprinted here with permission of the publisher.

39
Abstract
Volatile organic compounds released by fruits and plants have been suggested as indicators of
biotic stress in fruits and plants due to pathogen (fungi, bacteria and viruses) infection. Among
the hundreds of volatile organic compounds, 4-ethylphenol has been reported as one of the most
important volatile organic compounds released by strawberries upon pathogen infection.
Detection of these compounds in a highly selective manner would help in the identification of
infected fruits. In this chapter, a novel enzymatic biosensor made of tyrosinase-modified carbon
nanotube (CNT) electrode has been developed for the detection of 4-ethylphenol. Cyclic
voltammetry and constant potential amperometry were used for 4-ethylphenol detection. High
sensitivity of 4.0 ± 0.5 μA·cm-2·μM
-1 with measurement range of 0 – 100 μM (R
2 = 0.9956) was
achieved by constant potential amperometry for the detection of 4-ethylphenol. Limit of
detection and limit of quantification were determined as 0.10 ± 0.02 μM and 0.29 ± 0.07 μM
respectively. Stability studies showed satisfactory performance of the biosensor for one time
disposable use. The biosensor experience little interference from other compounds typically
present in strawberry volatile signatures. The studies using synthetic analyte revealed that the
biosensor could be reliably used for 4-ethylphenol detection in practical application.
Keywords: Volatile organic compound, 4-Ethylphenol, Enzyme, Tyrosinase, Biosensor,
Phytophthora cactorum.

40
3.1 INTRODUCTION OF 4-ETHYLPHENOL AND ITS DETECTION
3.1.1 4-Ethylphenol as signature compound for disease detection
As introduced in the Chapter 2, Phytophthora cactorum is a very common phytopathogenic
fungus that causes leather rot (crown rot) diseases in strawberries and other crops during growth
and post-harvesting procedure. In addition to 4-ethylguaiacol released by the infected strawberry
plants, the other such characteristic volatile marker or volatile organic compound (VOC) that
produced by infected strawberry plants is 4-ethylphenol (Jeleń, Krawczyk et al. 2005, Nieminen,
Neubauer et al. 2008, Ubeda, Callejon et al. 2012, Ubeda, San-Juan et al. 2012). Therefore,
detection of 4-ethylphenol produced by infected plants in ultra-low quantities could be used as an
effective indicator of crown rot stresses of strawberry plants. In the similar situation, GC-MS and
other techniques, although provide both qualitative and quantitative measurements for 4-
ethylphenol detection, are primarily limited in the laboratory study rather than for real on-field
application due to their complicated operation, analysis and requirements for professional
technicians to operate.
3.1.2 Application of enzyme tyrosinase as biorecognition element
Although application of nanomaterials, such as metal oxide nanoparticles, are introduced in
Chapter 2, bio-recognition element, such as enzyme, is also widely used for sensor development
to improve the biosensor performance such as sensitivity, limit of detection (LOD) and
specificity due to the catalytic function towards substrate reaction and the enzyme specificity. In
this project, we report the successful development of tyrosinase-immobilized biosensor for 4-
ethylphenol selective detection. Tyrosinase (TYR) is an effective enzyme that catalyzes catechol,
L-dopa and other o-phenols to their corresponding o-quinone derivatives due to its catechol

41
oxidase activity (Espín, Varón et al. 2000, de Faria, Rotuno Moure et al. 2007). Additionally,
tyrosinase is also able to catalyze monophenols to o-phenols due to its monooxygenase activity,
and oxidize the o-phenol intermediates to o-quinones due to its catechol oxidase activity (Rassaei,
Cui et al. 2012).
In this project, TYR is used and biochemically oxidized 4-ethylphenol to produce 4-ethyl-1,2-
benzoquinone on the electrode surface. The amperometric detection is realized through the
electrochemical reduction of 4-ethyl-1,2-benzoquinone to 4-ethyl-1,2-hydroquinone (Cosnier
and Innocent 1993). The schematic illustration can be explained by Figure 3.1.
Figure 3.1: Schematic illustration of 4-ethylphenol detection on TYR-immobilized biosensor.
Not drawn to scale. 4-Ethylphenol can be oxidized to 4-ethyl-1,2-benzoquinone by TYR and the
detection is based on the electrochemical reduction of 4-ethyl-1,2-benzoquinone to 4-ethyl-1,2-
hydroquinone (green arrows), the thus formed 4-ethyl-1,2-benzoquinone can be oxidized to 4-
ethyl-1,2-benzoquinone (yellow arrows).

42
TYR catalyzes the conversion of 4-ethylphenol to 4-ethyl-1,2-benzoquinone in the presence of
oxygen. The amperometric detection can be realized through the electrochemical reduction of 4-
ethyl-1,2-benzoquinone to 4-ethyl-1,2-hydroquinone on the multiwalled carbon nanotubes
(MWCNTs) modified on the electrode surface as both enzyme immobilization platform and as
amperometric transducer due to its high electrical conductivity and large surface area. TYR is
immobilized through a well-developed molecular tethering approach.
3.2 MATERIALS AND METHODS
3.2.1 Materials
Tyrosinase (E.C. 1.14.18.1) purified from mushroom (lyophilized powder, ≥ 1000 U/mg solid)
was purchased from Sigma-Aldrich (St. Louis, Missouri, USA) and used as it is. Multiwalled
carbon nanotubes (MWCNTs) were obtained from DropSens (Llanera, Spain). Pyrenebutanoic
acid succinimidyl ester (PBSE) was obtained from Ana Spec Inc. (Fremont, California, USA) as
cross-linker for enzyme immobilization. Dimethylformamide (DMF) and sodium salicylate were
purchased from Acros Organics (Pittsburgh, Pennsylvania, USA). 4-ethylphenol was purchased
from Aldrich (St. Louis, Missouri, USA). Methanol and ethanol were purchased directly from
Fisher Scientific (Pittsburg, Pennsylvania, USA) and Electron Microscopy Sciences (Hatfield,
Pennsylvania, USA) respectively. Acetone was obtained from BDH chemicals (London, United
Kingdom). 4-ethylguaiacol was obtained from Frinton Laboratories, Inc. (Hainesport, New
Jersey, USA). Other chemicals used as interferants such as ethyl butyrate and methyl hexanoate
were purchased from Fluka (St. Louis, Missouri, USA) and methyl butyrate, 2-pentanone and 2-
heptanone were obtained from Aldrich Chemicals (St. Louis, Missouri, USA). All experiments
were carried out in 0.1 M potassium phosphate buffer, pH 6.6 as electrolyte (Bru, Sanchez‐

43
Ferrer et al. 1989). All solutions were prepared in 18.2 MΩ nanopure de-ionized (DI) water. All
solutions were oxygenated by purging oxygen for 15 min.
3.2.2 Apparatus
CH Instrument 920 c potentiostat was used to carry out all the experiments including cyclic
voltammetry (CV) and constant potential amperometry (CPA). A conventional three-electrode
system consisting of a 3M Ag/AgCl as a reference electrode, a platinum wire as a counter
electrode, and a glassy-carbon (GC) electrode with diameter of 3 mm obtained from Pine
Instruments were used to perform all electrochemical experiments in a custom made 10 mL glass
electrochemical reaction cell. All experiments were carried out at the ambient temperature of 25
± 2 ºC.
3.2.3 Electrode preparation
GC electrode was first polished with 0.05 μm alumina powder for 5 min before each experiment.
Polished electrode was then cleaned with ultrasonication for 5 minutes and rinsed with DI water
to remove adhered polishing power on the electrode before the modification and immobilization
with CNTs and enzymes shown in Figure 3.2. MWCNT suspension was prepared by suspend 1
mg of nanotube in 1 mL of DMF, followed by sonication for an hour with power and frequency
of 75 W and 20 kHz.

44
Figure 3.2: Schematic illustration of electrode modification with MWCNT, PBSE and TYR. Not
drawn to scale. The GC electrode was first polished and drop-casted with CNT suspension and
dried in the oven at the temperature of 70 ºC. The electrode is then modified with PBSE as cross-
linker before the enzyme is used for the immobilization.
16 μL of CNT suspension were drop-casted on the polished GC electrode (in 8 steps of 2 μL)
followed by drying up in 70 ºC oven. CNT modified electrode was placed on ice before 2 μL of
10 mM PBSE (in DMF) solution was added. The electrode was then incubated for 15 min to
allow non-covalent binding of CNT with pyrene group of PBSE. The electrode was then rinsed
with DMF and 0.1 M potassium phosphate buffer, pH 6.6 to remove excessive non-binded PBSE.
TYR solution was prepared by dissolving 5 mg of TYR lyophilized powder in 1 mL 20 mM
potassium phosphate buffer (PB), pH 6.6. 5 μL of TYR solution was drop-casted on CNT/PBSE
modified electrode and the electrode was incubated on ice for 30 min to allow covalent binding
of PBSE and TYR. Excessive TYR was rinsed off with 20 mM PB, pH 6.6.
3.2.4 Electrochemical measurement
Cyclic voltammetry (CV) for CNT modified electrode without immobilization of TYR was
performed from 0.2 to 0.7 V with scan rate of 20 mV/s and sampling interval of 0.001 V in
presence of 0.1 M PB, pH 6.6 as electrolyte. For CNT modified electrode with immobilization of
45
TYR, CV was performed from -0.2 to 0.4 V with scan rate of 20 mV/s and sampling interval of 1
mV in presence of 0.1 M PB, pH 6.6. Initial potential for both non-TYR immobilized electrode
and TYR-immobilized electrode during CPA was set to 0.13 V with sampling interval of 0.1 s.
During CPA, the electrodes were stabilized for 2 min before each addition of 4-ethylphenol to
the electrolyte in the electrochemical cell with 1 min interval.
3.3 RESULTS AND DISCUSSION
3.3.1 Determination of voltage window for 4-ethylphenol detection
Previous research has already indicated that electrochemical oxidation of para-phenols can be
achieved on GC electrode with the window potential between 0.2 and 0.7 V (Enache and
Oliveira-Brett 2011). CV was first used to determine the potential window for reliable detection
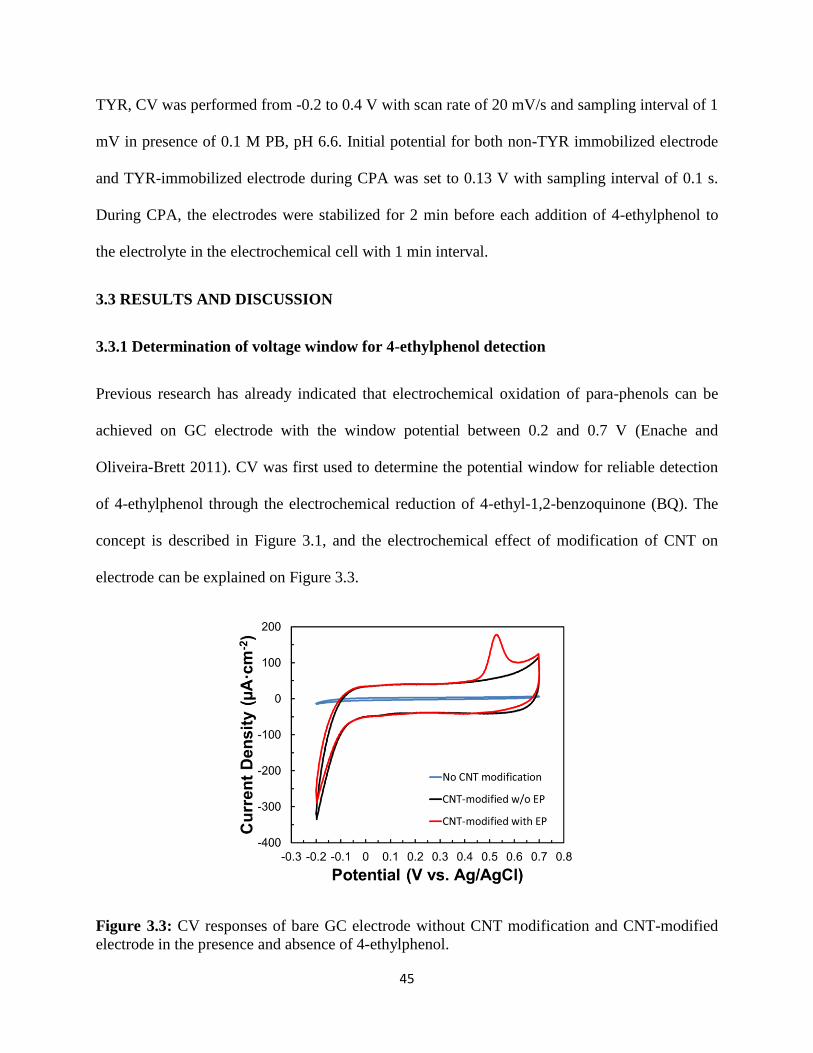
of 4-ethylphenol through the electrochemical reduction of 4-ethyl-1,2-benzoquinone (BQ). The
concept is described in Figure 3.1, and the electrochemical effect of modification of CNT on
electrode can be explained on Figure 3.3.
Figure 3.3: CV responses of bare GC electrode without CNT modification and CNT-modified
electrode in the presence and absence of 4-ethylphenol.

46
The increase of non-faradaic current for the CNT-modified electrode compared to bare GC
electrode can be attributed to the attachment of CNT on the GC electrode. With the deposition of
CNTs on the electrode, electrochemical surface increased, resulting in an increase in the
capacitance of the electrode from -0.2 to 0.7 V. With the presence of 4-ethylphenol, the
electrochemical oxidation of 4-ethylphenol was observed above 0.45 V during the anodic sweep
(from relatively negative to positive potential), and reached its peak around 0.5 V, while
corresponding reduction was absent. This result suggests that oxidation of 4-ethylphenol is
irreversible. In order to improve the specificity for 4-ethylphenol detection, TYR was used as
introduced in Figure 3.1, the direct electrochemical oxidation, in other words, non-specific
reactions, need to be avoided when a TYR-immobilized electrode is used for the detection.
Therefore, the voltage window was narrowed down to a shorter range from -0.2 V to 0.4 V.
Figure 3.4: CV responses of 0.49 mM 4-ethylphenol on unimmobilized CNT electrode and
TYR-immobilized CNT electrode with and without presence of 4-ethylphenol. BQ-4-ethyl-1,2-
benzoquinone and HQ-4-ethyl-1,2-hydroquinone.

47
Figure 3.4 shows the cyclic voltammograms of no TYR-immobilized and TYR immobilized
CNT-modified electrodes both in the presence and absence of 4-ethylphenol. The results
demonstrate that 4-ethylphenol cannot be directly detected electrochemically within the voltage
window between -0.2 and 0.4 V on unimmobilized CNT electrode since no significant oxidation
or reduction peak of 4-ethylphenol could be observed within the range. On the other hand,
increase of capacitance was observed after the immobilization of TYR, which could be attributed
to the crosslinking of TYR on the CNT modified electrode. In addition, upon adding 4-
ethylphenol in the electrolyte, 4-ethylphenol was catalyzed and formed the intermediate o-phenol
(4-ethyl-1,2-hydroquinone) due to the monooxygenase activity of tyrosinase. The intermediate o-
phenol was further oxidized to o-quinone (4-ethyl-1,2-benzoquione) by catechol oxidase activity
(Rassaei, Cui et al. 2012). Due to the monooxygenase activity and catechol oxidase activity, two
alternative names – catechol oxidase and monophenol monooxygenase are also proposed for
TYR. Therefore, the detection of 4-ethylphenol was realized through the measurement of
reduction of 4-ethyl-1,2-benzoquinone (BQ) to 4-ethyl-1,2-hydroquinone (HQ) below 0.2 V
during cationic sweep as per the schematic illustration shown as green arrows in Figure 3.1. In
addition, two prominent oxidation peaks were also observed as the sweeping potential increases
from -0.2 V to 0.1 V during the anodic sweep as shown in Figure 3.4. The peaks can be
explained by the two-step electrochemical oxidation of 4-ethyl-1,2-hydroquinone (HQ) as given
in yellow arrows in Figure 3.1. In this experiment, it is obvious that about 5-fold increase of the
amperometric signal was obtained for 4-ethylphenol from TYR-immobilized electrode (Figure
3.4) compare to the same concentration of 4-ethylphenol from non TYR-immobilized electrode
(Figure 3.3), which validates our assumption that TYR-immobilized biosensor cannot only
improve specificity, but also increases the sensitivity for 4-ethylphenol detection.
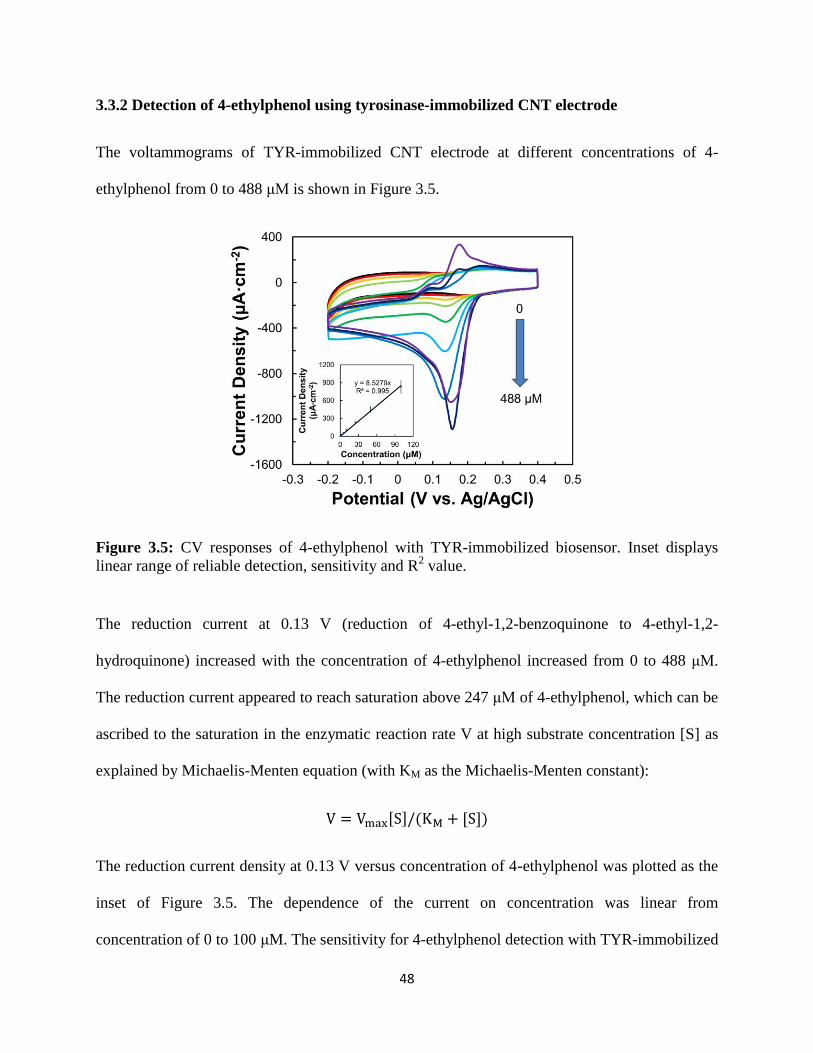
48
3.3.2 Detection of 4-ethylphenol using tyrosinase-immobilized CNT electrode
The voltammograms of TYR-immobilized CNT electrode at different concentrations of 4-
ethylphenol from 0 to 488 μM is shown in Figure 3.5.
Figure 3.5: CV responses of 4-ethylphenol with TYR-immobilized biosensor. Inset displays
linear range of reliable detection, sensitivity and R2 value.
The reduction current at 0.13 V (reduction of 4-ethyl-1,2-benzoquinone to 4-ethyl-1,2-
hydroquinone) increased with the concentration of 4-ethylphenol increased from 0 to 488 μM.
The reduction current appeared to reach saturation above 247 μM of 4-ethylphenol, which can be
ascribed to the saturation in the enzymatic reaction rate V at high substrate concentration [S] as
explained by Michaelis-Menten equation (with KM as the Michaelis-Menten constant):
V = Vmax[S]/(KM + [S])
The reduction current density at 0.13 V versus concentration of 4-ethylphenol was plotted as the
inset of Figure 3.5. The dependence of the current on concentration was linear from
concentration of 0 to 100 μM. The sensitivity for 4-ethylphenol detection with TYR-immobilized

49
biosensor calculated as the slope of the inset was estimated to be 8.53 μA·cm-2
·μM-1
. The TYR-
immobilized CNT electrode also exhibited a limit of detection (LOD) of 0.21 μM and limit of
quantification (LOQ) of 0.64 μM for the detection of 4-ethylphenol (Table 3.1).
Table 3.1: Linear range, R2 value, sensitivity, LOD and LOQ for TYR-immobilized CNT
biosensor for 4-ethylphenol detection by CV and constant potential amperometry (CPA).
Technique Linear range
(μM) R
2 value
Sensitivity
(μA·cm-2
·μM-1
) LOD (μM) LOQ (μM)
CV 0 – 100 0.9950 8.53 ± 0.95 0.21 ± 0.08 0.64 ± 0.25
CPA 0 – 100 0.9956 4.05 ± 0.52 0.10 ± 0.02 0.29 ± 0.07
LOD and LOQ can be calculated by equations below (Long and Winefordner 1983, Armbruster
and Pry 2008):
LOD (μM) = 3.3 × SD (μA · cm−2)/Sensitivity(μA · cm−2 · μM−1)
LOQ (μM) = 10 × SD (μA · cm−2)/Sensitivity(μA · cm−2 · μM−1)
Since CV is commonly a transient method used for steady state quantitative measurements for
the evaluation of an electrochemical sensor, a more suitable technique, i.e. constant potential
amperometry (CPA) was applied for 4-ethylphenol detection. CPA could provide reliable steady
state measurements to determine the sensitivity, LOD and LOQ for the analyte detection (Luo,
Prabhu et al. 1990, Park, Boo et al. 2006). Additionally, CPA is more convenient to program
when building a portable device; and it is easier to carry out the data analysis by computer. The
initial potential was set to 0.13 V (the potential at which highest reduction current is obtained
from 4-ethyl-1,2-benzoquinone). 4-Ethylphenol was consecutively added to maintain a
concentration gradient during the measurement by TYR-immobilized biosensor. The results of
the CPA measurements are shown in Figure 3.6.

50
Figure 3.6: CPA responses of 4-ethylphenol with TYR-immobilized biosensor. Inset displays
linear range of reliable detection, sensitivity and R2 value.
As concentration of 4-ethylphenol increased, the reduction current of 4-ethyl-1,2-benzoquinone
also increased in all three repetitive trials attempted for this measurement in Figure 3.6. The
sensitivity for 4-ethylphenol detection was determined to be 4.05 μA·cm-2
·μM-1
and LOD and
LOQ were determined to be 0.10 μM (1.8 ppb) and 0.29 μM (5.2 ppb) respectively (Table 3.1).
The results indicated that TYR-immobilized biosensor can be reliably used for 4-ethylphenol
detection within the concentration between 0 to 100 μM. In addition, the application of the initial
potential of 0.13 V was advantageous compared to the direct electrochemical detection without
TYR immobilization, whose oxidation potential is 0.5 V, because the lower potential that applied,
the less interference from other compounds will be. Therefore, false positive signal can be
avoided by using low detection potential.
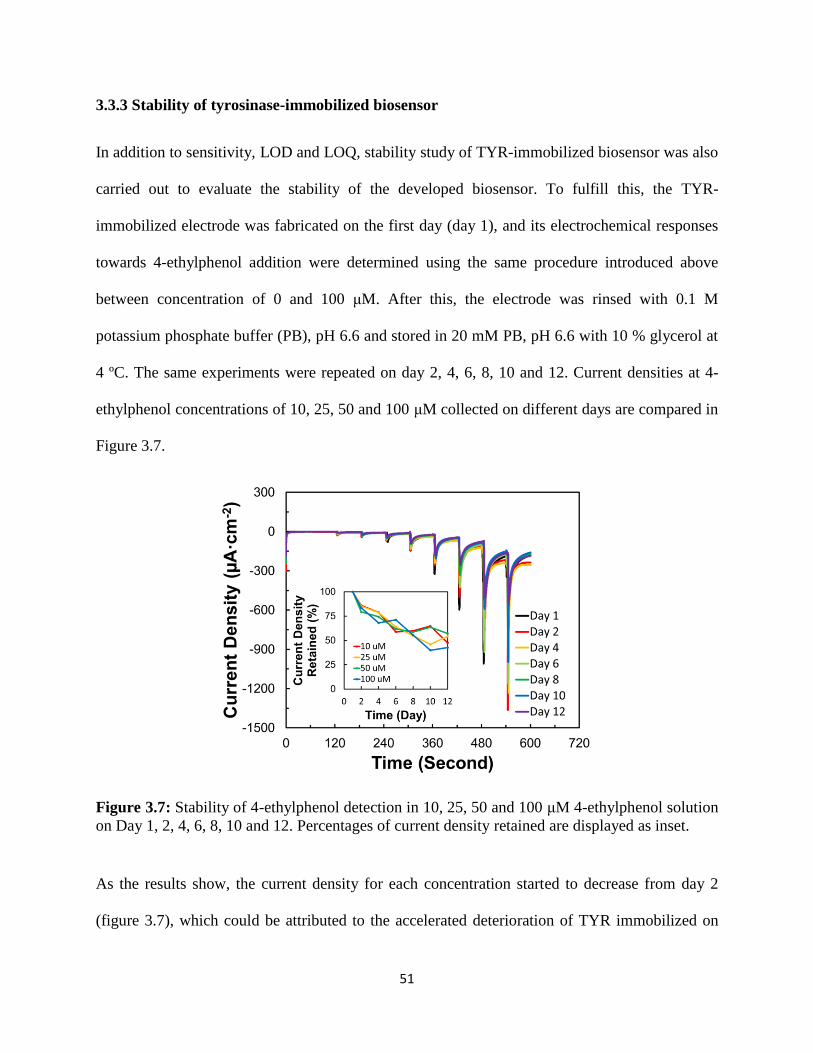
51
3.3.3 Stability of tyrosinase-immobilized biosensor
In addition to sensitivity, LOD and LOQ, stability study of TYR-immobilized biosensor was also
carried out to evaluate the stability of the developed biosensor. To fulfill this, the TYR-
immobilized electrode was fabricated on the first day (day 1), and its electrochemical responses
towards 4-ethylphenol addition were determined using the same procedure introduced above
between concentration of 0 and 100 μM. After this, the electrode was rinsed with 0.1 M
potassium phosphate buffer (PB), pH 6.6 and stored in 20 mM PB, pH 6.6 with 10 % glycerol at
4 ºC. The same experiments were repeated on day 2, 4, 6, 8, 10 and 12. Current densities at 4-
ethylphenol concentrations of 10, 25, 50 and 100 μM collected on different days are compared in
Figure 3.7.
Figure 3.7: Stability of 4-ethylphenol detection in 10, 25, 50 and 100 μM 4-ethylphenol solution
on Day 1, 2, 4, 6, 8, 10 and 12. Percentages of current density retained are displayed as inset.
As the results show, the current density for each concentration started to decrease from day 2
(figure 3.7), which could be attributed to the accelerated deterioration of TYR immobilized on

52
the electrode over time. About 50 % of the current density in retained on day 8. The results
suggest that stabilization of enzyme should be carried out pre- or post- immobilization on the
electrode surface before the biosensor can be considered for practical use. Developing enzyme
stabilization methods to improve the shelf life of the biosensor could be a goal for the future
work (Chapter 9).
3.3.4 Biosensor performance in the presence of interference compounds
As we introduced above, high amount of 4-ethylphenol will be produced by strawberry plants
upon biotic stresses such as infection of Phytophthora cactorum. However, uninfected
strawberry plants also produced and released a variety of other VOCs which could pose
problems of false positive. Compounds such as ethyl butanoate, methyl hexanoate, ethanol,
acetone, methyl butanoate, 2-heptanone and 2-pentanone are mostly produced VOCs by healthy
strawberry plants at all times (Hakala, Lapveteläinen et al. 2002). Therefore, the interference
from those compounds should be evaluated to avoid false positive signals before the biosensor
can be practically used. Different concentrations of the above-mentioned interfering compounds
up to 6.67 mM were analyzed using CPA and the results are shown in Figure 3.8.

53
Figure 3.8: CPA responses of interference compounds: ethyl butanoate (EB), methyl hexanoate
(MH), acetone (Ac), ethanol (Et), methyl butanoate (MB), 2-heptanone (HN) and 2-pentanone
(PN) (Inset) and 4-ethylguaiacol (red) and control (black).
The current densities obtained from the interference VOCs were compared against the
amperometric current density obtained from 10 μM 4-ethylphenol, which is a relatively low
concentration within the linear range of the biosensor (0 to 100 μM) to mimic the extreme case
(i.e., the situation that 4-ethylphenol is produced in small amount while other VOCs are greatly
produced simultaneously, mimicking a high noise, low signal scenario). The values for the
interference currents obtained from the CPA measurements and the corresponding concentrations
are tabulated in Table 3.2.
Table 3.2: Percentage (%) of interference current density resulted from interference compounds
compared to 10 μM 4-ethylphenol. ethyl butanoate (EB), methyl hexanoate (MH), acetone (Ac),
ethanol (Et), methyl butanoate (MB), 2-heptanone (HN), 2-pentanone (PN) and 4-ethylguaiacol
(EG).
Conc.
(mM)
EB MH Ac Et MB HN PN EG
0 0.04 -0.02 0.00 0.03 -0.04 0.13 0.04 -0.02
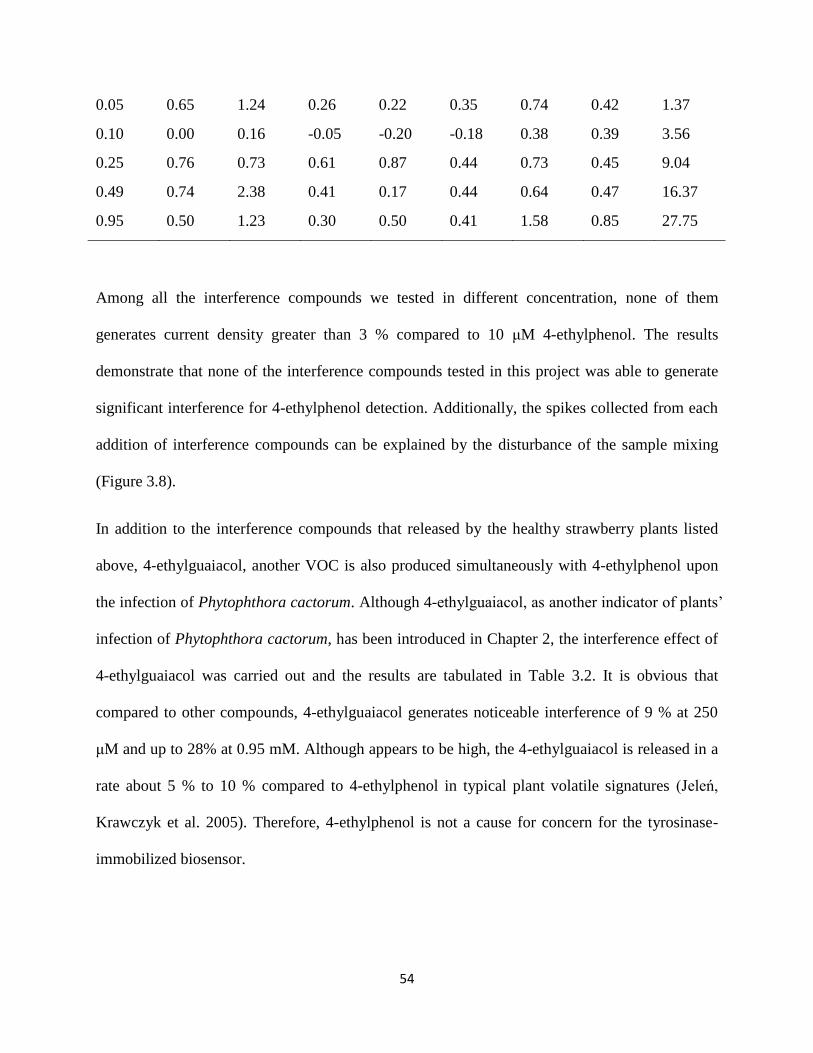
54
0.05 0.65 1.24 0.26 0.22 0.35 0.74 0.42 1.37
0.10 0.00 0.16 -0.05 -0.20 -0.18 0.38 0.39 3.56
0.25 0.76 0.73 0.61 0.87 0.44 0.73 0.45 9.04
0.49 0.74 2.38 0.41 0.17 0.44 0.64 0.47 16.37
0.95 0.50 1.23 0.30 0.50 0.41 1.58 0.85 27.75
Among all the interference compounds we tested in different concentration, none of them
generates current density greater than 3 % compared to 10 μM 4-ethylphenol. The results
demonstrate that none of the interference compounds tested in this project was able to generate
significant interference for 4-ethylphenol detection. Additionally, the spikes collected from each
addition of interference compounds can be explained by the disturbance of the sample mixing
(Figure 3.8).
In addition to the interference compounds that released by the healthy strawberry plants listed
above, 4-ethylguaiacol, another VOC is also produced simultaneously with 4-ethylphenol upon
the infection of Phytophthora cactorum. Although 4-ethylguaiacol, as another indicator of plants’
infection of Phytophthora cactorum, has been introduced in Chapter 2, the interference effect of
4-ethylguaiacol was carried out and the results are tabulated in Table 3.2. It is obvious that
compared to other compounds, 4-ethylguaiacol generates noticeable interference of 9 % at 250
μM and up to 28% at 0.95 mM. Although appears to be high, the 4-ethylguaiacol is released in a
rate about 5 % to 10 % compared to 4-ethylphenol in typical plant volatile signatures (Jeleń,
Krawczyk et al. 2005). Therefore, 4-ethylphenol is not a cause for concern for the tyrosinase-
immobilized biosensor.

55
3.3.5 Evaluation of biosensors using synthetic analyte cocktail
The composition of VOCs released by both healthy and infected strawberry plants has been
reported by previous publications (Hakala, Lapveteläinen et al. 2002, Jeleń, Krawczyk et al.
2005). In order to evaluate the application of this biosensor in near-practical conditions, a
synthetic cocktail solution was prepared as the analyte to simulate the production of VOCs by
healthy strawberries. The cocktail solution was prepared in seven compounds at compositions
similar to that found in the volatile signatures of strawberries listed in Table 3.3.
Table 3.3: Composition of the synthetic cocktail solution consisting VOCs released by healthy
strawberry plants.
Volatile organic compound Concentration (mM)
Ethyl butanoate 20.75
Methyl hexanoate 16.62
Acetone 7.42
Ethanol 7.42
Methyl butanoate 13.91
2-Heptanone 9.72
2-Pentanone 3.91
The fabricated TYR-immobilized biosensor was stabilized for 120 seconds in 1 mL, followed by
addition of 1 mL of synthetic cocktail solution to mimic the situation that all those VOCs are
omnipresent regardless of the healthy condition of strawberry. The mixed stock solution of 20
mM 4-ethylphenol and 20 mM 4-ethylguaiacol was then gradually added at 60-second interval to
mimic the release of the two VOCs by infected strawberries in addition to the VOCs released by
the healthy plants (i.e. cocktails already present in the electrochemical cell). The electrochemical
signal collected from the mixture was compared with the control experiment performed by
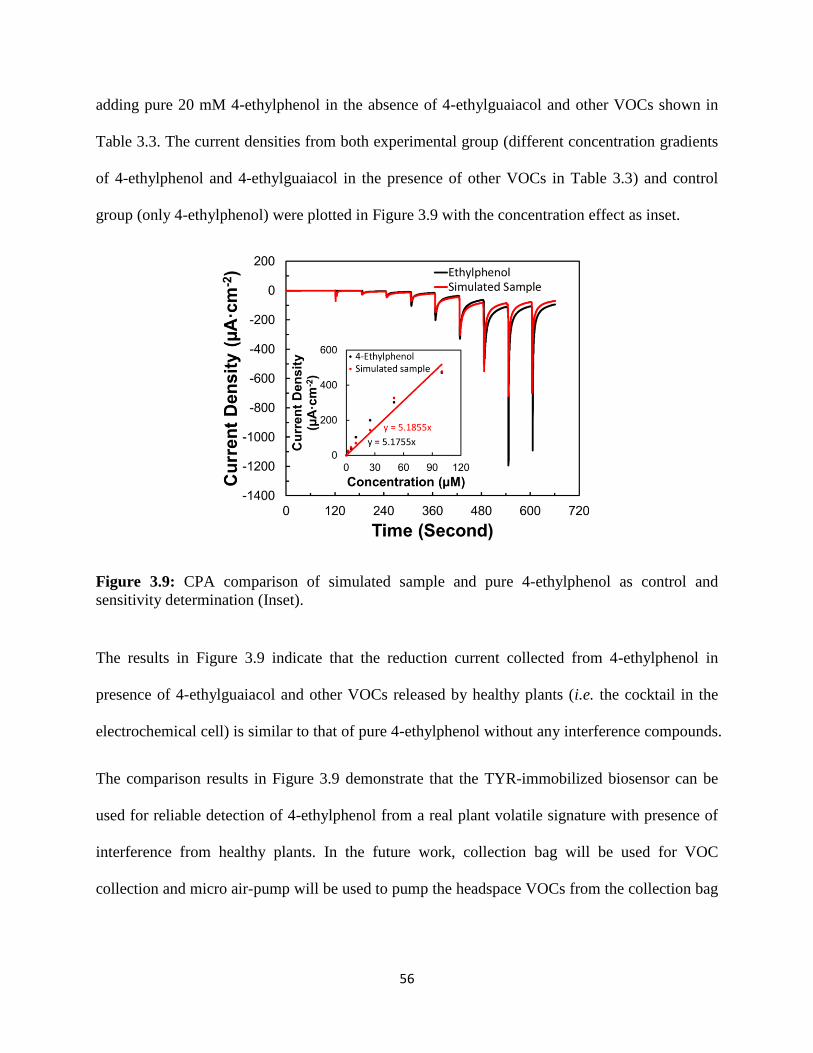
56
adding pure 20 mM 4-ethylphenol in the absence of 4-ethylguaiacol and other VOCs shown in
Table 3.3. The current densities from both experimental group (different concentration gradients
of 4-ethylphenol and 4-ethylguaiacol in the presence of other VOCs in Table 3.3) and control
group (only 4-ethylphenol) were plotted in Figure 3.9 with the concentration effect as inset.
Figure 3.9: CPA comparison of simulated sample and pure 4-ethylphenol as control and
sensitivity determination (Inset).
The results in Figure 3.9 indicate that the reduction current collected from 4-ethylphenol in
presence of 4-ethylguaiacol and other VOCs released by healthy plants (i.e. the cocktail in the
electrochemical cell) is similar to that of pure 4-ethylphenol without any interference compounds.
The comparison results in Figure 3.9 demonstrate that the TYR-immobilized biosensor can be
used for reliable detection of 4-ethylphenol from a real plant volatile signature with presence of
interference from healthy plants. In the future work, collection bag will be used for VOC
collection and micro air-pump will be used to pump the headspace VOCs from the collection bag

57
to electrolyte for enrichment, and therefore, realize the detection of 4-ethylphenol using the
biosensor developed above.
3.4 CONCLUSION
In this chapter, a novel TYR-based biosensor for 4-ethylphenol detection was developed with
CNTs. The newly developed biosensor exhibited high sensitivity, ultra-low LOD and LOQ for 4-
ethylphenol detection. The biosensor also displayed satisfactory stability although the enzyme
still needs pre-stabilization before immobilization. Other VOCs have been tested and no
significant interference was observed at reasonable concentration. Synthetic analyte consisting of
4-ethylphenol and other types of VOCs produced by both healthy and infected strawberry plants
have been used for evaluating the near-practical application and the sensor exhibited reliable
detection of 4-ethylphenol in the synthetic analyte sample. This project provides a platform for
the development of enzymatic biosensors for plant disease detection through VOCs that signify
plant diseases, therefore allows the detection of more VOCs in the future work.

58
CHAPTER 4
DETECTION OF METHYL SALICYLATE USING ALCOHOL OXIDASE /
PEROXIDASE – BASED BIOSENSOR
This chapter contains text modified from the following publications:
Yi Fang, Yogeswaran Umasankar, and Ramaraja P. Ramasamy. 2016. Biosensors and
Bioelectronics 81: 39-45.
Reprinted here with permission of the publisher.

59
Abstract
An amperometric biosensor based on a bi-enzyme-immobilized electrode was developed for
detection of methyl salicylate, a volatile organic compound released by pathogen-infected plants
via systemic response. The detection is based on cascadic conversion reactions that result in an
amperometric electrochemical signal. The bi-enzymatic electrode is made of alcohol oxidase and
horseradish peroxidase enzymes immobilized on to a carbon nanotube matrix through a
molecular tethering method. Methyl salicylate undergoes hydrolysis to form methanol, which is
consumed by alcohol oxidase to generate formaldehyde while simultaneously reducing oxygen
to hydrogen peroxide. The hydrogen peroxide will be further reduced to water by horseradish
peroxidase, which results in an amperometric signal via direct electron transfer. The bi-
enzymatic biosensor was evaluated by cyclic voltammetry and constant potential amperometry
using hydrolyzed methyl salicylate as the analyte. The sensitivity of the bi-enzymatic biosensor
as determined by cyclic voltammetry and constant potential amperometry were 0.11 and 0.28
μA·cm-2·μM
-1 respectively, and the corresponding limits of detection were 22.95 and 0.98 μA
respectively. Constant potential amperometry was also used to evaluate stability, repeatability
and interference from other compounds. Wintergreen oil was used for real sample study to
establish the application of the bi-enzymatic biosensor for selective detection of plant pathogen
infections.
Keywords: Agricultural biosensor, Bi-enzymatic electrode, Methyl salicylate, Alcohol oxidase,
Horseradish peroxidase.

60
4.1 INTRODUCTION OF METHYL SALICYLATE AND ITS DETECTION
4.1.1 Methyl salicylate in plant metabolism and communication
As introduced in Chapter 1, an infected plant would produce various volatile organic compounds
(VOCs) in different amount as opposed to a healthy plant. The VOCs in infected plants are
produced through various metabolic pathways, such as octadecanoid pathway for fatty-acid
derived green leaf volatiles (GLVs), monoterpenes, diterpenes, sesquiterpenes, isothiocyanates
and a large diversity of aromatic metabolites. Among the various compounds in the volatile
signature of plants, methyl salicylate (MeSA) plays an important role during pathogenic
infections and infestations because it is released in large quantity for self-defense and
communication. Therefore, MeSA is a suitable target compound (marker) for detecting biotic
stresses of plants. MeSA is produced through Shikimate biosynthesis pathway, during a biotic
stress event such as the pathogenic infection and herbivorous infestation (Kessler and Baldwin
2001, Loake and Grant 2007). For instance, the generation of MeSA as a VOC has been
observed from Tetranychus urticae infested lima beans (De Boer and Dicke 2004, De Boer,
Posthumus et al. 2004, James and Price 2004, Pickett, Bruce et al. 2006), and soybean aphid-
infested soybeans (Zhu and Park 2005). In addition to infestation, production of MeSA is also
reported upon infections by bacteria, fungi and viruses. For example, MeSA is detected when
maize and pepper infected by Fusarium and Phytophthora capsici respectively (Buttery, Seifert
et al. 1969, Piesik, Lemńczyk et al. 2011) and when tobacco plants are infected with Tobacco
mosaic virus (TMV) (Seskar, Shulaev et al. 1998). Additionally, MeSA, is not only a signature
VOC that produces in large quantity, also an allelochemical that released not just at the site of
pathogen infection but throughout the plant through a systematic response. It is also one of the
key markers for volatile-based detection of fungal diseases such as fruit blight, leaf blight, crown

61
rot etc., which primarily affect cucurbit crops. Therefore, it is regarded as a suitable target
analyte for phytodisease detection in crops.
4.1.2 Current method of detecting methyl salicylate
Although MeSA is crucial in plant disease detection, like many other VOCs introduced before,
gas chromatography – mass spectrometry (GC-MS) is still the most commonly used technique.
However, this technique requires the sample to be collected in the field and analyzed elsewhere
in a laboratory. Moreover, the high cost of the instrument and complexity of the analysis prohibit
it from being used for on-field detection. Given to the advantages provided by electrochemical
biosensor introduced above, a type of bi-enzymatic biosensor was successfully developed and
reported in this chapter.
4.1.3 Application of enzymes
Although being an ester, MeSA is relatively stable and not electroactive on the electrode, which
renders difficulties in the direct measurement of MeSA electrochemically on the electrode.
However, the products after the hydrolysis (either chemically or enzymatically, which will be
introduced in Chapter 6) of MeSA can be detected on enzyme-immobilized biosensors.
Therefore, a type of bi-enzymatic biosensor was developed by using alcohol oxidase (AOD) and
horseradish peroxidase (HRP) for MeSA detection after hydrolysis.
The hydrolysis products from MeSA consist of both methanol and salicylate (SA). Therefore, the
amount of the MeSA of interest is proportional to the amount of methanol or SA that present in
the system after hydrolysis. The first pathway to detect the concentration of MeSA is to measure
the concentration of methanol after hydrolysis. In order to fulfill this objective, the
biorecognition elements consisting of two enzymes namely alcohol oxidase (AOD) and

62
horseradish peroxidase (HRP) were immobilized on a matrix of multiwalled carbon nanotubes
(CNTs). The immobilization was achieved through an in-house established molecular tethering
approach developed and evaluated through the previous experiments that introduced in Chapter 3.
The mechanism of the detection can be illustrated in Figure 4.1.
Figure 4.1: Schematic illustration of MeSA detection by AOD/HRP-immobilized electrode. Not
drawn to scale. The process begins with hydrolysis of MeSA to form methanol and SA,
oxidation of methanol and production of hydrogen peroxide, and direct electron transfer from
electrode to hydrogen peroxide by HRP.
The detection was carried out in three steps. First, MeSA was hydrolyzed in potassium hydroxide
(KOH) to generate SA and methanol (MeOH). The pH was adjusted to 7.6 by adding phosphoric
acid. Secondly, the enzyme AOD converts methanol into formaldehyde via its native
biochemical reaction, during which a simultaneous reaction that reducing oxygen to hydrogen

63
peroxide takes place (Patel, Hou et al. 1981, Ozimek, Veenhuis et al. 2005). The last step
involves in the enzymatic reduction of hydrogen peroxide to H2O in present of HRP, which
results in an amperometric signal collected from the electrode through direct electron transfer
(DET) (Akkara, Senecal et al. 1991, Ghindilis, Atanasov et al. 1997, Veitch 2004). Therefore,
the amperometric signal is proportional to the concentration of the hydrolyzed MeSA.
4.2 MATERIALS AND METHODS
4.2.1 Materials
Alcohol oxidase (E.C. 1.1.3.13) from Pichia pastoris was purchased from Sigma Aldrich and
used as received. Horseradish peroxidase (specific activity 281 units/mg solid) was purchased
from Calbiochem Inc. Multiwalled carbon nanotubes (CNTs) were obtained from DropSens Inc
(Spain). 1-Pyrenebutanoic acid succinimidyl ester (PBSE) was purchased from Ana Spec Inc.
(Fremont, California, US) as cross-linker. Dimethylformamide (DMF) and sodium salicylate
were purchased from Acros Organics Inc. (New Jersey, US). Chemicals for the interference
study, such as cis-3-hexenol, hexyl acetate and cis-hexenyl acetate, are obtained from TCI
America (Portland, Oregon, US) and used as received. Wintergreen oil purchased from Piping
Rock Health Products was used for real-sample study. Methyl salicylate was used as received
from Sigma-Aldrich Inc. (St. Louis, MO, US). All other chemicals used in this project were of
the analytical grade. 0.1 mM potassium phosphate buffer (PB), pH 7.6 was used as the
electrolyte for all the experiments. All aqueous solutions were prepared in 18.2 MΩ nano-pure
de-ionized (DI) water. Electrolyte solutions were oxygenated by purging oxygen for 15 min prior
to each set of experiments.
64
4.2.2 Apparatus
Cyclic voltammetry (CV) and constant potential amperometry (CPA) were performed using CHI
920 c potentiostat. A conventional three-electrode system consisting a platinum wire as counter
electrode and 3 M Ag/AgCl as the reference electrode were used for electrochemical
measurements. Both glassy-carbon (GC) electrode and glassy-carbon rotating disc electrode
(RDE) from Pine Instrument Inc. were used as working electrode for different purposes. All
experiments were carried out at 25 ± 2 ºC.
4.2.3 Electrode preparation and electrochemical measurement
Both GC and RDE electrodes were surface polished on a polishing pad with 0.05 μm alumina
polishing powder for 5 min before each use. The electrodes were then cleaned with ultrasonic
cleanser and rinsed with DI water to remove the adhered polishing powder that attached to the
electrodes. The CNT suspension was prepared by ultrasonication of 1 mg of multiwalled CNTs
in 1 mL DMF for 1 h and the following electrode modification steps are shown in Figure 3.2.
The CNT modified electrodes were prepared by drop casting 8 μL (in 8 steps of 1 μL) for GC
and 12 μL (in 3 steps of 4 μL) for RDE followed by drying at 70 ºC. CNT modified electrodes
were placed on ice to cool down before applying 2 and 4 μL of 10 mM PBSE in DMF to allow
non-covalent linkage between CNT and PBSE. The electrodes were incubated for 15 min and
excessive PBSE was removed by rinsing with DMF and 20 mM potassium phosphate buffer, pH
7.6. HRP solution was prepared by dissolving 5 mg HRP lyophilized powder in 1 mL of 20 mM
potassium phosphate buffer, pH 7.6. The bi-enzyme solution was prepared by mixing 5 μL of
alcohol oxidase solution and 5 μL HRP solution. 10 μL of bi-enzyme solution was drop casted
on the electrode surface and incubated on ice for 30 min to allow the immobilization of enzymes
through covalent linkage. The electrodes were then rinsed with 20 mM potassium phosphate
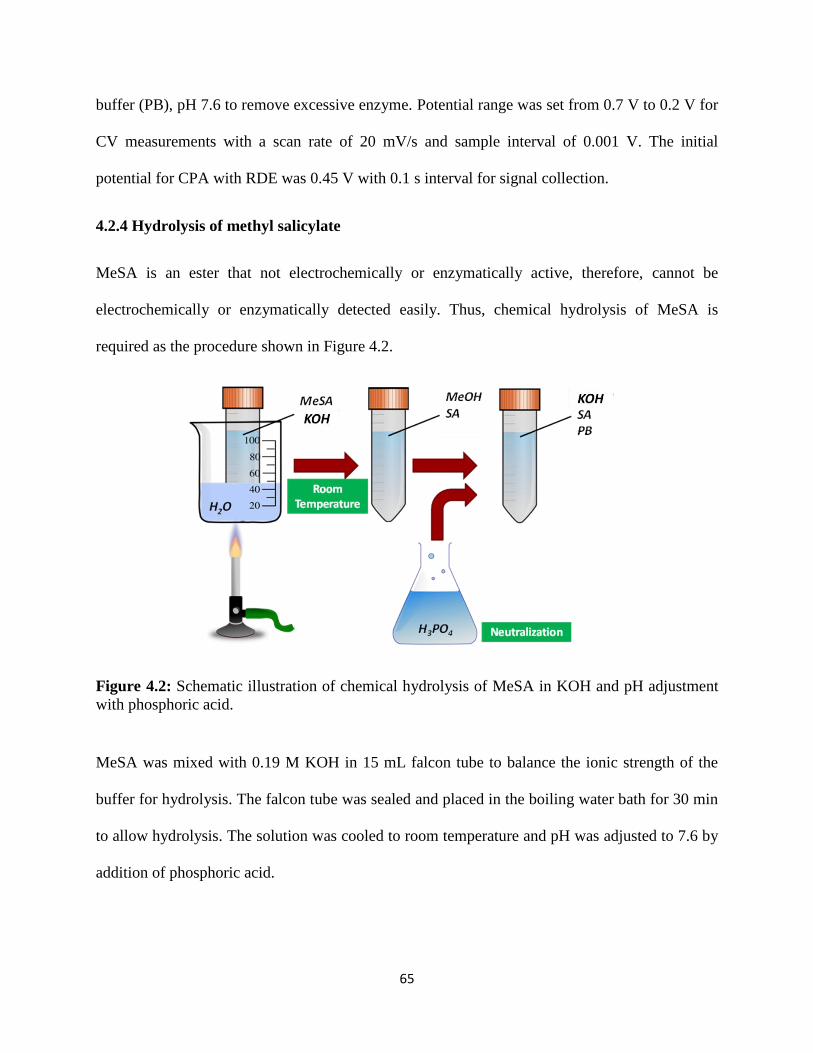
65
buffer (PB), pH 7.6 to remove excessive enzyme. Potential range was set from 0.7 V to 0.2 V for
CV measurements with a scan rate of 20 mV/s and sample interval of 0.001 V. The initial
potential for CPA with RDE was 0.45 V with 0.1 s interval for signal collection.
4.2.4 Hydrolysis of methyl salicylate
MeSA is an ester that not electrochemically or enzymatically active, therefore, cannot be
electrochemically or enzymatically detected easily. Thus, chemical hydrolysis of MeSA is
required as the procedure shown in Figure 4.2.
Figure 4.2: Schematic illustration of chemical hydrolysis of MeSA in KOH and pH adjustment
with phosphoric acid.
MeSA was mixed with 0.19 M KOH in 15 mL falcon tube to balance the ionic strength of the
buffer for hydrolysis. The falcon tube was sealed and placed in the boiling water bath for 30 min
to allow hydrolysis. The solution was cooled to room temperature and pH was adjusted to 7.6 by
addition of phosphoric acid.

66
4.3 RESULTS AND DISCUSSION
4.3.1 Cyclic voltammetry responses of AOD/HRP-immobilized electrode
As the mechanism of MeSA detection was based on the alcohol sensor in this project, the
biosensor was evaluated first for methanol detection using 3 mM methanol in the electrolyte. For
comparison, a CNT modified GC electrode immobilized with only one enzyme (either AOD or
HRP) as bio-recognition element was also evaluated as control experiments. As shown in Figure
4.3, the amperometric signal indicated by the reduction wave starting from 0.6 V (with a
reduction peak at 0.45 V) was observed only from the bi-enzyme immobilized biosensor. The
cathodic wave corresponds to the reduction of hydrogen peroxide to water, which was the last
step of cascadic reaction as described in Figure 4.1. No such reduction was observed in Figure
4.3 when any one of the two enzymes was absent on the electrode, indicating that the cascade
reaction do not proceed if one of the enzymes was absent and that the hydrogen peroxide was
formed as a result of cascade reactions. In addition, it also proved that none of oxidation and
reduction of methanol can be observed on electrode at the range of 0.2 V to 0.7 V. Therefore, the
amperometric signal could be solely attributed to the hydrogen peroxide reduction reaction by
HRP.
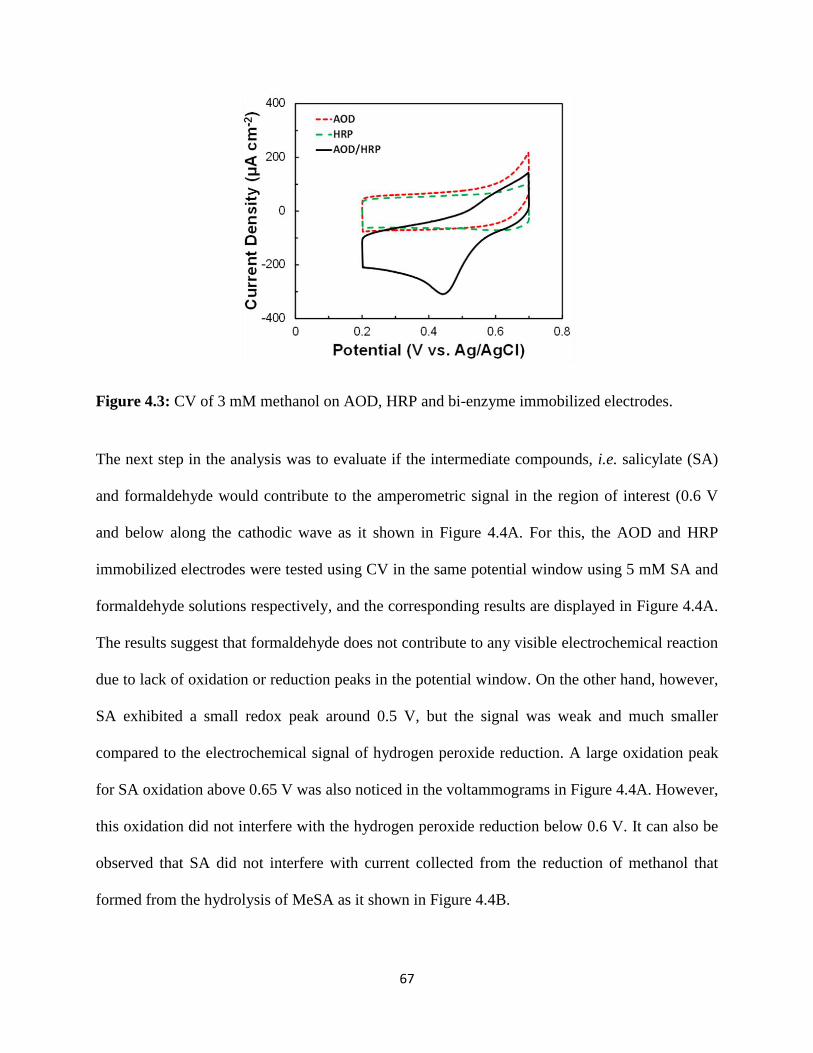
67
Figure 4.3: CV of 3 mM methanol on AOD, HRP and bi-enzyme immobilized electrodes.
The next step in the analysis was to evaluate if the intermediate compounds, i.e. salicylate (SA)
and formaldehyde would contribute to the amperometric signal in the region of interest (0.6 V
and below along the cathodic wave as it shown in Figure 4.4A. For this, the AOD and HRP
immobilized electrodes were tested using CV in the same potential window using 5 mM SA and
formaldehyde solutions respectively, and the corresponding results are displayed in Figure 4.4A.
The results suggest that formaldehyde does not contribute to any visible electrochemical reaction
due to lack of oxidation or reduction peaks in the potential window. On the other hand, however,
SA exhibited a small redox peak around 0.5 V, but the signal was weak and much smaller
compared to the electrochemical signal of hydrogen peroxide reduction. A large oxidation peak
for SA oxidation above 0.65 V was also noticed in the voltammograms in Figure 4.4A. However,
this oxidation did not interfere with the hydrogen peroxide reduction below 0.6 V. It can also be
observed that SA did not interfere with current collected from the reduction of methanol that
formed from the hydrolysis of MeSA as it shown in Figure 4.4B.
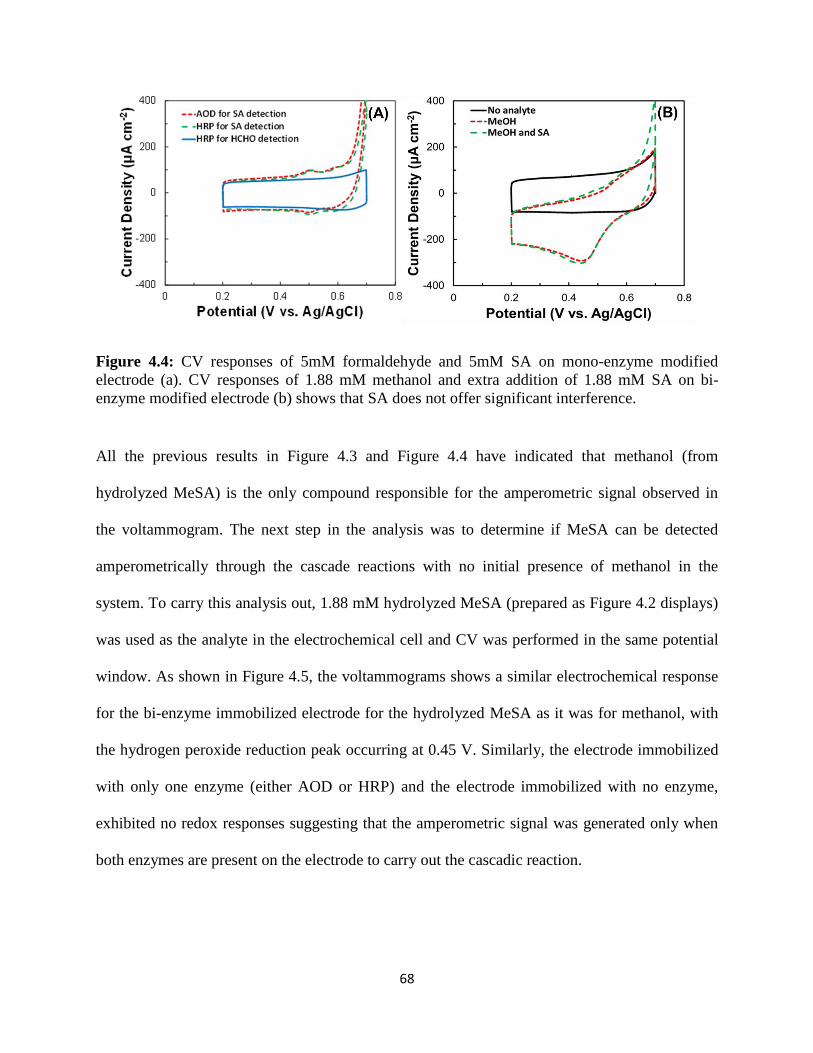
68
Figure 4.4: CV responses of 5mM formaldehyde and 5mM SA on mono-enzyme modified
electrode (a). CV responses of 1.88 mM methanol and extra addition of 1.88 mM SA on bi-
enzyme modified electrode (b) shows that SA does not offer significant interference.
All the previous results in Figure 4.3 and Figure 4.4 have indicated that methanol (from
hydrolyzed MeSA) is the only compound responsible for the amperometric signal observed in
the voltammogram. The next step in the analysis was to determine if MeSA can be detected
amperometrically through the cascade reactions with no initial presence of methanol in the
system. To carry this analysis out, 1.88 mM hydrolyzed MeSA (prepared as Figure 4.2 displays)
was used as the analyte in the electrochemical cell and CV was performed in the same potential
window. As shown in Figure 4.5, the voltammograms shows a similar electrochemical response
for the bi-enzyme immobilized electrode for the hydrolyzed MeSA as it was for methanol, with
the hydrogen peroxide reduction peak occurring at 0.45 V. Similarly, the electrode immobilized
with only one enzyme (either AOD or HRP) and the electrode immobilized with no enzyme,
exhibited no redox responses suggesting that the amperometric signal was generated only when
both enzymes are present on the electrode to carry out the cascadic reaction.

69
Figure 4.5: CV responses of 1.88mM hydrolyzed MeSA on bi-enzyme immobilized, AOD-
immobilized, HRP-immobilized and no enzyme immobilized electrodes.
The results also confirmed that the electrochemical reduction of hydrogen peroxide requires
presence of HRP, as no distinct signal for direct reduction of H2O2 was observed. Additionally,
no electrochemical signal was generated for direct oxidation of either methanol or SA in the
absence of enzyme. The results in Figure 4.5 demonstrate that only the bi-enzyme-immobilized
biosensor can be effectively used for MeSA detection after hydrolysis.
Since bi-enzymatic system was used to carry out MeSA detection, the optimal loading of
enzymes on the electrode was optimized by a series trial experiments with different mass ratios
of both enzymes (2.8 U AOD / 14.0 U HRP, 5.5 U AOD / 7.0 U HRP and 11.0 U AOD / 3.5 U
HRP), the results of which are giving in Figure 4.6.

70
Figure 4.6: CV responses of 1.88 mM hydrolyzed MeSA on GC electrodes immobilized with
different ratio of AOD and HRP.
Although all three ratio combinations display successful detection of hydrolyzed MeSA, the
optimal mass ratio was determined to be 5.5 units of AOD and 7 units of HRP (1:1 mass ratio of
AOD:HRP) on the CNT modified electrode due to the highest hydrogen peroxide reduction peak
it displayed.
4.3.2 Electrochemical responses of the AOD/HRP-immobilized biosensor
The amperometric responses of the bi-enzyme immobilized electrode at different concentration
of hydrolyzed MeSA were analyzed using both CV and CPA using RDE. The 11 different
concentrations of the hydrolyzed MeSA from 1 μM to 3 mM were studied by stepwise addition
of hydrolyzed MeSA. The solution was mixed well and stabilized for 10 seconds before each
measurement was made. The above concentration was chosen based on a series of experiments
where the lowest limit was based on the noticeable increase in the reduction current upon an
incremental addition of hydrolyzed MeSA into the electrolyte. Similarly, the upper concentration
boundary limit was chosen based on the rate of decrease in oxidation current during subsequent

71
additions of hydrolyzed MeSA. Voltammograms shown in Figure 4.7 indicate that before the
addition of hydrolyzed MeSA no reduction peak of methanol was observed. When the
concentration of hydrolyzed MeSA in the electrolyte increased by stepwise addition of 10 μM
and higher, noticeable hydrogen peroxide reduction waves were clearly observed starting from
0.6 V with a prominent peak appear around 0.45 V. It was also obvious that the peak increased
as the increasing concentration of hydrolyzed MeSA in the electrolyte. Another oxidation peak
around 0.5 V also appeared the concentration of hydrolyzed MeSA increased above 1 mM,
which could be attributed to the oxidation of SA present in the hydrolyzed MeSA.
Figure 4.7: CV responses of hydrolyzed MeSA from 0, 1 μM to 3 mM on bi-enzyme modified
GC electrode.
In order to quantitatively characterize the sensor behavior, amperometric sensor parameters such
as sensitivity, limit of detection (LOD), and limit of quantification (LOQ) can be derived from
the following equations.
Sensitivity (μA ∙ M−1 ∙ cm−2) = Slope of calibration curve (μA ∙ M−1)
Area of electrode (cm2)
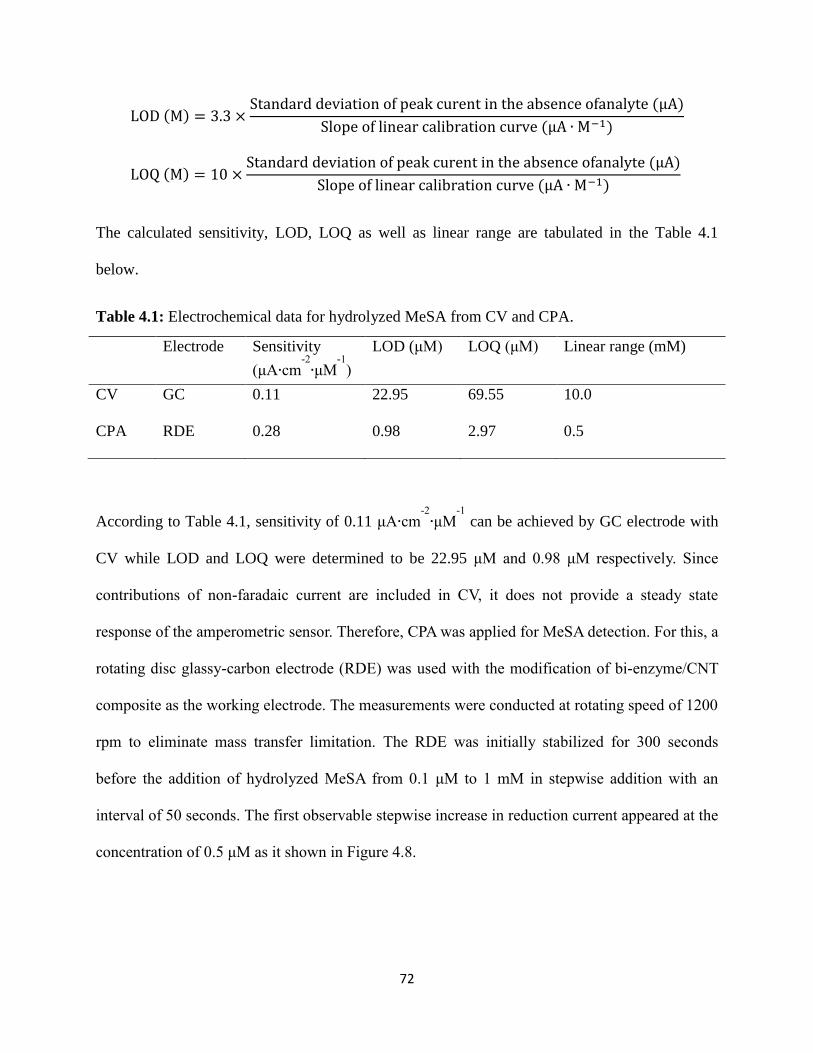
72
LOD (M) = 3.3 ×Standard deviation of peak curent in the absence ofanalyte (μA)
Slope of linear calibration curve (μA ∙ M−1)
LOQ (M) = 10 ×Standard deviation of peak curent in the absence ofanalyte (μA)
Slope of linear calibration curve (μA ∙ M−1)
The calculated sensitivity, LOD, LOQ as well as linear range are tabulated in the Table 4.1
below.
Table 4.1: Electrochemical data for hydrolyzed MeSA from CV and CPA.
Electrode Sensitivity
(μA∙cm-2
∙μM-1
)
LOD (μM) LOQ (μM) Linear range (mM)
CV GC 0.11 22.95 69.55 10.0
CPA RDE 0.28 0.98 2.97 0.5
According to Table 4.1, sensitivity of 0.11 μA∙cm-2
∙μM-1
can be achieved by GC electrode with
CV while LOD and LOQ were determined to be 22.95 μM and 0.98 μM respectively. Since
contributions of non-faradaic current are included in CV, it does not provide a steady state
response of the amperometric sensor. Therefore, CPA was applied for MeSA detection. For this, a
rotating disc glassy-carbon electrode (RDE) was used with the modification of bi-enzyme/CNT
composite as the working electrode. The measurements were conducted at rotating speed of 1200
rpm to eliminate mass transfer limitation. The RDE was initially stabilized for 300 seconds
before the addition of hydrolyzed MeSA from 0.1 μM to 1 mM in stepwise addition with an
interval of 50 seconds. The first observable stepwise increase in reduction current appeared at the
concentration of 0.5 μM as it shown in Figure 4.8.

73
Figure 4.8: CPA responses of hydrolyzed MeSA from 0, 0.1 μM to 1 mM on bi-enzyme
modified RDE electrode.
The corresponding electrochemical parameters such as sensitivity, LOD, LOQ and linear range
can be found in Table 4.1. The results suggest a higher sensitivity can be achieved from CPA
(0.28 μA∙cm-2
∙μM-1
) as opposed to that from CV (0.11 μA∙cm-2
∙μM-1
). In addition to the increase
of sensitivity, both LOD and LOQ were improved to 0.98 μM and 2.97 μM respectively as
opposed to 22.95 μM and 69.55 μM respectively from CV. To put the LOD into practical
meaning, a typical MeSA release rate by plants is 283 ng∙h-1∙plant-1
(Shulaev, Silverman et al.
1997). At this typical rate, only 1.05 hours are needed to collect enough VOCs released by the
diseased plants to reach 0.98 μM of MeSA in a 2 mL electrochemical cell for plant disease
detection. Although the linear range of CPA was narrower than that of CV, it is still a preferable
amperometric technique based on other estimated parameters.

74
4.3.3 Interference study of AOD/HRP-immobilized biosensor
MeSA is not the only VOC that released by the plants under biotic stresses. Other VOCs such as
green leaf volatile volatiles (GLVs) that are non-specific to pathogen infection or pest
infestations are also released at high concentrations, which could render interference during
MeSA measurement. Therefore, a representative set of such VOCs including cis-3-hexenol,
hexyl acetate and cis-3-hexen-1-yl acetate were used to determine the electrochemical effect of
interference on the biosensor response using CPA. The bi-enzyme modified RDE was pre-
conditioned with constant potential for 300 seconds until it stabilized. Then hydrolyzed MeSA
was added in the electrochemical cell to maintain a working concentration of 50 μM, which is in
the middle of linear range. The RDE was further stabilized for another 500 seconds before
different concentrations of GLVs from 10 μM to 1 mM at a 50-second interval. This procedure
was repeated for four times for all three GLVs as well the same volume of 0.1 M phosphate
buffer (PB), pH 7.6 as the negative control. The interference data of current versus time is shown
in Figure 4.9.
Figure 4.9: Interference of cis-3-hexenol, hexyl acetate and cis-3-hexyn-1-yl acetate by CPA (A)
and its enlargement from 500 to 800 seconds (B). PB was used as the negative control.

75
While the typical GLV concentration is about 10 μM for cis-3-hexenol, 1 μM for hexyl acetate
and 20 μM for cis-hexen-1-yl acetate (Umasankar, Rains et al. 2012), a wider concentration
range for studying the GLVs (from 0 to 1 mM) interference was used to simulate the extreme
case of GLV production (Danner, Boeckler et al. 2011). The original interference study
information can be observed from Figure 4.9A, where the variation in amperometric current
density of the biosensor was plotted against time during stepwise increase of the GLVs (cis-
hexenol, hexeyl acetate and cis-3-hexenyl acetate) concentration in presence of 50 μM of
hydrolyzed MeSA. To account the decrease of current density due to the dilution of hydrolyzed
MeSA during the addition of GLV solutions, a control interference study was also performed by
addition of potassium phosphate buffer (PB), pH 7.6 to mimic the electrolyte volume change. As
it shows in Figure 4.9B, the decrease in the current density values during the stepwise addition of
PB in control experiment could be attributed to the dilution effects arising from the stepwise
addition, as the buffer itself does not contribute to the interference study. On the other hand, CPA
current density signals slightly increased in the presence of GLVs compare to the control
experiment.

76
Figure 4.10: Percentage of current density interference caused by GLVs: cis-3-hexenol, hexyl
acetate and cis-3-hexen-1-yl acetate at different concentrations.
Figure 4.10 shows the percentage rate of interference compounds at different testing
concentrations, which range from 0 (for 0 μM of GLVs) to 2.36 %, 2.14% and 3.43 %
respectively (for 100 μM of cis-3-hexenol, hexyl acetate and cis-3-hexen-1-yl acetate) as
reported in Table 4.2.
Table 4.2: Current density interference of different concentration of GLVs in 50 μM in
hydrolyzed MeSA.
Concentration
of GLV (μM)
Current density interference percentage in 50 μM hydrolyzed MeSA (%)
cis-3-Hexenol Hexyl Acetate cis-3-Hexenyl Acetate
0 0 0 0
10 0.03 0.39 0.37
50 0.98 0.22 -0.03
100 2.36 2.14 3.43
250 3.04 1.94 3.46
500 6.11 3.49 6.95
1000 10.30 6.50 11.59

77
Since 100 μM of GLVs represent is about two orders of magnitude higher than typical
concentrations of GLVs, we could conclude that none of the interference compound tested in this
study has the significant impact on the hydrolyzed MeSA detection on the bi-enzymatic
biosensor. Additionally, it is obvious that the interference behavior of cis-3-hexenol and cis-3-
hexenyl acetate at high concentrations was similar, which can be explained by the generation of
cis-3-hexenol after the hydrolysis of cis-3-hexenyl acetate. The interference of cis-3-hexenol and
cis-3-hexenyl acetate was due to the enzymatic activity of alcohol oxidase towards the alcohol –
cis-3-hexenol, although the activity of alcohol oxidase towards cis-3-hexenol is substantially
lower compared to methanol due to its longer alkene chain.
In addition to the above-mentioned compounds, methanol, which produced by C3 plants, could
also potentially interfere with MeSA detection, since the detection of MeSA by AOD/HRP sensor
was based on the methanol that formed after hydrolysis. Therefore, the sensor was primarily
developed for C4 plants, such as corns (Fall and Benson 1996). Previous research publications
have indicated that significant amount of MeSA release by juvenile corn plant (Zea mays) was
reported without methanol generation. In addition, the developed biosensor can also be used for
crops, such as tobacco, as the methanol release level by tobacco crop is negligible compared to
the quantity of MeSA (Shulaev, Silverman et al. 1997, Bernasconi, Turlings et al. 1998).
Moreover, the biosensor can also be applied to methanol-releasing plants, if the volatile sample
is pretreated to remove the contained methanol (Premkumar and Krishnamohan 2010).
4.3.4 Stability and repeatability of AOD/HRP-immobilized biosensor
Stability of the bi-enzymatic biosensor was evaluated for 11 days based on the appearance of
significant amperometric current signal decrease over time. To fulfill this, the measurement was
carried out with bi-enzyme modified RDE by using CPA and the current density from 50 μM

78
hydrolyzed MeSA, which is the concentration in the middle of the detection linear range, was
collected before and after addition of the hydrolyzed MeSA. The RDE was then stored in 0.1 M
PB, pH 7.6 at 4 ºC and the stability evaluations were conducted on day 1, 2, 3, 4, 8, and 11 by
following the same procedure. The original results of the stability evaluation are displayed in
Figure 4.11.
Figure 4.11: Stability of bi-enzyme modified electrode with 50 μM hydrolyzed MeSA from day
1 to day 11. The inset shows the retention of initial current density over time.
The results of the stability demonstrate that the current density from for H2O2 reduction
decreased gradually over 10 days as the current density discrepancy before and after the addition
of hydrolyzed MeSA decreased over time.
Table 4.3: Stability study of bi-enzyme modified electrode with 50 μM hydrolyzed MeSA.
Time (Day) Current Density (μA cm-2
) Current Density Retained (%)
1 16.42 100
2 15.64 95.27
3 16.17 98.52
5 15.47 94.27
8 14.85 90.44
11 12.99 79.13

79
Table 4.3 displays the net current density (the current density discrepancy before and after the
addition of hydrolyzed MeSA) dropped from 100 % to 95.27 % within 1 day. However, the
biosensor behaved relatively stable with very little current variations. The amperometric signal
current was above 90 % of the initial value even after 7 days of storage. However, the current
density sharply decreased to 79% after 10 days of storage, which could be attributed to the loss
of enzyme activity. Since the biosensor was designed for one-time testing, the stability data here
shows satisfactory retention of signal stability by the bi-enzyme biosensor for 7 days.
In addition to stability study, repeatability performance of the biosensor was also conducted. The
experiments were carried out on the bi-enzyme modified RDE using 50 μM hydrolyzed MeSA
was applied as the analyte. The measurements were repeated for 6 times in total with preparing
the enzyme modified RDE for each time. The repeatability data shown in Figure 4.12 below
display that the current density differed slightly between each measurements, which could be
attributed to the systematic variances as well as the slight change in enzyme orientation on the
electrode – the enzyme could orient itself in different ways upon immobilization on the electrode
surface, and therefore, the active site of the enzyme could be either exposed to the electrolyte
side or facing down the electrode.

80
Figure 4.12: Repeatability of bi-enzyme modified electrode with 50 μM hydrolyzed MeSA. Six
replicates have been tested for repeatability evaluation.
The variation of the enzyme orientation upon each modification could affect the substrate
specific binding and reaction due to mass transfer limitation, thereby, causing small variances in
the electrochemical performance of the biosensor in each set of experiments. Relative standard
deviation (RSD) was calculated from the variances of the net current density (the current density
difference before and after the addition of hydrolyzed methyl salicylate) in six replicates. The
RSD for the repeatability experiments was 6.6 %, which is quite acceptable based on enzyme-
based sensors.
4.3.5 Real sample study for methyl salicylate detection
Real sample study was conducted to evaluate reliability of the bi-enzyme biosensor on a native
analyte containing MeSA. Wintergreen oil essentially contains 98 % of MeSA, which is
produced by the enzymes of the wintergreen plant upon biotic and abiotic stresses. Wintergreen
oil was hydrolyzed as stated before to generate enzymatic active SA and used as the analyte for

81
real-sample studies. However, MeSA is not naturally presented in the wintergreen plants, it can
only be produced enzymatically from a glucoside within the leaves when macerated in warm
water. Therefore, wintergreen oil was introduced to simulate the situation when plant produces
MeSA due to plant infection. Different quantities of hydrolyzed wintergreen oil containing 98 %
of MeSA was added stepwise to the electrochemical cell to maintain a final concentration of 0.1,
0.5, 1, 2.5, 5, 10, 25, 50 and 100 μM (i.e. the corresponding concentration of MeSA in the
wintergreen oil is 0.098, 0.49, 0.98, 2.45, 4.9, 9.8, 24.5, 49 and 98 μM). The electrochemical
signals were collected and the same experiment was repeated for three times. In addition, pure
MeSA solution, after the hydrolysis using the same protocol, was added to maintain the same
concentration of 0.1, 0.5, 1, 2.5, 5, 10, 25, 50 and 100 μM and the data was collected as standard
working curve to determine the calculated concentration of MeSA from wintergreen oil. As it
shows in Figure 4.13, three replicates of measurements obtained from hydrolyzed wintergreen oil
display the same trend of that from the hydrolyzed pure MeSA.

82
Figure 4.13: CPA of the RDE upon the stepwise addition of hydrolyzed wintergreen oil (3
replicates) resulting in concentrations of 0.1, 0.5, 1, 2.5, 5, 10, 25, 50 and 100 μM (98% MeSA)
wintergreen oil. Control experiment / standard curve using pure MeSA at identical concentration
gradients (black curve) is also displayed for comparison.
The standard concentration of from the wintergreen oil, the calculated concentration of MeSA, as
well as the recovery are tabulated in Table 4.4.
Table 4.4: Standard concentration, calculated concentration, recovery, standard deviation (SD)
and RSD of hydrolyzed wintergreen oil for real sample study.
Std. conc. (μM) Cal. conc. (μM) Recovery (%) SD (μM) RSD (%)
2.45 2.24 91 0.28 12.38
4.90 5.78 118 0.28 4.90
9.80 12.64 129 0.29 2.29
24.5 31.38 128 0.96 3.06
49.5 59.81 122 2.71 4.53
As seen in Table 4.4, the recovery obtained from the standard MeSA concentration and
calculated MeSA concentration varies from 91 % to 122 %. The bias could be attributed to the

83
presence of other electrochemical active compounds in wintergreen oil such as α-pinene,
myrcene, δ-3-carene, limonene, 3,7-guaiadine and δ-cadinene reacted directly on the electrode
(Gurung 2007). Thus, the specificity of the electrode needs to be improved in the future work.
From the RSD values in Table 4.4, it can be concluded that the current signals are highly
repeatable when the concentration is around the middle point of the linear range (e.g. 49 μM). It
is also noteworthy that since the wintergreen oil is purified from the wintergreen oil leaf, it
contains more compounds than the common VOCs that released to the air. Therefore, less false
positive could be expected if VOC samples are used as analyte.
4.4 CONCLUSION
A bi-enzyme based amperometric electrochemical biosensor has been developed using AOD and
HRP with established immobilization strategy. The biosensor demonstrated its capability of
MeSA, a common VOC released by various plants under biotic stresses such as infestations and
pathogen infections. The biosensor performance was characterized by both CV and CPA, among
which, CPA demonstrated higher sensitivity and better LOD and LOQ, which allows for faster
sample collection and detection of MeSA released from the stressed plants. The sensitivity and
limit of detection successfully demonstrated the application potential for on-field MeSA
detection. Wintergreen oil was applied for real-sample study, demonstrating the recovery of the
MeSA detection varies from 91 % to 122 %, indicating that the specificity of the biosensor needs
to be improved in the future work.

84
CHAPTER 5
DETECTION OF METHYL SALICYLATE USING SALICYLATE HYDROXYLASE /
TYROSINASE – BASED BIOSENSOR
This chapter contains text modified from the following publications:
Yi Fang et al. 2016. Biosensors and Bioelectronics 85: 603-610.
Reprinted here with permission of the publisher.

85
Abstract
Volatile organic compounds have been recognized as important bio-marker chemicals to detect
plant diseases caused by pathogens. Methyl salicylate has been identified as one of the most
important volatile organic compounds released by plants during a biotic stress event such as
fungal infection. Advanced detection of these marker chemicals could help in early identification
of plant diseases and has huge significance for agricultural industry. This chapter describes the
development of a novel bi-enzyme based electrochemical biosensor consisting salicylate
hydroxylase and tyrosinase enzymes immobilized on carbon nanotube modified electrodes. The
amperometric detection using the bi-enzyme platform was realized through a series of cascade
reactions that terminate in an electrochemical reduction reaction. Electrochemical measurements
revealed that the sensitivity of the bi-enzyme sensor was 30.6 ± 2.7 µA·cm-2·µA
-1 and the limit
of detection and limit of quantification were 13 nM and 39 nM respectively. Interference studies
showed no significant interference from the other common plant volatile organic compounds.
Synthetic analyte studies revealed that the bi-enzyme based biosensor can be used to reliably
detect methyl salicylate released by unhealthy plants.
Keywords: Methyl salicylate, Biosensor, Salicylate hydroxylase, Tyrosinase, Volatile organic
compound.
86
5.1 INTRODUCTION
5.1.1 Salicylate hydroxylase and tyrosinase as bi-enzyme system
Although the bi-enzymatic biosensor based on alcohol oxidase and horseradish peroxidase was
successfully developed as discussed in Chapter 4, efforts to improve the sensitivity, limit of
detection (LOD), limit of quantification (LOQ) and specificity, required better biosensor
performance for methyl salicylate (MeSA) detection. In this chapter, a more selective enzyme
combination for bi-enzymatic biosensor based on salicylate hydroxylase (SH) and tyrosinase
(TYR) was used to improve the sensitivity and prevent unwanted cross-reaction that may result
in the false positive signals. Salicylate (SA), a main compound formed after hydrolysis of MeSA,
can be electrochemically detected using SH as the recognition element with high selectivity. The
enzyme is immobilized through the methods described in the previous Chapter 4. SH is an FAD-
dependent monooxygenase that converts SA to catechol in the presence of NADH and oxygen
(Katagiri, Maeno et al. 1965, Yamamoto, Katagiri et al. 1965). Although SA acts as the natural
substrate for SH, other pseudo-substrates such as benzoate derivatives can also be catalyzed by
SH, thus generating false positive result. This issue can be addressed by introducing a second
enzyme – TYR in the bio-recognition element, in order to build an enzyme cascade that provides
highly selective MeSA detection. Additionally, as per the results discussed in Chapter 3, TYR
not only could improve the specificity, but also increase the sensitivity for substrate detection.
The stepwise reaction mechanism behind the MeSA is illustrated in Figure 5.1.
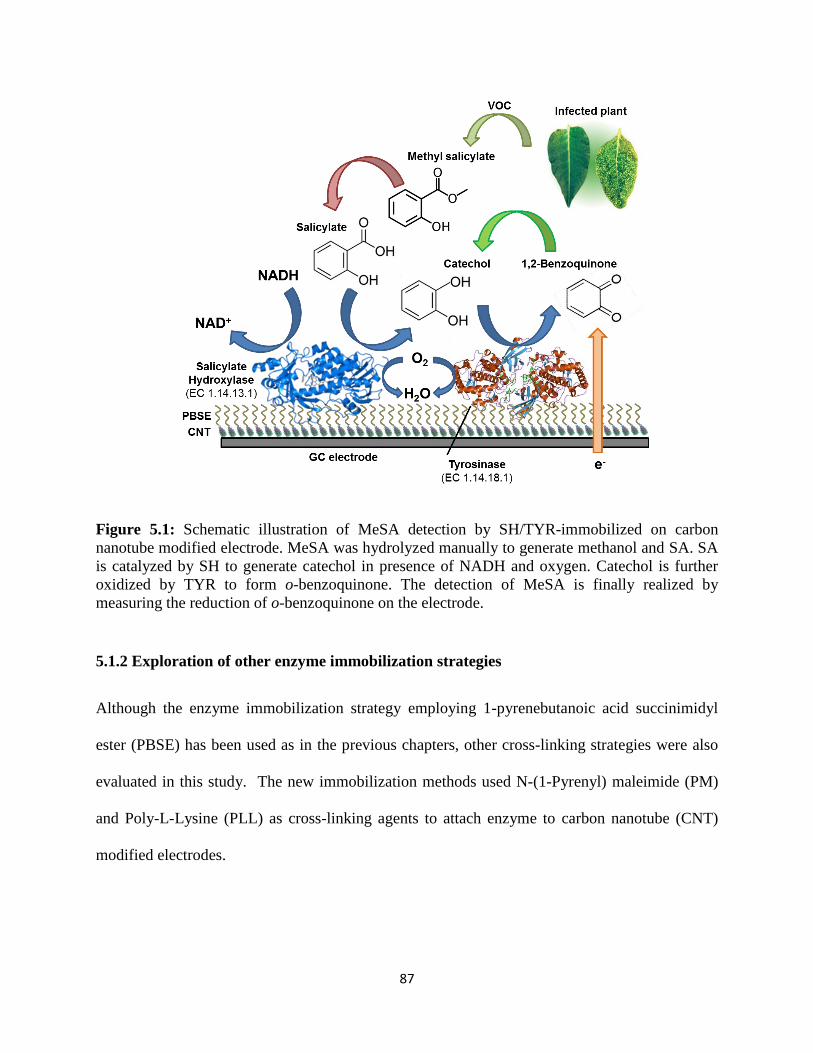
87
Figure 5.1: Schematic illustration of MeSA detection by SH/TYR-immobilized on carbon
nanotube modified electrode. MeSA was hydrolyzed manually to generate methanol and SA. SA
is catalyzed by SH to generate catechol in presence of NADH and oxygen. Catechol is further
oxidized by TYR to form o-benzoquinone. The detection of MeSA is finally realized by
measuring the reduction of o-benzoquinone on the electrode.
5.1.2 Exploration of other enzyme immobilization strategies
Although the enzyme immobilization strategy employing 1-pyrenebutanoic acid succinimidyl
ester (PBSE) has been used as in the previous chapters, other cross-linking strategies were also
evaluated in this study. The new immobilization methods used N-(1-Pyrenyl) maleimide (PM)
and Poly-L-Lysine (PLL) as cross-linking agents to attach enzyme to carbon nanotube (CNT)
modified electrodes.

88
5.1.2.1 1-pyrenebutanoic acid succinimidyl ester (PBSE) and N-(1-Pyrenyl) maleimide (PM)
Although the structure of both cross-linkers – PBSE and PM (as shown below) are similar in
many aspects (e.g. the same pyrene group and the similar structure of and succinimide and
maleimide), the mechanisms of enzyme immobilization are quite different due to their chemical
functionalities.
According to the structure of both cross-linkers – PBSE and PM, the binding of the pyrene group
(from PBSE and PM) with CNT can be realized through the non-covalent bond π–π stacking.
However, the cross-linking of PBSE and PM with enzyme is based on different mechanism – the
succinimidyl group from PBSE can be replaced by the amine group from the enzyme
(nucleophilic substitution reaction), while the alkene in maleimide from PM can be added by the
thiol group from the enzyme (thiol-ene addition reaction). Therefore, both PBSE and PM are
reported as hetero-bifunctional cross-linkers for enzyme immobilization.
5.1.2.2 Poly-L-Lysine (PLL)
In addition to the PBSE and PM, PLL, a polymer with a number of active primary amine groups,
is also developed as the cross-linker for protein immobilization due to its good biocompatibility,
flexible backbone and good water solubility. Some of the free amine groups on the PLL
covalently cross-link with carboxyl-modified CNTs while the other free amine groups cross-link
89
with the carboxyl groups on the proteins to allow the immobilization of protein on the CNT-
modified electrode. Accordingly, PLL becomes a homo-bifunctional cross-linking agent.
5.2 MATERIALS AND METHODS
5.2.1 Materials
Tyrosinase (E.C. 1.14.18.1) derived from mushroom (lyophilized powder, ≥ 1000 units / mg
solid), methyl salicylate and farnescene were purchased from Sigma-Aldrich (St. Louis, MO,
USA) and used directly as received. Humulene and tri-methylbenzene were obtained from
Aldrich. Multiwalled carbon nanotubes (MWCNTs) and carboxyl modified single-walled carbon
nanotubes (SWCNT-COOH) were purchased from DropSens Inc. (Spain) and used directly
without further purification. Sodium salicylate, NADH and methylformamide (DMF) were
obtained from Acros Organics (NJ, USA). FAD and dichlorobenzene were purchased from Alfa
Aesar (Haverhill, MA, USA) and Eastman (Kingsport, TN, USA) respectively. 1-Pyrenebutanoic
acid succinimidyl ester (PBSE) and N-(1-Pyrenyl) maleimide (PM) were obtained from AnaSpec
Inc. (Fremont CA, USA). Poly-l-lysine (PLL), dicyclohexylcarbodiimide (DCC), and 1-(3-
demethylaminopropyl)-3-ethylcarbodiimide hydrochloride (EDC) were purchased from Sigma,
Aldrich and Alfa Aesar respectively for cross-linking evaluation. Methanol was obtained from
Fisher Scientific (Waltham, MA, USA). All reagents used in the project were analytical grade
unless other specification. 0.1 M potassium phosphate buffer (PB, pH 7.6) was used as the
electrolyte for all experiments. All aqueous solutions were prepared in 18.2 MΩ nano-pure de-
ionized (DI) water. Solutions were oxygenated by purging with oxygen for 15 min before
experiments.
90
5.2.2 Apparatus
Cyclic voltammetry (CV) and constant potential amperometry (CPA) were performed using CHI
920 c model potentiostat. A glassy-carbon (GC) electrode purchased from Pine Instrument
Company was used as working electrode for all experiments. Additionally, a 3 M Ag/AgCl
electrode and a platinum wire were also used as reference and counter electrodes respectively to
form a traditional three-electrode system together with working electrode for carrying out all
electrochemical experiments in a conventional glass voltammetry cell. All experiments were
conducted at 22 ± 2 ºC.
5.2.3 Recombinant synthesis and purification of salicylate hydroxylase
SH has been discontinued from manufacturer and is not commercially available, therefore,
synthesis and purification of SH with high activity with SA became the first task of the project.
Gene nahG that codes for expression of SH was initially discovered in Pseudomonas putida
(You, Ghosal et al. 1991). The nahG gene was codon optimized for expression in Escherichia
coli and the gene sequence was sent to and synthesized by GenScript (Appendix A). Different
cloning strategies were carried out with different primer designs to ensure that the failure of
enzyme expression or activity could be dealt with.
5.2.2.1 Primer design for polymerase chain reaction (PCR)
Although the nahG gene was synthesized by GenScript in pUC57 plasmid, it does not contain
any bio-affinity tag which renders difficulties for the future purification from the crude extract of
the E.coli, therefore, cannot be directly used for transformation. Polyhistidine-tag (His-tag) is an
amino acid motif that consists of at least six histidine (His) residues. It is commonly constructed
in protein at either the N- or C-terminus of the protein. The His-tag on the recombinant protein

91
binds with affinity resin containing bound divalent nickel ions in the purification column while
other expressed proteins that do not bind with the resin due to the lack of His-tag were removed
by phosphate buffer with 5 mM of imidazole. The bound recombinant protein can be eluted by
phosphate buffer (PB) with high concentration of imidazole (500 mM), which can compete with
the His-tag to bind with the resin. The DNA primers were designed with 6 × histidine tag (His-
tag) before the PCR amplification to allow the future purification from other proteins / enzymes
that expressed by the E.coli. The His-tag was added on either C-terminus or N-terminus of the
protein (Appendix B).
5.2.2.2 Construction of recombinant plasmid pTrc99a-nahG
The pUC57-nahG synthesized by GenScript was used as the template for PCR amplification, and
both sets of primers (one set with His-tag on C-terminus and the other set with His-tag on N-
terminus) were used (Appendix C). The PCR product was examined by the agarose gel and nahG
gene was harvested before restriction enzymes – BamHI and HindIII were applied to clone the
gene into the restriction enzyme-treated plasmid pTrc99A (Appendices C and D). The
recombinant plasmid pTrc99A-nahG was constructed by cloning the nahG gene into pTrc99A
that harbors ampicillin resistance gene (ampR) as an antibiotic selection marker. The recombinant
plasmid containing gene nahG-histidine tag was then transformed into E. coli XL 1-blue through
electroporation at the potential of 1800 V. The resultant E.coli suspension was plated on the
ampicillin-containing (100 μg/mL) agar LB plate for transformant selection for future enzyme
expression purposes. The resultant transformants of E. coli XL 1-blue were inoculated in test
tubes, where each contains 3 mL LB media with ampicillin concentration of 100 μg/mL. The
strains were cultured overnight aerobically at 37 ºC and each overnight culture was further
inoculated into 250 mL fresh LB media with 100 μg/mL of ampicillin and left to grow at the

92
temperature of 37 ºC until the optical density at the wavelength of 600 nm (OD600) reached 0.6,
at which the E. coli reached log phase. The expression of nahG gene to synthesize SH was under
the control of Plac promotor and was induced by addition of isopropyl β-D-1-
thiogalactopyranoside (IPTG). 1 mM of IPTG was added to initiate the expression of salicylate
hydroxylase at 20 ºC for 8 h Figure 5.2 shows the schematic illustration of the procedures
involved in cloning and expression of nahG in E. coli.
Figure 5.2: Schematic illustration of procedures involved in cloning and expression of
recombinant nahG in E. coli: construction of recombinant plasmid using pTrc99A vector and
nahG with 6 × histidine tag, transformation and expression of SH via IPTG induction. Not drawn
to scale.
Cell pellets were harvested by centrifugation at 6000 rpm for 10 min. The cell pellets were
resuspended and rinsed with 20 mM potassium phosphate buffer (PB), pH 7.6 twice to remove
excess media before being lysed though the French Press. The lysed E. coli suspension was
further centrifuged at 8000 rpm for 15 min and the supernatant was collected as the crude extract
of SH. The crude extract was purified through fast-protein chromatography (FPLC) with

93
HisTrapTM
HP column. The elution procedure was carried out with 20 mM PB, pH 7.6 with 5
mM imidizole as binding buffer (Buffer A) which allows the nickel-histidine binding on the
HisTrapTM
HP column. The volume ratio of the elution buffer (Buffer B) , which is 20 mM PB,
pH 7.6 with 500 mM was gradually increase to elute SH from the HisTrapTM
HP column due to
higher affinity of nickel ion on the column with imidazole rather than histidine tag on the column.
Different eluent fractions were collected in the fraction tubes and enzymatic activity was
reassured by a traditional enzyme assay with addition of FAD as cofactor (Appendix E)
(Yamamoto, Katagiri et al. 1965, White-Stevens and Kamin 1972). The fraction with highest
enzyme activity was added with glycerol to final concentration of 20 % and the enzyme stock
was frozen and stored at -80 ºC (You, Murray et al. 1990) for all future experiments.
5.2.4. Electrode preparation for SH/TYR immobilization
GC electrode was first polished on a polishing pad with 0.05 µm alumina polishing powder for 5
min before each experiment. The electrode was then cleaned by ultrasonic cleaner for 5 min to
remove the polishing powder adhered to the surface of electrode. The electrode was then rinsed
with de-ionized (DI) water before further electrode modifications were carried out.
5.2.4.1 Immobilization with 1-pyrenebutanoic acid succinimidyl ester (PBSE)
Multi-walled carbon nanotube (MWCNT) was prepared by ultrasonicating 1 mg of MWCNT in
1 mL DMF for an hour. The electrode was then modified with CNT by drop casting 16 µL (in 8
steps of 2 µL) followed by drying in oven after each addition. The electrode was allowed to cool
down on ice before 2 µL 10 mM PBSE in DMF was applied on the surface electrode for 15 min
to allow the non-covalent binding between PBSE and CNTs. DMF and 0.1 M PB, pH 7.6 were
consecutively used to remove the unattached PBSE from the electrode surface. A solution of

94
TYR was prepared by dissolving 5 mg TYR in 1 mL 20 mM PB, pH 6.6 and bi-enzyme solution
mixture was prepared by mixing 5 µL of previous prepared salicylate hydroxylase and 5 µL of
TYR solution. Bi-enzyme immobilized biosensor was fabricated by drop-casting 10 µL of bi-
enzyme solution on the electrode surface, and the electrode was incubated on the electrode for 30
min to allow covalent binding of PBSE and both enzymes. CV was performed after each step of
modification and immobilization and the capacitance displayed was used to illustrate the
modification procedures. For control study, mono-enzyme modified electrodes were prepared by
drop casting 5 µL of salicylate hydroxylase prepared previously instead of the enzyme mixture.
5.2.4.2 Immobilization with N-(1-Pyrenyl) maleimide (PM)
Similar to the immobilization protocol using PBSE, procedure of SH/TYR immobilization was
also carried out and evaluated using cross-linker PM instead of using PBSE. The electrode
cleaning protocol and CNT preparation method were exactly the same as introduced above in
Section 5.2.4.1 and 2 µL of 10 mM PM solution in DMF was used as the cross-linker instead of
PBSE.
5.2.4.3 Immobilization with poly-l-lysine (PLL)
The GC electrode was polished and cleaned as above mentioned in Section 5.2.4.1. Single-
walled carbon nanotubes modified with carboxyl group (SWCNT-COOH) were prepared by
ultrasonicating 1 mg of SWCNT-COOH in 1 mL DMF for an hour. 50 µL of the 1 mg/mL
SWCNT-COOH solution was modified with PLL by adding 0.5 µL of 200 mg/mL PLL solution
and 1.5 µL of 200 mg/mL DCC (in DMF) and incubated in oven at 50 ºC overnight. Three
parallel incubations were also made and incubated overnight with only addition of PLL, only
addition of DCC and no addition of DCC or PLL, respectively as negative control to evaluate the

95
effect of PLL immobilization. The incubated solution was drop casted on the electrode for a total
loading of 16 µL (in 8 steps of 2 µL) followed by drying in oven at 50 ºC after each addition.
The electrodes were rinsed with DMF to remove DCC and unimmobilized PLL. 5 µL SH, 5 µL
TYR and 5 µL of 60 mM EDC was mixed and drop casted on the electrode and the electrodes
were kept at 4 ºC for enzyme immobilization for 48 h. The electrodes were then rinsed by PB to
remove the unimmobilized enzyme. The immobilization of enzymes with PLL can be illustrated
briefly as Figure 5.3:
Figure 5.3: Schematic illustration of enzyme (SH and TYR) immobilization on CNT modified
GC electrode with PLL.
5.2.5 Electrochemical measurements
A CHI 920 c potentiostat was used for all the experiments. For CV measurements, the potential
was scanned from 0.4 V to -0.2 V to monitor the reduction current for bi-enzyme immobilized
electrode and from -0.2 V to 0.4 V to monitor the oxidation current for mono-enzyme

96
immobilized electrode. Sampling interval of 1 mV and scan rate of 20 mV/s were used for all CV
experiments. The initial potential for CPA was set to 0.025 V with 0.1 s interval for current
collection.
5.3 RESULTS AND DISCUSSION
5.3.1 Expression and purification of salicylate hydroxylase
Crude extract of SH synthesized from E.coli XL 1-blue cells was collected from the French Press
after homogenization and centrifugation as introduced previously. The crude extract was first
evaluated by traditional SH enzyme assay with addition of FAD as cofactor (Yamamoto,
Katagiri et al. 1965, White-Stevens and Kamin 1972) to calculate the enzyme activity and
specific activity. In addition, the protein concentration of SH was determined by Bradford Assay
to be ~ 35 mg of total protein in 4 mL (Kruger 1994, Kruger 2009). Catalytic assay revealed that
the total and specific activity of SH were ~ 23 units and 0.67 unit / mg of protein. After the
purification by fast-protein liquid chromatography (FPLC) with HisTrapTM
column, 0.73 mg of
protein with the total activity of 8.96 units was obtained. Although the purification yield was
only 39 %, the specific activity of SH increased approximately 19 fold to ~ 12.3 units/mg as it
shows in Table 5.1.
Table 5.1: Purification table of SH from E. coli XL 1-blue.
Step Vol (mL) Total
protein
(mg)
Total
activity
(unit)
Specific
activity
(unit/mg)
Purification
fold
Yield (%)
Crude
extract
4 34.8 23.3 0.67 (1) (100)
HisTrapTM
HP
2 0.73 8.96 12.34 19 39
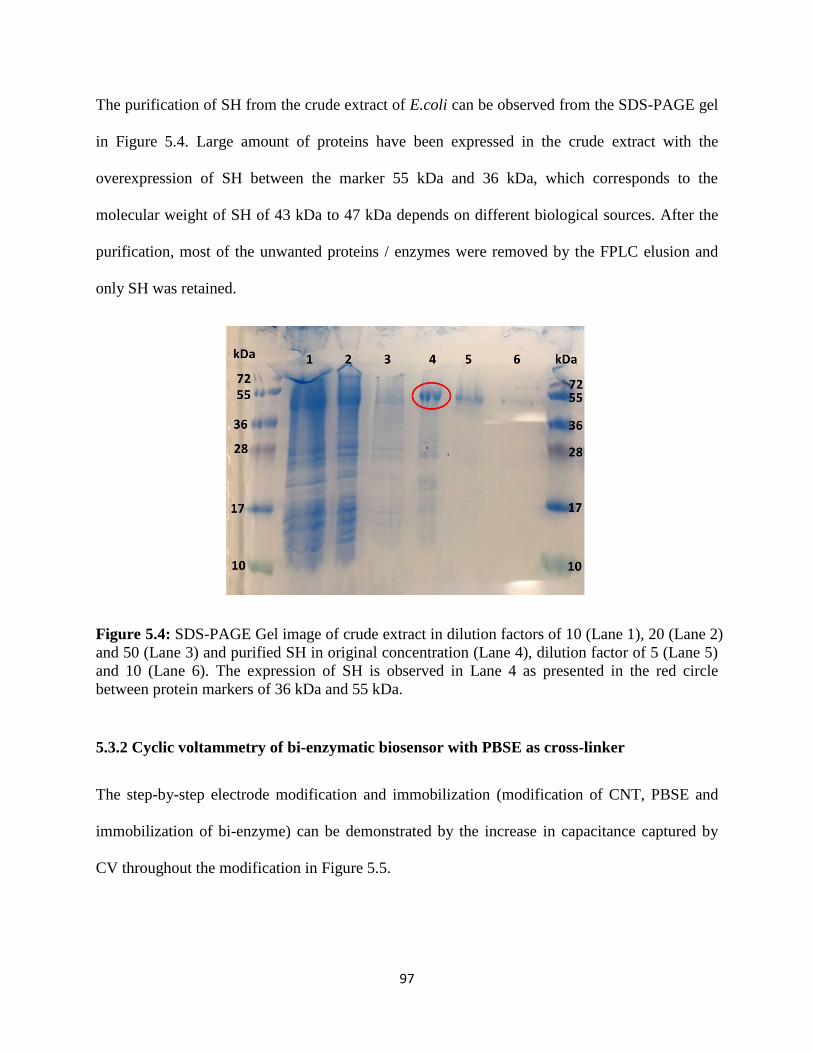
97
The purification of SH from the crude extract of E.coli can be observed from the SDS-PAGE gel
in Figure 5.4. Large amount of proteins have been expressed in the crude extract with the
overexpression of SH between the marker 55 kDa and 36 kDa, which corresponds to the
molecular weight of SH of 43 kDa to 47 kDa depends on different biological sources. After the
purification, most of the unwanted proteins / enzymes were removed by the FPLC elusion and
only SH was retained.
Figure 5.4: SDS-PAGE Gel image of crude extract in dilution factors of 10 (Lane 1), 20 (Lane 2)
and 50 (Lane 3) and purified SH in original concentration (Lane 4), dilution factor of 5 (Lane 5)
and 10 (Lane 6). The expression of SH is observed in Lane 4 as presented in the red circle
between protein markers of 36 kDa and 55 kDa.
5.3.2 Cyclic voltammetry of bi-enzymatic biosensor with PBSE as cross-linker
The step-by-step electrode modification and immobilization (modification of CNT, PBSE and
immobilization of bi-enzyme) can be demonstrated by the increase in capacitance captured by
CV throughout the modification in Figure 5.5.
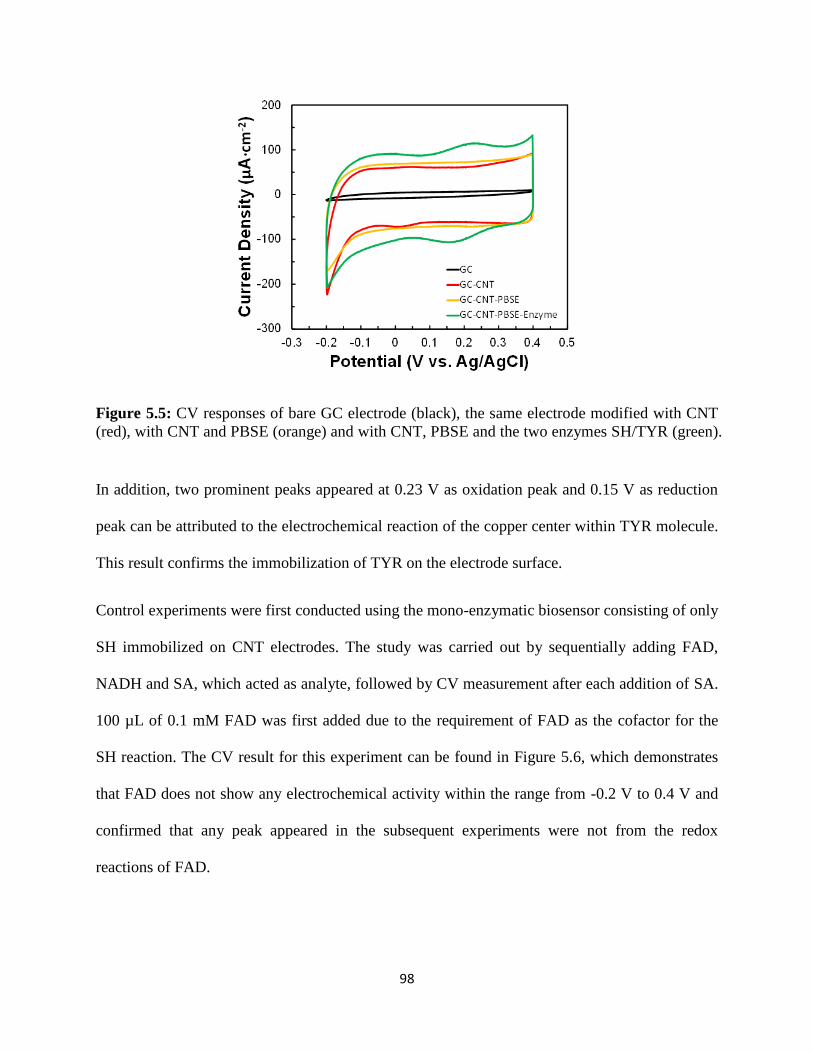
98
Figure 5.5: CV responses of bare GC electrode (black), the same electrode modified with CNT
(red), with CNT and PBSE (orange) and with CNT, PBSE and the two enzymes SH/TYR (green).
In addition, two prominent peaks appeared at 0.23 V as oxidation peak and 0.15 V as reduction
peak can be attributed to the electrochemical reaction of the copper center within TYR molecule.
This result confirms the immobilization of TYR on the electrode surface.
Control experiments were first conducted using the mono-enzymatic biosensor consisting of only
SH immobilized on CNT electrodes. The study was carried out by sequentially adding FAD,
NADH and SA, which acted as analyte, followed by CV measurement after each addition of SA.
100 µL of 0.1 mM FAD was first added due to the requirement of FAD as the cofactor for the
SH reaction. The CV result for this experiment can be found in Figure 5.6, which demonstrates
that FAD does not show any electrochemical activity within the range from -0.2 V to 0.4 V and
confirmed that any peak appeared in the subsequent experiments were not from the redox
reactions of FAD.

99
Figure 5.6: CV after sequential addition of 100 µL of 0.1 mM FAD (Red), 50 µL of 10 mM
NADH (Green) and 25 µM salicylate (Blue) on SH-immobilized mono-enzyme CNT electrode
consisting of SH.
Then 50 µL of 10 mM of NADH solution was added as the second cofactor for SH and the
electrochemical redox activity of NADH was observed using CV between the same potential
window. A small oxidation peak can be found around 0.2 V in Figure 5.6 due to the direct
oxidation of NADH to NAD+, which corresponds with early publications of direction
electrochemistry of NADH (Li, Wen et al. 2012, Li, Worley et al. 2012). In the next step, SA
was added to the electrolyte to maintain the final SA concentration of 25 µM and another CV
was performed to observe the electrochemical reaction. Under aerobic condition, SA would be
enzymatically reduced by SH to catechol while NADH would be oxidized to NAD+
simultaneously as per the reaction below.
Salicylate + NADH + 2H+ + O2
Salicylate Hydroxylase⇒ Catechol + NAD+ + H2O + CO2

100
The resulting CV response is displayed in Figure 5.6, where an oxidation peak at 0.15 V was
observed upon addition of 25 µM, which can be attributed to the peaks overlap from both
electrochemical oxidation of NADH and catechol on the electrode surface. Catechol is
electrochemically oxidized to 1,2-benzoquinone as per the following reaction at 0.15 V (Enache
and Oliveira-Brett 2011, Umasankar and Ramasamy 2013, Umasankar and Ramasamy 2014).
Catechol ⇒ 1,2 − Benzoquinone + 2e− + 2H+
For all the experiments, the reduction wave below -0.1 V could be attributed to the reduction of
dissolved oxygen present in the system.
Similar to the mono-enzymatic biosensor study discussed above, similar set of experiments was
also performed using the bi-enzymatic biosensor composed of both SH and TYR as recognition
elements. The study was carried out by sequential addition of FAD, NADH and SA followed by
CV measurement after each addition.
Figure 5.7: CV after sequential addition of 100 µL of 0.1 mM FAD (Red), 50 µL of 10 mM
NADH (Green) and 25 µM SA (Blue) on SH/TYR-immobilized bi-enzyme CNT electrode using
PBSE as cross-linker.

101
In Figure 5.7, similarly to the mono-enzymatic biosensor, no significant oxidation / reduction
peak can be observed after adding FAD. The mild hump noticed at 0.2 V in all the
voltammograms in Figure 5.7 is the characteristic redox peaks of the blue copper protein such as
TYR as found in previous research work (Ramasamy, Luckarift et al. 2010, Umasankar and
Ramasamy 2013, Umasankar and Ramasamy 2013). However, unlike the mono-enzymatic
biosensor, the oxidation peak upon addition of NADH was not observed on bi-enzyme
immobilized electrode. This could be due to the reduced transport of additional protein in the
CNT matrix on the modified electrode. However, with addition of 25 µM SA, a prominent
reduction peak appeared below 0.025 V as shown in Figure 5.7 compared to the mild oxidation
peak from the mono-enzymatic biosensor. This distinctive peak appears only when both SH and
TYR were present in the electrochemical system and thus can be attributed to the
electrochemical reduction of 1,2-benzoquinone that formed from the biocatalytic oxidation of
catechol by TYR as per the following reaction.
2 Catechol + O2Tyrosinase⇒ 2 1,2 − Benzoquinone + 2H2O
Unlike the mono-enzymatic biosensor, the bi-enzyme electrode did not exhibit a direct
electrochemical oxidation of the catechol in the 0.015 V region as it appeared in the mono-
enzymatic biosensor. This suggests that the biocatalytic oxidation of catechol by TYR proceeds
at the high rate that it depletes its surface concentration rapidly.
A further set of control experiments were performed with both unimmobilized electrode and
TYR-immobilized mono-enzyme electrodes, both in presence and absence of catechol, to
observe the electrochemical role of TYR on the electrode. The results of this experiment are
shown in Figure 5.8, which clearly display the redox couple peaks at ~ 0.15 V in the absence of

102
TYR on the non-immobilized electrode. On the other hand, a much stronger reduction peak was
observed at ~ 0.05 V from the same concentration of catechol, which can be attributed to the
reduction of 1,2-benzoquinone to 1,2-hydroquinone on the electrode surface. Due to the
proximity of the TYR, 1,2-benzoquinone generated from the TYR can be rapidly accumulated to
the electrode surface and renders high reduction current density.
Figure 5.8: CV responses of unimmobilized and TYR-immobilized mono-enzyme CNT
electrodes in the presence and absence of catechol.
Another set of control experiments was performed on both unimmobilized and TYR-
immobilized nano-enzyme electrodes, both in the presence and absence of SA. The results of
which are shown in Figure 5.S1. None of the voltammograms shown in Figure 5.S1 showed a
direct electrochemical reduction peak for 1,2-benzoquinone as observed in Figure 5.8. This
indicates that the 1,2-benzoquinone could only be produced in the enzymatic system through the
cascadic reactions (Steps 1-4), when both SH and TYR are present. The results provide
conclusive evidence that the bi-enzyme biosensor consisting both SH and TYR immobilized on
the CNT modified electrode provides a reliable detection of salicylate at potentials below 0.15 V.
103
5.3.3 Cyclic voltammetry of bi-enzymatic biosensor with PM and PLL as cross-linkers
In addition to PBSE, PM was evaluated as the cross-linker for enzyme immobilization. After 100
μL of 0.1 mM FAD, 50 µL of 10 mM NADH and SA were consecutively added to maintain a
concentration of 25 µM, a reduction peak for 1,2-benzoquinone appeared similar to that of the
bi-enzymatic electrode immobilized by PBSE, demonstrating the applicability of PM as a cross-
linker for enzyme immobilization. However the current density achieved using PM was not
significantly higher compared to that of PBSE (Figure 5.S2). The immobilization mechanism can
be explained by the thiol-ene reaction occurred between maleimide group of PM and the thiol-
group of cysteine from both SH (Appendix A) and TYR.
The same experiments were conducted for evaluating the immobilization efficiency of the cross-
linker PLL. As introduced in Section 5.2.4.3, four electrodes were prepared with PLL as the
cross-linker and DCC as the reaction agent, PLL only, DCC only and free of PLL and DCC as
controls. The 1,2-benzoquione reduction peak obtained from the DCC/PLL cross-linker
demonstrate that PLL can also be used as cross-linker for enzyme immobilization (Figure 5.S3A
and Figure 5.S3B). It was also proved that DCC can be used to increase the combination of PLL
on the CNT due to the higher reduction peak obtained from DCC/PLL (Figure 5.S3A) than that
of PLL-only case (Figure 5.S3B). The results further indicated that no reduction peak was
observed in the two control groups without PLL (Figure 5.S3C and Figure 5.S3D). The
immobilization function of PLL can be explained by the condensation reaction occurred between
amine group of PLL and the carboxyl group of acidic amino acid residues such as aspartic acid
and glutamic acid from both salicylate hydroxylase (Appendix A) and tyrosinase.

104
Although the use of PM and PLL as cross-linkers for enzyme immobilization were successfully
demonstrated, no significant increase of the reduction current density was obtained, therefore,
the following experiments would follow the traditional PBSE cross-linking strategy.
5.3.4 Determining optimal enzyme ratio of SH and TYR on electrode surface
The loading of either enzymes (SH and TYR) as well as the ratio of their loadings on the CNT
electrode surface would have a significant impact on the electrochemical detection and the
resulting sensor performance. Therefore, the difference in catalytic parameters (such as Km and
kcat) between the two enzymes and differences in mass transport coefficients of the reactants and
products must be optimized in order for the cascadic reaction to proceed efficiently (Steps 1-4).
To be specific, if the loading of SH on the electrode is insufficient compared to TYR, the
cascadic reactions would be limited by the catechol generation reaction, resulting in low 1,2-
benzoquinone generation and hence low currents on the electrode, thereby directly impacting the
sensitivity of SA detection. On the other hand, the cascade reactions will also be limited by the
step that converts catechol to 1,2-benzoquinone (Step 3), if the loading of TYR is insufficient
compare to SH, which can also impact the sensitivity of detection. Therefore, it is essential to
optimize the kinetics and transport inside the enzyme-CNT matrix of the bi-enzyme sensor to
ensure optimal conditions for reliable detection of SA. However, precise optimization and
control could only be achieved by theoretical treatment of the sensor surface, which is a separate
task and project all by itself. Therefore, a simpler experimental design approach for fabricating
bi-enzyme sensor with different loadings of the two enzymes was attempted in this work. For
this purpose, five different volume ratio combination of SH and TYR enzymes were used for the
immobilization on CNT modified electrodes. The loading of SH and TYR used respectively in
each set were: 1 µL and 9 µL, 3 µL and 7 µL, 5 µL and 5 µL, 7 µL and 3 µL and 9 µL and 1 µL

105
on the electrode surface. The other steps of modifications remained the same as introduced
previously. CV was performed on all the five bi-enzyme electrodes in the presence of the same
concentration of FAD, NADH and SA and the results are displayed in Figure 5.9.
Figure 5.9: CV responses of the bi-enzyme biosensor containing immobilized SH and TYR. The
2 mL electrolyte consists of 27.8 µM SA with FAD (4.7 µM) and NADH (0.23 mM). The ratio
of SH:TYR loadings by volume on the electrode respectively are 1:9 (red), 3:7 (orange), 5:5
(green), 7:3 (blue) and 9:1 (purple). The inset shows the current density of the sensor measured
at 0.025 V for different enzyme loading ratios showing the maximum sensitivity was obtained
when the enzyme volume ratio was 1:1.
The results show that the rate of 1,2-benzoquinone reduction (as determined by the slope of the
reduction wave below 0.15 V) differed significantly as the enzyme ratio of SH and TYR changed.
The inset of Figure 5.9 demonstrated the current density observed at 0.1 V as a function of
volume percentage of SH in the mixture, i.e. 50 % refers to 1:1 volume loading ratio of SH:TYR
used for immobilization. The potential of 0.1 V was an ideal reference point to measure the
electrochemical rate because it was outside both kinetic and mass transport limited regions.
Additionally, it is noteworthy that the current for 1:9 SH:TYR ratio was higher than that for 9:1
SH:TYR ratio. The trend of the inset of Figure 5.9 also indicates that the cascadic reactions were
106
more limited by the reaction catalyzed by TYR (Step 3) than by SH (Step 2). The highest
sensitivity (current density) was observed for a SH:TYR volume ratio 1:1. This corresponds to
0.022 unit of SH and 67.175 units of TYR in the bi-enzyme mixture. Consequently, the mixture
of 5 µL SH and 5 µL TYR (5 mg/mL) was used in all the following experiments to investigate
the biosensor performance such as sensitivity and limit of detection/quantification.
5.3.5 Electrochemical responses of the bi-enzymatic biosensor
Transient performance of the biosensor was measured using CV to determine electrochemical
parameters such as sensitivity, LOD and LOQ and reliable linear range for the SA detection.
Since no electrochemical redox peaks can be observed from FAD and NADH from Figure 5.7,
baseline was collected by CV after addition of 100 µL 0.1 mM FAD and 50 µL 10 mM NADH.
Then SA solution was added in steps to a concentration gradient from 2.3 µM, 4.6 µM, 9.3 µM,
18.6 µM, 27.8 µM and 46.3 µM. CV was then performed after each addition of SA. The
resulting voltammograms displayed in Figure 5.10 indicated that the 1,2-benzoquinone reduction
increased progressively (below 0.15 V) with the SA concentration in the electrolyte.
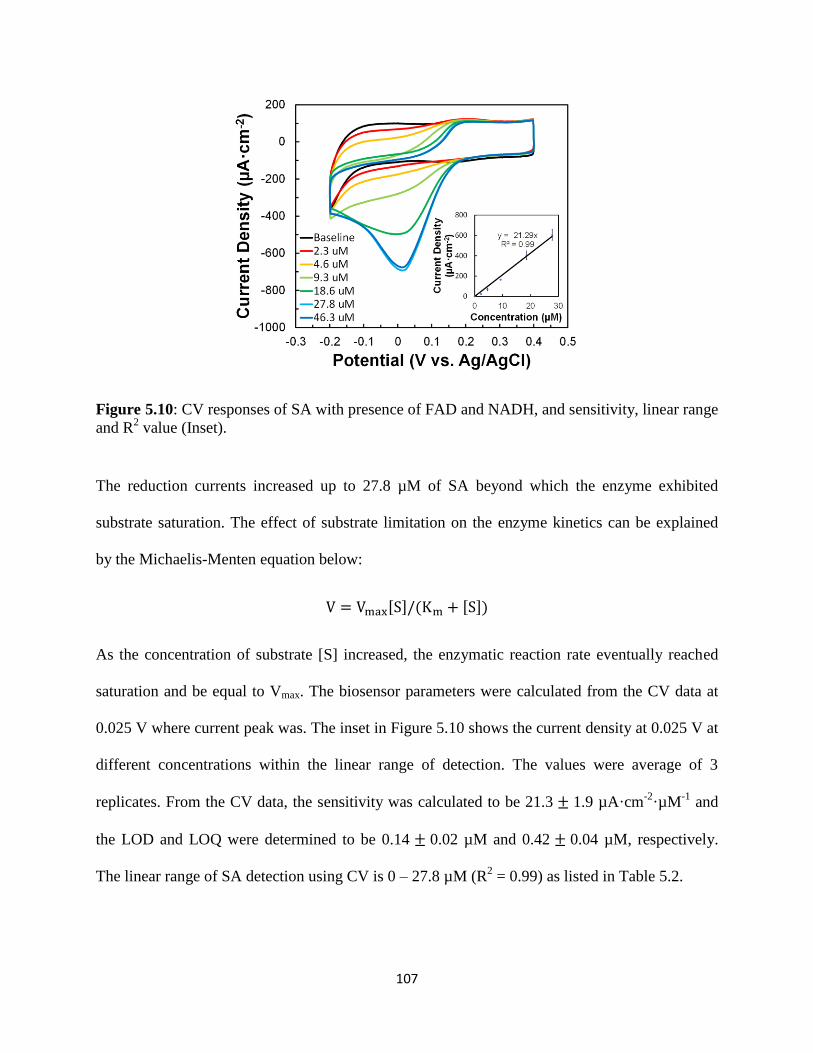
107
Figure 5.10: CV responses of SA with presence of FAD and NADH, and sensitivity, linear range
and R2 value (Inset).
The reduction currents increased up to 27.8 µM of SA beyond which the enzyme exhibited
substrate saturation. The effect of substrate limitation on the enzyme kinetics can be explained
by the Michaelis-Menten equation below:
V = Vmax[S]/(Km + [S])
As the concentration of substrate [S] increased, the enzymatic reaction rate eventually reached
saturation and be equal to Vmax. The biosensor parameters were calculated from the CV data at
0.025 V where current peak was. The inset in Figure 5.10 shows the current density at 0.025 V at
different concentrations within the linear range of detection. The values were average of 3
replicates. From the CV data, the sensitivity was calculated to be 21.3 ± 1.9 µA·cm-2
·µM-1
and
the LOD and LOQ were determined to be 0.14 ± 0.02 µM and 0.42 ± 0.04 µM, respectively.
The linear range of SA detection using CV is 0 – 27.8 µM (R2 = 0.99) as listed in Table 5.2.

108
Table 5.2: Sensor performance metrics for SA detection using CV and CPA techniques.
Method Linear range
(µM)
R2 Sensitivity
(µA·cm-2
·µM-1
)
LOD (µM) LOQ (µM)
CV 0 – 27.8 0.99 21.3 ± 1.9 0.14 ± 0.01 0.42 ± 0.04
CPA 0 – 27.8 0.99 30.6 ± 2.7 0.013 ± 0.005 0.039 ± 0.015
Since CV is a transient technique, it is usually used to obtain a firsthand understanding of the
sensor, but is generally not used as a quantitative measurement tool in real biosensor fabrication
situation. A more reliable and steady state measurement can be achieved by CPA. For the CPA,
the initial potential was set at 0.025 V and biosensor was stabilized for 2 min before 100 µL of
0.1 mM FAD and 50 µL of 10 mM NADH was consecutively added at 1-min interval. After 1
min of pre-conditioning, SA solution was introduced stepwise into the electrochemical cell in
different quantities to maintain a final concentration of 2.3 µM, 4.6 µM, 9.3 µM, 18.6 µM, 27.8
µM and 46.3 µM. The reduction current was continuously monitored by CPA for 1 min after
each addition. For each addition of SA, the reduction current reached steady value within short
time and at high concentrations began to fade within 10 seconds due to the mass transfer
limitations as it shown in Figure 5.11.

109
Figure 5.11: CPA responses of SA with presence of FAD and NADH and sensitivity, linear
range and R2 value (Inset).
Therefore, the highest current measured at each concentration was used for calculating the sensor
parameters, which are also reported in Table 5.2. Compared to the CV, the bi-enzyme biosensor
exhibited higher sensitivity (30.6 ± 2.7 µA·cm-2
·µM-1
), lower LOD (0.013 ± 0.005 µM) and
lower LOQ (0.039 ± 0.015 µM) in the CPA measurements with the same linear range of
salicylate detection 0 – 27.8 µM (R2 = 0.99) as it shows in Table 5.2. Compared to the previously
developed bi-enzymatic biosensor based on alcohol oxidase and horseradish peroxidase for
MeSA detection (Chapter 4), we successfully increased the sensitivity by over 110 fold from
0.28 µA·cm-2
·µM-1
to 30.6 µA·cm-2
·µM-1
and lowered the limit of detection from 0.98 µM to 13
nM. The above parameters allowed us to realize the quantification of MeSA released by plants in
less than 3 min under the assumptions that the produced MeSA is captured in 2 mL
electrochemical cell for detection based on the MeSA production rate of 283 ng/plant/h (Shulaev,
Silverman et al. 1997).

110
5.3.6 Evaluation of the reusability of the SH/TYR biosensor
Enzyme based biosensors are not meant for extended period of storage or repeated use as the
enzymes in the biorecognition element deteriorate over time. However, the biosensor needs to be
tested to perform repeatedly during multiple usages within a short period of time, to justify its
adoption to a commercial product over other competitive technologies. To this end, reusability of
the bi-enzyme biosensor was evaluated for 10 repetitions of SA detection and the results are
shown in Figure 5.12.
Figure 5.12: Reusability of bi-enzymatic biosensor for SA from 2.3 µM to 46.3 µM. Current
density retention over number of measurements in reusability is displayed in insets with two low
concentrations (4.6 µM and 9.3 µM) and two high concentrations (18.6 µM and 27.8 µM).
Similar to the sensitivity and LOD determination, SA solution was added stepwise in the
electrochemical cell in the presence of FAD and NADH followed by CPA measurements after
each addition. The experiment was carried out for 10 times using the same fabricated biosensor,
and after each measurement the electrode was rinsed to remove any residual catechol or 1,2-
benzoquinone on the electrode surface. Four SA concentrations within the linear range – two low
111
concentrations (4.6 µM and 9.3 µM) and two high concentrations (18.6 µM and 27.8 µM) were
analyzed. For low SA concentrations of 4.6 and 9.3 µM, the current density increased during the
first few repetitions (the inset of Figure 5.12). This could be caused by the residues of 1,2-
benzoquinone remained on the electrode surface from the previous repetition that was not
removed completely during the rinsing. For low concentrations of 4.6 and 9.3 µM, the current
density remained constant around 100 % of its original value, throughout the 10 repetitions with
no obvious loss in the sensitivity. On the other hand, a continuous loss in sensitivity was
observed during the 10 repetitions at high concentrations of salicylate at 18.6 and 27.8 µM,
suggested that the bi-enzyme biosensor in its current form could not be used to reliably detect
high concentrations of SA beyond 10 µM without suitable calibration. The reason for the
sensitivity loss during repeatable measurements at high SA concentrations could be attributed to
the imbalance in the kinetics and mass transport at the sensor-electrolyte interface. It is also
important to note that detection of SA concentrations above 10 µM are generally not necessary
due to the low release rate of MeSA by typical plants.
5.3.7 Stability of the bi-enzyme biosensor
In addition to reusability, the stability of the biosensor was also evaluated using CPA technique.
The bi-enzyme biosensor was fabricated on day 1 and used to measure different concentrations
of SA (4.6, 9.3, 18.6 and 27.8 µM) on the same day, using the previously described experimental
procedure. After the experiments were conducted on day 1, the electrode was rinsed by 0.1 M
phosphate buffer and stored in 0.1 M PB with 10 % glycerol at 4 ºC. The same sets of
experiments were repeated on days 2, 4, 6 and 8 and the current density for SA detection was
monitored over time. The results of the stability studies are displayed in Figure 5.13.

112
Figure 5.13: Stability of bi-enzyme biosensor for SA from 2.3 µM to 46.3 µM. Current density
retention over time is displayed in insets with two low concentrations (4.6 µM and 9.3 µM) and
high concentrations (18.6 µM and 27.8 µM).
Similar to the results obtained from during reusability evaluation, the currents at low SA
concentrations (4.6 and 9.3 µM) increased during the second measurement on day 2, likely due
to the residual catechol or 1,2-benzoquinone present on the electrode that could not be removed
during rinsing. The current density for all other SA concentrations decreased gradually after day
2 due to the deterioration of enzymes on the sensor surface. In addition, the currents took longer
time (10 – 60 seconds) to reach steady values unlike that on day 1, where it reached steady state
within 2 seconds. The results suggest that the biosensor could not be stored for long-term and a
suitable stabilization method must be developed before it can be employed for a practical
application. While this could be a goal of the future project, the results also indicate that bi-
enzyme sensor provides superior detection capabilities on the first day.

113
5.3.8 Effect of interference on the bi-enzyme biosensor
In addition to MeSA, other volatile organic compounds (VOCs) can also be released by both
healthy and stressed plants. For instance, dichlorobenzene (DCB) and 1,2,3-trimethylbenzene
(TMB) are among the most common expressed VOCs released by healthy uninfected soybean
(Zhu and Park 2005). On the other hand, farnesene (FAR) and humulene (HUM) are reported to
be VOCs that released by soybean aphid-infected soybean plant in addition to methyl salicylate
(Zhu and Park 2005). Therefore, the interference caused by FAR, HUM, DCB and TMB on
amperometric detection of MeSA using bi-enzyme sensor were evaluated. Since the eventual
quantitative detection of MeSA was realized after the hydrolysis, one potential interfering
compound that is produced during the hydrolysis, i.e. methanol (MeOH), was also evaluated. In
order to maintain the same ionic strength with 0.1 M phosphate buffer, pH 7.6, 0.19 M KOH was
used to hydrolyze the above-mentioned interfering VOCs for 2 hin 90 ºC water bath as it shown
in Figure 4.2. Interfering VOC samples were prepared by adding phosphoric acid to adjust pH to
7.6 before the evaluation experiments were carried out. CPA was used for interference
evaluation in the presence of 100 μL of 0.1 mM FAD and 50 µL of 10 mM NADH. Very high
concentrations ranging from 9.3 μM to 1.9 mM of MeOH, FAR, HUM, DCB and TMB were
used for the interference study. The upper range of 1.9 mM is significantly higher than the
typical VOCs concentration released by pathogen-infected plants. The reason for using such high
concentrations of interfering compound is to ensure the conservative estimate of interference
under extreme (unfavorable) conditions. The experiments of interference study carried out were
similar to that of earlier CPA measurements to determine sensitivity and LOD. The results of
these measurements are shown in Figure 5.14.

114
Figure 5.14: CPA responses of interference compounds – methanol (MeOH), farnesene (FAR),
humulene (HUM), dichlorobenzene (DCB), 1,2,3-trichlorobenzene (TCB) and control (PB).
In order to consider the volume change as interference solution was added stepwise in the
electrochemical cell, PB with same volume was stepwise added as the control to compare with
the experimental interference compounds. The results indicate that MeOH, HUM, DCB and
TMB did not contribute to significant interference with the SA detection current at the CPA
operation potential of 0.025 V as shown in Figure 5.14. Although FAR exhibits a noticeable
interference (sensitivity of 0.04 µA·cm-2
·µM-1
) as shown in inset of Figure 5.14, the current is
negligible compared to that of the salicylate detection without interfering compounds (30.61
µA·cm-2
·µM-1
). It can be concluded that none of the most common interference compounds
identified above cause significant interference to the bi-enzyme sensor towards the detection of
SA of MeSA.

115
5.3.9 Evaluation of bi-enzyme biosensor using synthetic analyte
Previous reports provide detailed information about the types of volatile signatures including the
compositions and relative molarity of the compounds that are released by uninfected and aphid-
infected soybean plants (Zhu and Park 2005). Based on this information, the cocktails of the
VOC mixtures simulating both the healthy and infected soybean VOCs were prepared and used
as synthetic analyte to evaluate the performance of the bi-enzyme sensor at near-practical
conditions. The compositions of these synthetic analytes are given in Table 5.3.
Table 5.3: Compositions of synthetic analyte simulating the VOC signature of uninfected and
soybean-aphid infected soybean plants
Uninfected synthetic analyte Soybean aphid-infected synthetic analyte
VOC Concentration (mM) VOC Concentration (mM)
Dichlorobenzene 10 Methyl salicylate 10
1,2,3-trimethylbenzene 7 Farnesene 15
Humulene 10
The synthetic analytes were prepared in 0.19 M KOH solution and hydrolyzed at 90 ºC water
bath for 2 h followed by pH neutralization by addition of phosphoric acid to 7.6, before CPA
measurement was carried out with the synthetic analyte samples. For the CPA measurement, the
pH adjusted synthetic analyte sample was gradually added to the electrolyte containing 100 μL
0.1 mM of FAD and 50 μL of 10 mM NADH. The results of the measurements shown in Figure
5.15 indicate that the uninfected synthetic analyte did not exhibit any noticeable reduction
current even at high concentrations of the synthetic analyte.

116
Figure 5.15: Uninfected synthetic analyte, infected synthetic analyte and SA as control in
simulated sample study. The inset shows the sensitivity of the infected synthetic analyte and pure
SA.
On the other hand, for the infected synthetic analyte, a stepwise increase in reduction currents
with concentration was observed. From the previous data, we can conclude the reduction current
increase is due to the concentration of SA produced after hydrolysis of MeSA in the analyte
sample. The qualitative and quantitative trend of aphid-infected analyte was nearly identical to
that of the responses from pure SA as analyte. The measured concentration of MeSA in the
synthetic analyte was calculated based on the current versus concentration data given in Figure
5.11 and the results are tabulated in Table 5.4.
Table 5.4: Simulated sample study with measuring simulated samples for uninfested, infested
and SA.
Concentration Added (µM) Concentration Measured (µM) Recovery (%)
4.6 4.73 102.77
9.3 10.15 109.11
18.6 22.76 122.34
27.8 28.93 104.06
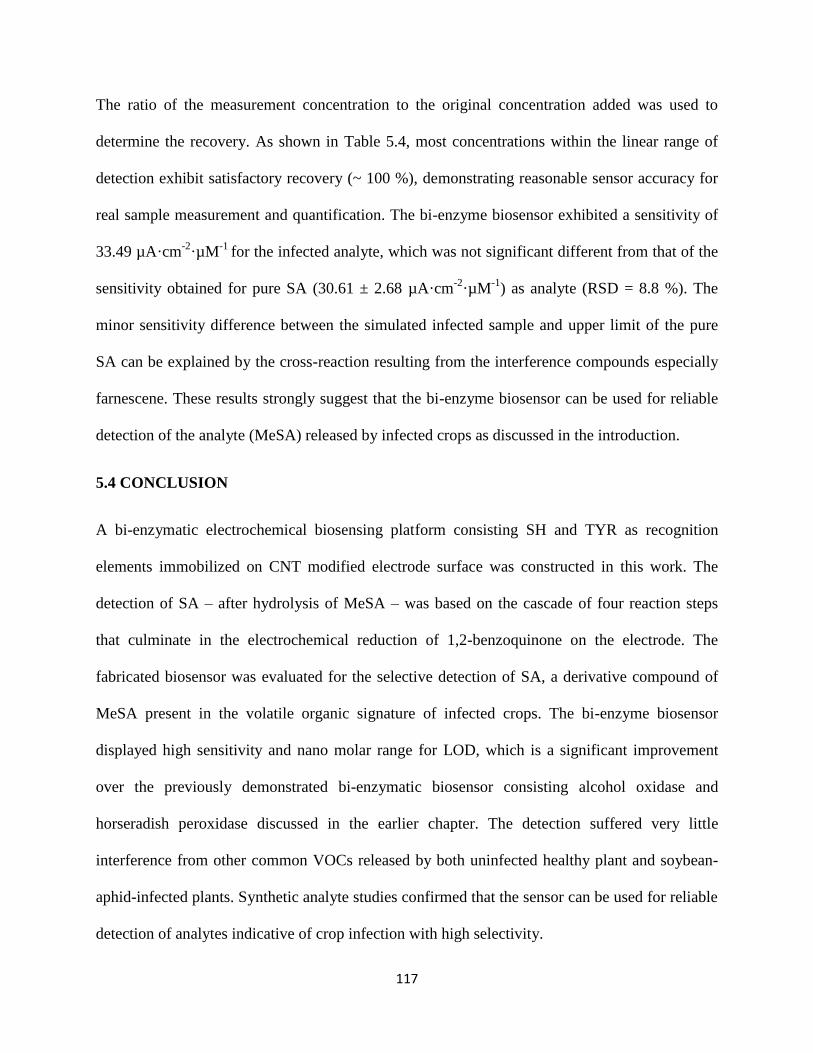
117
The ratio of the measurement concentration to the original concentration added was used to
determine the recovery. As shown in Table 5.4, most concentrations within the linear range of
detection exhibit satisfactory recovery (~ 100 %), demonstrating reasonable sensor accuracy for
real sample measurement and quantification. The bi-enzyme biosensor exhibited a sensitivity of
33.49 µA·cm-2
·µM-1
for the infected analyte, which was not significant different from that of the
sensitivity obtained for pure SA (30.61 ± 2.68 µA·cm-2
·µM-1
) as analyte (RSD = 8.8 %). The
minor sensitivity difference between the simulated infected sample and upper limit of the pure
SA can be explained by the cross-reaction resulting from the interference compounds especially
farnescene. These results strongly suggest that the bi-enzyme biosensor can be used for reliable
detection of the analyte (MeSA) released by infected crops as discussed in the introduction.
5.4 CONCLUSION
A bi-enzymatic electrochemical biosensing platform consisting SH and TYR as recognition
elements immobilized on CNT modified electrode surface was constructed in this work. The
detection of SA – after hydrolysis of MeSA – was based on the cascade of four reaction steps
that culminate in the electrochemical reduction of 1,2-benzoquinone on the electrode. The
fabricated biosensor was evaluated for the selective detection of SA, a derivative compound of
MeSA present in the volatile organic signature of infected crops. The bi-enzyme biosensor
displayed high sensitivity and nano molar range for LOD, which is a significant improvement
over the previously demonstrated bi-enzymatic biosensor consisting alcohol oxidase and
horseradish peroxidase discussed in the earlier chapter. The detection suffered very little
interference from other common VOCs released by both uninfected healthy plant and soybean-
aphid-infected plants. Synthetic analyte studies confirmed that the sensor can be used for reliable
detection of analytes indicative of crop infection with high selectivity.

118
5.5 SUPPLEMENTARY DATA
Figure 5.S1: CV responses of unimmobilized and TYR-immobilized mono-enzyme CNT
electrodes in the presence and absence of SA.
Figure 5.S2: CV of SA concentration effect on SH/TYR-immobilized GC electrode using PM
as cross-linker.
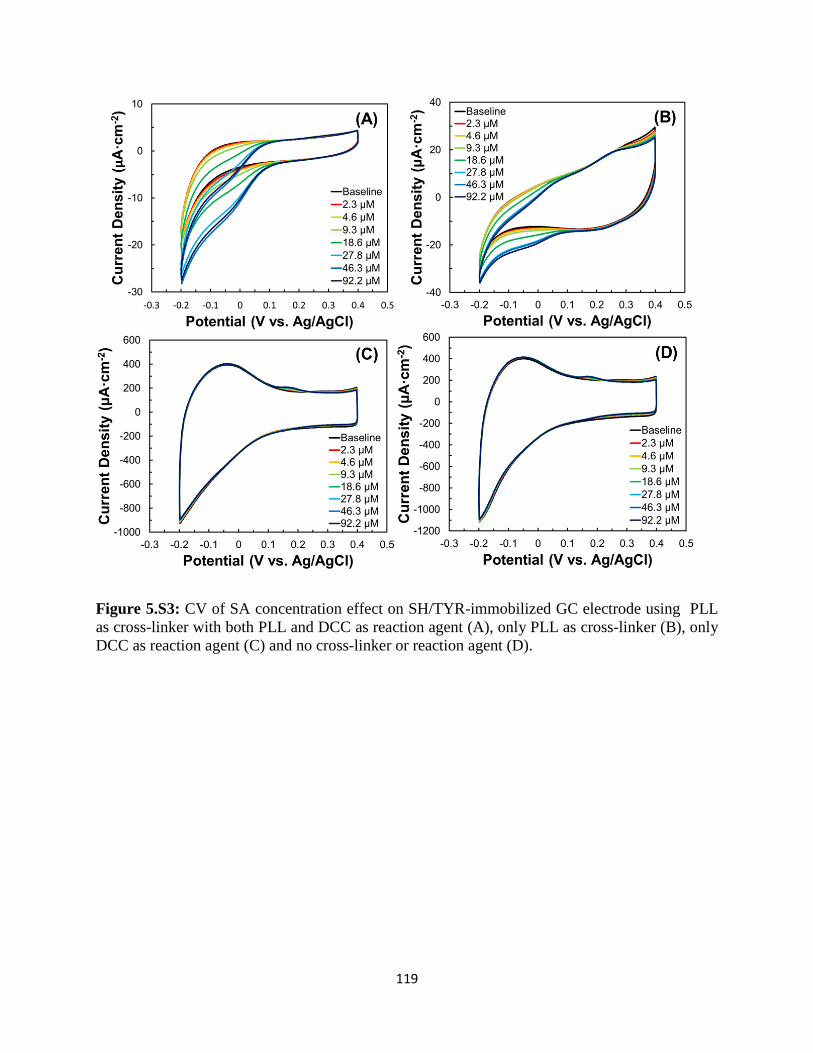
119
Figure 5.S3: CV of SA concentration effect on SH/TYR-immobilized GC electrode using PLL
as cross-linker with both PLL and DCC as reaction agent (A), only PLL as cross-linker (B), only
DCC as reaction agent (C) and no cross-linker or reaction agent (D).

120
CHAPTER 6
DIRECT DETECTION OF METHYL SALICYLATE USING ESTERASE /
SALICYLATE HYDROXYLASE / TYROSINASE – BASED TRIENZYMATIC
BIOSENSOR
To be submitted to Biosensors and Bioelectronics.

121
6.1 INTRODUCTION
6.1.1 Current limitations of the chemical hydrolysis of methyl salicylate
In the previous chapters, the developments of two types of bi-enzymatic biosensors consisting of
alcohol oxidase / horseradish peroxidase and salicylate hydroxylase (SH) / tyrosinase (TYR)
have been successfully demonstrated for the detection of methyl salicylate (MeSA). Although
the electrochemical parameters such as sensitivity, limit of detection (LOD) and limit of
quantification (LOQ) satisfy the requirement for the detection, pretreatment of MeSA (i.e.
chemical hydrolysis of MeSA to form methanol and salicylate (SA)) prior to detection is
necessary. The chemical hydrolysis of MeSA consists of KOH hydrolysis of the sample followed
by phosphoric acid neutralization. These additional pre-treatment requirements impact the
biosensor performance and device miniaturization as the pre-treatment requires hot water bath
for hydrolysis and pH meter for pH adjustment after the hydrolysis. This step greatly limits the
applicability of the biosensor for widespread commercial use by unskilled users. Therefore, a
more effective and easy-to-handle method for MeSA hydrolysis is necessary and proposed in this
chapter.
6.1.2 Application of esterase for hydrolysis
In this work, the hydrolysis step was carried out by an enzymatic reaction in an effort to avoid
pretreatment of the sample. Esterase (ES) (E.C. 3.1.1.1), also called carboxyl esterase or
carboxylic-ester hydrolase, is an enzyme which catalyzes a chemical reaction of the form as
below:
Caboxylic ester + H2OEsterase⇒ Alcohol + Carboxylate

122
To carry out the hydrolysis of MeSA, ES was used to catalyze the reaction as shown below to
generate SA that can be used for detection using SH and TYR.
Methyl salicylate + H2OEsterase⇒ Methanol + Salicylate
A tri-enzymatic biosensor consisting ES, SH and TYR can be employed for the detection of
MeSA without additional pre-treatment requirements for MeSA hydrolysis. In order to hydrolyze
MeSA, ES was mixed with SH and TYR to prepare a tri-enzyme mixture for immobilization on
the electrode. The entire detection mechanism is illustrated by the scheme in Figure 6.1:
Figure 6.1: Schematic illustration of tri-enzyme with all three enzymes – ES, SH and TYR
immobilized on the electrode. Not drawn to scale.
As shown in the Figure 6.1, MeSA diffused to the electrode surface to form methanol and SA by
the enzyme ES immobilized on the electrode. SA can then be decarboxylated by SH to form
catechol, which will further be oxidized by TYR to form 1,2-benzoquinone. The direct detection
of MeSA will eventually be realized through reduction of 1,2-benzoquinone to 1,2-hydroquinone
as introduced in Chapter 5.

123
An alternative option to immobilize all three enzymes on the electrode is to maintain ES in the
bulk electrolyte potassium phosphate buffer (PB, pH 7.6) to enable bulk hydrolysis of MeSA to
form SA, before SA is measured in the cascade reactions catalyzed by SH/TYR bi-enzymatic
recognition element as introduced in Chapter 5, which is shown in Figure 6.2.
Figure 6.2: Schematic illustration of tri-enzyme with two enzymes (i.e. SH and TYR)
immobilized on the electrode and esterase added in the solution. Not drawn to scale.
As shown in Figure 6.2, this approach for MeSA detection involves 2 steps. First, MeSA
produced by diseased plants can be collected and pre-concentrated in the electrolyte. During the
collection and pre-concentration, ES present in the electrolyte would simultaneously hydrolyze
the MeSA to generate SA and methanol. The resulting solution containing SA can be used for
MeSA detection (through SA) in the second step.

124
6.1.3 Gaseous methyl salicylate collection and pre-concentration system
Since either the bi-enzyme or tri-enzyme biosensor requires an aqueous solution, a collection and
pre-concentration of gaseous MeSA step is necessary to enable detection. Thus, a purge-and-trap
device will be designed for VOC collection. As introduced above, ES can also be added in the
electrolyte so the MeSA collected from the VOCs released by the diseased plant can be
hydrolyzed before the real detection and proceed simultaneously during detection. In order to
maintain favorable operating condition for ES to hydrolyze MeSA in bulk electrolyte, a PB at pH
7.6 will be used for the collection and pre-concentration of MeSA released by the plants. The
proposed collection and pre-concentration system is illustrated in Figure 6.3.
Figure 6.3: Schematic of proposed collection and pre-concentration system for MeSA generated
by stressed plants. Computer control system not shown. Not drawn to scale.
In the collection / pre-concentration system, the VOCs including MeSA are collected in the
plastic bag, and the ambient air is purged by a micro air pump through the connected hose to the
PB electrolyte in the pre-concentration reservoir. The gaseous MeSA is pre-concentrated in the
reservoir and hydrolyzed by esterase in the reservoir.

125
Although the procedure of collection and pre-concentration can be manually carried out, a
computer controlled automation platform could be used to start and stop the purge-and-trap. The
temperature measurement program can be controlled by computer to measure the ambient
temperature for compensation of enzyme activity instead of conducting temperature
measurement using a thermometer by the end-users. In this project, a platform that realizes the
automatic collection and ambient temperature measurement is proposed.
6.2 MATERIALS AND METHODS
6.2.1 Materials
Salicylate hydroxylase (E.C. 1.14.13.1) was expressed and purified from E.coli XL-1 blue
transformed with pTrc99A-nahG-His tag as introduced in Chapter 5. Esterase from porcine liver
(lyophilized powder, ≥ 15 units / mg solid), tyrosinase (E.C. 1.14.18.1) derived from mushroom
(lyophilized powder, ≥ 1000 units / mg solid) and methyl salicylate were purchased from Sigma-
Aldrich (St. Louis, MO, USA) and used directly as received. Multiwalled carbon nanotubes
(MWCNTs) were purchased from DropSens Inc. (Spain) and used directly without further
purification. Sodium salicylate, NADH and methylformamide (DMF) were obtained from Acros
Organics (NJ, USA). Dimethyl sulfoxide (DMSO), FAD and 1-pyrenebutanoic acid succinimidyl
ester (PBSE) were purchased from VWR, Alfa Aesar (Haverhill, MA, USA) and AnaSpec Inc.
(Fremont CA, USA) respectively. All reagents used in the project were analytical grade.
Potassium phosphate buffer (PB, 0.1 M, pH 7.6) was used as the electrolyte for all experiments.
All aqueous solutions were prepared in 18.2 MΩ nano-pure de-ionized (DI) water. Solutions
were oxygenated by purging with oxygen for 15 min before experiments.

126
6.2.2 Methods
6.2.2.1 GC and SP Electrode preparation
Multi-walled carbon nanotube (MWCNT) was prepared by ultrasonicating each 1 mg of
MWCNT in 1 mL DMF for glassy-carbon (GC) electrode and 1 mL DMSO for screen-printed
(SP) electrode for an hour for electrode modification. Both GC and SP electrodes were then
modified with CNT by drop casting 16 µL (in 8 steps of 2 µL) followed by drying in oven after
each addition. The electrodes were allowed to cool on ice before 2 µL of 10 mM PBSE (prepared
in DMF and DMSO for GC and SP, respectively) was applied on the surface electrode for 15
min to allow the non-covalent binding between PBSE and CNTs. DMF and DMSO were
respectively used to rinse the GC and SP to remove unattached PBSE before 0.1 M potassium
phosphate buffer (PB, pH 7.6) was consecutively used to remove the solvents from the electrode
surface. Solutions of TYR and ES were prepared by dissolving 5 mg TYR and ES in 1 mL of 20
mM PB, pH 7. Bi-enzyme and tri-enzyme solutions were prepared by mixing SH/TYR solution
and ES/SH/TYR solution for enzyme immobilization on both GC and SP electrodes. The
enzyme-immobilized biosensors were fabricated by drop-casting 10 µL of bi-enzyme solution or
15 µL of tri-enzyme on the electrode surface, and the electrode was incubated on the electrode
for 30 min to allow covalent binding of PBSE and the enzymes.
6.2.2.2 Electrochemical experiments
In CV experiments, the potential was scanned from 0.4 V to -0.2 V by CHI 920 c potentiostat to
monitor the reduction current for both bi-enzyme and tri-enzyme immobilized electrode.
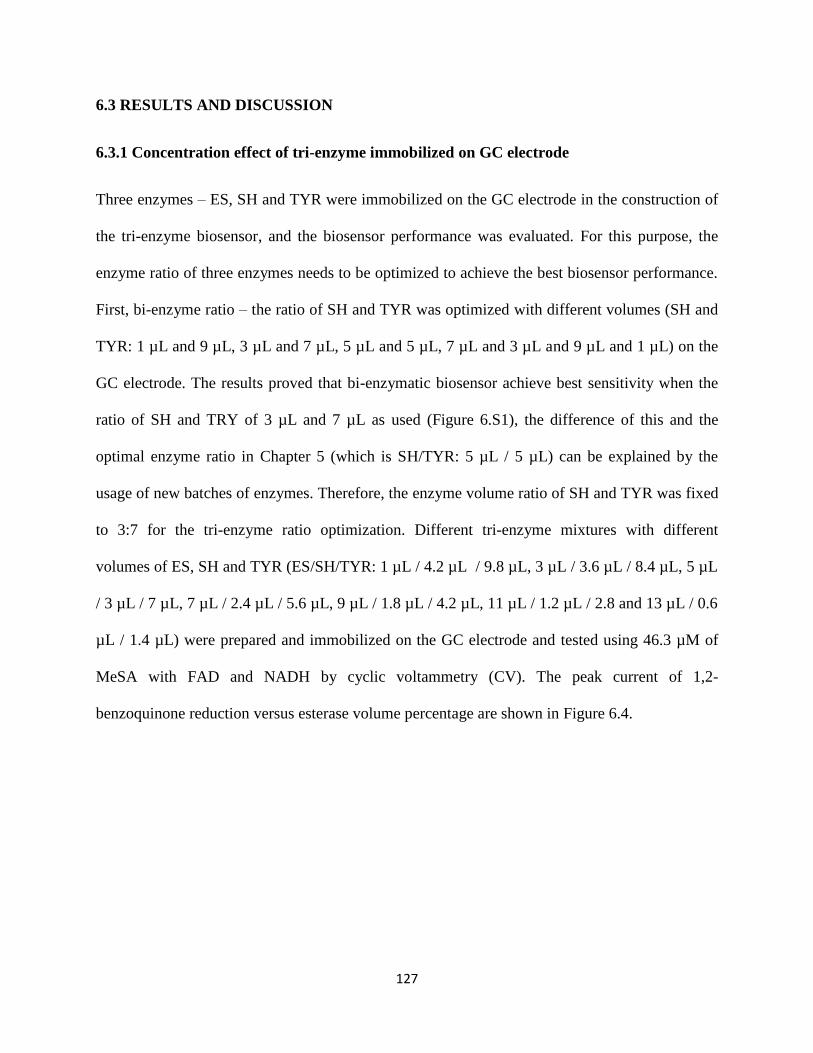
127
6.3 RESULTS AND DISCUSSION
6.3.1 Concentration effect of tri-enzyme immobilized on GC electrode
Three enzymes – ES, SH and TYR were immobilized on the GC electrode in the construction of
the tri-enzyme biosensor, and the biosensor performance was evaluated. For this purpose, the
enzyme ratio of three enzymes needs to be optimized to achieve the best biosensor performance.
First, bi-enzyme ratio – the ratio of SH and TYR was optimized with different volumes (SH and
TYR: 1 µL and 9 µL, 3 µL and 7 µL, 5 µL and 5 µL, 7 µL and 3 µL and 9 µL and 1 µL) on the
GC electrode. The results proved that bi-enzymatic biosensor achieve best sensitivity when the
ratio of SH and TRY of 3 µL and 7 µL as used (Figure 6.S1), the difference of this and the
optimal enzyme ratio in Chapter 5 (which is SH/TYR: 5 µL / 5 µL) can be explained by the
usage of new batches of enzymes. Therefore, the enzyme volume ratio of SH and TYR was fixed
to 3:7 for the tri-enzyme ratio optimization. Different tri-enzyme mixtures with different
volumes of ES, SH and TYR (ES/SH/TYR: 1 µL / 4.2 µL / 9.8 µL, 3 µL / 3.6 µL / 8.4 µL, 5 µL
/ 3 µL / 7 µL, 7 µL / 2.4 µL / 5.6 µL, 9 µL / 1.8 µL / 4.2 µL, 11 µL / 1.2 µL / 2.8 and 13 µL / 0.6
µL / 1.4 µL) were prepared and immobilized on the GC electrode and tested using 46.3 µM of
MeSA with FAD and NADH by cyclic voltammetry (CV). The peak current of 1,2-
benzoquinone reduction versus esterase volume percentage are shown in Figure 6.4.

128
Figure 6.4: CV responses of the tri-enzyme GC electrode containing immobilized ES, SH and
TYR. The 2 mL electrolyte consists of 46.3 µM MeSA with FAD (4.7 µM) and NADH (0.23
mM). The ratio of ES:SH:TYR loadings by volume on the electrode, respectively, are 1:4.2:9.8
(red), 3:3.6:8.4 (orange), 5:3:7 (light green), 7:2.4:5.6 (green), 9:1.8:4.2 (light blue), 11:1.2:2.8
(blue) and 13:0.6:1.4 (purple).
The results (Figure 6.4) indicated that current density increased as the volume percentage of
esterase increased and reached its maximum when the enzyme loadings of ES/SH/TYR: 7 µL /
2.4 µL / 5.6 µL was applied for GC electrode immobilization. However, the current density
decreased when the volume percentage of ES was beyond 47 % (corresponds to 7 µL of ES
among 15 µL of enzyme mixture) due to insufficient immobilization of SH/TYR, which limits
the conversion of salicylate to catechol and further to 1,2-benzoquinone for electrochemical
reduction. Therefore, the enzyme loading of ES/SH/TYR: 7 µL / 2.4 µL / 5.6 µL (corresponding
to 0.595 unit / 0.011 unit / 75.236 units) was used for the sensitivity, LOD and LOQ
determination.

129
Figure 6.5: Concentration effect of MeSA (2.3, 4.6, 9.3, 18.6, 27.8, 46.3, 92.2 and 182.6 µM) on
tri-enzyme (ES/SH/TYR: 7 µL / 2.4 µL / 5.6 µL) immobilized GC electrode.
Different volumes of 10 mM MeSA stock solution were then added to 2 mL PB electrolyte
supplemented with 100 µL 0.1 mM FAD and 50 µL 10 mM NADH to maintain concentrations
of MeSA of 2.3, 4.6, 9.3, 18.6, 27.8, 46.3, 92.2 and 182.6 µM. CV was applied to measure each
of concentration of MeSA, and the data were shown in Figure 6.5. The current density at 0.025 V
was used to plot against the concentration which shown as the inset of Figure 6.5. A sensitivity
of 1.55 µA·cm-2
·µM-1
was found, which was significantly lower than the bi-enzyme GC
electrode in Chapter 5 (which is 21.3 µA·cm-2
·µM-1
), although the LOD and LOQ (which are
0.70 and 2.13 µM) were similar to that of bi-enzyme sensor (Table 6.1). The decrease of the
sensitivity of tri-enzyme compare to bi-enzyme GC electrode can be explained by the low
reaction rate of esterase, i.e. it takes longer time for the electrode to accumulate enough SA for
the next reaction to take place.
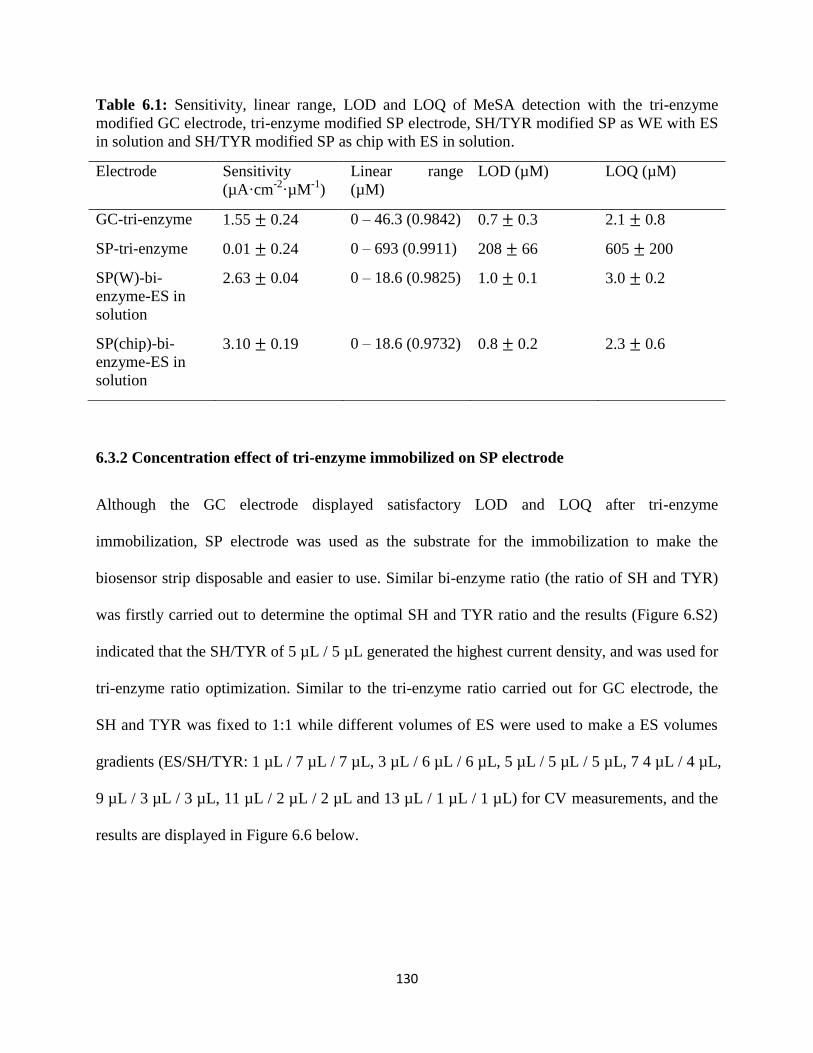
130
Table 6.1: Sensitivity, linear range, LOD and LOQ of MeSA detection with the tri-enzyme
modified GC electrode, tri-enzyme modified SP electrode, SH/TYR modified SP as WE with ES
in solution and SH/TYR modified SP as chip with ES in solution.
Electrode Sensitivity
(µA·cm-2
·µM-1
)
Linear range
(µM)
LOD (µM) LOQ (µM)
GC-tri-enzyme 1.55 ± 0.24 0 – 46.3 (0.9842) 0.7 ± 0.3 2.1 ± 0.8
SP-tri-enzyme 0.01 ± 0.24 0 – 693 (0.9911) 208 ± 66 605 ± 200
SP(W)-bi-
enzyme-ES in
solution
2.63 ± 0.04 0 – 18.6 (0.9825) 1.0 ± 0.1 3.0 ± 0.2
SP(chip)-bi-
enzyme-ES in
solution
3.10 ± 0.19 0 – 18.6 (0.9732) 0.8 ± 0.2 2.3 ± 0.6
6.3.2 Concentration effect of tri-enzyme immobilized on SP electrode
Although the GC electrode displayed satisfactory LOD and LOQ after tri-enzyme
immobilization, SP electrode was used as the substrate for the immobilization to make the
biosensor strip disposable and easier to use. Similar bi-enzyme ratio (the ratio of SH and TYR)
was firstly carried out to determine the optimal SH and TYR ratio and the results (Figure 6.S2)
indicated that the SH/TYR of 5 µL / 5 µL generated the highest current density, and was used for
tri-enzyme ratio optimization. Similar to the tri-enzyme ratio carried out for GC electrode, the
SH and TYR was fixed to 1:1 while different volumes of ES were used to make a ES volumes
gradients (ES/SH/TYR: 1 µL / 7 µL / 7 µL, 3 µL / 6 µL / 6 µL, 5 µL / 5 µL / 5 µL, 7 4 µL / 4 µL,
9 µL / 3 µL / 3 µL, 11 µL / 2 µL / 2 µL and 13 µL / 1 µL / 1 µL) for CV measurements, and the
results are displayed in Figure 6.6 below.
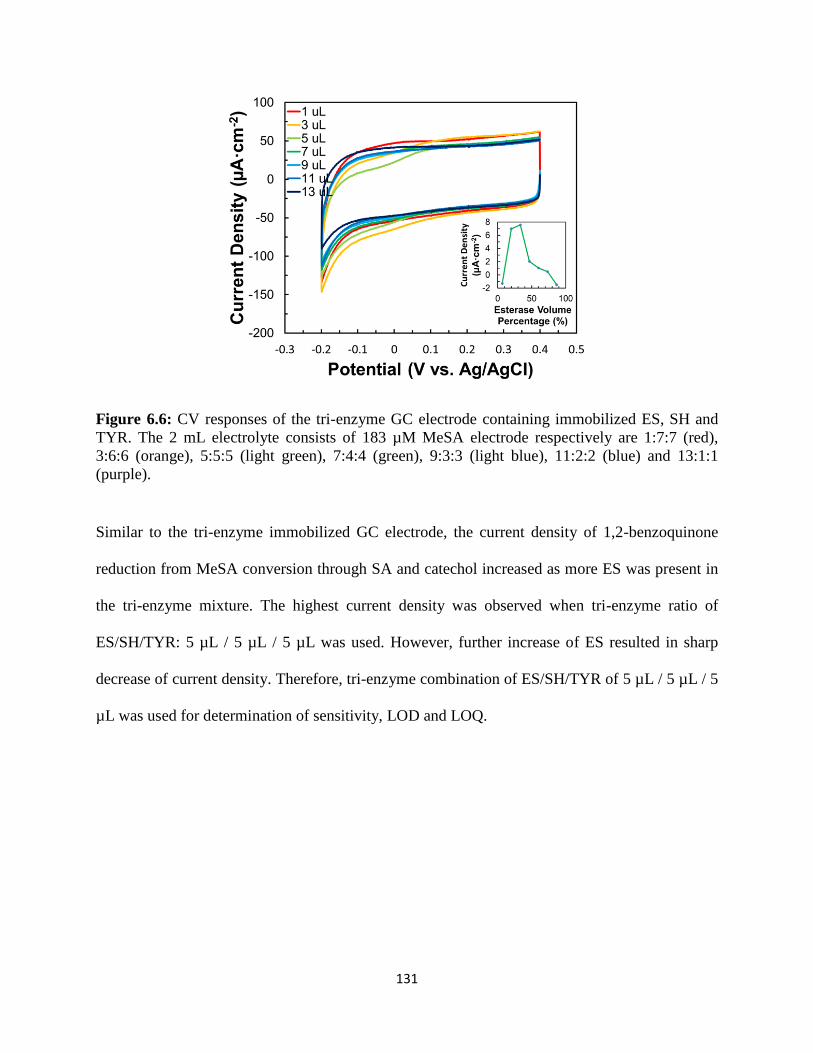
131
Figure 6.6: CV responses of the tri-enzyme GC electrode containing immobilized ES, SH and
TYR. The 2 mL electrolyte consists of 183 µM MeSA electrode respectively are 1:7:7 (red),
3:6:6 (orange), 5:5:5 (light green), 7:4:4 (green), 9:3:3 (light blue), 11:2:2 (blue) and 13:1:1
(purple).
Similar to the tri-enzyme immobilized GC electrode, the current density of 1,2-benzoquinone
reduction from MeSA conversion through SA and catechol increased as more ES was present in
the tri-enzyme mixture. The highest current density was observed when tri-enzyme ratio of
ES/SH/TYR: 5 µL / 5 µL / 5 µL was used. However, further increase of ES resulted in sharp
decrease of current density. Therefore, tri-enzyme combination of ES/SH/TYR of 5 µL / 5 µL / 5
µL was used for determination of sensitivity, LOD and LOQ.

132
Figure 6.7: Concentration effect of MeSA (28, 46, 92, 183, 359 and 693 µM) on tri-enzyme
(ES/SH/TYR: 5 µL / 5 µL / 5 µL) immobilized SP electrode.
Different concentrations of MeSA (28, 46, 92, 183, 359 and 693 µM) were used to evaluate the
tri-enzyme immobilized SP electrode in presence of FAD and NADH. CV results were shown in
Figure 6.7, and the current density versus concentration was shown in the inset. Although the
reduction current density of 1,2-benzoquione increased as higher concentrations of MeSA were
added in the electrolyte, the reduction peaks were not prominent as they were on tri-enzyme
immobilized GC electrode. Data in Table 6.1 further indicate that the sensitivity was
significantly compromised (0.01 µA·cm-2
·µM-1
) compared to that of tri-enzyme immobilized GC
electrode and SH/TYR-bi-enzyme immobilized SP (Figure 6.S2), which could be attributed to
the poor immobilization of ES. LOD and LOQ are determined to be 208 µM and 605 µM
respectively, which are much higher than expected. Therefore, the strategy of tri-enzyme
immobilization on SP electrode needs to be reconsidered for practical development of MeSA
biosensor.

133
6.3.3 SH/TYR-immobilized biosensor as working electrode for ES-treated MeSA
Since the tri-enzyme immobilized biosensor did not provide the desired sensitivity and LOD for
MeSA detection, a second strategy which includes pre-treatment of MeSA in the electrolyte by
ES and detection of SA with a SH/TYR-immobilized biosensor. To investigate this strategy, a
SH/TYR mixture with 5 µL SH and 5 µL TYR were prepared and immobilized on the electrodes
as introduced above. Since ES would be added in the electrolyte to hydrolyze MeSA before
SH/TYR-immobilized biosensor was used for measurement, the time required by ES to
hydrolyze MeSA must be determined. MeSA, 27.8 µM, was prepared in 2 mL PB, pH 7.6,
containing 100 µL of 0.1 mM FAD, 50 µL of 10 mM NADH and 5 µL of ES. CV measurements
were performed after 0 min, 30 min, 1 h, 2 h and 4 h of reaction and cyclic voltammograms were
displayed in Figure 6.8, and the peak current density versus reaction time is also plotted as inset.
Figure 6.8: CV responses of 27.8 µM MeSA on a SH/TYR-immobilized GC electrode after 0
min, 30 min, 1 h, 2 h and 4 h treatment with esterase.
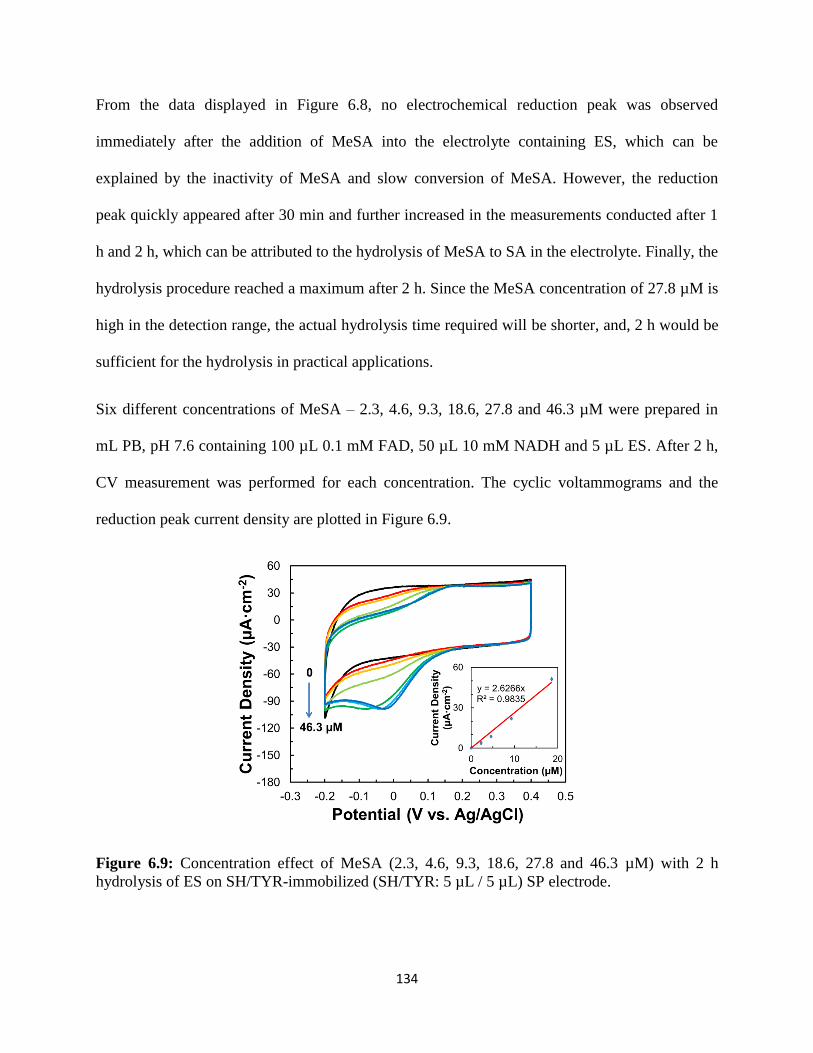
134
From the data displayed in Figure 6.8, no electrochemical reduction peak was observed
immediately after the addition of MeSA into the electrolyte containing ES, which can be
explained by the inactivity of MeSA and slow conversion of MeSA. However, the reduction
peak quickly appeared after 30 min and further increased in the measurements conducted after 1
h and 2 h, which can be attributed to the hydrolysis of MeSA to SA in the electrolyte. Finally, the
hydrolysis procedure reached a maximum after 2 h. Since the MeSA concentration of 27.8 µM is
high in the detection range, the actual hydrolysis time required will be shorter, and, 2 h would be
sufficient for the hydrolysis in practical applications.
Six different concentrations of MeSA – 2.3, 4.6, 9.3, 18.6, 27.8 and 46.3 µM were prepared in
mL PB, pH 7.6 containing 100 µL 0.1 mM FAD, 50 µL 10 mM NADH and 5 µL ES. After 2 h,
CV measurement was performed for each concentration. The cyclic voltammograms and the
reduction peak current density are plotted in Figure 6.9.
Figure 6.9: Concentration effect of MeSA (2.3, 4.6, 9.3, 18.6, 27.8 and 46.3 µM) with 2 h
hydrolysis of ES on SH/TYR-immobilized (SH/TYR: 5 µL / 5 µL) SP electrode.

135
The results in Figure 6.9 indicated the increase of current density with the increase of MeSA
concentration and the quantitative parameter can be found in Table 6.1. The results demonstrate
better sensitivity (2.63 µA·cm-2
·µM-1
) and lower LOD (1.0 µM) and LOQ (3.0 µM) which is
competitive compared to tri-enzyme immobilized GC electrode. Therefore, the strategy of
measuring MeSA through pre-hydrolyzed MeSA by SH/TYR-immobilized biosensor has been
successfully developed.
6.3.4 SH/TYR-immobilized biosensor as sensor chip for ES-treated MeSA
Although the SH/TYR-immobilized SP electrode has proved successful as a working electrode in
pre-hydrolyzed MeSA detection, an extra of Pt wire as the counter electrode and 3 M Ag/AgCl
reference electrode are required to perform the detection together with the SP working electrode.
However, the Ag/AgCl electrode, although it provides an accurate reference potential, contains 3
M KCl solution, which limits its application as a reference electrode for the development of a
lab-on-chip device, where all three electrodes (i.e. working, counter and reference electrodes) are
required to be non-aqueous. Because of the difficulty in finding a reference electrode for a non-
aqueous solvent that does not contaminate the test solution with undesirable species, a quasi-
reference electrode (QRE) is often employed. This is usually just a metal wire, Ag or Pt, used
with the expectation that no change occurs in the bulk solution during the measurement (Bard,
Faulkner et al. 1980). Since Ag/Ag Cl electrode was used for all previous experiments, SP
electrodes configured with Ag wire as QRE and printed carbon as CE were used to carry out the
MeSA detection (Figure 6.10).

136
Figure 6.10: Setup of SH/TYR immobilized SP electrode using the configured SP carbon and Pt
wire as counter electrode and quasi-reference electrode.
The working electrode of SP was immobilized with SH/TYR mixture as introduced above and
the concentration gradients of MeSA from 2.3, 4.6, 9.3, 18.6, 27.8 to 46.3 µM was prepared in
presence of FAD, NADH and ES as introduced above. After 2 h hydrolysis, CV measurement
was carried out at all concentrations, and cyclic voltammograms and the concentration effect are
shown in Figure 6.11.
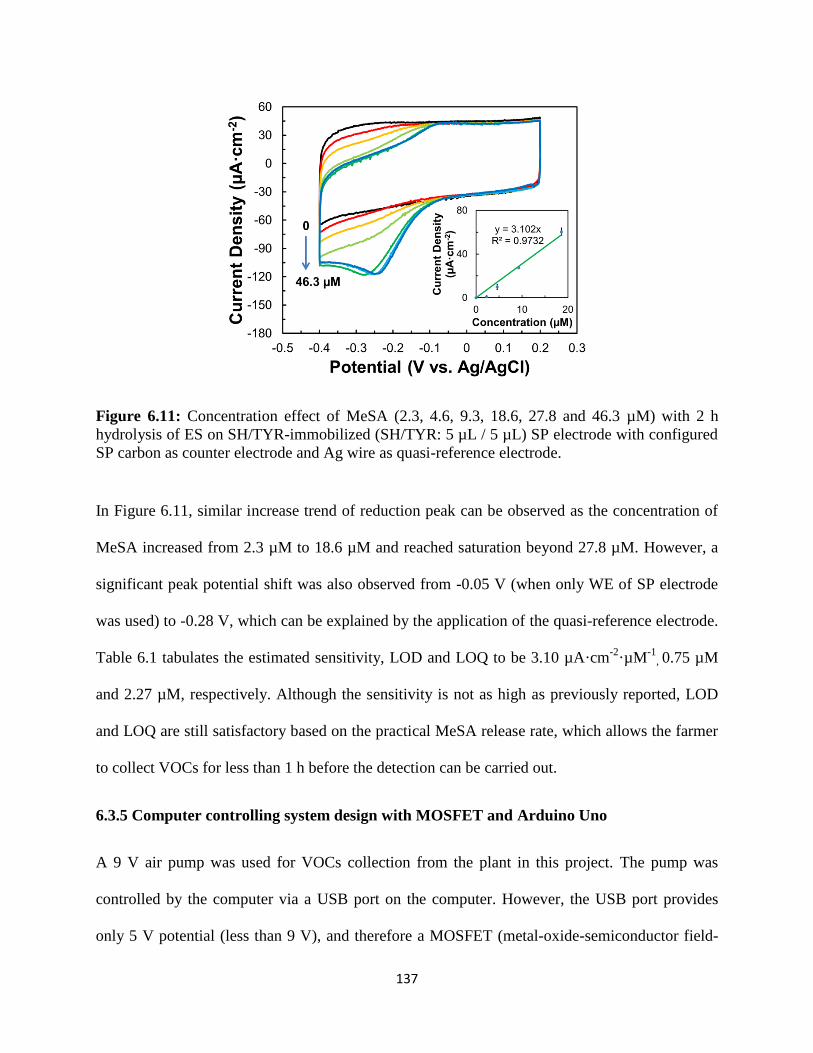
137
Figure 6.11: Concentration effect of MeSA (2.3, 4.6, 9.3, 18.6, 27.8 and 46.3 µM) with 2 h
hydrolysis of ES on SH/TYR-immobilized (SH/TYR: 5 µL / 5 µL) SP electrode with configured
SP carbon as counter electrode and Ag wire as quasi-reference electrode.
In Figure 6.11, similar increase trend of reduction peak can be observed as the concentration of
MeSA increased from 2.3 µM to 18.6 µM and reached saturation beyond 27.8 µM. However, a
significant peak potential shift was also observed from -0.05 V (when only WE of SP electrode
was used) to -0.28 V, which can be explained by the application of the quasi-reference electrode.
Table 6.1 tabulates the estimated sensitivity, LOD and LOQ to be 3.10 µA·cm-2
·µM-1
, 0.75 µM
and 2.27 µM, respectively. Although the sensitivity is not as high as previously reported, LOD
and LOQ are still satisfactory based on the practical MeSA release rate, which allows the farmer
to collect VOCs for less than 1 h before the detection can be carried out.
6.3.5 Computer controlling system design with MOSFET and Arduino Uno
A 9 V air pump was used for VOCs collection from the plant in this project. The pump was
controlled by the computer via a USB port on the computer. However, the USB port provides
only 5 V potential (less than 9 V), and therefore a MOSFET (metal-oxide-semiconductor field-
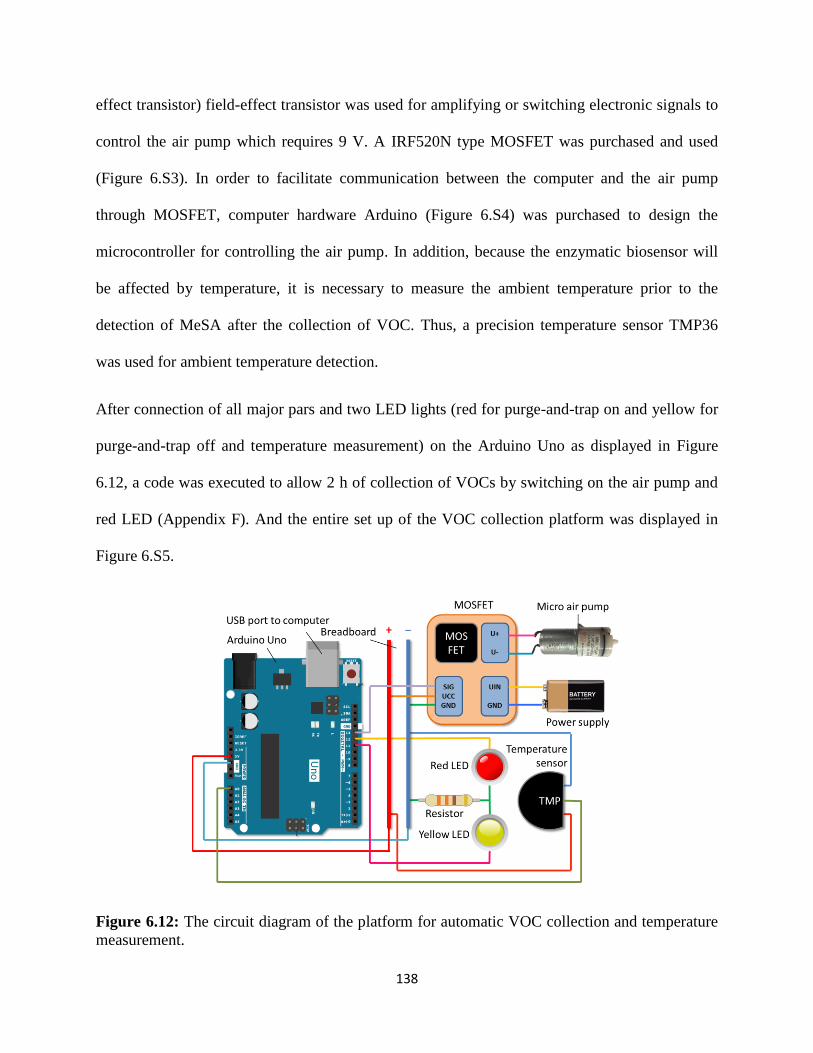
138
effect transistor) field-effect transistor was used for amplifying or switching electronic signals to
control the air pump which requires 9 V. A IRF520N type MOSFET was purchased and used
(Figure 6.S3). In order to facilitate communication between the computer and the air pump
through MOSFET, computer hardware Arduino (Figure 6.S4) was purchased to design the
microcontroller for controlling the air pump. In addition, because the enzymatic biosensor will
be affected by temperature, it is necessary to measure the ambient temperature prior to the
detection of MeSA after the collection of VOC. Thus, a precision temperature sensor TMP36
was used for ambient temperature detection.
After connection of all major pars and two LED lights (red for purge-and-trap on and yellow for
purge-and-trap off and temperature measurement) on the Arduino Uno as displayed in Figure
6.12, a code was executed to allow 2 h of collection of VOCs by switching on the air pump and
red LED (Appendix F). And the entire set up of the VOC collection platform was displayed in
Figure 6.S5.
Figure 6.12: The circuit diagram of the platform for automatic VOC collection and temperature
measurement.

139
After 2 h of collection, the computer automatically switched off the air pump and turned on the
temperature sensor for temperature detection and temperature compensation when SH/TYR-
immobilized biosensor is used for MeSA detection.
6.4 CONLUSION
In addition to SH and TYR that were used for development of bi-enzymatic biosensor for MeSA
detection, this project successfully employed ES as another bio-recognition element for tri-
enzymatic biosensor fabrication that allows the direct detection of MeSA without chemical
hydrolysis of MeSA. However, ES/SH/TYR-immobilized GC electrode displayed significant
lower sensitivity (1.54 µA·cm-2
·µM-1
) compared to the bi-enzymatic biosensor developed in
Chapter 5 (21.3 µA·cm-2
·µM-1
). Lower sensitivity was obtained when SP electrode was used for
tri-enzyme immobilization. Thus, ES was applied in the electrolyte for MeSA hydrolysis during
the VOC collection rather than being immobilized on the electrode. The experiment indicated
that 2 h is sufficient for hydrolysis of a high concentration of MeSA. The whole SP electrode
was used as the detection chip, which does not require extra counter and reference electrodes.
The enzymatic SP chip rendered sensitivity of 3.1 µA·cm-2
·µM-1
for MeSA detection. In
addition to the detection chip, automation of the VOC collection system was designed using a
micro air pump, Arduino Uno as controlling system, and MOSFET as an electronic switch. The
automation system allows the end-user to use a computer for operating and minoring such as
switching on/off micro air pump for VOC collection and temperature measurement.

140
6.5 SUPPLEMENTARY DATA
Figure 6.S1: CV responses of the bi-enzyme GC electrode containing immobilized SH and TYR.
The 2 mL electrolyte consists of 27.8 µM SA with FAD (4.7 µM) and NADH (0.23 mM). The
ratio of SH:TYR loadings by volume on the electrode respectively are 1:9 (red), 3:7 (orange), 5:5
(light green), 7:3 (green) and 9:1 (light blue).
Figure 6.S2: CV responses of the bi-enzyme SP electrode containing immobilized SH and TYR.
The 2 mL electrolyte consists of 27.8 µM SA with FAD (4.7 µM) and NADH (0.23 mM). The
ratio of SH:TYR loadings by volume on the electrode respectively are 1:9 (red), 3:7 (orange), 5:5
(light green), 7:3 (green) and 9:1 (light blue).

141
Figure 6.S3: The IRF520N MOSFET used to control the purge-and-trap.
Figure 6.S4: The Arduino Uno used for computer to interact with MOSFET/Air pump and
temperature sensor.

142
Figure 6.S5: The setup of the platform for automatic VOC collection and temperature
measurement.

143
CHAPTER 7
COMPUTATIONAL MODELING OF BIENZYMATIC BIOSENSOR
To be submitted to Journal of Electrochemical Society.

144
7.1 INTRODUCTION
The platform of bi-enzymatic electrochemical biosensor consisting salicylate hydroxylase (SH)
and tyrosinase (TYR) for methyl salicylate (MeSA) detection has been successfully established
as introduced in the previous chapters. Although the obtained biosensor parameters such as
sensitivity, limit of detection (LOD) and limit of quantification (LOQ) satisfy the requirements
of MeSA detection for plant disease prediction, the improvement of the biosensor performance is
always desired. In order to improve the performance of the biosensor, it is important to
understand the mechanism of both enzyme kinetics and electrochemical kinetics. However, the
current research is primarily based on the experiments to determine the biosensor performance
(e.g. determination of enzyme ratio), rather than from the study of the underlying theory and
mechanisms, Therefore, the theory of operation the biosensor including the study of enzyme
kinetics and the methodology of electrochemical kinetics that enable the design of better
biosensors are discussed in this chapter.
7.1.1 Enzyme kinetics
As introduced in the previous chapters, the detection of MeSA can be realized through either bi-
enzymatic approach using SH and TYR, or the tri-enzymatic approach that additionally uses
esterase (ES) for hydrolysis before bi-enzymatic detection. Therefore, the key reaction in the
cascade is the conversion of salicylate to catechol, and then to electroactive 1,2-benzoquione,
which is described as following kinetic equations:
Salicylate + O2 + NADH + 2H+ +
Salicylate Hydroxylase⇒ Catechol + NAD+ + H2O + CO2
Catechol +1
2O2
Tyrosinase⇒ 1,2 − Benzoquinone + H2O

145
In addition, the experiments performed in Chapter 6 suggested that ES could be added directly
into the electrolyte for MeSA hydrolysis instead of immobilizing on the electrode surface.
Therefore, only SH and TYR for the theoretical treatment is discussed in this chapter. The
kinetic mechanism of SH and TYR will be examined by initial rate measurements by
Ultraviolet–visible spectrometry using the corresponding enzyme assays and the corresponding
kinetic parameters such as Michaelis-Menten constants will be calculated in the experiments for
the electrochemistry modeling.
7.1.2 Electrochemical Modeling
In addition to the enzyme kinetics, the study of electrochemical theory that directly determines
the signal obtained from the reduction of 1,2-benzoquinone is necessary for understanding the
mechanism of the bi-enzyme biosensor. The computational modeling has been widely applied to
various scientific researches including the application of mathematical modelling to investigate
the biosensor behavior (Mell and Maloy 1975, Schulmeister 1990). The computational modeling
can be widely used for understanding the kinetics of the biosensor through which physical
experiments required for biosensor fabrication and improvement could be designed. Governing
equations, initial conditions and boundary conditions are derived from first principles for the
computational modeling in this work. However, solving the mathematical model has not been
attempted as it is beyond the scope of the work.
7.2 MATERIALS AND METHODS
7.2.1 Materials
Salicylate hydroxylase (E.C. 1.14.13.1) was expressed and purified from pTrc99a-nahG
transformed E.coli XL-1 blue as introduced in Chapter 5. Tyrosinase (E.C. 1.14.18.1) derived
146
from mushroom (lyophilized powder, ≥ 1000 units / mg solid) was purchased from Sigma-
Aldrich (St. Louis, MO, USA) and used directly. Sodium salicylate, catechol and NADH were
obtained from Acros Organics (NJ, USA) and FAD was purchased from Alfa Aesar (Haverhill,
MA, USA). All reagents used in the project were analytical grade. 0.1 M potassium phosphate
buffer (PB, pH 7.6) was used to prepare the enzyme assay for both SH and TYR for all
experiments. Manganese (II) chloride tetrahydrate, sodium iodide, sodium hydroxide, sulfuric
acid, sodium thiosulfate and starch were obtained from Alfa Aesar (Haverhill, MA, USA),
Carolina (Burlington, NC, USA), J.T. Baker (Phillipsburg, NJ, USA), Fisher Scientific (Fair
Lawn, NJ, USA), Sigma (St. Louis, MO, USA) and J.T. Baker (Phillipsburg, NJ, USA),
respectively for dissolved oxygen measurement. All aqueous solutions were prepared in 18.2
MΩ nano-pure de-ionized (DI) water.
7.2.2 Apparatus
The initial rate measurements were carried out using Genesys 10S UV-Vis from Thermo
Scientific, and all experiments were conducted at 22 ± 2 ºC.
7.2.3 Methods
7.2.3.1 Initial rate measurements
Since SH requires three substrates (i.e. salicylate (SA), NADH and oxygen), two sets of enzyme
assays are required to calculate the enzymatic parameters. The enzyme assays using different
combinations of SA concentration (10 μM, 20 μM and 50 μM) and NADH concentrations (10
μM, 20 μM and 50 μM) were performed (Appendix G) with air-saturated solution. In addition,
the assay was also performed using different concentration of SA (10 μM, 20 μM and 50 μM) at
the NADH concentration of 100 μM with nitrogen, air and oxygen saturated solutions

147
respectively. The measurements of initial reaction rate in each assay were realized through the
UV measurement at the wavelength of 340 mM, which monitors the decrease of NADH during
the enzymatic reaction. Due to the potential impurities present in the recombinant expressed
enzyme (e.g. NADH dehydrogenase, which causes the consumption of NADH), the decrease of
NADH absorption before and after addition of SA needs to be monitored to calculate the activity
from SH. 0.1 M PB buffer at pH 7.6, water, FAD, NADH, SH were added in the cuvette and
measured for 1 min to record the absorption decrease of NADH as control. Then SA was added
and NADH absorption was measured for another minute as experimental groups. The difference
in UV absorption change rate before and after addition of SA was recorded and used for the
reaction rate calculation.
The TYR enzyme assay (Appendix G) using different concentrations of catechol (10 μM, 20 μM
and 100 μM) was based on the increase in optical density of 1,2-benzoquinone at the wavelength
of 470 nm as experimental when catechol was incubated with TYR (Boscan, Powrie et al. 1962).
The net initial rates were calculated from the UV absorption difference of the experimental and
the control samples (performed in absence of TYR). In addition to the air-saturated experiments,
the same experiments were also conducted in nitrogen and oxygen saturated electrolytes for
obtaining the initial reaction rate at three different oxygen concentrations.
7.2.3.2 Dissolved oxygen measurement
Since SH and TYR depend on the concentration of dissolved oxygen in the electrolyte, it is
necessary to study the oxygen concentration effect. In this project, the concentration of the
oxygen in the assay purged with nitrogen, air and oxygen was measured by Winkler titration
method (Carpenter 1965) (Appendix H) which can be explained by the following steps.

148
2Mn2+ + 4OH− + O2⇒ 2MnO2 + 2H2O
MnO2 + 2I− + 4H+⇒Mn2+ + I2 + 2H2O
2S2O32− + I2 ⇒S4O6
2− + 2I−
The Winkler reagent manganese (II) chloride was used to fix the oxygen in MnO2 in the basic
condition. Then MnO2 was reduced back to Mn2+
under acidic condition while oxidizing I− to I2,
which can be correlated with the amount of sodium thiosulfate during the titration. The dissolved
oxygen concentration can be calculated from the following equation:
C (mM) = 0.18 V (mL),
where C and V denotes the concentration of dissolved oxygen (mM) and volume of Na2S2O3
used during the titration (mL).
7.3 RESULTS AND DISCUSSION
7.3.1 Enzymatic kinetics
7.3.1.1 Salicylate Hydroxylase
Wang et al. indicated that SA and NADH bind to the SH in random order resulting a ternary
complex and release NAD+ before further binds with O2 (Wang and Tu 1984). Therefore, the
reaction rate equation based on the three substrates can be simplified from the equation (Dalziel
1969):
e
v= ∅0 +
∅A[A]+∅B[B]+∅C[C]+∅AB[A][B]
+∅BC[B][C]
+∅AC[A][C]
+∅ABC
[A][B][C]
to the following equation (Wang and Tu 1984):

149
e
v= ∅0 +
∅Sal[Sal]
+∅NADH[NADH]
+∅O2[O2]
+∅Sal∙NADH[Sal][NADH]
where e is the concentration of active center (which is equivalent to the concentration of SH in
this case), v is the observed initial rate and e/v is the reciprocal of the initial reaction rate. The
concentrations of SA, NADH and oxygen are denoted as [Sal], [NADH] and [O2] respectively.
The reciprocal of the maximum rate with unit enzyme concentration is shown as ∅0, whereas
∅Sal, ∅NADH and ∅O2 are functions of rate and/or dissociation constants as defined by Dalziel
(Dalziel 1969).
The reciprocal initial reaction rate of SH were examined at various concentrations of SA and
NADH at a fixed oxygen concentration first. When concentrations of SA were varied at several
concentrations of NADH and a constant oxygen concentration, double reciprocal plots of initial
reaction rates yielded a set of lines that converged to a common point (Figure 7.1). Such double
reciprocal plot clearly indicated that the SH is capable of forming ternary complex consisting SH,
SA and NADH before other enzymatic reaction takes place.

150
Figure 7.1: Lineweaker-Burk plots of SH activity versus salicylate concentration (10 μM, 20 μM
and 50 μM) at several NADH concentrations of 10 μM, 20 μM and 50 μM and a fixed oxygen
concentration of 0.28 mM. Insets show the secondary plots by plotting the slopes and intercepts
from the primary plot against the reciprocal concentration of NADH.
The secondary plots can be derived by plotting the slopes and intercepts from the primary plot
(Figure 7.1) against the reciprocal concentration of NADH (the insets of Figure 7.1) which yields
the parameters – ∅Sal∙NADH, ∅Sal and ∅NADH as it shown in Table 7.1.
Table 7.1: Biological meanings of the slopes and intercepts from the secondary plot for SH.
Secondary plot Slope Intercept
Slope ~ 1/[NADH] ∅Sal∙NADH ∅Sal
Intercept ~ 1/[NADH] ∅NADH ∅0+ ∅O2/[O2]
Intercept ~ 1/[O2] ∅O2 ∅0+ ∅NADH/[NADH]
Double reciprocal plot of initial rate versus reciprocal concentration of SA at several
concentrations of dissolved oxygen and a fixed NADH concentration of 100 μM, however,

151
produced a set of parallel lines (Figure 7.2), indicating a ping-pong model of reaction;
subsequent to the formation of ternary complex of SH, SA and NADH.
Figure 7.2: Lineweaker-Burk plots of SH activity versus salicylate concentration (10 μM, 20 μM
and 50 μM) at several oxygen concentrations of 0.1 mM, 0.23 mM and 0.99 mM and a fixed
NADH concentration of 100 μM. Insets show the secondary plots by plotting the intercepts from
the primary plot against the reciprocal concentration of oxygen.
Since parallel lines were obtained from Figure 7.2, intercepts were used for the secondary plot
against the reciprocal concentration of oxygen. Therefore, ∅O2 can be derived from the slope of
the secondary plot and ∅0 can be calculated accordingly.
The reciprocal of the maximum rate with unit enzyme ∅0 was calculated and other parameters
listed in Figure 7.1 were obtained directly from the slopes and intercepts, and are tabulated in
Table 7.2 while Km,sal, Km,NADH and Km,O2 are Michaelis-Menten constants for SA, NADH and
oxygen respectively.

152
Table 7.2: Kinetic coefficients for SH.
Term Value determined Kinetic equivalent
∅0 3.97×10⁻⁴
min -
∅Sal 1.00×10⁻⁸
M·min Km,sal ∙ ∅0
∅NADH 4.40×10⁻⁹
M·min Km,NADH ∙ ∅0
∅O2 4.43×10⁻⁸
M·min Km,O2 ∙ ∅0
∅Sal∙NADH 7.60×10⁻¹⁴
M2·min -
Additionally, the Michaelis-Menten constants for SA, NADH and oxygen were calculated
according to Table 7.2, and determined to be 25 μM, 11 μM and 0.11 mM respectively. It is
noteworthy that Km,sal of 25 μM coincides with the linear range of SA detection in Chapter 5 and
6 (~ 27.8 μM), i.e. the linear range of the detection does not exceed the Km,sal due to the
saturation of the enzyme by the substrate. The Michaelis-Menten constant of SH for NADH
(Km,NADH) further proved that the concentration of NADH in the electrochemical cell (0.23 mM)
during the MeSA detection was significantly higher (more than 20 fold) than Km,NADH, which is
11 μM. This indicated that the reaction rate was not limited by NADH concentration.
7.3.1.2 Tyrosinase
Similar to the tri-substrate enzymatic reaction, a similar equation can also be derived for TYR
which catalyzes two substrates (i.e. catechol and oxygen) as it shown below:
e
v= ∅0 +
∅Cat[Cat]
+∅O2[O2]
+∅Cat∙O2[Cat][O2]
where e is the concentration of active center (which is equivalent to the concentration of
tyrosinase in this case), v is the observed initial rate and e/v is the reciprocal of the initial reaction

153
rate. The concentrations of catechol and oxygen are denoted as [Cat] and [O2] respectively. The
reciprocal of the maximum rate with unit enzyme concentration is shown as ∅0, whereas ∅Cat
and ∅O2 are functions of rate and/or dissociation constants as defined by Dalziel (Dalziel 1957).
The reciprocal of initial reaction rate was plotted against different catechol concentrations (10
μM, 20 μM and 100 μM) and oxygen concentrations prepared by purging nitrogen (0.1 mM), air
(0.26 mM) and oxygen (0.94 mM). When the concentration of catechol varies at different
oxygen concentration, the Lineweaver-Burk plot generated a set of linear lines converging to a
common point (Figure 7.3). This plot indicated the ternary complex formation consisting TYR,
catechol and oxygen (Siegbahn 2004).
Figure 7.3: Lineweaker-Burk plots of TYR activity versus catechol concentration (10 μM, 20
μM and 100 μM) at several oxygen concentrations of 0.1 mM (purged with nitrogen), 0.26 mM
(purged with air) and 0.94 mM (purged with oxygen). Insets show the secondary plots by
plotting the slopes and intercepts from the primary plot against the reciprocal concentration of
oxygen.

154
Secondary plots were generated by plotting the slopes and intercepts of the primary plot against
the reciprocal of oxygen concentration. The parameters (i.e. ∅0, ∅Cat, ∅O2 and ∅Cat∙O2) can be
derived from the Table 7.3 and the values are tabulated in Table 7.4.
Table 7.3: Biological meanings of the slopes and intercepts from the secondary plot for TYR.
Secondary plot Slope Intercept
Slope ~ 1/[O2] ∅Cat∙O2 ∅Cat
Intercept ~ 1/[O2] ∅O2 ∅0
Table 7.4: Kinetic coefficients for TYR.
Term Value determined Kinetic equivalent
∅0 6.38×10⁻⁵
min -
∅Cat 5.31×10⁻⁹
M·min Km,Cat ∙ ∅0
∅O2 1.83×10⁻⁹
M·min Km,O2 ∙ ∅0
∅Cat∙O2 1.95×10⁻¹²
M2·min -
Additionally, Km values for catechol and oxygen (i.e. Km,Cat and Km,O2 ) were calculated and
determined to be 83 μM and 29 μM respectively.
7.3.2 Modeling
After understanding the mechanism of the enzymatic reaction and the derivation of kinetic
parameters, a one-dimensional continuum mathematical model was developed to understand the
electrochemical mechanisms involving three regions: the enzyme layer, diffusion layer, and bulk
solution region as shown in Figure 7.4, where d and f represent thickness of the enzyme layer
and diffusion layer respectively.

155
Figure 7.4: Schematic illustration of three regions: enzyme layer, diffusion layer and bulk
solution region formed on the electrode surface.
7.3.2.1 Governing Equations
In the enzyme layer, enzymatic reactions of both enzymes play an important role on the electrode
surface in addition to mass transfer, therefore, coupling the enzymatic reaction in the enzyme
with the Fick’s second law of diffusion is necessary to derive the governing equations (0 < x < d,
t > 0):
∂U1,e
∂t= D1,e
∂2U1,e
∂x2− v1
∂U2,e
∂t= D2,e
∂2U2,e
∂x2− v1 −
v2
2
∂U3,e
∂t= D3,e
∂2U3,e
∂x2− v1
∂U4,e
∂t= D4,e
∂2U4,e
∂x2− 2v1
∂U5,e
∂t= D5,e
∂2U5,e
∂x2+ v1 − v2
∂U6,e
∂t= D6,e
∂2U4,e
∂x2+ v2
where v1 and v2 refer to the enzymatic reaction of SH and TYR that discussed in Section 7.3.1,
and x and t stand for space from the electrode and time respectively, U1,e, U2,e, U3,e, U4,e, U5,e and
U6,e are molecular concentrations of the substrates (SA, oxygen, NADH, proton), intermediate
(catechol) and product (1,2-benzoquinone) in enzyme layer of thickness d, respectively. And D1,e,

156
D2,e, D3,e, D4,e, D5,e and D6,e are the diffusion coefficients of the corresponding compounds in
enzyme layer. And r1 and r2 refer to reaction rate of SH and TYR respectively.
In the diffusion layer (d < x < d + f, t > 0), only the mass transfer of all species take place due to
lack of enzymatic reaction, therefore, second Fick’s law can be applied directly as below:
∂U1,d
∂t= D1,d
∂2U1,d
∂x2
∂U2,d
∂t= D2,d
∂2U2,d
∂x2
∂U3,d
∂t= D3,d
∂2U3,d
∂x2
∂U4,d
∂t= D4,d
∂2U4,d
∂x2
∂U5,d
∂t= D5,d
∂2U5,d
∂x2
∂U6,d
∂t= D6,d
∂2U4,d
∂x2
where U1,d, U2,d, U3,d, U4,d, U5,d and U6,d are molecular concentrations of the substrates (SA,
oxygen, NADH, proton), intermediate (catechol) and product (1,2-benzoquinone) in diffusion
layer of thickness f, respectively. And D1,d, D2,d, D3,d, D4,d, D5,d and D6,d are the diffusion
coefficients of the corresponding compounds in diffusion layer.
7.3.2.2 Initial conditions
At the beginning of the biosensor operation (t = 0), oxygen, NADH and protons are already
present in the electrolyte throughout enzyme layer and diffusion layer as the same concentration
in the bulk solution.
U2(𝑥, 0) = U2∗ U3(𝑥, 0) = U3
∗ U4(𝑥, 0) = U4∗ (0 ≤ x ≤ d + f)
where U2, U3 and U4 represent the concentrations of oxygen, NADH and protons throughout the
three regions while U2∗ , U3
∗ and U4∗ represent the corresponding concentrations in the bulk
solution.
Both catechol and 1,2-benzoquinone are not presented at the beginning of the reaction (t = 0),
thus both concentrations are zero:

157
U5(𝑥, 0) = U6(𝑥, 0) =0 (0 ≤ x ≤ d + f)
where U5 and U6 represent the concentration of catechol and 1,2-benzoquinone throughout three
regions.
SA is added into the electrochemical system at the beginning of the reaction (t = 0), therefore the
concentration at the boundary of diffusion layer is the same as that in the bulk solution. However,
the concentration of salicylate within both enzyme and diffusion layer are not affected:
U1(𝑑 + 𝑓, 0) = U1∗
U1(𝑥, 0) = 0 (0 ≤ x < d + f)
where U1 and U1∗ represent the concentrations of SA throughout the three regions and the
concentration of SA in the bulk solution.
7.3.2.3 Boundary conditions
Boundary conditions are examined at the boundaries between the electrode and enzyme layer (x
= 0), between enzyme layer and diffusion layer (x = d) and between diffusion layer and bulk
solution (x = d + f)
All the compounds in the cascadic reaction other than 1,2-benzoquinone (i.e. SA, oxygen,
NADH, proton and catechol) are considered to be electrochemically inactive due to lack of redox
peaks from abovementioned compounds, therefore the fluxes at the electrode surface (x = 0) are
considered as 0:
D1,d∂U1,e
∂x= D2,d
∂U2,e
∂x= D3,d
∂U3,e
∂x= D4,d
∂U4,e
∂x= D5,d
∂U5,e
∂x= 0 (x = 0)

158
During the measurement of MeSA, the electrode was polarized causing the consumption of 1,2-
benzoquinone for detection, therefore, the biosensor was assumed to be non-Clark type and 1,2-
benzoquinone is assumed to be constantly reduced to zero at the electrode surface.
U6,e = 0 (𝑥 = 0)
At the boundary of enzyme layer and diffusion layer (x = d), the entering and ongoing fluxes
from all species at both sides of the boundary are considered to be equal. Additionally, the
concentrations of all species are considered to be continuous, therefore, the concentrations of all
species at both sides of the boundary are considered to be equal.
De∂Ue
∂x= Dd
∂Ud
∂x (x = d)
Ue(𝑑, 𝑡) = Ud(𝑑, 𝑡)
At the boundary between diffusion layer and bulk solution (x = d + f), the concentrations of all
reactants – SA, oxygen, NADH and protons remain the same as those in bulk solution
respectively, and the concentration of both intermediate – catechol and final enzymatic product
– 1,2-benzouqinone remain 0.
U1,d(𝑑 + 𝑓, 𝑡) = U1∗ U2,d(𝑑 + 𝑓, 𝑡) = U2
∗ U3,d(𝑑 + 𝑓, 𝑡) = U3∗ U4,d(𝑑 + 𝑓, 𝑡) = U4
∗
U5,d(d + f, t) = U6,d(d + f, t) = 0
7.3.2.4 Biosensor response
Cathodic current collected from the reduction of 1,2-benzoquinone formed after enzymatic
reaction is used as biosensor response. The current density can be determined by Faraday’s Law
and Fick’s law:

159
𝑖(𝑡) = 𝑛𝑒𝐹𝐷6,𝑒𝜕𝑈6,𝑒𝜕𝑥
(𝑥 = 0)
7.4 CONCLUSION
Lineweaker-Burke plots were generated for SH and TYR by plotting the reciprocal of initial
reaction rate against various reciprocal concentrations of reactants. The results indicated the SH
firstly formed SH-SA-NADH ternary complex with substrates SA and NADH before releasing
the product (NAD+). After that, the SH reacts with oxygen and generates catechol, carbon
dioxide and water as ping-pong type mechanism. The results also proved that ternary complex
TYR-catechol-O2 was formed during catalysis. Enzyme-kinetic parameters such as the reciprocal
of the maximum rate with unit enzyme concentration (∅0) and the functions of rate and/or
dissociation constants defined by Delziel (∅A, ∅B, etc.) were calculated from the secondary plots
and Michaelis-Menten constant was calculated for computational modeling. The linear range of
the MeSA detection (0 – 27.8 μM) could be explained by Km,Sal (25 μM), within which the
reaction rate is proportional to the concentration of SA. Additionally, governing equations, initial
conditions, boundary conditions and biosensor response equation was derived for computational
modelling.

160
CHAPTER 8
COMMERCIALIZATION POTENTIAL FOR A PORTABLE PLANT DISEASE
DETECTION SYSTEM
8.1 OVERVIEW AND MOTIVATION
8.1.1 The proposed early-detection device for plant disease detection
Economic losses in the agricultural field due to pathogen infection and pest-infestation have been
introduced in Chapter 1 in detail. It has been estimated that over $40 billion worth of economic
loss could be attributed to pathogen infection and pest-infestation in the U.S. alone (Pimentel,
Zuniga et al. 2005, Roberts, Schimmelpfennig et al. 2006). The narrow profit margins limit most
of the producers’ option from choosing highly effective controls for most pathogen/pest-induced
diseases. Instead, the traditional preventive approaches such as large-scale-spraying of chemicals
(e.g. fungicides or pesticides) on a pre-determined schedule is still the most widely adopted
solution to control and/or prevent most plant diseases caused by pathogens and pests in the
agricultural field during cultivation. This results in excessively unnecessary chemical sprayings
that increase the production costs and impacts environment and food quality. However, when the
chemical spraying is not properly timed or late, it proves ineffective and could result up to 90 %
of grower losses (Granke, Quesada-Ocampo et al. 2012). Therefore, end-user operable
diagnostic device for early detection of pathogen infection / pest infestation would help growers,

161
distributors and other food processors to monitor and contain the infections on time, spray
chemicals conservatively and selectively to only the infected regions as well as time the
sprayings precisely in order to reduce cost. As the laboratory-based electrochemical biosensor
was developed with esterase, salicylate hydroxylase and tyrosinase for MeSA detection as
introduced previously, commercialization of a portable device for plant disease detection became
our goal. The underlying innovation for such a device could also be potentially used for other
applications where early detection is necessary.
8.1.2 The importance of understanding customer needs
The proposed plant-disease detection device is intended to be developed for growers. Therefore,
it becomes important to study the customer base and the market opportunity for such a
device/technology. Though there is some information available in the literature about the need in
the agricultural industry for technology such as the one being developed in this dissertation
project, the information from the potential customers is still insufficient. And the end user need
for a plant-disease detection device or technology was never validated against potential end-users
(i.e. growers, food handlers and distributors, etc.) in the previous research. Thus, direct
engagement with farmers and other end-users could be helpful in determining the demand,
potential market size and commercialization potential for the aforementioned device. Moreover,
the needs may differ broadly for different end users, and, therefore, a comprehensive
understanding of the different customer segments is necessary for commercialization.
8.1.3 Research funded by NSF Innovation Corps (I-CorpsTM
) program
The National Science Foundation (NSF) funded I-Corps program prepares scientist and
engineers who lack knowledge and opportunities for commercialization in the academic field to

162
extend the focus beyond the technology towards technology transfer and commercialization, with
the goal of broadening the economic and societal benefits of NSF-funded research projects.
During the I-Corps program, the project teams learn to identify valuable product opportunities
that can emerge from a fundamental research, and learn the entrepreneurship skills and business
knowledge for technology transfer and commercialization. Key objectives of the program are to
discover the product-market fit of the proposed product, its corresponding potential customer
segment, and to convey the value propositions of the product / service to the customers. The
program requires the project teams to carry out interviews, especially in-person interviews with
the potential customers from different customer segments, in order to understand the customer
needs.
During the interviews, the perceived issues and risks related to crop disease management
practices were verified and/or validated through specific questions and surveys of potential
customers of the device. Therefore, the problem of the customers and their need for the device
can be clearly understood, and the development of the detection device can be improved based
on the value propositions and customer segments accordingly before the start of the
commercialization.
8.1.4 Interviews and anticipated output
During the I-Corps program in Los Angeles, CA, from October to December, 2014, the I-Corps
team consisting Yi Fang as Entrepreneurial Lead (EL), Dr. Ramaraja Ramasamy as Principal
Investigator (PI) and Mr. Stefan Schulze as mentor underwent an intense customer discovery
exercise. Interviews of potential customers to determine product-market fit were conducted
across the United States including California, Georgia, North Carolina and South Carolina as
163
well as in foreign countries, such as Brazil and Germany. Overall 105 potential customers were
interviewed during this period, with over 91 in-person interviews.
A questionnaire as shown below was prepared. Questions related to basic profiling of the
interviewee, their current methods for disease management, and their willingness to adopt a new
technology were included in the questionnaire. The questions were related to:
Basic information:
o Company name, person name, position in the company (e.g. employee, technician,
owner, manager)
o Type of business (e.g. agricultural production, distribution, processor, lumbering
industry, nursery)
o Type of products (e.g. the type of vegetable, fruit, tree, flower)
o The scale of the business (e.g. the average annual sales / revenue, size of the field)
Current problems:
o In their cultivation of plants (crops, vegetables, fruits, trees and nurseries), were
they suffering from plant diseases caused by pathogens or pests?
o If the answer is YES, what is their current approach to managing crop diseases?
Application of fungicide and pesticide
o Is the currently used approach effective? What is the cost of the currently used
approach?
Market opportunity for the proposed device:
o Would customers be interested in a device which provides them an early detection
of plant diseases that allows for reduction in fungicide / pesticide usage?
o What other characteristics and properties would they expect from such a device?

164
o How much would they be willing to pay for the device?
During each interview, the information collected from the interviewees was categorized based on
the types and scale of business. The information was used for determining the value proposition
and narrow down the customer segments.
8.2 DISCOVER THE CUSTOMER SEGMENTS AND VALUE PROPOSITIONS
8.2.1 Application of business model canvas
As introduced earlier, the key aspect of the I-Corps interview is to discover the product-market
fit before real commercialization of the product is carried out. Business model canvas (Figure 8.1)
was used to describe the rationale of how an organization creates, delivers and captures value
and can be used to pivot the assumptions of both value proposition and customer segments
during and after interview to find the best commercial model for product-market fit.
Figure 8.1: The business model canvas used during I-Corps program to discover the best
product-market fit.

165
Among all the nine building blocks of the business model canvas, the most important blocks are
customer segments, which defines the groups of people or organizations an enterprise aims to
serve, and the value propositions, which describes the bundle of products and services that create
values for specific customer segments.
8.2.2 Customer segments and value propositions
At the very beginning of the I-Corps program, customer segments and value proposition were
merely composed of assumptions about market opportunity. Six categories of potential customer
segments were proposed, including vegetable/fruit handlers and distributors, crop growers,
nursery wholesalers, nursery growers and forestry agents. The three value propositions were
proposed including rapid detection of plant diseases, increase the productivity and minimize the
fungicide/pesticide use as shown in the business model canvas below:

166
Figure 8.2: Business model canvas (original version) proposed at the beginning of the I-Corps
program.
During the interviews with potential customer segments, the value propositions were fully
explained to the interviewees as described in the questionnaire and customer segments were
narrowed down to eliminate the nursery wholesalers as a customer segment. This was because
nurseries had a rapidly turn around, and any potential infection or disease do not directly affect
the nurseries’ business. We also narrowed down the vegetable/fruit handlers and distributors to
those who have long storage time (longer than 1 week) and eliminated the fast-operating
handlers and distributors. Furthermore, forestry was also removed from the customer segments in
order to focus on only agricultural application. The value proposition was also revised and
updated according to the customer needs. For example, rapid detection was quantitatively
defined as less than 1 day, and productivity improvement was defined to be 10 % and fungicide /
pesticide use reduction was defined to be 50 %. In addition, some potential customers require the
shelf life prediction from the device, which requires the biosensor to provide quantitative
information rather than just qualitative information (Figure 8.3).

167
Figure 8.3: Second version of business model canvas with forestry segment removed and
vegetable/fruit handlers and distributors narrowed down.
In the later interviews within the potential customer segment of crop growers (including
vegetable and fruit growers) and nursery growers, it was found that nursery growers were
generally not interested in the proposition of the device due to lack of the described plant disease.
Additionally, the scale of the nursery growers was generally small enough for the growers pay
enough attention to spot the diseases rather than rely on the sensors. Coincidently, crop growers
were narrowed down to vegetable and fruit growers with large (> 100 acres) farms cultivating
tomato, cucumber, squash, pumpkin and other high-value produce (Figure 8.4).

168
Figure 8.4: Third version of business model canvas with nursery growers segment removed and
crop growers narrowed down to vegetable/fruit growers with large farms.
8.3 MARKET OPPORTUNITY
8.3.1 Preliminary market research
Based on the information collected during the I-Corps program, our target market space, as
narrowed down in the business model canvas (Figure 8.4) from the interviews, is the vegetative
crop growers and handlers/distributors. Among them, the vegetable/fruit growers spending at
least $50,000 for chemical spraying annually are our archetypal customers whose primary
concern is to protect the crops from pathogen infection and pest infestation during growing and
harvesting seasons.

169
The potential customers indicated that pathogenic fungal infections cause numerous diseases
such as white mold, grey mold, crown rot, leaf blight in varieties of cucurbit crops, grapes and
strawberries. If not diagnosed, treated and controlled on time, these infections quickly spread to
the entire field by wind, human or animal contact and splashed water; resulting in devastating
damage to the crops. In addition to the growers, the vegetable handlers/distributors with long
storage time also expressed similar concern about the disease and interest in the detection device.
Although the produce is sold frequently to the food handler/distributor through mass distribution
well before the infection and diseases appeares, the hidden pathogens (if the crop is infected
already) could break out at a later time and low the values of the vegetables and fruits.
The interview also indicated the frequency of the chemical spraying is from 4 days (grapes) to 15
days (cucurbit crops) depending on the crop type, weather and geography, and the average cost
of the chemical sprayings is about $200/acre/application and up to $3,000/acre/season for some
crops. One of our potential customers from Germany, owns a 3 acre greenhouse to grow
tomatoes mentioned spending €30,000 annually on fungicide sprayings. Our potential customers
typically take one of two options for chemical sprayings: (i) Unwilling to take risk of the crop
losses, most vegetable/fruit growers adopt a preemptive spraying in which, chemicals, such as
fungicide and pesticide, are applied to the entire crop field on a pre-determined schedule
regardless of weather or the condition of infection. This type of customers spends much more on
the chemical sprayings than what they are supposed to. (ii) Risk-takers, who are willing to take
some risks by reducing costs of chemical sprayings, would rather wait for the onset of visual
symptoms or bad weather that favors the diseases before applying chemical sprayings. But this
option is not popular among most growers, except those who cultivate pumpkins which are not
harvested as food. However, both types of growers expressed their interests in adopting a
170
solution that provides early detection of plant diseases which could further help them determine
the single infectious ‘plot’ of the crop field to perform specific sprayings, which decreases the
chemical expenses and maintain the standard of good agricultural practices (GAP) program.
8.3.2 Market size
The market size is estimated in this section based on how much direct economic value could be
brought to the customers by means of reduced sprayings. The immediate market space is the
agricultural industry that heavily relies on the chemical sprayings to contain and prevent
pathogen infection / pest infestation. The worldwide fungicide spraying is estimated to be about
$9.2 billion in 2014 (total available market) of which $1.375 billion was spend in the United
States (service available market). If our value proposition is to reduce the spraying by at least
50 %, this could bring the benefit of up to ~ $700 million annually (target market) to the
agricultural industry (Figure 8.5). However, the data need further refinement based on the
fungicide expenditures by regions and crop types, whose data are provided in the pie chart in
Figure 8.5.

171
Figure 8.5: Total available, service available and target markets (above). Fungicide spraying
costs by state and crop type (below).
The data shows that the fungicide expenditures in Georgia alone account for $120 million and
vine crops such as tomatoes and grapes constitute the largest consumption of fungicide. The data
shown in Figure 8.5 indicated the current market that is available and our goal is to capture at
least 10 % of our target market within the first 3 years of starting our business.
8.4 CONCLUSION
The NSF funded I-Corps program between the period of October and December of 2014 initiated
our path towards commercialization of the biosensor-based early detection device for predicting
plant diseases. In this program, the product-market fit with different types of customers was

172
studied and the business model canvas was updated every week through 8-week period during
which potential customers were interviewed. The interviews we conducted with end-users,
buyers and other recommenders suggest different attitudes towards the value propositions of our
product. Through the interviews, we confined the potential customer segments to vegetable and
fruit growers (e.g. tomatoes, strawberries, grapes, etc.) with large scale of farmlands (> 100
acres). And the value propositions provided by the early detection device was revalidated using
interviews, which provides the motivations for the device development. From the requirements
and interests of the potential customers, we learnt that a quantitative method for the prediction of
vegetable / fruit shelf life is highly desired, suggesting the areas of focus for our future steps. In
addition, the market size was also estimated based on the current fungicide expenditures for
agricultural industry.
173
CHAPTER 9
CONCLUSIONS AND FUTURE DIRECTIONS
Although various methods including both direct detection methods for plant pathogens and pests
and indirect detection methods for plant disease symptom have been developed for plant disease
prediction, they either require expensive instruments or skilled operators to carry out the
detection tests. Therefore, in dissertation research, an early detection method that is different
from the traditional practices was developed using electrochemical biosensors through the
measurement of volatile organic compounds that are released as chemical markers during a
biotic stress event in plants. A multi-disciplinary approach to develop such biosensor could aid in
proper disease management practices, including minimizing chemical spraying, improved cost
savings, improved food quality and minimize environmental impact of the chemicals. Such
efforts have been carried out in this dissertation research in three different dimensions:
(1) Electrochemical biosensors for volatile organic compounds
The research work reported in this dissertation is the illustration of electrochemical sensors for
three volatile organic compounds that can be used as the biomarkers for the plant disease
prediction – 4-ethylguaiacol, 4-ethylphenol and methyl salicylate. 4-Ethylguaiacol and 4-
ethylphenol are produced by Phytophthora cactorum when infecting various plants, such as
strawberries, and causes crown rot and can devastate the entire crop field. Detection of 4-

174
ethylguaiacol was realized in this project using metal oxide-modified (TiO2 and SnO2) screen
printed electrodes, which generates good sensitivity and low limit of detection to nanomole scale.
The detection of 4-ethylphenol was realized through the immobilization of enzyme tyrosinase on
the glassy-carbon electrode by cross-linker PBSE. The analyte 4-ethyl-phenol was oxidized on
the electrode to form 4-ethyl-1,2-benzoquinone by both monooxygenase activity (forming 4-
ethyl-1,2-hydroquinone) and catechol activity (forming 4-ethyl-1,2-benzoquinone) from
tyrosinase. 4-Ethyl-1,2-benzoquinone can be reduced on the electrode surface due to its
electrochemical activity.
Detection of methyl salicylate, a common volatile organic compound that plays an important role
in plant defense response was demonstrated using two methods. The first method involved the
enzyme combination alcohol oxidase and horseradish peroxidase as recognition element.
Although the approach was proven to be satisfactory, a second approach consisting of
recombinant expressed salicylate hydroxylase and tyrosinase as recognition element was
developed to achieve enhanced sensitivity (30.6 µA·cm-2
·µM-1
) and improved detection limits
(13 nM). In addition to the noncovalent functionalization method for enzyme immobilization
using PBSE, other cross-linking strategies based on N-(1-Pyrenyl) maleimide and poly-L-lysine
were also explored as alternatives for enzyme immobilization on nanostructured electrodes.
In addition to the bi-enzymatic biosensor, an esterase was introduced in the system to make a tri-
enzyme system for methyl salicylate detection without using the chemical method to hydrolyze
methyl salicylate before detection. A screen-printed electrode was successfully prepared for
methyl salicylate detection with a quarsi-reference electrode. In addition, a computer controlled
platform for automated collection of volatile organic compounds and temperature measurements
was designed using MOSFET, allowing the control of a micro air pump through computer and

175
Arduino Uno to allow for the communication between a computer and the electronic device that
contains the biosensor.
2) The mathematical modeling for bi-enzymatic reactions
In addition to the evaluation of bi-enzymatic (salicylate hydroxylase and tyrosinase) biosensors
using electrochemical characterization tools, the mechanisms of the bi-enzymatic systems were
also studied using enzyme assays. The initial reaction rates of both enzymes were measured
using UV-Vis spectroscopy at different concentration of substrates. The Lineweaker-Burk plot
generated from the initial reaction rate against substrate concentrate indicated ternary-complex
was formed in salicylate hydroxylase with salicylate and NADH, while the ping-pong reaction
mechanism was observed in the oxygen utilization. The similar formation of ternary-complex in
tyrosinase can also be demonstrated by the Lineweaver-Burk plot. In addition to the kinetic
mechanisms, the enzyme kinetic parameters defined by Dalziel was derived and calculated from
the Lineweaver-Burk plots, which in return, explained the biosensor linear range and can be used
for the mathematical modelling. The electrochemical modeling including derivation of governing
equations, initial conditions, boundary conditions and biosensor response equation were also
discussed.
(3) Commercialization approaches by I-Corps program
Although the laboratory research work accounted for a majority of this dissertation research, the
validation of assumptions about the biosensor device and its commercialization prospects were
carried out to understand the product-market fit through the I-Corps program. The assumption
validations include the existence of plant diseases in agriculture, current methods for plant
disease prediction and prevention, and the necessity of the biosensor device. Based on the

176
interviews conducted during the program, a business model canvas was developed and later
updated. During the I-Corps program, the potential customer segments were narrowed down to
specific group of people, and the value proposition of the product (biosensor device) was revised.
The project confirmed the existence of a commercial need for a biosensor device for early
detection of plant diseases.
FUTURE DIRECTIONS:
1) The mathematical developed in chapter 8 will be rigorously solved in order to fully
understand the biochemical kinetic and electrochemical reaction and transport mechanisms
that govern the operation and performance of the biosensors for further optimization and
improvement.
2) Improving enzyme stability could be an important goal for our future work as the enzyme
stability determines the shelf life and operational duration of the biosensor. Other enzyme
cross-linking strategy could be explored for better immobilization and stabilization of
enzymes on the electrode. Lyophilization of enzymes could be explored for removing the
solvent on the electrode when the enzyme is immobilized on the electrode for better shelf life.
3) Finally, real world application of the developed biosensor needs to be evaluated for the on-
field detection. Different crops reported for MeSA generation could be our future target. In
order to ensure the applicability of the biosensor at different temperature (which affects the
enzyme activity), the developed biosensor will also be calibrated under different temperature
before on-field test is carried out.

177
REFERENCES
Akkara, J. A., K. J. Senecal and D. L. Kaplan (1991). "Synthesis and characterization of
polymers produced by horseradish peroxidase in dioxane." Journal of Polymer Science
Part A: Polymer Chemistry 29(11): 1561-1574.
Armbruster, D. A. and T. Pry (2008). "Limit of blank, limit of detection and limit of
quantitation." Clin Biochem Rev 29(Suppl 1): S49-52.
Armstrong, N. R., A. W. Lin, M. Fujihira and T. Kuwana (1976). "ELECTROCHEMICAL AND
SURFACE CHARACTERISTICS OF TIN OXIDE AND INDIUM OXIDE
ELECTRODES." Analytical Chemistry 48(4): 741-750.
Bakker, E. (2004). "Electrochemical sensors." Analytical chemistry 76(12): 3285-3298.
Bard, A. J., L. R. Faulkner, J. Leddy and C. G. Zoski (1980). Electrochemical methods:
fundamentals and applications, Wiley New York.
Bernasconi, M. L., T. C. Turlings, L. Ambrosetti, P. Bassetti and S. Dorn (1998). "Herbivore‐induced emissions of maize volatiles repel the corn leaf aphid, Rhopalosiphum maidis."
Entomologia Experimentalis et Applicata 87(2): 133-142.
Boscan, L., W. Powrie and O. Fennema (1962). "Darkening of red beets, Beta vulgaris." Journal
of Food Science 27(6): 574-582.
Brigati, J. R. and V. A. Petrenko (2005). "Thermostability of landscape phage probes."
Analytical and bioanalytical chemistry 382(6): 1346-1350.
Bru, R., A. Sanchez‐Ferrer and F. García‐Carmona (1989). "Characteristics of tyrosinase in
AOT–isooctane reverse micelles." Biotechnology and bioengineering 34(3): 304-308.
Buttery, R., R. Seifert, D. Guadagni and L. Ling (1969). "Characterization of some volatile
constituents of bell peppers." Journal of Agricultural and Food Chemistry 17(6): 1322-
1327.
Byrne, B., E. Stack, N. Gilmartin and R. O’Kennedy (2009). "Antibody-based sensors: principles,
problems and potential for detection of pathogens and associated toxins." Sensors 9(6):
4407-4445.
Caboni, P., G. Sarais, M. Cabras and A. Angioni (2007). "Determination of 4-Ethylphenol and 4-
Ethylguaiacol in Wines by LC-MS-MS and HPLC-DAD-Fluorescence." Journal of
agricultural and food chemistry 55(18): 7288-7293.
Cai, H., J. Caswell and J. Prescott (2014). "Nonculture molecular techniques for diagnosis of
bacterial disease in animals a diagnostic laboratory perspective." Veterinary Pathology
Online 51(2): 341-350.
Candresse, T., H. Lot, S. German-Retana, R. Krause-Sakate, J. Thomas, S. Souche, T. Delaunay,
M. Lanneau and O. Le Gall (2007). "Analysis of the serological variability of Lettuce
mosaic virus using monoclonal antibodies and surface plasmon resonance technology."
Journal of general virology 88(9): 2605-2610.
Cao, X., Y. Ye and S. Liu (2011). "Gold nanoparticle-based signal amplification for biosensing."
Analytical biochemistry 417(1): 1-16.
Carpenter, J. H. (1965). "The Chesapeake Bay Institute technique for the Winkler dissolved
oxygen method." Limnology and Oceanography 10(1): 141-143.
Chaerle, L., I. Leinonen, H. G. Jones and D. Van Der Straeten (2007). "Monitoring and
screening plant populations with combined thermal and chlorophyll fluorescence
imaging." Journal of Experimental Botany 58(4): 773-784.

178
Chitarra, L. G. and R. W. Van Den Bulk (2003). "The application of flow cytometry and
fluorescent probe technology for detection and assessment of viability of plant
pathogenic bacteria." European journal of plant pathology 109(5): 407-417.
Clark, M. F. and A. Adams (1977). "Characteristics of the microplate method of enzyme-linked
immunosorbent assay for the detection of plant viruses." Journal of general virology
34(3): 475-483.
Clay, E. (2002). "Food security: concepts and measurement." Trade reforms and food security:
Conceptualising the linkages: 25-34.
Comninellis, C. and C. Pulgarin (1993). "Electrochemical oxidation of phenol for wastewater
treatment using SnO 2, anodes." Journal of applied electrochemistry 23(2): 108-112.
Conway, G. (2012). One billion hungry: can we feed the world?, Cornell University Press.
Cosnier, S. and C. Innocent (1993). "A new strategy for the construction of a tyrosinase-based
amperometric phenol and o-diphenol sensor." Bioelectrochemistry and bioenergetics
31(2): 147-160.
Dalziel, K. (1957). "Initial steady state velocities in the evaluation of enzyme-coenzyme-
substrate reaction mechanisms." Acta chem. scand 11(1): 706-723.
Dalziel, K. (1969). "The interpretation of kinetic data for enzyme-catalysed reactions involving
three substrates." Biochemical Journal 114(3): 547-556.
Danner, H., G. A. Boeckler, S. Irmisch, J. S. Yuan, F. Chen, J. Gershenzon, S. B. Unsicker and T.
G. Köllner (2011). "Four terpene synthases produce major compounds of the gypsy moth
feeding-induced volatile blend of Populus trichocarpa." Phytochemistry 72(9): 897-908.
De Boer, J. G. and M. Dicke (2004). "The role of methyl salicylate in prey searching behavior of
the predatory mite Phytoseiulus persimilis." Journal of chemical ecology 30(2): 255-271.
De Boer, J. G., M. A. Posthumus and M. Dicke (2004). "Identification of volatiles that are used
in discrimination between plants infested with prey or nonprey herbivores by a predatory
mite." Journal of chemical ecology 30(11): 2215-2230.
de Faria, R. O., V. Rotuno Moure, W. Balmant, M. A. Lopes de Almeida Amazonas, N. Krieger
and D. A. Mitchell (2007). "The tyrosinase produced by Lentinula boryana (Berk. &
Mont.) Pegler suffers substrate inhibition by L-DOPA." Food Technology and
Biotechnology 45(3): 334-340.
de Lacy Costello, B., R. Ewen, P. Jones, N. Ratcliffe and R. Wat (1999). "A study of the
catalytic and vapour-sensing properties of zinc oxide and tin dioxide in relation to 1-
butanol and dimethyldisulphide." Sensors and Actuators B: Chemical 61(1): 199-207.
Delalieux, S., J. Van Aardt, W. Keulemans, E. Schrevens and P. Coppin (2007). "Detection of
biotic stress (Venturia inaequalis) in apple trees using hyperspectral data: Non-parametric
statistical approaches and physiological implications." European Journal of Agronomy
27(1): 130-143.
Dewey, F. and G. Marshall (1996). Production and use of monoclonal antibodies for the
detection of fungi. British Crop Protection Council Symposium Proceedings. 1996.
Dickert, F. L., O. Hayden, R. Bindeus, K.-J. Mann, D. Blaas and E. Waigmann (2004).
"Bioimprinted QCM sensors for virus detection—screening of plant sap." Analytical and
bioanalytical chemistry 378(8): 1929-1934.
Diebold, U. (2003). "Structure and properties of TiO 2 surfaces: a brief review." Applied Physics
A: Materials Science & Processing 76(5): 681-687.
El-Ansary, A. and L. M. Faddah (2010). "Nanoparticles as biochemical sensors."
Nanotechnology, science and applications 3(1): 65-76.

179
Ellis, M. and G. Grove (1983). "Leather rot in Ohio strawberries." Plant disease 67(5).
Enache, T. A. and A. M. Oliveira-Brett (2011). "Phenol and para-substituted phenols
electrochemical oxidation pathways." Journal of Electroanalytical Chemistry 655(1): 9-
16.
Espín, J. C., R. Varón, L. G. Fenoll, M. Gilabert, P. A. García‐Ruíz, J. Tudela and F. García‐Cánovas (2000). "Kinetic characterization of the substrate specificity and mechanism of
mushroom tyrosinase." European Journal of Biochemistry 267(5): 1270-1279.
Eun, A. J.-C., L. Huang, F.-T. Chew, S. Fong-Yau Li and S.-M. Wong (2002). "Detection of two
orchid viruses using quartz crystal microbalance-based DNA biosensors."
Phytopathology 92(6): 654-658.
Eun, A. J.-C. and S.-M. Wong (2000). "Molecular beacons: a new approach to plant virus
detection." Phytopathology 90(3): 269-275.
Fall, R. and A. A. Benson (1996). "Leaf methanol—the simplest natural product from plants."
Trends in Plant Science 1(9): 296-301.
Fang, Y., Y. Umasankar and R. P. Ramasamy (2014). "Electrochemical detection of p-
ethylguaiacol, a fungi infected fruit volatile using metal oxide nanoparticles." Analyst
139(15): 3804-3810.
Ghindilis, A. L., P. Atanasov and E. Wilkins (1997). "Enzyme‐catalyzed direct electron transfer:
Fundamentals and analytical applications." Electroanalysis 9(9): 661-674.
Godfray, H. C. J., J. R. Beddington, I. R. Crute, L. Haddad, D. Lawrence, J. F. Muir, J. Pretty, S.
Robinson, S. M. Thomas and C. Toulmin (2010). "Food security: the challenge of
feeding 9 billion people." science 327(5967): 812-818.
Gorris, M. T., B. Alarcon, M. M. Lopez and M. Cambra (1994). "Characterization of monoclonal
antibodies specific for Erwinia carotovora subsp. atroseptica and comparison of
serological methods for its sensitive detection on potato tubers." Applied and
Environmental Microbiology 60(6): 2076-2085.
Granke, L. L., L. Quesada-Ocampo, K. Lamour and M. K. Hausbeck (2012). "Advances in
research on Phytophthora capsici on vegetable crops in the United States." Plant Disease
96(11): 1588-1600.
Gurung, K. (2007). "Analysis of wintergreen oil." Ecology Agriculture and Rural Development
Society, Dolakha, Nepal.
Hakala, M. A., A. T. Lapveteläinen and H. P. Kallio (2002). "Volatile compounds of selected
strawberry varieties analyzed by purge-and-trap headspace GC-MS." Journal of
agricultural and food chemistry 50(5): 1133-1142.
Hijri, M. (2009). "The use of Fluorescent in situ hybridisation in plant fungal identification and
genotyping." Plant Pathology: Techniques and Protocols: 131-145.
Isidorov, V., I. Zenkevich and B. Ioffe (1985). "Volatile organic compounds in the atmosphere
of forests." Atmospheric Environment (1967) 19(1): 1-8.
James, D. (1999). "A simple and reliable protocol for the detection of apple stem grooving virus
by RT–PCR and in a multiplex PCR assay." Journal of Virological Methods 83(1): 1-9.
James, D. G. and T. S. Price (2004). "Field-testing of methyl salicylate for recruitment and
retention of beneficial insects in grapes and hops." Journal of chemical ecology 30(8):
1613-1628.
Jansen, R. M., J. W. Hofstee, J. Wildt, F. W. Verstappen, H. Bouwmeester and E. J. van Henten
(2009). "Induced plant volatiles allow sensitive monitoring of plant health status in
greenhouses." Plant signaling & behavior 4(9): 824-829.

180
Jeleń, H., J. Krawczyk, T. Larsen, A. Jarosz and B. Gołębniak (2005). "Main compounds
responsible for off‐odour of strawberries infected by Phytophthora cactorum." Letters in
applied microbiology 40(4): 255-259.
Katagiri, M., H. Maeno, S. Yamamoto, O. Hayaishi, T. Kitao and S. Oae (1965). "Salicylate
hydroxylase, a monooxygenase requiring flavin adenine dinucleotide II. The mechanism
of salicylate hydroxylation to catechol." Journal of Biological Chemistry 240(8): 3414-
3417.
Kempf, V. A., K. Trebesius and I. B. Autenrieth (2000). "Fluorescent in situ hybridization allows
rapid identification of microorganisms in blood cultures." Journal of clinical
microbiology 38(2): 830-838.
Kesselmeier, J. and M. Staudt (1999). "Biogenic volatile organic compounds (VOC): an
overview on emission, physiology and ecology." Journal of atmospheric chemistry 33(1):
23-88.
Kessler, A. and I. T. Baldwin (2001). "Defensive function of herbivore-induced plant volatile
emissions in nature." Science 291(5511): 2141-2144.
Kliot, A., S. Kontsedalov, G. Lebedev, M. Brumin, P. B. Cathrin, J. M. Marubayashi, M. Skaljac,
E. Belausov, H. Czosnek and M. Ghanim (2014). "Fluorescence in situ hybridizations
(FISH) for the localization of viruses and endosymbiotic bacteria in plant and insect
tissues." JoVE (Journal of Visualized Experiments)(84): e51030-e51030.
Kobayashi, T., E. Kanda, K. Kitada, K. Ishiguro and Y. Torigoe (2001). "Detection of rice
panicle blast with multispectral radiometer and the potential of using airborne
multispectral scanners." Phytopathology 91(3): 316-323.
Kretzer, J. W., R. Lehmann, M. Schmelcher, M. Banz, K.-P. Kim, C. Korn and M. J. Loessner
(2007). "Use of high-affinity cell wall-binding domains of bacteriophage endolysins for
immobilization and separation of bacterial cells." Applied and environmental
microbiology 73(6): 1992-2000.
Kruger, N. J. (1994). "The Bradford method for protein quantitation." Basic protein and peptide
protocols: 9-15.
Kruger, N. J. (2009). "The Bradford method for protein quantitation." The protein protocols
handbook: 17-24.
Leonard, P., S. Hearty, J. Brennan, L. Dunne, J. Quinn, T. Chakraborty and R. O’Kennedy
(2003). "Advances in biosensors for detection of pathogens in food and water." Enzyme
and Microbial Technology 32(1): 3-13.
Li, H., H. Wen and S. Calabrese Barton (2012). "NADH Oxidation catalyzed by
electropolymerized azines on carbon nanotube modified electrodes." Electroanalysis
24(2): 398-406.
Li, H., K. E. Worley and S. Calabrese Barton (2012). "Quantitative analysis of bioactive NAD+
regenerated by NADH electro-oxidation." Acs Catalysis 2(12): 2572-2576.
Lian, P., X. Zhu, S. Liang, Z. Li, W. Yang and H. Wang (2011). "High reversible capacity of
SnO 2/graphene nanocomposite as an anode material for lithium-ion batteries."
Electrochimica Acta 56(12): 4532-4539.
Lievens, B., M. Brouwer, A. C. Vanachter, B. P. Cammue and B. P. Thomma (2006). "Real-time
PCR for detection and quantification of fungal and oomycete tomato pathogens in plant
and soil samples." Plant Science 171(1): 155-165.

181
Lindenthal, M. (2005). Visualisierung der Krankheitsentwicklung von Falschem Mehltau an
Gurken durch Pseudoperonospora cubensis mittels Thermografie, Universitäts-und
Landesbibliothek Bonn.
Lindenthal, M., U. Steiner, H.-W. Dehne and E.-C. Oerke (2005). "Effect of downy mildew
development on transpiration of cucumber leaves visualized by digital infrared
thermography." Phytopathology 95(3): 233-240.
Loake, G. and M. Grant (2007). "Salicylic acid in plant defence—the players and protagonists."
Current opinion in plant biology 10(5): 466-472.
Long, G. L. and J. Winefordner (1983). "Limit of detection. A closer look at the IUPAC
definition." Anal. Chem 55(7).
López, M. M., E. Bertolini, A. Olmos, P. Caruso, M. T. Gorris, P. Llop, R. Penyalver and M.
Cambra (2003). "Innovative tools for detection of plant pathogenic viruses and bacteria."
International Microbiology 6(4): 233-243.
Luo, P., S. V. Prabhu and R. P. Baldwin (1990). "Constant potential amperometric detection at a
copper-based electrode: electrode formation and operation." Analytical Chemistry 62(7):
752-755.
Mahlein, A.-K., E.-C. Oerke, U. Steiner and H.-W. Dehne (2012). "Recent advances in sensing
plant diseases for precision crop protection." European Journal of Plant Pathology 133(1):
197-209.
Mandler, D. and S. Kraus-Ophir (2011). "Self-assembled monolayers (SAMs) for
electrochemical sensing." Journal of Solid State Electrochemistry 15(7-8): 1535.
Martorell, N., M. Martı, M. Mestres, O. Busto and J. Guasch (2002). "Determination of 4-
ethylguaiacol and 4-ethylphenol in red wines using headspace-solid-phase
microextraction-gas chromatography." Journal of Chromatography A 975(2): 349-354.
Mason, M. (2013). Has urbanization caused a loss to agricultural land.
Mc Grath, S. and D. van Sinderen (2007). Bacteriophage: genetics and molecular biology,
Horizon Scientific Press.
Mell, L. D. and J. Maloy (1975). "Model for the amperometric enzyme electrode obtained
through digital simulation and applied to the immobilized glucose oxidase system."
Analytical Chemistry 47(2): 299-307.
Nassuth, A., E. Pollari, K. Helmeczy, S. Stewart and S. A. Kofalvi (2000). "Improved RNA
extraction and one-tube RT-PCR assay for simultaneous detection of control plant RNA
plus several viruses in plant extracts." Journal of Virological Methods 90(1): 37-49.
Neufeld, T., A. Schwartz-Mittelmann, D. Biran, E. Ron and J. Rishpon (2003). "Combined
phage typing and amperometric detection of released enzymatic activity for the specific
identification and quantification of bacteria." Analytical chemistry 75(3): 580-585.
Nieminen, T., P. Neubauer, S. Sivelä, S. Vatamo, P. Silfverberg and M. Salkinoja-Salonen
(2008). "Volatile compounds produced by fungi grown in strawberry jam." LWT-Food
Science and Technology 41(10): 2051-2056.
Nugaeva, N., K. Y. Gfeller, N. Backmann, M. Düggelin, H. P. Lang, H.-J. Güntherodt and M.
Hegner (2007). "An antibody-sensitized microfabricated cantilever for the growth
detection of Aspergillus niger spores." Microscopy and Microanalysis 13(01): 13-17.
Oerke, E.-C. (2006). "Crop losses to pests." The Journal of Agricultural Science 144(01): 31-43.
Oerke, E.-C., P. Fröhling and U. Steiner (2011). "Thermographic assessment of scab disease on
apple leaves." Precision Agriculture 12(5): 699-715.

182
Oerke, E., U. Steiner, H. Dehne and M. Lindenthal (2006). "Thermal imaging of cucumber
leaves affected by downy mildew and environmental conditions." Journal of experimental
botany 57(9): 2121-2132.
Osiowy, C. (1998). "Direct detection of respiratory syncytial virus, parainfluenza virus, and
adenovirus in clinical respiratory specimens by a multiplex reverse transcription-PCR
assay." Journal of Clinical Microbiology 36(11): 3149-3154.
Ozimek, P., M. Veenhuis and I. J. van der Klei (2005). "Alcohol oxidase: a complex peroxisomal,
oligomeric flavoprotein." FEMS yeast research 5(11): 975-983.
Palchetti, I. and M. Mascini (2008). "Electroanalytical biosensors and their potential for food
pathogen and toxin detection." Analytical and bioanalytical chemistry 391(2): 455-471.
Pallisgaard, N., P. Hokland, D. C. Riishøj, B. Pedersen and P. Jørgensen (1998). "Multiplex
reverse transcription-polymerase chain reaction for simultaneous screening of 29
translocations and chromosomal aberrations in acute leukemia." Blood 92(2): 574-588.
Park, S., H. Boo and T. D. Chung (2006). "Electrochemical non-enzymatic glucose sensors."
Analytica Chimica Acta 556(1): 46-57.
Patel, R. N., C. Hou, A. Laskin and P. Derelanko (1981). "Microbial oxidation of methanol:
properties of crystallized alcohol oxidase from a yeast, Pichia sp." Archives of
biochemistry and biophysics 210(2): 481-488.
Perera, R. M., P. J. Marriott and I. E. Galbally (2002). "Headspace solid-phase
microextraction—Comprehensive two-dimensional gas chromatography of wound
induced plant volatile organic compound emissions." Analyst 127(12): 1601-1607.
Pickett, J. A., T. J. Bruce, K. Chamberlain, A. Hassanali, Z. R. Khan, M. C. Matthes, J. A.
Napier, L. E. Smart, L. J. Wadhams and C. M. Woodcock (2006). "Plant volatiles
yielding new ways to exploit plant defence." Chemical ecology: from gene to ecosystem:
161-173.
Piesik, D., G. Lemńczyk, A. Skoczek, R. Lamparski, J. Bocianowski, K. Kotwica and K. J.
Delaney (2011). "Fusarium infection in maize: Volatile induction of infected and
neighboring uninfected plants has the potential to attract a pest cereal leaf beetle, Oulema
melanopus." Journal of plant physiology 168(13): 1534-1542.
Pimentel, D., R. Zuniga and D. Morrison (2005). "Update on the environmental and economic
costs associated with alien-invasive species in the United States." Ecological economics
52(3): 273-288.
Pollnitz, A. P., K. H. Pardon and M. A. Sefton (2000). "Quantitative analysis of 4-ethylphenol
and 4-ethylguaiacol in red wine." Journal of Chromatography A 874(1): 101-109.
Premkumar, R. and N. Krishnamohan (2010). "Removal of methanol from waste gas using
biofiltration." Journal of Applied Sciences Research(November): 1898-1907.
Ramasamy, R. P., H. R. Luckarift, D. M. Ivnitski, P. B. Atanassov and G. R. Johnson (2010).
"High electrocatalytic activity of tethered multicopper oxidase–carbon nanotube
conjugates." Chemical Communications 46(33): 6045-6047.
Rassaei, L., J. Cui, E. D. Goluch and S. G. Lemay (2012). "Substrate-dependent kinetics in
tyrosinase-based biosensing: amperometry vs. spectrophotometry." Analytical and
bioanalytical chemistry 403(6): 1577-1584.
Rayne, S. and N. J. Eggers (2007). "4-ethylphenol and 4-ethylguaiacol in wines: estimating non-
microbial sourced contributions and toxicological considerations." Journal of
Environmental Science and Health Part B 42(8): 887-897.

183
Roberts, M. J., D. E. Schimmelpfennig, E. Ashley, M. J. Livingston, M. S. Ash and U. Vasavada
(2006). The value of plant disease early-warning systems: a case study of USDA's
soybean rust coordinated framework, United States Department of Agriculture, Economic
Research Service.
Ronkainen, N. J., H. B. Halsall and W. R. Heineman (2010). "Electrochemical biosensors."
Chemical Society Reviews 39(5): 1747-1763.
Sadana, A. and J. R. Katzer (1974). "Involvement of free radicals in the aqueous-phase catalytic
oxidation of phenol over copper oxide." Journal of Catalysis 35(1): 140-152.
Sadanandom, A. and R. M. Napier (2010). "Biosensors in plants." Current opinion in plant
biology 13(6): 736-743.
Savary, S., A. Ficke, J.-N. Aubertot and C. Hollier (2012). "Crop losses due to diseases and their
implications for global food production losses and food security." Food Security 4(4):
519-537.
Schaad, N. W. and R. D. Frederick (2002). "Real-time PCR and its application for rapid plant
disease diagnostics." Canadian Journal of Plant Pathology 24(3): 250-258.
Schofield, D. A., C. T. Bull, I. Rubio, W. P. Wechter, C. Westwater and I. J. Molineux (2013).
"“Light-tagged” bacteriophage as a diagnostic tool for the detection of phytopathogens."
Bioengineered 4(1): 50-54.
Schulmeister, T. (1990). "Mathematical modelling of the dynamic behaviour of amperometric
enzyme electrodes." Selective electrode reviews 12(2): 203-260.
Seskar, M., V. Shulaev and I. Raskin (1998). "Endogenous methyl salicylate in pathogen-
inoculated tobacco plants." Plant Physiology 116(1): 387-392.
Settle, F. A. (1997). Handbook of instrumental techniques for analytical chemistry, Prentice Hall
PTR.
Shipway, A. N., E. Katz and I. Willner (2000). "Nanoparticle arrays on surfaces for electronic,
optical, and sensor applications." ChemPhysChem 1(1): 18-52.
Shulaev, V., P. Silverman and I. Raskin (1997). "Airborne signalling by methyl salicylate in
plant pathogen resistance.[Erratum: Apr 17, 1997, v. 386 (6626), p. 738.]." Nature.
Siegbahn, P. E. (2004). "The catalytic cycle of catechol oxidase." JBIC Journal of Biological
Inorganic Chemistry 9(5): 577-590.
Skottrup, P., H. Frøkiær, S. Hearty, R. O'Kennedy, J. Hejgaard, M. Nicolaisen and A. F. Justesen
(2007). "Monoclonal antibodies for the detection of Puccinia striiformis urediniospores."
mycological research 111(3): 332-338.
Skottrup, P., S. Hearty, H. Frøkiær, P. Leonard, J. Hejgaard, R. O’Kennedy, M. Nicolaisen and
A. F. Justesen (2007). "Detection of fungal spores using a generic surface plasmon
resonance immunoassay." Biosensors and Bioelectronics 22(11): 2724-2729.
Skottrup, P. D., M. Nicolaisen and A. F. Justesen (2008). "Towards on-site pathogen detection
using antibody-based sensors." Biosensors and Bioelectronics 24(3): 339-348.
Sponsel, V. M. and P. Hedden (2010). Gibberellin biosynthesis and inactivation. Plant Hormones,
Springer: 63-94.
Stoll, M., H. R. Schultz, G. Baecker and B. Berkelmann-Loehnertz (2008). "Early pathogen
detection under different water status and the assessment of spray application in
vineyards through the use of thermal imagery." Precision agriculture 9(6): 407-417.
Suneesh, P., K. Chandhini, T. Ramachandran, B. G. Nair and T. S. Babu (2013). "Tantalum
oxide honeycomb architectures for the development of a non-enzymatic glucose sensor
with wide detection range." Biosensors and Bioelectronics 50: 472-477.

184
Sunesson, A., W. Vaes, C. Nilsson, G. Blomquist, B. Andersson and R. Carlson (1995).
"Identification of volatile metabolites from five fungal species cultivated on two media."
Applied and Environmental Microbiology 61(8): 2911-2918.
Thomas, S. G., A. L. Phillips and P. Hedden (1999). "Molecular cloning and functional
expression of gibberellin 2-oxidases, multifunctional enzymes involved in gibberellin
deactivation." Proceedings of the National Academy of Sciences 96(8): 4698-4703.
Torrance, L., A. Ziegler, H. Pittman, M. Paterson, R. Toth and I. Eggleston (2006). "Oriented
immobilisation of engineered single-chain antibodies to develop biosensors for virus
detection." Journal of virological methods 134(1): 164-170.
Ubeda, C., R. Callejon, A. Troncoso, J. Moreno‐Rojas, F. Peña and M. Morales (2012).
"Characterization of odour active compounds in strawberry vinegars." Flavour and
fragrance journal 27(4): 313-321.
Ubeda, C., F. San-Juan, B. n. Concejero, R. M. Callejon, A. M. Troncoso, M. L. Morales, V.
Ferreira and P. n. Hernandez-Orte (2012). "Glycosidically bound aroma compounds and
impact odorants of four strawberry varieties." Journal of agricultural and food chemistry
60(24): 6095-6102.
Umasankar, Y., G. C. Rains and R. P. Ramasamy (2012). "Electroanalytical studies on green leaf
volatiles for potential sensor development." Analyst 137(13): 3138-3145.
Umasankar, Y. and R. P. Ramasamy (2013). "Catalytic Activity of Tyrosinase for Potential
Biofuel Cell Application." ECS Transactions 45(11): 9-14.
Umasankar, Y. and R. P. Ramasamy (2013). "Highly sensitive electrochemical detection of
methyl salicylate using electroactive gold nanoparticles." Analyst 138(21): 6623-6631.
Umasankar, Y. and R. P. Ramasamy (2013). "On the bio-electrocatalytic activity of tyrosinase
for oxygen reduction reaction." Catalysis Science & Technology 3(10): 2546-2549.
Umasankar, Y. and R. P. Ramasamy (2014). "Enhanced Electron Transfer in Enzymatic
Bioelectrodes by a Poly (vinyl alcohol) N‐Methyl‐4 (4′‐formylstyryl) Pyridinium
Methosulfate Acetal Cationic Polymer." ChemElectroChem 1(11): 1834-1839.
Veitch, N. C. (2004). "Horseradish peroxidase: a modern view of a classic enzyme."
Phytochemistry 65(3): 249-259.
Vidal, J. (2007). "Global food crisis looms as climate change and fuel shortages bite." The
Guardian 3.
Wang, L.-H. and S.-C. Tu (1984). "The kinetic mechanism of salicylate hydroxylase as studied
by initial rate measurement, rapid reaction kinetics, and isotope effects." Journal of
Biological Chemistry 259(17): 10682-10688.
White-Stevens, R. H. and H. Kamin (1972). "Studies of a flavoprotein, salicylate hydroxylase I.
Preparation, properties, and the uncoupling of oxygen reduction from hydroxylation."
Journal of Biological Chemistry 247(8): 2358-2370.
Williams, K., S. Blake, A. Sweeney, J. Singer and B. Nicholson (1999). "Multiplex reverse
transcriptase PCR assay for simultaneous detection of three fish viruses." Journal of
clinical microbiology 37(12): 4139-4141.
Yamamoto, S., M. Katagiri, H. Maeno and O. Hayaishi (1965). "Salicylate hydroxylase, a
monooxygenase requiring flavin adenine dinucleotide I. Purification and general
properties." Journal of Biological Chemistry 240(8): 3408-3413.
You, I.-S., D. Ghosal and I. C. Gunsalus (1991). "Nucleotide sequence analysis of the
Pseudomonas putida PpG7 salicylate hydroxylase gene (nahG) and its 3'-flanking
region." Biochemistry 30(6): 1635-1641.
185
You, I.-S., R. Murray, D. Jollie and I. Gunsalus (1990). "Purification and characterization of
salicylate hydroxylase from Pseudomonas putida PpG7." Biochemical and biophysical
research communications 169(3): 1049-1054.
Zezza, F., M. Pascale, G. Mulè and A. Visconti (2006). "Detection of Fusarium culmorum in
wheat by a surface plasmon resonance-based DNA sensor." Journal of microbiological
methods 66(3): 529-537.
Zhang, M., Z. Qin, X. Liu and S. L. Ustin (2003). "Detection of stress in tomatoes induced by
late blight disease in California, USA, using hyperspectral remote sensing." International
Journal of Applied Earth Observation and Geoinformation 4(4): 295-310.
Zhu, J. and K.-C. Park (2005). "Methyl salicylate, a soybean aphid-induced plant volatile
attractive to the predator Coccinella septempunctata." Journal of chemical ecology 31(8):
1733-1746.
Zhuang, Z., X. Su, H. Yuan, Q. Sun, D. Xiao and M. M. Choi (2008). "An improved sensitivity
non-enzymatic glucose sensor based on a CuO nanowire modified Cu electrode." Analyst
133(1): 126-132.

186
APPENDICES
Appendix A
GenScript Sequence Information Pseudomonas putida: nahG salicylate hydroxylase 1305bp original atgaaaaaca ataaacttgg cttgcgcatc ggtatcgtcg gcggcggaat ttccggcgtt
gccttagcac tggaactctg ccgctactcc catatccagg tacagctgtt cgaggctgcg
ccggctttcg gtgaggtcgg tgccggcgtg tcctttggcc ccaacgcggt gcgcgccatt
gtcggcctgg gcttgggcga ggcctacctg caggttgccg accgtacttc ggagccctgg
gaggacgtgt ggttcgaatg gcggcgcggc agcgatgcca gctatctggg agccaccatc
gctccgggcg tgggccagtc ctcggtacac cgggcggatt tcatcgacgc cctagtaact
cacctcccag aaggtatcgc ccaattcggg aagcgcgcca cccaggtcga gcagcagggt
ggcgaagtgc aagtgctgtt caccgacggc acagagtacc gctgcgacct tctgatcggt
gccgacggaa tcaagtcagc gctccgtagc catgtgctgg aaggtcaggg gctggcccca
caagtgccgc gattcagcgg cacctgtgcc tatcggggga tggtcgacag cctgcatctg
cgagaagcct atcgggccca tggcatcgac gagcacttgg tggacgtgcc gcagatgtac
ctagggctcg acggccatat cctcaccttt ccagtgagga atggcggcat catcaacgtg
gtggctttca tctccgaccg tagcgagccg aagccgacct ggcctgcgga tgccccttgg
gtgcgtgagg cgagccagcg cgagatgctc gatgccttcg cgggttgggg ggatgccgcg
cgcgccctgc tggagtgcat cccggcacca actctctggg cactgcatga cctggcggag
ctgccgggct acgtgcacgg tcgggtcgtc ctgatcggcg acgcagctca cgccatgctg
ccgcaccaag gtgccggtgc tggccaaggg cttgaggacg cctacttcct cgcccgcctg
ttgggcgata cgcaggccga tgccggcaac ctcgccgagc tgcttgaagc ctacgacgac
ctgcgccgcc ctcgtgcctg tcgcgtgcag caaacctcct gggagaccgg cgagttatac
gagttgcgcg accccgtcgt cggtgcgaac gagcagctgc tgggggaaaa cctggcgacc
cgcttcgact ggctgtggaa ccacgacctc gacactgacc tggccgaggc ccgtgcgcgg
ctgggttggg agcatggtgg cgggggtgcg ctacgtcaag ggtga
Optimized
ATGAAAAACAATAAACTGGGTCTGCGTATCGGCATCGTGGGTGGCGGCATCTCGGGCGTTGCTCTGGCTC
TGGAACTGTGTCGCTACTCACATATTCAGGTGCAACTGTTTGAAGCAGCACCGGCTTTCGGTGAAGTTGG
TGCAGGTGTCTCGTTTGGCCCGAACGCAGTGCGTGCTATCGTTGGCCTGGGTCTGGGCGAAGCATATCTG
CAGGTGGCTGACCGCACCTCAGAACCGTGGGAAGATGTTTGGTTCGAATGGCGTCGCGGTAGTGATGCAT
CCTACCTGGGTGCAACGATTGCACCGGGTGTCGGCCAAAGCTCTGTGCATCGTGCGGACTTTATTGATGC
CCTGGTCACCCACCTGCCGGAAGGTATCGCCCAGTTCGGCAAACGCGCAACGCAAGTTGAACAGCAAGGC
GGTGAAGTGCAGGTTCTGTTTACCGATGGTACGGAATATCGTTGCGACCTGCTGATTGGTGCTGATGGCA
TCAAGAGCGCGCTGCGCTCTCACGTTCTGGAGGGTCAGGGTCTGGCACCGCAAGTCCCGCGTTTCAGTGG
TACCTGTGCCTATCGCGGCATGGTGGATTCCCTGCATCTGCGTGAAGCATACCGCGCTCATGGCATCGAC
GAACACCTGGTCGATGTGCCGCAGATGTACCTGGGTCTGGATGGCCACATTCTGACCTTTCCGGTGCGTA
ACGGCGGTATTATCAATGTGGTTGCGTTCATCTCAGACCGTTCGGAACCGAAACCGACGTGGCCGGCAGA
TGCTCCGTGGGTTCGTGAAGCAAGCCAGCGCGAAATGCTGGACGCGTTTGCAGGTTGGGGTGATGCAGCT
CGTGCACTGCTGGAATGCATTCCGGCACCGACCCTGTGGGCTCTGCATGACCTGGCGGAACTGCCGGGTT
ATGTGCACGGTCGTGTCGTGCTGATCGGTGATGCAGCACATGCAATGCTGCCGCACCAGGGTGCAGGTGC
TGGTCAAGGCCTGGAAGATGCGTACTTCCTGGCACGTCTGCTGGGTGACACCCAGGCAGATGCAGGTAAC
CTGGCAGAACTGCTGGAAGCATATGATGACCTGCGTCGCCCGCGTGCATGTCGTGTTCAGCAAACCTCTT
GGGAAACGGGCGAACTGTACGAACTGCGTGACCCGGTTGTCGGTGCCAACGAACAGCTGCTGGGCGAAAA
TCTGGCAACCCGCTTTGATTGGCTGTGGAATCATGATCTGGACACGGATCTGGCGGAAGCTCGTGCTCGT
CTGGGCTGGGAACATGGTGGTGGCGGTGCTCTGCGTCAAGGCTAA
Original

187
Met K N N K L G L R I G I V G G G I S G V A L A L E L C R Y S H I Q V Q L F E A A P A F G E V G A G V S F G P N A V R A I V G L G L G E A Y L Q V A D R T S E P W E D V W F E W R R G S D A S Y L G A T I A P G V G Q S S V H R A D F I D A L V T H L P E G I A Q F G K R A T Q V E Q Q G G E V Q V L F T D G T E Y R C D L L I G A D G I K S A L R S H V L E G Q G L A P Q V P R F S G T C A Y R G Met V D S L H L R E A Y R A H G I D E H L V D V P Q Met Y L G L D G H I L T F P V R N G G I I N V V A F I S D R S E P K P T W P A D A P W V R E A S Q R E Met L D A F A G W G D A A R A L L E C I P A P T L W A L H D L A E L P G Y V H G R V V L I G D A A H A Met L P H Q G A G A G Q G L E D A Y F L A R L L G D T Q A D A G N L A E L L E A Y D D L R R P R A C R V Q Q T S W E T G E L Y E L R D P V V G A N E Q L L G E N L A T R F D W L W N H D L D T D L A E A R A R L G W E H G G G G A L R Q G Stop
Optimized
Met K N N K L G L R I G I V G G G I S G V A L A L E L C R Y S H I Q V Q L F E A A P A F G E V G A G V S F G P N A V R A I V G L G L G E A Y L Q V A D R T S E P W E D V W F E W R R G S D A S Y L G A T I A P G V G Q S S V H R A D F I D A L V T H L P E G I A Q F G K R A T Q V E Q Q G G E V Q V L F T D G T E Y R C D L L I G A D G I K S A L R S H V L E G Q G L A P Q V P R F S G T C A Y R G Met V D S L H L R E A Y R A H G I D E H L V D V P Q Met Y L G L D G H I L T F P V R N G G I I N V V A F I S D R S E P K P T W P A D A P W V R E A S Q R E Met L D A F A G W G D A A R A L L E C I P A P T L W A L H D L A E L P G Y V H G R V V L I G D A A H A Met L P H Q G A G A G Q G L E D A Y F L A R L L G D T Q A D A G N L A E L L E A Y D D L R R P R A C R V Q Q T S W E T G E L Y E L R D P V V G A N E Q L L G E N L A T R F D W L W N H D L D T D L A E A R A R L G W E H G G G G A L R Q G Stop

188
Appendix B
Primer design for PCR amplification
1. C-terminus
a. Forward primer: GGGAAAGGATCCATGAAAAACAATAAACTGGGTCTGC
b. Reverse primer: GGGAAA AAGCTTTTAATGATGATGATGATGATGGCCTTGACGCAGAGCAC
2. N-terminus
a. Forward primer: GGGAAAGGATCCATGCACCATCACCATCACCAC
ATGAAAAACAATAAACTGGGTCTGCG
b. Reverse primer: GGGAAAAAGCTTTTAGCCTTGACGCAGAGCA
Note: red – restriction sites, blue – start and stop codons, green – histidine tag, yellow –
structural gene sequence

189
Appendix C
Primer dilution # 1 for PCR:
Refer to operon datasheet on each primer for correct dilution to 100 µM with primers and DI
water
Primer dilution # 2 for PCR (from dilution # 1):
Forward primer 2 µL
Reverse primer 2 µM
DI water 16 µM
Total 20 µM
PCR system:
Polymerase 0.5 µL
pUC57-nahG
(template)
1 µL
Primer dilution # 2 5 µL
DMSO 5 µL
dNTPs 5 µL
5 × Phusion buffer 10 µL
DI water 23.5 µL
Total 50 µL
Restriction enzyme digestion:
BSA diluted 10 × 5 µL
Buffer 5 µL
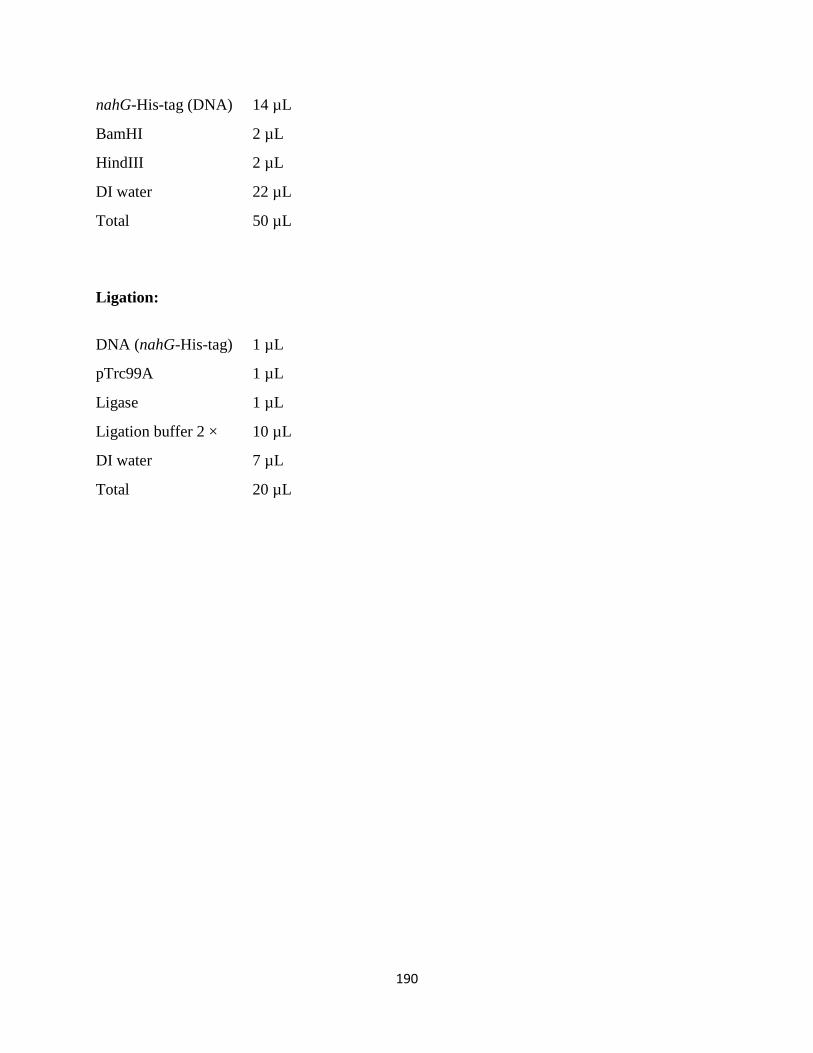
190
nahG-His-tag (DNA) 14 µL
BamHI 2 µL
HindIII 2 µL
DI water 22 µL
Total 50 µL
Ligation:
DNA (nahG-His-tag) 1 µL
pTrc99A 1 µL
Ligase 1 µL
Ligation buffer 2 × 10 µL
DI water 7 µL
Total 20 µL

191
Appendix D
The plasmid map of pTrc99A
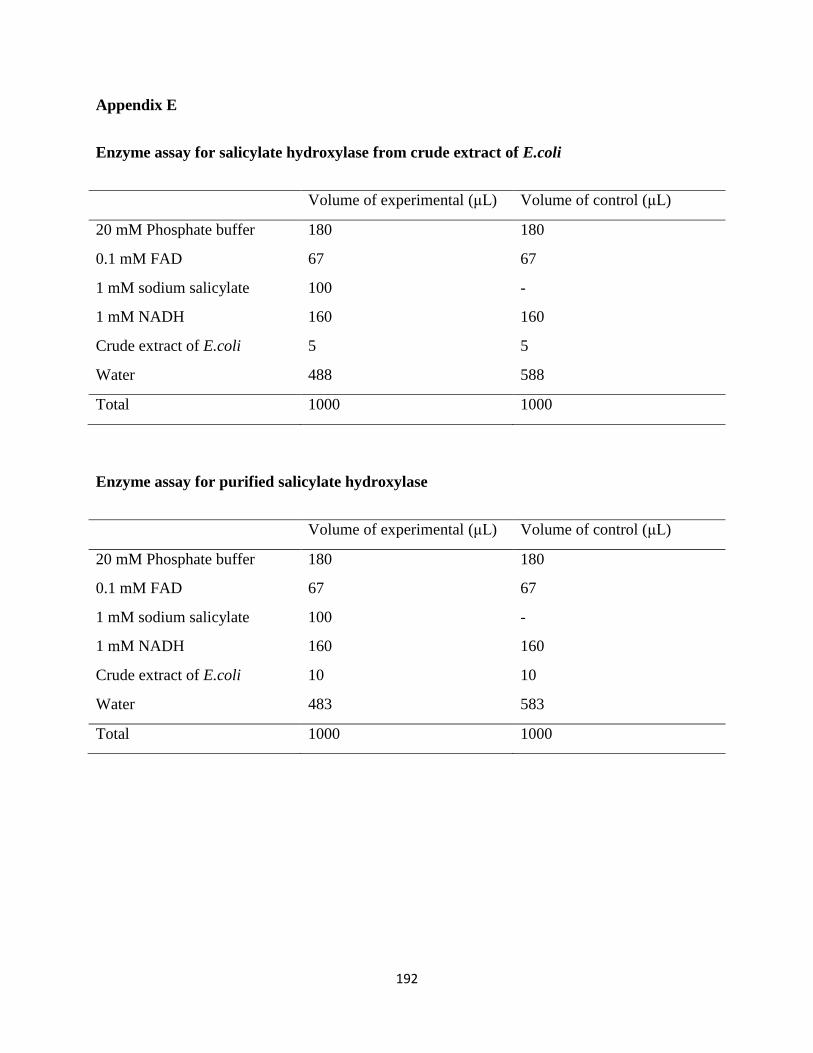
192
Appendix E
Enzyme assay for salicylate hydroxylase from crude extract of E.coli
Volume of experimental (μL) Volume of control (μL)
20 mM Phosphate buffer 180 180
0.1 mM FAD 67 67
1 mM sodium salicylate 100 -
1 mM NADH 160 160
Crude extract of E.coli 5 5
Water 488 588
Total 1000 1000
Enzyme assay for purified salicylate hydroxylase
Volume of experimental (μL) Volume of control (μL)
20 mM Phosphate buffer 180 180
0.1 mM FAD 67 67
1 mM sodium salicylate 100 -
1 mM NADH 160 160
Crude extract of E.coli 10 10
Water 483 583
Total 1000 1000

193
Appendix F
Code of computer controlling system for automatic VOC collection (2 h) and temperature
measurement
const int temperaturePin = 0;
void setup() {
// put your setup code here, to run once:
pinMode (13,OUTPUT);
pinMode (12,OUTPUT);
pinMode (11,OUTPUT);
Serial.begin(9600);
digitalWrite (12,HIGH);
digitalWrite (13,HIGH);
delay(5000);
digitalWrite (12,LOW);
digitalWrite (13,LOW);
delay(1000);
digitalWrite (11,HIGH);
}
void loop() {
// put your main code here, to run repeatedly:
float voltage, degreesC, degreesF;
voltage = getVoltage(temperaturePin);
degreesC = (voltage - 0.5) * 100.0;
degreesF = degreesC * (9.0/5.0) + 32.0;
Serial.print("voltage: ");
Serial.print(voltage);
Serial.print(" deg C: ");

194
Serial.print(degreesC);
Serial.print(" deg F: ");
Serial.println(degreesF);
delay(1000);
}
float getVoltage(int pin) {
return (analogRead(pin) * 0.004882814);
}

195
Appendix G
Enzyme assays of salicylate hydroxylase and tyrosinase
Salicylate hydroxylase assays with different salicylate concentrations (10, 20 and 50 μM) at
given concentration of NADH (10, 20 and 50 μM):
[NADH]=50 μM [NADH]=20 μM [NADH]=10 μM
Water 334/329/314 349/344/329 354/349/334
Buffer 100 100 100
0.1 mM FAD 34 34 34
Salicylate hydroxylase 2 2 2
1 mM NADH 25 10 5
1 mM sodium salicylate 5/10/25 5/10/25 5/10/25
Total 500 500 500
Salicylate hydroxylase assays with different salicylate concentrations (10, 20 and 50 μM) at
concentration of NADH of 100 μM purged with nitrogen, air and oxygen:
[NADH]=100 μM
Water 309/304/289
Buffer 100
0.1 mM FAD 34
Salicylate hydroxylase 2
1 mM NADH 50
1 mM sodium salicylate 5/10/25
Total 500

196
For tyrosinase with different catechol concentrations (10, 20 and 100 μM):
Experimental (μM) Control (μM)
Water 390/385/345 395/390/350
0.1 M Phosphate buffer 100 100
1 mM Catechol 5/10/50 5/10/50
Tyrosinase (5 mg/mL) 5 -
Total 500 500
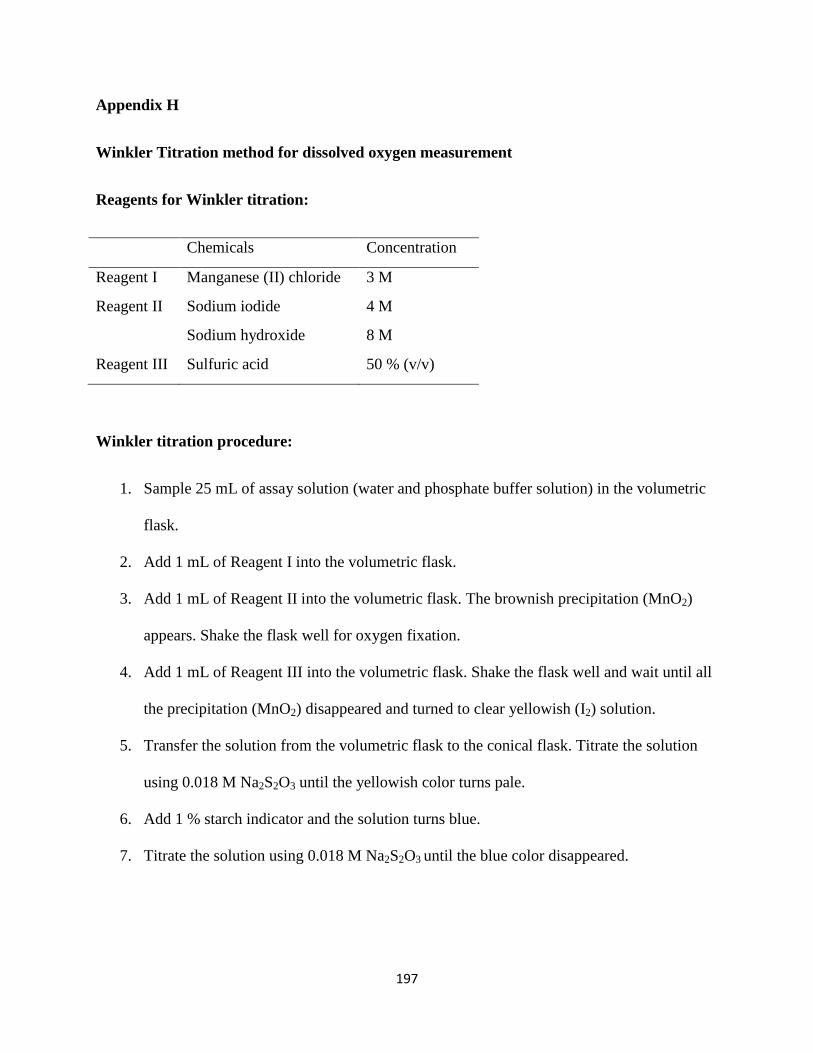
197
Appendix H
Winkler Titration method for dissolved oxygen measurement
Reagents for Winkler titration:
Chemicals Concentration
Reagent I Manganese (II) chloride 3 M
Reagent II Sodium iodide 4 M
Sodium hydroxide 8 M
Reagent III Sulfuric acid 50 % (v/v)
Winkler titration procedure:
1. Sample 25 mL of assay solution (water and phosphate buffer solution) in the volumetric
flask.
2. Add 1 mL of Reagent I into the volumetric flask.
3. Add 1 mL of Reagent II into the volumetric flask. The brownish precipitation (MnO2)
appears. Shake the flask well for oxygen fixation.
4. Add 1 mL of Reagent III into the volumetric flask. Shake the flask well and wait until all
the precipitation (MnO2) disappeared and turned to clear yellowish (I2) solution.
5. Transfer the solution from the volumetric flask to the conical flask. Titrate the solution
using 0.018 M Na2S2O3 until the yellowish color turns pale.
6. Add 1 % starch indicator and the solution turns blue.
7. Titrate the solution using 0.018 M Na2S2O3 until the blue color disappeared.