electrochemical biosensors and angiogenesis - spiral: … · electrochemical biosensors and...
TRANSCRIPT
Electrochemical Biosensors and
Angiogenesis
Raphaël Trouillon
A thesis submitted for the degree of Doctor of
Philosophy of Imperial College London
Department of Bioengineering, Imperial College London
SW7 2AZ UK
1
The work presented in this thesis is my own and has been obtained during
the course of my Ph.D. Furthermore, most of the results presented here have been
published or submitted for publication in the following articles:
• Trouillon R, O’Hare D (2010) Comparison of glassy carbon and boron doped
diamond electrodes: resistance to biofouling, Electrochimica Acta, doi:10.1016/
j.electacta.2010.06.016.
• Trouillon R, Cheung C, Patel BA, O’Hare D (2010) Electrochemical study
of the intracellular transduction of vascular endothelial growth factor induced
nitric oxide synthase activity using a multi-channel biocompatible microelec-
trode array. Biochimica et Biophysica Acta, doi:10.1016/j.bbagen.2010.04.010.
• Trouillon R, Kang DK, Park H, Chang SI, O’Hare D (2010) Angiogenin in-
duces nitric oxide synthesis in endothelial cells through PI-3 and Akt kinases.
Biochemistry 49:3282- 3288.
• Trouillon R, Combs Z, Patel BA, O’Hare D (2009) Comparative study of
the effect of various electrode membranes on biofouling and electrochemical
measurements. Electrochemistry Communications 11:1409-1413.
• Trouillon R, Cheung C, Patel BA, O’Hare D (2009) Comparative study of poly
(styrene-sulfonate) /poly(L-lysine) and fibronectin as biofouling-preventing
layers in dissolved oxygen electrochemical measurements. The Analyst 134:784-
793.
• Trouillon R, Cheung C, Kang DK, Chang SI, O’Hare D (2010) Electrochemical
2
sensing of angiogenin induced nitric oxide synthase activity in different types
of endothelial cells. Medical Engineering and Physics, Submitted.
I acknowledge the help of my co-authors for experimental support. All else is ap-
propriately referenced.
Abstract
Electrochemical methods provide attractive sensing techniques for biology. Elec-
trochemical devices can be easily manufactured, miniaturized and are sometimes
the only direct sensing method available. However, stability of these sensors is
problematic, as foreign-body type reactions may induce distortions of the signal
(biofouling). As a consequence, investigating the interactions with the biological
matrix is of paramount importance to achieve reliable sensing.
Different types of electrodes (boron doped diamond and different preparations of
glassy carbon) and various electrode coatings were tested, in the presence of bio-
logical molecules. The results showed that boron doped diamond and fibronectin
coated sensors offer good stability, even in the presence of high concentrations of
proteins. A generally applicable protocol to assess the quality of electrode materials
in biofouling conditions is also presented. Fibronectin has also been found to be a
highly biocompatible coating, perfectly suited for cell-based measurements.
This fibronectin coating was used on an electrode array to study the pathway lead-
3
4
ing to angiogenic factor induced nitric oxide release. Vascular endothelial growth
factor, a well known angiogenic factor, was initially used and allowed me to setup
a reliable and robust protocol for the use of electrode arrays in biology. It was
then demonstrated that angiogenin, another angiogenic factor, leads to nitric oxide
exocytosis through PI-3 kinase transduction.
Acknowledgements
I would like to thank my supervisor Dr. Danny O’Hare for his thorough guide on
this work. His help and expertise on numerous topics have been of great help, in
particular when complex chemical reactions were involved.
I would also like to thank my co-supervisor, Prof. Kim Parker, for his comments
and support.
I would like to acknowledge Dr. Martyn Boutelle and Dr. Bhavik Anil Patel for
their kind advice and help with my research.
Many thanks to Prof. Soo-Ik Chang, Dr. Dong-Ku Kang and Hyun, Min-Yi, Se-
Ra, Soo-Youn, Ee-Jun, Mi-Han and Ye-Ran from the angiogenin research group
of the Chungbuk National University. I would like to thank my friends from the
Biosensor group and from the Bioengineering Department: Dr. Pei Ling Leow, Dr.
Emma Corcoles, Dr. Delphine Feuerstein, Dr. Eleni Bitziou, Dr. Yoko Kikuchi, Ms.
Michelle Rogers, Ms. Agnes Leong, Dr Christina Warboys, Ms. Véronique Mahue,
5

6
Dr. Severin Harvey, Mr. Parinya Seelanan, Dr. Jean-Martial Mari, Dr. Gianfilippo
Coppola, Mr. Nicolas Foin.
Abbreviations
ANG: Angiogenin
BDD: Boron doped diamond electrode
Cdl: Double layer capacitance
CV: Cyclic voltammogram
∆Ep: Peak separation
∆Ep,anodic/cathodic: Anodic/ cathodic peak width
DA: Dopamine (3-hydroxytyramine)
DMEM: Dulbecco’s modified Eagle medium
DPV: Differential pulse voltammogram
E1/2: Mid-peak potential
Epc: Peak potential
eNOS: Endothelial nitric oxide synthase
ERK: Endothelial-related kinase
GC: Glassy carbon
GC-D: Glassy carbon with low surface oxide concentration
GC-P: Polished glassy carbon
7
8
HUVEC: Human umbilical vein endothelial cells
iox/red: Anodic/ cathodic peak current
L-NAME: NG-nitro-L-arginine methyl ester
MAP: Mitogen activated protein
MMA: Multiple microelectrode array
NO: Nitric oxide
NOS: Nitric oxide synthase
PI-3: Phosphatidylinositol 3
PSS/PL: Poly(styrene-sulphonate)/poly(L-lysine)
Rct: Charge transfer resistance
Re: Solution resistance
VEGF: Vascular endothelial growth factor
W: Warburg resistance
Contents
Abstract 3
Acknowledgements 5
Abbreviations 7
Table of Contents 15
List of Figures 18
List of Tables 19
1 Electrochemical Biosensors 20
1.1 Electrochemistry . . . . . . . . . . . . . . . . . . . . . . . . . . . . . 20
1.1.1 Basic theory and principles . . . . . . . . . . . . . . . . . . . . 20
1.1.2 Electrochemical methods . . . . . . . . . . . . . . . . . . . . . 22
Cyclic voltammetry . . . . . . . . . . . . . . . . . . . . . . . . 23
Differential pulse voltammetry . . . . . . . . . . . . . . . . . . 25
Electrochemical impedance spectroscopy . . . . . . . . . . . . 27
9
CONTENTS 10
Amperometry . . . . . . . . . . . . . . . . . . . . . . . . . . . 29
1.1.3 Electrochemistry and biological measurements . . . . . . . . . 29
1.2 The tissue-sensor interface . . . . . . . . . . . . . . . . . . . . . . . . 32
1.2.1 The biofouling phenomenon . . . . . . . . . . . . . . . . . . . 32
1.2.2 Potential effects of biofouling on electrochemical measurements 34
1.3 Microfabricated electrochemical devices . . . . . . . . . . . . . . . . . 36
1.3.1 Carbon fibre microelectrodes . . . . . . . . . . . . . . . . . . . 37
1.3.2 Microelectrode arrays . . . . . . . . . . . . . . . . . . . . . . . 38
1.4 Biochemistry of angiogenesis . . . . . . . . . . . . . . . . . . . . . . . 40
1.5 Conclusion . . . . . . . . . . . . . . . . . . . . . . . . . . . . . . . . . 43
2 Biofouling and Biocompatibility 44
2.1 Boron doped diamond and glassy carbon electrodes . . . . . . . . . . 44
2.1.1 Introduction . . . . . . . . . . . . . . . . . . . . . . . . . . . . 44
2.1.2 Material and Methods . . . . . . . . . . . . . . . . . . . . . . 47
Chemicals . . . . . . . . . . . . . . . . . . . . . . . . . . . . . 47
Electrode preparation . . . . . . . . . . . . . . . . . . . . . . . 47
Electrochemical measurements . . . . . . . . . . . . . . . . . . 48
Data processing . . . . . . . . . . . . . . . . . . . . . . . . . . 49
2.1.3 Results . . . . . . . . . . . . . . . . . . . . . . . . . . . . . . . 51
Effect of biological matrices on the cyclic voltammetry of ruthe-
nium III hexaammine . . . . . . . . . . . . . . . . . 51
CONTENTS 11
Effect of albumin on the impedance spectroscopy of ruthenium
III hexaammine . . . . . . . . . . . . . . . . . . . . . 52
Cyclic voltammetry of ferro/ferricyanide . . . . . . . . . . . . 54
Effect of albumin on the impedance spectroscopy of ferrocyanide 56
Stability of the different electrode materials during successive
voltammetric cycles of dopamine . . . . . . . . . . . 58
Effect of biological matrices on successive voltammetric cycles
of dopamine . . . . . . . . . . . . . . . . . . . . . . . 59
Long term stability of boron doped diamond and glassy carbon
electrodes during dopamine oxidation . . . . . . . . . 62
2.1.4 Discussion . . . . . . . . . . . . . . . . . . . . . . . . . . . . . 63
Significance of the biological matrices and interferences . . . . 63
Glassy carbon cleaned in cyclohexane . . . . . . . . . . . . . . 64
Polished glassy carbon . . . . . . . . . . . . . . . . . . . . . . 68
Boron doped diamond . . . . . . . . . . . . . . . . . . . . . . 70
2.1.5 Conclusion . . . . . . . . . . . . . . . . . . . . . . . . . . . . . 74
2.2 Membrane coatings for biomeasurements . . . . . . . . . . . . . . . . 75
2.2.1 Introduction . . . . . . . . . . . . . . . . . . . . . . . . . . . . 75
2.2.2 Experimental procedures, methods and chemicals . . . . . . . 76
Solutions and chemicals . . . . . . . . . . . . . . . . . . . . . 76
Electrode preparation . . . . . . . . . . . . . . . . . . . . . . . 77
Membrane coating . . . . . . . . . . . . . . . . . . . . . . . . 78
Electrochemical measurement and data analysis . . . . . . . . 79
CONTENTS 12
2.2.3 Results . . . . . . . . . . . . . . . . . . . . . . . . . . . . . . . 79
Cathodic peak potential . . . . . . . . . . . . . . . . . . . . . 81
Peak width . . . . . . . . . . . . . . . . . . . . . . . . . . . . 81
Cathodic peak current magnitude . . . . . . . . . . . . . . . . 83
Capacitance . . . . . . . . . . . . . . . . . . . . . . . . . . . . 83
2.2.4 Discussion . . . . . . . . . . . . . . . . . . . . . . . . . . . . . 84
Untreated gold . . . . . . . . . . . . . . . . . . . . . . . . . . 85
Nafion . . . . . . . . . . . . . . . . . . . . . . . . . . . . . . . 86
Cellulose acetate . . . . . . . . . . . . . . . . . . . . . . . . . 87
Chitosan . . . . . . . . . . . . . . . . . . . . . . . . . . . . . . 87
Fibronectin . . . . . . . . . . . . . . . . . . . . . . . . . . . . 88
PSS/PL . . . . . . . . . . . . . . . . . . . . . . . . . . . . . . 88
2.3 Biocompatibility of the electrode coatings . . . . . . . . . . . . . . . 89
2.3.1 Experimental procedures . . . . . . . . . . . . . . . . . . . . . 89
Preparation of the substrates . . . . . . . . . . . . . . . . . . 89
Adhesion test . . . . . . . . . . . . . . . . . . . . . . . . . . . 89
Effect of electrochemical tests . . . . . . . . . . . . . . . . . . 90
2.3.2 Results and Discussion . . . . . . . . . . . . . . . . . . . . . . 91
2.4 Electrode coatings for biomeasurements: Conclusion . . . . . . . . . . 97
3 Biocompatible Microelectrode Array 98
3.1 Introduction . . . . . . . . . . . . . . . . . . . . . . . . . . . . . . . . 98
3.2 Experimental . . . . . . . . . . . . . . . . . . . . . . . . . . . . . . . 102
CONTENTS 13
3.2.1 Chemicals . . . . . . . . . . . . . . . . . . . . . . . . . . . . . 102
3.2.2 Electrochemical measurements . . . . . . . . . . . . . . . . . . 104
3.2.3 In vitro NOS induced activity in endothelial cells and aortic
rings . . . . . . . . . . . . . . . . . . . . . . . . . . . . . . . . 106
3.2.4 Membrane Biocompatibility . . . . . . . . . . . . . . . . . . . 107
3.2.5 Wound healing assay . . . . . . . . . . . . . . . . . . . . . . . 108
3.3 Results . . . . . . . . . . . . . . . . . . . . . . . . . . . . . . . . . . . 108
3.3.1 Membrane biocompatibility . . . . . . . . . . . . . . . . . . . 108
3.3.2 Cyclic voltammograms for the uncoated and fibronectin coated
sensors . . . . . . . . . . . . . . . . . . . . . . . . . . . . . . . 109
3.3.3 Characterization of the sensor during cell measurements . . . 112
3.3.4 Study of VEGF induced NOS activity in endothelial cells . . . 116
3.3.5 Cell migration assay . . . . . . . . . . . . . . . . . . . . . . . 117
3.4 Discussion . . . . . . . . . . . . . . . . . . . . . . . . . . . . . . . . . 119
3.4.1 Sensor characterization . . . . . . . . . . . . . . . . . . . . . . 119
3.4.2 Validation of the biosensing protocol . . . . . . . . . . . . . . 122
3.4.3 Intracellular pathway of VEGF induced NO synthesis . . . . . 126
3.4.4 Aortic sections . . . . . . . . . . . . . . . . . . . . . . . . . . 129
3.5 Conclusion . . . . . . . . . . . . . . . . . . . . . . . . . . . . . . . . . 130
4 Biochemistry of Angiogenin 131
4.1 Introduction . . . . . . . . . . . . . . . . . . . . . . . . . . . . . . . . 131
4.2 Experimental procedures, methods and chemicals . . . . . . . . . . . 133
CONTENTS 14
4.2.1 Chemicals . . . . . . . . . . . . . . . . . . . . . . . . . . . . . 133
4.2.2 Cell culture . . . . . . . . . . . . . . . . . . . . . . . . . . . . 134
4.2.3 MMA design . . . . . . . . . . . . . . . . . . . . . . . . . . . 134
4.2.4 Modification and preparation of the sensors . . . . . . . . . . 134
4.2.5 Electrochemical measurements . . . . . . . . . . . . . . . . . . 135
4.2.6 Data processing . . . . . . . . . . . . . . . . . . . . . . . . . . 136
4.2.7 Inhibitors . . . . . . . . . . . . . . . . . . . . . . . . . . . . . 136
4.2.8 Laser confocal microscopic analysis . . . . . . . . . . . . . . . 136
4.2.9 Effects of selective inhibitors on the migration of HUVEC . . . 137
4.3 Results . . . . . . . . . . . . . . . . . . . . . . . . . . . . . . . . . . . 138
4.3.1 Angiogenin induces NOS activity and NO release . . . . . . . 138
4.3.2 NO production is dose and time dependent . . . . . . . . . . . 141
4.3.3 NO synthesis depends on nuclear translocation of angiogenin . 143
4.3.4 PI-3 kinase is involved in angiogenin induced NOS activity,
but not ERK 1/2 . . . . . . . . . . . . . . . . . . . . . . . . . 143
4.3.5 Angiogenin regulates eNOS activation and intracellular local-
ization . . . . . . . . . . . . . . . . . . . . . . . . . . . . . . . 145
4.3.6 NOS activity is involved in angiogenin induced endothelial cell
migration . . . . . . . . . . . . . . . . . . . . . . . . . . . . . 145
4.3.7 Neomycin inhibits VEGF induced NO synthesis . . . . . . . . 148
4.4 Discussion . . . . . . . . . . . . . . . . . . . . . . . . . . . . . . . . . 149
4.5 Conclusion . . . . . . . . . . . . . . . . . . . . . . . . . . . . . . . . . 155

CONTENTS 15
Conclusion 156
Bibliography 193
List of Figures
1.1 Scheme of a typical electrochemical reaction . . . . . . . . . . . . . . 21
1.2 Cyclic Voltammetry . . . . . . . . . . . . . . . . . . . . . . . . . . . . 26
1.3 Differential Pulse Voltammetry . . . . . . . . . . . . . . . . . . . . . 26
1.4 Randles’ model . . . . . . . . . . . . . . . . . . . . . . . . . . . . . . 28
1.5 Clark’s electrode . . . . . . . . . . . . . . . . . . . . . . . . . . . . . 30
1.6 Electrode fouling in biological environments . . . . . . . . . . . . . . 33
1.7 Scheme of a typical electrochemical reaction on a fouled electrode . . 34
1.8 Carbon fibre microelectrode fabrication . . . . . . . . . . . . . . . . . 37
1.9 Fabrication of an electrode microarray . . . . . . . . . . . . . . . . . 39
1.10 Microsensor setups . . . . . . . . . . . . . . . . . . . . . . . . . . . . 40
1.11 Cross section pictures of an artery . . . . . . . . . . . . . . . . . . . . 41
1.12 Scheme of the intracellular cascade induced by an angiogenic factor . 42
2.1 Randles’ model . . . . . . . . . . . . . . . . . . . . . . . . . . . . . . 50
2.2 Cyclic voltammograms and impedance spectrograms for 1 mM ruthe-
nium III hexaammine on boron doped diamond and glassy carbon
electrodes . . . . . . . . . . . . . . . . . . . . . . . . . . . . . . . . . 52
16
LIST OF FIGURES 17
2.3 Cyclic voltammograms and impedance spectrograms for 1 mM ferro-
cyanide on boron doped diamond and glassy carbon electrodes . . . . 56
2.4 Successive cyclic voltammograms of 1 mM dopamine on boron doped
diamond and glassy carbon electrodes . . . . . . . . . . . . . . . . . . 57
2.5 Current ratios for successive cyclic voltammograms of dopamine . . . 58
2.6 Amperometric currents obtained for the oxidation of 1mM dopamine
on boron doped diamond and glassy carbon electrodes . . . . . . . . 60
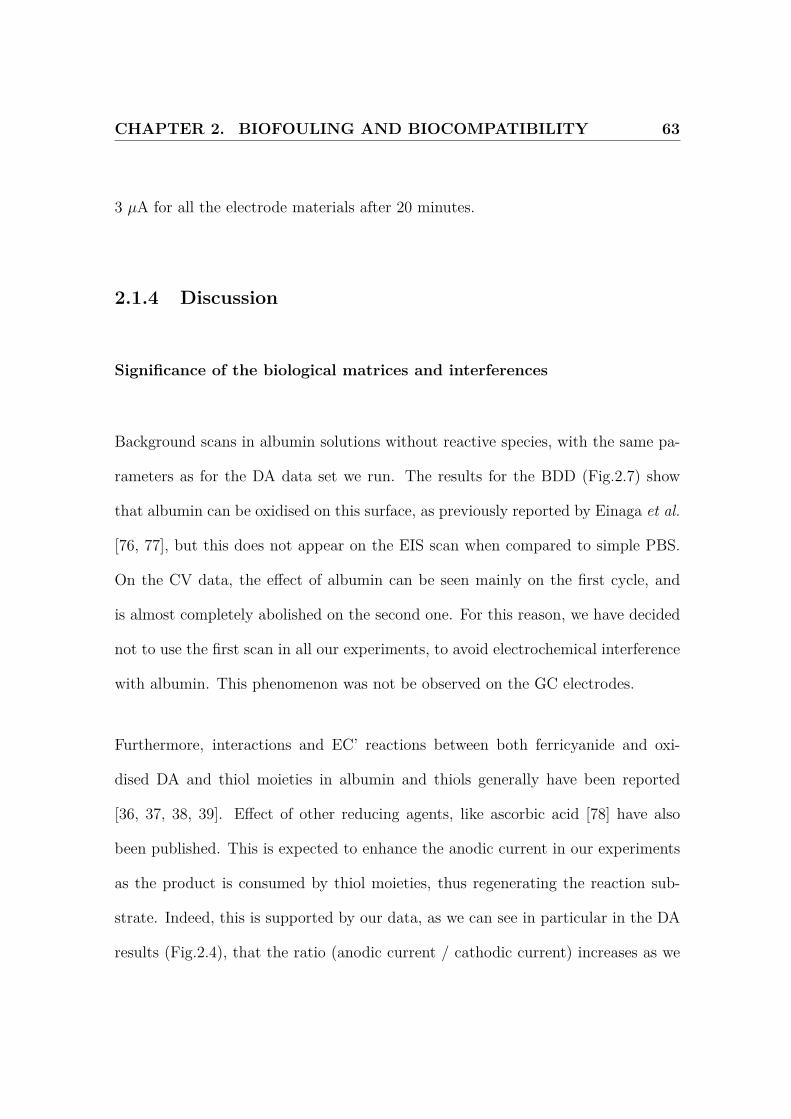
2.7 Controls for the effect of albumin and intrinsic resistance and capac-
itance in the boron doped diamond substrate . . . . . . . . . . . . . . 67
2.8 A) schematics showing how the BDD electrode made of conducting
and insulating areas can be modelled as a resistor in parallel with a
capacitor and B) the updated Randles model. . . . . . . . . . . . . . 72
2.9 Results for the cyclic voltammograms of ruthenium III/II hexaammine 80
2.10 Results for the cyclic voltammograms of dissolved oxygen . . . . . . . 82
2.11 Picture of a transparent microarray . . . . . . . . . . . . . . . . . . . 91
2.12 Microscope pictures of cells on different membrane coatings, 1 . . . . 92
2.13 Microscope pictures of cells on different membrane coatings, 2 . . . . 93
2.14 Results of the adhesion test . . . . . . . . . . . . . . . . . . . . . . . 94
2.15 Results of the survival test . . . . . . . . . . . . . . . . . . . . . . . . 96
3.1 Structures of L-arginine and NG-nitro-L-arginine methyl ester . . . . 99
3.2 Picture of the MMA . . . . . . . . . . . . . . . . . . . . . . . . . . . 101
3.3 Structures of PD 98059 and LY 294002 . . . . . . . . . . . . . . . . . 102
3.4 Microscope pictures of pig aortic endothelial grown on various substrates109
LIST OF FIGURES 18
3.5 Cyclic voltammograms for uncoated and coated electrode arrays . . . 110
3.6 Microelectrode array setup and protocol . . . . . . . . . . . . . . . . 113
3.7 Results for VEGF induced NOS activity . . . . . . . . . . . . . . . . 115
3.8 Migration assay . . . . . . . . . . . . . . . . . . . . . . . . . . . . . . 118
3.9 Calibration of the sensor . . . . . . . . . . . . . . . . . . . . . . . . . 123
3.10 Successive DPV scans . . . . . . . . . . . . . . . . . . . . . . . . . . 124
3.11 Scheme for the intracellular cascade leading to VEGF induced NO
synthesis . . . . . . . . . . . . . . . . . . . . . . . . . . . . . . . . . . 128
4.1 Effect of angiogenin on NOS activity . . . . . . . . . . . . . . . . . . 139
4.2 Effect of selective inhibitors of angiogenin physiological pathways . . 144
4.3 Cellular location of phospho-eNOS and eNOS in endothelial cells . . . 146
4.4 Effects of selective inhibitors on angiogenin induced cell migration . . 147
4.5 Effects of neomycin on VEGF induced NO synthesis . . . . . . . . . . 148
4.6 Proposed pathway for angiogenin induced eNOS activation. The red
colour indicates the new contributions presented in this work. . . . . 153
List of Tables
2.1 Cyclic voltammograms results, for the reduction of 1 mM ruthenium
III hexaammine, for the oxidation of 1mM ferrocyanide and for the
oxidation of 1mM dopamine, at 100 mV.s-1 . . . . . . . . . . . . . . . 53
2.2 Electrochemical impedance spectroscopy results, for the reduction of
1 mM ruthenium III hexaammine and for the oxidation of 1mM fer-
rocyanide . . . . . . . . . . . . . . . . . . . . . . . . . . . . . . . . . 55
2.3 Results for the fitting of current ratios in cyclic voltammetry of 1 mM
dopamine in PBS, pH = 7.4 . . . . . . . . . . . . . . . . . . . . . . . 61
3.1 Results for the average values obtained from the cyclic voltammo-
grams of ruthenium III hexaammine and oxygen . . . . . . . . . . . . 111
3.2 Results for the peak potential in DPV of different interfering molecules114
4.1 Dose-time response . . . . . . . . . . . . . . . . . . . . . . . . . . . . 142
19
Chapter 1
Electrochemical Biosensors
1.1 Electrochemistry
1.1.1 Basic theory and principles
Electrochemistry is a field of chemistry studying reactions happening at the surface
of electrical conductors (electrodes) and involving exchange of electrons [1]. This
exchange of electrons is generally dependent on the potential applied at the surface
of the electrode and is therefore very informative regarding the energy levels of the
system. Furthermore, the flow of electrons can be measured as a current proportional
to the rate of reaction and, under transport limited conditions is linearly proportional
20
CHAPTER 1. ELECTROCHEMICAL BIOSENSORS 21
to the bulk concentration of the reacting species. Electrochemistry is therefore an
ideally suited analytical technique for titration and chemical measurements.
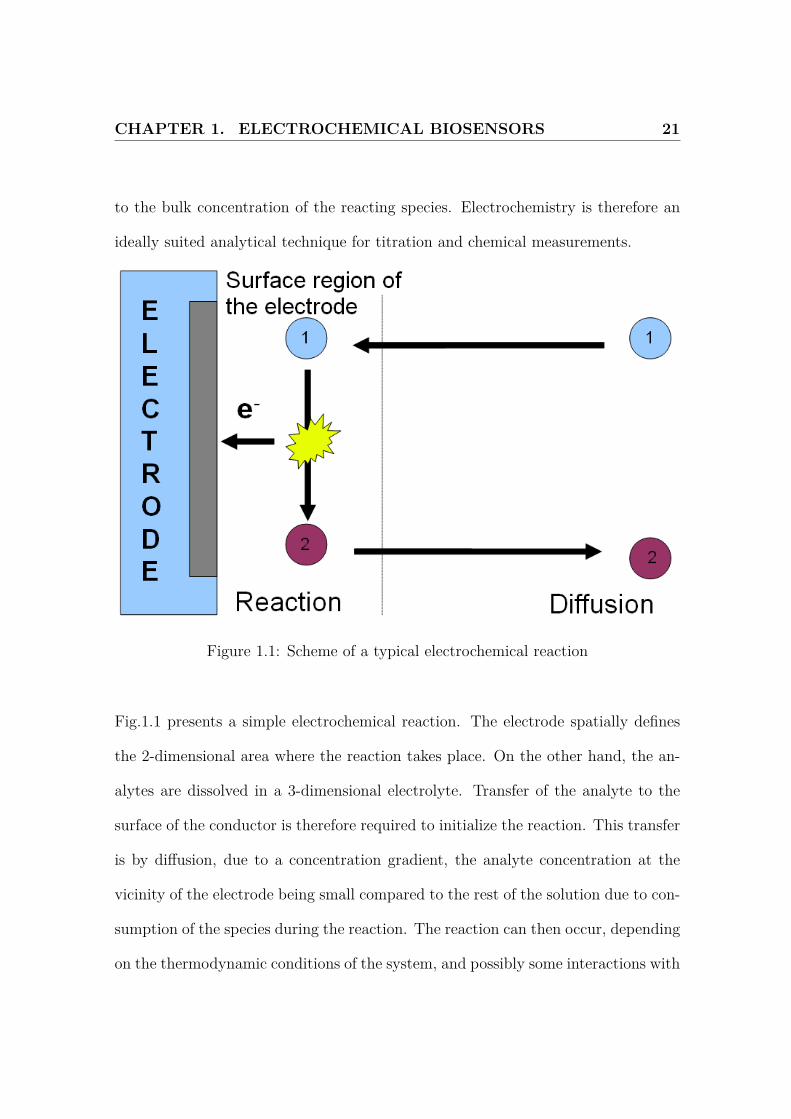
Figure 1.1: Scheme of a typical electrochemical reaction
Fig.1.1 presents a simple electrochemical reaction. The electrode spatially defines
the 2-dimensional area where the reaction takes place. On the other hand, the an-
alytes are dissolved in a 3-dimensional electrolyte. Transfer of the analyte to the
surface of the conductor is therefore required to initialize the reaction. This transfer
is by diffusion, due to a concentration gradient, the analyte concentration at the
vicinity of the electrode being small compared to the rest of the solution due to con-
sumption of the species during the reaction. The reaction can then occur, depending
on the thermodynamic conditions of the system, and possibly some interactions with
CHAPTER 1. ELECTROCHEMICAL BIOSENSORS 22
the electrode material (adsorption, formation of bonds).
As a consequence, the current-voltage relationship measured from electrochemical
methods contains several types of information:
• The contribution of transport (gradients of concentration, viscosity) but also
the effect of convection (rotating or laminar flow).
• The thermodynamics of the reaction between the electrode and the analyte.
• The kinetics of the electron transfer.
Several methods have been proposed to disentangle these different parameters.
1.1.2 Electrochemical methods
Several methods are routinely used and have well-established analytical or model-
based interpretations. These are reviewed and extensively described [1, 2, 3] and
have be to used complementarily to obtain precise insights on reaction mechanisms.
The methods used in this project are detailed below.
CHAPTER 1. ELECTROCHEMICAL BIOSENSORS 23
Cyclic voltammetry
Cyclic voltammetry (CV) is a widely used electrochemical method where a range
of potential is linearly scanned at a constant scan rate, the resulting current being
simultaneously measured (Fig.1.2). As a potential where reaction can happen is
reached, we notice an increase in current. This current reaches a maximum, and
then decreases, as the reaction is limited by diffusion. This is linear sweep voltam-
metry. If the sweep is reversed, the technique is known as cyclic voltammetry. This
method provides a quick ’fingerprint’ of the studied system. This can be used to
investigate the reversibility of the process, the analyte concentration or the diffusive
properties of the system. CV can provide qualitative and, with numerical simula-
tion, quantitative information about electrode reaction mechanisms. Notably, peak
current, peak current ratio, peak potential and the form of their dependence on
the scan rate can reveal the extent to which a reaction can be considered thermo-
dynamically reversible and is frequently revealing about any coupled homogeneous
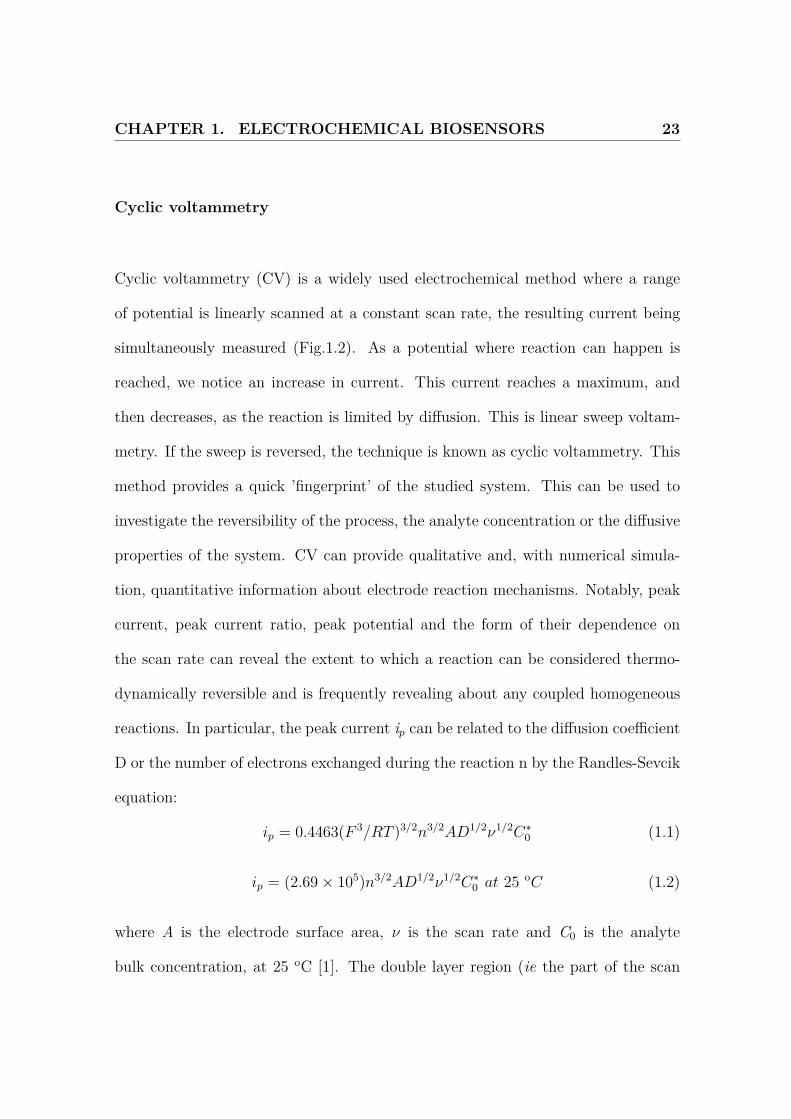
reactions. In particular, the peak current ip can be related to the diffusion coefficient
D or the number of electrons exchanged during the reaction n by the Randles-Sevcik
equation:
ip = 0.4463(F 3/RT )3/2n3/2AD1/2ν1/2C∗0 (1.1)
ip = (2.69× 10⁵)n3/2AD1/2ν1/2C∗0 at 25 oC (1.2)
where A is the electrode surface area, ν is the scan rate and C0 is the analyte
bulk concentration, at 25 oC [1]. The double layer region (ie the part of the scan
CHAPTER 1. ELECTROCHEMICAL BIOSENSORS 24
where no reaction happens) is an indicator of the capacitance of the electrode.
Finally, changing the scan rate provides important informations on the type of
process (reversible, quasi-reversible, irreversible, etc.) or the diffusion coefficient.
We can distinguish chemical reversibility from thermodynamic reversibility [1]. In
chemical reversibility, the reaction can be reversed by inverting the potential, and no
new reaction appears. For the thermodynamic reversibility, a infinitesimal reversal
in the driving force will lead to the reversal of the system. This therefore assumes
that the system is always at equilibrium. In electrochemistry, a system is generally
called electrochemically reversible or thermodynamically reversible if it follows the
Nernst equation
E = Eo′ +RT
nFln
(aO
aR
)(1.3)
where Eo′ is the formal potential of the electrode, and aO and aR are respectively
the activities (or here the concentrations) of the oxidised and reduced species. This
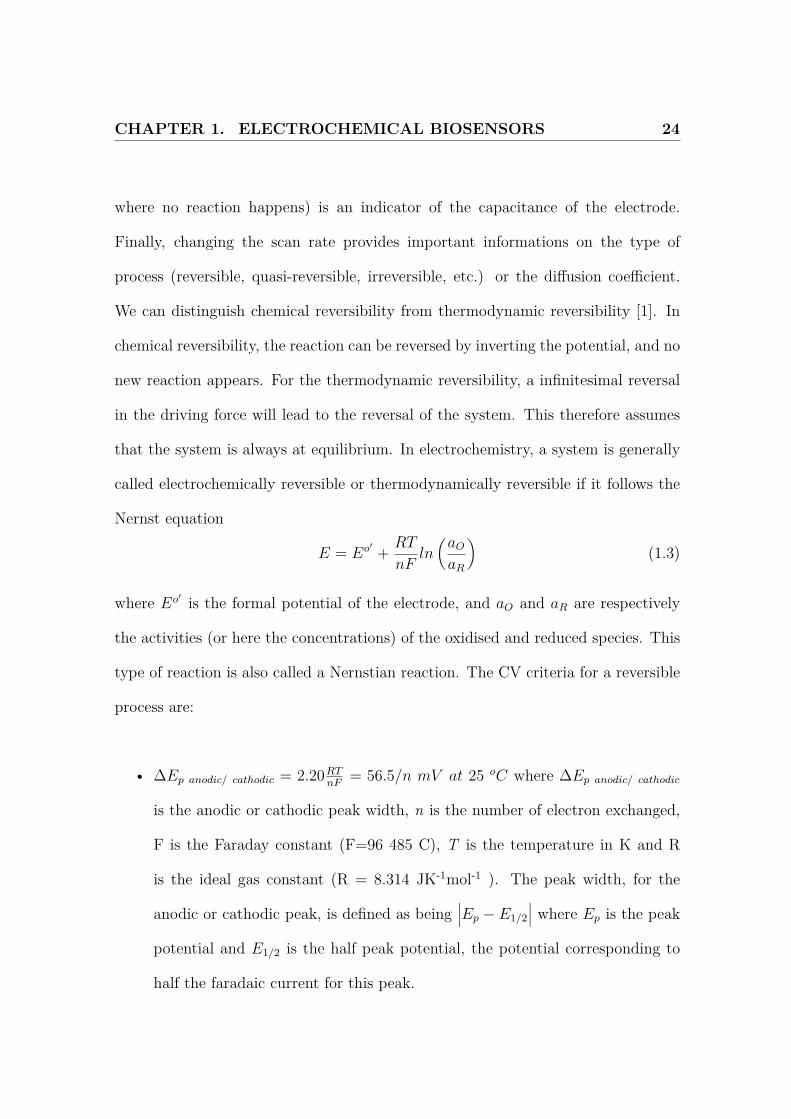
type of reaction is also called a Nernstian reaction. The CV criteria for a reversible
process are:
• ∆Ep anodic/ cathodic = 2.20RTnF
= 56.5/n mV at 25 oC where ∆Ep anodic/ cathodic
is the anodic or cathodic peak width, n is the number of electron exchanged,
F is the Faraday constant (F=96 485 C), T is the temperature in K and R
is the ideal gas constant (R = 8.314 JK-1mol-1 ). The peak width, for the
anodic or cathodic peak, is defined as being∣∣∣Ep − E1/2
∣∣∣ where Ep is the peak
potential and E1/2 is the half peak potential, the potential corresponding to
half the faradaic current for this peak.
CHAPTER 1. ELECTROCHEMICAL BIOSENSORS 25
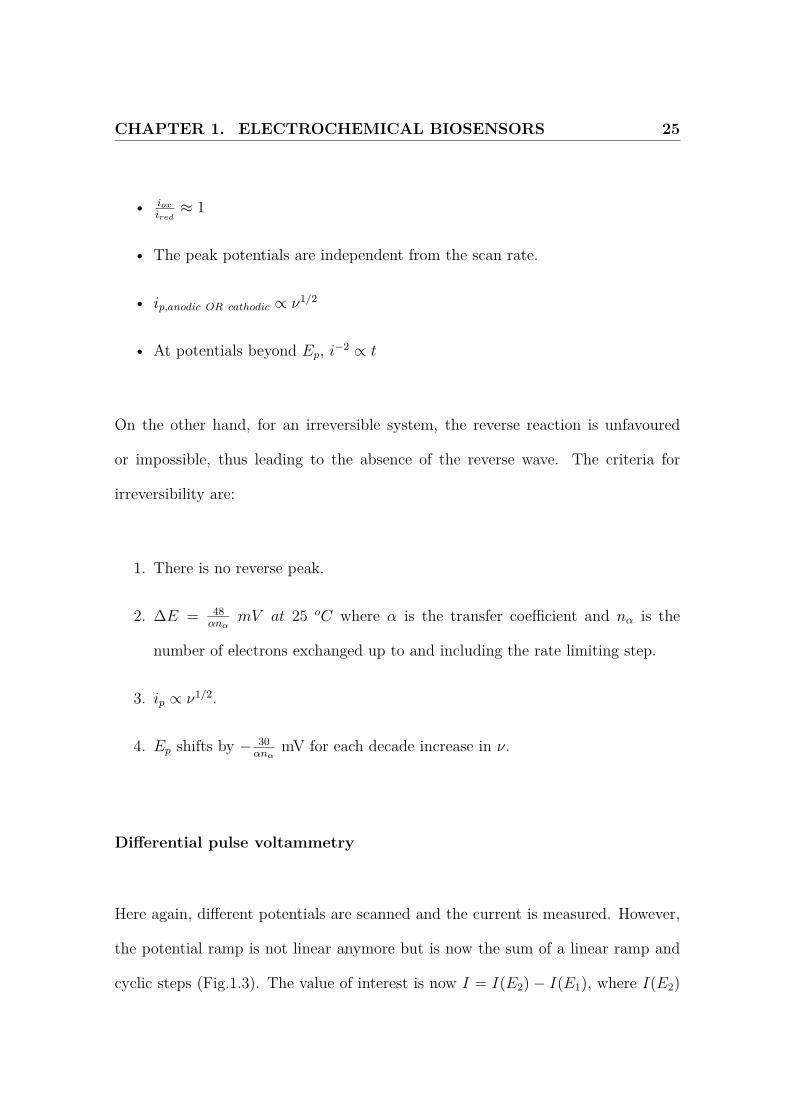
• iox
ired≈ 1
• The peak potentials are independent from the scan rate.
• ip,anodic OR cathodic ∝ ν1/2
• At potentials beyond Ep, i−2 ∝ t
On the other hand, for an irreversible system, the reverse reaction is unfavoured
or impossible, thus leading to the absence of the reverse wave. The criteria for
irreversibility are:
1. There is no reverse peak.
2. ∆E = 48αnα
mV at 25 oC where α is the transfer coefficient and nα is the
number of electrons exchanged up to and including the rate limiting step.
3. ip ∝ ν1/2.
4. Ep shifts by − 30αnα
mV for each decade increase in ν.
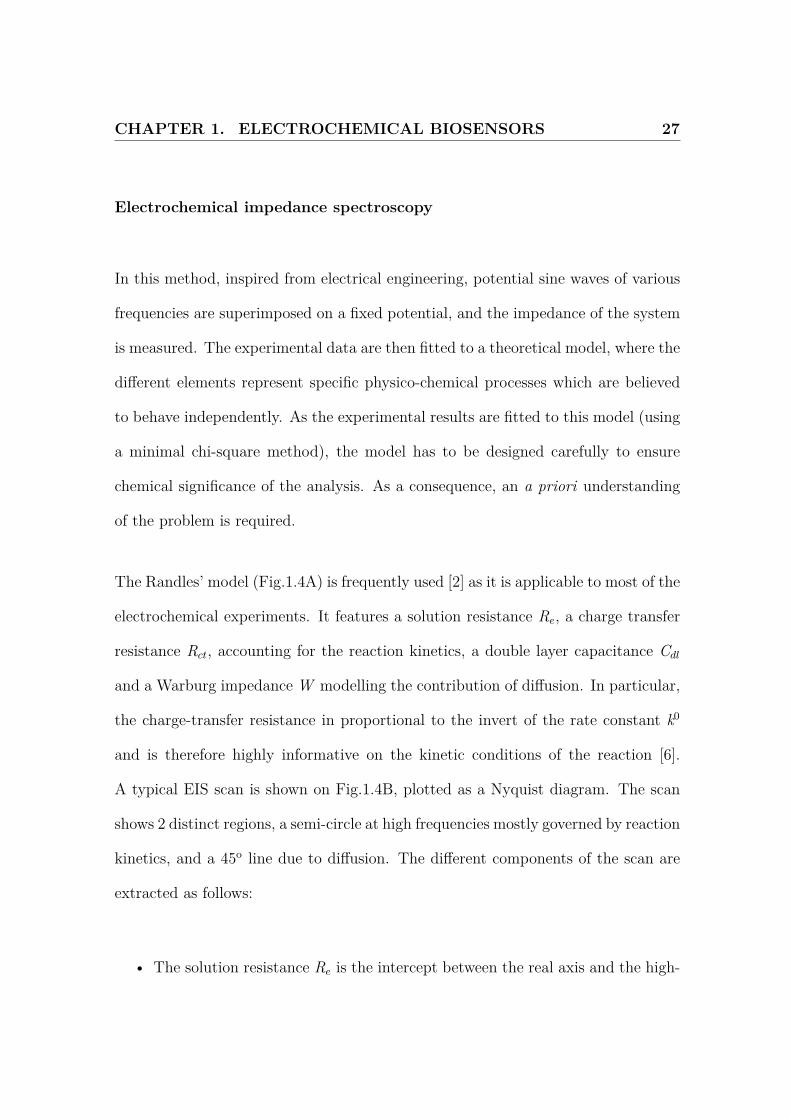
Differential pulse voltammetry
Here again, different potentials are scanned and the current is measured. However,
the potential ramp is not linear anymore but is now the sum of a linear ramp and
cyclic steps (Fig.1.3). The value of interest is now I = I(E2)− I(E1), where I(E2)
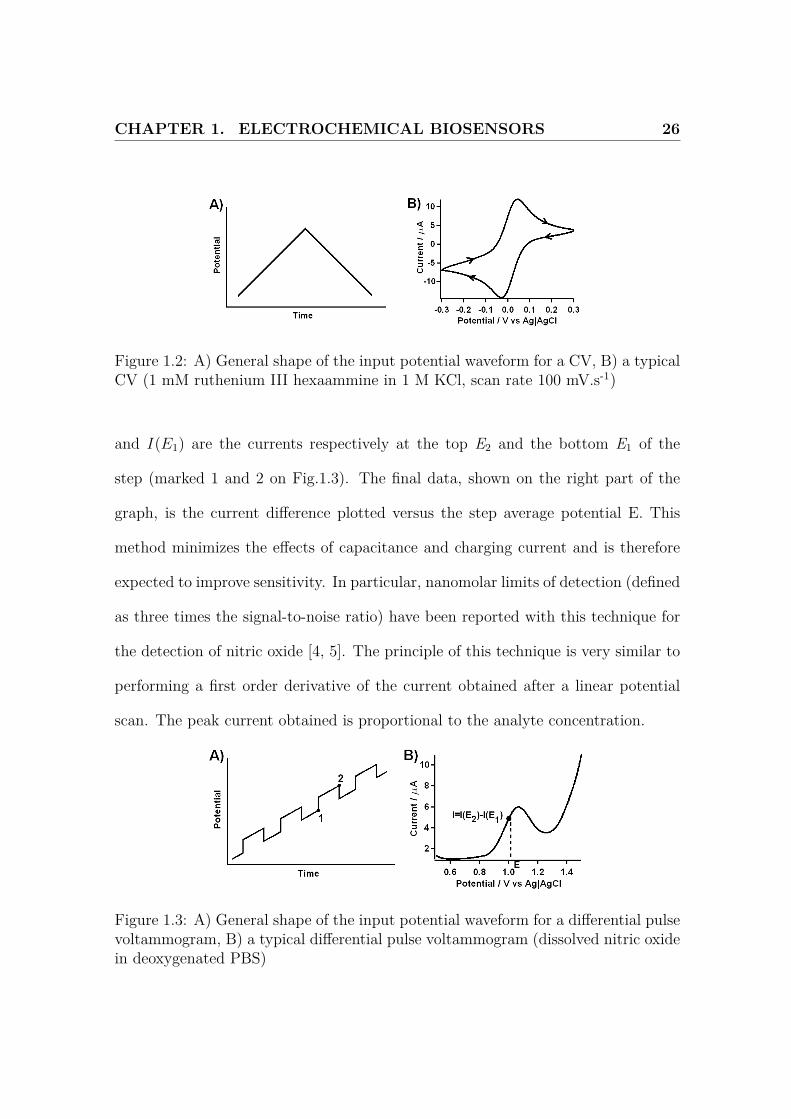
CHAPTER 1. ELECTROCHEMICAL BIOSENSORS 26
Figure 1.2: A) General shape of the input potential waveform for a CV, B) a typicalCV (1 mM ruthenium III hexaammine in 1 M KCl, scan rate 100 mV.s-1)
and I(E1) are the currents respectively at the top E2 and the bottom E1 of the
step (marked 1 and 2 on Fig.1.3). The final data, shown on the right part of the
graph, is the current difference plotted versus the step average potential E. This
method minimizes the effects of capacitance and charging current and is therefore
expected to improve sensitivity. In particular, nanomolar limits of detection (defined
as three times the signal-to-noise ratio) have been reported with this technique for
the detection of nitric oxide [4, 5]. The principle of this technique is very similar to
performing a first order derivative of the current obtained after a linear potential
scan. The peak current obtained is proportional to the analyte concentration.
Figure 1.3: A) General shape of the input potential waveform for a differential pulsevoltammogram, B) a typical differential pulse voltammogram (dissolved nitric oxidein deoxygenated PBS)
CHAPTER 1. ELECTROCHEMICAL BIOSENSORS 27
Electrochemical impedance spectroscopy
In this method, inspired from electrical engineering, potential sine waves of various
frequencies are superimposed on a fixed potential, and the impedance of the system
is measured. The experimental data are then fitted to a theoretical model, where the
different elements represent specific physico-chemical processes which are believed
to behave independently. As the experimental results are fitted to this model (using
a minimal chi-square method), the model has to be designed carefully to ensure
chemical significance of the analysis. As a consequence, an a priori understanding
of the problem is required.
The Randles’ model (Fig.1.4A) is frequently used [2] as it is applicable to most of the
electrochemical experiments. It features a solution resistance Re, a charge transfer
resistance Rct, accounting for the reaction kinetics, a double layer capacitance Cdl
and a Warburg impedance W modelling the contribution of diffusion. In particular,
the charge-transfer resistance in proportional to the invert of the rate constant k0
and is therefore highly informative on the kinetic conditions of the reaction [6].
A typical EIS scan is shown on Fig.1.4B, plotted as a Nyquist diagram. The scan
shows 2 distinct regions, a semi-circle at high frequencies mostly governed by reaction
kinetics, and a 45o line due to diffusion. The different components of the scan are
extracted as follows:
• The solution resistance Re is the intercept between the real axis and the high-
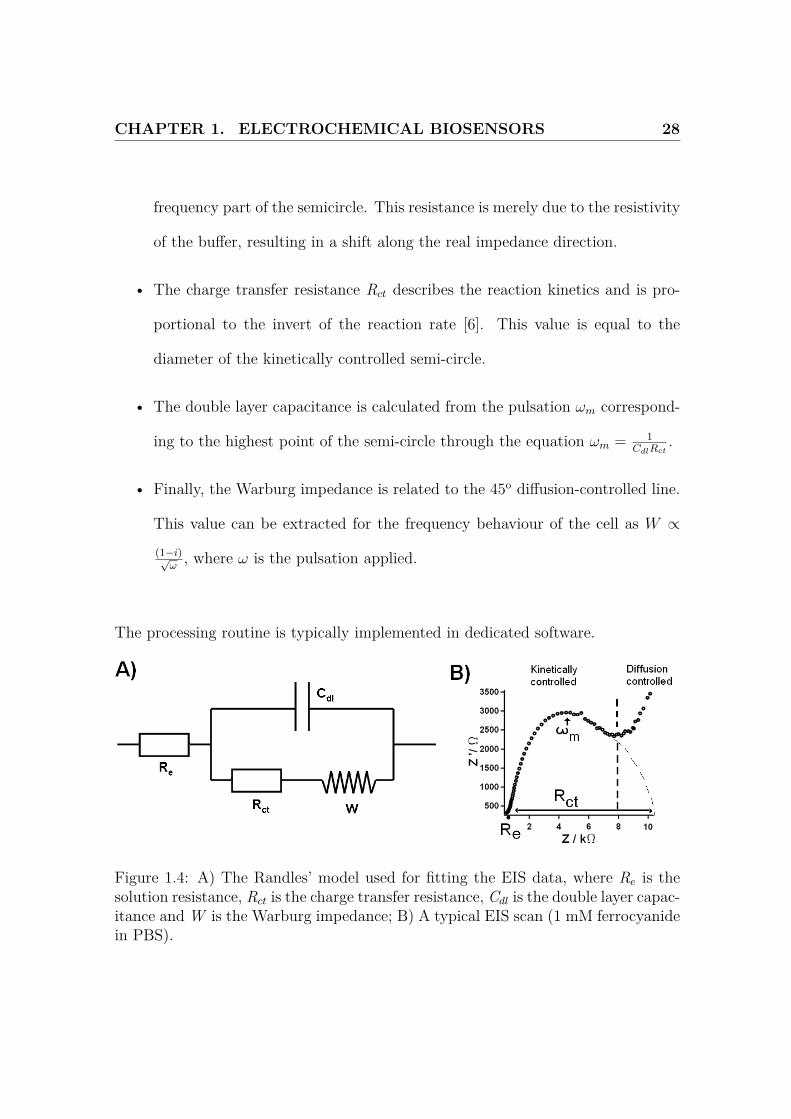
CHAPTER 1. ELECTROCHEMICAL BIOSENSORS 28
frequency part of the semicircle. This resistance is merely due to the resistivity
of the buffer, resulting in a shift along the real impedance direction.
• The charge transfer resistance Rct describes the reaction kinetics and is pro-
portional to the invert of the reaction rate [6]. This value is equal to the
diameter of the kinetically controlled semi-circle.
• The double layer capacitance is calculated from the pulsation ωm correspond-
ing to the highest point of the semi-circle through the equation ωm = 1CdlRct
.
• Finally, the Warburg impedance is related to the 45o diffusion-controlled line.
This value can be extracted for the frequency behaviour of the cell as W ∝
(1−i)√ω
, where ω is the pulsation applied.
The processing routine is typically implemented in dedicated software.
Figure 1.4: A) The Randles’ model used for fitting the EIS data, where Re is thesolution resistance, Rct is the charge transfer resistance, Cdl is the double layer capac-itance and W is the Warburg impedance; B) A typical EIS scan (1 mM ferrocyanidein PBS).
CHAPTER 1. ELECTROCHEMICAL BIOSENSORS 29
Amperometry
In this technique, the electrode is held at a fixed potential, and the current is mea-
sured a function of time. This steady state current is a function of the analyte
concentration, and follows the local changes in analyte concentration. This is a
commonly used method for biological applications.
By using the above methods on the same system, it is possible to disentangle the
respective contributions of the different parameters of the reaction, such as diffusion,
reaction kinetics, catalytic effects, double layer capacitance or the type of reaction.
Mechanistic studies therefore have to feature several of these techniques to ensure
full characterization of all the physico-chemical phenomena contributing to the re-
action.
1.1.3 Electrochemistry and biological measurements
Electrodes have been used for numerous biomeasurements [7], in particular for oxy-
gen biomeasurements since 1938 [8] and in neurochemistry since 1973 [9]. Only the
most frequent and representative use of electrochemistry in biological sciences are
presented here.
Electrochemistry is often used as an analytical technique for the study of neuro-
CHAPTER 1. ELECTROCHEMICAL BIOSENSORS 30
transmitters. Indeed, most of these important molecules are electroactive and can
be oxidised [10, 11, 12], at the surface of carbon fibre microelectrode for instance.
The carbon fibre method has been initially implemented by Ponchon et al. [10]
and a wealth of studies have used this technology. Study of neurotransmitters have
mostly been performed in the brain, ex vivo [13] or in vivo [14, 15], but also in the
adrenal glands, or more recently into the gut, using boron doped diamond electrodes
[16].
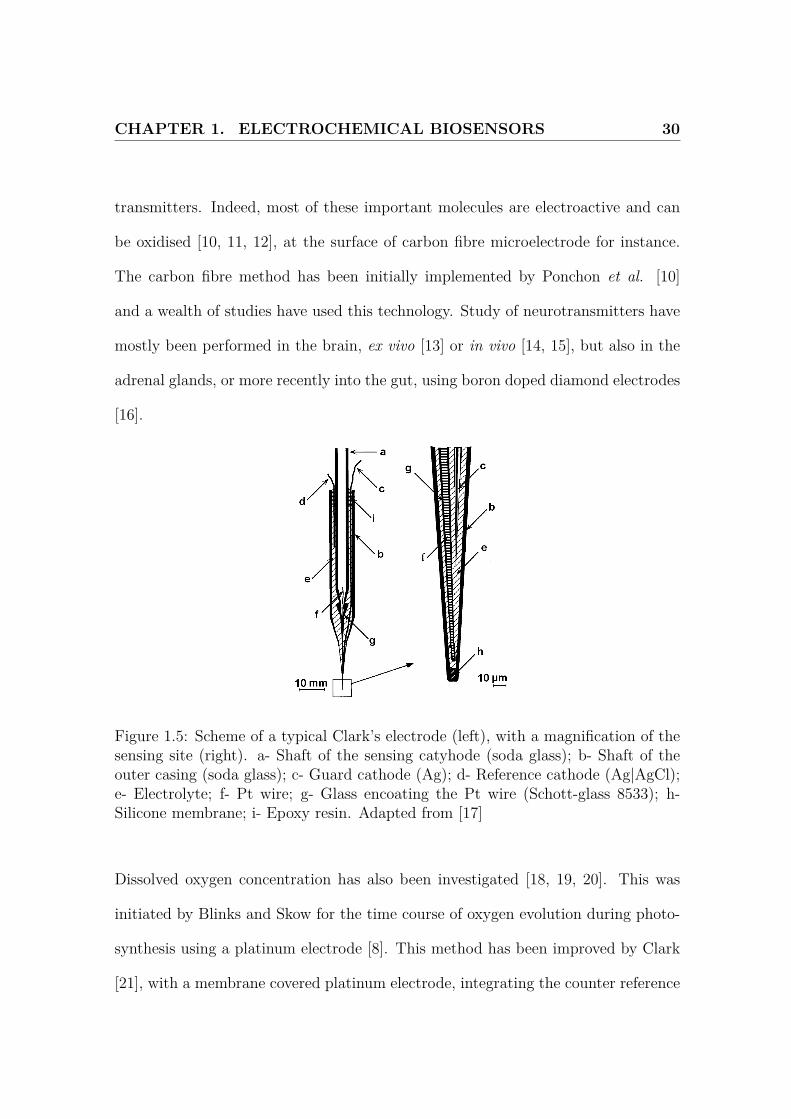
Figure 1.5: Scheme of a typical Clark’s electrode (left), with a magnification of thesensing site (right). a- Shaft of the sensing catyhode (soda glass); b- Shaft of theouter casing (soda glass); c- Guard cathode (Ag); d- Reference cathode (Ag|AgCl);e- Electrolyte; f- Pt wire; g- Glass encoating the Pt wire (Schott-glass 8533); h-Silicone membrane; i- Epoxy resin. Adapted from [17]
Dissolved oxygen concentration has also been investigated [18, 19, 20]. This was
initiated by Blinks and Skow for the time course of oxygen evolution during photo-
synthesis using a platinum electrode [8]. This method has been improved by Clark
[21], with a membrane covered platinum electrode, integrating the counter reference
CHAPTER 1. ELECTROCHEMICAL BIOSENSORS 31
electrode behind the membrane. Briefly, an etched platinum microwire is covered
with glass using a pipette puller. This electrode is then covered with a membrane,
such as collodion and polystyrene. Measurement of oxygen tension in blood was
reported in 1953 with this method. This metal electrode has been optimised using
different processes and used to measure the oxygen gradient across artery walls [22],
or to identify hypoxic tissues in tumours [23, 24].
Numerous biological molecules can be directly sensed on a bare electrode. For
some other systems, like glucose, surface activation, for instance through enzyme
immobilization is required [25, 26].
Electrochemical methods are cheap, rapid, mass-producible and user-friendly com-
pared to the other methods commonly used for biological measurements biomea-
surements, like confocal microscopy, chromatographic methods, radiolabelling or
imaging. They also offer good spatial and temporal resolution, the possibility to
perform continuous recordings and can be applied to a wide range of biosystems
(animal, cells, plants, human, excised tissue, etc.)
However, several technical limitations arise when electrochemical methods are ap-
plied to biological measurements. The first is the invasiveness of this type of sensing,
as the electrode has to be directly inserted into the sample. The impact of the sen-
sor is limited by the micrometric size of the device, but risks of infection or foreign
body reactions still have to be considered. An electrochemical sensor intrinsically
modifies the environment by reducing or oxidising a biologically relevant molecule.
CHAPTER 1. ELECTROCHEMICAL BIOSENSORS 32
This can result in a serious depletion of this molecule in the surrounding tissue and
therefore in a pathological response. Interaction with the biological environment
is, practically, the main problem encountered during biosensing, as detailed in the
following paragraph. Use of electrochemical sensor is also limited by the molecule of
interest, has this molecule has to be electroactive in the domain of stability of water.
This problem can be partially solved by modifying the surface of the electrode, with
enzymes for example.
1.2 The tissue-sensor interface
1.2.1 The biofouling phenomenon
Stability of electrodes in presence of biomolecules has seriously limited the devel-
opment and use of bioelectrochemical devices. Indeed, introducing any artificial
materials inside the body is going to trigger immune responses or adsorption of
amphiphilic molecules on the surface, thus changing the conditions of the tissue-
electrode interface. This is a well-known problem, widely reported in the field of
prosthetics and implantable devices [27, 28].
Interactions between biomolecules and the electrode are the main factors limiting
the use of electrochemical sensors for biological studies (Fig.1.6-A). In vivo or in situ
measurements expose the sensor to a complex matrix of proteins, which are very
CHAPTER 1. ELECTROCHEMICAL BIOSENSORS 33
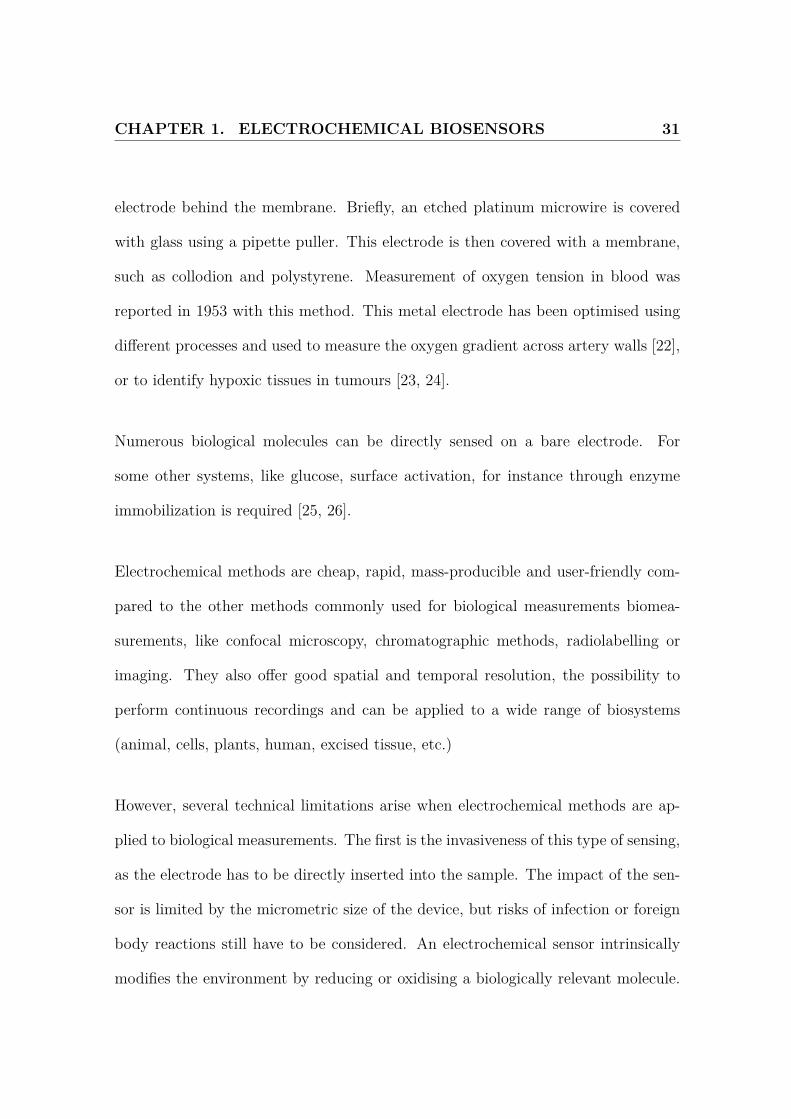
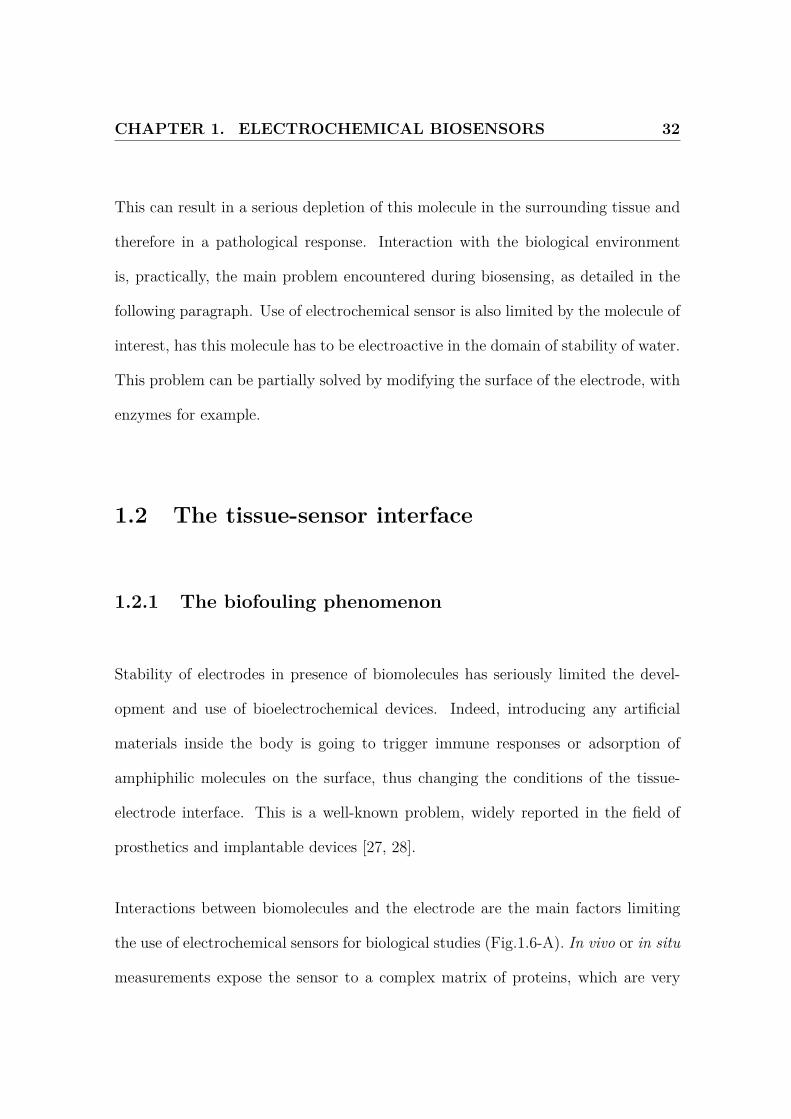
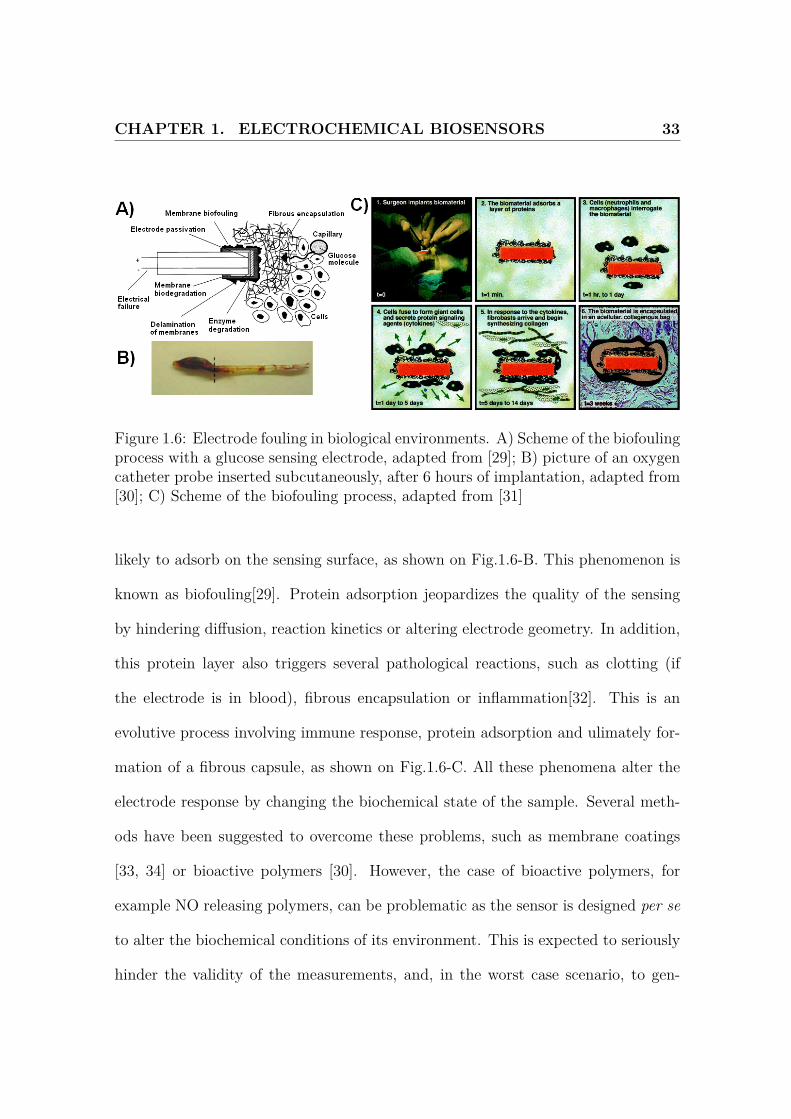
Figure 1.6: Electrode fouling in biological environments. A) Scheme of the biofoulingprocess with a glucose sensing electrode, adapted from [29]; B) picture of an oxygencatheter probe inserted subcutaneously, after 6 hours of implantation, adapted from[30]; C) Scheme of the biofouling process, adapted from [31]
likely to adsorb on the sensing surface, as shown on Fig.1.6-B. This phenomenon is
known as biofouling[29]. Protein adsorption jeopardizes the quality of the sensing
by hindering diffusion, reaction kinetics or altering electrode geometry. In addition,
this protein layer also triggers several pathological reactions, such as clotting (if
the electrode is in blood), fibrous encapsulation or inflammation[32]. This is an
evolutive process involving immune response, protein adsorption and ulimately for-
mation of a fibrous capsule, as shown on Fig.1.6-C. All these phenomena alter the
electrode response by changing the biochemical state of the sample. Several meth-
ods have been suggested to overcome these problems, such as membrane coatings
[33, 34] or bioactive polymers [30]. However, the case of bioactive polymers, for
example NO releasing polymers, can be problematic as the sensor is designed per se
to alter the biochemical conditions of its environment. This is expected to seriously
hinder the validity of the measurements, and, in the worst case scenario, to gen-
CHAPTER 1. ELECTROCHEMICAL BIOSENSORS 34
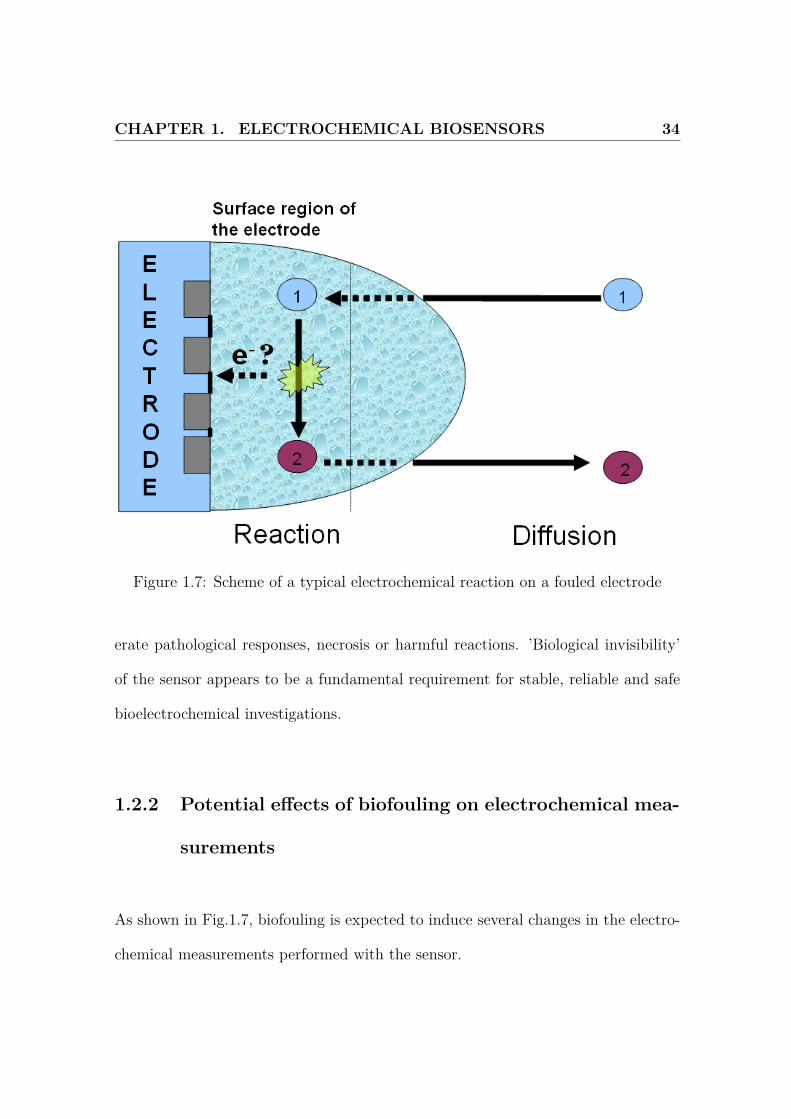
Figure 1.7: Scheme of a typical electrochemical reaction on a fouled electrode
erate pathological responses, necrosis or harmful reactions. ’Biological invisibility’
of the sensor appears to be a fundamental requirement for stable, reliable and safe
bioelectrochemical investigations.
1.2.2 Potential effects of biofouling on electrochemical mea-
surements
As shown in Fig.1.7, biofouling is expected to induce several changes in the electro-
chemical measurements performed with the sensor.
CHAPTER 1. ELECTROCHEMICAL BIOSENSORS 35
Firstly, encapsulation, which can be seen as the formation of an aqueous polymer
on the surface, will alter the diffusion profiles and hinder the mass transport to the
electrode. This is expected due to the local reduction in free volumes [35]. This will
reduce the steady state current and modify the shape of the i-V curves obtained from
potentiodynamic techniques, in particular the peak currents. The other effect of this
matrix is also secondary reaction with the redox couple of interest. In particular, in
the case of dopamine or ferrocyanide oxidation, cysteines can reduce the conjugated
quinone, thus regenerating the oxidation substrate and increasing the measured
current essentially through a catalytic EC’ mechanism [36, 37, 38, 39].
Secondly, adsorption of molecules on the electrode may reduce the measured current
or modify the geometry of the electrode. In particular, local inactivation of the
surface can transform the electrode into an array of smaller electrodes. This is
expected to modify the transient behaviour of the electrode, because of the merging
of the local diffusion profiles [40].
Thirdly, adsorption of molecules can compete for electrocatalytic high energy sites,
eg oxygen functionality on carbon electrodes, out of lattice metal atoms. We ex-
pect this to have a more marked effect on kinetics for inner sphere redox couples
and reactions where reactants or intermediates are adsorbed (eg oxygen reduction,
dopamine oxidation)
Finally, the capacitance of the electrode is decreased by partial inactivation of the
conducting surface. Capacitance arises from formation of charged layers at the
CHAPTER 1. ELECTROCHEMICAL BIOSENSORS 36
electrode surface as it is dipped in the solution [1]. Non-electroactive, charged
molecules from the background are attracted to the charged surface, thus creating
a counter-charged layer and therefore a capacitance. The value of this capacitance
is dependent on the surface of the conductor, the potential, the type of material
and the background electrolyte. This capacitance is therefore expected to decrease,
as spectator species are adsorbed on the surface, thus providing a good criterion to
evaluate the level of fouling of the sensor.
Biofouling is therefore expected to alter all of the features of electrochemical mea-
surements. Several methods and parameters have to be studied to quantify its
effects.
1.3 Microfabricated electrochemical devices
Electrochemical devices are mostly conducting surfaces delimited by an insulator.
This simple morphology is ideally suited for miniaturization, which is a major re-
quirement for biological and medical use, and mass production. In particular, we
can take advantage of recent advances in microfabrication to obtain robust, reliable
and reproducible devices. Two types of electrochemical devices are most frequently
used: carbon fibre microelectrodes and microelectrode arrays.
CHAPTER 1. ELECTROCHEMICAL BIOSENSORS 37
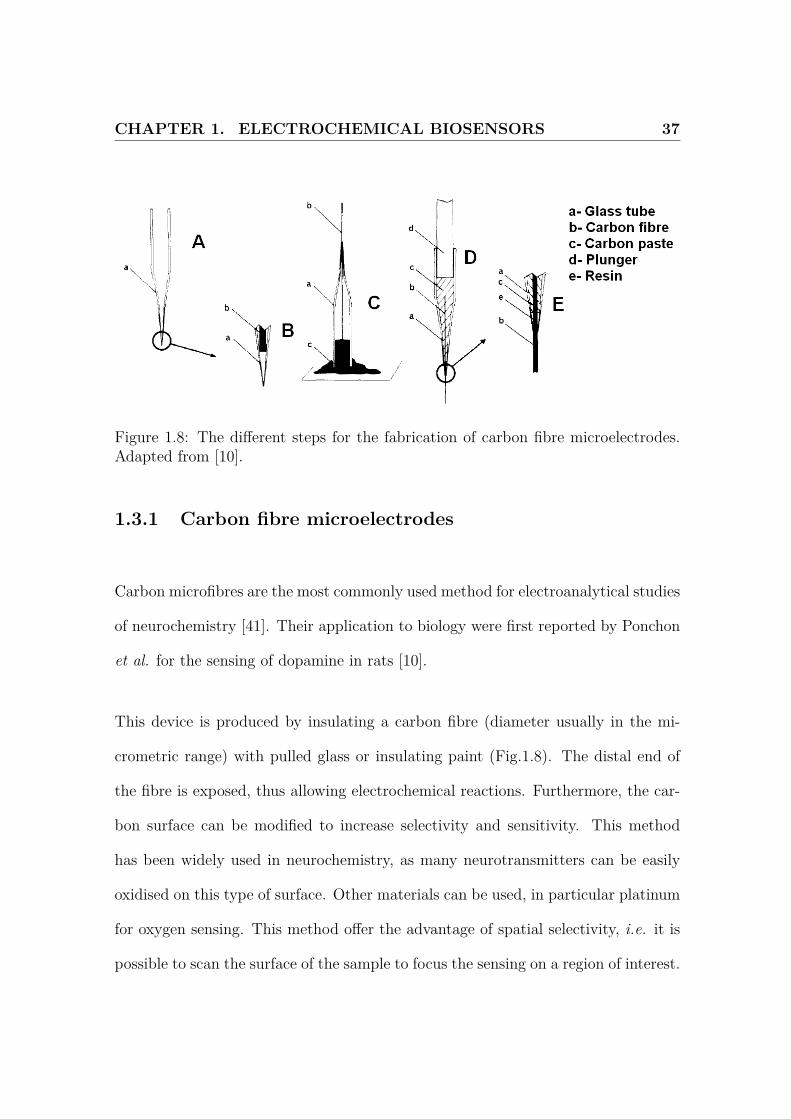
Figure 1.8: The different steps for the fabrication of carbon fibre microelectrodes.Adapted from [10].
1.3.1 Carbon fibre microelectrodes
Carbon microfibres are the most commonly used method for electroanalytical studies
of neurochemistry [41]. Their application to biology were first reported by Ponchon
et al. for the sensing of dopamine in rats [10].
This device is produced by insulating a carbon fibre (diameter usually in the mi-
crometric range) with pulled glass or insulating paint (Fig.1.8). The distal end of
the fibre is exposed, thus allowing electrochemical reactions. Furthermore, the car-
bon surface can be modified to increase selectivity and sensitivity. This method
has been widely used in neurochemistry, as many neurotransmitters can be easily
oxidised on this type of surface. Other materials can be used, in particular platinum
for oxygen sensing. This method offer the advantage of spatial selectivity, i.e. it is
possible to scan the surface of the sample to focus the sensing on a region of interest.
CHAPTER 1. ELECTROCHEMICAL BIOSENSORS 38
Several researchers have extended the range of application by modifying the car-
bon surface of this electrode. Polymeric films can be deposited on the surface. This
can reduce the effect of fouling, in particular Nafion coating in the case of serotonin
detection [42], or increase the sensitivity and selectivity of the sensor towards a spe-
cific analyte [4, 43, 44, 45].
The geometry of these sensors may also have an impact of the measurements. In-
deed, two types of microsensors are generally used: inlaid microdiscs [44, 4] and
microcylinders [42, 13]. With the latter electrode, interpretation is more compli-
cated because of larger surface area, leading to biological heterogeneity and poor
spatial resolution as the side of the cylinder senses, in particular in vivo, a larger
biological area. Furthermore, the end and the side of the cylinder are expected to
show different reactivity. Cylindrical electrode production is also less reproducible.
1.3.2 Microelectrode arrays
The microelectrode arrays take full advantage of the recent developments in microde-
vices, as these devices are fully microengineered and do not require custom-building.
This offers minimal variation from one device to another and should facilitate the
use of such systems. In addition, these platforms can be easily integrated to larger
systems, and are therefore a very attractive prospect for biomedical and analytical
CHAPTER 1. ELECTROCHEMICAL BIOSENSORS 39
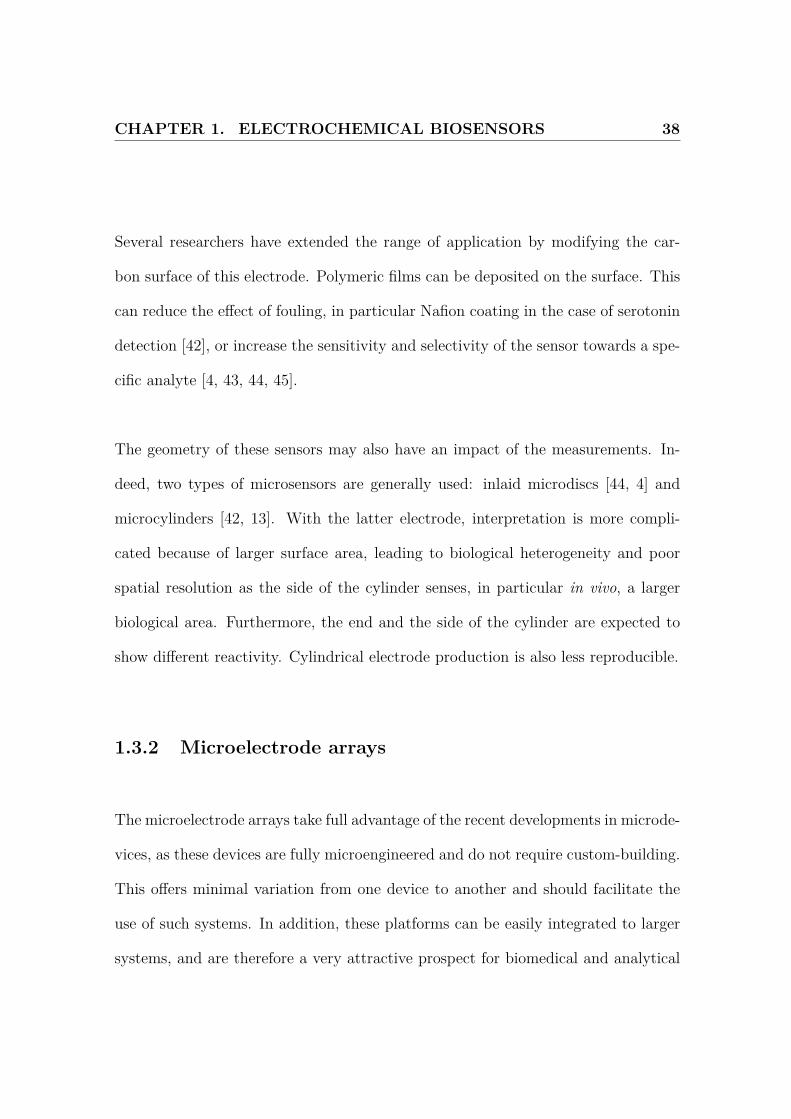
Figure 1.9: Fabrication of an electrode microarray using stereolithography. (1) A1 mm thick cleaned glass wafer was (2) coated first with gold on titanium. (3)Photoresist was spin coated and (4) patterned through a chromed mask. (5) Theresin was then developed. (6) The gold electrodes were etched. A polyimide layerwas (7) deposited, (8) patterned using a chrome mask and developed to obtain (9)a completed device with 35 µm recessed gold disc electrodes. Adapted from [46]
devices.
In the case of the microelectrode arrays, the sensing part of the device is prepared by
stereolithography (Fig.1.9). This method is widely used in microelectronics and for
microdevice production. In this method, several layers of materials are deposited,
usually by chemical vapour deposition, on a wafer. This layer is then patterned with
a mask and photo-polymerized resin and wet-etched. Repeating this protocol for
each layer of the system enables production of rather complex and intricate patterns.
Several of such devices have already been proposed for cell-based measurements
[46, 47, 48, 49]. Indeed, these sensors allow several simultaneous measurements,
CHAPTER 1. ELECTROCHEMICAL BIOSENSORS 40
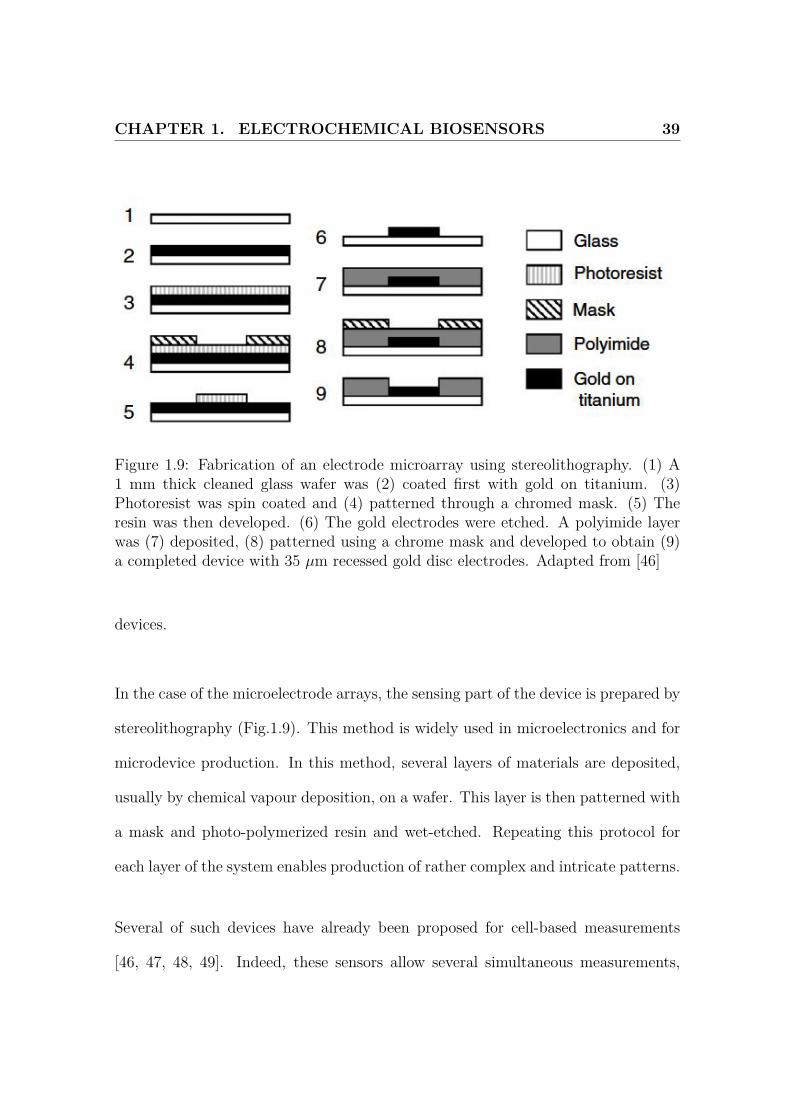
Figure 1.10: Two different microsensor setups: fibre microelectrode (left) and mi-croelectrode array (right)
of different analytes if required. A large volume of data can be acquired more
quickly, compared to the microfibre method. Moreover, this sensor can be left in
an incubator, thus allowing long-term reliable measurements. However, as shown
on Fig.1.10, scanning the surface to study the topology of the sensor is not possible
here. Microelectrode arrays can be used as a complement of fibre microelectrodes.
1.4 Biochemistry of angiogenesis
Angiogenesis, e.g. formation of new blood vessels, is a critical phenomenon in nu-
merous physiological events. Microvasculature is indeed responsible for providing
oxygen and nutrients to tissue. High metabolic demands therefore requires more
dense vascular networks, and formation of new vessels. This is particularly critical
for wound healing or regeneration, or after a graft, to ensure sufficient oxygenation
of the newly formed tissue. More importantly, it is a fundamental factor in cancer
development, as growth of tumours is dependent on nutrient supplied by the vascu-
lar system [50]. Inhibition of angiogenic factors as an anticarcinogenic strategy has
CHAPTER 1. ELECTROCHEMICAL BIOSENSORS 41
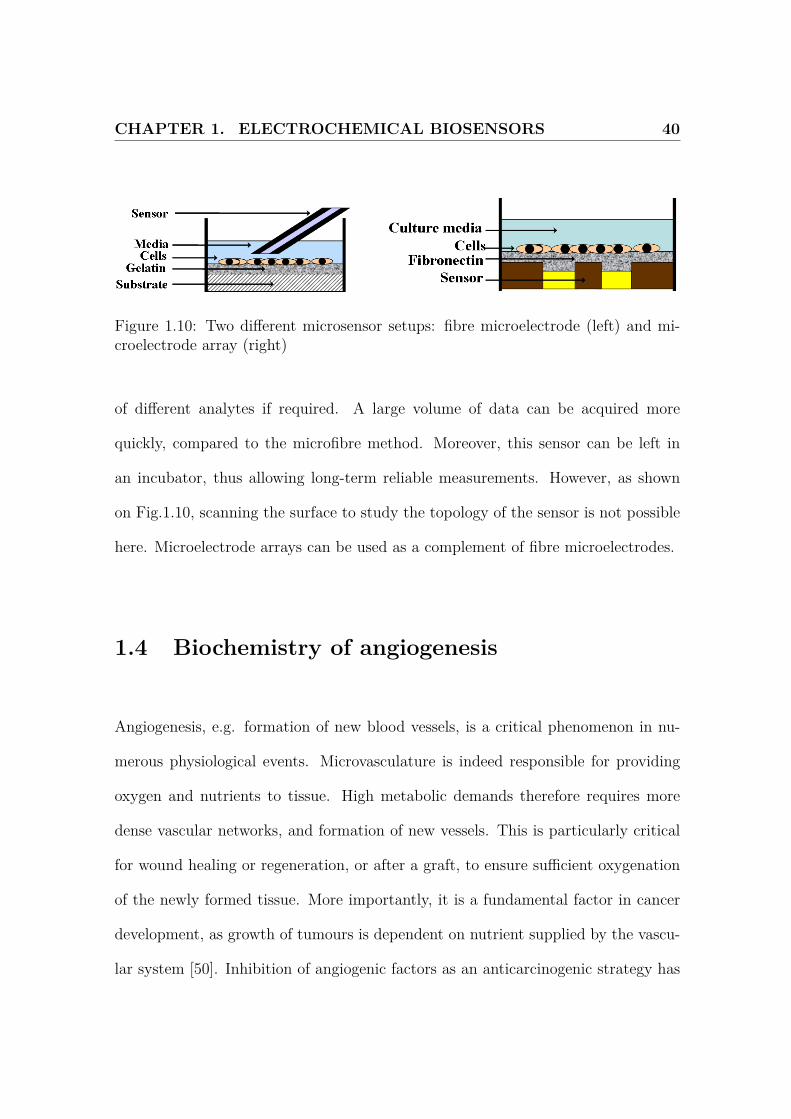
Figure 1.11: A) Microscope pictures of the cross section of an artery, the black arrowshows the endothelium; B) Scheme of the cross section of an artery. Adapted from[52] and [53]
now entered the third phase of clinical tests [51]. Understanding its mechanisms is
therefore of paramount importance for pharmacology and therapy.
Angiogenesis is a complex phenomenon involving mechanical conditions [54] and
chemical mediators [55]. In the case of mechanical stimulation, high blood pres-
sure induces increased shear stress on the artery wall, thus triggering angiogenesis.
This is mediated by endothelial cells covering the artery wall, as shown on Fig.1.11-A
and Fig.1.11-B. These cells are indeed responsible for most of the biochemical events
regulating angiogenesis, in particular by releasing nitric oxide [56], and eventually
sprouting, deforming the artery wall, migrating and forming a new vessel. In the
case of a chemical stimulation, these cells are activated by angiogenic factors. These
factors are in particular produced by tumour or hypoxic cells. These molecules then
activate the endothelial cells through a complex intracellular cascade of kinases,

CHAPTER 1. ELECTROCHEMICAL BIOSENSORS 42
Figure 1.12: Scheme of the intracellular cascade induced by vascular endothelialgrowth factor, VEGF. Adapted from [57]
as shown on Fig.1.12. Indeed, angiogenesis requires activity at both cellular and
molecular levels, and involves a wide range of cellular phenomena, such as migra-
tion, endothelial permeation or mitosis. All these different activities are mediated
through the phosphorylation of specific kinases. Identifying these kinase pathways is
expected to provide pharmacological targets for pathological angiogenesis inhibition
without hindering other biological processes
Most of the high molecular weight messenger molecules, such as angiogenic factors,
or the intracellular expression of proteins or ribonucleotides during angiogenesis have
been and are being widely investigated [58]. However, several markers of low molec-
ular weight (dissolved gases, metabolites) are involved and are not being studied
CHAPTER 1. ELECTROCHEMICAL BIOSENSORS 43
because of the lack of a simple and reliable method of measurement. Moreover,
most of the studies are carried out in cell monolayers and do not address the effect
of mechanical stress, matrix conditions and 3-dimensional growth. Consequently
the initial events of angiogenesis and the extracellular conditions during vascular
growth have been surprisingly little studied and are yet partially unclear.
1.5 Conclusion
Electrochemical sensors are an interesting possibility for the detection of biologically
significant molecules. Electrochemical devices can easily be mass produced and are
suitable for use as a general biochemical test. However, the problem of biofoul-
ing has to be addressed before any bioelectrochemical experiment, as changes in the
sensor behaviour in presence of biomolecules can jeopardize the quality of the results.
The research project presented here is focused on i) improving the stability of the tis-
sue sensor interface, ii) establishing a reliable protocol for the use of microelectrode
arrays in biological conditions and iii) applying this technology to the biochemistry
of angiogenic factors.
Chapter 2
Improving Sensor Biocompatibility
and Reducing Biofouling
2.1 Boron doped diamond and glassy carbon elec-
trodes
2.1.1 Introduction
Carbon based electrodes are widely used for in vivo and in vitro electrochemical
studies. In particular, monoamine physiology in the nervous system has been inves-
tigated using carbon paste [59, 60, 61] and carbon microfibre electrodes [62, 63, 64,
44
CHAPTER 2. BIOFOULING AND BIOCOMPATIBILITY 45
65, 66]. These electrodes allow good spatial resolution because of their small size
and are therefore ideal for studies at the cellular level. Similarly, glassy carbon (GC)
is the preferred material for many biochemical applications, such as electrochemi-
cal detection in chromatography. However, fouling of the carbon surface during
catecholamine oxidation limits the long term stability of these electrodes.
The main other factor limiting the use of electrochemical sensors for biological stud-
ies is the effect of the biological matrix. Using an electrode material compatible
with reliable measurements in potentially fouling environments is an attractive pos-
sibility to improve stability and precision. Recently, boron doped diamond (BDD)
has been used for biosensing [67, 68, 69]. The carbon sp3 structure of the sample-
sensor interface is expected to provide better resistance to fouling because of its high
chemical inertness and stability. Furthermore, these electrodes show a low capaci-
tance [70] and therefore improved performances for the detection of small amounts
of molecules in complex biological matrices.
In this chapter, investigation of the stability of two carbon based electrode materi-
als, GC and BDD, used for electrochemical measurements in biological matrices is
described. We have utilized two different biological environments. Firstly, 40 g.l-1
bovine serum albumin has been added to the PBS used as an electrolyte. Addition
of albumin at its blood concentration is a commonly used surrogate for biological
environments in bioelectrochemical studies [71, 33, 34, 72], albumin being one of the
most abundant protein in bio-fluids. Secondly, homogenized chicken liver (1:4 v/v
CHAPTER 2. BIOFOULING AND BIOCOMPATIBILITY 46
in PBS) has also been used to mimic the complex composition of biological samples
containing colloids, lipids, hormones and proteins.
Firstly, cyclic voltammograms (CV) and electrochemical impedance spectra (EIS)
of the outer-sphere couple ruthenium III/II hexaammine were recorded in these
buffers (ie PBS, PBS with albumin, PBS with homogenized liver). Secondly, similar
experiments were performed on ferrocyanide. This chemical is known to be surface
sensitive [73] and can therefore give valuable informations on the surface interactions.
Finally, several successive CV of dopamine (DA), which is critically dependent on
the surface state of the electrode, have also been performed. DA is also known to
foul the electrode material. Studying the fouling kinetics was expected to provide
significant indications about matrix adsorption, these two phenomena competing for
adsorption sites on the electrode. However, the DA fouling led us not to perform
EIS for this chemical. A complete EIS scan, in these experiments, lasts about a
minute. DA fouling occurs very rapidly, and modifies the electrode as the EIS is
performed. As the constant change in current magnitude was expected to hinder
the AC behaviour of the electrodes, EIS was not performed for this system.
CHAPTER 2. BIOFOULING AND BIOCOMPATIBILITY 47
2.1.2 Material and Methods
Chemicals
All the chemicals were purchased from Sigma and were used without further purifi-
cation. Deionized water purified with a Millipore system was used throughout these
experiments (resistivity ≥ 15 MΩ.cm).
The measurements were carried out in phosphate buffered saline (PBS, pH 7.4, 0.01
M phosphate buffered) with 1 mM ruthenium III hexaammine chloride or 1 mM
potassium ferrocyanide, or 1 mM 3-hydroxytyramine (dopamine, DA).
Effects of biological matrix was simulated by adding 40 g.l-1 of albumin from bovine
serum or 1:4 v/v of homogenized chicken liver to the PBS.
Electrode preparation
The BDD electrode (Windsor Scientific, UK, diameter 3mm, boron doping level:
≈0.1%, resistivity: 7.5x10⁻⁴ Ω m) was carefully polished on 0.3 µm alumina aqueous
slurry to remove adsorbed biological matrix, sonicated for 2 minutes in water and
cathodically treated for 30 minutes in 0.5 M perchloric acid at -3 V vs Ag|AgCl [74].
The electrode was then kept in water.
CHAPTER 2. BIOFOULING AND BIOCOMPATIBILITY 48
The GC electrode (CHI Instruments, Austin, Texas, USA, diameter 3 mm) was
prepared following two different methods. The electrode was carefully polished on
0.3 µm alumina aqueous slurry, sonicated for 2 minutes and kept in water. This
electrode is referred to as GC-P (polished). In the other process, water in the
alumina slurry was replaced with cyclohexane purified for 24 hours over activated
carbon[75]. The electrode was then placed in cleaned cyclohexane, sonicated for
2 minutes and kept in this solvent. This preparation is referred to as GC-D (de-
oxidised).
Electrochemical measurements
The 3 electrode setup was completed with a Pt wire as the counter electrode and
an Ag|AgCl, 3 M KCl reference electrode.
Cyclic voltammograms (CV) were performed using a CHI 1030 potentiostat (CHI
Instruments, Austin, Texas, USA). The scan rate was 100 mV.s-1 for all the experi-
ments.
Electrochemical impedance spectroscopy (EIS) was performed using an Ivium Com-
pactstat (Ivium Technologies, Netherlands). The potential amplitude was 10 mV
and the frequency range, for ruthenium III hexaammine, was 1 MHz-1 Hz. The bias
potential was the mid-peak potential obtained during the CV.
CHAPTER 2. BIOFOULING AND BIOCOMPATIBILITY 49
The solutions were degassed prior experiments by bubbling them with nitrogen, or
under vacuum in the case of the albumin containing solutions. The solution was
blanketed with nitrogen for all the experiments.
In the case of DA, long term stability (1 hour) was investigated using amperometry at
the diffusion limited oxidation potential, on a initially clean electrodes. Furthermore,
recovery was studied by dipping the electrodes in warm (40-45oC) isopropyl alcohol
(IPA) for 1 to 2 minutes, and the experiment was repeated for 10 minutes.
Data processing
The CV data were analysed by measuring the anodic peak current Iox, the peak
separation ∆Ep and also the anodic peak width ∆Ep,anodic, the difference between
the anodic peak potential and the half peak potential. Results from the second
cycles were used for this analysis.
For the DA experiments, 10 cycles were performed, and data from the cycles 2 to 10
were used. In particular, the fouling was investigated by calculating the normalized
peak current:Iox,n
Iox,2
(2.1)
where Iox,n is the oxidation peak current from the n-th cycle, n ∈ [|2, 10|]. The
results for the current ratio were then fitted, using a Levenberg-Marquardt fitting
algorithm implemented in the Igor software (Wavemetrics, USA), with an exponen-
CHAPTER 2. BIOFOULING AND BIOCOMPATIBILITY 50
tial function f :
f(n) = K0 + K1 exp(−nt/K2) (2.2)
where t is the duration of dopamine oxidation during one cycle. K0 is the current
ratio after an infinite number of cycles and K2 is the fouling rate, in s. K1 is related
to the initial conditions.
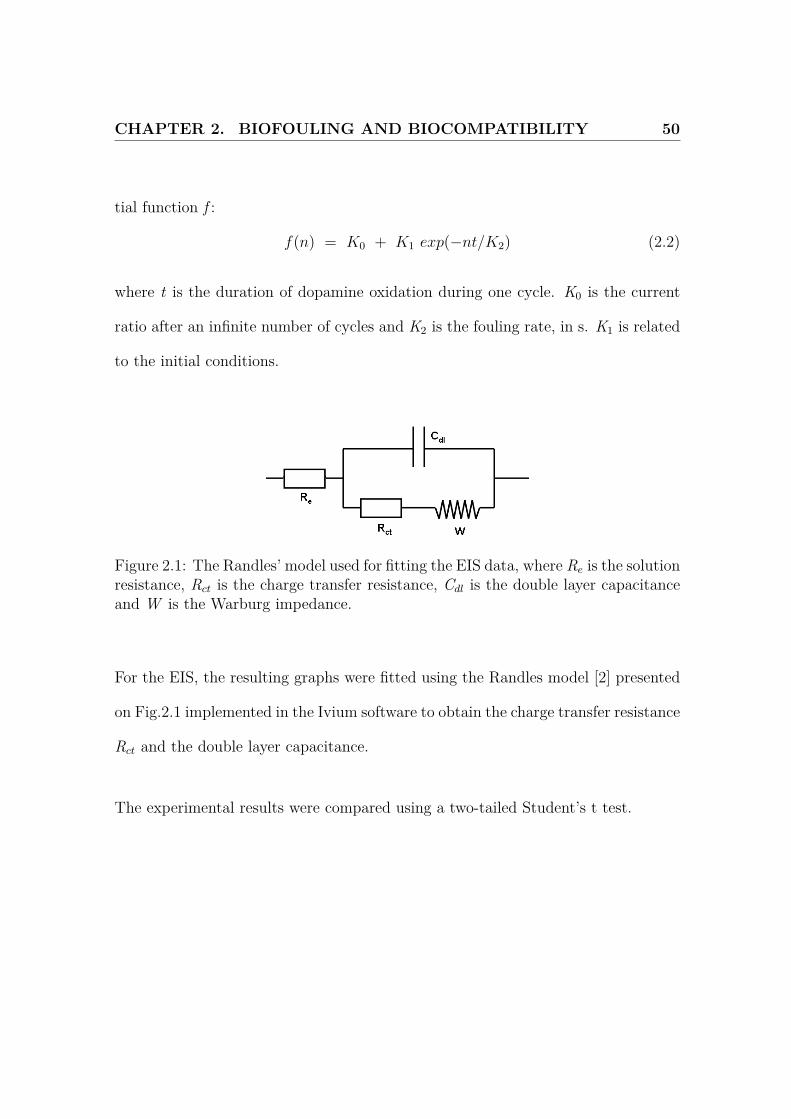
Figure 2.1: The Randles’ model used for fitting the EIS data, where Re is the solutionresistance, Rct is the charge transfer resistance, Cdl is the double layer capacitanceand W is the Warburg impedance.
For the EIS, the resulting graphs were fitted using the Randles model [2] presented
on Fig.2.1 implemented in the Ivium software to obtain the charge transfer resistance
Rct and the double layer capacitance.
The experimental results were compared using a two-tailed Student’s t test.
CHAPTER 2. BIOFOULING AND BIOCOMPATIBILITY 51
2.1.3 Results
For the sake of clarity, only the changes considered highly significant (p < 0.01), in
comparison to the control case without albumin or liver mixture, are reported here.
The peak separation and the anodic peak width have both been reported. The peak
separation has more significance as it is directly related to the reaction rate, but the
peak width is a commonly used criterion for reversible couple. For these reasons,
these 2 values have been considered.
Effect of biological matrices on the cyclic voltammetry of ruthenium III
hexaammine
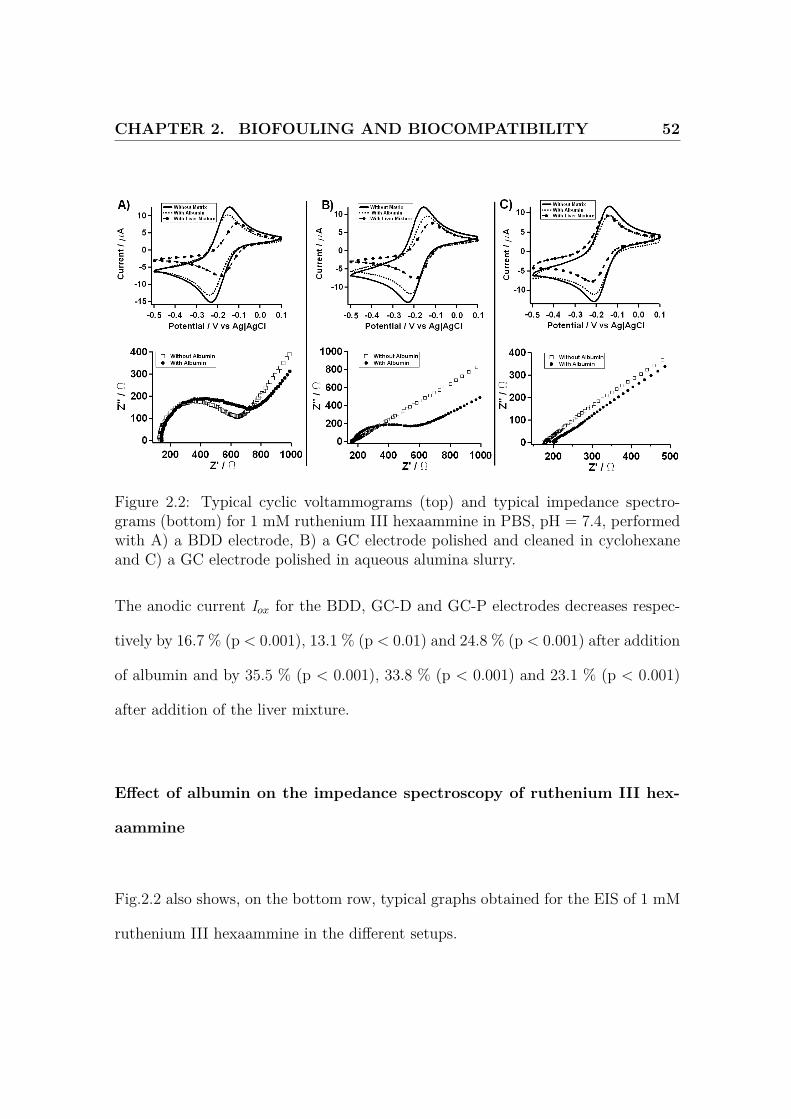
Fig.2.2 (top row) presents some typical CV obtained for 1 mM ruthenium III hex-
aammine with the different biological matrices, for the 3 types of electrode (BDD,
GC-D and GC-P).
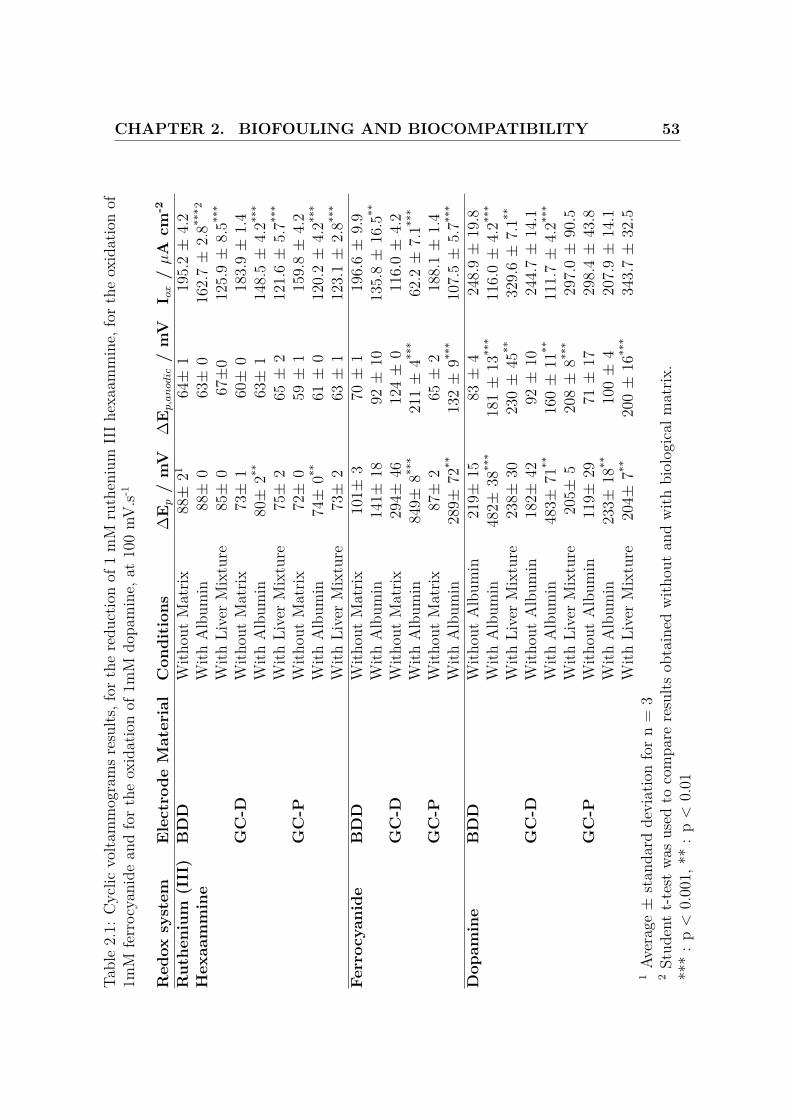
The results obtained for sets of 3 CV are summarized in Table.2.1. Adding albumin
significantly increased ∆Ep for the GC-D (9.5 %, p < 0.01) and GC-P electrodes
(2.3 %, p < 0.01). No significant increase was recorded for the other conditions.
The anodic peak width ∆Ep,anodic obtained for the BDD, GC-D and GC-P electrodes
does not change significantly after addition of albumin or liver mixture.
CHAPTER 2. BIOFOULING AND BIOCOMPATIBILITY 52
Figure 2.2: Typical cyclic voltammograms (top) and typical impedance spectro-grams (bottom) for 1 mM ruthenium III hexaammine in PBS, pH = 7.4, performedwith A) a BDD electrode, B) a GC electrode polished and cleaned in cyclohexaneand C) a GC electrode polished in aqueous alumina slurry.
The anodic current Iox for the BDD, GC-D and GC-P electrodes decreases respec-
tively by 16.7 % (p < 0.001), 13.1 % (p < 0.01) and 24.8 % (p < 0.001) after addition
of albumin and by 35.5 % (p < 0.001), 33.8 % (p < 0.001) and 23.1 % (p < 0.001)
after addition of the liver mixture.
Effect of albumin on the impedance spectroscopy of ruthenium III hex-
aammine
Fig.2.2 also shows, on the bottom row, typical graphs obtained for the EIS of 1 mM
ruthenium III hexaammine in the different setups.
CHAPTER 2. BIOFOULING AND BIOCOMPATIBILITY 53Ta
ble
2.1:
Cyc
licvo
ltam
mog
ram
sre
sults
,for
the
redu
ctio
nof
1m
Mru
then
ium
IIIh
exaa
mm
ine,
fort
heox
idat
ion
of1m
Mfe
rroc
yani
dean
dfo
rth
eox
idat
ion
of1m
Mdo
pam
ine,
at10
0m
V.s-1
Red
oxsy
stem
Ele
ctro
deM
ater
ial
Con
diti
ons
∆E
p/
mV
∆E
p,a
nodic
/m
VI o
x/
µA
cm-2
Rut
heni
um(I
II)
BD
DW
ithou
tM
atrix
88±
2164±
119
5.2±
4.2
Hex
aam
min
eW
ithA
lbum
in88±
063±
016
2.7±
2.8**
*2
With
Live
rM
ixtu
re85±
067±
012
5.9±
8.5**
*
GC
-DW
ithou
tM
atrix
73±
160±
018
3.9±
1.4
With
Alb
umin
80±
2**63±
114
8.5±
4.2**
*
With
Live
rM
ixtu
re75±
265±
212
1.6±
5.7**
*
GC
-PW
ithou
tM
atrix
72±
059±
115
9.8±
4.2
With
Alb
umin
74±
0**61±
012
0.2±
4.2**
*
With
Live
rM
ixtu
re73±
263±
112
3.1±
2.8**
*
Ferr
ocya
nide
BD
DW
ithou
tM
atrix
101±
370±
119
6.6±
9.9
With
Alb
umin
141±
1892±
1013
5.8±
16.5
**
GC
-DW
ithou
tM
atrix
294±
4612
4±
011
6.0±
4.2
With
Alb
umin
849±
8***
211±
4***
62.2±
7.1**
*
GC
-PW
ithou
tM
atrix
87±
265±
218
8.1±
1.4
With
Alb
umin
289±
72**
132±
9***
107.
5±
5.7**
*
Dop
amin
eB
DD
With
out
Alb
umin
219±
1583±
424
8.9±
19.8
With
Alb
umin
482±
38**
*18
1±
13**
*11
6.0±
4.2**
*
With
Live
rM
ixtu
re23
8±30
230±
45**
329.
6±
7.1**
GC
-DW
ithou
tA
lbum
in18
2±42
92±
1024
4.7±
14.1
With
Alb
umin
483±
71**
160±
11**
111.
7±
4.2**
*
With
Live
rM
ixtu
re20
5±5
208±
8***
297.
0±
90.5
GC
-PW
ithou
tA
lbum
in11
9±29
71±
1729
8.4±
43.8
With
Alb
umin
233±
18**
100±
420
7.9±
14.1
With
Live
rM
ixtu
re20
4±7**
200±
16**
*34
3.7±
32.5
1Av
erag
e±
stan
dard
devi
atio
nfo
rn
=3
2St
uden
tt-
test
was
used
toco
mpa
rere
sults
obta
ined
with
out
and
with
biol
ogic
alm
atrix
.**
*:
p<
0.00
1,**
:p
<0.
01
CHAPTER 2. BIOFOULING AND BIOCOMPATIBILITY 54
Average values (n = 3) obtained for the charge-transfer resistance Rct and the capac-
itance are reported in Table.2.2. Changing the biological matrix conditions did not
alter the value of the double layer capacitance for all the electrodes. High variations
in capacitance are noticed due to the absence of a kinetically controlled region.
However, addition of albumin dramatically decreases the kinetics for the GC-D
electrode as Rct increases significantly (+ 2008.1 %, p < 0.001). Rct is indeed
proportional to the invert of the reaction rate constant k0 [6].
Effect of biological matrices on the cyclic voltammetry of ferro/ferricyanide
Fig.2.3 presents on the top row some typical CV obtained for 1 mM ferrocyanide
with the different biological matrices, for the 3 types of electrode (BDD, GC-D and
GC-P). These results are summarized on Table.2.1.
Albumin did not change ∆Ep for the BDD, but did seriously increase it for the
GC-D (188.5 %, p < 0.001) and GC-P electrodes (232.2 %, p < 0.01).
The anodic peak ∆Ep,anodic width obtained for the BDD did not change, and in-
creased for the GC-D (74.2 %, p < 0.001) and GC-P (103.6 %, p < 0.001).
The anodic current Iox for the BDD, GC-D and GC-P electrodes decreased respec-
tively by 31.0 % (p < 0.01), 46.3 % (p < 0.001) and 42.9 % (p < 0.001) after addition
CHAPTER 2. BIOFOULING AND BIOCOMPATIBILITY 55
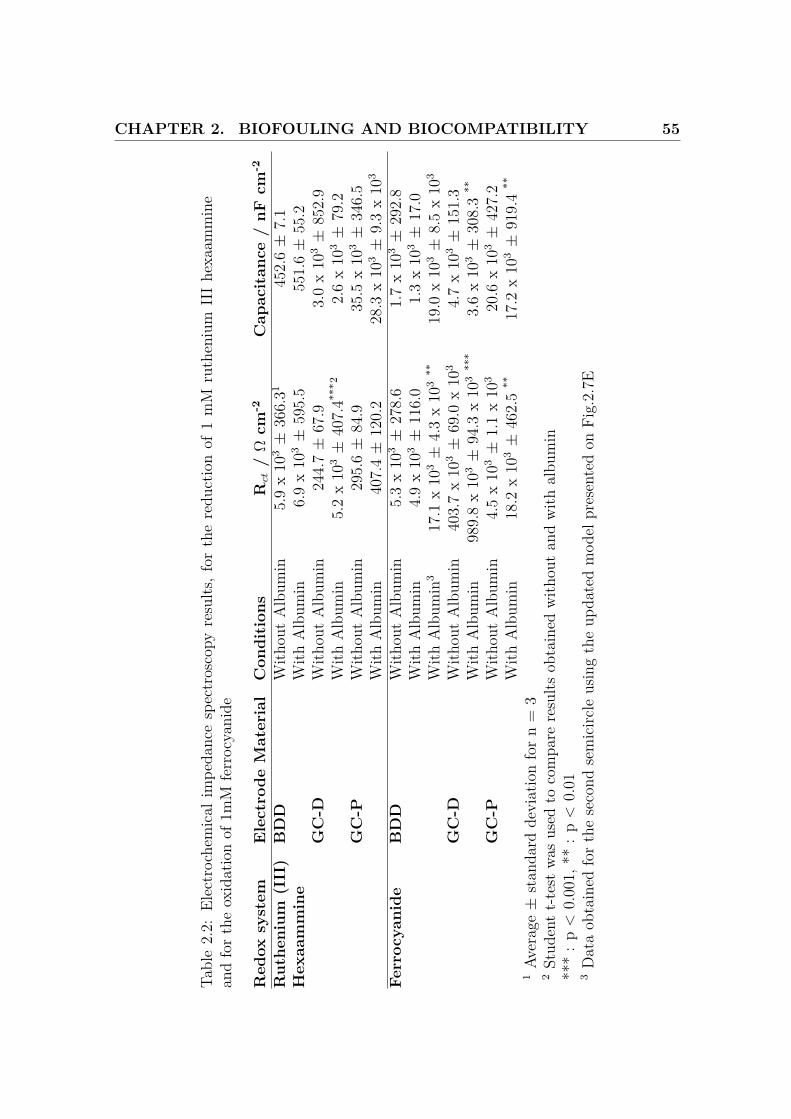
Tabl
e2.
2:El
ectr
oche
mic
alim
peda
nce
spec
tros
copy
resu
lts,f
orth
ere
duct
ion
of1
mM
ruth
eniu
mII
Ihe
xaam
min
ean
dfo
rth
eox
idat
ion
of1m
Mfe
rroc
yani
de
Red
oxsy
stem
Ele
ctro
deM
ater
ial
Con
diti
ons
Rct
/Ω
cm-2
Cap
acit
ance
/nF
cm-2
Rut
heni
um(I
II)
BD
DW
ithou
tA
lbum
in5.
9x
103±
366.
3145
2.6±
7.1
Hex
aam
min
eW
ithA
lbum
in6.
9x
103±
595.
555
1.6±
55.2
GC
-DW
ithou
tA
lbum
in24
4.7±
67.9
3.0
x10
3±
852.
9W
ithA
lbum
in5.
2x
103±
407.
4***2
2.6
x10
3±
79.2
GC
-PW
ithou
tA
lbum
in29
5.6±
84.9
35.5
x10
3±
346.
5W
ithA
lbum
in40
7.4±
120.
228
.3x
103±
9.3
x10
3
Ferr
ocya
nide
BD
DW
ithou
tA
lbum
in5.
3x
103±
278.
61.
7x
103±
292.
8W
ithA
lbum
in4.
9x
103±
116.
01.
3x
103±
17.0
With
Alb
umin
317
.1x
103±
4.3
x10
3**
19.0
x10
3±
8.5
x10
3
GC
-DW
ithou
tA
lbum
in40
3.7
x10
3±
69.0
x10
34.
7x
103±
151.
3W
ithA
lbum
in98
9.8
x10
3±
94.3
x10
3**
*3.
6x
103±
308.
3**
GC
-PW
ithou
tA
lbum
in4.
5x
103±
1.1
x10
320
.6x
103±
427.
2W
ithA
lbum
in18
.2x
103±
462.
5**
17.2
x10
3±
919.
4**
1Av
erag
e±
stan
dard
devi
atio
nfo
rn
=3
2St
uden
tt-
test
was
used
toco
mpa
rere
sults
obta
ined
with
out
and
with
albu
min
***
:p
<0.
001,
**:
p<
0.01
3D
ata
obta
ined
for
the
seco
ndse
mic
ircle
usin
gth
eup
date
dm
odel
pres
ente
don
Fig.
2.7E
CHAPTER 2. BIOFOULING AND BIOCOMPATIBILITY 56
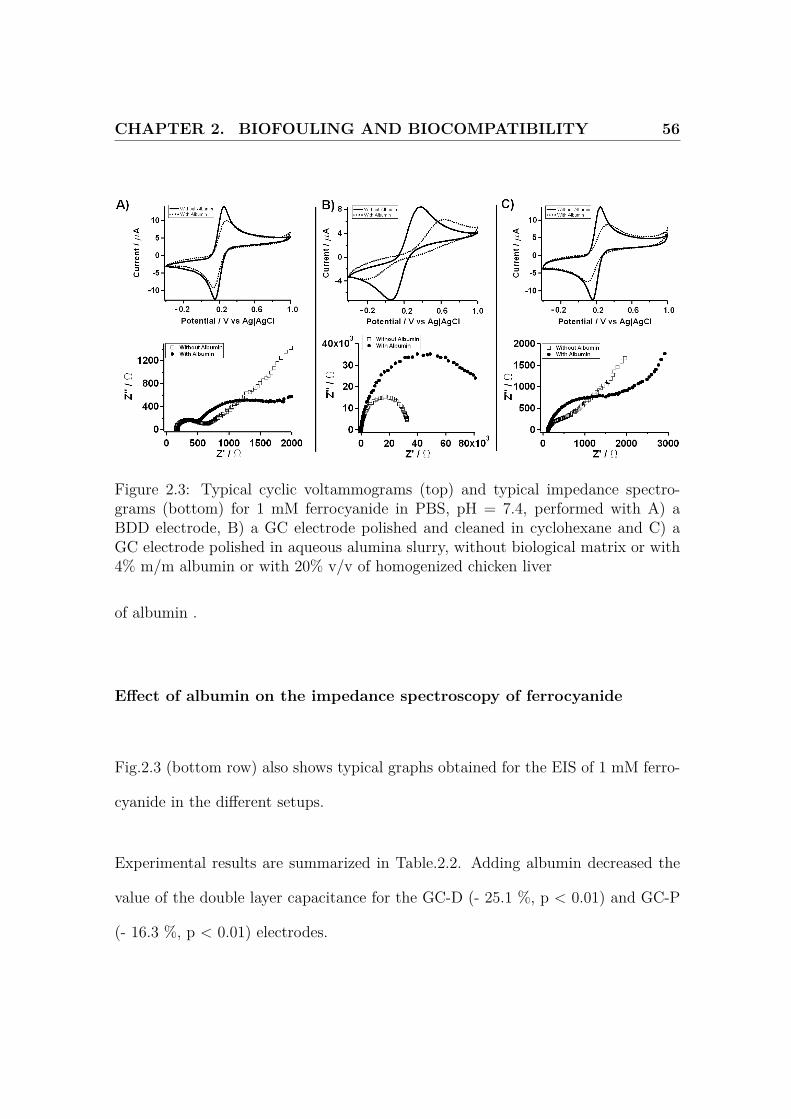
Figure 2.3: Typical cyclic voltammograms (top) and typical impedance spectro-grams (bottom) for 1 mM ferrocyanide in PBS, pH = 7.4, performed with A) aBDD electrode, B) a GC electrode polished and cleaned in cyclohexane and C) aGC electrode polished in aqueous alumina slurry, without biological matrix or with4% m/m albumin or with 20% v/v of homogenized chicken liver
of albumin .
Effect of albumin on the impedance spectroscopy of ferrocyanide
Fig.2.3 (bottom row) also shows typical graphs obtained for the EIS of 1 mM ferro-
cyanide in the different setups.
Experimental results are summarized in Table.2.2. Adding albumin decreased the
value of the double layer capacitance for the GC-D (- 25.1 %, p < 0.01) and GC-P
(- 16.3 %, p < 0.01) electrodes.
CHAPTER 2. BIOFOULING AND BIOCOMPATIBILITY 57
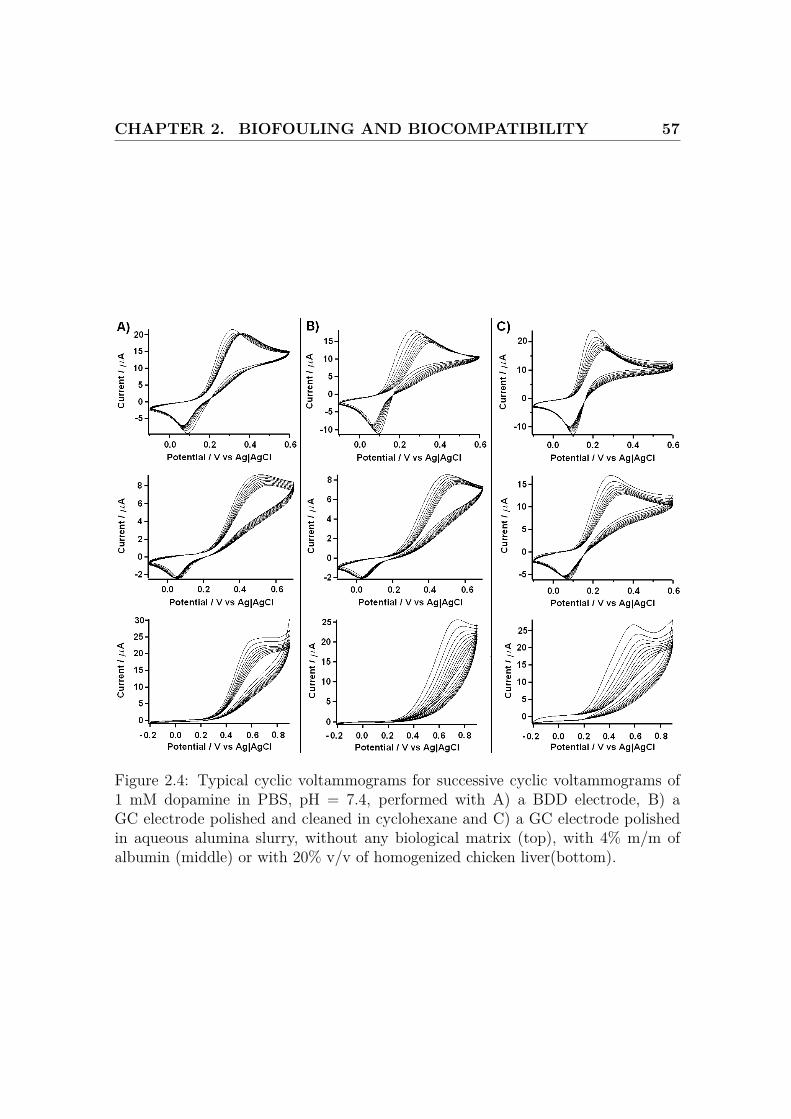
Figure 2.4: Typical cyclic voltammograms for successive cyclic voltammograms of1 mM dopamine in PBS, pH = 7.4, performed with A) a BDD electrode, B) aGC electrode polished and cleaned in cyclohexane and C) a GC electrode polishedin aqueous alumina slurry, without any biological matrix (top), with 4% m/m ofalbumin (middle) or with 20% v/v of homogenized chicken liver(bottom).
CHAPTER 2. BIOFOULING AND BIOCOMPATIBILITY 58
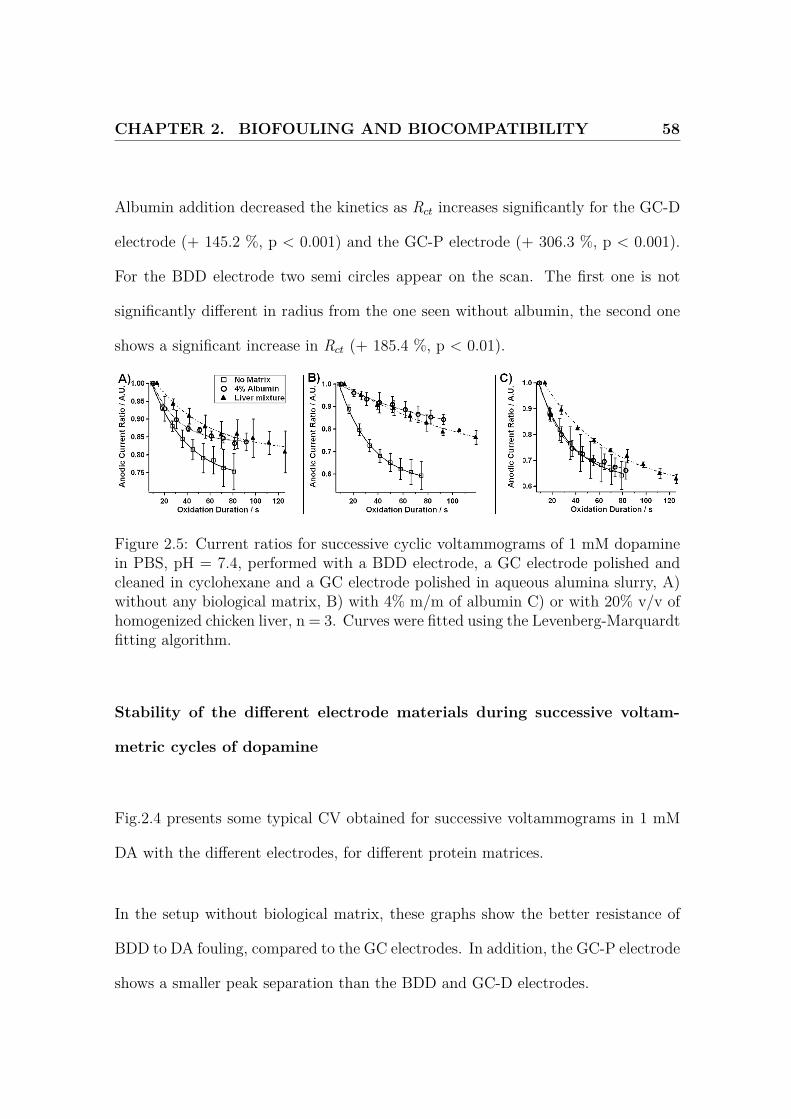
Albumin addition decreased the kinetics as Rct increases significantly for the GC-D
electrode (+ 145.2 %, p < 0.001) and the GC-P electrode (+ 306.3 %, p < 0.001).
For the BDD electrode two semi circles appear on the scan. The first one is not
significantly different in radius from the one seen without albumin, the second one
shows a significant increase in Rct (+ 185.4 %, p < 0.01).
Figure 2.5: Current ratios for successive cyclic voltammograms of 1 mM dopaminein PBS, pH = 7.4, performed with a BDD electrode, a GC electrode polished andcleaned in cyclohexane and a GC electrode polished in aqueous alumina slurry, A)without any biological matrix, B) with 4% m/m of albumin C) or with 20% v/v ofhomogenized chicken liver, n = 3. Curves were fitted using the Levenberg-Marquardtfitting algorithm.
Stability of the different electrode materials during successive voltam-
metric cycles of dopamine
Fig.2.4 presents some typical CV obtained for successive voltammograms in 1 mM
DA with the different electrodes, for different protein matrices.
In the setup without biological matrix, these graphs show the better resistance of
BDD to DA fouling, compared to the GC electrodes. In addition, the GC-P electrode
shows a smaller peak separation than the BDD and GC-D electrodes.
CHAPTER 2. BIOFOULING AND BIOCOMPATIBILITY 59
The results obtained for the second cycle of these DA CV are summarized in
Table.2.1. The peak separation for the GC-P is significantly different ( -100.7 mV,
p < 0.01) than the one obtained for the BDD.
The current ratio has been calculated for each cycle performed in 1 mM DA. The
results obtained are plotted on Fig.2.5. These results were fitted with an exponen-
tial function K0 + K1 exp(−t/K2), where t is the duration of dopamine oxidation,
therefore the time the electrode has been exposed to chemical fouling, and these
values are reported in Fig.2.3. These results show that the oxidation current ob-
tained for the BDD electrode is less affected (K0 = 0.73) by DA fouling than GC-P
(K0 = 0.62) and GC-D (K0 = 0.55). GC-D and GC-P foul more quickly than BDD
as their K2 are smaller.
Effect of biological matrices on successive voltammetric cycles of dopamine
The same parameters were determined in presence of biological backgrounds. In
particular, Fig.2.4 shows decreases in kinetics, as indicated by higher peak separation
and higher peak width, changes in measured currents and no reverse peak in the
case of homogenized liver matrix.
In the presence of albumin, oxidative current decreases by 53.4 % (p < 0.001) and
48.6 % (p < 0.001) for BDD and GC-D respectively. No significant change are
obserevd in the case of GC-P. Furthermore, the peak separation increases by 262.3
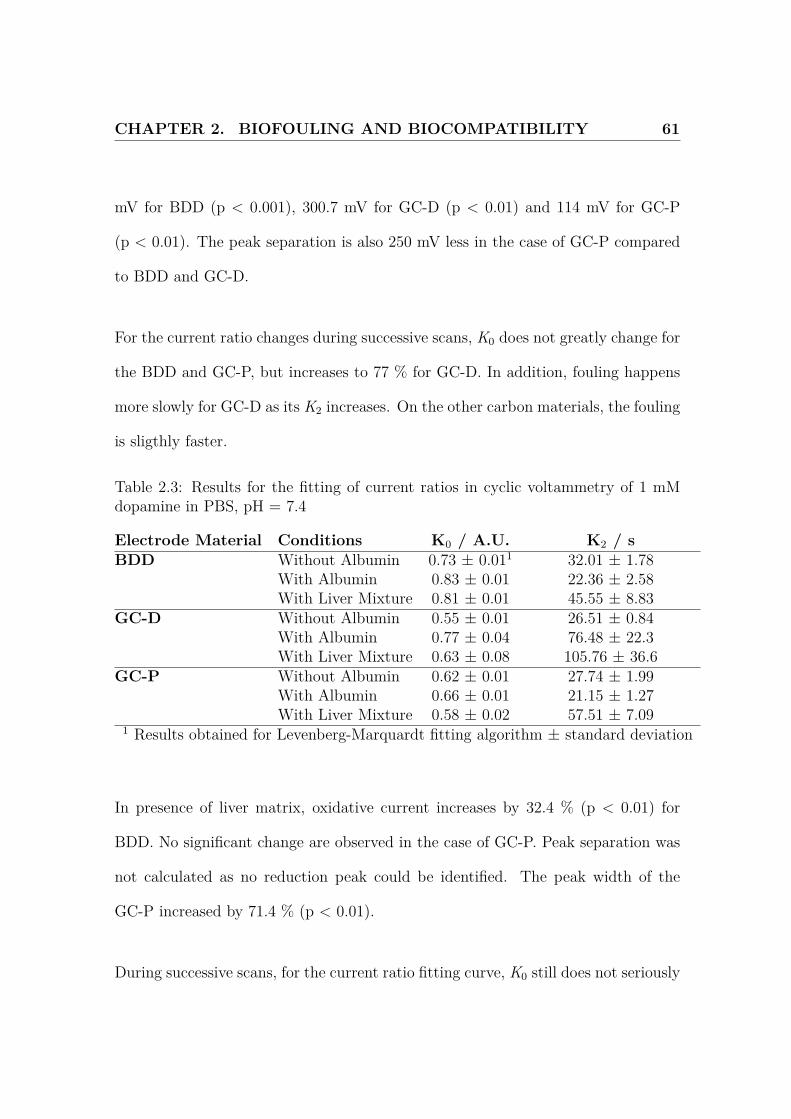
CHAPTER 2. BIOFOULING AND BIOCOMPATIBILITY 60
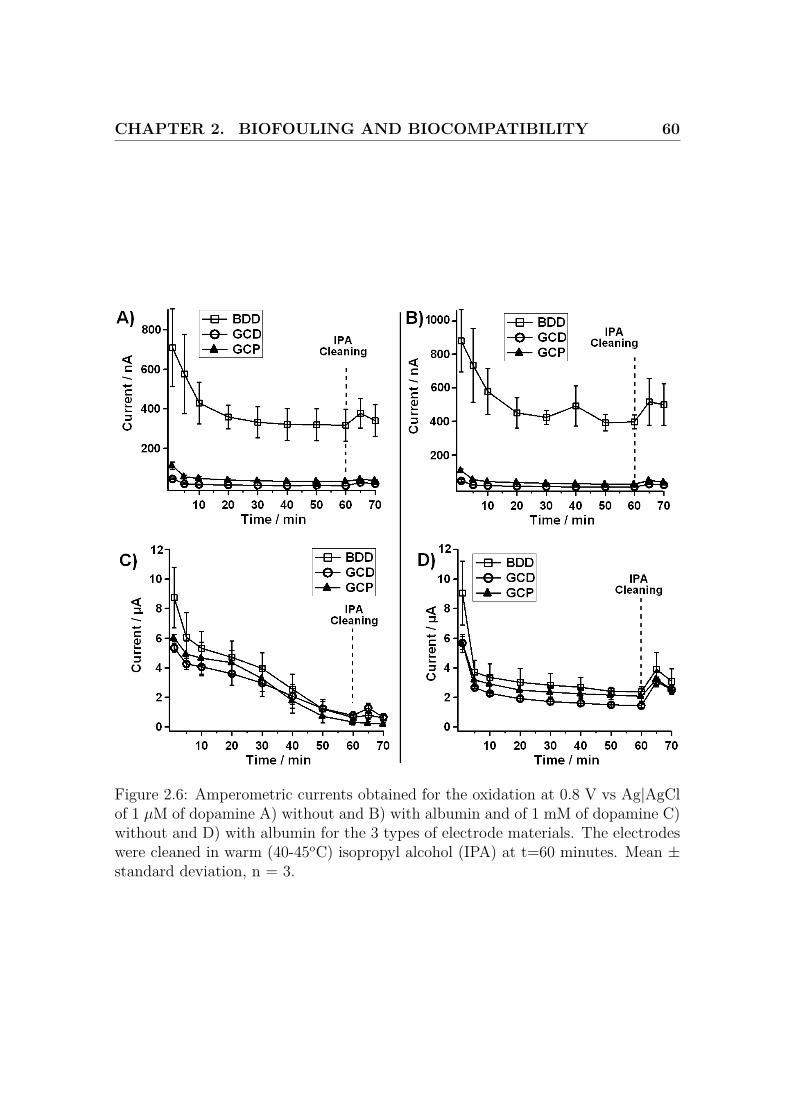
Figure 2.6: Amperometric currents obtained for the oxidation at 0.8 V vs Ag|AgClof 1 µM of dopamine A) without and B) with albumin and of 1 mM of dopamine C)without and D) with albumin for the 3 types of electrode materials. The electrodeswere cleaned in warm (40-45oC) isopropyl alcohol (IPA) at t=60 minutes. Mean ±standard deviation, n = 3.
CHAPTER 2. BIOFOULING AND BIOCOMPATIBILITY 61
mV for BDD (p < 0.001), 300.7 mV for GC-D (p < 0.01) and 114 mV for GC-P
(p < 0.01). The peak separation is also 250 mV less in the case of GC-P compared
to BDD and GC-D.
For the current ratio changes during successive scans, K0 does not greatly change for
the BDD and GC-P, but increases to 77 % for GC-D. In addition, fouling happens
more slowly for GC-D as its K2 increases. On the other carbon materials, the fouling
is sligthly faster.
Table 2.3: Results for the fitting of current ratios in cyclic voltammetry of 1 mMdopamine in PBS, pH = 7.4
Electrode Material Conditions K0 / A.U. K2 / sBDD Without Albumin 0.73 ± 0.011 32.01 ± 1.78
With Albumin 0.83 ± 0.01 22.36 ± 2.58With Liver Mixture 0.81 ± 0.01 45.55 ± 8.83
GC-D Without Albumin 0.55 ± 0.01 26.51 ± 0.84With Albumin 0.77 ± 0.04 76.48 ± 22.3With Liver Mixture 0.63 ± 0.08 105.76 ± 36.6
GC-P Without Albumin 0.62 ± 0.01 27.74 ± 1.99With Albumin 0.66 ± 0.01 21.15 ± 1.27With Liver Mixture 0.58 ± 0.02 57.51 ± 7.09
1 Results obtained for Levenberg-Marquardt fitting algorithm ± standard deviation
In presence of liver matrix, oxidative current increases by 32.4 % (p < 0.01) for
BDD. No significant change are observed in the case of GC-P. Peak separation was
not calculated as no reduction peak could be identified. The peak width of the
GC-P increased by 71.4 % (p < 0.01).
During successive scans, for the current ratio fitting curve, K0 still does not seriously
CHAPTER 2. BIOFOULING AND BIOCOMPATIBILITY 62
change for the GC-P, but it increases to 63 % for GC-D and to 81 % for the BDD. In
addition, the fouling rate does not seriously vary for BDD in the different matrices,
but K2 increases, indicating slower fouling, for GC-P and GC-D.
Long term stability of boron doped diamond and glassy carbon electrodes
during dopamine oxidation
The same electrodes have then been exposed to 1 µM DA in the absence or presence
of 4 % albumin and continuous oxidation was performed at 0.8 V vs Ag|AgCl. The
purpose of this experiment is to simulate the in vivo or ex vivo use of the electrodes
for real time monitoring of DA levels. As shown on Fig.2.6A) and Fig.2.6B), the
current obtained for BDD after 60 minutes, in both cases (317.4 ± 81.1 nA in
absence of albumin and 397.7±41.5 nA in presence of albumin), is at least one order
of magnitude higher than the ones obtained for GC-D (10.3 ± 0.6 nA in absence
of albumin and 8.4±0.3 nA in presence of albumin) and GC-P (32.7 ± 4.4 nA in
absence of albumin and 26.0±1.4 nA in presence of albumin). Furthermore, IPA
cleaning led to a better current recovery in the presence of albumin and in particular
the case of BDD (59.8 nA in the absence of albumin and 120 nA in the presence of
albumin).
If the same experiment is repeated with 1 mM DA, the response in the absence
of albumin is completely different as the current continuously decreases for all the
electrodes. However, if albumin is present, the oxidation current stabilized around
CHAPTER 2. BIOFOULING AND BIOCOMPATIBILITY 63
3 µA for all the electrode materials after 20 minutes.
2.1.4 Discussion
Significance of the biological matrices and interferences
Background scans in albumin solutions without reactive species, with the same pa-
rameters as for the DA data set we run. The results for the BDD (Fig.2.7) show
that albumin can be oxidised on this surface, as previously reported by Einaga et al.
[76, 77], but this does not appear on the EIS scan when compared to simple PBS.
On the CV data, the effect of albumin can be seen mainly on the first cycle, and
is almost completely abolished on the second one. For this reason, we have decided
not to use the first scan in all our experiments, to avoid electrochemical interference
with albumin. This phenomenon was not be observed on the GC electrodes.
Furthermore, interactions and EC’ reactions between both ferricyanide and oxi-
dised DA and thiol moieties in albumin and thiols generally have been reported
[36, 37, 38, 39]. Effect of other reducing agents, like ascorbic acid [78] have also
been published. This is expected to enhance the anodic current in our experiments
as the product is consumed by thiol moieties, thus regenerating the reaction sub-
strate. Indeed, this is supported by our data, as we can see in particular in the DA
results (Fig.2.4), that the ratio (anodic current / cathodic current) increases as we
CHAPTER 2. BIOFOULING AND BIOCOMPATIBILITY 64
add albumin, and the reduction peak even disappears in presence of the liver mix-
ture, the oxidised species being completely consumed by the high concentration of
thiol contained in biomolecules like albumin, cysteine. The very high anodic current
in this case (20 % higher than the control setup) is more evidence of this secondary
process. This effect may also explain the protective effect of albumin when conti-
nous oxidation is performed for a high and non-physiological concentration of DA
(Fig.2.6C and Fig.2.6D). Furthermore, competition between DA and protein fouling
are also another possible explanation. Indeed, IPA cleaning was usually noticed to
be more efficient in presence of albumin. This was expected to be due to the IPA
denaturating the adsorbed proteins, but not the film generated by DA oxidation.
Glassy carbon cleaned in cyclohexane
Sonicating GC electrodes in cyclohexane purified over activated carbon has been
reported to decrease the oxygen to carbon atomic ratio (O/C) at the esurface of the
substrate [75]. This was understood to be an evidence that the solvent is removing
some oxygen containing organic molecules physisorbed on the surface. Furthermore,
cleaning the electrode with the polar cyclohexane, once cleaned over activated car-
bon, is expected to improve the reaction rates for most of the redox couples by
removing spectator molecules physisorbed on the surface.
For the ruthenium III hexaammine reduction, no major difference were observed
in the general shape of the CV results, in any biological matrix. The main change
CHAPTER 2. BIOFOULING AND BIOCOMPATIBILITY 65
was the redox current magnitudes, in particular in the presence of the liver mixture.
In the case of this outer-sphere redox species, this is expected to be mainly due
to the lower diffusivity of the buffer [71] and to the presence of colloids (red blood
cells, cell debris) in the liver mixture hindering the diffusion pattern. Presence of
macromolecules is expected to have 2 effects on diffusion: it decreases the diffusion
coefficient because of i) increased viscosity according to the Stokes-Einstein equation
D = kT6πηr
, where k is the Boltzmann constant, T is the temperature in K, η is
the viscosity and r is the radius of the molecule and of ii) excluded volume as
shown by the Mackie-Meares model [79] DD0
=(
1−φ1+φ
)2, where d is the apparent
diffusion coefficient, D0 is the diffusion coefficient in the free buffer and φ is the
excluded volume fraction. Furthermore, the peak width is still close to 59 mV
in all the experiments, as predicted by the reversible reaction theory, for a single
electron exchange [1]. This shows that there is no change in the reaction process
after addition of the biomolecules. However, there is a significant increase in the
peak separation in presence of albumin. Similarly, the EIS analysis shows dramatic
changes as the impedance patterns indicate different reaction dependences, a semi-
circle appearing at high frequencies in the presence of albumin, the reaction being
mainly diffusion controlled in the control setup. This results in the serious increase
in charge transfer resistance observed. These data, together with the current results,
indicate a severe albumin and protein adsorption on the GC-D surface.
In the case of ferrocyanide oxidation, the results obtained for the GC-D are com-
pletely different from the ones obtained with the other electrodes. Peak separa-
CHAPTER 2. BIOFOULING AND BIOCOMPATIBILITY 66
tion is higher and the measured current amplitudes are smaller compared to the
BDD and the oxidised GC. These observations confirm some recent reports that the
Fe(CN)63-/4- couple is surface sensitive [73]. The pH effects reported by Deakin et
al. are unlikely to be important here at near neutral pH [80]. However, Kawiak has
reported the formation of poorly soluble products during ferrocyanide oxidation [81]
at the concentrations used here and it is possible that this leads to partial blocking
of the electrode surface. This is consistent with the very low capacitance of the
GC-D (compared to GC-P) in the ferrocyanide solution indicating displacement of
the counter-ions. Furthermore, the CV results changed completely after addition
of albumin to the sample, as the peak current and the peak width increased, and
the current magnitudes decreased. Similarly, Rct increases sharply. This is consis-
tent with albumin interfering with the reaction process, probably because of surface
insulation and adsorption as this system is surface sensitive, thus increasing peak
separation, indicating slower reaction kinetics, and decreasing current magnitude.
This is supported by the capacitance decreasing in the presence of albumin, indi-
cating partial inactivation of the surface.
For the DA oxidation, GC-D shows again rather poor kinetics compared to GC-P,
as reported previously, maybe because of easier adsorption of DA on surface oxides
[75, 82]. In the presence of albumin, the peak separation increases again, and the
oxidation current falls, despite the enhanced oxidation due to albumin. The data for
the liver experiments cannot be used here because of the disappearance of the re-
duction peak and to the higher current due to thiol secondary reaction with oxidised
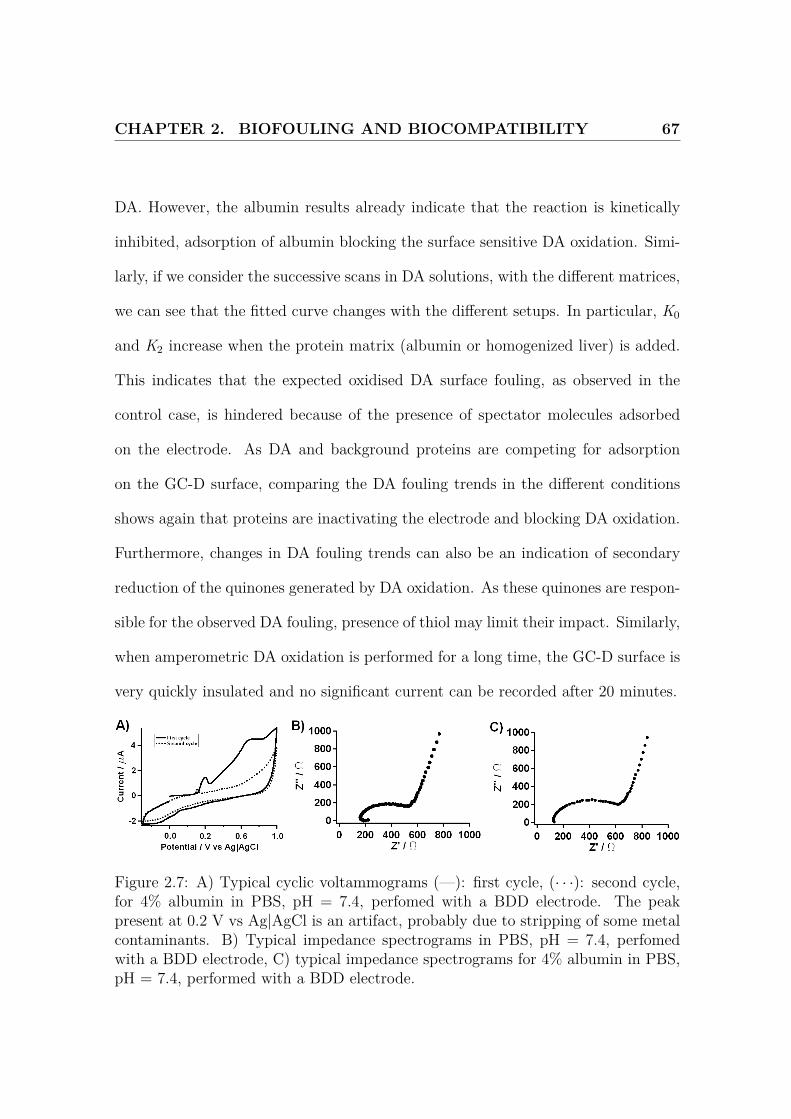
CHAPTER 2. BIOFOULING AND BIOCOMPATIBILITY 67
DA. However, the albumin results already indicate that the reaction is kinetically
inhibited, adsorption of albumin blocking the surface sensitive DA oxidation. Simi-
larly, if we consider the successive scans in DA solutions, with the different matrices,
we can see that the fitted curve changes with the different setups. In particular, K0
and K2 increase when the protein matrix (albumin or homogenized liver) is added.
This indicates that the expected oxidised DA surface fouling, as observed in the
control case, is hindered because of the presence of spectator molecules adsorbed
on the electrode. As DA and background proteins are competing for adsorption
on the GC-D surface, comparing the DA fouling trends in the different conditions
shows again that proteins are inactivating the electrode and blocking DA oxidation.
Furthermore, changes in DA fouling trends can also be an indication of secondary
reduction of the quinones generated by DA oxidation. As these quinones are respon-
sible for the observed DA fouling, presence of thiol may limit their impact. Similarly,
when amperometric DA oxidation is performed for a long time, the GC-D surface is
very quickly insulated and no significant current can be recorded after 20 minutes.
Figure 2.7: A) Typical cyclic voltammograms (—): first cycle, (· · ·): second cycle,for 4% albumin in PBS, pH = 7.4, perfomed with a BDD electrode. The peakpresent at 0.2 V vs Ag|AgCl is an artifact, probably due to stripping of some metalcontaminants. B) Typical impedance spectrograms in PBS, pH = 7.4, perfomedwith a BDD electrode, C) typical impedance spectrograms for 4% albumin in PBS,pH = 7.4, performed with a BDD electrode.
CHAPTER 2. BIOFOULING AND BIOCOMPATIBILITY 68
These results indicate that GC-D is highly vulnerable to protein and catecholamine
fouling, thus jeopardizing its biological stability. One of the main issues is expected
to be the blocking of adsorption sites (such as fractures [82]) by inactive species,
leading to a dramatic loss of electroactivity. This phenomenon has been postulated
to hinder other electrocatalytic reactions, in particular oxygen reduction on gold
defect catalytic sites in presence of albumin [33]. Furthermore, GC-D exhibits poor
reaction kinetics for several important redox systems compared to other carbon
electrodes and should therefore be avoided for reliable biomeasurements. This result
is different from the the ones reported by Ranganathan et al., as purified cyclohexane
is expected to improve the reaction rates by cleaning the electrode and increasing
its surface area. This was understood to be an evidence that the polishing step
induced some pollution and partial inactivation of the surface. However, improved
results were obtained if cyclohexane is replaced with water for the polishing, thus
indicating that adsorption of oxygen containing groups (with are absent in the case
of cyclohexane polishing) enhance the electrocatalytic activity of the substrate.
Polished glassy carbon
As for GC-D, the shape of the CV scans remains pretty much unchanged as biomolecules
are added to the buffer. The only noticeable variation is the decrease in current mag-
nitude, probably due to higher viscosity leading to a smaller diffusion layer. The
peak current being given by ip = 2.69× 10⁵ n3/2ACD1/2ν1/2, and using the Stokes-
CHAPTER 2. BIOFOULING AND BIOCOMPATIBILITY 69
Einstein relation, we can calculate a corresponding increase of 41.7 % in viscosity.
The peak separation and the peak width are in the 60-75 mV range and are therefore
consistent with the reversible reaction theory [1]. Furthermore, the EIS data shows
that the ruthenium III/II hexaammine redox reaction is diffusion controlled, even
after addition of albumin. This may indicate a less dramatic fouling than for the
GC-D surface.
In the case of ferrocyanide, in the control setup, GC-P leads to a well-defined CV
scan, with sharp peaks. The peak width is consistent with reversible redox reaction.
Addition of 4% albumin leads to increased peak separation and width, as well as
lower current magnitudes. This supports the possibility of the formation of an
albumin layer blocking the surface and inducing poor reaction kinetics, as indicated
by the increase in charge-transfer resistance [72] and the decrease in capacitance.
Protein adsorption decreases current magnitude because of diffusion hinderance,
excluded volume and poor kinetics, but the fall in capacitance arises solely from the
reduced surface area of the electrode.
Finally, in the case of DA oxidation, GC-P shows very good kinetics, with a low peak
separation. Peak separation increases in the presence of albumin, but this surface is
still the best of the three situations tested. The oxidative current does not decrease
significantly in the presence of albumin, but this may be an artefact due to an EC’
reaction with albumin, enhancing what could be a limited over-current due to better
kinetics. However, if we look at the successive CV, we see that GC-P shows a very
CHAPTER 2. BIOFOULING AND BIOCOMPATIBILITY 70
poor stability in these samples, as the low K0 indicates that the current is expected
to fall by 40% after a sufficient number of cycles. However, the general shape of the
curve does not change significantly, indicating that albumin does not interfere too
severely with DA fouling.
Poor stability during DA oxidation is supported by the long term experiments, as
the surface is quickly completely insulated.
GC-P is rather stable in biological samples, probably because of the surface ox-
ides improving reaction kinetics and reducing the impact of adsorption on catalytic
sites. However, this electrode is rather sensitive to DA fouling. This is an impor-
tant conclusion showing that adsorption of spectator species (albumin, chicken liver
compounds) is qualitatively different from the chemical fouling observed during DA
oxidation, when polymer/ oligomer formation is involved
Boron doped diamond
Again, the ruthenium III hexaammine results show the limited impact of proteins
on the electrochemical measurements, apart from the magnitude of the redox cur-
rent, probably because of diffusion hindrance, as accounted by higher viscosity and
excluded volume. More importantly, no significant changes could be identified in
the EIS results, for kinetics and capacitance. The capacitance is very low, as ex-
pected for BDD, and is not altered by protein adsorption, indicating that the surface
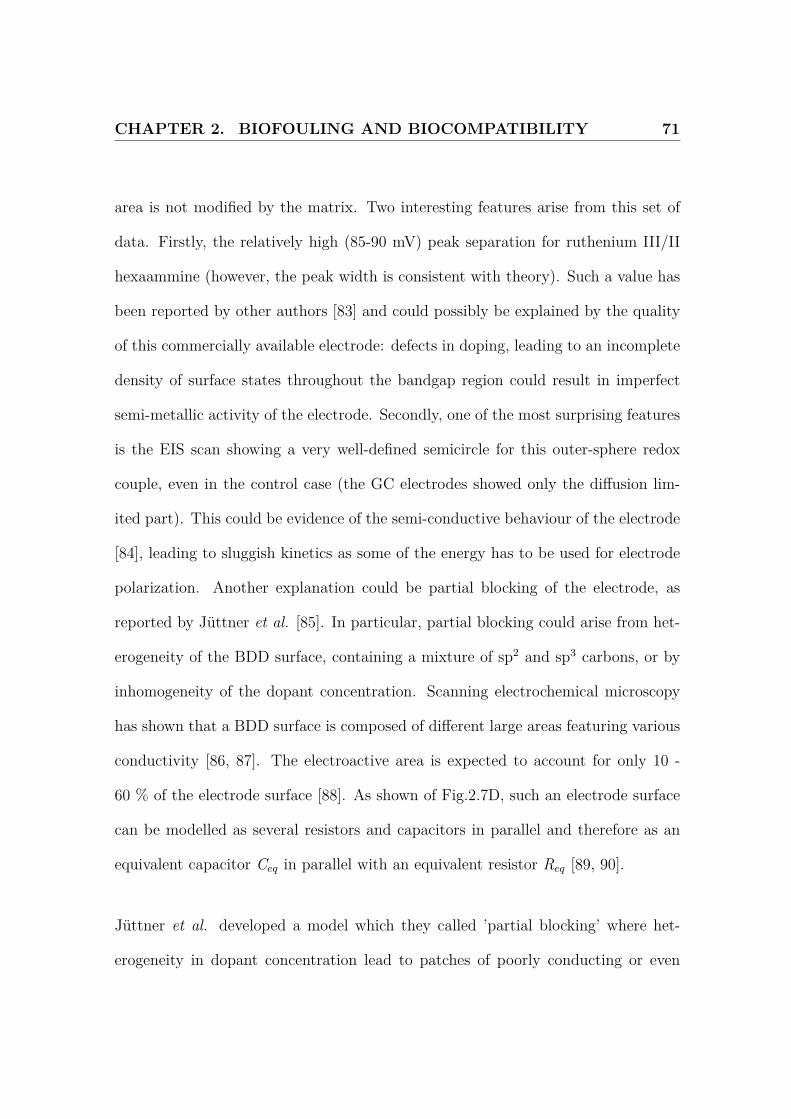
CHAPTER 2. BIOFOULING AND BIOCOMPATIBILITY 71
area is not modified by the matrix. Two interesting features arise from this set of
data. Firstly, the relatively high (85-90 mV) peak separation for ruthenium III/II
hexaammine (however, the peak width is consistent with theory). Such a value has
been reported by other authors [83] and could possibly be explained by the quality
of this commercially available electrode: defects in doping, leading to an incomplete
density of surface states throughout the bandgap region could result in imperfect
semi-metallic activity of the electrode. Secondly, one of the most surprising features
is the EIS scan showing a very well-defined semicircle for this outer-sphere redox
couple, even in the control case (the GC electrodes showed only the diffusion lim-
ited part). This could be evidence of the semi-conductive behaviour of the electrode
[84], leading to sluggish kinetics as some of the energy has to be used for electrode
polarization. Another explanation could be partial blocking of the electrode, as
reported by Jüttner et al. [85]. In particular, partial blocking could arise from het-
erogeneity of the BDD surface, containing a mixture of sp2 and sp3 carbons, or by
inhomogeneity of the dopant concentration. Scanning electrochemical microscopy
has shown that a BDD surface is composed of different large areas featuring various
conductivity [86, 87]. The electroactive area is expected to account for only 10 -
60 % of the electrode surface [88]. As shown of Fig.2.7D, such an electrode surface
can be modelled as several resistors and capacitors in parallel and therefore as an
equivalent capacitor Ceq in parallel with an equivalent resistor Req [89, 90].
Jüttner et al. developed a model which they called ’partial blocking’ where het-
erogeneity in dopant concentration lead to patches of poorly conducting or even
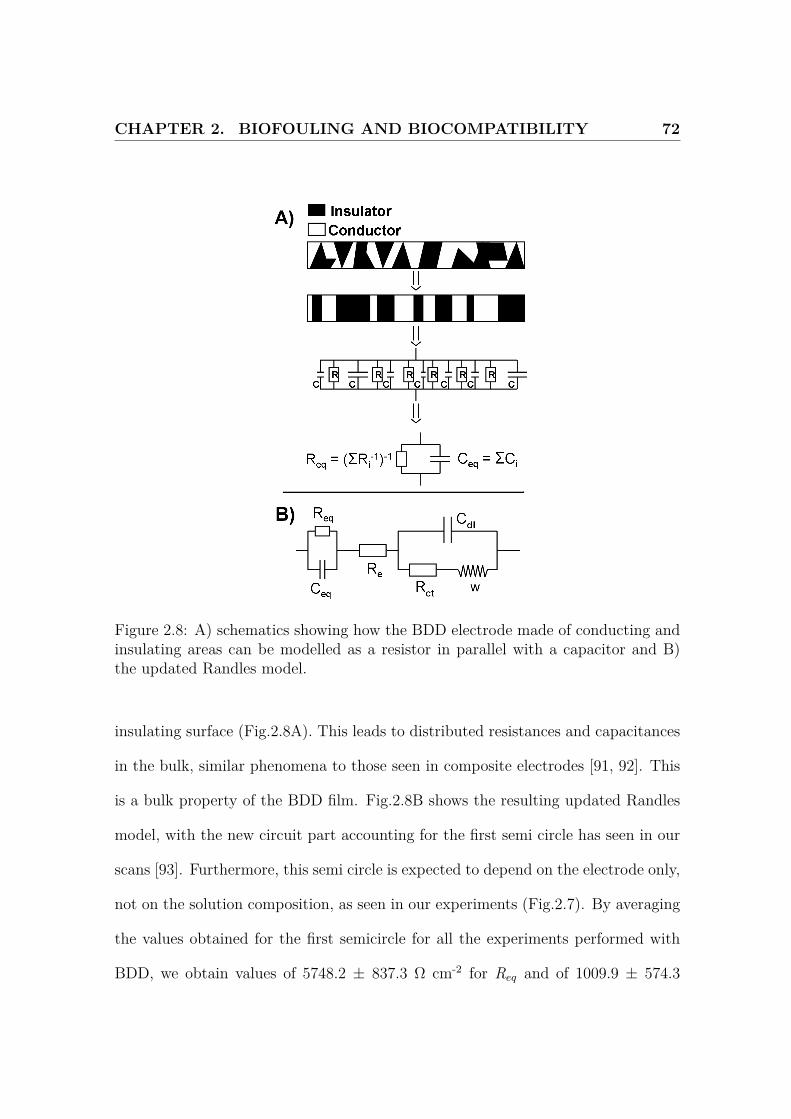
CHAPTER 2. BIOFOULING AND BIOCOMPATIBILITY 72
Figure 2.8: A) schematics showing how the BDD electrode made of conducting andinsulating areas can be modelled as a resistor in parallel with a capacitor and B)the updated Randles model.
insulating surface (Fig.2.8A). This leads to distributed resistances and capacitances
in the bulk, similar phenomena to those seen in composite electrodes [91, 92]. This
is a bulk property of the BDD film. Fig.2.8B shows the resulting updated Randles
model, with the new circuit part accounting for the first semi circle has seen in our
scans [93]. Furthermore, this semi circle is expected to depend on the electrode only,
not on the solution composition, as seen in our experiments (Fig.2.7). By averaging
the values obtained for the first semicircle for all the experiments performed with
BDD, we obtain values of 5748.2 ± 837.3 Ω cm-2 for Req and of 1009.9 ± 574.3
CHAPTER 2. BIOFOULING AND BIOCOMPATIBILITY 73
nF cm-2 for Ceq, which is consistent with values obtained by others for BDD [90].
This surface non-uniformity could also explain the limited effect of fouling on BDD,
proteins inactivating some specific sites, probably the less doped or less conducting
areas, but not the more active ones.
Similarly, no serious change is induced by the addition of albumin in presence of
ferrocyanide, apart again from the current drop. However, the EIS shows higher Rct,
and therefore decreased k0, which could be explained by blocking electrocatalytic
defect sites, where ferrocyanide oxidation is favoured, thus reducing reaction rates.
This phenomenon may also be an artefact due to the presence of albumin, oxidised on
the BDD electrode and therefore distorting the signal or reacting with ferricyanide
and thus inhibiting the reverse reduction.
Finally, BDD is the most resistant material to DA fouling, with a K0 close to 0.80.
BDD shows the same kind of behaviour as the other electrodes for DA oxidation
when albumin is added, with an increase in peak separation which may arise from
secondary reaction with albumin. However, the kinetics of DA fouling remains
quite unchanged during the successive CV cycles, thus showing that albumin does
not seriously alter the reactants/electrode interactions.
Similarly, the long term amperometric experiments in presence of 1 µM DA show
the excellent resistance of BDD to biological conditions compared to the other elec-
trodes. However, as shown on Fig.2.6, significantly higher current variations are
noticed for this electrode than for the others. The first explanation is that the other
CHAPTER 2. BIOFOULING AND BIOCOMPATIBILITY 74
materials are quickly completely insulated, thus leading to an almost null current,
therefore limiting the scope for variations. Furthermore, we have noticed the pres-
ence of several spikes of the i(t) graphs obtained for BDD, in presence and absence
of albumin. These spikes were understood to be evidence of formation of a poly-
meric quinone film, due to DA oxidation, loosely attached to the surface because of
poor adsorption onto the BDD interface. Vibrations or matrix convection may then
cause this polymer to fall and therefore induce spike because of sudden increase in
the electrode surface. This is not seen for the GC electrodes as this quinone film is
here strongly adsorbed to the electrode interface.
These results show that BDD is very stable in biosamples, even for complex reaction
mechanisms, even though it can show slightly more sluggish kinetics compared to
other materials. However, resistance to biofouling is expected to change with the
BDD sample used, because of the critical dependence of this material on the surface
uniformity and doping quality.
2.1.5 Conclusion
Different reaction processes have been compared in the absence or the presence of
biological matrices for various carbon electrodes. The very good performance of the
BDD surface has been demonstrated, even for surface sensitive reactions in complex
biological matrices. However, it appeared that BDD may be hard to characterize
CHAPTER 2. BIOFOULING AND BIOCOMPATIBILITY 75
and lead to slower kinetics. Furthermore, BDD is more expensive and less available
than GC. In this case, a GC-P surface could be used, at the expense of poorer
biological stability, especially in the presence of catechols. Finally, sp2 carbon offers
improved miniaturization, as 5 µm fibres are commonly used. For biological use
BDD has to be deposited on a metal substrate, such as a tungsten or a platinum
wire [94]. This limits its diameter and decreases its mechanical strength, as the
BDD substrate can break very easily.
2.2 Membrane coatings for biomeasurements
2.2.1 Introduction
In this study, we focus on the effects of 5 different membranes, all of which have
been investigated for biological use, on protein adsorption: Nafion [95], cellulose
acetate [96], chitosan [97], fibronectin and poly(styrene-sulphonate)/ poly(L-lysine)
(PSS/PL) [33, 34]. To investigate the effect of these layers, membrane coated gold
electrodes have been used to study the electrochemistry of an outer-sphere couple
(ruthenium III/II hexaammine) reduction and of the electrocatalytic reduction of
dissolved oxygen. Oxygen reduction has been reported to be dramatically dependent
on the surface quality of gold: high energy defect sites (out of lattice atoms) catalyse
the initial step of reduction of oxygen to hydrogen peroxide [98] and therefore oxygen
CHAPTER 2. BIOFOULING AND BIOCOMPATIBILITY 76
reduction kinetics are expected to be particularly sensitive to adsorption at these
high energy sites. To mimic biofouling, we have been using albumin solutions.
Albumin is frequently used for biofouling studies, and is a convenient surrogate for
more complex biological matrices [33, 34, 99]. Voltammetry was used to compare
the different membranes.
2.2.2 Experimental procedures, methods and chemicals
Solutions and chemicals
All the chemicals were purchased from Sigma, unless stated otherwise, and were
used without further purification. Deionized water purified with a Millipore system
was used throughout these experiments.
The ruthenium III/II hexaammine measurements were carried out in 1 M KCl with
1 mM ruthenium III hexaammine chloride.
Dissolved oxygen measurements were performed in gas saturated phosphate buffered
saline (PBS, pH = 7.4, NaCl: 0.138 M, KCl: 0.0027 M, phosphate: 0.01 M) to reach
a final dissolved oxygen concentration of 1.2 mM [100].
Nafion was used as supplied by Sigma (1:19 solution in ethanol).
CHAPTER 2. BIOFOULING AND BIOCOMPATIBILITY 77
The cellulose acetate solution was prepared by mixing 0.6 g cellulose acetate (Aver-
age Mw 50,000), 15.8 g acetone and 2.8 ml deionized water.
The chitosan films were prepared by mixing 1 g of chitosan with 1 ml of pure acetic
acid and 100 ml of deionized water. The mixture was stirred for a day, filtered and
degassed. Drops of this solution were deposited on an ethanol cleaned polymethyl
methacrylate sheets and dried at 40oC. The dried films were then dipped in 20 g.l-1
NaOH and stored in deionized water.
20 µg.ml-1 fibronectin solution was prepared by dissolving mouse fibronectin in Dul-
becco’s Modified Eagle’s Medium.
PSS/PL is prepared from a 25 mM solution of poly(sodium-4-styrene-sulphonate)
(PSS, molar mass: 206 g.mol-1, molecular weight ≈ 70,000) and a 25 mM solution
of poly(L-lysine-hydrobromide) (PL, molar mass: 146.188 g.mol-1, molecular weight
≈ 23,400) were prepared (the molar masses stated here refer to the monomers of
PSS and PL) and stored at 4oC whenever they were not in use.
Electrode preparation
5 mm gold electrodes were polished with 0.05 µ m grade alumina aqueous slurry
followed by ultrasonication in distilled water. The surface was then electrochemically
cleaned by potential cycling in 0.1 M H2SO4 between 1.7 V and -0.6 V at 1 V.s-1
CHAPTER 2. BIOFOULING AND BIOCOMPATIBILITY 78
until reproducible voltammograms were obtained followed by -0.6 V for 15 min to
reduce surface oxides. The electrode was then stored in water.
Membrane coating
Nafion and cellulose acetate were deposited using spin-coating: a 200 µl drop of
the relevant solution was deposited on the electrode which was immediately rotated
at 1000 RPM. For Nafion, solvent was then evaporated by placing the electrode at
200oC for 2 minutes. The electrode was then cleaned in PBS and stored in deionized
water.
The chitosan membrane was wrapped on the clean electrodes, making sure no gap or
air bubble is trapped between the gold surface and the chitosan film before securing
with a rubber ring and parafilm.
Gold was coated with fibronectin by depositing a 200 µl drop of the solution and
letting it dry at room temperature. Excess fibronectin was removed by cleaning the
electrode in PBS.
A PSS/PL mixture was prepared by mixing PSS and PL solutions in the ratio
1:2 v|v. 200 µl of this solution was deposited on the sensor and kept in a humid
environment. After 12 hours, the electrode was cleaned with PBS and stored in
water.
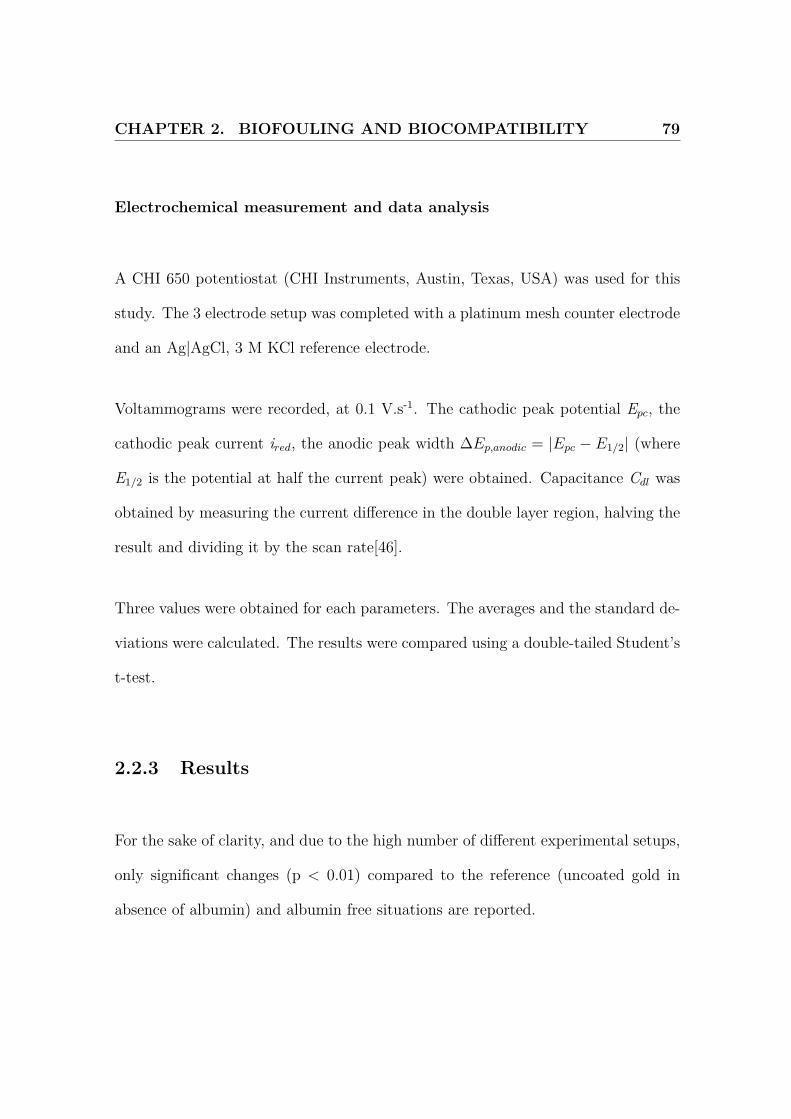
CHAPTER 2. BIOFOULING AND BIOCOMPATIBILITY 79
Electrochemical measurement and data analysis
A CHI 650 potentiostat (CHI Instruments, Austin, Texas, USA) was used for this
study. The 3 electrode setup was completed with a platinum mesh counter electrode
and an Ag|AgCl, 3 M KCl reference electrode.
Voltammograms were recorded, at 0.1 V.s-1. The cathodic peak potential Epc, the
cathodic peak current ired, the anodic peak width ∆Ep,anodic = |Epc − E1/2| (where
E1/2 is the potential at half the current peak) were obtained. Capacitance Cdl was
obtained by measuring the current difference in the double layer region, halving the
result and dividing it by the scan rate[46].
Three values were obtained for each parameters. The averages and the standard de-
viations were calculated. The results were compared using a double-tailed Student’s
t-test.
2.2.3 Results
For the sake of clarity, and due to the high number of different experimental setups,
only significant changes (p < 0.01) compared to the reference (uncoated gold in
absence of albumin) and albumin free situations are reported.
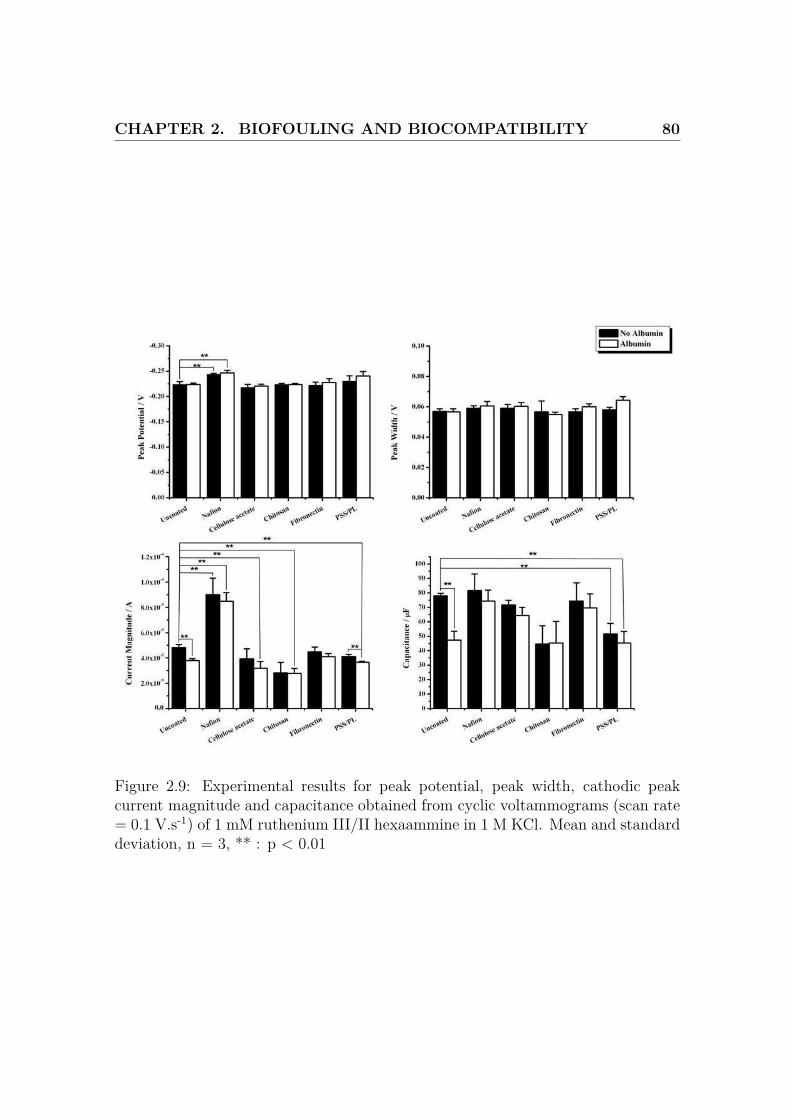
CHAPTER 2. BIOFOULING AND BIOCOMPATIBILITY 80
Figure 2.9: Experimental results for peak potential, peak width, cathodic peakcurrent magnitude and capacitance obtained from cyclic voltammograms (scan rate= 0.1 V.s-1) of 1 mM ruthenium III/II hexaammine in 1 M KCl. Mean and standarddeviation, n = 3, ** : p < 0.01
CHAPTER 2. BIOFOULING AND BIOCOMPATIBILITY 81
Cathodic peak potential
Fig.2.9 summarizes the results for ruthenium III hexaammine reduction.
Nafion coating leads to a negative shift in Epc, in absence and presence of albumin
(respectively -0.019 V and -0.023 V).
In Fig.2.10, we report the results for dissolved oxygen reduction. Adding albumin
for the uncoated electrode made Epc more negative by 0.099 V. Similarly, PSS/PL
shifted Epc by -0.12 V in absence of albumin and -0.10 V in presence of albumin.
Peak width
There was no significant change in peak width for ruthenium III hexaammine re-
duction (Fig.2.9), ∆Ep,anodic being close to 57 mV for all electrodes, the expected
theoretical value for reversible reduction. Fig.2.10 shows that in the case of dis-
solved oxygen reduction, adding albumin when an uncoated gold electrode is used
increases the peak width by 0.036 V. Again, coating gold with PSS/PL in absence
of albumin increases ∆Ep,anodic by 0.038 V.
CHAPTER 2. BIOFOULING AND BIOCOMPATIBILITY 82
Figure 2.10: Experimental results for peak potential, peak width, cathodic peakcurrent magnitude and capacitance obtained from cyclic voltammograms (scan rate= 0.1 V.s-1) of dissolved oxygen in PBS, pH = 7.4. Mean and standard deviation,n = 3, ** : p < 0.01
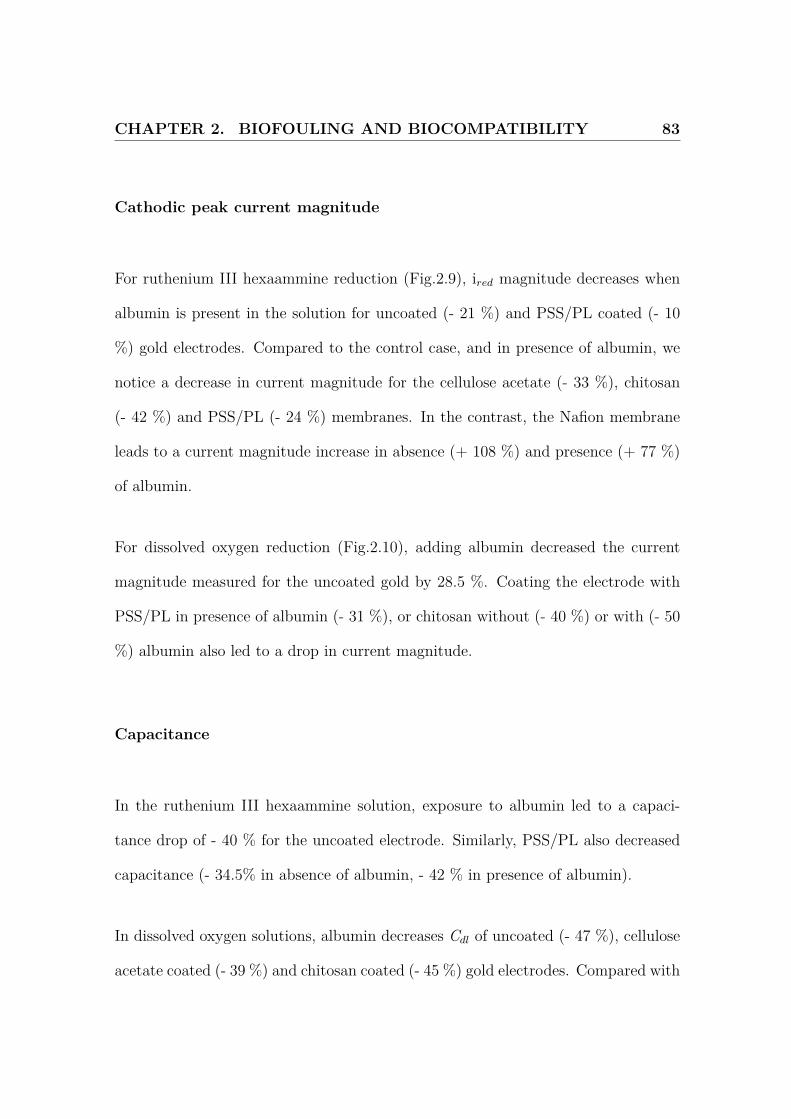
CHAPTER 2. BIOFOULING AND BIOCOMPATIBILITY 83
Cathodic peak current magnitude
For ruthenium III hexaammine reduction (Fig.2.9), ired magnitude decreases when
albumin is present in the solution for uncoated (- 21 %) and PSS/PL coated (- 10
%) gold electrodes. Compared to the control case, and in presence of albumin, we
notice a decrease in current magnitude for the cellulose acetate (- 33 %), chitosan
(- 42 %) and PSS/PL (- 24 %) membranes. In the contrast, the Nafion membrane
leads to a current magnitude increase in absence (+ 108 %) and presence (+ 77 %)
of albumin.
For dissolved oxygen reduction (Fig.2.10), adding albumin decreased the current
magnitude measured for the uncoated gold by 28.5 %. Coating the electrode with
PSS/PL in presence of albumin (- 31 %), or chitosan without (- 40 %) or with (- 50
%) albumin also led to a drop in current magnitude.
Capacitance
In the ruthenium III hexaammine solution, exposure to albumin led to a capaci-
tance drop of - 40 % for the uncoated electrode. Similarly, PSS/PL also decreased
capacitance (- 34.5% in absence of albumin, - 42 % in presence of albumin).
In dissolved oxygen solutions, albumin decreases Cdl of uncoated (- 47 %), cellulose
acetate coated (- 39 %) and chitosan coated (- 45 %) gold electrodes. Compared with
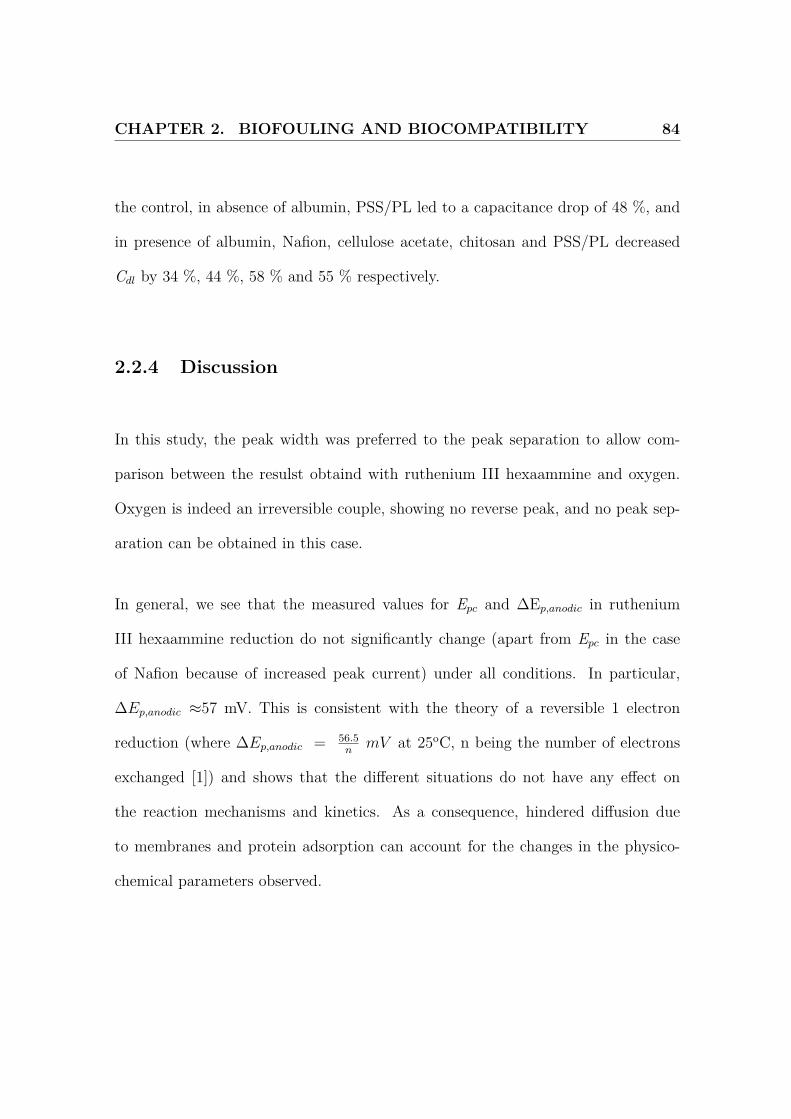
CHAPTER 2. BIOFOULING AND BIOCOMPATIBILITY 84
the control, in absence of albumin, PSS/PL led to a capacitance drop of 48 %, and
in presence of albumin, Nafion, cellulose acetate, chitosan and PSS/PL decreased
Cdl by 34 %, 44 %, 58 % and 55 % respectively.
2.2.4 Discussion
In this study, the peak width was preferred to the peak separation to allow com-
parison between the resulst obtaind with ruthenium III hexaammine and oxygen.
Oxygen is indeed an irreversible couple, showing no reverse peak, and no peak sep-
aration can be obtained in this case.
In general, we see that the measured values for Epc and ∆Ep,anodic in ruthenium
III hexaammine reduction do not significantly change (apart from Epc in the case
of Nafion because of increased peak current) under all conditions. In particular,
∆Ep,anodic ≈57 mV. This is consistent with the theory of a reversible 1 electron
reduction (where ∆Ep,anodic = 56.5n
mV at 25oC, n being the number of electrons
exchanged [1]) and shows that the different situations do not have any effect on
the reaction mechanisms and kinetics. As a consequence, hindered diffusion due
to membranes and protein adsorption can account for the changes in the physico-
chemical parameters observed.
CHAPTER 2. BIOFOULING AND BIOCOMPATIBILITY 85
Untreated gold
The results for the uncoated gold surface show us the effects of albumin adsorption
on electrochemical measurements. In the case of ruthenium III/II hexaammine, we
notice a serious decrease in capacitance due to adsorption of albumin leading to a
displacement of surface counter ions. This reduces the effective electrode surface
accounting for double layer formation and therefore the capacitance. Moreover,
the decrease in current could be partially due to electrode insulation, but this phe-
nomenon is expected to have a very little impact on the measured current, the
diffusion layer for the complete electrode being rather unchanged because of over-
lapping diffusion layers [35]. Hindered diffusion, leading to reduced mass transport,
is expected to account for the decreased current.
In the case of dissolved oxygen reduction, an irreversible reduction (with Epc = Eo′−
RTαnaF
[0.780 + ln(D
1/2o
ko ) + ln(αnaFνRT
)1/2
]and ∆Ep,anodic = 48
αnamV at 25oC, where
α is the transfer coefficient, na is the number of electrons exchanged in the rate
determining step, F is the Faraday constant, D0 is the diffusion coefficient, k0 is
the standard heterogeneous rate constant, ν is the scan rate [1]), albumin addition
increases ∆Ep,anodic and makes Epc more negative. This means that αna decreases
(from the ∆Ep,anodic expression) and therefore that k0 decreases from the Epc ex-
pression, as Epc is getting more negative. We again notice a serious decrease in
capacitance and in current because of adsorption. These decrease in current and
kinetics are mainly expected to be due to adsorption to the catalytic defect sites
CHAPTER 2. BIOFOULING AND BIOCOMPATIBILITY 86
of gold, thus leading to a higher energy gap for the initial formation of hydrogen
peroxide.
These results shows that the main effect of albumin is due to steric occupation,
leading to hindered mass transport most of the time, but also seriously decreasing
reaction kinetics when electrocatalytic effects of the surface are important.
Nafion
Nafion seems to be a good membrane for electrochemistry, leading to few variations
in electrochemical sensing. However, we notice in the case of ruthenium III hex-
aammine reduction an increase in current magnitude. This is expected to be due
to the high affinity of Nafion with cations, leading to a Donnan equilibrium where
the concentration of ruthenium cations inside the membrane is higher than in the
solution. This results in a higher current and more negative potential peak, the
diffusion layer being depleted more slowly.
Furthermore, Nafion does not protect the gold surface from capacitance drop in
the case of dissolved oxygen reduction. This decrease is not seen for ruthenium,
because of changes in buffer leading to different ionic strengths (1 M vs 0.18 M) and
therefore to a smaller effect of spectator species. However, the decrease in Cdl shows
that Nafion does not fully protect the electrodes and that biofouling agents can still
access the electrode.
CHAPTER 2. BIOFOULING AND BIOCOMPATIBILITY 87
Cellulose acetate
As Nafion, cellulose acetate is a satisfactory electrode membrane, leading to no
significant differences from the control in non-biofouling environments. However,
if albumin is added to the solution, we see a capacitance decrease in the lower
ionic strength buffer, showing that it does not protect the surface from protein
adsorption. Cellulose acetate shows quite big pores [101], so it is very likely that
albumin permeates through the membrane. Albumin also decreases the current in
ruthenium III hexaammine reduction, probably because of albumin blocking these
pores and hindering analyte diffusion to the sensor.
Chitosan
Compared to the control situation, chitosan leads to rather disappointing results, in
particular because of the decrease in measured current. This is expected to be due to
hindered diffusion in the case of ruthenium III hexaammine reduction, because of the
thickness of this film, and also because of adsorption blocking the catalytic sites in
the case of dissolved oxygen. We can also notice that, in the case of dissolved oxygen
reduction in the presence of albumin, a decrease in current magnitude is coupled
with a decrease in double layer capacitance. This indicates that chitosan does not
protect the sensing surface from protein adsorption, in particular on catalytic sites
thus decreasing current magnitude, and that protein might permeate through this
CHAPTER 2. BIOFOULING AND BIOCOMPATIBILITY 88
polymer. Again, this is not noticed in the ruthenium III hexaammine experiments,
probably because of the different ionic strengths of the buffers.
Fibronectin
Fibronectin coated electrodes showed no significant differences from uncoated elec-
trodes. It also provides a good protection for biofouling. These results are expected
to be due to the denaturation of fibronectin during the dry-coating process. De-
naturated fibronectin produces a lacunar matrix of fibrin with highly localized thiol
moieties [102]. Such a membrane would bind to relatively few sites of the gold
surface, thus barely affecting its active area and its catalytic properties.
PSS/PL
PSS/PL decreases the double layer capacitance, probably because of intimate ad-
sorption to gold. Furthermore, the negative shift of the cathodic peak potential in
the case of dissolved oxygen reduction shows a decrease in electrode transfer kinetics,
because of catalytic sites insulation due to polyion layer adsorption.
We also notice a decrease in current magnitude after addition of albumin in ruthe-
nium III/II hexaammine solutions. This might indicate a diffusional hindrance due
to albumin adsorption on the PSS/PL layer.
CHAPTER 2. BIOFOULING AND BIOCOMPATIBILITY 89
2.3 Biocompatibility of the electrode coatings
The previous section, compared the effect of the coatings on electrochemical mea-
surements. The biocompatibility of these membranes has also been investigated by
cultivating cells on the same substrates. Fibronectin, PSS/PL, Nafion and cellulose
acetate were studied. Chitosan was not used as this polymer has shown poor elec-
trochemical properties. Gelatin, a substrate frequently used in biology, was used as
a control.
2.3.1 Experimental procedures
Preparation of the substrates
Plastic (polystyrene) Petri dishes, 35 mm in diameter, were coated with the relevant
substrates. These membranes were prepared as previously, apart from Nafion, which
was baked at 60oC, as plastic dishes were used. Multiple layers have also been tested,
with Nafion and cellulose acetate covered with fibronectin.
Adhesion test
Pig aortic endothelial cells were harvested from freshly excised aortas using collage-
nase and cultured in culture medium (DMEM with 10 % newborn calf serum, 10 %
CHAPTER 2. BIOFOULING AND BIOCOMPATIBILITY 90
foetal calf serum, 8 mM endothelial growth factor, 5 µg.ml-1 glutamine) at 37 oC,
95 % O2, 5 % CO2. Cells from passage 2 to 6 were used.
10,000 cells.cm-2 were deposited, in 2 ml of culture medium, on the coated Petri
dishes. The dishes were placed in the humid incubator for 24 hours. The medium was
then changed, and microscope pictures were taken. The cell density was quantified
using the software ImageJ. The results were compared using double-tailed Student’s
t-test, for 6 measurements (3 duplicates).
Effect of electrochemical tests
To investigate the effects of electrochemical experiments on cell viability, some cells
were grown on a fibronectin coated sensor. This sensor, presented on Fig.2.11, is a
multiple microelectrode array featuring 14 gold working electrodes, a pseudo gold
reference and a gold counter electrode, on a glass substrate, with silicon nitride as
an insulating layer. This sensor allowed observation of the cells using a microscope,
and was made by stereolithography by Aleria Biodevices, Barcelona, Spain (Fig.1.9).
The cells were cultivated in culture media and, after 24 hours of culture, were
exposed to a fixed potential, measured vs Ag|AgCl, for 5 minutes. Trypan blue, a
cell viability staining, was then added to the media and the cells were incubated
for 5 minutes. The media was changed and the cells were observed using an optical
microscope.
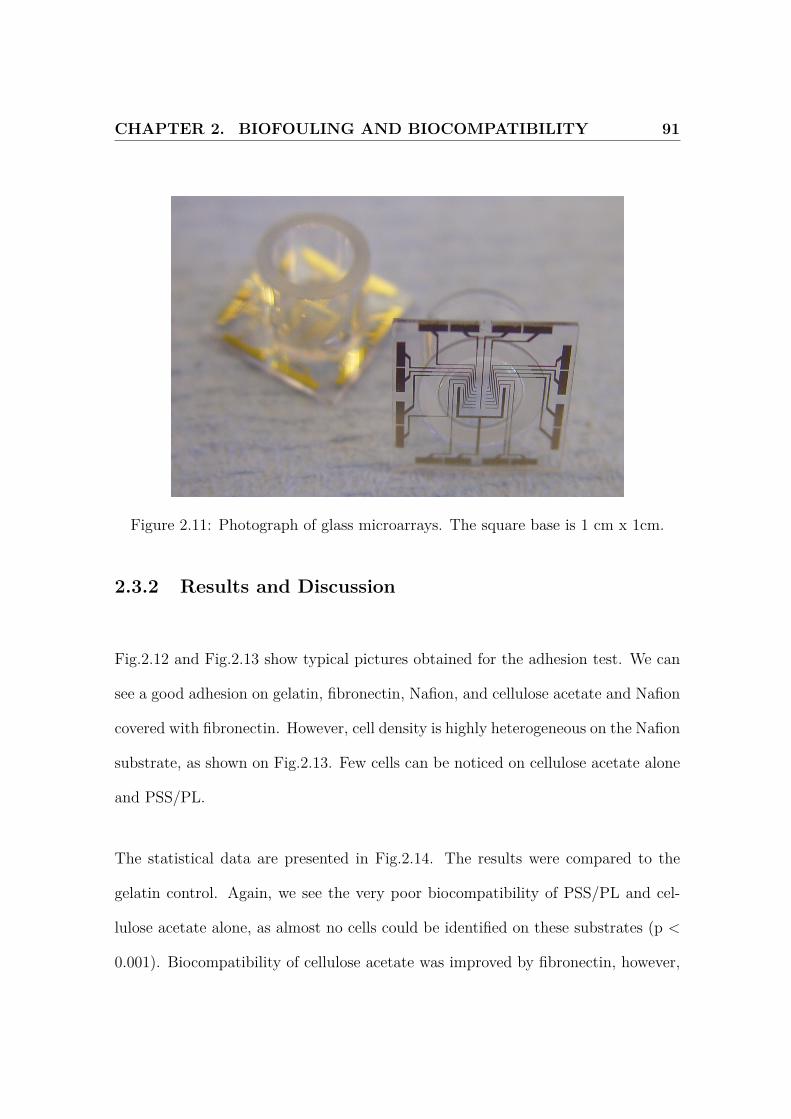
CHAPTER 2. BIOFOULING AND BIOCOMPATIBILITY 91
Figure 2.11: Photograph of glass microarrays. The square base is 1 cm x 1cm.
2.3.2 Results and Discussion
Fig.2.12 and Fig.2.13 show typical pictures obtained for the adhesion test. We can
see a good adhesion on gelatin, fibronectin, Nafion, and cellulose acetate and Nafion
covered with fibronectin. However, cell density is highly heterogeneous on the Nafion
substrate, as shown on Fig.2.13. Few cells can be noticed on cellulose acetate alone
and PSS/PL.
The statistical data are presented in Fig.2.14. The results were compared to the
gelatin control. Again, we see the very poor biocompatibility of PSS/PL and cel-
lulose acetate alone, as almost no cells could be identified on these substrates (p <
0.001). Biocompatibility of cellulose acetate was improved by fibronectin, however,
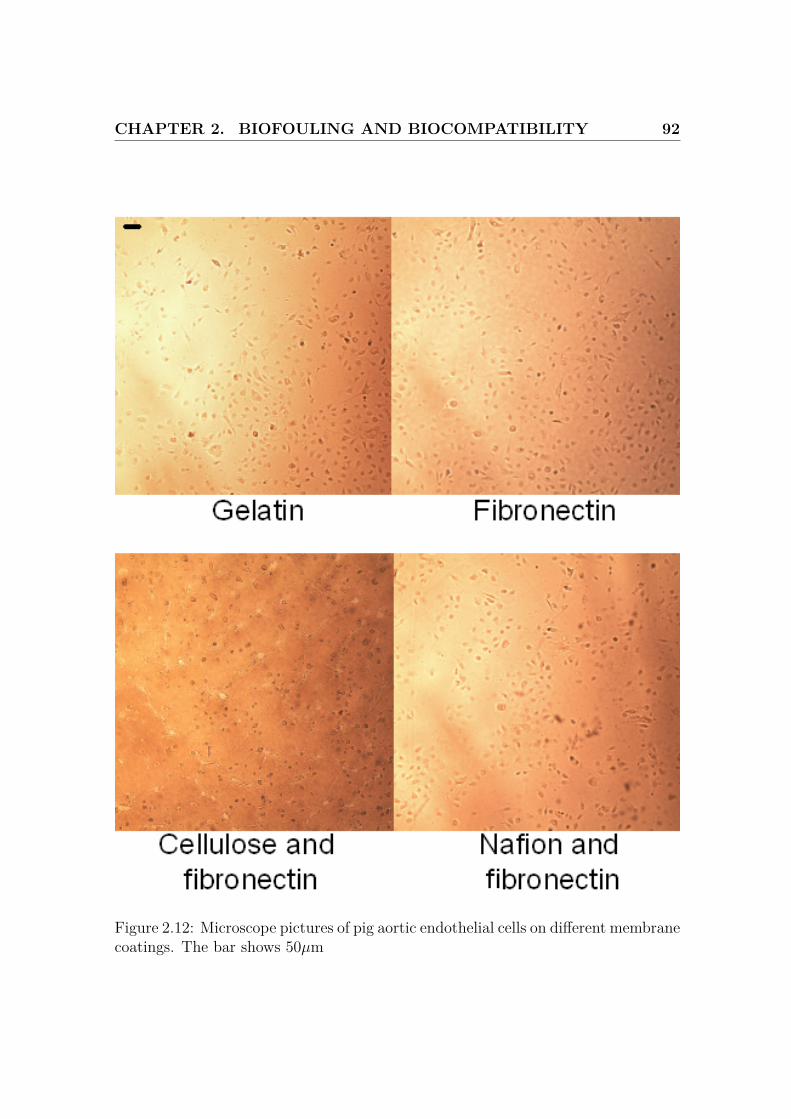
CHAPTER 2. BIOFOULING AND BIOCOMPATIBILITY 92
Figure 2.12: Microscope pictures of pig aortic endothelial cells on different membranecoatings. The bar shows 50µm
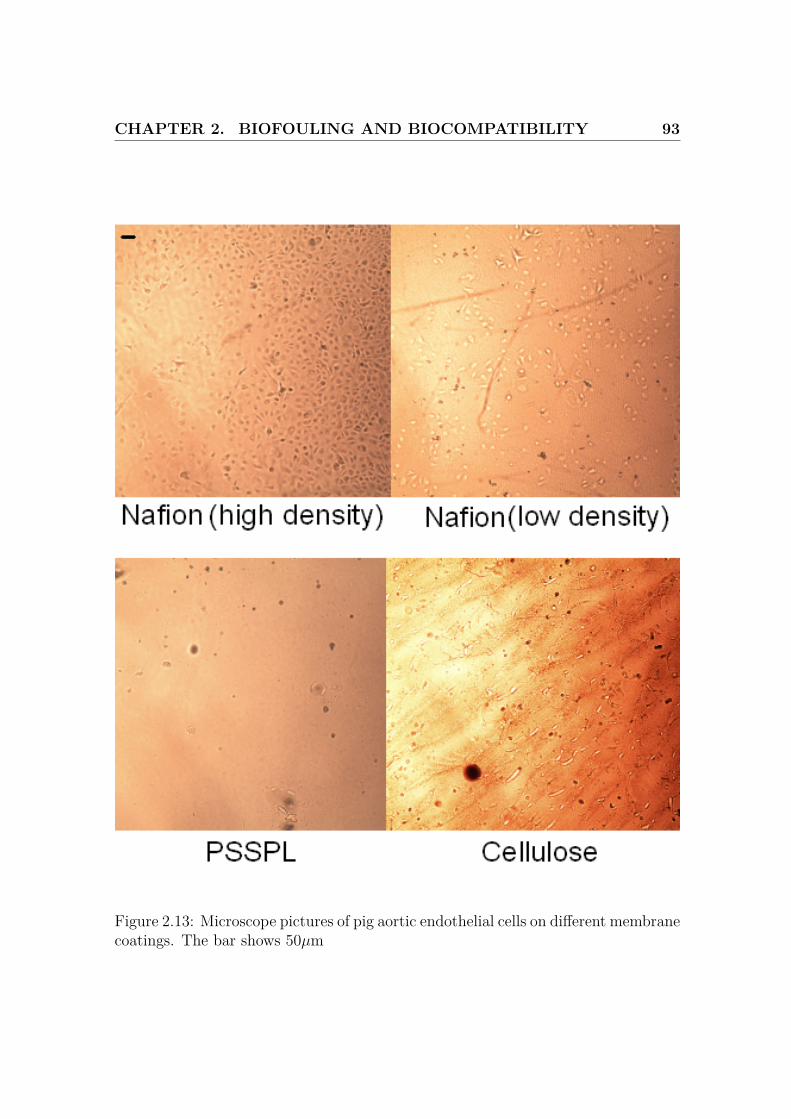
CHAPTER 2. BIOFOULING AND BIOCOMPATIBILITY 93
Figure 2.13: Microscope pictures of pig aortic endothelial cells on different membranecoatings. The bar shows 50µm
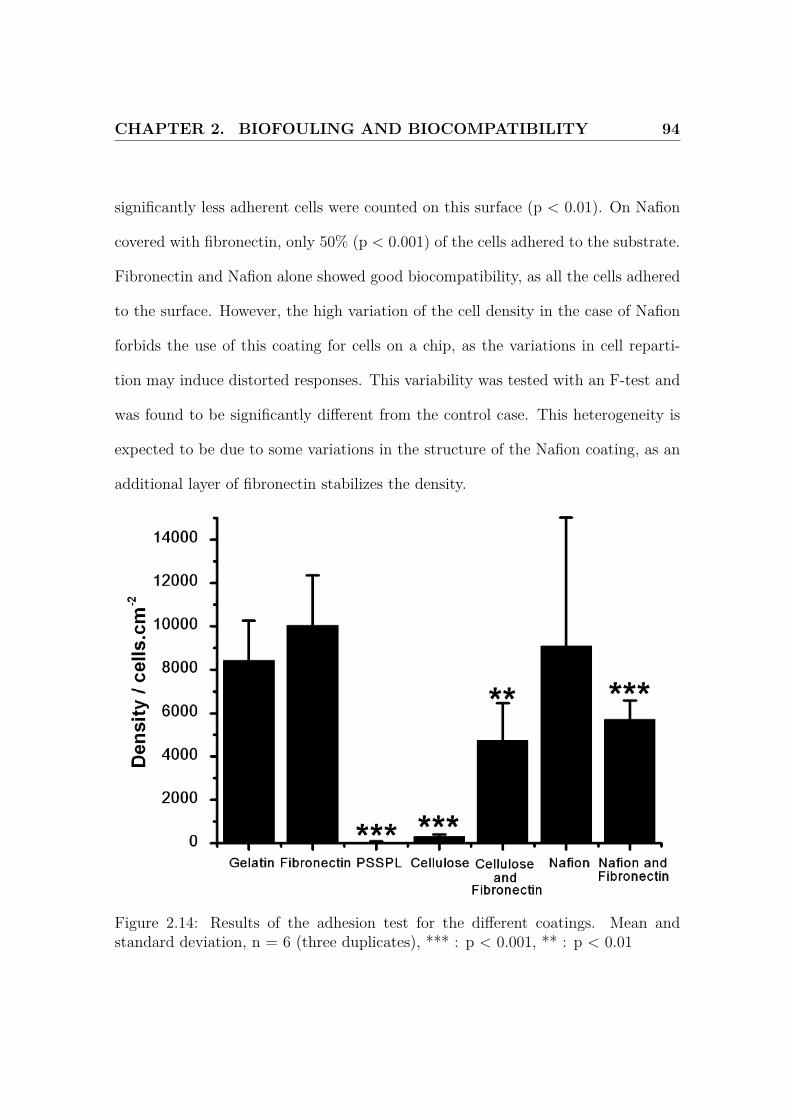
CHAPTER 2. BIOFOULING AND BIOCOMPATIBILITY 94
significantly less adherent cells were counted on this surface (p < 0.01). On Nafion
covered with fibronectin, only 50% (p < 0.001) of the cells adhered to the substrate.
Fibronectin and Nafion alone showed good biocompatibility, as all the cells adhered
to the surface. However, the high variation of the cell density in the case of Nafion
forbids the use of this coating for cells on a chip, as the variations in cell reparti-
tion may induce distorted responses. This variability was tested with an F-test and
was found to be significantly different from the control case. This heterogeneity is
expected to be due to some variations in the structure of the Nafion coating, as an
additional layer of fibronectin stabilizes the density.
Figure 2.14: Results of the adhesion test for the different coatings. Mean andstandard deviation, n = 6 (three duplicates), *** : p < 0.001, ** : p < 0.01
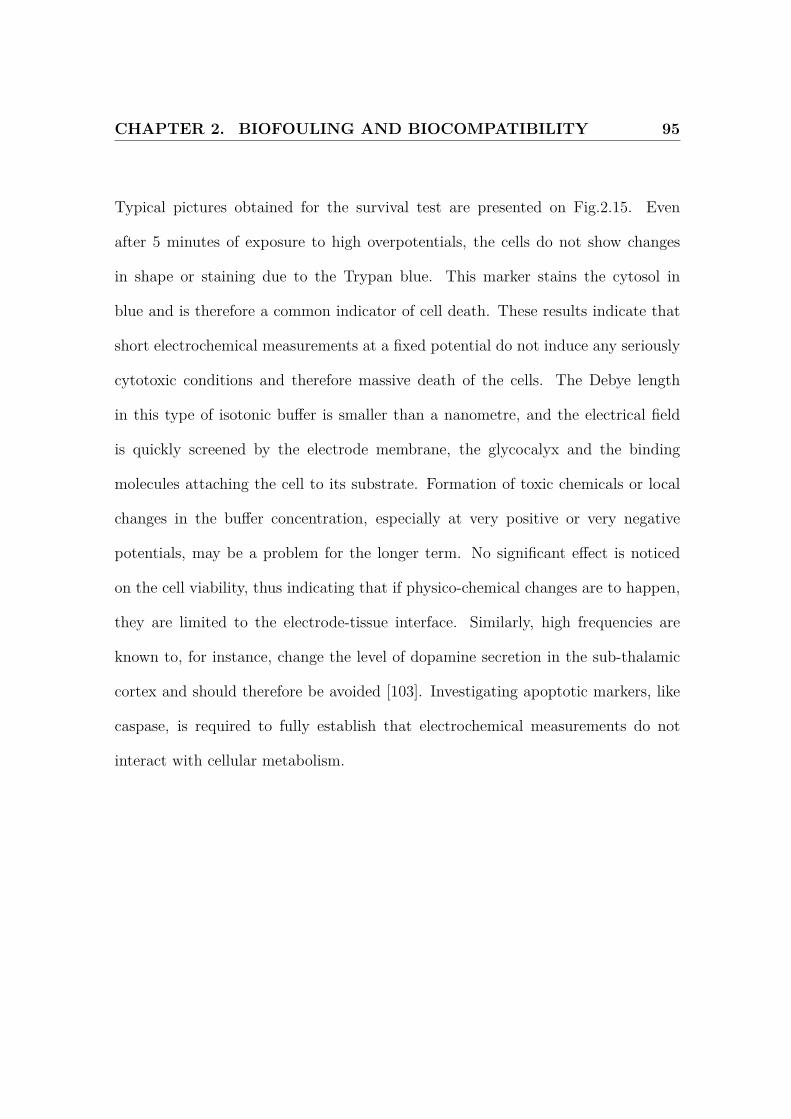
CHAPTER 2. BIOFOULING AND BIOCOMPATIBILITY 95
Typical pictures obtained for the survival test are presented on Fig.2.15. Even
after 5 minutes of exposure to high overpotentials, the cells do not show changes
in shape or staining due to the Trypan blue. This marker stains the cytosol in
blue and is therefore a common indicator of cell death. These results indicate that
short electrochemical measurements at a fixed potential do not induce any seriously
cytotoxic conditions and therefore massive death of the cells. The Debye length
in this type of isotonic buffer is smaller than a nanometre, and the electrical field
is quickly screened by the electrode membrane, the glycocalyx and the binding
molecules attaching the cell to its substrate. Formation of toxic chemicals or local
changes in the buffer concentration, especially at very positive or very negative
potentials, may be a problem for the longer term. No significant effect is noticed
on the cell viability, thus indicating that if physico-chemical changes are to happen,
they are limited to the electrode-tissue interface. Similarly, high frequencies are
known to, for instance, change the level of dopamine secretion in the sub-thalamic
cortex and should therefore be avoided [103]. Investigating apoptotic markers, like
caspase, is required to fully establish that electrochemical measurements do not
interact with cellular metabolism.
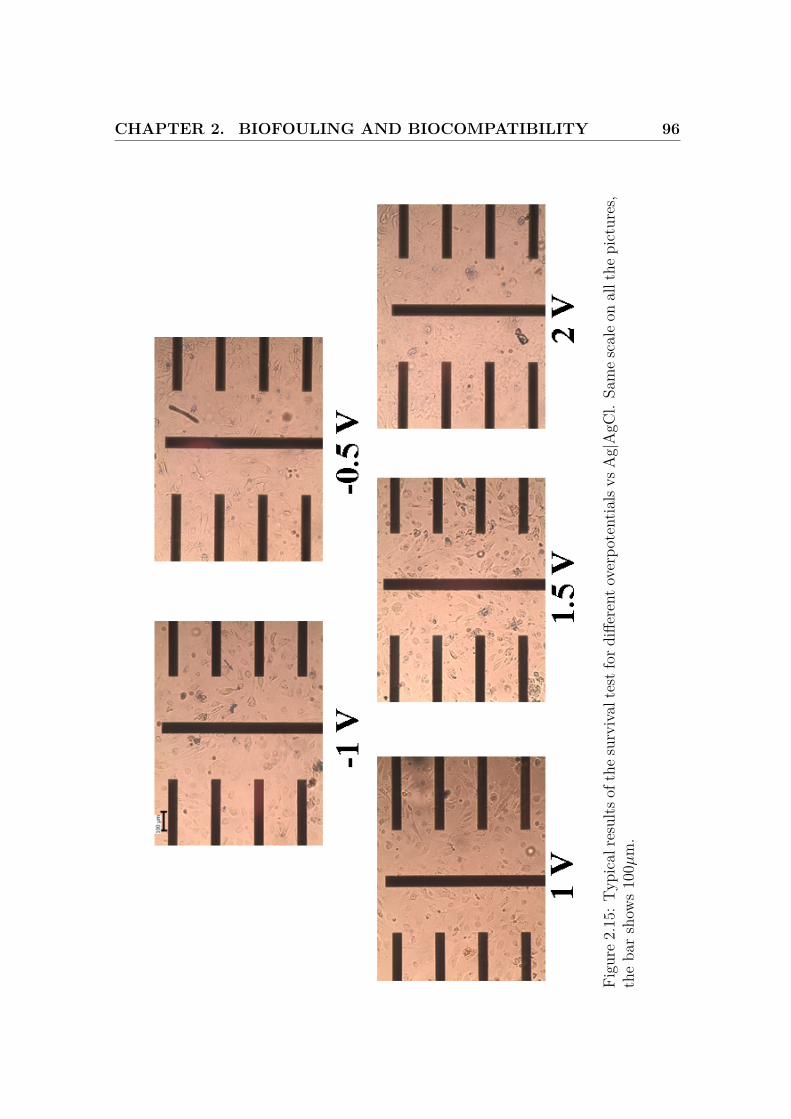
CHAPTER 2. BIOFOULING AND BIOCOMPATIBILITY 96
Figu
re2.
15:T
ypic
alre
sults
ofth
esu
rviv
alte
stfo
rdiff
eren
tove
rpot
entia
lsvs
Ag|
AgC
l.Sa
me
scal
eon
allt
hepi
ctur
es,
the
bar
show
s10
0µm
.
CHAPTER 2. BIOFOULING AND BIOCOMPATIBILITY 97
2.4 Electrode coatings for biomeasurements: Con-
clusion
This study has shown that fibronectin, Nafion and cellulose acetate offer good re-
sistance to biofouling, even for electrocatalytic processes. However, only fibronectin
allows good cell adhesion.
As a consequence, fibronectin is a biopolymer of choice for the tissue-electrode in-
terface and for cells on chip application.
Chapter 3
Sensing from Endothelial Cells
Using a Multi-channel
Microelectrode Array
3.1 Introduction
Nitric oxide (NO) plays a critical role in numerous physiological phenomena [104,
105, 106, 107, 108, 109]. It is a key biological mediator appearing in the nervous
system [110, 111, 112], immune system [113, 114] and vascular physiology [115, 116].
In particular, NO is known to regulate blood pressure by mediating vasodilation
98
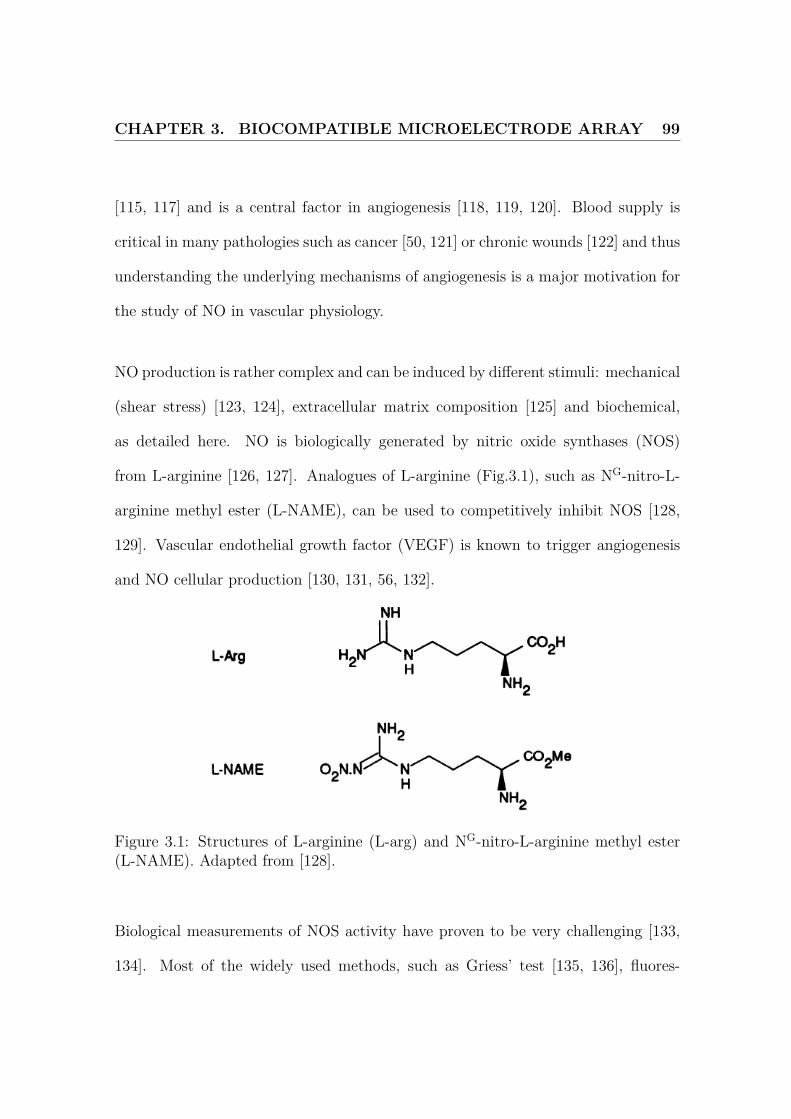
CHAPTER 3. BIOCOMPATIBLE MICROELECTRODE ARRAY 99
[115, 117] and is a central factor in angiogenesis [118, 119, 120]. Blood supply is
critical in many pathologies such as cancer [50, 121] or chronic wounds [122] and thus
understanding the underlying mechanisms of angiogenesis is a major motivation for
the study of NO in vascular physiology.
NO production is rather complex and can be induced by different stimuli: mechanical
(shear stress) [123, 124], extracellular matrix composition [125] and biochemical,
as detailed here. NO is biologically generated by nitric oxide synthases (NOS)
from L-arginine [126, 127]. Analogues of L-arginine (Fig.3.1), such as NG-nitro-L-
arginine methyl ester (L-NAME), can be used to competitively inhibit NOS [128,
129]. Vascular endothelial growth factor (VEGF) is known to trigger angiogenesis
and NO cellular production [130, 131, 56, 132].
Figure 3.1: Structures of L-arginine (L-arg) and NG-nitro-L-arginine methyl ester(L-NAME). Adapted from [128].
Biological measurements of NOS activity have proven to be very challenging [133,
134]. Most of the widely used methods, such as Griess’ test [135, 136], fluores-
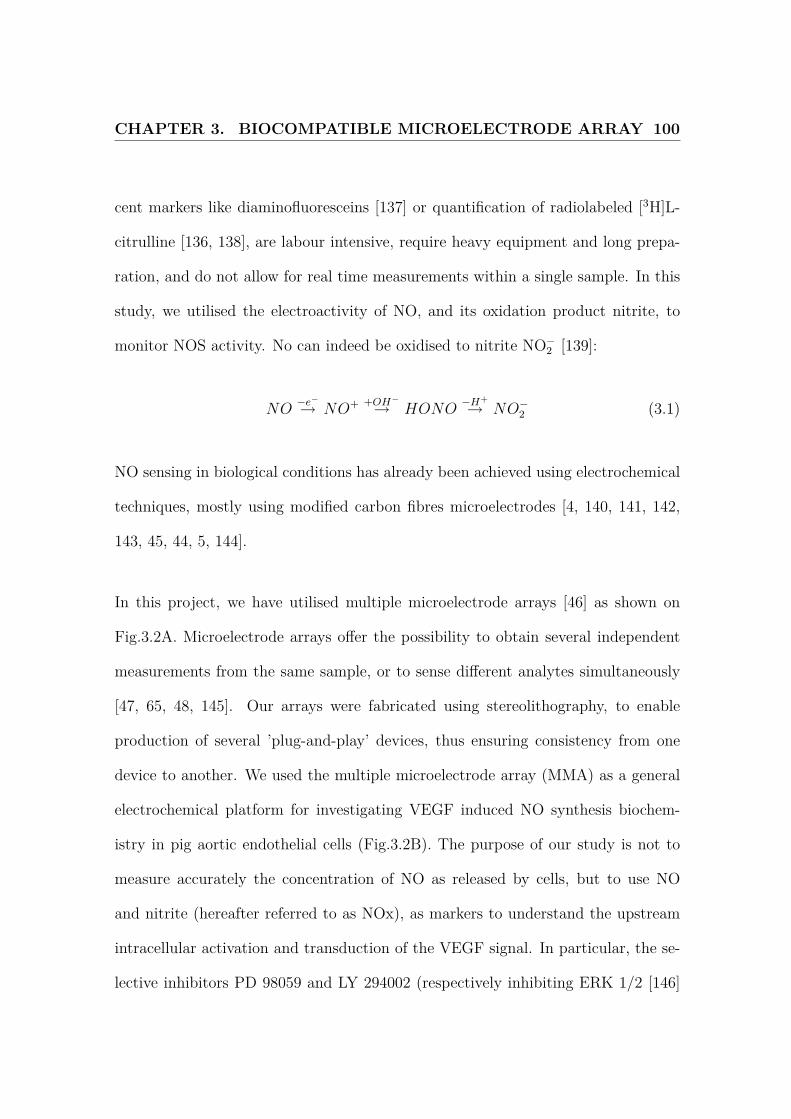
CHAPTER 3. BIOCOMPATIBLE MICROELECTRODE ARRAY 100
cent markers like diaminofluoresceins [137] or quantification of radiolabeled [3H]L-
citrulline [136, 138], are labour intensive, require heavy equipment and long prepa-
ration, and do not allow for real time measurements within a single sample. In this
study, we utilised the electroactivity of NO, and its oxidation product nitrite, to
monitor NOS activity. No can indeed be oxidised to nitrite NO−2 [139]:
NO−e−→ NO+ +OH−
→ HONO−H+
→ NO−2 (3.1)
NO sensing in biological conditions has already been achieved using electrochemical
techniques, mostly using modified carbon fibres microelectrodes [4, 140, 141, 142,
143, 45, 44, 5, 144].
In this project, we have utilised multiple microelectrode arrays [46] as shown on
Fig.3.2A. Microelectrode arrays offer the possibility to obtain several independent
measurements from the same sample, or to sense different analytes simultaneously
[47, 65, 48, 145]. Our arrays were fabricated using stereolithography, to enable
production of several ’plug-and-play’ devices, thus ensuring consistency from one
device to another. We used the multiple microelectrode array (MMA) as a general
electrochemical platform for investigating VEGF induced NO synthesis biochem-
istry in pig aortic endothelial cells (Fig.3.2B). The purpose of our study is not to
measure accurately the concentration of NO as released by cells, but to use NO
and nitrite (hereafter referred to as NOx), as markers to understand the upstream
intracellular activation and transduction of the VEGF signal. In particular, the se-
lective inhibitors PD 98059 and LY 294002 (respectively inhibiting ERK 1/2 [146]
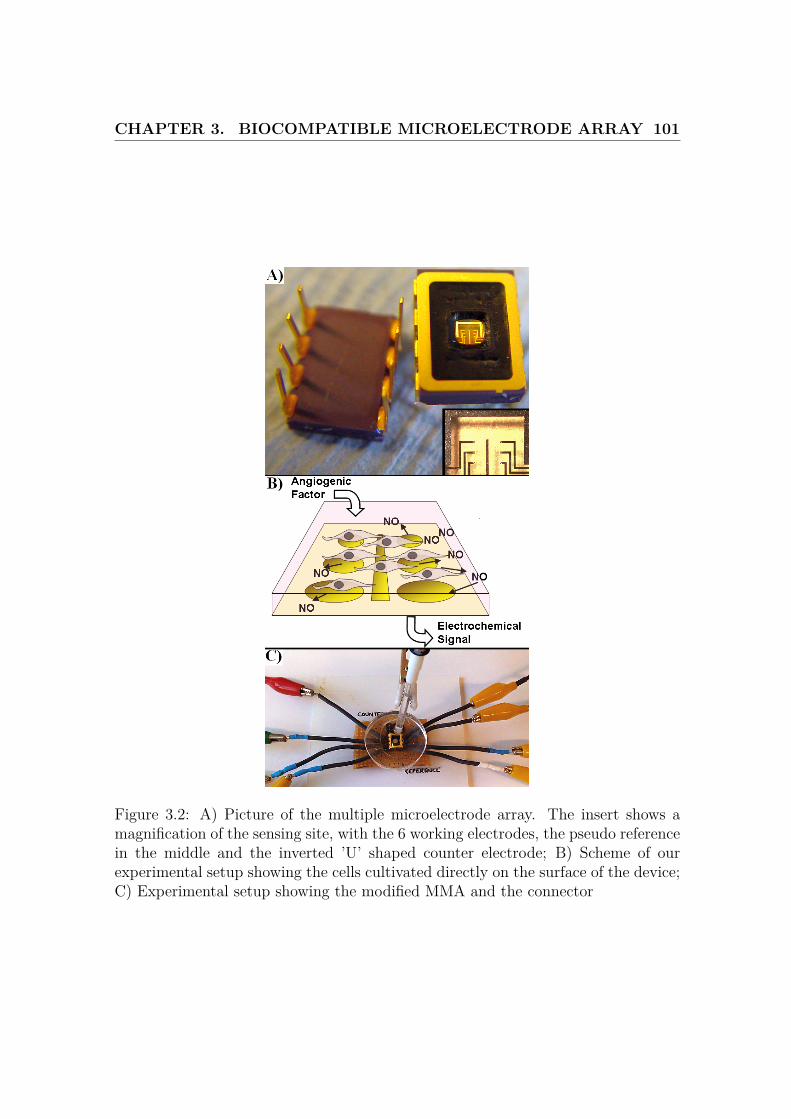
CHAPTER 3. BIOCOMPATIBLE MICROELECTRODE ARRAY 101
Figure 3.2: A) Picture of the multiple microelectrode array. The insert shows amagnification of the sensing site, with the 6 working electrodes, the pseudo referencein the middle and the inverted ’U’ shaped counter electrode; B) Scheme of ourexperimental setup showing the cells cultivated directly on the surface of the device;C) Experimental setup showing the modified MMA and the connector
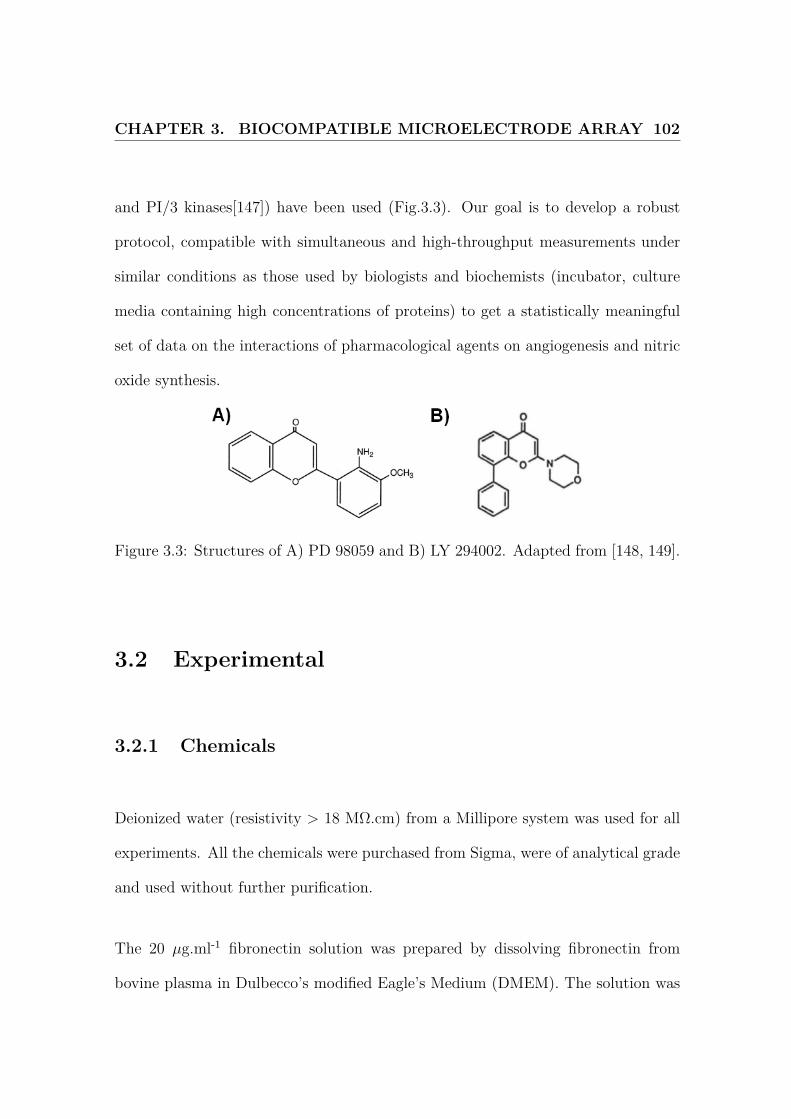
CHAPTER 3. BIOCOMPATIBLE MICROELECTRODE ARRAY 102
and PI/3 kinases[147]) have been used (Fig.3.3). Our goal is to develop a robust
protocol, compatible with simultaneous and high-throughput measurements under
similar conditions as those used by biologists and biochemists (incubator, culture
media containing high concentrations of proteins) to get a statistically meaningful
set of data on the interactions of pharmacological agents on angiogenesis and nitric
oxide synthesis.
Figure 3.3: Structures of A) PD 98059 and B) LY 294002. Adapted from [148, 149].
3.2 Experimental
3.2.1 Chemicals
Deionized water (resistivity > 18 MΩ.cm) from a Millipore system was used for all
experiments. All the chemicals were purchased from Sigma, were of analytical grade
and used without further purification.
The 20 µg.ml-1 fibronectin solution was prepared by dissolving fibronectin from
bovine plasma in Dulbecco’s modified Eagle’s Medium (DMEM). The solution was
CHAPTER 3. BIOCOMPATIBLE MICROELECTRODE ARRAY 103
stored in at 4 oC.
The poly(styrene-sulphonate)/poly(L-lysine) (PSS/PL) solution was prepared and
used as in the previous chapter.
The 5 µg.ml-1 VEGF solution was prepared by dissolving mouse VEGF into water.
The solution was stored at 4oC. The PD 98059 and LY 294002 stock solutions where
prepared by dissolving 1 mg of each of these chemicals in 1 ml of dimethyl sulfoxide.
LY 294002 and PD 98059 are here used as selective kinase inhibitors.
Dissolved NO solution has been used for sensor calibration. Dissolved NO solution
was prepared by saturating deoxygenated deionised water with NO using Feelisch
method [150]. Briefly, before bubbling pure NO gas through water, the system
is fully deoxygenated using nitrogen purified over a vanadium(II)/ zinc/ mercury
oxygen scrubber. The final concentration of this solution is 1.93 mM according to
Henry’s law [100]. NO solutions were prepared in a custom-built gas collection jar
sealed with a silicone rubber septum. Aliquots of saturated NO solution were drawn
using a Hamilton syringe.
CHAPTER 3. BIOCOMPATIBLE MICROELECTRODE ARRAY 104
3.2.2 Electrochemical measurements
The multiple microelectrode arrays were developed in our group at Imperial College
London, UK. The design and geometry of the multiple microelectrode arrays are
reported elsewhere [46]. They feature six 35 µm gold working electrodes, a pseudo-
reference and a counter electrode embedded in a DIL package to allow connection
to a potentiostat. The connections are made of gold on titanium and are insulated
with polyimide. All the electrodes are recessed by 2µm .
The measurements were performed with a CHI 1030 from CH Instruments, Austin,
Texas, US. An Ag|AgCl reference, 3 M KCl (CH Instruments) was used throughout
the experiments.
The electrodes were initially cleaned with ethanol. An electrochemical cleaning
protocol was then performed in 0.1 M H2SO4. Potentials were cycled from 1.4 V
to -0.3 V vs Ag|AgCl until reproducible I-V traces were obtained. The electrode
potential was then maintained at -0.3 V vs Ag|AgCl until a steady current was
obtained to reduce surface oxides [151].
The fibronectin coating was deposited by allowing 50 µl of fibronectin solution on a
clean sensor to dry, followed by rinsing with PBS.
The ruthenium III hexaammine measurements were carried out in 1 M KCl with 10
mM ruthenium III hexaammine chloride. Dissolved oxygen measurements were per-

CHAPTER 3. BIOCOMPATIBLE MICROELECTRODE ARRAY 105
formed in gas saturated phosphate buffered saline (PBS, pH = 7.4, NaCl: 0.138 M,
KCl: 0.0027 M, phosphate: 0.01 M) to reach a final dissolved oxygen concentration
of 1.2 mM [33, 34]. Cyclic voltammograms were obtained in ruthenium III hex-
aammine and in dissolved oxygen solutions at a scan rate of 50 mV.s-1. The Tomeš
potential [152] and cathodic peak current were obtained. From the microelectrode
theory, for a reversible species, the Tomeš potential is given by [152, 1]:
ET =∣∣∣E1/4 − E3/4
∣∣∣ =RT
nFln9 =
56.45
nmV at 25oC (3.2)
where n is the number of electrons exchanged (1 in the case of ruthenium (III)
hexaamine reduction). The results were compared using two-tailed Student’s t test,
18 experimental values, from 3 arrays, being obtained for each parameter.
4% w/v bovine serum albumin, 1 mM ascorbic acid, 1 mM l-arginine, 1 mM sodium
nitrite and 1 mM dopamine hydrochloride (dopamine) were used to assess potential
biological interferences and were used as received, dissolved in PBS. Furthermore,
1% sulfamic acid was used to eliminate nitrites [153], sodium hydroxide being used
to reequilibrate the pH.
CHAPTER 3. BIOCOMPATIBLE MICROELECTRODE ARRAY 106
3.2.3 In vitro NOS induced activity in endothelial cells and
aortic rings
Pig aortic endothelial cells were harvested from freshly excised aortas using collage-
nase and cultured in culture medium (DMEM with 10 % newborn calf serum, 10 %
foetal calf serum, 8 mM endothelial growth factor, 5 µg.ml-1 glutamine) at 37 oC,
95 % O2, 5 % CO2. Cells from passage 2 to 6 were used.
All animal experiments were carried out in compliance with the relevant laws and
institutional guidelines. Male guinea pigs weighing 300-400 g were euthanized using
CO2 gas. The animals were dissected and their aortas were excised. The artery was
stored in Krebs buffer solution, pH 7.4 (117 mM NaCl, 4.7 mM KCl, 2.5 mM CaCl2,
1.2 mM MgCl2, 1.2 mM NaH2PO4, 25 NaHCO3 and 11 mM glucose) until use and
cut in 3-4 mm long sections.
Multiple microelectrode arrays were modified with a Sylgard surround to create
a reservoir enabling deposition of 0.5 ml of solution of the surface. The setup is
presented on Fig.3.2C. These modified chips were then coated with fibronectin. The
relevant biological sample was then placed on this sensor:
1. 1000 pig aortic endothelial cells were counted using trypan blue (Mediatech,
Fischer) and a Neubauer improved haemacytometer and resuspended in 0.5
ml culture medium (composition described previously);
CHAPTER 3. BIOCOMPATIBLE MICROELECTRODE ARRAY 107
2. A 3-4 mm section of guinea pig aorta in 0.5 ml culture medium.
The sensor was left for 2 hours in the incubator (37 oC, 5 % CO2) to allow equilibra-
tion of the system. To investigate the effect of NOS inhibition, 100 µM of L-NAME
[154] or 20 µM PD 98059 [146] or 20 µM LY 294002 [149] was added at least one
hour before NOx measurement. The level of NOx was measured by differential pulse
voltammetry (DPV) between 0.5 V and 1.2 V vs Ag|AgCl (increment 0.004 V, am-
plitude 0.05 V, pulse width 0.06 s, pulse period 0.2 s). 100 ng of VEGF dissolved
in 20 µl of water was then added and the sensor was placed in the incubator for an-
other 2 hours. The NOx concentration was measured again using DPV. The current
peaks due to NO/nitrite oxidation were then measured. The value of interest was
the dimensionless current ratio:
current ratio =peak current (t = 2 hours)
peak current (t = 0 hour)(3.3)
The results were compared using two-tailed Student’s t test.
3.2.4 Membrane Biocompatibility
20,000 pig aortic endothelial cells were deposited on Petri dishes (diameter 3.5 cm)
coated with fibronectin or PSS/PL and incubated in medium. The cells were ob-
served using an inverted microscope and pictures were taken after 24 and 48 hours.
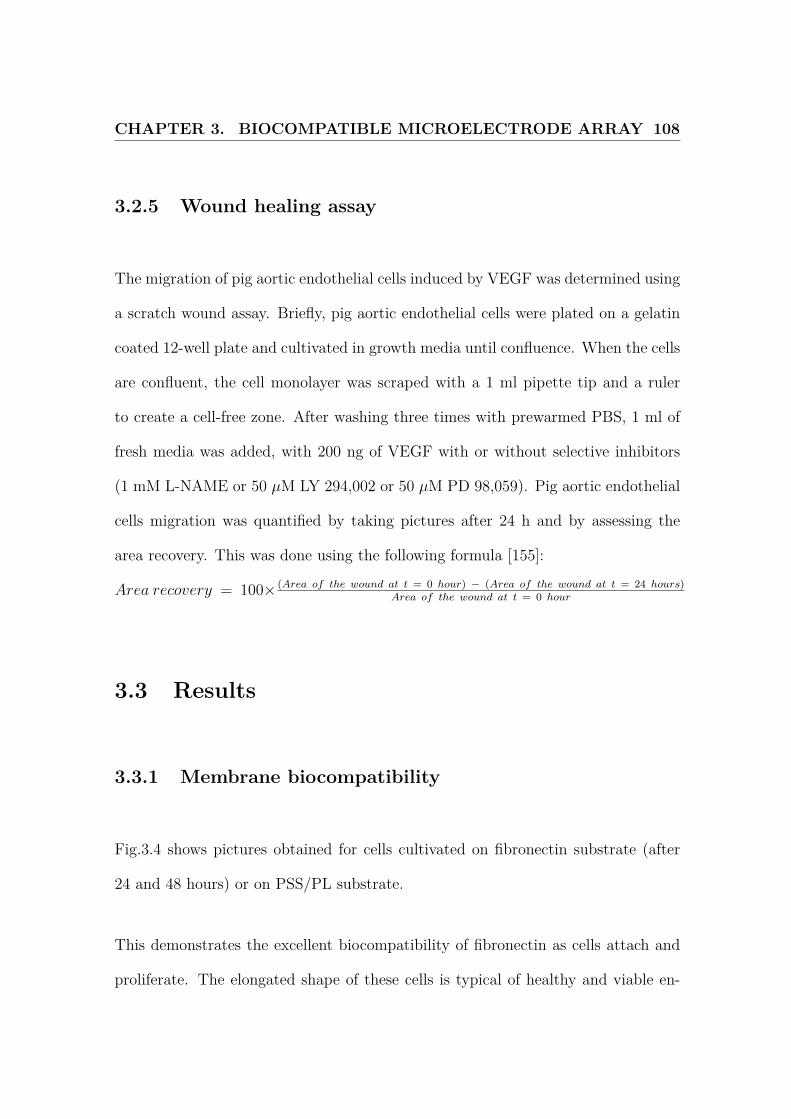
CHAPTER 3. BIOCOMPATIBLE MICROELECTRODE ARRAY 108
3.2.5 Wound healing assay
The migration of pig aortic endothelial cells induced by VEGF was determined using
a scratch wound assay. Briefly, pig aortic endothelial cells were plated on a gelatin
coated 12-well plate and cultivated in growth media until confluence. When the cells
are confluent, the cell monolayer was scraped with a 1 ml pipette tip and a ruler
to create a cell-free zone. After washing three times with prewarmed PBS, 1 ml of
fresh media was added, with 200 ng of VEGF with or without selective inhibitors
(1 mM L-NAME or 50 µM LY 294,002 or 50 µM PD 98,059). Pig aortic endothelial
cells migration was quantified by taking pictures after 24 h and by assessing the
area recovery. This was done using the following formula [155]:
Area recovery = 100× (Area of the wound at t = 0 hour) − (Area of the wound at t = 24 hours)Area of the wound at t = 0 hour
3.3 Results
3.3.1 Membrane biocompatibility
Fig.3.4 shows pictures obtained for cells cultivated on fibronectin substrate (after
24 and 48 hours) or on PSS/PL substrate.
This demonstrates the excellent biocompatibility of fibronectin as cells attach and
proliferate. The elongated shape of these cells is typical of healthy and viable en-
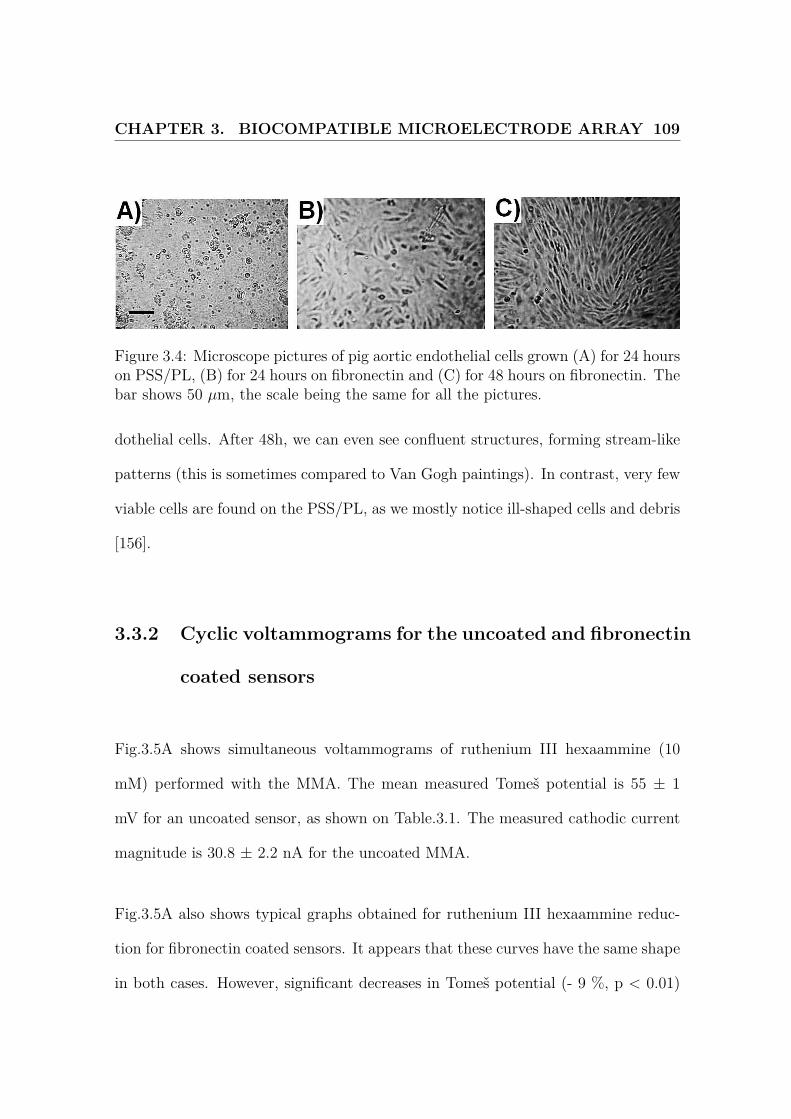
CHAPTER 3. BIOCOMPATIBLE MICROELECTRODE ARRAY 109
Figure 3.4: Microscope pictures of pig aortic endothelial cells grown (A) for 24 hourson PSS/PL, (B) for 24 hours on fibronectin and (C) for 48 hours on fibronectin. Thebar shows 50 µm, the scale being the same for all the pictures.
dothelial cells. After 48h, we can even see confluent structures, forming stream-like
patterns (this is sometimes compared to Van Gogh paintings). In contrast, very few
viable cells are found on the PSS/PL, as we mostly notice ill-shaped cells and debris
[156].
3.3.2 Cyclic voltammograms for the uncoated and fibronectin
coated sensors
Fig.3.5A shows simultaneous voltammograms of ruthenium III hexaammine (10
mM) performed with the MMA. The mean measured Tomeš potential is 55 ± 1
mV for an uncoated sensor, as shown on Table.3.1. The measured cathodic current
magnitude is 30.8 ± 2.2 nA for the uncoated MMA.
Fig.3.5A also shows typical graphs obtained for ruthenium III hexaammine reduc-
tion for fibronectin coated sensors. It appears that these curves have the same shape
in both cases. However, significant decreases in Tomeš potential (- 9 %, p < 0.01)

CHAPTER 3. BIOCOMPATIBLE MICROELECTRODE ARRAY 110
Figure 3.5: Typical cyclic voltammograms (scan rate = 0.05 V.s-1) of (A) 10 mMruthenium III hexaammine in 1 M KCl and (B) oxygen dissolved in PBS (pH = 7.4)for uncoated and coated MMA. The traces presented here are obtained simultane-ously from 6 independent electrodes.
and cathodic current magnitude (- 20 %, p < 0.01) are noticed. The values mea-
sured for the Tomeš potential are here smaller than the expected theoretical value.
However, the error is still in the expected range for measurement inaccuracies. The
Tomeš potential does not seriously increase, thus showing there is no serious ki-
netic hinderance for ruthenium III hexaammine reduction, as shown in the previous
chapter. For both setups, measurements of Tomeš potential and cathodic current
magnitude show good repeatability (relative standard deviation < 2.5 % and < 9 %
respectively). However, by performing an F-test, it appears that these variances are
statistically different from the ones obtained for the uncoated sensor. This indicates
that the coating increases the measurement variability.
The same parameters were measured for dissolved oxygen reduction. Again, the
shapes of the graphs are similar (Fig.3.5B). No significant difference was observed
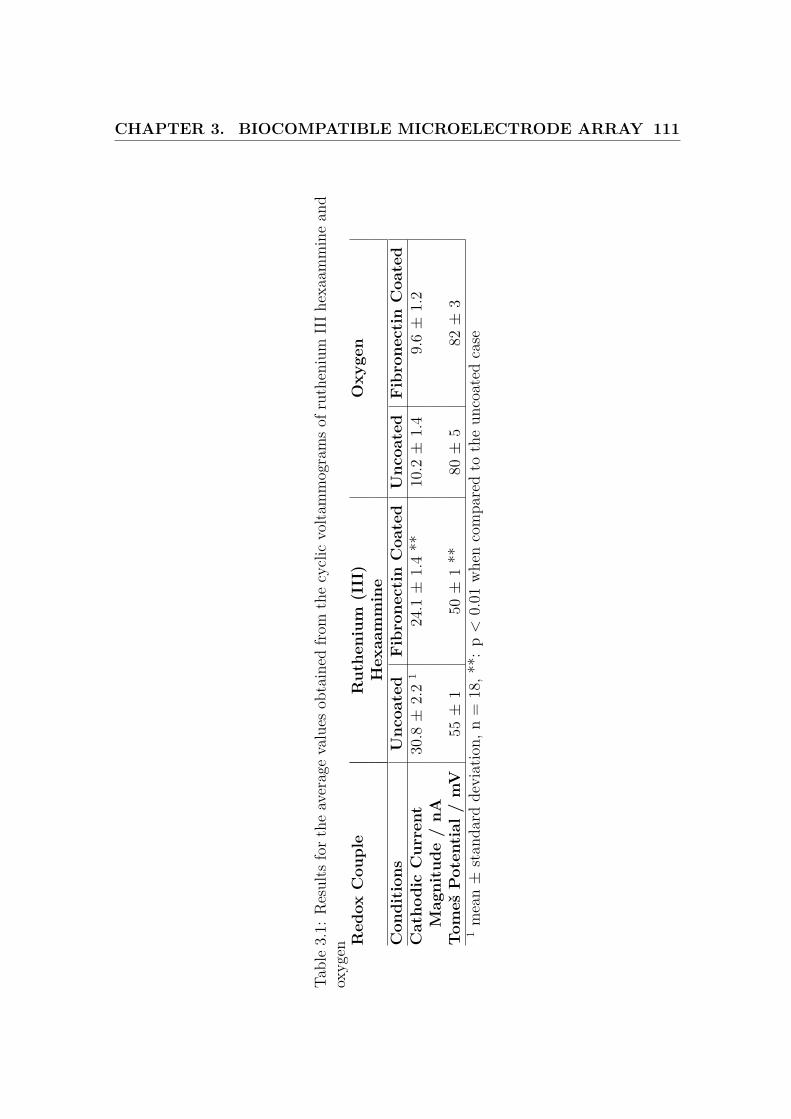
CHAPTER 3. BIOCOMPATIBLE MICROELECTRODE ARRAY 111
Tabl
e3.
1:R
esul
tsfo
rthe
aver
age
valu
esob
tain
edfro
mth
ecy
clic
volta
mm
ogra
mso
frut
heni
umII
Ihex
aam
min
ean
dox
ygen
Red
oxC
oupl
eR
uthe
nium
(III
)O
xyge
nH
exaa
mm
ine
Con
diti
ons
Unc
oate
dF
ibro
nect
inC
oate
dU
ncoa
ted
Fib
rone
ctin
Coa
ted
Cat
hodi
cC
urre
nt30
.8±
2.2
124
.1±
1.4
**10
.2±
1.4
9.6±
1.2
Mag
nitu
de/
nAT
omeš
Pot
enti
al/
mV
55±
150±
1**
80±
582±
31
mea
n±
stan
dard
devi
atio
n,n
=18
,**:
p<
0.01
whe
nco
mpa
red
toth
eun
coat
edca
se

CHAPTER 3. BIOCOMPATIBLE MICROELECTRODE ARRAY 112
(Table.3.1). The measurements of Tomeš potential and cathodic current magnitude
still show satisfactory repeatability (relative standard deviation < 11 % and < 25 %
respectively).
3.3.3 Characterization of the sensor during cell measure-
ments
Fig.3.6A shows the setup used for the cell experiments. Cells were grown directly
on the fibronectin coated device, and the experiments were carried out in culture
media, to ensure that the features observed are biologically relevant.
Fig.3.6B shows typical DPV obtained from pig aortic endothelial cells cultivated on a
fibronectin coated sensor, before and after injection of VEGF. A peak was identified
at 0.9-1.0 V vs Ag|AgCl, similar in shape and consistent with results obtained by
others [145] for DPV of NO on gold electrodes vs Ag|AgCl. This peak increased
by ≈ 40 % after addition of VEGF, thus indicating an increase in NOS activity
and therefore in NO release. To confirm higher NOS activity, control results were
obtained by inhibiting NOS with 100 µM L-NAME.
Furthermore, we have also tested interferences from different biological molecules
on an uncoated sensor. The peak potential obtained in the DPV is reported on
Table.3.2. Proteins like albumin and amino acids like l-arginine did not noticeably
CHAPTER 3. BIOCOMPATIBLE MICROELECTRODE ARRAY 113
Figure 3.6: A) Schematic showing a cross-section of the system used for the VEGFexperiments; B) differential pulse voltammograms for a fibronectin coated MMAwith 1000 pig aortic endothelial cells, in culture medium, after addition of 200 ng.ml-1VEGF, without (· · ·)or with 100 µM L-NAME (- - -) and control; C) differentialpulse voltammograms of culture media, with an uncoated MMA, without (—) orwith (- - -) 1 % sulfamic acid and sodium hydroxide; D) time line summarizing themeasurement process involving 2 successive DPV.
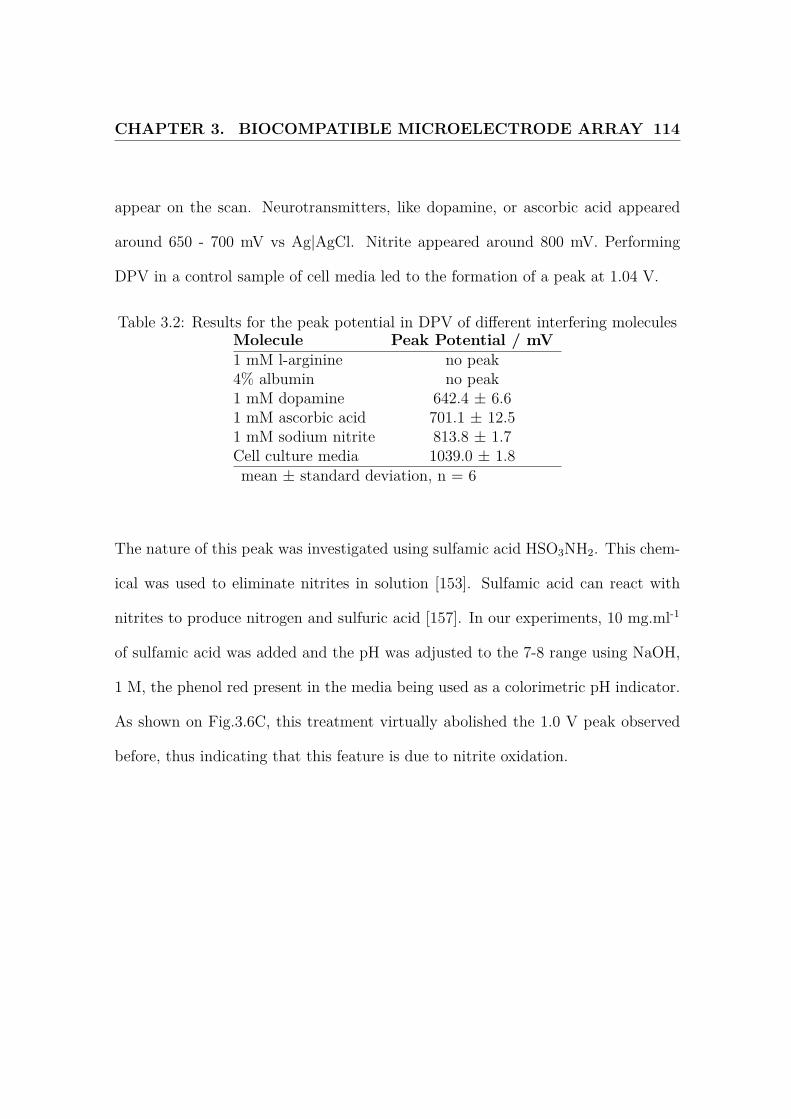
CHAPTER 3. BIOCOMPATIBLE MICROELECTRODE ARRAY 114
appear on the scan. Neurotransmitters, like dopamine, or ascorbic acid appeared
around 650 - 700 mV vs Ag|AgCl. Nitrite appeared around 800 mV. Performing
DPV in a control sample of cell media led to the formation of a peak at 1.04 V.
Table 3.2: Results for the peak potential in DPV of different interfering moleculesMolecule Peak Potential / mV1 mM l-arginine no peak4% albumin no peak1 mM dopamine 642.4 ± 6.61 mM ascorbic acid 701.1 ± 12.51 mM sodium nitrite 813.8 ± 1.7Cell culture media 1039.0 ± 1.8mean ± standard deviation, n = 6
The nature of this peak was investigated using sulfamic acid HSO3NH2. This chem-
ical was used to eliminate nitrites in solution [153]. Sulfamic acid can react with
nitrites to produce nitrogen and sulfuric acid [157]. In our experiments, 10 mg.ml-1
of sulfamic acid was added and the pH was adjusted to the 7-8 range using NaOH,
1 M, the phenol red present in the media being used as a colorimetric pH indicator.
As shown on Fig.3.6C, this treatment virtually abolished the 1.0 V peak observed
before, thus indicating that this feature is due to nitrite oxidation.
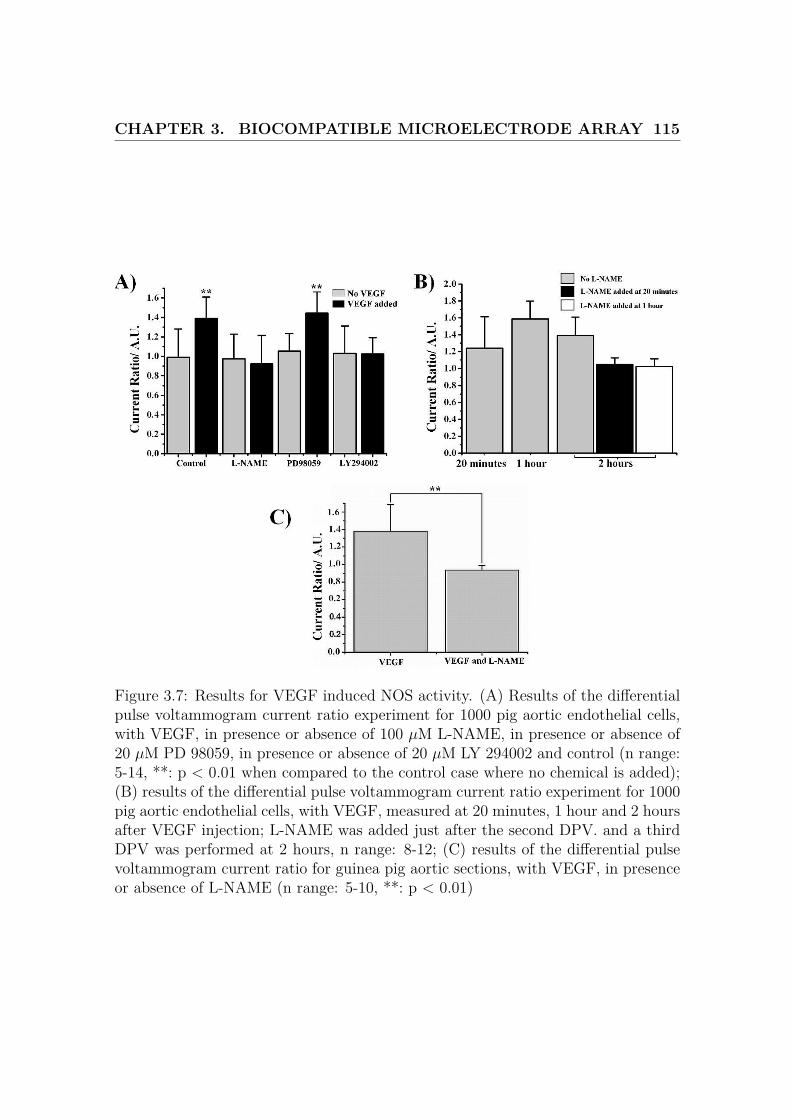
CHAPTER 3. BIOCOMPATIBLE MICROELECTRODE ARRAY 115
Figure 3.7: Results for VEGF induced NOS activity. (A) Results of the differentialpulse voltammogram current ratio experiment for 1000 pig aortic endothelial cells,with VEGF, in presence or absence of 100 µM L-NAME, in presence or absence of20 µM PD 98059, in presence or absence of 20 µM LY 294002 and control (n range:5-14, **: p < 0.01 when compared to the control case where no chemical is added);(B) results of the differential pulse voltammogram current ratio experiment for 1000pig aortic endothelial cells, with VEGF, measured at 20 minutes, 1 hour and 2 hoursafter VEGF injection; L-NAME was added just after the second DPV. and a thirdDPV was performed at 2 hours, n range: 8-12; (C) results of the differential pulsevoltammogram current ratio for guinea pig aortic sections, with VEGF, in presenceor absence of L-NAME (n range: 5-10, **: p < 0.01)
CHAPTER 3. BIOCOMPATIBLE MICROELECTRODE ARRAY 116
3.3.4 Study of VEGF induced NOS activity in endothelial
cells
The protocol for these experiments was to incubate, if required, the cells with L-
NAME, a NOS inhibitor, for 1 hour. The NO/nitrite levels were then measured using
a first DPV. If necessary, VEGF was then injected, and the MMA was incubated for
2 hours. A second DPV was then performed. The current peaks due to NO/nitrite
oxidation were then measured. This process is summarized on Fig3.6D. The results
for the DPV experiments are summarized on Fig.3.7.
Fig.3.7A shows that injecting VEGF leads to a ≈ 40 % increase in measured peak
current (p < 0.01). However, in presence of L-NAME, no significant change is
observed (p = 0.67). This shows a significant increase in NOx levels, after VEGF
injection. Complete inhibition by L-NAME indicates that increased NOS activity
is the cause of increased anodic peak current in response to VEGF.
Furthermore, effects of kinase inhibitors PD 98059 and LY 294002 (respectively
inhibiting ERK 1/2 and PI-3 kinases) were used to investigate the upstream pathway
of NO synthesis. As shown on Fig.3.7A, PD 98059 did not affect VEGF induced NO
production, but LY 294002 completely inhibited it. This shows that NOS activation
is mainly mediated through PI-3, and not significantly through ERK 1/2.
The time response of the system was also investigated (Fig.3.7B). Additional DPV

CHAPTER 3. BIOCOMPATIBLE MICROELECTRODE ARRAY 117
were performed at 20 minutes and 1 hour. The peak current was again normalized
using the results obtained at 0 minute. We see that the current ratio reaches a
maximum at one hour and then decreases. To complete this set of data, L-NAME
was added in some samples 20 minutes and 1 hour after VEGF injection. NOx was
measured at t = 2 hours. We see that the obtained ratio is in this case very close to
1, and close to 1.4 when L-NAME is not added. This shows that L-NAME can even
block induced NOS and that the NOx signal measured fades with time because of
diffusion.
A similar protocol was applied to aortic sections. The calculated current ratios
(fig.3.7C) again shows an increase of ≈ 40 % in the peak current after addition of
100 ng of VEGF. This phenomenon was again completely inhibited by L-NAME
(p < 0.01).
3.3.5 Cell migration assay
These results were completed by following VEGF action in a migration wound heal-
ing assay (Fig.3.8). In this experiment, angiogenesis is triggered by scratching a cell
monolayer. This scratch is shown in Fig.3.8 by white dashes. Drug angiogenicity
is assessed by monitoring how quickly the cell monolayer invades this wound. The
fraction of area recovery is shown in Fig.4.4. We can see that VEGF induced an
almost complete recovery of the scratch in 24 hours, as numerous cells are present in
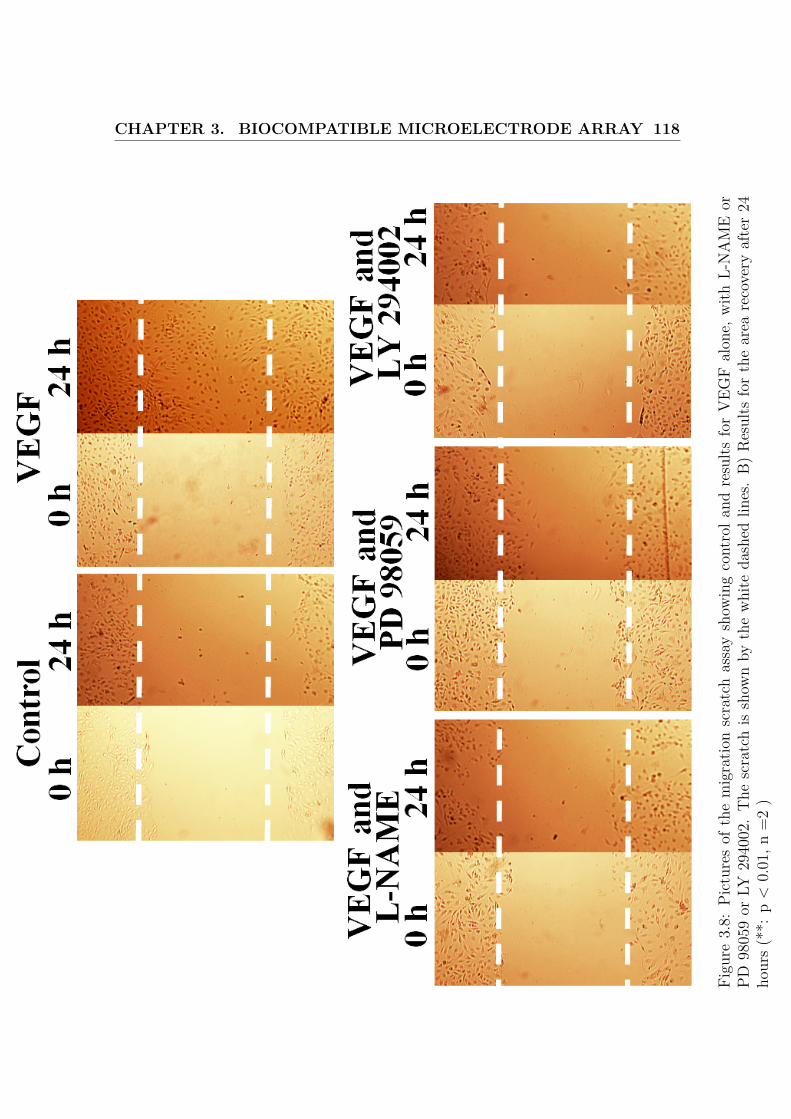
CHAPTER 3. BIOCOMPATIBLE MICROELECTRODE ARRAY 118
Figu
re3.
8:Pi
ctur
esof
the
mig
ratio
nsc
ratc
has
say
show
ing
cont
rola
ndre
sults
for
VEG
Fal
one,
with
L-N
AM
Eor
PD98
059
orLY
2940
02.
The
scra
tch
issh
own
byth
ew
hite
dash
edlin
es.
B)
Res
ults
for
the
area
reco
very
afte
r24
hour
s(*
*:p
<0.
01,n
=2
)
CHAPTER 3. BIOCOMPATIBLE MICROELECTRODE ARRAY 119
the wound site, thus confirming the angiogenic effect of this molecule. This recovery
was almost fully inhibited by L-NAME, showing that NO is a critical mediator of
VEGF biochemistry, and by LY 294002 and PD 98059, demonstrating that both
PI-3 and ERK 1/2 are critical for this VEGF mediated angiogenesis.
3.4 Discussion
3.4.1 Sensor characterization
Results for NO release and cells have already been reported previously, but in that
case the cells were then cultivated in collagen pellets deposited on a sensor coated
with PSS/PL [46]. The presence of this thick matrix between the cells and the
electrode is expected to seriously hinder diffusion and therefore measurement. Fur-
thermore, we have demonstrated since the relatively poor properties of PSS/PL as
an electrode membrane. In this section, we have used fibronectin which we have
shown does not significantly affect electrochemical measurements and provides good
protection from biofouling whilst providing a biocompatible surface for cell culture
[33, 34].
The biocompatibility experiments show that PSS/PL, as previously used for MMA
coating[46], is not suitable for cell based measurements. On the other hand, fi-
bronectin allows good cell adhesion. Fibronectin should therefore be preferred as it
CHAPTER 3. BIOCOMPATIBLE MICROELECTRODE ARRAY 120
seriously improves long term (48h) biocompatibility.
Furthermore, whilst fibronectin has been assessed on macroelectrodes, the hemi-
spherical diffusion patterns of microelectrodes may have an effect on electrochemical
sensing with a fibronectin coated MMA. This study was carried out by comparing
the electrocatalytic reduction of dissolved oxygen with the reduction of ruthenium
III hexaammine. The different mechanisms of these redox reactions are expected
to give indications on the relative effect of the coating on diffusion and reaction
kinetics.
For the cyclic voltammograms of ruthenium III hexaammine performed with the
uncoated MMA, the mean measured Tomeš potential is consistent with the expected
theoretical value for a reversible process[152]. Similarly, the theoretical diffusion
limited current for a recessed microelectrode is given by [1]:
id =4nFcDπa2
4L + πa(3.4)
where n is the number of electron exchanged, c is the analyte concentration, D is the
diffusion coefficient (here 7.9 x 10⁻¹⁰ m2.s-1 [46]), a is the electrode radius and L is the
recess depth. The theoretical value is 31.8 nA and is consistent with the measured
current (30.77 ± 2.23 nA). In presence of the fibronectin layer, significant decreases
in Tomeš potential (- 9 %, p < 0.01) and cathodic current magnitude (- 20 %,
p < 0.01) may be evidence of limited blocking of the sensor surface, probably at the
edge of the recessed electrode. However, good repeatability and good reproducibility
CHAPTER 3. BIOCOMPATIBLE MICROELECTRODE ARRAY 121
demonstrate the possibility of achieving satisfactory electrochemical measurements
with this kind of micro-engineered device.
These results show the limited effect of the fibronectin layer on the electrochemistry
of the microelectrode sensor, for ruthenium III hexaammine or dissolved oxygen
reduction. The minor decrease in cathodic current magnitude for ruthenium III
hexaammine reduction shows that fibronectin barely insulates the electrode. This
result is observed for all six electrodes, so consistency of the current measurements
is assured. In addition, the Tomeš potential is between 50 and 55 mV for ruthe-
nium III hexaammine, which is consistent with the expected result for a reversible
redox reaction [1] and indicates that the fibronectin layer does not alter the reaction
mechanisms. When compared to results previously reported with PSS/PL [46], we
see that the fibronectin membrane offers improved performances, as the PSS/PL
seriously insulated the electrodes and hindered electrochemical detection.
The conclusion of these experiments is that a fibronectin coated MMA is suitable for
electrochemical measurements and is a major improvement of the device, compared
to the PSS/PL used previously. This is consistent with the results obtained in the
previous chapter for macroelectrodes, despite a minor decrease in diffusion limited
current which may be attributed to accumulation of fibronectin on the edges of the
recessed electrode.
CHAPTER 3. BIOCOMPATIBLE MICROELECTRODE ARRAY 122
3.4.2 Validation of the biosensing protocol
The biological measurement environment is drastically different from homogeneous
solutions normally used in electrochemistry. In particular, several reactions and
phenomena, such as fouling, cell response to changes in biological conditions, hetero-
geneity in the cell density, are all expected to hinder the measurements. Calibration
working curves, for DPV, were obtained through successive addition of aliquots NO
saturated deionized water, as shown on Fig.3.9. The results show a linear peak cur-
rent increase, thus demonstrating the efficacy of the sensor. Oxidation current was
measured amperometrically for addition of successive aliquots in the 3-9 µM range
for 3 independent sensors. The resulting sensitivities were 64.7 ± 5.8 pA.µM-1 for
the uncoated sensor and 116.4 ± 12.6 pA.µM-1 for the Fn coated one. The limits of
detection were 1.20 ± 0.08 µM for the uncoated sensor and 2.53 ± 0.12 µM for the
Fn coated one. Fn therefore improves sensor ability by improving its sensitivity by
79.9 %. The 10 %-90 % response time to a 4 µM step change in NO concentration
was 8.9 seconds for the uncoated MMA and significantly longer (p < 0.05, n = 3)
at 14.3 seconds for the Fn coated device. These results display a linear response to
NO concentration in the 3-9 µM range, which is consistent with theory.
However, for the reason presented above, these curves were not employed. Instead,
the relative NO concentration variations following pharmacological or physiological
changes were calculated from DPV peak currents. DPV was used for biomeasure-
ments in preference to amperometry to minimize exposure of the cells to electric
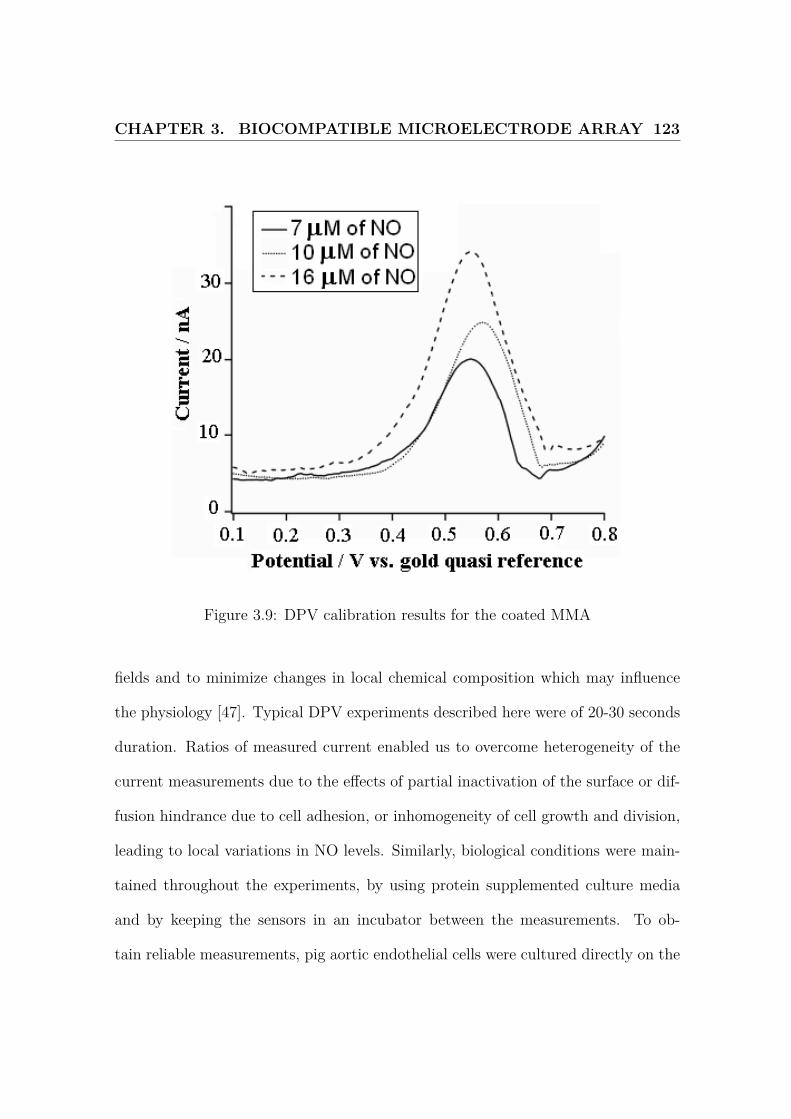
CHAPTER 3. BIOCOMPATIBLE MICROELECTRODE ARRAY 123
Figure 3.9: DPV calibration results for the coated MMA
fields and to minimize changes in local chemical composition which may influence
the physiology [47]. Typical DPV experiments described here were of 20-30 seconds
duration. Ratios of measured current enabled us to overcome heterogeneity of the
current measurements due to the effects of partial inactivation of the surface or dif-
fusion hindrance due to cell adhesion, or inhomogeneity of cell growth and division,
leading to local variations in NO levels. Similarly, biological conditions were main-
tained throughout the experiments, by using protein supplemented culture media
and by keeping the sensors in an incubator between the measurements. To ob-
tain reliable measurements, pig aortic endothelial cells were cultured directly on the
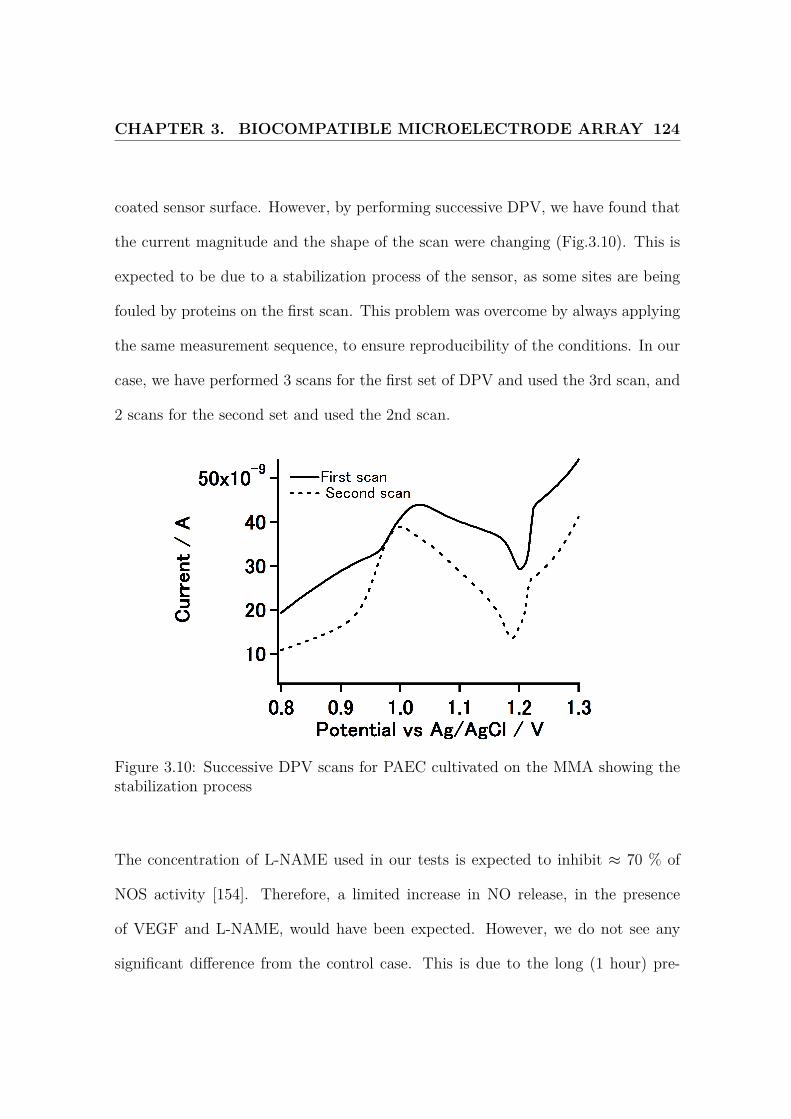
CHAPTER 3. BIOCOMPATIBLE MICROELECTRODE ARRAY 124
coated sensor surface. However, by performing successive DPV, we have found that
the current magnitude and the shape of the scan were changing (Fig.3.10). This is
expected to be due to a stabilization process of the sensor, as some sites are being
fouled by proteins on the first scan. This problem was overcome by always applying
the same measurement sequence, to ensure reproducibility of the conditions. In our
case, we have performed 3 scans for the first set of DPV and used the 3rd scan, and
2 scans for the second set and used the 2nd scan.
Figure 3.10: Successive DPV scans for PAEC cultivated on the MMA showing thestabilization process
The concentration of L-NAME used in our tests is expected to inhibit ≈ 70 % of
NOS activity [154]. Therefore, a limited increase in NO release, in the presence
of VEGF and L-NAME, would have been expected. However, we do not see any
significant difference from the control case. This is due to the long (1 hour) pre-
CHAPTER 3. BIOCOMPATIBLE MICROELECTRODE ARRAY 125
incubation of cells with L-NAME before the measurements. This is expected to
induce accumulation of L-NAME inside the cell. L-NAME features an ester moiety,
allowing the molecule to cross the cell membrane. However, this ester is cleaved by
esterases inside the cytoplasm, thus preventing diffusion to the extracellular space
and inducing higher intracellular concentration of the active inhibitor [158].
Furthermore, from the interfering electroactive biomolecules we have tested, only
nitrite is expected to interfere with our measurements. Indeed, nitrites generated
from NO reacting with oxygen (≈0.2 mM in this solution) or already present in the
culture media are also oxidised during the scan and will therefore contribute to the
current. It is very likely that they account for the main contribution to this current,
as shown by the sulfamic acid control. This was not considered problematic because
nitrite levels arise solely from previous release of NO and are therefore indicative of
NOS activity (as in a Griess test[135]) and of the biochemical cascade inducing NO
synthesis.
This method does not provide direct measurements of NO, but still offers the pos-
sibility of in situ sensing of NO release. This is in particular one of the first reports
of biosensing performed with a microelectrode array in cultured cells. This technol-
ogy is expected to offer an alternative, or at least a good complement, to most of
the common biological techniques. Gel migrations focus on large macromolecules,
require long preparation times and sometimes expensive reactants. Our method
enables the characterization of early biochemical events, for some low molecular
CHAPTER 3. BIOCOMPATIBLE MICROELECTRODE ARRAY 126
weight molecules. The other standard methods, fluorescence microscopy or con-
focal microscopy, require very expensive equipments and maintenance, and again
specialist skills. Confocal microscopy can be used for NO sensing with diaminoflu-
oresceins. However, these molecules are expensive and not commonly available.
Microelectrode arrays offer the possibility of numerous parallel measurements with
cheaper equipements. Preparation the sensor is easy, and results can be obtained
quickly (after few hours). Furthermore, the protocol and the data processing are
simple, this technology is therefore ideally suited for automation and massively par-
allel measurements. However, this device is still limited by the intrinsic limitations
of electrochemical sensors. The molecule of interest has to be electroactive and
furthermore, long term stability of the sensor can be problematic.
3.4.3 Intracellular pathway of VEGF induced NO synthesis
The mechanism of action of VEGF is only partially understood, and it appears that
VEGF initially binds to membrane receptors and triggers a kinase cascade leading
to increased intracellular levels of calcium, consequently activating NOS to release
NO [159, 160]. As shown on Fig.1.12, several kinase pathways have been reported
in VEGF activity. FAK and the p38 mitogenic-activated protein (MAP) kinase
regulate migration, Src modulates endothelial permeability. Phosphatidylinositol 3
(PI-3) and Akt kinases have been shown to mediate VEGF induced NO synthesis
[161]. Similarly, the MAP extracellular signal-regulated kinase (ERK 1/2) is a
CHAPTER 3. BIOCOMPATIBLE MICROELECTRODE ARRAY 127
critical transducer for VEGF induced angiogenesis, as it induces proliferation, but its
mitogenic activity seems to be independent of NO [162, 163, 164], probably through
inhibition of apoptosis [165]. PI-3 and ERK 1/2 can be inhibited by LY 294002
[166] and PD 98059 [162] respectively.
The L-NAME test demonstrates the effect of this angiogenic factor on NOS activity
and supports the central role of NO in the regulation of angiogenesis. Using the
increase in current ratio as a marker of NOS activity enables us to establish the
kinase cascade leading to VEGF induced NOS activity. The experiments with kinase
inhibitors show that PI-3 and Akt kinases are critical for the mediation of this
pathway, but MAP kinases such as ERK 1/2 are independent of NO synthesis.
However, the migration assay demonstrates the importance of both PI-3 and ERK
1/2 in angiogenesis, as addition of PD 98,059 inhibits wound recovery. This also
shows that angiogenesis is a very complex biochemical phenomenon, not relying
solely on the synthesis of NO, as other mediators or pathways are involved. These
experiments enable us to establish the kinase cascade leading to VEGF induced NOS
activity, with PI-3 mediating this signal. MAP such as ERK 1/2 are independent
of NO synthesis, but their action is critical for cell proliferation as shown by the
wound healing assay. This pathway is presented in Fig.3.7.
The time response of our device is different from what has been reported previously
for VEGF, as NO synthesis is expected to reach a maximum after 20 minutes of
exposure [164]. This delay time also includes time for intrinsic biological processes,
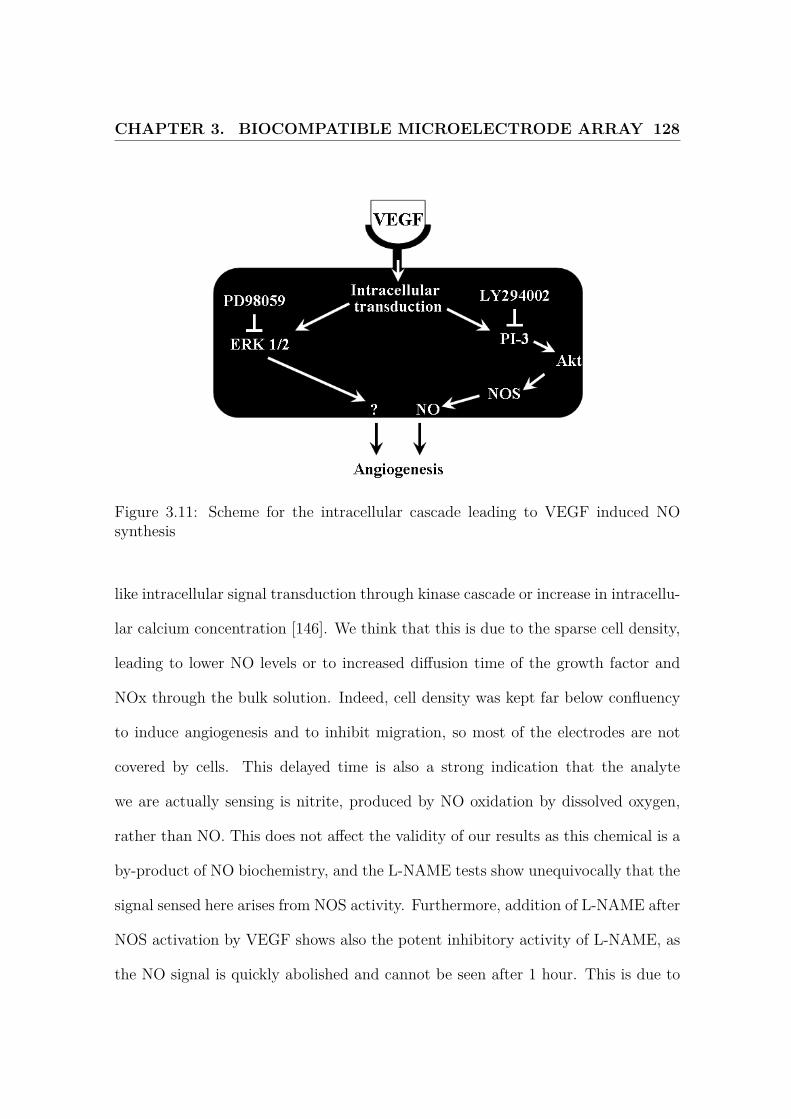
CHAPTER 3. BIOCOMPATIBLE MICROELECTRODE ARRAY 128
Figure 3.11: Scheme for the intracellular cascade leading to VEGF induced NOsynthesis
like intracellular signal transduction through kinase cascade or increase in intracellu-
lar calcium concentration [146]. We think that this is due to the sparse cell density,
leading to lower NO levels or to increased diffusion time of the growth factor and
NOx through the bulk solution. Indeed, cell density was kept far below confluency
to induce angiogenesis and to inhibit migration, so most of the electrodes are not
covered by cells. This delayed time is also a strong indication that the analyte
we are actually sensing is nitrite, produced by NO oxidation by dissolved oxygen,
rather than NO. This does not affect the validity of our results as this chemical is a
by-product of NO biochemistry, and the L-NAME tests show unequivocally that the
signal sensed here arises from NOS activity. Furthermore, addition of L-NAME after
NOS activation by VEGF shows also the potent inhibitory activity of L-NAME, as
the NO signal is quickly abolished and cannot be seen after 1 hour. This is due to
CHAPTER 3. BIOCOMPATIBLE MICROELECTRODE ARRAY 129
the geometry of the system: NO and nitrite are generated from the 2-dimensional
cell monolayer at the bottom of of the device, leading locally to a higher concen-
tration. These chemicals then diffuse away, to the bulk solution, and the measured
current decreases.
3.4.4 Aortic sections
The versatility of the system was confirmed using freshly excised aortic sections. The
similarity of response from aortic sections and from endothelial cell culture confirms
similar underlying biochemistry. Furthermore, it demonstrates the validity of our
protocol, this method enabling measurements in various setups to assess the activity
of cultured cells or freshly excised biosamples, and underlines the possibility of using
such a device as a general tool for drug screening and pharmacological interactions
in real tissue samples. This kind of mass produced microdevice is ideally suited for
rapid testing of drugs or inhibitors and to elucidate biochemical cascades. In addi-
tion, this technology is not restricted to NO physiology only, as this could be applied
to any electroactive biomolecule of interest, such as neurotransmitters or reactive
species. Identifying a marker of activity (here, release of NO) and investigating the
effect of selective inhibitors provides a quick and robust way to disentangle respective
contributions of different intracellular transduction steps.
CHAPTER 3. BIOCOMPATIBLE MICROELECTRODE ARRAY 130
3.5 Conclusion
It has been demonstrated that fibronectin has minor effects on electrochemical mea-
surements with microelectrodes and can therefore be used as a coating for cell-culture
and in vitro based electrochemical tests. Despite a minor increase in measurement
variability, fibronectin does not hinder electrochemical reactions for both outer-
sphere (ruthenium III hexaammine) and electrocatalytic (dissolved oxygen) couples.
These results are similar to the ones obtained in the previous chapter with macro-
electrodes. This membrane also offers optimal biocompatibility and allow growth of
cells on the electrode for several days.
We have underlined the effect of VEGF on NOS activity, and the kinase transduction
of VEGF induced NO release from cultured cells has been clarified in conditions
suitable for cell survival (37 oC, 95 % O2, 5 % CO2). Our results show the critical
role of PI-3 in NO synthesis and support the independence between NOS and MAP
kinases like ERK 1/2.
Finally, we have described a device and a protocol generally applicable to the inves-
tigation of pharmacology on cell biochemistry, for various types of samples (cultured
cells or excised tissue). The MMA is particularly suitable for biochemical studies
involving numerous measurements for a great number of setups.
Chapter 4
Study of the Biochemical Pathway
of Angiogenin
4.1 Introduction
Angiogenesis, the formation of new blood vessels, is currently an important topic for
biochemical research because of its central role in cancer development [50]. However,
controlling angiogenesis is a rather challenging task as this complex biological phe-
nomenon is known to depend on several parameters including interaction with the
extracellular matrix [125], mechanical or shear stresses [123] and other biochemical
factors. It has been reported that some growth factors, like vascular endothelial
131
CHAPTER 4. BIOCHEMISTRY OF ANGIOGENIN 132
growth factor, increase endothelial growth and angiogenesis [118]. Studying the
biochemical interactions between endothelium and angiogenic factors is therefore
essential for understanding and modulating angiogenesis for therapeutic purposes.
In this section, we focus on angiogenin (ANG), one of these angiogenic factors. ANG
is a 123 amino acid long single-chain protein of about 14.4 kDa [167]. This molecule
is essential for cell proliferation, even for angiogenesis induced by other angiogenic
factors [168]. In particular, it has been reported that nuclear translocation of ANG
is a critical step for angiogenesis induced by acidic or basic fibroblasts, epidermal or
vascular endothelial growth factors [168]. However, the cellular physiology of ANG
is still unclear.
As already presented in the previous chapter, NO plays a central role in angiogenesis
[169] by triggering the synthesis of angiogenic factors and the differentiation of
endothelial cells into vascular tube cells [170]. Ziche et al. have also shown that, as
with many other angiogenic factors, NO can lead to DNA synthesis and migration of
coronary endothelial cells [171, 172]. In addition, NO may also promote angiogenesis
through its endothelial antiapoptotic properties [173]: angiogenesis is mainly based
on proliferation of endothelial cells and therefore on inhibition of their apoptosis.
As a consequence, NO is a key factor in angiogenesis. The purpose of this study
is to investigate relationships between ANG and extracellular NO release. Human
umbilical vein endothelial cells (HUVECs) were grown directly on the fibronectin
coated multiple microelectrode array, ANG was added and NO levels were mon-
CHAPTER 4. BIOCHEMISTRY OF ANGIOGENIN 133
itored. Sparse cell concentration (about 5x10³ cells.cm-2 [174]) and endothelial
growth medium were used to promote angiogenesis. NO was measured electro-
chemically using differential pulse voltammetry (DPV). Several inhibitors of ANG
activities were used to investigate their role in NOS activity. Our results suggest
that ANG induces NOS activity in a dose and time dependent manner. Further-
more, signal transduction through PI-3 and Akt kinases and nuclear translocation
of ANG appear to be critical for NO synthesis.
4.2 Experimental procedures, methods and chem-
icals
4.2.1 Chemicals
All the chemicals used in this study were purchased from Sigma, unless stated other-
wise, and were used without further purification. Deionized water purified through a
Millipore system was used throughout all the experiments. Angiogenin was purified
as previously described [175].
CHAPTER 4. BIOCHEMISTRY OF ANGIOGENIN 134
4.2.2 Cell culture
HUVEC were purchased from Clonetics (San Diego, USA) and cultivated in EGM-2
(Endothelial Growth Media 2, Clonetics) on gelatin coated 75 ml flasks, at 37 oC,
95% O2, 5% CO2. Cells from passage 6 to 9 were used.
4.2.3 MMA design
Multiple microelectrode arrays (MMA) were used for the electrochemical sensing of
NO and were described in the previous chapter.
4.2.4 Modification and preparation of the sensors
The MMA were modified using a Sylgard (Dow Corning, Midland, USA) custom-
made reaction cell to allow deposition of a 500 µl volume on the sensor. A lid made
from a Petri dish was also fitted on the cell to minimise evaporation.
Prior to any experiment, biological debris was removed using trypsin solution.
Trypsin solution was deposited into the cell and incubated at 37 oC for at least
20 minutes. They were then rinsed with 70% aqueous ethanol followed by water.
The gold electrodes were electrochemically cleaned by performing cyclic voltammo-
grams between 1 V and -0.8 V at 0.5 V/s in 0.5 M sulfuric acid until stability of the

CHAPTER 4. BIOCHEMISTRY OF ANGIOGENIN 135
graphs. The electrode potential was then held at -0.6 V to reduce gold oxides.
The sensor was then sterilized with 70% aqueous ethanol and rinsed with PBS (pH
= 7.4). 40 µl of human fibronectin (20 µg.ml-1, in DMEM) was deposited on the
sensor and allowed to dry. Excess of fibronectin was removed by rinsing with PBS.
4.2.5 Electrochemical measurements
Cells were harvested using trypsin and counted with a cytometer and Trypan blue.
2000 cells were suspended in 500 µl of EGM-2 and deposited on the sensor. The chip
was then incubated for at least 12 hours (37 oC, 95% O2, 5% CO2). Just before the
measurement, culture media were replaced with fresh EGM-2, and DPV was then
recorded between 0.6 V and 1.5 V vs Ag/AgCl (increment 0.004 V, amplitude 0.006
V, pulse width 0.06 s, pulse period 0.2 s). Measurements were stopped just after a
complete peak was obtained to minimize the possible impact of the measurements on
HUVEC. In these conditions, a single DPV scan lasts less than 30 seconds. Adequate
volumes of angiogenin solution (1.14 mg.ml-1 in deionized water) were added with
the relevant inhibitor if required (protocol described below). The MMA was then
placed back in the incubator and another DPV was recorded after 30 minutes (or
every 10 minutes for the time dependence study).
In a set of experiments, angiogenin was replaced with 200 ng.ml-1 of VEGF dissolved
in water.
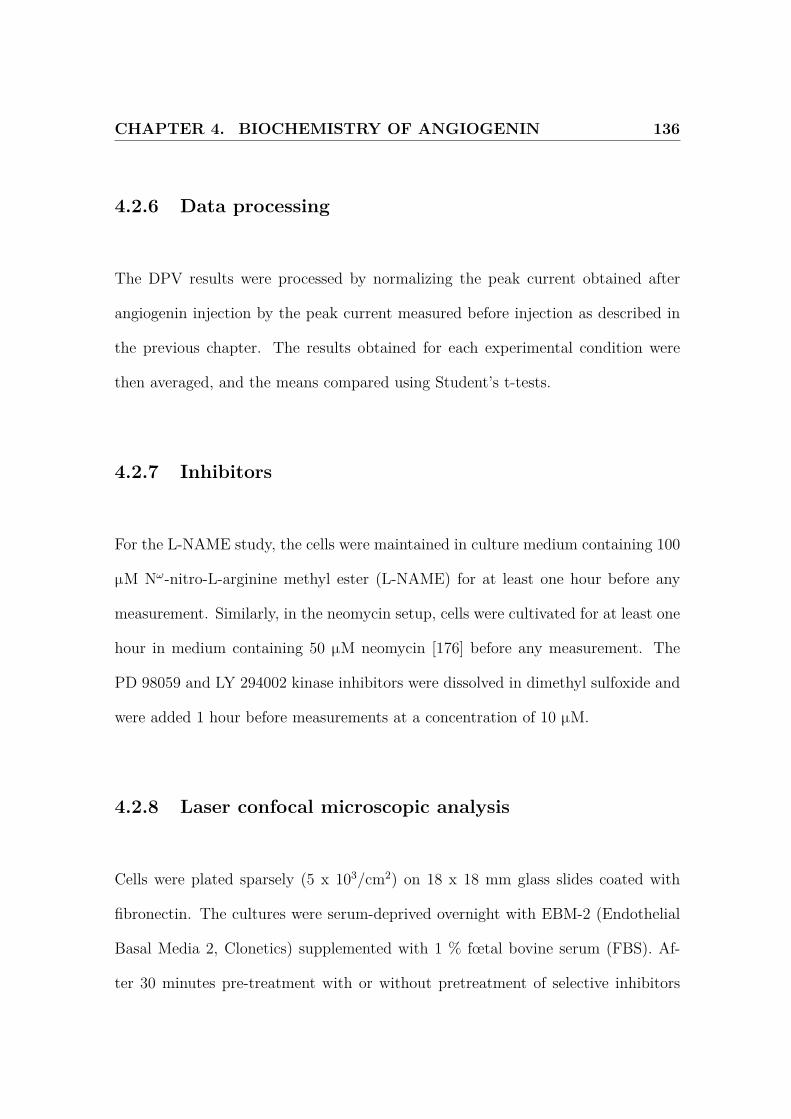
CHAPTER 4. BIOCHEMISTRY OF ANGIOGENIN 136
4.2.6 Data processing
The DPV results were processed by normalizing the peak current obtained after
angiogenin injection by the peak current measured before injection as described in
the previous chapter. The results obtained for each experimental condition were
then averaged, and the means compared using Student’s t-tests.
4.2.7 Inhibitors
For the L-NAME study, the cells were maintained in culture medium containing 100
µM Nω-nitro-L-arginine methyl ester (L-NAME) for at least one hour before any
measurement. Similarly, in the neomycin setup, cells were cultivated for at least one
hour in medium containing 50 µM neomycin [176] before any measurement. The
PD 98059 and LY 294002 kinase inhibitors were dissolved in dimethyl sulfoxide and
were added 1 hour before measurements at a concentration of 10 µM.
4.2.8 Laser confocal microscopic analysis
Cells were plated sparsely (5 x 10³/cm2) on 18 x 18 mm glass slides coated with
fibronectin. The cultures were serum-deprived overnight with EBM-2 (Endothelial
Basal Media 2, Clonetics) supplemented with 1 % fœtal bovine serum (FBS). Af-
ter 30 minutes pre-treatment with or without pretreatment of selective inhibitors
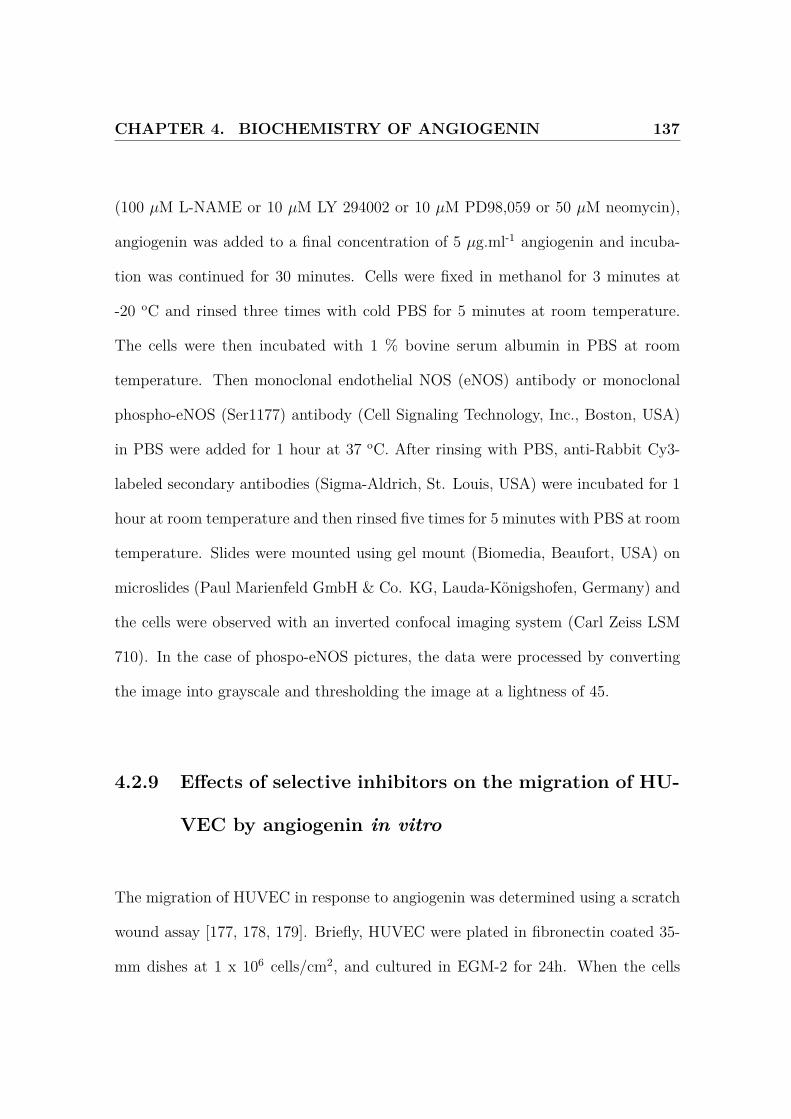
CHAPTER 4. BIOCHEMISTRY OF ANGIOGENIN 137
(100 µM L-NAME or 10 µM LY 294002 or 10 µM PD98,059 or 50 µM neomycin),
angiogenin was added to a final concentration of 5 µg.ml-1 angiogenin and incuba-
tion was continued for 30 minutes. Cells were fixed in methanol for 3 minutes at
-20 oC and rinsed three times with cold PBS for 5 minutes at room temperature.
The cells were then incubated with 1 % bovine serum albumin in PBS at room
temperature. Then monoclonal endothelial NOS (eNOS) antibody or monoclonal
phospho-eNOS (Ser1177) antibody (Cell Signaling Technology, Inc., Boston, USA)
in PBS were added for 1 hour at 37 oC. After rinsing with PBS, anti-Rabbit Cy3-
labeled secondary antibodies (Sigma-Aldrich, St. Louis, USA) were incubated for 1
hour at room temperature and then rinsed five times for 5 minutes with PBS at room
temperature. Slides were mounted using gel mount (Biomedia, Beaufort, USA) on
microslides (Paul Marienfeld GmbH & Co. KG, Lauda-Königshofen, Germany) and
the cells were observed with an inverted confocal imaging system (Carl Zeiss LSM
710). In the case of phospo-eNOS pictures, the data were processed by converting
the image into grayscale and thresholding the image at a lightness of 45.
4.2.9 Effects of selective inhibitors on the migration of HU-
VEC by angiogenin in vitro
The migration of HUVEC in response to angiogenin was determined using a scratch
wound assay [177, 178, 179]. Briefly, HUVEC were plated in fibronectin coated 35-
mm dishes at 1 x 10⁶ cells/cm2, and cultured in EGM-2 for 24h. When the cells
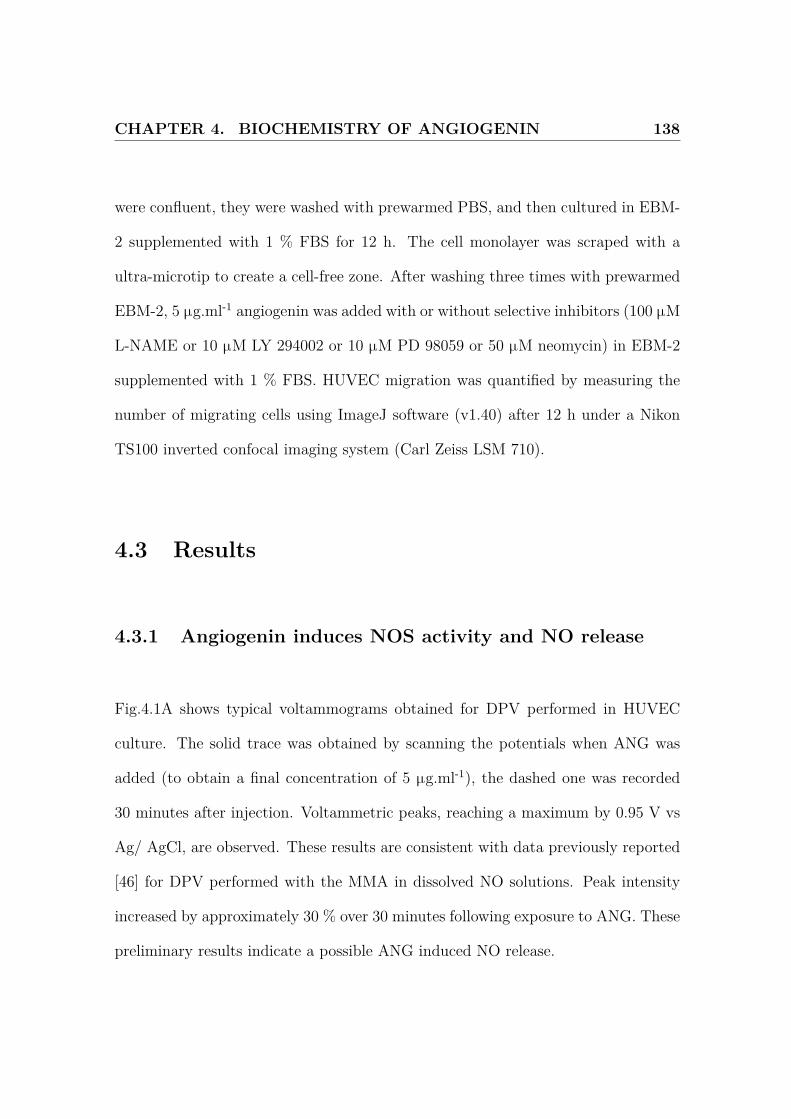
CHAPTER 4. BIOCHEMISTRY OF ANGIOGENIN 138
were confluent, they were washed with prewarmed PBS, and then cultured in EBM-
2 supplemented with 1 % FBS for 12 h. The cell monolayer was scraped with a
ultra-microtip to create a cell-free zone. After washing three times with prewarmed
EBM-2, 5 µg.ml-1 angiogenin was added with or without selective inhibitors (100 µM
L-NAME or 10 µM LY 294002 or 10 µM PD 98059 or 50 µM neomycin) in EBM-2
supplemented with 1 % FBS. HUVEC migration was quantified by measuring the
number of migrating cells using ImageJ software (v1.40) after 12 h under a Nikon
TS100 inverted confocal imaging system (Carl Zeiss LSM 710).
4.3 Results
4.3.1 Angiogenin induces NOS activity and NO release
Fig.4.1A shows typical voltammograms obtained for DPV performed in HUVEC
culture. The solid trace was obtained by scanning the potentials when ANG was
added (to obtain a final concentration of 5 µg.ml-1), the dashed one was recorded
30 minutes after injection. Voltammetric peaks, reaching a maximum by 0.95 V vs
Ag/ AgCl, are observed. These results are consistent with data previously reported
[46] for DPV performed with the MMA in dissolved NO solutions. Peak intensity
increased by approximately 30 % over 30 minutes following exposure to ANG. These
preliminary results indicate a possible ANG induced NO release.
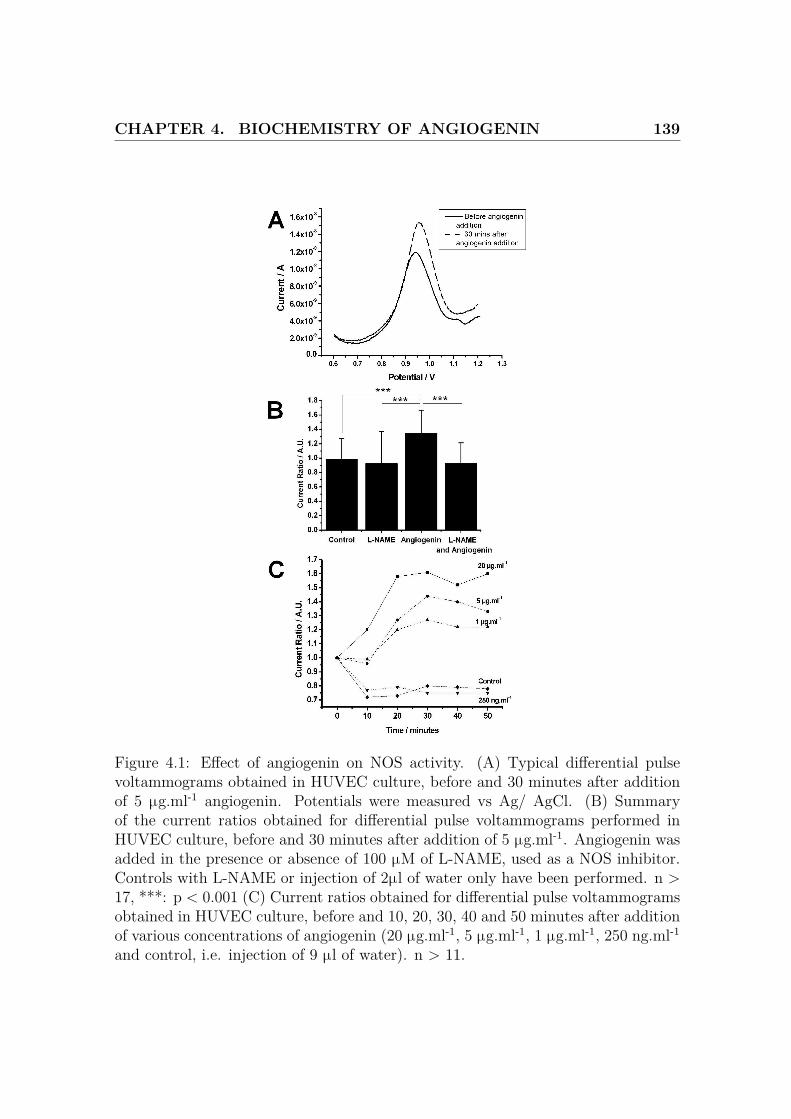
CHAPTER 4. BIOCHEMISTRY OF ANGIOGENIN 139
Figure 4.1: Effect of angiogenin on NOS activity. (A) Typical differential pulsevoltammograms obtained in HUVEC culture, before and 30 minutes after additionof 5 µg.ml-1 angiogenin. Potentials were measured vs Ag/ AgCl. (B) Summaryof the current ratios obtained for differential pulse voltammograms performed inHUVEC culture, before and 30 minutes after addition of 5 µg.ml-1. Angiogenin wasadded in the presence or absence of 100 µM of L-NAME, used as a NOS inhibitor.Controls with L-NAME or injection of 2µl of water only have been performed. n >17, ***: p < 0.001 (C) Current ratios obtained for differential pulse voltammogramsobtained in HUVEC culture, before and 10, 20, 30, 40 and 50 minutes after additionof various concentrations of angiogenin (20 µg.ml-1, 5 µg.ml-1, 1 µg.ml-1, 250 ng.ml-1and control, i.e. injection of 9 µl of water). n > 11.
CHAPTER 4. BIOCHEMISTRY OF ANGIOGENIN 140
To confirm that ANG induces NOS activity in HUVEC, we used Nω-nitro-L-arginine
methyl ester (L-NAME) as a competitive NOS inhibitor [128]. We repeated the
previous protocol (i.e. running a DPV before and 30 minutes after injection of 5
µg.ml-1 of ANG) and the current ratio (peak current at t = 30 minutes) / (peak
current at t = 0 minutes) was calculated for each of the 6 individual electrodes of the
MMA. This method was used to obtained a dimensionless value, in order to decrease
the impact of heterogeneity in cell division and sensor variability. The average and
standard deviations for each experimental situations were obtained, and Student’s
t-tests were performed.
The results for L-NAME inhibition are reported in Fig.4.1B. Controls for L-NAME
only and for injection of 2 µl of water only gave no significant difference in the
peak current ratio (0.93 and 0.99 respectively). In these setups, the peak current
does not change significantly. As expected, the current ratio for ANG only is 1.35
because of increase in peak current ( p < 0.001 if compared to the control and
L-NAME only situations). However, if 100 µM L-NAME is present when ANG is
added, the current ratio is now 0.93. This means that L-NAME inhibits the peak
increase induced by ANG (p < 0.001). As L-NAME is commonly used to inhibit
NO synthesis [128], this result shows that ANG induces NO synthesis in HUVEC,
and that this resulting increase in extracellular NO concentration can be detected
by calculating the peak current ratio.
CHAPTER 4. BIOCHEMISTRY OF ANGIOGENIN 141
4.3.2 NO production is dose and time dependent
The dose and time dependence of this NO synthesis was then investigated. Different
concentrations of ANG (20 µg.ml-1, 5 µg.ml-1, 1 µg.ml-1, 250 ng.ml-1) and control
(injection of 9 µl of water) were tested. DPVs were obtained every 10 minutes for 50
minutes, and peak current ratios were calculated by normalizing the peak current
with the peak current measured at t = 0 minute. The graphical results are presented
in Fig.4.1C. However, for the sake of clarity, standard deviations were not added on
the graph, but numerical values are reported in Table.4.1.
The 250 ng.ml-1 of ANG situation is not different from the control, both graphs
stabilizing around 0.8. However, for higher ANG concentrations, we notice a strong
increase in NO levels, starting almost immediately for 20 µg.ml-1, and after 10
minutes for 5 µg.ml-1 and 1 µg.ml-1. In the 3 cases, the maximum is reached 30
minutes after injection, and the signal starts to decrease slowly, in particular for 5
µg.ml-1 and 1 µg.ml-1 of ANG. The maximal value for the current ratio also increases
with the concentration of ANG injected (1.61 for 20 µg.ml-1, 1.44 for 5 µg.ml-1 and
1.27 for 1 µg.ml-1 of ANG).
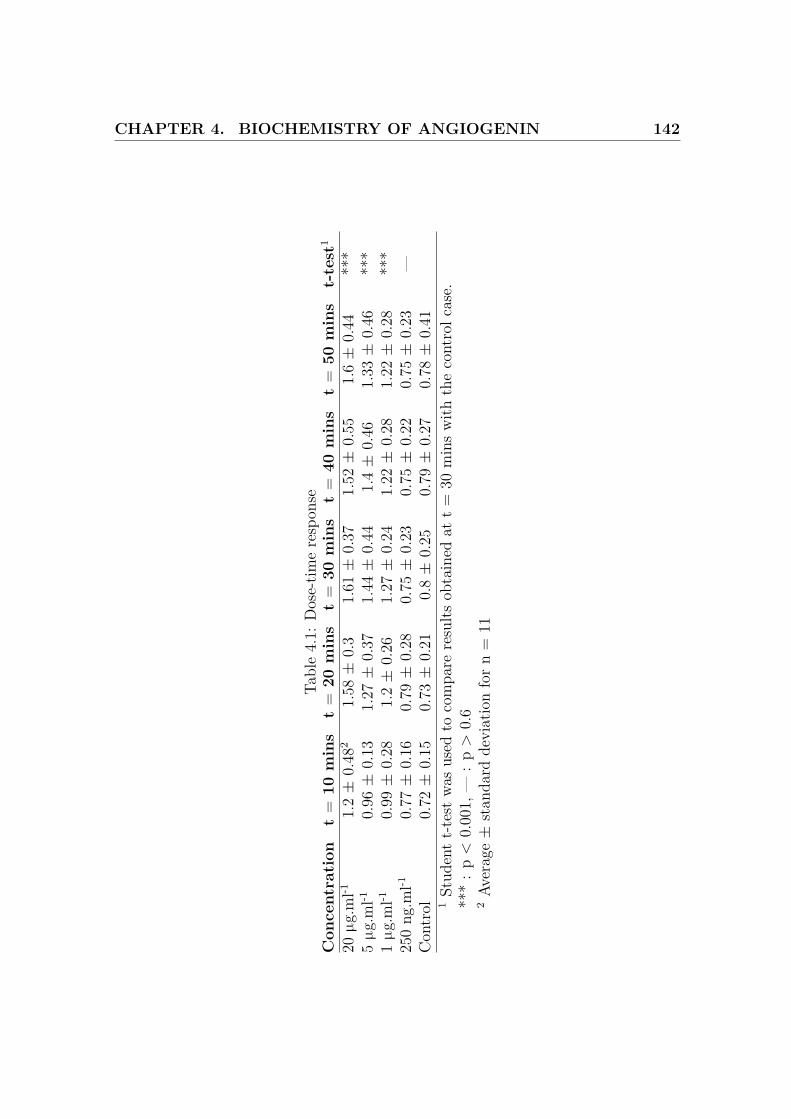
CHAPTER 4. BIOCHEMISTRY OF ANGIOGENIN 142
Tabl
e4.
1:D
ose-
time
resp
onse
Con
cent
rati
ont
=10
min
st
=20
min
st
=30
min
st
=40
min
st
=50
min
st-
test
1
20µg
.ml-1
1.2±
0.48
21.
58±
0.3
1.61±
0.37
1.52±
0.55
1.6±
0.44
***
5µg
.ml-1
0.96±
0.13
1.27±
0.37
1.44±
0.44
1.4±
0.46
1.33±
0.46
***
1µg
.ml-1
0.99±
0.28
1.2±
0.26
1.27±
0.24
1.22±
0.28
1.22±
0.28
***
250
ng.m
l-10.
77±
0.16
0.79±
0.28
0.75±
0.23
0.75±
0.22
0.75±
0.23
—C
ontr
ol0.
72±
0.15
0.73±
0.21
0.8±
0.25
0.79±
0.27
0.78±
0.41
1St
uden
tt-
test
was
used
toco
mpa
rere
sults
obta
ined
att
=30
min
sw
ithth
eco
ntro
lcas
e.**
*:
p<
0.00
1,—
:p
>0.
62
Aver
age±
stan
dard
devi
atio
nfo
rn
=11
CHAPTER 4. BIOCHEMISTRY OF ANGIOGENIN 143
4.3.3 NO synthesis depends on nuclear translocation of an-
giogenin
To investigate the ANG pathways, we have again repeated the previous protocol,
but with L-NAME being replaced with 50 µM neomycin. Neomycin is an antibiotic
frequently used to inhibit nuclear translocation of angiogenin [180, 176].
The results obtained for ANG, for ANG and neomycin and for neomycin alone are
summarized in Fig.4.2A. Complete inhibition of NO release is observed (p < 0.001),
suggesting that nuclear translocation of ANG is required for NO release.
4.3.4 PI-3 kinase is involved in angiogenin induced NOS
activity, but not ERK 1/2
Kinase inhibitors PD 98059 and LY 294002, respectively inhibiting ERK 1/2 [146]
and the phosphatidylinositol 3 (PI-3) [147] kinases, were then added instead of
neomycin in separate experiments.
As shown in Fig.4.2B, PD 98059 does not have any effect on NO release, indicating
that ERK 1/2 is not involved in ANG induced NOS activity. However, LY 294002
leads to inhibition of NO synthesis (p < 0.01) thus indicating that PI-3 kinase
mediates NOS activation (Fig.4.2C).
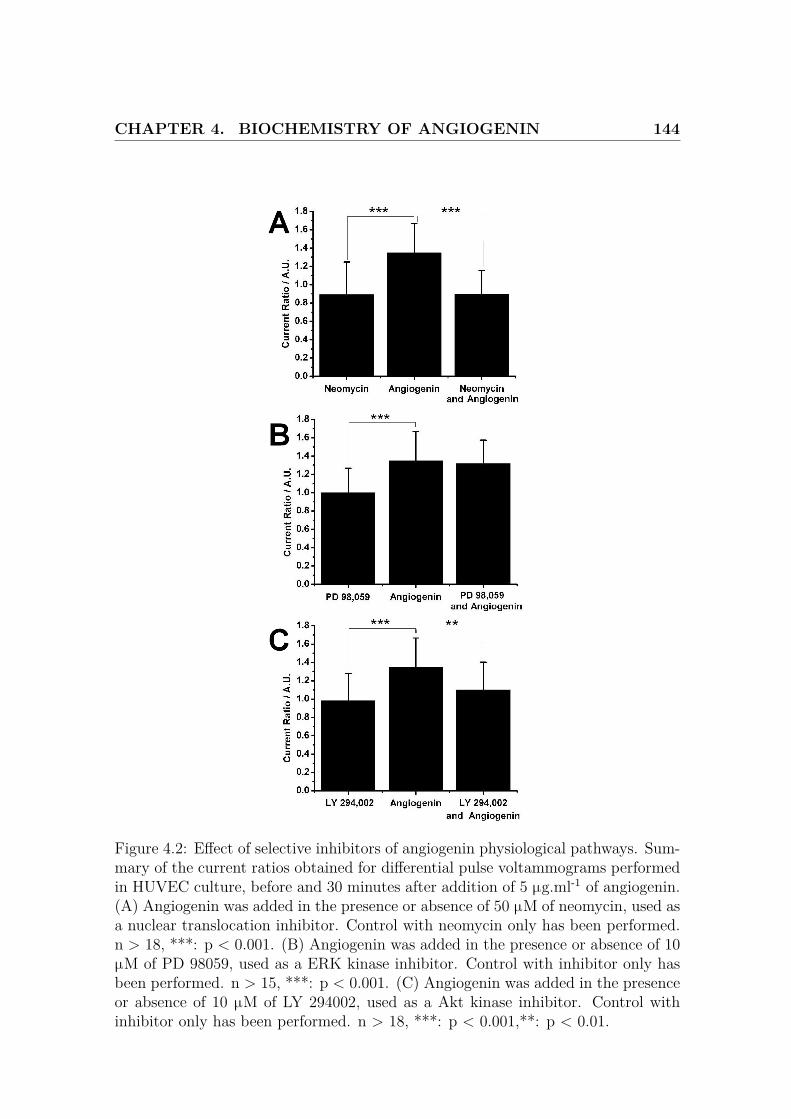
CHAPTER 4. BIOCHEMISTRY OF ANGIOGENIN 144
Figure 4.2: Effect of selective inhibitors of angiogenin physiological pathways. Sum-mary of the current ratios obtained for differential pulse voltammograms performedin HUVEC culture, before and 30 minutes after addition of 5 µg.ml-1 of angiogenin.(A) Angiogenin was added in the presence or absence of 50 µM of neomycin, used asa nuclear translocation inhibitor. Control with neomycin only has been performed.n > 18, ***: p < 0.001. (B) Angiogenin was added in the presence or absence of 10µM of PD 98059, used as a ERK kinase inhibitor. Control with inhibitor only hasbeen performed. n > 15, ***: p < 0.001. (C) Angiogenin was added in the presenceor absence of 10 µM of LY 294002, used as a Akt kinase inhibitor. Control withinhibitor only has been performed. n > 18, ***: p < 0.001,**: p < 0.01.
CHAPTER 4. BIOCHEMISTRY OF ANGIOGENIN 145
4.3.5 Angiogenin regulates eNOS activation and intracellu-
lar localization
We examined the effect of ANG on the intracellular localization of endogenous
eNOS and phospho-eNOS by confocal microscopy (Fig.4.3). After ANG treatment,
phospho-eNOS is enriched in the perinuclear region of cells in a punctate pattern,
(white arrows) and at the periphery of cells (blue arrows). In addition, phosphory-
lation of eNOS is increased by ANG. To demonstrate the exact cellular mechanism
of ANG regulated eNOS phosphorylation and intracellular location, LY 294002 and
PD 98059 were tested. Pretreatment with LY 294002, neomycin or L-NAME for
30 min inhibited ANG induced eNOS phosphorylation and intracellular localiza-
tion. However, when cells were stimulated with PD 98059, it did not affect eNOS
activation and localization.
4.3.6 NOS activity is involved in angiogenin induced en-
dothelial cell migration
We then characterized the effect of the competitive NOS inhibitor L-NAME on ANG
induced endothelial cell migration in HUVEC. The NOS inhibitor reduced the cell
migration induced by ANG, as shown in Fig.4.4. This results confirms the role of
NO as a mediator in ANG physiology. Furthermore, LY 294002, PD 98059 and
neomycin similarly inhibit cell migration.
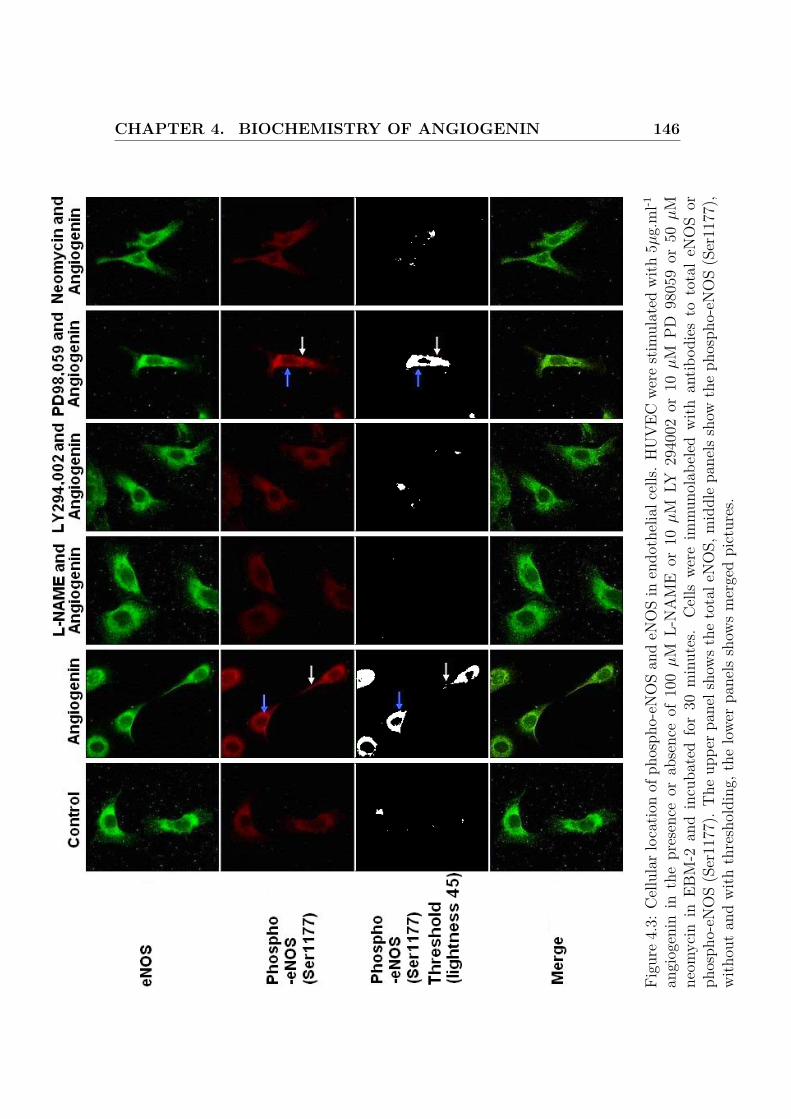
CHAPTER 4. BIOCHEMISTRY OF ANGIOGENIN 146
Figu
re4.
3:C
ellu
larl
ocat
ion
ofph
osph
o-eN
OS
and
eNO
Sin
endo
thel
ialc
ells.
HU
VEC
were
stim
ulat
edw
ith5µ
g.m
l-1
angi
ogen
inin
the
pres
ence
orab
senc
eof
100
µM
L-N
AM
Eor
10µ
MLY
2940
02or
10µ
MPD
9805
9or
50µ
Mne
omyc
inin
EBM
-2an
din
cuba
ted
for
30m
inut
es.
Cel
lswe
reim
mun
olab
eled
with
antib
odie
sto
tota
leN
OS
orph
osph
o-eN
OS
(Ser
1177
).T
heup
perp
anel
show
sthe
tota
leN
OS,
mid
dle
pane
lssh
owth
eph
osph
o-eN
OS
(Ser
1177
),w
ithou
tan
dw
ithth
resh
oldi
ng,t
helo
wer
pane
lssh
ows
mer
ged
pict
ures
.
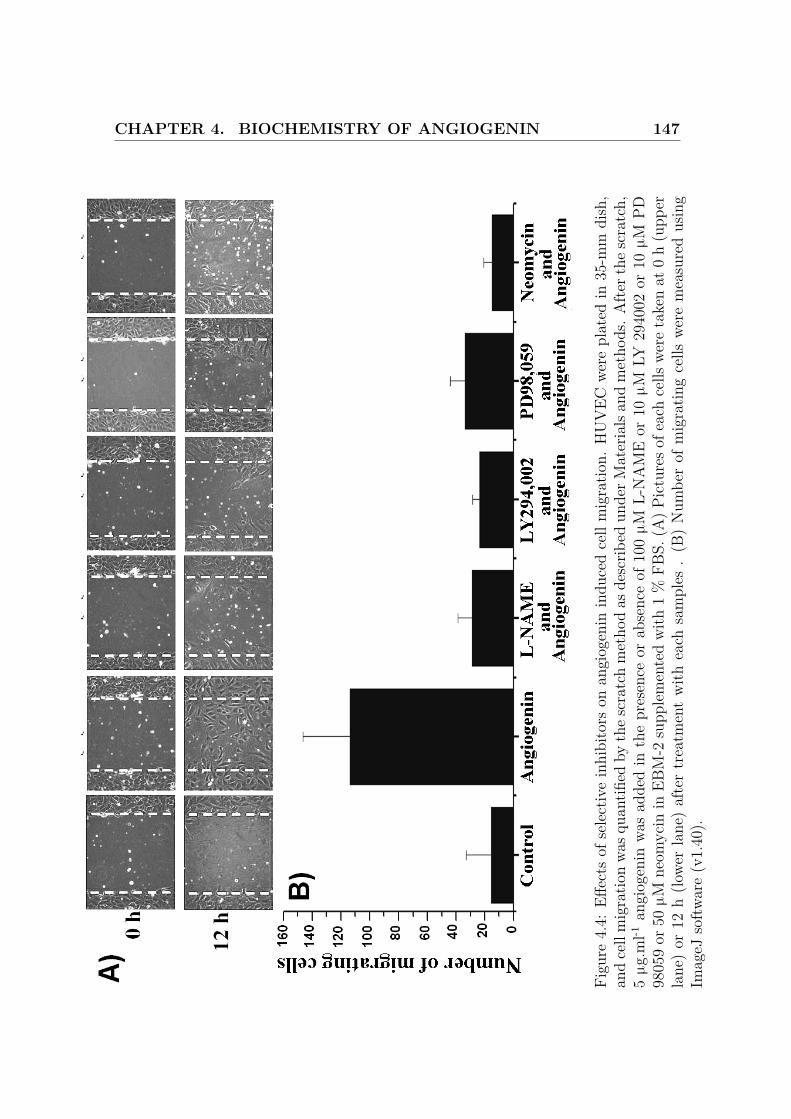
CHAPTER 4. BIOCHEMISTRY OF ANGIOGENIN 147
Figu
re4.
4:Eff
ects
ofse
lect
ive
inhi
bito
rson
angi
ogen
inin
duce
dce
llm
igra
tion.
HU
VEC
were
plat
edin
35-m
mdi
sh,
and
cell
mig
ratio
nwa
squa
ntifi
edby
the
scra
tch
met
hod
asde
scrib
edun
derM
ater
ials
and
met
hods
.Afte
rthe
scra
tch,
5µg
.ml-1
angi
ogen
inwa
sad
ded
inth
epr
esen
ceor
abse
nce
of10
0µM
L-N
AM
Eor
10µM
LY29
4002
or10
µMPD
9805
9or
50µM
neom
ycin
inEB
M-2
supp
lem
ente
dw
ith1
%FB
S.(A
)Pic
ture
sofe
ach
cells
were
take
nat
0h
(upp
erla
ne)
or12
h(lo
wer
lane
)af
ter
trea
tmen
tw
ithea
chsa
mpl
es.
(B)
Num
ber
ofm
igra
ting
cells
were
mea
sure
dus
ing
Imag
eJso
ftwar
e(v
1.40
).
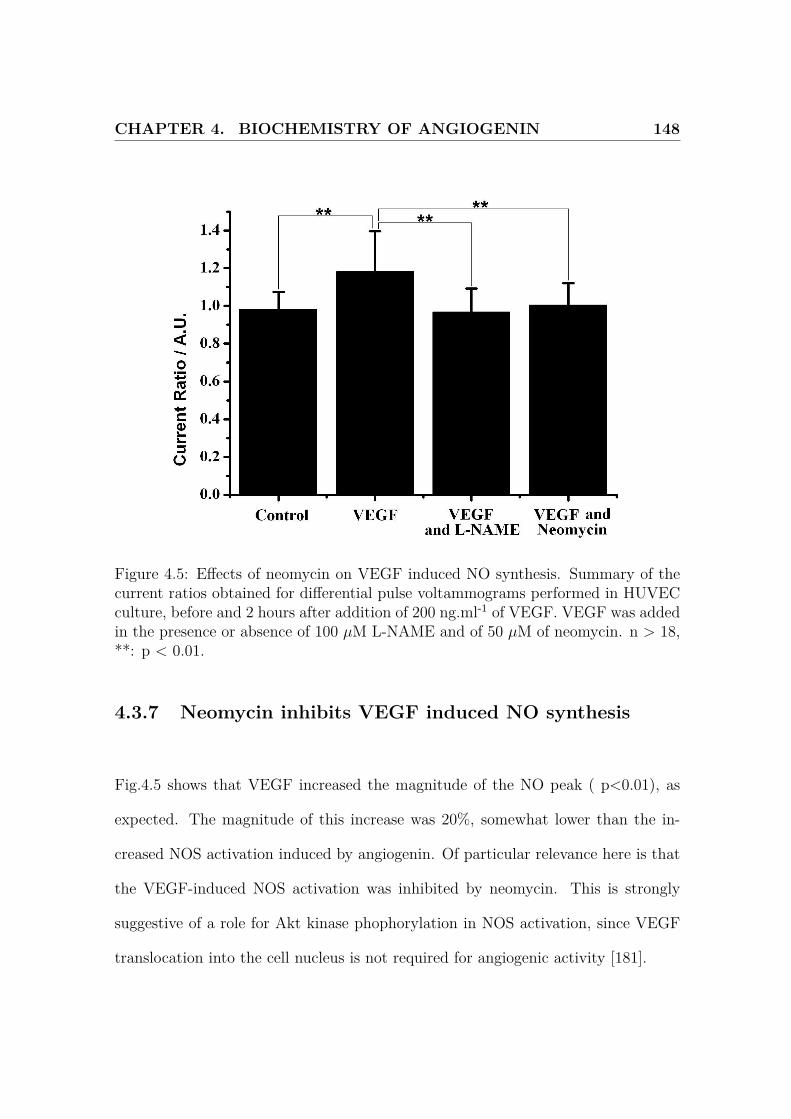
CHAPTER 4. BIOCHEMISTRY OF ANGIOGENIN 148
Figure 4.5: Effects of neomycin on VEGF induced NO synthesis. Summary of thecurrent ratios obtained for differential pulse voltammograms performed in HUVECculture, before and 2 hours after addition of 200 ng.ml-1 of VEGF. VEGF was addedin the presence or absence of 100 µM L-NAME and of 50 µM of neomycin. n > 18,**: p < 0.01.
4.3.7 Neomycin inhibits VEGF induced NO synthesis
Fig.4.5 shows that VEGF increased the magnitude of the NO peak ( p<0.01), as
expected. The magnitude of this increase was 20%, somewhat lower than the in-
creased NOS activation induced by angiogenin. Of particular relevance here is that
the VEGF-induced NOS activation was inhibited by neomycin. This is strongly
suggestive of a role for Akt kinase phophorylation in NOS activation, since VEGF
translocation into the cell nucleus is not required for angiogenic activity [181].
CHAPTER 4. BIOCHEMISTRY OF ANGIOGENIN 149
4.4 Discussion
In this study, we have demonstrated that angiogenin (ANG) induces NO synthesis
through two pathways involving the PI-3 kinase signal transduction cascade and
nuclear translocation.
Sensing of NO in biological conditions raises several problems due to the high re-
activity of this molecule, leading to a very short lifetime. In addition, most of the
commonly used methods, such as the Griess test, cannot be performed in real time,
show high limits of detection and poor spatial and temporal resolution. For these
reasons, measurement of NO was performed electrochemically, using a MMA [46].
The utility of the MMA for NO sensing in fibroblast cells has already been demon-
strated in the previous chapter [182, 46]. To improve biocompatibility, the surface of
the MMA was coated with fibronectin, an extracellular matrix protein. Fibronectin
is known to promote adequate cell adhesion and growth, and we have shown previ-
ously that it does not interfere with electrochemical measurements [33, 34].
The dose dependence result shows two interesting features. Firstly, NOS activity
increases with ANG concentration. Secondly, there is a minimum concentration of
ANG required for NOS activation. The threshold for NOS activation, between 250
ng.ml-1 and 1 µg.ml-1, can be related to ANG plasma concentration. In particular,
the human plasma concentration of ANG is reported to be 359.0 ± 59.9 ng.ml-1
[183]. Therefore, adding 250 ng.ml-1 may be not enough to trigger NO production,
CHAPTER 4. BIOCHEMISTRY OF ANGIOGENIN 150
as it is similar to basal concentrations of ANG.
Furthermore, the typical time-scale of this NO synthesis is consistent with the be-
haviour of other angiogenic factors. For instance, vascular endothelial growth factor
induces NOS activity, and a maximum is reached after 20 minutes [159]. However,
NO levels usually increase directly after addition of the growth factor, which is dif-
ferent from what we report for ANG, as the response is here delayed by typically 5
minutes.
This delay time in NO synthesis is consistent with the evidence that nuclear translo-
cation is a critical step in NOS activation pathway. Indeed, Xu et al. have shown
that nuclear translocation of ANG is dose-time dependent [180]. For instance, at
300 ng.ml-1, ANG can be detected in the nucleus after 30 minutes. However, at
1 µg.ml-1, ANG is localized into the nucleus after 10 minutes, which is consistent
with the delayed response time observed for NO synthesis and calcium influx at this
concentration.
Furthermore, it has been reported by Kishimoto et al. that nuclear translocation
of ANG is a general requirement for angiogenesis [168]. This led to investigation of
the effect of nuclear translocation, and of other ANG properties, on NO release to
understand the biochemical cascade leading to NOS activation.
Indeed, ANG is known to have several physiological effects on cells [167]:
CHAPTER 4. BIOCHEMISTRY OF ANGIOGENIN 151
1. ANG can bind to the actin receptors and cleave the extracellular matrix, thus
allowing cell migration [184],
2. It has an RNase activity [185],
3. It can bind to cell membrane receptors and trigger an intracellular biochemical
cascade (probably via signal-associated kinases ERK 1/2 [186] and B/Akt [187]
or via the phosphorylation of stress associated kinase SAPK/JNK in smooth
muscles [180]),
4. It can enter the cell nucleus and interact with ribonucleotides (nuclear translo-
cation) [180]. Nuclear translocation is time and dose dependent.
In this study, selective inhibitors for nuclear translocation (neomycin), for ERK 1/2
activity (PD 98059) and for PI-3 kinase (LY 294002) (thus inhibiting the downstream
Akt kinase) have been used.
It is well-established that the aminoglycoside antibiotic neomycin blocks nuclear
translocation of angiogenin[188, 189] in endothelial cells and inhibits angiogenesis
by angiogenin, acidic fibroblast growth factor, basic fibroblast growth factor and
epidermal growth factor, all of which undergo nuclear translocation but does not
have this effect on vascular endothelial growth factor which is not translocated.
Relevant to this study is the observation that it blocks endogenous ATP-induced
Ca2+ transients [190] and associated NO production in response to hypotonic stress.
NO production per se is not inhibited by neomycin, rather it is the Ca2+ transients
CHAPTER 4. BIOCHEMISTRY OF ANGIOGENIN 152
that are inhibited. These transients have been observed by Kimura et al. [190] some
100 s following hypotonic stress, a similar lag to that observed here following an-
giogenin administration, consistent with angiogenin involvement. Given the ability
of neomycin to inhibit angiogenesis, it is unsurprising that it has been investigated
as an anti-neoplastic agent[191] and that consequently its pharmacology has been
widely studied. Other actions include inhibition of phospholipase C[192, 193]. It is
a calcium sensory receptor agonist[194] and can increase ERK 1/2 phosphorylation.
Of these diverse pharmacological actions, it is neomycin’s ability to block angiogenin
nuclear translocation that is of major relevance here.
NO synthesis, eNOS activation and localization, and cell migration being all in-
hibited by neomycin, this would tend to show that nuclear translocation of ANG
is involved in these phenomena. These results have also been related to the ob-
served delayed response time reported above for angiogenin-induced NOS activity.
Furthermore, this also supports the fact that angiogenin interaction with nucleus
ribonucleotides is a critical step for angiogenesis.However, the VEGF experiments
demonstrate that neomycin does not solely inhibit angiogenin nuclear translocation,
as VEGF does not translocate into the nucleus. It has been reported by Miyazaki
et al. that neomycin attenuates Akt kinase phosphorylation downstream of PI-3
kinase [195]. Akt kinase being an important mediator for VEGF-induced NO syn-
thesis [196, 197], this result demonstrates that other effects of neomycin have to be
taken in account in angiogenic factor induced angiogenesis. As a consequence, we
cannot yet provide definitive conclusions about the role of nuclear translocation in
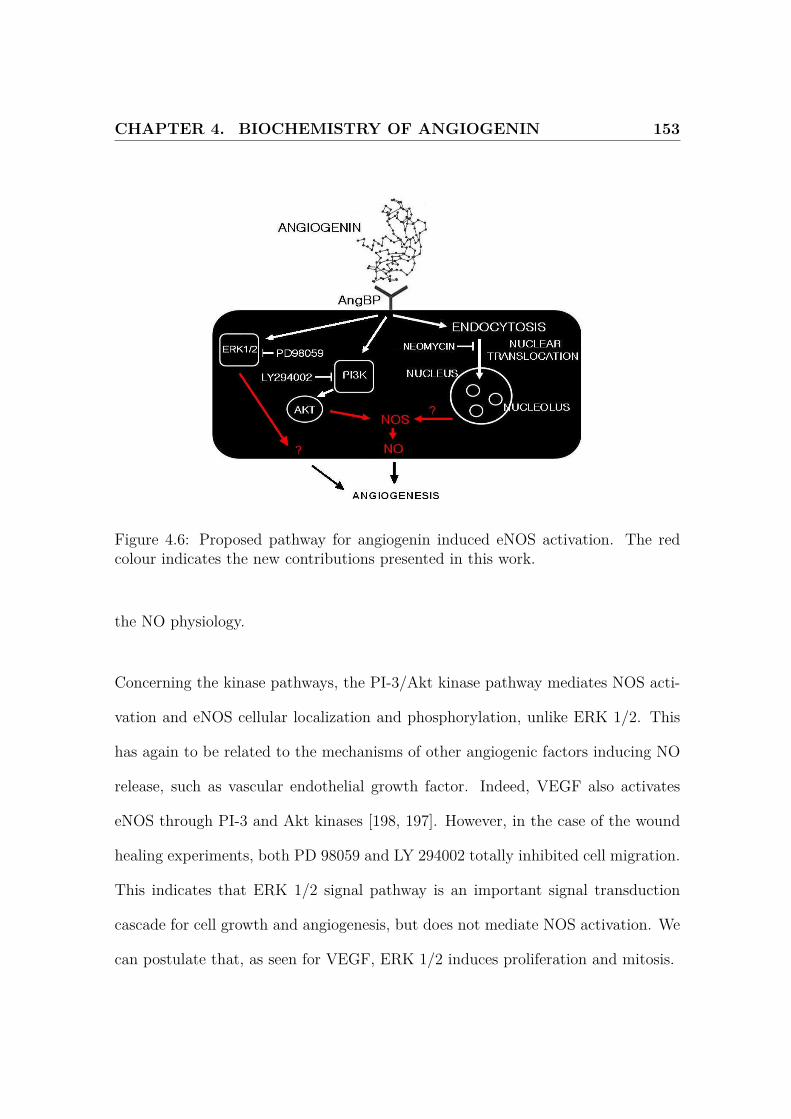
CHAPTER 4. BIOCHEMISTRY OF ANGIOGENIN 153
Figure 4.6: Proposed pathway for angiogenin induced eNOS activation. The redcolour indicates the new contributions presented in this work.
the NO physiology.
Concerning the kinase pathways, the PI-3/Akt kinase pathway mediates NOS acti-
vation and eNOS cellular localization and phosphorylation, unlike ERK 1/2. This
has again to be related to the mechanisms of other angiogenic factors inducing NO
release, such as vascular endothelial growth factor. Indeed, VEGF also activates
eNOS through PI-3 and Akt kinases [198, 197]. However, in the case of the wound
healing experiments, both PD 98059 and LY 294002 totally inhibited cell migration.
This indicates that ERK 1/2 signal pathway is an important signal transduction
cascade for cell growth and angiogenesis, but does not mediate NOS activation. We
can postulate that, as seen for VEGF, ERK 1/2 induces proliferation and mitosis.
CHAPTER 4. BIOCHEMISTRY OF ANGIOGENIN 154
In addition, localisation of NOS has been observed for other angiogenic factors, no-
tably 17β-estradiol (E2). Grasselli et al.[199] have demonstrated eNOS and estrogen
2α receptor co-localisation in the endothelial cell nucleus in response to E2 which is
inhibited by L-NAME. Inhibition of eNOS localization by L-NAME, as noticed in
our study and for E2[199], is also an indication of a possible positive feedback loop
of NO levels on eNOS.
Fig.4.6 summarizes the results presented here for ANG induced eNOS activation.
We suggest that ANG binds to a membrane receptor, thus transducing an intra-
cellular signal through PI-3 and Akt kinases. At the same time, endocytosis and
nuclear translocation of ANG, and therefore possible interaction of ANG with ri-
bonucleotides, are also critical requirements for eNOS activation, as for any angio-
genic activity. Nuclear translocation is expected to account for the delayed response
time noticed for eNOS activity in response to ANG.
To summarize, ANG was previously known to:
• translocate inside the nucleus,
• activate PI-3 and Akt kinases,
• activate ERK 1/2.
From our results, obtained with the MMA technology, we have demonstrated that:
CHAPTER 4. BIOCHEMISTRY OF ANGIOGENIN 155
• ANG induces NO release,
• this release is dose and time dependent and is triggered by the addition of at
least 500 ng.ml-1 of ANG, which is consistent with the basal level of ANG,
• NOS activation is mediated by PI-3 and Akt kinases,
• NOS activation is not mediated by ERK 1/2,
• No conclusion can yet be drawn regarding the role of nuclear translocation in
NOS activation, as neomycin may interfere with Akt phosphorylation.
4.5 Conclusion
Results, in this chapter, have demonstrated how an electrochemical device can be
used to disentangle complex biochemical phenomena.
In the case of angiogenin, it is confirmed that the threshold of activity is around
500 ng.ml-1. Furthermore, as for many angiogenic factors, the effect of PI-3 kinase
is vital for the synthesis of nitric oxide. On the other hand, these results indi-
cate that neomycin, which is frequently used as an inhibitor of angiogenin nuclear
translocation, inhibited NO release.
Conclusion and Future
Developments
The initial step of this work was improving the biological stability of electrochemical
sensors. A general protocol for the study of fouling processes has been designed. This
protocol uses different reaction types to disentangle the different physico-chemical
phenomena contributing to the electrochemical signal. The stability of carbon based
and membrane covered electrodes has been investigated [200, 33, 34] in different bi-
ological setups. BDD was shown to be very stable in biological conditions, even
for complex redox reactions. This biological inertness, coupled with the exceptional
physical properties of diamond, can offer interesting opportunities for biomedical
applications. However, the stability of this material in vivo has yet to be character-
ized. The results for the membrane covered electrodes indicate that fibronectin, a
protein of the extracellular matrix, is a promising candidate for a cell-on-chip sub-
strate. Indeed, it prevents protein adsorption on the surface of the electrode, and
offers highly biocompatible conditions for cell culture. Again, the behaviour of this
156
CHAPTER 4. BIOCHEMISTRY OF ANGIOGENIN 157
type of coating has to be investigated in vivo, but coating devices with a well-chosen
molecule of the extracellular matrix may be a general strategy to improve the long-
term stability and biological integration of sensors.
With this membrane, we have then designed a generally applicable protocol to per-
form reliable biomeasurements, in biologically significant conditions. This protocol
allowed robust measurements of long-term NO release. However, this setup is not
suited for the measurements of fast (sub-millisecond) events, but fills a gap in the
current biological equipment by providing a way to quickly investigate the release
of small relevant biomolecules. In particular, the kinase pathway leading to VEGF
induced NO release has been elucidated [182] and is correlated with the existing
literature. Furthermore, this technology has demonstrated that angiogenin induces
NO release through the phosphorylation of PI-3 and Akt kinases [201]. This is a new
and original contribution to the current research of this important angiogenic factor.
However, the role of nuclear translocation on NO release is still partially unclear,
mostly because the neomycin used to inhibit this pathway may also interact with
Akt phosphorylation. Neamine, another aminoglycoside antibiotic, may be used as
an alternative to elucidate this problem.
Further developments of this work should focus on the biological applications of
this technology. Indeed, the protocol presented here is ideally suited to investigate
pharmacological interactions. Dose responses can be obtained quickly by performing
numerous parallel measurements. The device is currently designed for NO release
CHAPTER 4. BIOCHEMISTRY OF ANGIOGENIN 158
sensing, so anti-oxidant or pro-oxidant drugs and anti-angiogenic or pro-carcinogenic
drugs are good candidates for systematic studies. Obtaining significant sets of data
in relatively short times will definitely establish the usefulness of this method, es-
pecially in comparison to confocal microscopy. Other biological systems where NO
is involved (immune system, neurosciences) are also to be studied. Similarly, elec-
trochemical sensing could also be used for cell culture daily monitoring, for instance
by informing the user of non ideal or harmful conditions and therefore preventing
the loss of precious samples. In vivo sensing, using the biocompatibility findings
presented here, may also be investigated.
Another prospect is improving the device. Achieving multi-analyte sensing, proba-
bly with chemical or enzymatic modification of the system, in order to get a wider
set of data on these critical biological phenomena will have to be considered. Adding
other conditions parameters, like mechanical stimulation with a fluidic system or by
performing co-culture of different cell types, will enable the study of more complex
interactions. More importantly, the design of the MMA needs improvement. More
working electrodes (the MMA currently presents 6 electrodes) will have to be added.
The stability of the sensor, and in particular the problem of delamination of the top
layer, will have to be improved.
The work presented in this thesis therefore establishes the usefulness of microfabri-
cated devices for cell-based assays, and significant biological results can be obtained
with simple methods. However, several technological improvements are still required

CHAPTER 4. BIOCHEMISTRY OF ANGIOGENIN 159
to establish this technology as a general and user-friendly method for biology.
Bibliography
[1] A. Bard and L. Faulkner, Electrochemical Methods: Fundamentals and Appli-
cations. John Wiley & Sons, 1980.
[2] C. Gabrielli, Identification of electrochemical processes by frequency response
analysis. Solartron Instrumentation Group, 1980.
[3] R. Compton and C. Banks, Understanding voltammetry. World Scientific Pub
Co Inc, 2007.
[4] B. Patel, M. Arundell, K. Parker, M. Yeoman, and D. O’Hare, “Detection of
nitric oxide release from single neurons in the pond snail, Lymnaea stagnalis,”
Analytical Chemistry, vol. 78, no. 22, pp. 7643–7648, 2006.
[5] T. Malinski and Z. Taha, “Nitric oxide release from a single cell measured in
situ by a porphyrinic-based microsensor,” Nature, vol. 358, pp. 676–678, 1992.
[6] P. Beattie, A. Delay, and H. Girault, “Investigation of the kinetics of ion and
assisted ion transfer by the technique of ac impedance of the micro-ITIES,”
160
BIBLIOGRAPHY 161
Electrochimica Acta, vol. 40, no. 18, pp. 2961–2969, 1995.
[7] G. Dryhurst and J. Stocker, “Electrochemistry of biological molecules,” Jour-
nal of The Electrochemical Society, vol. 124, p. 390C, 1977.
[8] L. Blinks and R. Skow, “The time course of photosynthesis as shown by a
rapid electrode method for oxygen,” Proceedings of the National Academy of
Sciences of the United States of America, vol. 24, no. 10, p. 420, 1938.
[9] A. Sternson, R. McCreery, B. Feinberg, and R. Adams, “Electrochemical stud-
ies of adrenergic neurotransmitters and related compounds,” Journal of Elec-
troanalytical Chemistry, vol. 46, no. 2, pp. 313–321, 1973.
[10] J. Ponchon, R. Cespuglio, F. Gonon, M. Jouvet, and J. Pujol, “Normal pulse
polarography with carbon fiber electrodes for in vitro and in vivo determina-
tion of catecholamines,” Analytical Chemistry, vol. 51, no. 9, pp. 1483–1486,
1979.
[11] R. Adams, “Probing brain chemistry with electroanalytical techniques.,” An-
alytical chemistry, vol. 48, no. 14, p. 1126A, 1976.
[12] U. Ungerstedt and C. Marsden, “Measurement of neurotransmitter release in
vivo,” Methods In Neuroscience, vol. 6, pp. 81–106, 1984.
[13] R. Kelly and R. Wightman, “Detection of dopamine overflow and diffusion
with voltammetry in slices of rat brain,” Brain Research, vol. 423, no. 1-2,
pp. 79–87, 1987.
BIBLIOGRAPHY 162
[14] C. Marsden, J. Conti, E. Strope, G. Curzon, and R. Adams, “Monitoring 5-
hydroxytryptamine release in the brain of the freely moving unanaesthetized
rat using in vivo voltammetry,” Brain Research, vol. 171, no. 1, pp. 85–99,
1979.
[15] N. Kulagina, M. Zigmond, and A. Michael, “Glutamate regulates the spon-
taneous and evoked release of dopamine in the rat striatum,” Neuroscience,
vol. 102, no. 1, pp. 121–128, 2001.
[16] B. Patel, “Continuous amperometric detection of co-released serotonin and
melatonin from the mucosa in the ileum,” Analyst, vol. 133, no. 4, pp. 516–
524, 2008.
[17] P. Liss, A. Nygren, N. Revsbech, and H. Ulfendahl, “Intrarenal oxygen tension
measured by a modified Clark electrode at normal and low blood pressure and
after injection of x-ray contrast media,” Pflügers Archiv European Journal of
Physiology, vol. 434, no. 6, pp. 705–711, 1997.
[18] H. Montgomery and O. Horwitz, “Oxygen tension of tissues by the polaro-
graphic method. I. Introduction: oxygen tension and blood flow of the skin of
human extremities,” Journal of Clinical Investigation, vol. 29, no. 9, p. 1120,
1950.
[19] D. Cater, I. Silver, and G. Wilson, “Apparatus and technique for the quan-
titative measurement of oxygen tension in living tissues,” Proceedings of the
Royal Society of London. Series B, Biological Sciences, pp. 256–276, 1959.
BIBLIOGRAPHY 163
[20] W. Whalen, J. Riley, and P. Nair, “A microelectrode for measuring intracel-
lular PO2,” Journal of Applied Physiology, vol. 23, no. 5, p. 798, 1967.
[21] L. Clark et al., “Continuous recording of blood oxygen tensions by polarogra-
phy,” Journal of Applied Physiology, vol. 6, no. 3, pp. 189–193, 1953.
[22] S. Santilli, A. Tretinyak, and E. Lee, “Transarterial wall oxygen gradients at
the deployment site of an intra-arterial stent in the rabbit,” American Journal
of Physiology- Heart Circulatory Physiology, vol. 279, no. 4, pp. H1518–H1525,
2000.
[23] P. Vaupel, K. Schlenger, C. Knoop, and M. Hockel, “Oxygenation of hu-
man tumors: evaluation of tissue oxygen distribution in breast cancers by
computerized O2 tension measurements,” Cancer Research, vol. 51, no. 12,
pp. 3316–3322, 1991.
[24] R. Cooper, C. West, J. Logue, S. Davidson, A. Miller, S. Roberts, I. Stat-
ford, D. Honess, and R. Hunter, “Changes in oxygenation during radiother-
apy in carcinoma of the cervix,” International Journal of Radiation Oncology-
Biology- Physics, vol. 45, no. 1, pp. 119–126, 1999.
[25] P. Bartlett and R. Whitaker, “Strategies for the development of amperometric
enzyme electrodes,” Biosensors, vol. 3, no. 6, pp. 359–379, 1988.
[26] L. Clark and L. Lyons, “Glucose enzyme electrode,” Annals of the New York
Academy of Sciences, vol. 102, pp. 29–45, 1962.
BIBLIOGRAPHY 164
[27] V. Björk and A. Henze, “Encapsulation of the Björk-Shiley Aortic Disc Valve
Prosthesis Caused by the Lack of Anticoagulation Treatment,” Scandinavian
Cardiovascular Journal, vol. 7, no. 1, pp. 17–20, 1973.
[28] J. Lilla and L. Vistnes, “Long-term study of reactions to various silicone breast
implants in rabbits,” Plastc and Reconstructive Surgery, vol. 57, no. 5, pp. 637–
649, 1976.
[29] N. Wisniewski, F. Moussy, and W. Reichert, “Characterization of implantable
biosensor membrane biofouling,” Fresenius Journal of Analytical Chemistry,
vol. 366, no. 6, pp. 611–621, 2000.
[30] M. Frost, S. Rudich, H. Zhang, M. Maraschio, and M. Meyerhoff, “In vivo
biocompatibility and analytical performance of intravascular amperometric
oxygen sensors prepared with improved nitric oxide-releasing silicone rubber
coating,” Analytical Chemistry, vol. 74, no. 23, pp. 5942–5947, 2002.
[31] D. Castner and B. Ratner, “Biomedical surface science: Foundations to fron-
tiers,” Surface Science, vol. 500, no. 1-3, pp. 28–60, 2002.
[32] J. Anderson, “Biological responses to materials,” Annual Review of Materials
Research, vol. 31, no. 1, pp. 81–110, 2001.
[33] R. Trouillon, C. Cheung, B. Patel, and D. O’Hare, “Comparative study of poly
(styrene-sulfonate)/poly (L-lysine) and fibronectin as biofouling-preventing
layers in dissolved oxygen electrochemical measurements,” Analyst, vol. 134,
no. 4, pp. 784–793, 2009.
BIBLIOGRAPHY 165
[34] R. Trouillon, Z. Combs, B. Patel, and D. O’Hare, “Comparative study of
the effect of various electrode membranes on biofouling and electrochemical
measurements,” Electrochemistry Communications, vol. 11, pp. 1409–1413,
2009.
[35] T. Davies, C. Banks, and R. Compton, “Voltammetry at spatially hetero-
geneous electrodes,” Journal of Solid State Electrochemistry, vol. 9, no. 12,
pp. 797–808, 2005.
[36] M. Anson, “The reactions of denatured egg albumin with ferricyanide,” Jour-
nal of General Physiology, vol. 23, no. 2, pp. 247–261, 1939.
[37] O. Nekrassova, G. Allen, N. Lawrence, L. Jiang, T. Jones, and R. Compton,
“The oxidation of cysteine by aqueous ferricyanide: A kinetic study using
boron doped diamond electrode voltammetry,” Electroanalysis, vol. 14, no. 21,
pp. 1464–1469, 2002.
[38] R. Whitehead, J. Ferrer, J. Javitch, and J. Justice, “Reaction of oxidized
dopamine with endogenous cysteine residues in the human dopamine trans-
porter.,” Journal of Neurochemistry, vol. 76, no. 4, pp. 1242–1251, 2001.
[39] S. Shahrokhian and S. Bozorgzadeh, “Electrochemical oxidation of dopamine
in the presence of sulfhydryl compounds: Application to the square-wave
voltammetric detection of penicillamine and cysteine,” Electrochimica Acta,
vol. 51, no. 20, pp. 4271–4276, 2006.
BIBLIOGRAPHY 166
[40] T. Davies and R. Compton, “The cyclic and linear sweep voltammetry of
regular and random arrays of microdisc electrodes: Theory,” Journal of Elec-
troanalytical Chemistry, vol. 585, no. 1, pp. 63–82, 2005.
[41] M. James and J. Millar, “Carbon fibre microelectrodes,” Journal of Neuro-
science Methods, vol. 1, pp. 279–287, 1979.
[42] P. Hashemi, E. Dankoski, J. Petrovic, R. Keithley, and R. Wightman,
“Voltammetric Detection of 5-Hydroxytryptamine Release in the Rat Brain,”
Analytical Chemistry, pp. 171–183, 2009.
[43] O. Schuvailo, S. Dzyadevych, A. El’skaya, S. Gautier-Sauvigne, E. Csöregi,
R. Cespuglio, and A. Soldatkin, “Carbon fibre-based microbiosensors for in
vivo measurements of acetylcholine and choline,” Biosensors and Bioelectron-
ics, vol. 21, no. 1, pp. 87–94, 2005.
[44] C. Amatore, S. Arbault, Y. Bouret, B. Cauli, M. Guille, A. Rancillac,
and J. Rossier, “Nitric oxide release during evoked neuronal activity in
cerebellum slices: detection with platinized carbon-fiber microelectrodes,”
ChemPhysChem, vol. 7, no. 1, pp. 181–187, 2006.
[45] S. Arbault, N. Sojic, D. Bruce, C. Amatore, A. Sarasin, and M. Vuillaume,
“Oxidative stress in cancer prone xeroderma pigmentosum fibroblasts. Real-
time and single cell monitoring of superoxide and nitric oxide production with
microelectrodes,” Carcinogenesis, vol. 25, no. 4, pp. 509–515, 2004.
BIBLIOGRAPHY 167
[46] B. Patel, M. Arundell, R. Quek, S. Harvey, I. Ellis, M. Florence, A. Cass,
A. Schor, and D. O’Hare, “Individually addressable microelectrode array for
monitoring oxygen and nitric oxide release,” Analytical Bioanalytical Chem-
istry, vol. 390, no. 5, pp. 1379–1387, 2008.
[47] J. Oni, A. Pailleret, S. Isik, N. Diab, I. Radtke, A. Blöchl, M. Jackson,
F. Bedioui, and W. Schuhmann, “Functionalised electrode array for the de-
tection of nitric oxide released by endothelial cells using different NO-sensing
chemistries,” Analytical Bioanalytical Chemistry, vol. 378, no. 6, pp. 1594–
1600, 2004.
[48] S. Isik, L. Berdondini, J. Oni, A. Blöchl, M. Koudelka-Hep, and W. Schuh-
mann, “Cell-compatible array of three-dimensional tip electrodes for the de-
tection of nitric oxide release,” Biosensors and Bioelectronics, vol. 20, no. 8,
pp. 1566–1572, 2005.
[49] Z. Lin, K. Ino, H. Shiku, and T. Matsue, “Electrochemical topography of a
cell monolayer with an addressable microelectrode array,” Chemical Commu-
nications, vol. 46, no. 4, pp. 559–561, 2010.
[50] P. Carmeliet and R. Jain, “Angiogenesis in cancer and other diseases,” Nature,
vol. 407, no. 6801, pp. 249–257, 2000.
[51] R. Jain, D. Duda, J. Clark, and J. Loeffler, “Lessons from phase III clinical
trials on anti-VEGF therapy for cancer,” Nature Clinical Practice Oncology,
vol. 3, no. 1, pp. 24–40, 2006.

BIBLIOGRAPHY 168
[52] “www.mccd.edu/biology/anatomy/unit 204/Page1.html.”
[53] “en.wikipedia.org/wiki/Artery.”
[54] G. Kasper, N. Dankert, J. Tuischer, M. Hoeft, T. Gaber, J. Glaeser, D. Zander,
M. Tschirschmann, M. Thompson, G. Matziolis, et al., “Mesenchymal stem
cells regulate angiogenesis according to their mechanical environment,” Stem
Cells, vol. 25, no. 4, pp. 903–910, 2007.
[55] J. Folkman and M. Klagsbrun, “Angiogenic factors,” Science, vol. 235,
no. 4787, p. 442, 1987.
[56] A. Papapetropoulos, G. García-Cardeña, J. Madri, and W. Sessa, “Nitric oxide
production contributes to the angiogenic properties of vascular endothelial
growth factor in human endothelial cells.,” Journal of Clinical Investigation,
vol. 100, no. 12, p. 3131, 1997.
[57] G. Valdés, R. Erices, C. Chacón, and J. Corthorn, “Angiogenic, hyperperme-
ability and vasodilator network in utero-placental units along pregnancy in the
guinea-pig(Cavia porcellus),” Reproductive Biology and Endocrinology, vol. 6,
no. 1, p. 13, 2008.
[58] S. Welsh, W. Bellamy, M. Briehl, and G. Powis, “The redox protein
thioredoxin-1 is necessary for the hypoxia dependent increase in HIF-1 and
results in increased vascular endothelial growth factor formation by cancer
cells and enhanced tumor angiogenesis,” Cancer Res, vol. 62, pp. 5089–5095,
2002.
BIBLIOGRAPHY 169
[59] R. O’Neill, R. Grünewald, M. Fillenz, and W. Albery, “Linear sweep voltam-
metry with carbon paste electrodes in the rat striatum,” Neuroscience, vol. 7,
no. 8, pp. 1945–1954, 1982.
[60] R. O’Neill, M. Fillenz, and W. Albery, “The development of linear sweep
voltammetry with carbon paste electrodes in vivo,” Journal of Neuroscience
Methods, vol. 8, no. 3, pp. 263–273, 1983.
[61] R. O’Neill, M. Fillenz, L. Sundstrom, and J. Rawlins, “Voltammetrically mon-
itored brain ascorbate as an index of excitatory amino acid release in the
unrestrained rat,” Neuroscience letters, vol. 52, no. 3, pp. 227–233, 1984.
[62] R. Wightman, J. Jankowski, R. Kennedy, K. Kawagoe, T. Schroeder,
D. Leszczyszyn, J. Near, E. Diliberto, and O. Viveros, “Temporally resolved
catecholamine spikes correspond to single vesicle release from individual chro-
maffin cells,” Proceedings of the National Academy of Sciences of the United
States of America, vol. 88, no. 23, pp. 10754–10758, 1991.
[63] M. Roitman, G. Stuber, P. Phillips, R. Wightman, and R. Carelli, “Dopamine
operates as a subsecond modulator of food seeking,” Journal of Neuroscience,
vol. 24, no. 6, pp. 1265–1271, 2004.
[64] M. Heien, A. Khan, J. Ariansen, J. Cheer, P. Phillips, K. Wassum, and
R. Wightman, “Real-time measurement of dopamine fluctuations after co-
caine in the brain of behaving rats,” Proceedings of the National Academy of
BIBLIOGRAPHY 170
Sciences of the United States of America, vol. 102, no. 29, pp. 10023–10028,
2005.
[65] B. Zhang, K. Adams, S. Luber, D. Eves, M. Heien, and A. Ewing, “Spa-
tially and temporally resolved single-cell exocytosis utilizing individually ad-
dressable carbon microelectrode arrays,” Analytical Chemistry, vol. 80, no. 5,
pp. 1394–1400, 2008.
[66] B. Patel, M. Arundell, K. Parker, M. Yeoman, and D. O’Hare, “Detection of
nitric oxide release from single neurons in the pond snail, Lymnaea stagnalis,”
Analytical Chemistry, vol. 78, no. 22, pp. 7643–7648, 2006.
[67] B. Patel, X. Bian, V. Quaiserová-Mocko, J. Galligan, and G. Swain, “In vitro
continuous amperometric monitoring of 5-hydroxytryptamine release from en-
terochromaffin cells of the guinea pig ileum,” Analyst, vol. 132, no. 1, pp. 41–
47, 2007.
[68] J. Park, V. Quaiserová-Mocko, B. Patel, M. Novotny, A. Liu, X. Bian, J. Gal-
ligan, and G. Swain, “Diamond microelectrodes for in vitro electroanalytical
measurements: current status and remaining challenges,” Analyst, vol. 133,
no. 1, pp. 17–24, 2008.
[69] B. Patel, J. Galligan, G. Swain, and X. Bian, “Electrochemical monitoring of
nitric oxide released by myenteric neurons of the guinea pig ileum,” Neurogas-
troenterology & Motility, vol. 20, no. 11, pp. 1243–1250, 2008.
BIBLIOGRAPHY 171
[70] J. Strojek, M. Granger, G. Swain, T. Dallas, and M. Holtz, “Enhanced
signal-to-background ratios in voltammetric measurements made at diamond
thin-film electrochemical interfaces,” Analytical Chemistry, vol. 68, no. 13,
pp. 2031–2037, 1996.
[71] I. Dumitrescu, J. Edgeworth, P. Unwin, and J. Macpherson, “Ultrathin car-
bon nanotube mat electrodes for enhanced amperometric detection,” Advanced
Materials, vol. 21, pp. 1–5, 2009.
[72] H. Heli, N. Sattarahmady, A. Jabbari, A. Moosavi-Movahedi, G. Hakimelahi,
and F. Tsai, “Adsorption of human serum albumin onto glassy carbon surface–
Applied to albumin-modified electrode: Mode of protein–ligand interactions,”
Journal of Electroanalytical Chemistry, vol. 610, no. 1, pp. 67–74, 2007.
[73] P. Chen and R. McCreery, “Control of electron transfer kinetics at glassy car-
bon electrodes by specific surface modification,” Analytical Chemistry, vol. 68,
no. 22, pp. 3958–3965, 1996.
[74] G. Salazar-Banda, L. Andrade, P. Nascente, P. Pizani, R. Rocha-Filho, and
L. Avaca, “On the changing electrochemical behaviour of boron-doped dia-
mond surfaces with time after cathodic pre-treatments,” Electrochimica Acta,
vol. 51, no. 22, pp. 4612–4619, 2006.
[75] S. Ranganathan, T. Kuo, and R. McCreery, “Facile preparation of active
glassy carbon electrodes with activated carbon and organic solvents,” Ana-
lytical Chemistry, vol. 71, no. 16, pp. 3574–3580, 1999.
BIBLIOGRAPHY 172
[76] M. Chiku, T. Ivandini, A. Kamiya, A. Fujishima, and Y. Einaga, “Direct elec-
trochemical oxidation of proteins at conductive diamond electrodes,” Journal
of Electroanalytical Chemistry, pp. 201–207, 2007.
[77] M. Chiku, J. Nakamura, A. Fujishima, and Y. Einaga, “Conformational
change detection in nonmetal proteins by direct electrochemical oxidation us-
ing diamond electrodes,” Analytical Chemistry, vol. 80, no. 15, pp. 5783–5787,
2008.
[78] D. Tse, R. McCreery, and R. Adams, “Potential oxidative pathways of brain
catecholamines,” Journal of Medical Chemistry, vol. 19, no. 1, pp. 37–40, 1976.
[79] J. Mackie and P. Meares, “The diffusion of electrolytes in a cation-exchange
resin membrane. I. Theoretical,” Proceedings of the royal society of London.
Series A, mathematical and physical sciences, vol. 232, no. 1191, pp. 498–509,
1955.
[80] M. Deakin, K. Stutts, and R. Wightman, “The Effect of pH on some outer-
sphere electrode reactions at carbon electrodes,” Journal of Electroanalytical
Chemistry, vol. 182, no. 1, pp. 113–122, 1985.
[81] J. Kawiak, T. Jedral, and Z. Galus, “A reconsideration of the kinetic data
for the Fe(CN)63- /Fe(CN)6
4- system,” Journal of Electroanalytical Chemistry,
vol. 145, no. 1, pp. 163–171, 1983.
BIBLIOGRAPHY 173
[82] C. Allred and R. McCreery, “Adsorption of catechols on fractured glassy car-
bon electrode surfaces,” Analytical Chemistry, vol. 64, no. 4, pp. 444–448,
1992.
[83] M. Granger and G. Swain, “The influence of surface interactions on the re-
versibility of ferri/ferrocyanide at boron-doped diamond thin-film electrodes,”
Journal of The Electrochemical Society, vol. 146, pp. 4551–4558, 1999.
[84] Y. Pleskov, “Electrochemistry of diamond: A review,” Russian Journal of
Electrochemistry, vol. 38, no. 12, pp. 1275–1291, 2002.
[85] D. Becker and K. Jüttner, “The impedance of fast charge transfer reactions on
boron doped diamond electrodes,” Electrochimica Acta, vol. 49, no. 1, pp. 29–
39, 2003.
[86] N. Wilson, S. Clewes, M. Newton, P. Unwin, and J. Macpherson, “Impact of
grain-dependent boron uptake on the electrochemical and electrical proper-
ties of polycrystalline boron doped diamond electrodes,” Journal of Physical
Chemistry B, vol. 110, no. 11, pp. 5639–5646, 2006.
[87] A. Colley, C. Williams, U. Johansson, M. Newton, P. Unwin, N. Wilson, and
J. Macpherson, “Examination of the spatially heterogeneous electroactivity of
boron-doped diamond microarray electrodes,” Analytical Chemistry, vol. 78,
no. 8, pp. 2539–2548, 2006.
[88] K. Holt, A. Bard, Y. Show, and G. Swain, “Scanning electrochemical mi-
croscopy and conductive probe atomic force microscopy studies of hydrogen-
BIBLIOGRAPHY 174
terminated boron-doped diamond electrodes with different doping levels,”
Journal of Physical Chemistry B, vol. 108, no. 39, pp. 15117–15127, 2004.
[89] W. Zhang, S. Xie, M. Li, H. Chen, L. Ma, and J. Jia, “Electrochemical char-
acteristics of an interdigitated microband electrode array of boron-doped di-
amond film,” Collection of Czechoslovak Chemical Communications, vol. 74,
no. 3, pp. 393–407, 2009.
[90] R. Ramesham, “Effect of annealing and hydrogen plasma treatment on the
voltammetric and impedance behavior of the diamond electrode,” Thin Solid
Films, vol. 315, no. 1-2, pp. 222–228, 1998.
[91] D. O’Hare, J. Macpherson, and A. Willows, “On the microelectrode behaviour
of graphite-epoxy composite electrodes,” Electrochemistry Communications,
vol. 4, no. 3, pp. 245–250, 2002.
[92] H. Zhao and D. O’Hare, “Characterisation and modeling of conducting com-
posite electrodes,” Journal of Physical Chemistry C, vol. 112, no. 25, pp. 9351–
9357, 2008.
[93] E. Muccillo and M. Kleitz, “Impedance spectroscopy of Mg-partially stabilized
zirconia and cubic phase decomposition,” Journal of the European Ceramic
Society, vol. 16, no. 4, pp. 453–465, 1996.
[94] A. Suzuki, T. Ivandini, K. Yoshimi, A. Fujishima, G. Oyama, T. Nakazato,
N. Hattori, S. Kitazawa, and Y. Einaga, “Fabrication, characterization, and
BIBLIOGRAPHY 175
application of boron-doped diamond microelectrodes for in vivo dopamine de-
tection,” Anal. Chem, vol. 79, no. 22, pp. 8608–8615, 2007.
[95] B. Fabre, S. Burlet, R. Cespuglio, and G. Bidan, “Voltammetric detection
of NO in the rat brain with an electronic conducting polymer and Nafion®
bilayer-coated carbon fibre electrode,” Journal of Electroanalytical Chemistry,
vol. 426, no. 1-2, pp. 75–83, 1997.
[96] M. Madaras, I. Popescu, S. Ufer, and R. Buck, “Microfabricated amperometric
creatine and creatinine biosensors,” Analytica Chimica Acta, vol. 319, no. 3,
pp. 335–345, 1996.
[97] R. Kumar and N. Majeti, “A review of chitin and chitosan applications,”
Reactive and Functional Polymers, vol. 46, no. 1, pp. 1–27, 2000.
[98] G. Ertl, Dynamics of Reactions at Surfaces in Impact of surface science on
catalysis. Academic Pr, 2001.
[99] M. Pontié and F. Bedioui, “Evaluation of the nonbiofouling behaviour of ni-
tric oxide electrochemical sensor materials by using sessile drop contact angle
measurements and free enthalpy of adhesion calculations,” Materials Science
and Engineering C, vol. 21, no. 1-2, pp. 69–73, 2002.
[100] R. Battino and H. Clever, “The solubility of gases in liquids,” Chemical Re-
views, vol. 66, no. 4, pp. 395–463, 1966.
[101] R. Riley, J. Gardner, and U. Merten, “Cellulose acetate membranes: Electron
microscopy of structure,” Science, vol. 143, pp. 801–803, 1964.
BIBLIOGRAPHY 176
[102] B. Dzamba and D. Peters, “Arrangement of cellular fibronectin in noncollage-
nous fibrils in human fibroblast cultures,” Journal of Cell Science, vol. 100,
no. 3, pp. 605–612, 1991.
[103] R. Xia, F. Berger, B. Piallat, and A. Benabid, “Alteration of hormone and
neurotransmitter production in cultured cells by high and low frequency elec-
trical stimulation,” Acta Neurochirurgica, vol. 149, no. 1, pp. 67–73, 2007.
[104] S. Moncada, R. Palmer, and E. Higgs, “Nitric oxide: physiology, pathophys-
iology, and pharmacology,” Pharmacological Reviews, vol. 43, pp. 109–142,
1991.
[105] D. Bredt and S. Snyder, “Nitric oxide: a physiologic messenger molecule,”
Annual Review of Biochemistry, vol. 63, no. 1, pp. 175–195, 1994.
[106] S. Moncada and E. Higgs, “Endogenous nitric oxide: physiology, pathology
and clinical relevance,” European Journal of Clinical Investigation, vol. 21,
no. 4, pp. 361–374, 1991.
[107] J. Stamler and G. Meissner, “Physiology of nitric oxide in skeletal muscle,”
Physiological Reviews, vol. 81, no. 1, p. 209, 2001.
[108] J. Garthwaite and C. Boulton, “Nitric oxide signaling in the central nervous
system,” Annual Review of Physiology, vol. 57, no. 1, pp. 683–706, 1995.
[109] D. Bredt and S. Snyder, “Nitric oxide, a novel neuronal messenger.,” Neuron,
vol. 8, no. 1, p. 3, 1992.
BIBLIOGRAPHY 177
[110] R. Knowles, M. Palacios, R. Palmer, and S. Moncada, “Formation of nitric
oxide from L-arginine in the central nervous system: a transduction mechanism
for stimulation of the soluble guanylate cyclase,” Proceedings of the National
Academy of Sciences of the United States of America, vol. 86, no. 13, pp. 5159–
5162, 1989.
[111] D. Bredt, P. Hwang, and S. Snyder, “Localization of nitric oxide synthase
indicating a neural role for nitric oxide,” Nature, vol. 347, pp. 768–770, 1990.
[112] V. Calabrese, C. Mancuso, M. Calvani, E. Rizzarelli, D. Butterfield, and
A. Giuffrida Stella, “Nitric oxide in the central nervous system: neuropro-
tection versus neurotoxicity,” Nature Reviews Neuroscience, vol. 8, no. 10,
pp. 766–775, 2007.
[113] J. Assreuy, F. Cunha, M. Epperlein, A. Noronha-Dutra, C. O’Donnell, F. Liew,
and S. Moncada, “Production of nitric oxide and superoxide by activated
macrophages and killing of Leishmania major,” European Journal of Immunol-
ogy, vol. 24, no. 3, pp. 672–676, 1994.
[114] C. Nathan and J. Hibbs Jr, “Role of nitric oxide synthesis in macrophage
antimicrobial activity,” Current Opinion in Immunology, vol. 3, no. 1, pp. 65–
70, 1991.
[115] R. Palmer, A. Ferrige, S. Moncada, et al., “Nitric oxide release accounts for the
biological activity of endothelium-derived relaxing factor,” Nature, vol. 327,
no. 6122, pp. 524–526, 1987.
BIBLIOGRAPHY 178
[116] J. Cooke, MD and V. Dzau, MD, “Nitric oxide synthase: role in the genesis
of vascular disease,” Annual Review of Medicine, vol. 48, no. 1, pp. 489–509,
1997.
[117] H. Steinberg, G. Brechtel, A. Johnson, N. Fineberg, and A. Baron, “Insulin-
mediated skeletal muscle vasodilation is nitric oxide dependent. A novel action
of insulin to increase nitric oxide release,” Journal of Clinical Investigation,
vol. 94, no. 3, pp. 1172–1179, 1994.
[118] N. Ferrara, “Role of vascular endothelial growth factor in regulation of phys-
iological angiogenesis,” American Journal of Physiology- Cell Physiology,
vol. 280, no. 6, pp. 1358–1366, 2001.
[119] D. Fukumura, T. Gohongi, A. Kadambi, Y. Izumi, J. Ang, C. Yun, D. Buerk,
P. Huang, and R. Jain, “Predominant role of endothelial nitric oxide syn-
thase in vascular endothelial growth factor-induced angiogenesis and vascular
permeability,” Proceedings of the National Academy of Sciences of the United
States of America, vol. 98, no. 5, pp. 2604–2609, 2001.
[120] M. Goligorsky, A. Budzikowski, H. Tsukahara, and E. Noiri, “Co-operation
between endothelin and nitric oxide in promoting endothelial cell migration
and angiogenesis,” Clinical and Experimental Pharmacology and Physiology,
vol. 26, no. 3, pp. 269–271, 1999.
[121] D. Fukumura and R. Jain, “Role of nitric oxide in angiogenesis and micro-
circulation in tumors,” Cancer Metastasis Reviews, vol. 17, no. 1, pp. 77–89,
BIBLIOGRAPHY 179
1998.
[122] K. Harding, H. Morris, and G. Patel, “Healing chronic wounds,” British Med-
ical Journal, vol. 324, no. 7330, pp. 160–163, 2002.
[123] O. Baum, L. Da Silva-Azevedo, G. Willerding, A. Wockel, G. Planitzer,
R. Gossrau, A. Pries, and A. Zakrzewicz, “Endothelial NOS is main medi-
ator for shear stress-dependent angiogenesis in skeletal muscle after prazosin
administration,” American Journal of Physioloy- Heart and Circulatory Phys-
iology, vol. 287, no. 5, pp. 2300–2308, 2004.
[124] G. Buga, M. Gold, J. Fukuto, and L. Ignarro, “Shear stress-induced release
of nitric oxide from endothelial cells grown on beads,” Hypertension, vol. 17,
no. 2, pp. 187–193, 1991.
[125] E. Clark and J. Brugge, “Integrins and signal transduction pathways: the road
taken,” Science, vol. 268, no. 5208, pp. 233–239, 1995.
[126] R. Palmer, D. Ashton, and S. Moncada, “Vascular endothelial cells synthesize
nitric oxide from L-arginine,” Nature, vol. 333, pp. 664–666, 1988.
[127] S. Moncada and E. Higgs, “Mechanisms of disease: the L-arginine-nitric oxide
pathway,” New England Journal of Medicine, vol. 329, pp. 2002–2012, 1993.
[128] D. Rees, R. Palmer, R. Schulz, H. Hodson, and S. Moncada, “Characterization
of three inhibitors of endothelial nitric oxide synthase in vitro and in vivo,”
British Journal of Pharmacology, vol. 101, pp. 746–752, 1990.
BIBLIOGRAPHY 180
[129] P. Kubes, M. Suzuki, D. Granger, et al., “Nitric oxide: an endogenous modu-
lator of leukocyte adhesion,” Proceedings of the National Academy of Sciences
of the United States of America, vol. 88, pp. 4651–4655, 1991.
[130] Y. Feng, V. Venema, R. Venema, N. Tsai, and R. Caldwell, “VEGF induces
nuclear translocation of Flk-1/KDR, endothelial nitric oxide synthase, and
caveolin-1 in vascular endothelial cells,” Biochemical and Biophysical Research
Communication, vol. 256, no. 1, pp. 192–197, 1999.
[131] L. Morbidelli, C. Chang, J. Douglas, H. Granger, F. Ledda, and M. Ziche, “Ni-
tric oxide mediates mitogenic effect of VEGF on coronary venular endothe-
lium,” American Journal of Physiology- Heart and Circulatory Physiology,
vol. 270, no. 1, pp. H411–H415, 1996.
[132] A. Bouloumie, V. Schini-Kerth, and R. Busse, “Vascular endothelial growth
factor up-regulates nitric oxide synthase expression in endothelial cells,” Car-
diovascular Research, vol. 41, no. 3, pp. 773–780, 1999.
[133] S. Archer, “Measurement of nitric oxide in biological models,” FASEB Journal,
vol. 7, no. 2, p. 349, 1993.
[134] M. Feelisch and J. Stamler, Methods in nitric oxide research. John Wiley &
Sons Inc, 1996.
[135] W. Sessa, K. Pritchard, N. Seyedi, J. Wang, and T. Hintze, “Chronic exercise
in dogs increases coronary vascular nitric oxide production and endothelial cell
BIBLIOGRAPHY 181
nitric oxide synthase gene expression,” Circulation Research, vol. 74, no. 2,
pp. 349–353, 1994.
[136] D. Bredt and S. Snyder, “Nitric oxide mediates glutamate-linked enhancement
of cGMP levels in the cerebellum,” Proceedings of the National Academy of
Sciences of the United States of America, vol. 86, no. 22, pp. 9030–9033, 1989.
[137] N. Nakatsubo, H. Kojima, K. Kikuchi, H. Nagoshi, Y. Hirata, D. Maeda,
Y. Imai, T. Irimura, and T. Nagano, “Direct evidence of nitric oxide pro-
duction from bovine aortic endothelial cells using new fluorescence indicators:
diaminofluoresceins,” FEBS Letters, vol. 427, no. 2, pp. 263–266, 1998.
[138] D. Bredt, S. Snyder, et al., “Isolation of nitric oxide synthetase, a calmodulin-
requiring enzyme,” Proceedings of the National Academy of Sciences of the
United States of America, vol. 87, no. 2, pp. 682–685, 1990.
[139] M. Tarpey and I. Fridovich, “Methods of detection of vascular reactive species:
nitric oxide, superoxide, hydrogen peroxide, and peroxynitrite,” Circulation
research, vol. 89, no. 3, p. 224, 2001.
[140] F. Bedioui and N. Villeneuve, “Electrochemical nitric oxide sensors for biolog-
ical samples-principle, selected examples and applications,” Electroanalysis,
vol. 15, no. 1, pp. 5–18, 2003.
[141] F. Bedioui, S. Trevin, and J. Devynck, “Chemically modified microelectrodes
designed for the electrochemical determination of nitric oxide in biological
systems,” Electroanalysis, vol. 8, no. 12, pp. 1085–1091, 1996.
BIBLIOGRAPHY 182
[142] F. Bedioui, S. Trevin, J. Dvynck, F. Lantoine, A. Brunet, and M. Devynck,
“Elaboration and use of nickel planar macrocyclic complex-based sensors for
the direct electrochemical measurement of nitric oxide in biological media,”
Biosensors and Bioelectronics, vol. 12, no. 3, pp. 205–212, 1997.
[143] C. Amatore, S. Arbault, D. Bruce, P. Oliveira, M. Erard, and M. Vuillaume,
“Analysis of individual biochemical events based on artificial synapses using
ultramicroelectrodes: cellular oxidative burst,” Faraday Discussions, vol. 116,
pp. 319–333, 2000.
[144] J. Balligand, D. Ungureanu-Longrois, W. Simmons, D. Pimental, T. Malinski,
M. Kapturczak, Z. Taha, C. Lowenstein, A. Davidoff, and R. Kelly, “Cytokine-
inducible nitric oxide synthase (iNOS) expression in cardiac myocytes. Char-
acterization and regulation of iNOS expression and detection of iNOS activity
in single cardiac myocytes in vitro,” Journal of Biological Chemistry, vol. 269,
no. 44, pp. 27580–25788, 1994.
[145] K. Kamei, M. Mie, Y. Yanagida, M. Aizawa, and E. Kobatake, “Construction
and use of an electrochemical NO sensor in a cell-based assessing system,”
Sensors and Actuators, B, vol. 99, no. 1, pp. 106–112, 2004.
[146] A. Parenti, L. Morbidelli, X. Cui, J. Douglas, J. Hood, H. Granger, F. Ledda,
and M. Ziche, “Nitric oxide is an upstream signal of vascular endothelial
growth factor-induced extracellular signal-regulated kinase1/2 activation in
postcapillary endothelium,” Journal of Biological Chemistry, vol. 273, no. 7,
pp. 4220–4226, 1998.
BIBLIOGRAPHY 183
[147] H. Gerber, A. McMurtrey, J. Kowalski, M. Yan, B. Keyt, V. Dixit, and N. Fer-
rara, “Vascular Endothelial Growth Factor Regulates Endothelial Cell Survival
through the Phosphatidylinositol 3’-Kinase/Akt Signal Transduction Path-
way requirement for Flk-1/KDR activation,” Journal of Biological Chemistry,
vol. 273, no. 46, pp. 30336–30343, 1998.
[148] J. Reiners, J. Lee, R. Clift, D. Dudley, and S. Myrand, “PD98059 is an equipo-
tent antagonist of the aryl hydrocarbon receptor and inhibitor of mitogen-
activated protein kinase kinase,” Molecular Pharmacology, vol. 53, no. 3,
p. 438, 1998.
[149] C. Vlahos, W. Matter, K. Hui, and R. Brown, “A specific inhibitor of phos-
phatidylinositol 3-kinase, 2-(4-morpholinyl)-8-phenyl-4H-1-benzopyran-4-one
(LY294002).,” Journal of Biological Chemistry, vol. 269, no. 7, p. 5241, 1994.
[150] M. Feelisch, “The biochemical pathways of nitric oxide formation from ni-
trovasodilators: appropriate choice of exogenous NO donors and aspects of
preparation and handling of aqueous NO solutions,” Journal of Cardiovascu-
lar pharmacology, vol. 17, pp. S25–hyhen, 1991.
[151] R. Carvalhal, R. Freire, and L. Kubota, “Polycrystalline gold electrodes: a
comparative study of pretreatment procedures used for cleaning and thiol
self-assembly monolayer formation,” Electroanalysis, vol. 17, no. 14, pp. 1251–
1259, 2005.
BIBLIOGRAPHY 184
[152] J. Tomeš, “Polarographic Studies with the Dropping Mercury Cathode.
LXVII. Equations of the Polarographic Wave in the Electrodeposition of Hy-
drogen from Strong and Weak Acid,” Collection of Czechoslovak Chemical
Communications, vol. 9, pp. 150–167, 1937.
[153] M. Betlach and J. Tiedje, “Kinetic explanation for accumulation of nitrite,
nitric oxide, and nitrous oxide during bacterial denitrification,” Applied and
Environmental Microbiology, vol. 42, no. 6, pp. 1074–1084, 1981.
[154] M. Radomski, R. Palmer, and S. Moncada, “Characterization of the L-
arginine: nitric oxide pathway in human platelets.,” British Journal of Phar-
macology, vol. 101, no. 2, pp. 325–328, 1990.
[155] C. Reinhart-King, “Endothelial cell adhesion and migration,” Angiogenesis:
In Vitro Systems, pp. 45–64, 2008.
[156] F. Re, A. Zanetti, M. Sironi, N. Polentarutti, L. Lanfrancone, E. Dejana, and
F. Colotta, “Inhibition of anchorage-dependent cell spreading triggers apop-
tosis in cultured human endothelial cells.,” Journal of cell biology, vol. 127,
no. 2, p. 537, 1994.
[157] M. Cupery, “Sulfamic Acid A New Industrial Chemical,” Industrial & Engi-
neering Chemistry, vol. 30, no. 6, pp. 627–631, 1938.
[158] U. Frandsen, J. Bangsbo, M. Sander, L. Höffner, A. Betak, B. Saltin, and
Y. Hellsten, “Exercise-induced hyperaemia and leg oxygen uptake are not
BIBLIOGRAPHY 185
altered during effective inhibition of nitric oxide synthase with NG-nitro-L-
arginine methyl ester in humans,” Journal of Physiology, vol. 531, no. 1,
pp. 257–264, 2001.
[159] H. He, V. Venema, X. Gu, R. Venema, M. Marrero, and R. Caldwell, “Vascular
endothelial growth factor signals endothelial cell production of nitric oxide and
prostacyclin through flk-1/KDR activation of c-Src,” Journal of Biological
Chemistry, vol. 274, no. 35, pp. 25130–25135, 1999.
[160] H. Wu, Y. Yuan, D. Zawieja, J. Tinsley, and H. Granger, “Role of phospholi-
pase C, protein kinase C, and calcium in VEGF-induced venular hyperperme-
ability,” American Journal of Physiology- Heart and Circulatory Physiology,
vol. 276, no. 2, pp. H535–H542, 1999.
[161] S. Dimmeler, E. Dernbach, and A. Zeiher, “Phosphorylation of the endothelial
nitric oxide synthase at ser-1177 is required for VEGF-induced endothelial cell
migration,” FEBS Letters, vol. 477, no. 3, pp. 258–262, 2000.
[162] J. Breslin, P. Pappas, J. Cerveira, R. Hobson, and W. Duran, “VEGF increases
endothelial permeability by separate signaling pathways involving ERK-1/2
and nitric oxide,” American Journal of Physiology- Heart and Circulatory
Physiology, vol. 284, no. 1, pp. H92–H100, 2003.
[163] I. Zachary, “VEGF signalling: integration and multi-tasking in endothelial cell
biology,” Biochemical Society Transactions, vol. 31, pp. 1171–1177, 2003.
BIBLIOGRAPHY 186
[164] H. He, V. Venema, X. Gu, R. Venema, M. Marrero, and R. Caldwell, “Vascular
endothelial growth factor signals endothelial cell production of nitric oxide and
prostacyclin through flk-1/KDR activation of c-Src,” Journal of Biological
Chemistry, vol. 274, no. 35, pp. 25130–25135, 1999.
[165] S. Dimmeler, K. Breitschopf, J. Haendeler, and A. Zeiher, “Dephosphory-
lation targets Bcl-2 for ubiquitin-dependent degradation: a link between the
apoptosome and the proteasome pathway,” Journal of Experimental Medicine,
vol. 189, no. 11, pp. 1815–1822, 1999.
[166] S. Chlench, N. Mecha Disassa, M. Hohberg, C. Hoffmann, T. Pohlkamp,
G. Beyer, M. Bongrazio, L. Da Silva-Azevedo, O. Baum, A. Pries, et al.,
“Regulation of Foxo-1 and the angiopoietin-2/Tie2 system by shear stress,”
FEBS Letters, vol. 581, no. 4, pp. 673–680, 2007.
[167] X. Gao and Z. Xu, “Mechanisms of action of angiogenin,” Acta Biochimica et
Biophysica Sinica, vol. 40, no. 7, pp. 619–624, 2008.
[168] K. Kishimoto, S. Liu, T. Tsuji, K. Olson, and G. Hu, “Endogenous angio-
genin in endothelial cells is a general requirement for cell proliferation and
angiogenesis,” Oncogene, vol. 24, no. 3, pp. 445–456, 2004.
[169] D. Fukumura and R. Jain, “Role of nitric oxide in angiogenesis and microcir-
culation in tumors,” Cancer and Metastasis Reviews, vol. 17, no. 1, pp. 77–89,
1998.
BIBLIOGRAPHY 187
[170] S. Babaei, K. Teichert-Kuliszewska, J. Monge, F. Mohamed, M. Bendeck, and
D. Stewart, “Role of nitric oxide in the angiogenic response in vitro to basic
fibroblast growth factor,” Circulation Research, vol. 82, no. 9, pp. 1007–1015,
1998.
[171] M. Ziche, L. Morbidelli, E. Masini, H. Granger, P. Geppetti, and F. Ledda,
“Nitric oxide promotes DNA synthesis and cyclic GMP formation in endothe-
lial cells from postcapillary venules,” Biochemical and Biophysical Research
Communications, vol. 192, no. 3, pp. 1198–1203, 1993.
[172] M. Ziche, L. Morbidelli, E. Masini, S. Amerini, H. J. Granger, C. A. Maggi,
P. Geppetti, and F. Ledda, “Nitric oxide mediates angiogenesis in vivo and
endothelial cell growth and migration in vitro promoted by substance P,”
Journal of Clinical Investigations., vol. 94, pp. 2036–2044, 1994.
[173] E. Chavakis and S. Dimmeler, “Regulation of endothelial cell survival and
apoptosis during angiogenesis,” Arteriosclerosis, Thrombosis, and Vascular
Biology, vol. 22, no. 6, pp. 887–893, 2002.
[174] G. Hu, J. Riordan, and B. Vallee, “A putative angiogenin receptor in
angiogenin-responsive human endothelial cells,” Proceedings of the National
Academy of Sciences of the United States of America, vol. 94, no. 6, pp. 2204–
2209, 1997.
[175] S. Jang, D. Kang, S. Chang, H. Scheraga, and H. Shin, “High level production
of bovine angiogenin in E. coli by an efficient refolding procedure,” Biotech-
BIBLIOGRAPHY 188
nology Letters, vol. 26, no. 19, pp. 1501–1504, 2004.
[176] G. Hu, “Neomycin inhibits angiogenin-induced angiogenesis,” Proceedings of
the National Academy of Sciences of the United States of America, vol. 95,
no. 17, p. 9791, 1998.
[177] S. Dimmeler, E. Dernbach, and A. Zeiher, “Phosphorylation of the endothelial
nitric oxide synthase at ser-1177 is required for VEGF-induced endothelial cell
migration,” FEBS letters, vol. 477, no. 3, pp. 258–262, 2000.
[178] M. Tamura, J. Gu, K. Matsumoto, S. Aota, R. Parsons, and K. Yamada, “In-
hibition of cell migration, spreading, and focal adhesions by tumor suppressor
PTEN,” Science, vol. 280, no. 5369, pp. 1614–1617, 1998.
[179] J. Huang and C. Kontos, “PTEN modulates vascular endothelial growth
factor-mediated signaling and angiogenic effects,” Journal of Biological Chem-
istry, vol. 277, no. 13, pp. 10760–10766, 2002.
[180] Z. Xu, D. Monti, and G. Hu, “Angiogenin activates human umbilical artery
smooth muscle cells,” Biochemical and Biophysical Research Communications,
vol. 285, no. 4, pp. 909–914, 2001.
[181] G. Hu, “Neomycin inhibits the angiogenic activity of fibroblast and epider-
mal growth factors,” Biochemical and Biophysical Research Communications,
vol. 287, no. 4, pp. 870–874, 2001.
[182] R. Trouillon, C. Cheung, B. Patel, and D. O’Hare, “Electrochemical study
of the intracellular transduction of vascular endothelial growth factor in-
BIBLIOGRAPHY 189
duced nitric oxide synthase activity using a multi-channel biocompatible
microelectrode array,” Biochimica et Biophysica Acta- General Subjects,
p. doi:10.1016/j.bbagen.2010.04.010, 2010.
[183] S. Shimoyama, F. Gansauge, S. Gansauge, G. Negri, T. Oohara, and H. Beger,
“Increased angiogenin expression in pancreatic cancer is related to cancer ag-
gressiveness,” Cancer Research, vol. 56, no. 12, pp. 2703–2706, 1996.
[184] G. Hu, J. Riordan, and B. Vallee, “Angiogenin promotes invasiveness of cul-
tured endothelial cells by stimulation of cell-associated proteolytic activities,”
Proceedings of the National Academy of Sciences of the United States of Amer-
ica, vol. 91, no. 25, pp. 12096–12100, 1994.
[185] N. Russo, R. Shapiro, K. Acharya, J. Riordan, and B. Vallee, “Role of
glutamine-117 in the ribonucleolytic activity of human angiogenin,” Proceed-
ings of the National Academy of Sciences of the United States of America,
vol. 91, no. 8, pp. 2920–2924, 1994.
[186] S. Liu, D. Yu, Z. Xu, J. Riordan, and G. Hu, “Angiogenin activates Erk1/2 in
human umbilical vein endothelial cells,” Biochemical and Biophysical Research
Communications, vol. 287, no. 1, pp. 305–310, 2001.
[187] H. Kim, D. Kang, H. Kim, S. Kang, and S. Chang, “Angiogenin-induced pro-
tein kinase B/Akt activation is necessary for angiogenesis but is independent
of nuclear translocation of angiogenin in HUVE cells,” Biochemical and Bio-
physical Research Communications, vol. 352, no. 2, pp. 509–513, 2007.
BIBLIOGRAPHY 190
[188] R. Li, J. Riordan, and G. Hu, “Nuclear translocation of human angiogenin
in cultured human umbilical artery endothelial cells is microtubule and lyso-
some independent,” Biochemical and Biophysical Research Communications,
vol. 238, no. 2, pp. 305–312, 1997.
[189] G. Hu, C. Xu, and J. Riordan, “Human angiogenin is rapidly translocated
to the nucleus of human umbilical vein endothelial cells and binds to DNA,”
Journal of Cellular Biochemistry, vol. 76, no. 3, pp. 452–462, 2000.
[190] C. Kimura, T. Koyama, M. Oike, and Y. Ito, “Hypotonic stress-induced NO
production in endothelium depends on endogenous ATP,” Biochemical and
Biophysical Research Communications, vol. 274, no. 3, pp. 736–740, 2000.
[191] N. Yoshioka, L. Wang, K. Kishimoto, T. Tsuji, and G. Hu, “A therapeutic
target for prostate cancer based on angiogenin-stimulated angiogenesis and
cancer cell proliferation,” Proceedings of the National Academy of Sciences of
the United States of America, vol. 103, no. 39, pp. 14519–14524, 2006.
[192] J. Heo, Y. Lee, and H. Han, “EGF stimulates proliferation of mouse embry-
onic stem cells: involvement of Ca2+ influx and p44/42 MAPKs,” American
Journal of Physiology- Cell Physiology, vol. 290, no. 1, pp. 123–133, 2006.
[193] M. Cheng, X. Liu, Y. Li, R. Tang, W. Zhang, J. Wu, L. Li, X. Liu, Y. Gang,
and H. Chen, “IL-8 gene induction by low shear stress: Pharmacological eval-
uation of the role of signaling molecules,” Biorheology, vol. 44, no. 5, pp. 349–
360, 2007.
BIBLIOGRAPHY 191
[194] R. Berra Romani, A. Raqeeb, U. Laforenza, M. Scaffino, F. Moccia, J. Avelino-
Cruz, A. Oldani, D. Coltrini, V. Milesi, V. Taglietti, et al., “Cardiac Microvas-
cular Endothelial Cells Express a Functional Ca-Sensing Receptor,” Journal
of Vascular Research, vol. 46, no. 1, pp. 73–82, 2009.
[195] T. Miyazaki, K. Honda, and H. Ohata, “Requirement of Ca2+ influx-and phos-
phatidylinositol 3-kinase-mediated m-calpain activity for shear stress-induced
endothelial cell polarity,” American Journal of Physiology- Cell Physiology,
vol. 293, no. 4, pp. C1216–C1225, 2007.
[196] B. Michell, J. Griffiths, K. Mitchelhill, I. Rodriguez-Crespo, T. Tiganis,
S. Bozinovski, P. De Montellano, B. Kemp, and R. Pearson, “The Akt ki-
nase signals directly to endothelial nitric oxide synthase,” Current Biology,
vol. 9, no. 15, pp. 845–848, 1999.
[197] D. Fulton, J. Gratton, T. McCabe, J. Fontana, Y. Fujio, K. Walsh, T. Franke,
A. Papapetropoulos, and W. Sessa, “Regulation of endothelium-derived ni-
tric oxide production by the protein kinase Akt,” Nature, vol. 399, no. 6736,
pp. 597–601, 1999.
[198] B. Michell, J. Griffiths, K. Mitchelhill, I. Rodriguez-Crespo, T. Tiganis,
S. Bozinovski, P. De Montellano, B. Kemp, and R. Pearson, “The Akt ki-
nase signals directly to endothelial nitric oxide synthase,” Current Biology,
vol. 9, no. 15, pp. 845–848, 1999.

BIBLIOGRAPHY 192
[199] A. Grasselli, S. Nanni, C. Colussi, A. Aiello, V. Benvenuti, G. Ragone,
F. Moretti, A. Sacchi, S. Bacchetti, C. Gaetano, et al., “Estrogen Receptor-α
and Endothelial Nitric Oxide Synthase Nuclear Complex Regulates Transcrip-
tion of Human Telomerase,” Circulation Research, vol. 103, no. 1, pp. 34–42,
2008.
[200] R. Trouillon and D. O’Hare, “Comparison of glassy carbon and boron
doped diamond electrodes: resistance to biofouling,” Electrochimica Acta,
p. doi:10.1016/j.electacta.2010.06.016, 2010.
[201] R. Trouillon, D. Kang, H. Park, S. Chang, and D. O’Hare, “Angiogenin In-
duces Nitric Oxide Synthesis in Endothelial Cells through PI-3 and Akt Ki-
nases,” Biochemistry, vol. 49, no. 15, pp. 3282–3288, 2010.
[202] N. Wisniewski and M. Reichert, “Methods for reducing biosensor membrane
biofouling,” Colloids Surfaces, B, vol. 18, no. 3-4, pp. 197–219, 2000.
[203] B. Fabre, S. Burlet, R. Cespuglio, and G. Bidan, “Voltammetric detection
of NO in the rat brain with an electronic conducting polymer and Nafion®
bilayer-coated carbon fibre electrode,” Journal of Electroanalytical Chemistry,
vol. 426, no. 1-2, pp. 75–83, 1997.
[204] D. Hibbert, Introduction to electrochemistry. Macmillan, 1993.
[205] J. Davis, K. McKeegan, M. Cardosi, and D. Vaughan, “Evaluation of phenolic
assays for the detection of nitrite,” Talanta, vol. 50, no. 1, pp. 103–112, 1999.
BIBLIOGRAPHY 193
[206] M. Bindschadler and J. McGrath, “Sheet migration by wounded monolayers
as an emergent property of single-cell dynamics,” Journal of Cell Science,
vol. 120, no. 5, pp. 876–884, 2007.
[207] D. Fulton, J. Gratton, T. McCabe, J. Fontana, Y. Fujio, K. Walsh, T. Franke,
A. Papapetropoulos, and W. Sessa, “Regulation of endothelium-derived nitric
oxide production by the protein kinase Akt,” Nature, vol. 399, pp. 597–601,
1999.
[208] Q. Chen and G. Swain, “Structural characterization, electrochemical reactiv-
ity, and response stability of hydrogenated glassy carbon electrodes,” Lang-
muir, vol. 14, no. 24, pp. 7017–7026, 1998.
[209] N. Wisniewski and M. Reichert, “Methods for reducing biosensor membrane
biofouling,” Colloids and Surfaces B, vol. 18, no. 3-4, pp. 197–219, 2000.
[210] G. Swain, Electrically conducting diamond thin films: advanced electrode ma-
terials for electrochemical technologies in Electroanalytical chemistry Vol. 22.
Marcel Dekker Inc., New York, 2004.