electrochemical properties of nanoporous carbon electrodes∗
TRANSCRIPT
Condensed Matter Physics, 2002, Vol. 5, No. 2(30), pp. 307–327
Electrochemical properties ofnanoporous carbon electrodes∗
E.Lust 1,2 , G.Nurk 1,2 , A.Janes 1,2 , M.Arulepp 1,2 ,L.Permann 2 , P.Nigu 2 , P.Moller 2
1 Institute of Physical Chemistry, University of Tartu2 Jakobi Str., 51014 Tartu, Estonia
2 Tartu Technologies Ltd., 185 Riia Str., 51014 Tartu, Estonia
Received October 5, 2001, in final form December 28, 2001
Electrical double layer and electrochemical characteristics at the nano-porous carbon | (C2H5)4NBF4+acetonitrile interface have been studied bythe cyclic voltammetry and impedance spectroscopy methods. The valueof zero charge potential (0.23 V vs. SCE in H2O), the region of ideal polar-izability and other characteristics have been established. Analysis of com-plex plane plots shows that the nanoporous carbon | x M (C2H5)4NBF4 +acetonitrile interface can be simulated by the equivalent circuit, in whichthe two parallel conduction parts in the solid and liquid phases are inter-connected by the double layer capacitance in parallel with the complexadmittance of hindered reaction of the charge transfer process. The valuesof the characteristic frequency depend on the electrolyte concentration andon the electrode potential, i.e. on the nature of ions adsorbed at the surfaceof nanoporous carbon electrode.
Key words: electrical double layer, nanoporous carbon, zero chargepotential, nonaqueous electrolyte solution
PACS: 68.08.-p, 68.08.De
1. Introduction and theoretical background
Electrochemical and electrical double layer characteristics of the carbon elec-trodes have been studied for a long time, but there are many problems, which havenot been solved at the moment. Electric double layer characteristics of various car-bonaceous materials are very important as these parameters determine the electricalbehaviour of the electrical double layer capacitors (EDLC-s).
EDLC-s are the energy conservation systems, in which the electrical charge isstored in the electric double layer and it is based mainly on the electrostatic interac-tions. As the electrostatic interactions are significantly less detrimental to electrodes
∗This paper is dedicated to Jean-Pierre Badiali on the occasion of his 60th birthday
c© E.Lust, G.Nurk, A.Janes, M.Arulepp, L.Permann, P.Nigu, P.Moller 307

E.Lust et al.
and solution stability than the usual electrochemical redox reactions, used for thegeneration of electricity in the fuel cells as well as in various batteries, EDLC can berecharged-discharged up to 106 times. The very important advantages of EDLC aretheir reversibility and comparatively low temperature coefficient [1]. However, a veryimportant problem with EDLC is their relatively low energy density compared withthe rechargeable batteries. It is well known that the performance specifications ofelectrochemical capacitor e.g. in terms of the relations between the achieved powerdensities and corresponding energy densities depend on the equivalent series resis-tance (ESR) and on the internal distribution of electrode resistance (IER) in thepore matrix of the electrodes.
The capacitance of EDLC depends mainly on the surface area of carbon materialused for the preparation of the electrodes. Theoretically, the higher surface area ofthe activated carbon the higher specific capacitance should be expected. The spe-cific capacitance should be defined as the specific surface area of carbon multipliedby the double layer capacitance Cdl (F/cm
2) [1]. However, the practical situation ismore complicated and usually the capacitance measured does not have the linearrelationship with the specific surface area of the electrode material. In fact, someactivated carbons with smaller specific surface area demonstrate higher specific ca-pacitance values than those with larger surface area. There are two main reasons forthis phenomenon:
(1) the double layer capacitance Cdl varies with various types of activated car-bons that were made from the different types of precursors (through differentprocesses and subsequent treatments);
(2) the nanopores with small diameter may not be accessible to the electrolytesolution, simply because the electrolyte ions, especially big organic ions andions with the hydration cell, are too big to enter into the nanopores. Thus, thesurface area of these non-accessible nanopores will not contribute to the totaldouble layer capacitance of the electrode material.
It should be noted that in the literature there are very big differences between thevalues of the electric double layer capacitance of the carbonaceous materials, rangingfrom 3 µF/cm2 for the basal plane C(0001) (cut surface) of stress-annealed highlyoriented pyrolytic graphite (HOPC) to 70 µF/cm−2 for the polished graphite edgeplane [1–3]. This surprisingly low non-faradaic differential capacitance value for theC(0001) plane compared with the capacitance values for metals (18 . . . 20 µF/cm2 forHg, Bi and Cd), having nearly parabolic dependence on the electrode potential, canbe explained on the basis that the substantial fraction of the potential drop betweenthe solid electrode and the solution occurs in a space charge layer within the HOPC.In 70th and 80th, various physical models were introduced into the electrochemistry,taking into account the potential drop in the thin surface layer of the electrode.
The model worked out by Amokrane and Badiali [4,5] gives good explanations ofthe capacitance data established for different metal electrodes in various aqueous andnon-aqueous solutions [6,7]. In this theory, the metal is described using the densityfunctional formalism, and the metal-solvent interaction as a sum of an attractive
308

Nanoporous electrodes
term (due to the dispersion forces (Van der Waals)) and a repulsion term (simulatingthe exclusion of the metal electrons from the electron cloud of the solvent molecules).
According to the results of investigations [4–7], the inverse inner layer capacitancecan be expressed as
C−1i = C−1
s + C−1m , (1)
where Cm is the capacitance of the metal phase. Systematic analysis of experimentaldata shows that the inverse capacitance of the solvent layer with a thickness l canbe obtained as
C−1s = 4πl −
(
4πNsµ2/εkT
)
1− coth2(x) + 1/x2
, (2)
where Ns is the number of dipoles per unit area; µ is the value of dipole moment;x = µE/kT (k is the Boltzmann constant) [4,5]. The effective field acting on adipole was taken as E = 4πσ∗/ε, where ε is an adjustable parameter having themeaning of an effective dielectric constant; and σ∗ is an effective charge density.The dependence of the capacitance of the carbon phase on the electrode rationalpotential (E − Eσ=0, where Eσ=0 is the zero charge potential), obtained assuming,to a first approximation, that this simplified model developed in [4,5] is valid forC(0001) with the cut surface (prepared according to the method described in [8,9])as well as for polished edge plane of HOPG and glassy carbon electrodes, is given infigure 1. It should be noted that the Amokrane and Badiali model has been workedout for the homogeneous planar and smooth surfaces with translational invarianceparallel to the metal surface [4,5]. Therefore, the values of Cm obtained for the cutC(0001) | 0.1 M NaF+H2O as well as for C(0001) | 0.2 M (C3H7)NBF4+acetonitrileinterface are realistic as the surface roughness of cut HOPC, i.e. C(0001) plane isvery small [8,9]. The inner layer values used for the calculation of the values ofCm for other carbon (i.e. glassy carbon) electrodes have been calculated using thesurface roughness factor obtained from impedance data according to the variousmodels [1,10–17] (Parsons-Zobel plot method, Valette-Hamelin approach, fractalanalysis described more in detail in [12,16,17]). According to the systematic analysisof experimental data, [12,16], the inner layer capacitance values depend only slightlyon the surface roughness of the solid electrode at |E| > Eσ=0, if cel > 0.1 M. Thevalues of inner layer capacitance obtained for polycrystalline metal electrodes liebetween the Ci values for single crystal planes for the corresponding metal [6,12,16],have the medium values and, to a first very rough approximation, characterize theinner layer parameters for metal | electrolyte interface under discussion. Only fordilute electrolyte systems (cel 6 0.01 M) in the region of zero charge potential thereis a complicated dependence of Ci on E, but at the electrode potentials |E| > Eσ=0,there is a monotonic dependence of Ci on E. More detailed analysis of the problemsfor polycrystalline metal electrode | electrolyte interface as well as for liquid | liquidinterface are given in [10–17]. Thus, the values of Cm for glassy carbon electrodes in0.1 M electrolyte solution have to be taken with some reservation because the valuesof the inner layer capacitance depend somewhat on the surface roughness values usedfor the calculation of Cm values [6,7,10–12]. However, the order of Cm values seemsto be reasonable and, thus, the data in figure 1 indicate that the capacitance of the
309

E.Lust et al.
carbon phase depends noticeably on the crystallographic structure of the carbonmaterial [1–3]. For that reason it seems to us that in any case, the potential dropin the thin surface layer of carbonaceous material is very important, but additionalstudies are inevitable.
It should be noted that the carbonaceous materials show the frequency-depend-ent capacitance even though the capacitance should be independent of frequency.This abnormal frequency-dependence is called a distributed characteristic or “fre-quency dispersion” of the electrical properties [1]. A circuit element with the dis-tributed characteristic can not be exactly expressed as a combination of a finitenumber of ideal circuit elements, except in certain limiting cases. The distributedcharacteristic results mainly from the two origins [1,6,18–25].
(1) It appears non-locally when a dimension of a system under study (electrodethickness or pore length) is longer than the characteristic length (for example,diffusion length or ac penetration depth), which is a function of frequency. Thistype of a distributed characteristic exists even when all system properties arehomogeneous and space-invariant (double layer charging of a porous electrode,diffusion in diffusion-limited systems, adsorption of anions and cations, surfacereconstruction and transformation in adlayers).
(2) The distributed characteristic is attributed to the various heterogeneities: ge-ometric inhomogeneity, such as the surface roughness or the distribution ofpore size as well as the crystallographic anisotropy and the surface disorder ofa polycrystalline electrode.
Beginning essentially with the work of de Levie [20,22,23], a large number ofvarious models have been developed [1,18,19,21,24,25] to theoretically describe theexperimental behaviour of the porous electrodes. A very important direction is theinvestigation of the influence of the pore geometry on the data of electrical impedancespectroscopy (EIS) [24,25]. Some authors used simple modifications of the classicalRandles-Frumkin-Melik-Gaikazyan equivalent circuits, involving a constant phaseelement or Warburg diffusion impedance modified according to the boundary con-ditions [1,21,26–30], as well as the branched transmission line equivalent circuits[1,18,31]. Paasch et al. [21] developed a theory for macroscopically homogeneousporous electrode, where the three main processes are considered: (a) ionic conduc-tivity in the porous electrolyte and electronic conductance in the electrode (solid)phase; (b) charging the double layer at the solid | liquid interface; and (c) the sim-ple charge transfer reaction (ctr.) at the interface. The averaged polarization at theporous surface was described by the diffusion equation with the linear source termrepresenting the ctr. with the charge transfer resistance Rctr. This leads to the po-larization of the porous electrode. According to this theory the position (x) andtime-dependent (t) polarization (E(x, t)) (averaged for the porous surface) has beengiven (without regard to an unknown constant) as
E(x, t) ≡ φ1 − φ2 , (3)
310

Nanoporous electrodes
σ
µ
Figure 1. The dependence of the electrode phase capacitance on the rationalelectrode potential for various electrode materials: (1) – Cd(0001); (2) – Hg; (3)– Bi(111); (4) – Sb(111); (5,6) – glassy carbon; (7) – stress annealed pyrolyticgraphite (recalc. from [1–3]); and (8) – stress annealed C(0001) (recalculated fromdata in [2]) in surface inactive electrolyte solutions (0.1 M NaF + H2O) (1–6,8)and in 0.2 M (C3H7)4NBF4 + acetonitrile solution (7).
311

E.Lust et al.
where φ1 is a value of potential in the solid phase (taken independent of x, φ1 6= f(x))[21]. The potential in the porous electrolyte φ2 depends on the conductivity, doublelayer formation parameters and ctr. characteristics of the interface. Averaging thispotential over the volume element containing many pores gives the position- andtime-dependent potential (φ2(x, t)).
The electrochemical impedance of an interface is determined by the potentialdrop Eel over an electrode [21]
Eel(ω) = φ1,a(d, ω)− φ2,a(0, ω) = Ea(d, ω) + φ2,a(d, ω)− φ2,a(0, ω), (4)
Z(ω) = Eel(ω)/Aja , (5)
where φ1,a(d, ω) is the solid phase potential at the contact side (x = d); φ2,a(0, ω) isthe electrolyte potential at electrolyte side (x = 0); ω is the ac angular frequency;and ja is the amplitude of the current density (reported to unit geometrical area ofthe electrode); A is the flat cross-section electrode area.
Using the conditions, which are usual in electrochemistry [19], the electrodeimpedance has been obtained as
Z(ω) = A−1
[
ρ21 + ρ22ρ1 + ρ2
coth(dβ)
β+
2ρ1ρ2ρ1 + ρ2
1
β sinh (dβ)+
dρ1ρ2ρ1 + ρ2
]
(6)
with
β =1
d
(
k + iω
ω1
)1/2
and ω1 =K
d2, (6a)
where ρ1 and ρ2 are the resistivities per unit length of the electrode material andof the electrolyte in the pores, respectively [21,32]; ω1 is a characteristic frequency,related to the finite “field diffusion” [21]. Parameter k is the characteristic frequencyproportional to the ratio of the exchange current density jo to the double layercapacitance C; and K is the so-called “field-diffusion constant”, depending on theohmic resistivities (ρ1 and ρ2) and on the value of capacitance. The ac penetrationlength λ is defined as [21]
λ =
(
2K/k
(1 + ω2/k2)1/2 + 1
)1/2
. (7)
In the conditions of diffusional hindrance at a planar porous electrode, the valueof charge transfer resistance, Rctr, has to be replaced as follows [21]
Rctr → Rctrz(ω) = Rctr
(
1 +√
ω2/iω)
, (8)
where z(ω) = 1/y(ω) is the value of volume-averaged hindrance impedance, describ-ing the deviation of a porous system from the conditions of the real charge transferresistance. For the simple electrochemical charge transfer reaction, the characteristicfrequency is given as
ω2 = k2het/D, (9)
312

Nanoporous electrodes
where D denotes the diffusion coefficient of the electroactive species and khet = kox+kred is a rate constant. For macroscopically homogeneous surfaces the equation (8)seems to explain the dominant dependence which only has to be corrected for the factthat the diffusion is finite owing to the small nanopore size. The corrected hindranceimpedance for a single kind of diffusing species, when the boundary condition is nota transmissive one, will be of the form
z(ω) = 1 +√
ω2/iω coth(
√
iω/ω3
)
(10)
with
ω3 = D/l2p , (10a)
where lp denotes the characteristic pore dimension [19]. Compared with the case ofa simple ctr, in the Paasch et al. model I, there are two additional parameters, ω2
and ω3, i.e. parameters characteristic of the porous electrodes if the finite diffusiontakes place.
2. Experimental
2.1. Electrode preparation and other experimental details
The electrodes were constituted by an aluminium foil current collector and fromthe active material layer. The active material used (noted as ID711) consists ofnanoporous carbon (prepared from TiC “stark” by the chlorination method ac-cording to the preparation scheme presented in [26–30]); of the mixture of binder(poly-tetra-fluoro-ethylene, PTFE, 60% solution in H2O “Aldrich”) and of the car-bon black (“Aldrich”). The carbon black was added to decrease the ohmic resis-tance of the electroactive material layer. This mixture was laminated on the Ni foiland pressed together to form a very flexible layer of the active electrode material.After drying and plating under the vacuum, this material was covered by the Al(99.9999%) layer from one side [34–37]. After that the Al-covered carbon layer wasspot-welded in the Ar atmosphere to the Al foil current collector. The limits of idealpolarizability of Al foil have been established by cyclic voltammetry as well as byimpedance spectroscopy methods.
The electrolyte used was prepared from the acetonitrile (AN) (0.003% H2O;Riedel de Haen), stored over the molecular sieves before using, and from the(C2H5)4NBF4 salt (99.9%; 0.005% H2O; Pred Materials International, Inc.). Thethree electrode standard glass cell with the very big counter electrode (apparentarea ∼ 30 cm2), prepared from the carbon cloth, was used. The reference electrodewas an aqueous saturated calomel electrode (SCE in H2O) connected through theelectrolytic salt bridge (0.01 M LiClO4 in H2O | 0.01 M (C2H5)4NBF4 in AN) withthe measurement system [12]. Ar (99.9999 %, AGA) was used for the saturation ofsolutions. Specific surface area (SQ), pore size distribution, micropore volume (Vm),micropore area (Sm) and other parameters were obtained using the Gemini 2375(Micromeritics, Inc.) system and calculated according to the methods described in
313
E.Lust et al.
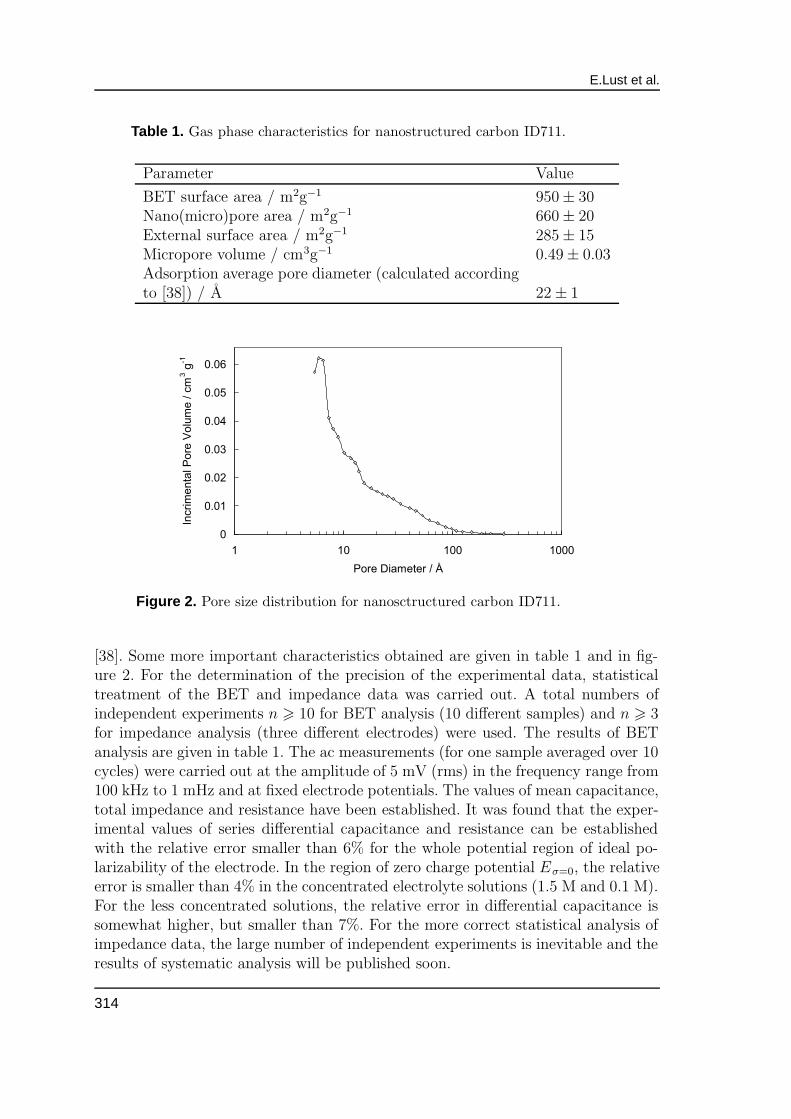
Table 1. Gas phase characteristics for nanostructured carbon ID711.
Parameter Value
BET surface area / m2g−1 950± 30Nano(micro)pore area / m2g−1 660± 20External surface area / m2g−1 285± 15Micropore volume / cm3g−1 0.49± 0.03Adsorption average pore diameter (calculated accordingto [38]) / A 22± 1
Figure 2. Pore size distribution for nanosctructured carbon ID711.
[38]. Some more important characteristics obtained are given in table 1 and in fig-ure 2. For the determination of the precision of the experimental data, statisticaltreatment of the BET and impedance data was carried out. A total numbers ofindependent experiments n > 10 for BET analysis (10 different samples) and n > 3for impedance analysis (three different electrodes) were used. The results of BETanalysis are given in table 1. The ac measurements (for one sample averaged over 10cycles) were carried out at the amplitude of 5 mV (rms) in the frequency range from100 kHz to 1 mHz and at fixed electrode potentials. The values of mean capacitance,total impedance and resistance have been established. It was found that the exper-imental values of series differential capacitance and resistance can be establishedwith the relative error smaller than 6% for the whole potential region of ideal po-larizability of the electrode. In the region of zero charge potential Eσ=0, the relativeerror is smaller than 4% in the concentrated electrolyte solutions (1.5 M and 0.1 M).For the less concentrated solutions, the relative error in differential capacitance issomewhat higher, but smaller than 7%. For the more correct statistical analysis ofimpedance data, the large number of independent experiments is inevitable and theresults of systematic analysis will be published soon.
314
Nanoporous electrodes
2.2. Cyclic voltammetry ( j, E -) curves
The cyclic voltammetry curves for x M (C2H5)4NBF4 acetonitrile solution(0.005 < x < 1.5), obtained at small scan rates of potential v = dE/dt 6 5 mV/s,presented in figure 3, have a nearly rectangular form and a mirror image symme-try of the current responses about the zero current line. Accordingly, the porouscarbon electrodes are ideally polarizable in the region of potentials from −1.4 to1.4 V (vs. SCE in H2O). The experimental data show that the shape of j, E-curvesis independent of the number of current cycle, n, if n > 5. Thus, the nanoporouscarbon electrodes demonstrate the stable electrochemical properties in this regionof potentials. i.e. in the region of ideal polarizability. At c el = const, the currentresponses increase almost the expected way with large ν values (figure 3a), but withincreasing v > 20 mV/s (1.5 M (C2H5)4NBF4 in acetonitrile) the cyclic voltammo-grams become distorted from the rectangular form expected for an ideal capacitormaterial having a constant capacitance [1,39]. The data for more dilute solutions,presented in figures 3b and 3c, demonstrate that the shape of j, E-curves is indepen-dent of the potential scan rate if v 6 5 mV/s for cel 6 0.1 M and v 6 2 mV/s forcel 6 5 · 10−3 M. At higher scan rates there are very well expressed distortion effectsin the j, E-curves, caused by the higher internal resistance of the system comparedwith the 1.5 M solution, as well as by the onset of the so-called “electrolyte starva-tion” effect, referred to earlier by Conway et al. [1,39] associated with the withdrawalof the electrolyte ions from the pore bulk electrolyte due to the adsorption of ionson the double layer interphases when they become charged. Thus, the scan rate atwhich the deviation of j, E-curves from the ideal behaviour starts, decreases withthe dilution of the electrolyte solution. Additionally it should be noted that theestablishment of the adsorption equilibrium in the nanopores is a very slow process,caused by the very small “effective” diffusion coefficient values of ions in nanopores,discussed more in detail later.
Comparison of data for 1.5 M and 0.1 M electrolyte solutions, obtained at smallscan rates, shows that in the region of potentials −0.1 6 E 6 0.5 V (SCE), there isa minimum of current density for 0.1 M (C2H5)4NBF4 solution, in the case of metalelectrodes explained by the diffuse nature of the electric double layer in the region oftotal (or free) zero charge [1,6,12]. Noticeably better-expressed current minima havebeen established for the 0.01 M and 0.005 M TEABF4+AN solutions (figure 3c). Thecurrent density at ν = const and E = Emin decreases with the dilution of electrolyte(figure 4). Thus, this minimum is probably caused by the zero charge potential (orby the zero total charge potential) of porous carbon electrode. The potential of thisminimum (figure 5) is practically independent of the direction of potential scan ifv 6 1 mV/s, as well as of the electrolyte concentration if cel 6 0.01 M.
The values of differential capacitance, corresponding mainly to the double layercapacitance, can be obtained as
C = jv−1 = j (dE/dt)−1 . (11)
The data in figure 6a, obtained from j, E-curves, indicate that for 1.5 M(C2H5)4NBF4 + AN solution in the limited region of electrode potential the ca-
315

E.Lust et al.
Figure 3. Current density vs. potential curves for nanostructured carbon ID711in 1.5 M (a); 0.1 M (b); and 0.005 M (c) (C2H5)4NBF4 + acetonitrile solution atvarious potential scan rates: (a) (1) – 10, (2) – 20, (3) – 50; (b) (1) – 0.2, (2) –0.5, (3) – 1.0; and (c) (1) – 0.2, (2) – 0.5, (3) – 1.0, (4) – 2.0 mV/s.
316

Nanoporous electrodes
Figure 4. Current density vs. potential scan rate curves at Emin for nanos-tructured carbon ID711 in 1.5 M (1); 0.1 M (2); 0.01 M (3); and 0.005 M(C2H5)4NBF4 + acetonitrile solution.
Figure 5. Emin vs. potential scan rate curves for nanostructured ID711 carbon in0.01M (1,4) and 0.1M (2,3) (C2H5)4NBF4 +acetonitrile solutions, obtained fromj, E-curves with positive (1,2) and negative (3,4) direction of potential scan.
317

E.Lust et al.
pacitance, C, is practically independent of v only at the values of v 6 20 mV/s. Itshould be noted that the values of C established from j, E-curves at ν 6 10 mV/sare in good agreement with the Cs, E-curves (figure 6b) (where Cs is the seriescapacitance, calculated from the complex plane (Z ′′, Z ′) plots), measured at ac fre-quencies f 6 10 mHz. According to the experimental data, the series differentialcapacitance is independent of f only at f 6 0.01 Hz. At higher frequencies, thereis a very big dependence of Cs on f , caused by the small values of ac penetrationdepth (equation (7)) compared with the pore length. The same is valid for the moredilute solutions (figure 7), but, in the region of capacitance minimum, there is a veryweak dependence of Cs on f , as well as of C on ν, demonstrating that the almostequilibrium capacitance values have been established in the region of zero chargepotential. At |E| > Eσ=0, there is a noticeable dependence of Cs on f and C on ν.Thus, only at very small potential scan rates (v 6 10 mV/s the “equilibrium” valuesof capacitance and thus the maximal values of energy can be stored. The data infigure 7 show that at E ∼ 0.23 V (vs. SCE in H2O) the very well expressed capaci-tance minimum (with the potential of the minimum Emin) in C,E-curves has beenobserved. The series capacitance at Emin, Cs,min, decreases approximately linearlywith c1/2 (figure 7c).
At higher scan rates, the value of Emin depends on the direction of potential scan(figure 7d), which is caused by the very slow processes of adsorption-desorption anddiffusion of ions in the nanopores. With the decrease of v lower than 1 mV/s, thedifference between the Emin values for positive and negative going potential scansdecreases (figure 4) and the Emin value, corresponding to the zero charge potentialof nanoporous carbon electrode, can be taken equal to 0.23 V vs. SCE. However,it should be noted that for a more detailed analysis of the physical nature of theminimum in the C,E-curves, the future experimental investigations in more diluteelectrolyte solutions as well as in conditions v < 0.5 mV/s are inevitable.
2.3. Analysis of impedance data
The Z ′′, Z ′-plots (so-called Nyquist plots, figure 8) were measured for 1.5 and0.1 M (C2H5)4NBF4 + AN solutions in the range of ac frequency from 1 · 10−3 to1 · 105 Hz and in the region of potentials from −1.4 to 1.4 V (vs. SCE in H2O) atfixed E = const. The results obtained demonstrate that the shape of Z ′′, Z ′-plotsnoticeably depends on cel as well as somewhat on the electrode potential. The Z ′′, Z ′-plots (at f = const) were used for the calculation of the values of differential seriescapacitance (Cs, series circuit) and parallel capacitance (Cp, parallel circuit) valuesas well as of the series resistance Rs and parallel resistance Rp values. According tothe data in figure 9a, the Cs and Cp values level off to the limiting value of C s(ω → 0)at f 6 5 · 10−2 Hz, indicating that the diffusion is a limiting stage of the adsorptionprocess.
At −1.4 6 E 6 −0.7 V (SCE), the values of Cs(ω = 0) are somewhat higher forless concentrated electrolyte solutions, indicating that the limiting Gibbs adsorptionvalues have been established for (C2H5)4N
+ cations at c > 0.1 M. The inflectionfrequency for Cs, f - and Cp, f -plots is somewhat higher for the more concentrated
318

Nanoporous electrodes
Figure 6. (a) C,E-curves for nanostructured carbon ID711 | 1.5 M(C2H5)4NBF4 + acetonitrile interface, calculated from j, E-curves at potentialscan rates: (1) – 50; (2) – 10; and (3) – 2 mV/s. (b) Cs, E-curves the same interfaceat different ac frequencies: (1) – 0.01; (2) – 0.1; (3) – 1.0; and (4) – 10 Hz.
Figure 7. (a) C,E-curves for nanostructured carbon ID711 | 0.01 M(C2H5)4NBF4 + acetonitrile interface obtained from j, E curves at different scanrates: (1) – 0.1; (2) – 0.2; (3) – 0.5; (4) – 1; (5) – 2 ; and (6) – 5 mV/s (positive di-rection of potential scan). (b) Cs, E - curves for the same interface obtained fromZ ′, Z ′′ curves at different ac frequencies: (1) – 0.01; (2) – 0.1 Hz. (c) Cmin, ν
1/2-dependences for nanostructured carbon ID711 in (1) – 1.5 M; (2) – 0.1 M; (3) –0.01 M; and (4) – 0.005 M (C2H5)4NBF4+acetonitrile solutions. (d) C,E-curvesfor 0.005 M (1,2) and 0.07 M (3;4) (C2H5)4NBF4+acetonitrile solutions obtainedfrom j, E-curves at potential scan rate ν = 10 mV/s ((1,4) – negative and (2,3)– positive direction of potential scan).
319

E.Lust et al.
Ω
Ω
l
Figure 8. Complex plane plots for nanostructured carbon ID711 in 1.5 M (1) and0.1 M (2) (C2H5)4NBF4 + acetonitrile solutions at E = 1.0 V vs. SCE. Marks –experimental data; and solid lines – data calculated according to the transmissionline equivalent circuit (i.e. according to Paasch et al. model No. 1 [21,42]), wheredY is the complex admittance of the hindered charge transfer reaction (involvingthe hindrance factor y(ω) of the charge transfer reaction with the charge transferconductance gct); dCdl is the double layer capacitance; dR1 and dR2 are theohmic resistance of the porous electrode material and of the electrolyte in thepore, respectively, in the volume element Adx.
320

Nanoporous electrodes
ν
ν
Ω
Figure 9. (a) Cs, ν-curves (1,2) and Cp, ν-curves (3,4) for nanostructured carbonID711 in 1.5 M (1,3) and 0.1 M (2,4) (C2H5)4NBF4 + acetonitrile solutions atE = 0.2 V vs. SCE. (b) Bode plots for nanostructured carbon ID711 in 0.1 M(1) and 1.5 M (2) (C2H5)4NBF4 +acetonitrile solutions at E = −1.2 V vs. SCE.
electrolyte solution, which is caused by the decrease of the influence of the diffuselayer effect, i.e. by the decrease of the Debye screening length with the increase ofcel [1,12,40]. At low frequency, the Rs and Rp values are lower for less concentratedelectrolyte solutions, which can be explained by the less compact structure of theadsorption layer of (C2H5)4N
+ ions in the pure capacitance region. At E > 0.7 V, theCs(ω→0) values for more concentrated electrolyte solution are higher than those forless concentrated electrolyte, indicating that the value of limiting Gibbs adsorptionΓmax has not been established for c 6 1.5 M (C2H5)4NBF4+AN solution if the weakspecific adsorption of BF−
4 anions takes place on nanoporous carbon.
Comparison of Cs values, obtained from impedance data and from j, E-curves,demonstrates a good agreement between the differential capacitance values of bothseries if f 6 10−1 Hz and v 6 1 mV/s. Figure 9b demonstrates the Bode (|Z|, logω)plots obtained at different electrode potentials E = const and electrolyte concen-trations. According to these data, the shape of |Z|, logω-plots depends on the elec-trolyte concentration at ac frequency 5 · 10−2 < f < 5 · 102 Hz. The higher valuesof |Z| for 0.1 M solution are caused mainly by the higher pore resistance values(discussed more in detail later). At f 6 1 · 10−2 Hz, there is no dependence of |Z|on the electrolyte concentration, and |Z|, logω-plots have a slope ∼ −45, which ischaracteristic of the kinetically mixed process, i.e. of the process limited by the slowdiffusion and the charge transfer stages (simulated by the equivalent circuit wherethe Warburg diffusion impedance and the charge transfer resistance are connectedin series in the equivalent circuit). The dependence of the phase angle δ on logω isin very good agreement with the data in figure 9b.
2.4. Analysis of complex plane plots
The complex plane plots, measured for porous carbon | (C2H5)4NBF4) + ANinterface at E = const (figure 8), can be divided into the four main sections. At a highac penetrability (at very low ac frequency f 6 1 · 10−1 Hz) the nanoporous carbonelectrode behaves like a planar electrode since the penetration depth λ (equation (7))
321
E.Lust et al.
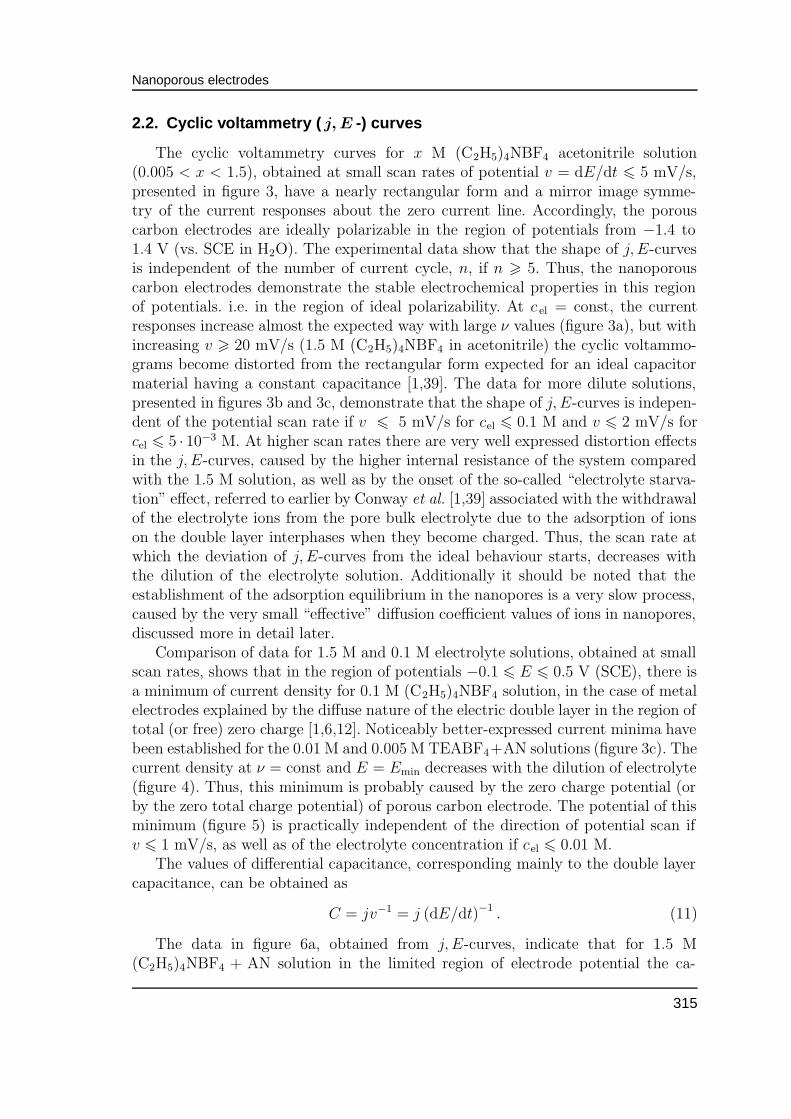
Table 2. Electrochemical characteristics nanoporous carbon ID 711 | x M(C2H5)4NBF4 + acetonitrile interface.
1.5 M (C2H5)4NBF4 0.1 M (C2H5)4NBF4
E / V vs. SCE +1.2 +0.2 0 −1.2 +1.2 +0.2 0 −1.2Rel / Ω cm−2 0.77 0.94 0.95 0.75 0.84 0.88 0.89 0.76α 0.91 0.92 0.91 0.87 0.96 0.96 0.99 0.97vpore 0.207 0.241 0.241 0.200 0.224 0.168 0.166 0.153Sp / m2 cm−3 70.8 103.7 103.8 54.3 86.5 80.6 74.3 64.7Sc / m2 g−1 81.6 119.5 119.6 62.6 99.7 92.9 85.6 74.6Rpore / Ω cm−2 0.50 0.43 0.43 0.51 1.28 1.72 1.74 1.88
Rel – total resistance of system at ac frequency ν → ∞,α – constant phase exponent obtained at ac frequency ν → 0,vpore – effective relative pore volume,Sp – effective area per unit volume,Sc – effective area per gram,Rpore – pore resistance.
is larger than the length of the pore so that an ac signal detects a large amount ofthe pore volume. In this region of the Z ′′, Z ′-plots (called the planar section [1]) thephase angle approaches asymptotically to −85 . . .− 90 degrees. However, accordingto the data in figure 8, the impedance (as well as the phase angle) at low ac frequency,i.e. at high λ values shows non-ideal constant phase element (CPE) behaviour. Theconstant phase exponent values α less than 1.0 have been established: α ∼ 0.90for 1.5 M and α ∼ 0.98 for 0.1 M solution (α = 1 for the planar ideally smoothelectrode) (table 2). The values of α depend somewhat on the electrode potential (aswell as on the electrolyte concentration), indicating that a weak specific adsorptionof ions at different E values is possible. The dependence of α on cel as well as on|E| indicates that the effectively working surface area of the electrode increaseswith the increase of the electrolyte concentration as well as of the surface chargedensity [1,6,10–12,16,40]. The increase of α can be explained by the increase of theeffective Debye screening length with the dilution of solution [1,11,40]. Comparisonof the values of the surface area, obtained according to the N2 adsorption data(BET), with the values of the effective surface area SC, obtained from the impedancedata (tables 1 and 2), indicates that the very small nanopores are probably notaccessible for the electrolyte ions. According to the model developed in [41], thedeviation of α from unity is caused mainly by the pore size distribution in thenanoporous material studied. It should be noted that the more detailed computersimulations are inevitable, but the very small deviation of α from unity indicatesthat the nanoporous carbon has the narrow pore size distribution, which is in goodagreement with the BET data (table 1 and figure 2).
At lower penetrability (at higher frequency), the penetration depth is smallerthan the length of the pores, so that the ac signal detects only a part of the pore
322

Nanoporous electrodes
ω
ω
ω
ω
ω
Figure 10. The dependence of the characteristic frequencies ω0 = k√3 (a); ω1
(equations (6) and (6a)) (b); ω2 (equation (9)) (c); and ω3 (equation (10a)) (d) onthe electrode potential for nanostructured carbon ID711 in 0.1 M (1) and 1.5 M(2) (C2H5)4NBF4 + acetonitrile solutions.
volume, i.e. the nanopore surface. This is called the porous section of Z ′′, Z ′-plots,and the phase angle approaches −45 degrees in this region of ac frequency. In ad-dition, there is a transition section between the porous and the planar sections inthe Z ′′, Z ′-plots. At higher frequencies, there is a very well expressed and slightlydepressed semicircle, with the depression angle β only somewhat higher than zero(β = 0 corresponds to the purely charge transfer limited heterogeneous process, andβ = 45 corresponds to the diffusion limited stage) [1,18,21,41]. So, the very fastheterogeneous adsorption step (i.e. the partial charge transfer reaction) is probablypossible in the case of the porous carbon | (C2H5)4NBF4) + AN interface. The val-ues of effective pore volume vpore, pore resistance Rpore and the effective surface areaof the nanoporous carbon electrode material, Sc, obtained according to the models[18–25,32], are given in table 2. As it can be seen in table 2, the values of vpore
and Sc decrease and Rpore increase with the dilution of the electrolyte. Comparisonof the effective surface area of the nanoporous carbon electrode with the values ofnano-(micro-) pore area established by BET method shows that the surface of thevery small nanopores does not contribute to the double layer capacitance.
The data in figures 8 and 10 indicate that the polarization propagates like diffu-sion (parameter ω0 = k
√3) through the electrode of finite thickness (related to ω1,
equation (6a)), and that at any point, x, the finite diffusion, related to ω2 and ω3
(equations (9) and (10a)), results in a further time delay. The values of characteris-tic frequencies ω0, ω1, ω2 and ω3, obtained according to equations (6), (6a), (9) and
323

E.Lust et al.
(10b) by the simulation program [42], are given in figure 10. According to the resultsof the data of non-linear regression analysis [42], the chi-squared function (χ2) hasthe usual values (χ2 6 3 · 10−3) for the electrochemistry when the complicated ma-terials and systems are studied. The errors of individual parameters indicate a goodagreement with the Paasch et al. model I. Therefore, the two parallel conductionpaths in the solid and in the liquid phases are interconnected by the double layercapacitance in parallel with the complex admittance of the hindered charge transferreaction (the equivalent circuit in the inset of figure 8).
Additionally, the Paasch et al.model II [19,40] was tested, where the polarizationfield E(κ, ω), responsible for the ctr reaction, is not restricted to the volume averageof the polarization at the interface but it can be extended into the solid phase.The results of the non-linear regression analysis demonstrate the noticeably higherdeviation of the calculated Z ′′, Z ′-curves from the experimental data for this modelthan that for Paasch et al. model I, and therefore these data will not be discussedmore in detail in this paper. According to our simulations, ω 2; ω3 ≪ ω0, and thenthe relative magnitudes of ω1, ω2 and ω3 determine the low-frequency behaviour ofthe Z ′′, Z ′-plots (figure 10). At very low frequency f 6 0.2 Hz, there is a transitionto a pure capacitive behaviour, since both the field diffusion and the species diffusionare finite. In the region of frequencies 0.2 < f < 10 Hz, the slope equal to π/4 forZ ′′, Z ′-plot was observed around ω2, where the diffusion of species dominates in thesolution phase.
According to the data in figure 8, the shape of the complex plots depends on theconcentration of the electrolyte, as well as on the electrode potential. The depen-dence of the Z ′′, Z ′-plots on the electrolyte concentration is caused mainly by theinterplay of frequencies ω0, ω1, ω2 and ω3 and their dependence on cel. Thus, thecharacteristic frequencies depend noticeably on the nature and structure of the ionsadsorbed at the nanoporous carbon electrode. At E ≪ Eσ=0, there are mainly phys-ically adsorbed (C2H5)4N
+ cations in the region of the inner layer but, at E ≫ Eσ=0,the weak specific adsorption of anions is possible. Between the (C2H5)4N
+ cations,the van der Waals attractive interaction prevails, but there is repulsive interactionbetween weakly specifically adsorbed BF−
4 anions. At higher frequencies (f > 40 Hz(0.1 M) and f > 200 Hz (1.5 M)), the shape of the impedance spectra is determinedmainly by the ratio of the ω0 and ω1 values, i.e. without regard to the diffusion inthe pores [19].
3. Conclusions
The results of impedance studies at nanoporous carbon | x M (C2H5)4NBF4 +acetonitrile interface indicate that the series capacitance, series resistance, phaseangle and other parameters depend noticeably on the concentration of electrolyteas well as on the electrode potential. It was found that the pore resistance, i.e. in-ternal distribution of the electrode resistance rises noticeably with the dilution ofthe electrolyte solution. For the dilute electrolyte solutions, a very well expresseddifferential capacitance minima in the series capacitance-potential curves have been
324

Nanoporous electrodes
observed with the potential of the capacitance minimum, Emin, dependent slightlyon cel and on the direction of potential scan if cel > 0.01 M and ν > 1 mV/s. Atcel 6 0.007 M, the values of Emin are practically independent of ν (ν 6 2 mV/s) aswell as of cel. Thus, to a first approximation, this potential value corresponds to thezero charge potential for the nanoporous carbon | x M (C2H5)4NBF4 + acetonitrileinterface. Analysis of complex plane plots shows that the nanoporous carbon | x M(C2H5)4NBF4 + acetonitrile interface can be simulated by the equivalent circuit, inwhich the two parallel conduction parts in the solid and liquid phases are intercon-nected by the double layer capacitance in parallel with the complex admittance ofhindered reaction of the charge transfer process [21]. The values of the characteristicfrequency depend on the electrolyte concentration and on the electrode potential,i.e. on the effective Debye screening length [10,11,16,40] as well as on the nature andstructure of ions adsorbed at the surface of nanoporous carbon electrode.
4. Acknowledgements
This work was supported in part by the Estonian Science Foundation underProject No. 4568.
References
1. Conway B.E. Electrochemical Supercapacitors. Scientific Fundamentals and Techno-logical Applications. New York, Kluwer Academic/Plenum Publishers, 1999.
2. Randin J.B., Yeager E.B. // J. Electroanal. Chem., 1972, vol. 38, p. 257.3. Salitra G., Soffer A., Eliad L., Cohen Y., Aurbach D. // J. Electrochem. Soc., 2000,
vol. 146, p. 2486.4. Amokrane S., Badiali J.P. // J. Electroanal. Chem., 1989, vol. 266, p. 21.5. Amokrane S., Badiali J.P. – In: J. O’M.Bockris, B.E.Conway and R.E.White (Eds.),
Modern Aspects of Electrochemistry. Vol. 22. New York, Plenum Press, 1991, p. 1.6. Lust E., Janes A., Lust K., Vaartnou M. // Electrochim. Acta, 1997, vol. 42, p. 771.7. Emets V.V., Damaskin B.B., Kazarinov V.E. // Elektrokhimiya, 1995, vol. 31, p. 787.8. Bruyant A., Smith D.P.E., Quante C.F. // Appl. Phys. Lett., 1986, vol. 48, p. 832.9. Binning C., Smith D.P.E. // Rev. Sci. Instrum., 1986, vol. 57, p. 1688.10. Daikin L.I., Kornyshev A.A, Urbakh M. // Phys. Rev. E, 1996, vol. 53, p. 6192.11. Daikin L.I., Kornyshev A.A, Urbakh M. // J. Chem. Phys., 1998, vol. 108, p. 2853.12. Trasatti S., Lust E. – In: R.E.White, B.E.Conway and J.O’M.Bockris (Eds.), Mod-
ern Aspects of Electrochemistry. Vol. 33. New York and London, Kluwer Academ-ic/Plenum Publishers, 1999, p. 1.
13. Pecina O., Badiali J.P. // Phys. Rev. E, 1998, vol. 58, p. 6041.14. Pecina O., Badiali J.P. // Phys. Rev. E, 1999, vol. 60, p. 4431.15. Pecina O., Badiali J.P. // J. Electroanal. Chem., 1999, vol. 475, p. 46.16. Lust E., Janes A., Sammelselg V., Miidla P., Lust K. // Electrochim. Acta, 1998,
vol. 44, p. 373.17. Jarzabek G., Borkovska Z. // Electrochim. Acta, 1997, vol. 42, p. 2915.18. Macdonald J.R. Impedance Spectroscopy. New York, Wiley, 1987.
325

E.Lust et al.
19. Rousar I., Micka K., Kimla A. Electrochemical Engineering. Vol. 2. Amsterdam, El-sevier, 1986.
20. de Levie R. // J. Electroanal. Chem., 1990, vol. 281, p. 1.21. Paasch G., Micka K., Gersdorf P. // Electrochim. Acta, 1993, vol. 38, p. 2653.22. de Levie R. // Electrochim. Acta, 1963, vol. 8, p. 751.23. de Levie R. // Electrochim. Acta, 1964, vol. 9, p. 1231.24. Keiser H., Beccu K.D., Gutjahr M.A. // Electrochim. Acta, 1976, vol. 21, p. 539.25. Keddam M., Rakomoto C., Takenouti H. // J. Applied Electrochem., 1984, vol. 14,
p. 437.26. Frumkin A.N., Melik-Gaikazyan V.I. // Dokl. akad. nauk SSSR, 1951, vol. 77, p. 855.27. Lorenz W. // Z. Elektrochem., 1958, vol. 62, p. 192.28. Armstrong R.P., Rice W.P., Thrisk H.R. // J. Electroanal. Chem., 1968, vol. 16,
p. 517.29. Rammelt U., Reinhard G., Rammelt K. // J. Electroanal. Chem., 1980, vol. 180,
p. 327.30. Paasch G., Schwarzenberg M., Jobst K., Sawtchenko L. // Mat. Sci. Forum, 1990,
vol. 62–64, p. 455.31. Schneider W. // J. Phys. Chem., 1975, vol. 79, p. 127.32. Micka K., Svata M. // J. Power Sources, 1978, vol. 2, p. 167.33. Izotov V.Y., Strizhakova N.G., Kozachkov S.G., Danilin V.V., Mironova A.A.,
Maletin Y.A., Lust E., Arulepp M., Janes A., Nurk G., Perman L. Modeling thecharge-discharge processes in porous electrodes – the way to double-layer capacitoroptimization. // J. Power Sources (in press).
34. Arulepp M., Janes A., Nurk G., Permann L., Nigu P., Lust E. Electrochemical prop-erties of skeleton carbon materials with large surface area and controlled pore size. –In: Abstracts of 51st Annual ISE Meeting, Warsaw, 2000, s-8, p. 946.
35. Maletin Y.A., Strizhakova N.G., Izotov V.Y., Kozachkov S.G., Mironova A.A.,Danilin V.V. – In: V.Barsukov and F.Beck (Eds.), New Promising ElectrochemicalSystems for Rechargable Batteries. Kluwer Academic Publishers, 1996, p. 363.
36. Maletin Y.A., Strizhakova N.G., Izotov V.Y., Kozachkov S.G., Mironova A.A.,Danilin V.V., Ekstrom T. – In: Proc. 7th Sem. on Double Layer Capacitors andSimilar Energy Storage Devices, Deerfield Beach Florida, USA.
37. Nurk G., Janes A., Arulepp M., Nigu P., Permann L., Lust E. – In: Abstracts of JointInt. Meeting of ISE and ECS, San Francisco, 2001, Abstr. No. 1006.
38. Gregg S.J., Sing K.S.W. Adsorption, Surface Area and Porosity. London, AcademicPress, 1982.
39. Pell W.G., Conway B.E., Marincic N. // J. Electroanal. Chem., 2000, vol. 491, p. 9.40. Lust E., Janes A., Sammelselg V., Miidla P. // Electrochimica Acta, 2000, vol. 46,
p. 185.41. Song H.-K., Jung Y.-H., Lee K.-H., Dao L.H. // Electrochimica Acta, 1999, vol. 44,
p. 3513.42. Macdonald J.R. ZPlot for Windows (Version 2.2) Fitting Program, LEVM 6.0.
326

Nanoporous electrodes
Електрохімічні властивості нанопористих
вуглецевих електродів
Е.Луст 1,2 , Г.Нурк 1,2 , А.Яанес 1,2 , М.Арулепп 1,2 ,
Л.Перманн 2 , П.Нігу 2 , П.Мйоллер 2
1 Інститут фізичної хімії, Університет м. Тарту
вул. Якобі 2, 51014 Тарту, Естонія2 ТЗОВ “Тарту Текнолоджіз”, вул. Рія 185, 51014 Тарту, Естонія
Отримано 5 жовтня 2001 р., в остаточному вигляді – 28 грудня
2001 р.
Методами циклічної вольтаметрії та імпедансної спектроскопії бу-
ли досліджені подвійний електричний шар та електрохімічні характе-
ристики міжфазної області вуглець | (C2H5)4NBF4+ацетонітрил. Були
встановлені значення потенціалу нульового заряду (0.23 В відносно
SEE в H2O) область ідеальної поляризованості та інші характеристи-
ки. Аналіз графіків в комплексній площині показав, що лімфазна об-
ласть вуглець | x M (C2H5)4NBF4 + ацетонітрил може бути змодельо-
вана еквівалентним колом, в якому дві паралельні провідні частини в
твердій та рідкій фазі є зв’язані ємністю подвійного шару паралельно
з комплексною повною провідністю зворотньої реакції процесу пе-
реносу заряду. Значення характеристичної частоти залежить від кон-
центрації електроліту та потенціалу електрода, тобто природи іонів
адсорбованих на поверхні нанопористого вуглецевого електроду.
Ключові слова: подвійний електричний шар, нанопористий
вуглець, потенціал нульового заряду, неводний розчин електроліту
PACS: 68.08.-p, 68.08.De
327

328