electrocomponents annual report 2018/media/files/e/electro... · 28.4p like-for-like1 growth 29.7%...
TRANSCRIPT

Electrocomponents plc Annual Report and Accounts for the year ended 31 March 2018
BECOMING FIRST CHOICE
Elec
troc
om
po
ne
nts p
lc Annual R
eport and Accounts for the year end
ed 31 March 20
18

We support customers with a broad range of industrial and electronic products and services that are essential
for the successful operation of their businesses.
ELECTROCOMPONENTS IS A GLOBAL MULTI-CHANNEL
DISTRIBUTOR
Revenue
£1,705.3mGrowth 12.8%2017: £1,511.7m
Like-for-like1 revenue growth
12.8%2017: 4.8%
Profit before tax
£168.6mGrowth 32.7%
2017: £127.1m
Adjusted2 profit before tax
£173.1mLike-for-like1 growth 30.0%
2017: £128.0m
Earnings per share
33.9pGrowth 62.2%
2017: 20.9p
Adjusted2 earnings per share
28.4pLike-for-like1 growth 29.7%
2017: 21.0p
Dividend per share
13.25pGrowth 7.7%2017: 12.30p
Adjusted2 free cash flow
£105.1mGrowth (10.7)%
2017: £117.7m
electrocomponents.com
1. Like-for-like change excludes the effects of changes in exchange rates on translation of overseas operating results, with 2017 converted at 2018 average exchange rates. Revenue is also adjusted to eliminate the impact of trading days year on year.
2. Adjusted excludes substantial reorganisation costs, asset write-downs, one-off pension credits or costs, significant tax rate changes and associated income tax (refer to Note 3 on pages 97 to 99 for reconciliations).

Electrocomponents plcAnnual Report and Accounts for the year ended 31 March 2018 1
ST
RA
TE
GIC
RE
PO
RT
SIMPLESEE PAGE 10
HOW WILL WE BECOME
FIRST CHOICE?
INNOVATIVESEE PAGE 24
COLLABORATIVESEE PAGE 38
Strategic report 1Group at a glance 2Our investment proposition 3Business model 4Chairman’s introduction 6Our marketplace 8CEO’s review 12Key performance indicators 26Financial review 28Risks, viability and going concern 34Corporate responsibility 40
Corporate governance 48Board of Directors 48Corporate governance report 50Audit Committee report 56Nomination Committee report 62Directors’ Remuneration Report 64Directors’ report 79Statement of Directors’ responsibilities 83Financial statements 84Independent Auditors’ report 84Group accounts 90Company accounts 124Five year record 131Shareholder information 132
2 Annual Report and Accounts for the year ended 31 March 2018 Electrocomponents plc
GROUP AT A GLANCE
A GLOBAL PROVIDER
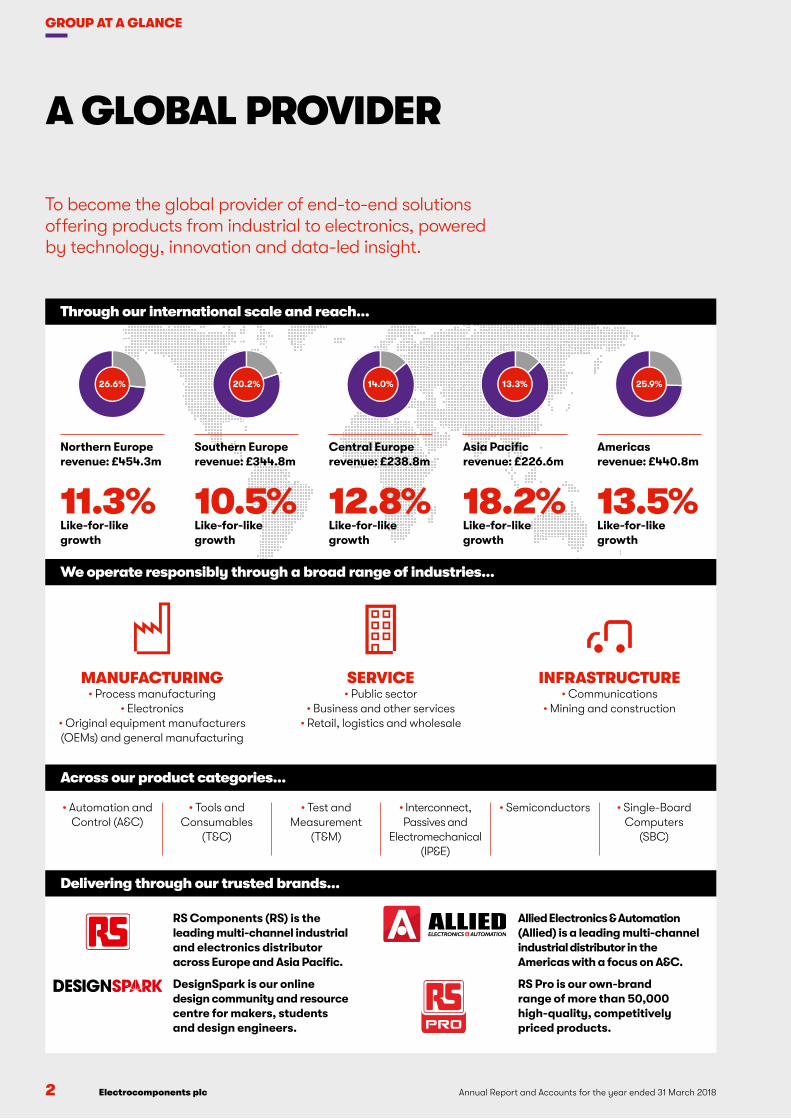
To become the global provider of end-to-end solutions offering products from industrial to electronics, powered by technology, innovation and data-led insight.
Through our international scale and reach…
26.6% 20.2% 14.0% 13.3% 25.9%
Northern Europe revenue: £454.3m
Southern Europe revenue: £344.8m
Central Europe revenue: £238.8m
Asia Pacific revenue: £226.6m
Americas revenue: £440.8m
11.3% 10.5% 12.8% 18.2% 13.5%Like-for-like growth
Like-for-like growth
Like-for-like growth
Like-for-like growth
Like-for-like growth
We operate responsibly through a broad range of industries…
MANUFACTURING• Process manufacturing
• Electronics• Original equipment manufacturers (OEMs) and general manufacturing
SERVICE• Public sector
• Business and other services• Retail, logistics and wholesale
INFRASTRUCTURE• Communications
• Mining and construction
Delivering through our trusted brands…
Across our product categories…
• Automation and Control (A&C)
• Tools and Consumables
(T&C)
• Test and Measurement
(T&M)
• Interconnect, Passives and
Electromechanical (IP&E)
• Semiconductors • Single-Board Computers
(SBC)
Allied Electronics & Automation (Allied) is a leading multi-channel industrial distributor in the Americas with a focus on A&C.
RS Pro is our own-brand range of more than 50,000 high-quality, competitively priced products.
RS Components (RS) is the leading multi-channel industrial and electronics distributor across Europe and Asia Pacific.
DesignSpark is our online design community and resource centre for makers, students and design engineers.
Electrocomponents plcAnnual Report and Accounts for the year ended 31 March 2018 3
ST
RA
TE
GIC
RE
PO
RT
OUR INVESTMENT PROPOSITION
FOUR KEY REASONS TO INVEST
CEO’S REVIEWPAGE 12
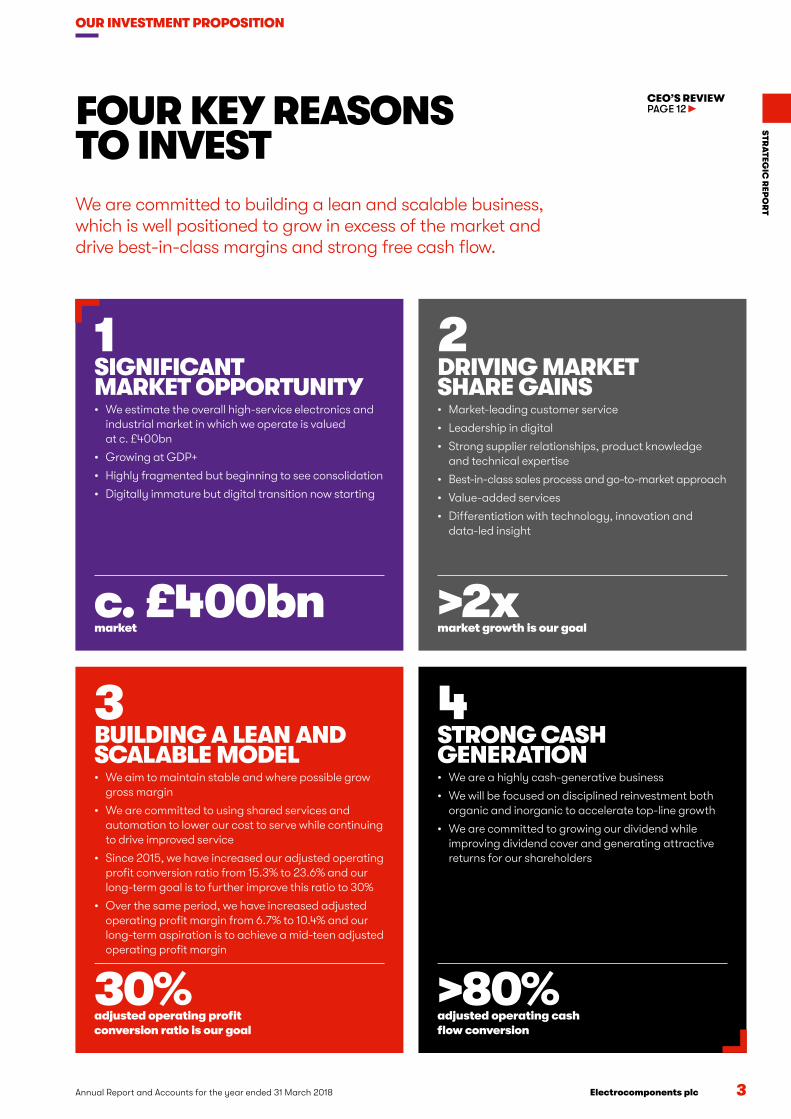
We are committed to building a lean and scalable business, which is well positioned to grow in excess of the market and drive best-in-class margins and strong free cash flow.
1SIGNIFICANT MARKET OPPORTUNITY• We estimate the overall high-service electronics and
industrial market in which we operate is valued at c. £400bn
• Growing at GDP+
• Highly fragmented but beginning to see consolidation
• Digitally immature but digital transition now starting
2DRIVING MARKET SHARE GAINS• Market-leading customer service
• Leadership in digital
• Strong supplier relationships, product knowledge and technical expertise
• Best-in-class sales process and go-to-market approach
• Value-added services
• Differentiation with technology, innovation and data-led insight
4STRONG CASH GENERATION• We are a highly cash-generative business
• We will be focused on disciplined reinvestment both organic and inorganic to accelerate top-line growth
• We are committed to growing our dividend while improving dividend cover and generating attractive returns for our shareholders
c. £400bnmarket
>2xmarket growth is our goal
>80%adjusted operating cash flow conversion
3BUILDING A LEAN AND SCALABLE MODEL• We aim to maintain stable and where possible grow
gross margin
• We are committed to using shared services and automation to lower our cost to serve while continuing to drive improved service
• Since 2015, we have increased our adjusted operating profit conversion ratio from 15.3% to 23.6% and our long-term goal is to further improve this ratio to 30%
• Over the same period, we have increased adjusted operating profit margin from 6.7% to 10.4% and our long-term aspiration is to achieve a mid-teen adjusted operating profit margin
30%adjusted operating profit conversion ratio is our goal

4 Annual Report and Accounts for the year ended 31 March 2018 Electrocomponents plc
BUSINESS MODEL
We are a multi-channel distributor supporting customers across the product life cycle, whether via innovation and technical support at the design phase, improved productivity in the build phase or reducing purchase-to-pay costs and optimising inventory in the maintenance phase. We offer our customers tailored product and service propositions to help them save time and money.
WHAT WE DO TO CREATE VALUE
HOW WE DO IT
SOURCE• High-quality products from over 2,500 major suppliers
• Extensive range of industrial and electronic products
• From latest technologies to hard-to-find products
STOCK• 500,000+ stocked products and a much greater
non-stocked range
• RS Pro – our competitively priced own-brand range
• High stock availability with transparent information
SHIP• Over 50,000 parcels shipped daily to over one million customers
• No minimum order size
• Aiming for best-in-class fulfilment via our global network of distribution centres
VALUE PROPOSITION
HOW WE PROVIDE VALUE
We make it easy to do business
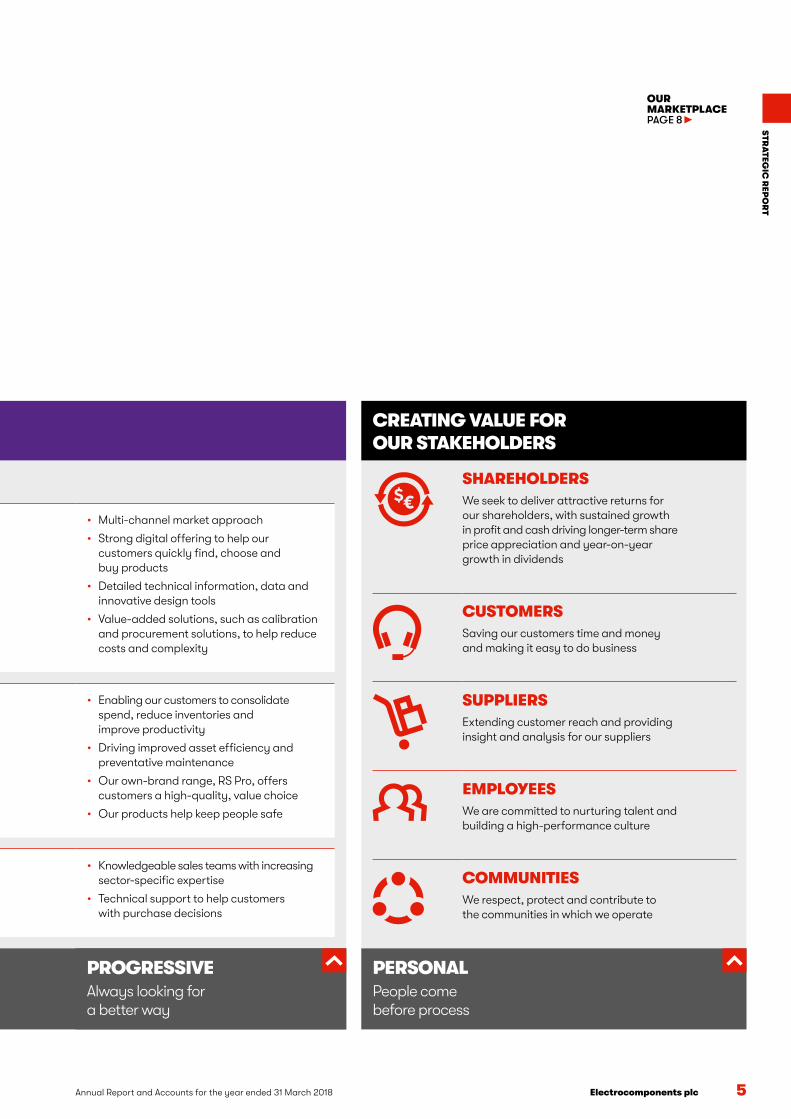
• Multi-channel market approach
• Strong digital offering to help our customers quickly find, choose and buy products
• Detailed technical information, data and innovative design tools
• Value-added solutions, such as calibration and procurement solutions, to help reduce costs and complexity
We have a broad range of products and high stock availability
• Enabling our customers to consolidate spend, reduce inventories and improve productivity
• Driving improved asset efficiency and preventative maintenance
• Our own-brand range, RS Pro, offers customers a high-quality, value choice
• Our products help keep people safe
We have significant sector-specific knowledge and technical expertise
• Knowledgeable sales teams with increasing sector-specific expertise
• Technical support to help customers with purchase decisions
SEAMLESSWe make complex things satisfyingly simple
Underpinned by our brand values
Electrocomponents plcAnnual Report and Accounts for the year ended 31 March 2018 5
ST
RA
TE
GIC
RE
PO
RT
OUR MARKETPLACEPAGE 8
VALUE PROPOSITION
HOW WE PROVIDE VALUE
We make it easy to do business
• Multi-channel market approach
• Strong digital offering to help our customers quickly find, choose and buy products
• Detailed technical information, data and innovative design tools
• Value-added solutions, such as calibration and procurement solutions, to help reduce costs and complexity
We have a broad range of products and high stock availability
• Enabling our customers to consolidate spend, reduce inventories and improve productivity
• Driving improved asset efficiency and preventative maintenance
• Our own-brand range, RS Pro, offers customers a high-quality, value choice
• Our products help keep people safe
We have significant sector-specific knowledge and technical expertise
• Knowledgeable sales teams with increasing sector-specific expertise
• Technical support to help customers with purchase decisions
CREATING VALUE FOR OUR STAKEHOLDERS
SHAREHOLDERSWe seek to deliver attractive returns for our shareholders, with sustained growth in profit and cash driving longer-term share price appreciation and year-on-year growth in dividends
CUSTOMERSSaving our customers time and money and making it easy to do business
SUPPLIERSExtending customer reach and providing insight and analysis for our suppliers
EMPLOYEESWe are committed to nurturing talent and building a high-performance culture
COMMUNITIESWe respect, protect and contribute to the communities in which we operate
PERSONALPeople come before process
PROGRESSIVEAlways looking for a better way

6 Annual Report and Accounts for the year ended 31 March 2018 Electrocomponents plc
CHAIRMAN’S INTRODUCTION
LAYING THE FOUNDATIONS FOR FUTURE GROWTH
The last three years since Lindsley Ruth’s appointment as Chief Executive Officer (CEO) in April 2015 and the initiation of the Performance Improvement Plan (PIP) in November 2015 have been a period of considerable change and progress at Electrocomponents. The ambition and pace of change have increased. The Senior Management Team, consisting of Lindsley and his direct reports, has been changed and strengthened. Efficiency and customer service have taken big steps forward. We have reinvested to enhance our capabilities in digital, sales effectiveness, innovation, value-added services and RS Pro, all of which have been key in driving accelerated revenue and profit growth.
Progress is encouraging. Since the PIP was launched, like-for-like revenue growth has accelerated to 12.8% in 2018 (2015: 3.5%), gross margin has increased and adjusted operating profit margin has improved to 10.4% (2015: 6.7%). Operating profit has grown at a compound rate of over 25% over the two and a half years of the PIP and strong cash flow generation has led to a much improved balance sheet with net debt reducing to £65.0 million (2015: £152.6 million). Our rolling three-month RS Net Promoter Score (NPS), a measure of customer satisfaction, has risen by around 20% over the course of the PIP.
Importantly, the organisation is once again focused on delivering best-in-class results for customers, suppliers, employees and shareholders. However, while we are pleased by what has been achieved, we still have much more to do, and remain committed to maintaining the pace of change in order to take advantage of the significant opportunity we have ahead of us.
Trading performance The year ended 31 March 2018 was another year of good progress. Revenue growth was 12.8%. Foreign exchange movements increased revenue by around £22 million, while fewer trading days reduced revenue by around £21 million, so that like-for-like revenue growth (adjusted for trading days and currency movements) was also 12.8%. Like-for-like growth remained strong across the two halves of the year (H1 13.3%, H2 12.2%) and for the first time in seven years all our regions
saw double-digit like-for-like revenue growth and market share gains in the year as a whole.
Profit before tax (PBT) increased by 32.7% to £168.6 million with the improvement being driven by higher sales and gross margin and continued discipline on operating costs. PBT benefited by around £5 million from currency movements. Earnings per share was up 62.2% to 33.9p as it benefited from a one-off non-cash deferred tax credit as a result of the US tax reform. Adjusted PBT (which excludes substantial reorganisation costs) grew by 35.2%, 30.0% on a like-for-like basis, to £173.1 million. Adjusted earnings per share was up 35.2%, 29.7% on a like-for-like basis, to 28.4p.
Adjusted free cash flow (that is before financing activities and net substantial reorganisation cash flows of £2.4 million fell to £105.1 million (2017: £117.7 million). This reduction reflected our decision to increase inventory levels to improve product availability and our On Time To Promise (OTTP) ratio, a key driver of customer satisfaction. Net debt reduced to £65.0 million (2017: £112.9 million).
Laying the foundations for future growthOur market opportunity remains huge and our leadership in digital and breadth of offering gives us significant potential to drive further market share gains in the future. We have the capability to use strong free cash flow to accelerate our growth organically or through value-accretive acquisitions.
To fully exploit these opportunities we will continue to make our business more customer centric, leaner and more scalable. Our customer service levels have improved but there is still great potential through raising the performance of all our regions to that of the best. We need to consistently be first choice for customers, suppliers and employees. There also remains a lot of scope to improve our financial ratios. Our adjusted operating profit conversion ratio, a measure of efficiency and one of our Group key performance indicators (KPIs), has increased to 23.6% (2015: 15.3%), but we are still aiming to increase this towards a best-in-class conversion ratio of closer to 30%.
As a result, in May 2018 we launched a second phase of the PIP which is focused on driving further simplification and
“ Over the last three years we have made considerable progress. We intend to keep up the pace of change to ensure we fully capitalise on our significant market opportunity.”PETER JOHNSON CHAIRMAN

Electrocomponents plcAnnual Report and Accounts for the year ended 31 March 2018 7
STR
ATEG
IC R
EPO
RTefficiency in our model and investing in automation, shared
services and our supply chain to support improved customer service at lower cost. As a result, we are targeting significant further cost savings, which will enable us to achieve our aspiration of driving best-in-class adjusted operating profit conversion and adjusted operating profit margin ratios (see page 13).
Inspiring the next generation of engineers Our business was established to inspire and support engineers. As such, it is exciting to see the numerous initiatives across the globe to increase engagement with customers, students and communities. During 2018 we launched a global multi-channel brand awareness campaign, ‘for the inspired’, which celebrates some of the great achievements of inspired people within the engineering community (see page 19). Greater brand awareness, improved content and higher pay-per-click marketing is driving significantly higher traffic to our website (see page 19). DesignSpark, our online community of engineers, makers and students, has become the technology partner of Barclays Eagle Labs to bolster innovation in local communities. DesignSpark membership continues to grow and this is just one of many exciting initiatives that will help extend its reach in the future (see page 18). We have also recently launched a new version of our interactive technology truck, Titan II, which will showcase our products and new technologies to customers, universities and schools to inspire and inform engineers of today and tomorrow (see page 19). This increased engagement with customers and the next generation of engineers will provide a key source of future growth in customer numbers, laying the foundation for revenue growth in years to come.
DividendThe Board understands the continuing importance of the dividend to its shareholders. The Board proposes to increase the final dividend to 8.0p per share. This will be paid on 25 July 2018 to shareholders on the register on 15 June 2018. As a result, the total proposed dividend for the 2018 financial year will be 13.25p per share, representing an increase of 7.7% over the 2017 full-year dividend, resulting in adjusted earnings dividend cover of 2.1 times. The increase in the dividend reflects the Board’s confidence in the future prospects of the Group and the Group’s strong balance sheet. The Board intends to pursue a progressive dividend policy whilst remaining committed to further improving dividend cover over time by driving improved results and stronger cash flow.
Board and governanceDuring the year, the Board visited our Allied Electronics & Automation (Allied) operation in the Americas and our Northern European operation of RS Components (RS) in Corby, UK. In both regions, we were impressed by the energy and commitment of the newly strengthened leadership teams and delighted to see a more aspirational, innovative and customer-centric culture evolving.
In July 2017, we said farewell to Paul Hollingworth and I would like to thank him for his outstanding contribution as Audit Committee Chairman over the last nine years. Our two most recent Non-Executive Director appointments, Simon Pryce and Louisa Burdett are settling in well and greatly adding to the breadth of skills on the Board. We continuously evaluate the balance of skills, experience, knowledge and independence of the Directors. The results and recommendations of this year’s internal review of the Board are discussed in detail later in Corporate Governance on pages 53 and 54.
Corporate responsibilityCorporate responsibility is an integral part of our business and we work to align our values and strategy with responsible and ethical business practices across the Group. We are committed to creating an inclusive and diverse place to work where everyone can deliver their best irrespective of age, race or gender. We have plans to tackle the challenges of occupational segregation and encourage much more diversity in senior roles, both essential in addressing the gender pay gap. We also remain committed to being good citizens, playing a full part in the communities in which we operate and controlling our impact upon the environment. The Board remains committed to providing clear leadership in all these areas.
EmployeesWe, as a Board, continue to be impressed by how our employees have responded to the increased pace of change and ambition within the Group. On behalf of the Board, I would like to thank all our employees for their hard work, enthusiasm and dedication throughout the year. It is the service they provide that delivers continuously improving results for the Group and creates value for customers, suppliers and shareholders.
Peter JohnsonChairman 23 May 2018
CORPORATE GOVERNANCE REPORTPAGE 50
For definitions and reconciliations of all alternative performance measures, refer to Note 3 on pages 97 to 99.
2016 2017 2018
2.8
4.8
12.8
2016 2017 2018
5.0
20.9
33.9
76.8
128.0
173.1
2016 2017 2018 2016 2017 2018
62.6
117.7105.1
Like-for-like revenue growth (%)
Adjusted profit before tax (£m)
Earnings per share (p) Adjusted free cash flow (£m)
8 Annual Report and Accounts for the year ended 31 March 2018 Electrocomponents plc
OUR MARKETPLACE
WELL POSITIONED IN A LARGE AND FRAGMENTED MARKETPLACE
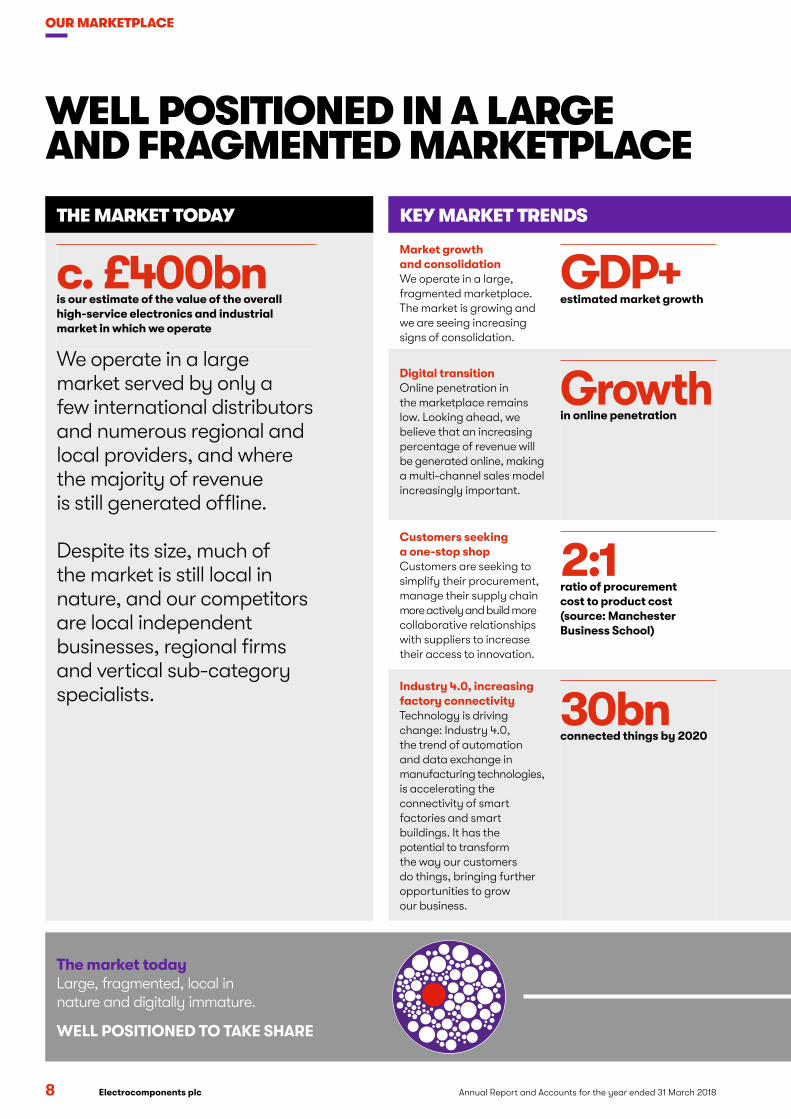
The market todayLarge, fragmented, local in nature and digitally immature.
WELL POSITIONED TO TAKE SHARE
THE MARKET TODAY
c. £400bnis our estimate of the value of the overall high-service electronics and industrial market in which we operate
We operate in a large market served by only a few international distributors and numerous regional and local providers, and where the majority of revenue is still generated offline.
Despite its size, much of the market is still local in nature, and our competitors are local independent businesses, regional firms and vertical sub-category specialists.
KEY MARKET TRENDS
Market growth and consolidation We operate in a large, fragmented marketplace. The market is growing and we are seeing increasing signs of consolidation.
GDP+estimated market growth
Our strategic responseWe aim to grow market share both organically and by acquisition.
Digital transitionOnline penetration in the marketplace remains low. Looking ahead, we believe that an increasing percentage of revenue will be generated online, making a multi-channel sales model increasingly important.
Growthin online penetration
Our strategic responseWe are a leading player in digital, with 61% of revenue online. We have invested heavily in digital talent, our website, online design tools and our new mobile platform. We are also increasing our investment in eProcurement and inventory management tools to further differentiate our service.
Customers seeking a one-stop shopCustomers are seeking to simplify their procurement, manage their supply chain more actively and build more collaborative relationships with suppliers to increase their access to innovation.
2:1ratio of procurement cost to product cost (source: Manchester Business School)
Our strategic responseOur global presence, broad product range and breadth of service make us a perfect partner for customers wishing to consolidate their spend. We are expanding our range and value-added services and our global accounts programme is well positioned to benefit from these trends.
Industry 4.0, increasing factory connectivityTechnology is driving change: Industry 4.0, the trend of automation and data exchange in manufacturing technologies, is accelerating the connectivity of smart factories and smart buildings. It has the potential to transform the way our customers do things, bringing further opportunities to grow our business.
30bnconnected things by 2020
Our strategic responseOur broad product portfolio covers both industrial and electronic products, meaning we are well positioned to benefit from growth in the Industrial Internet of Things (IIoT). We are driving more innovation into our business and are piloting new IIoT solutions to ensure we are well placed to capitalise on this trend.
Electrocomponents plcAnnual Report and Accounts for the year ended 31 March 2018 9
STR
ATEG
IC R
EPO
RT
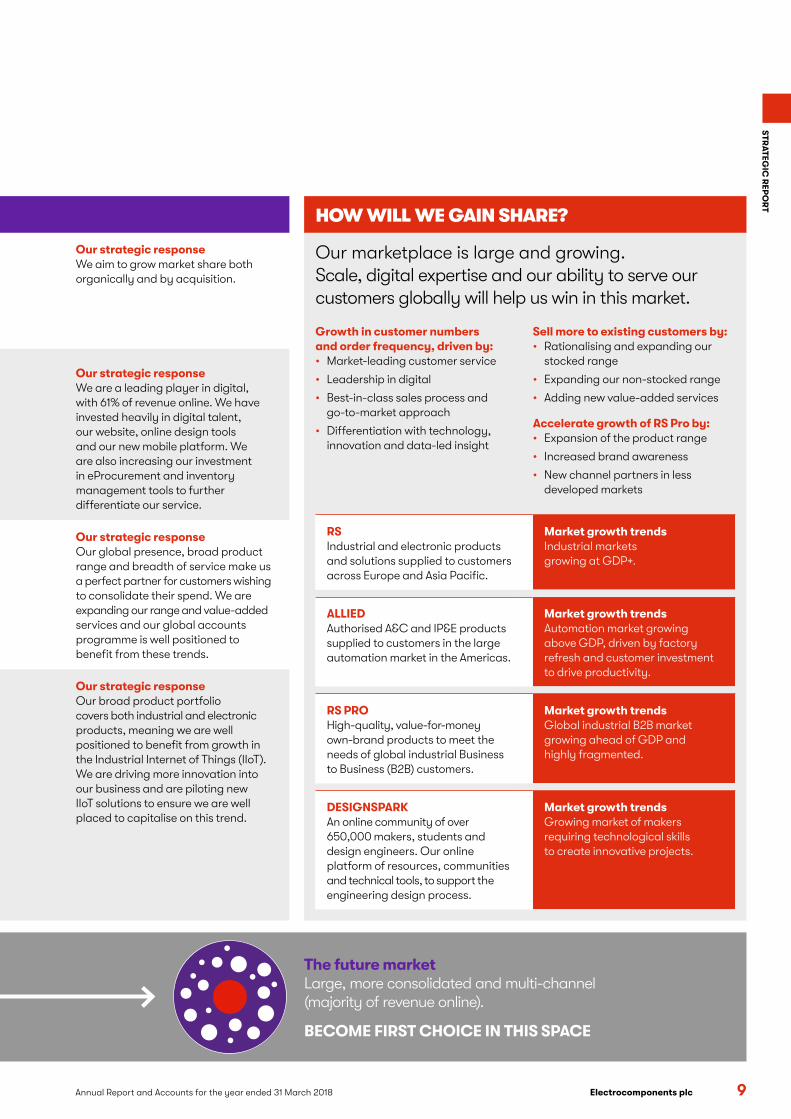
The future marketLarge, more consolidated and multi-channel (majority of revenue online).
BECOME FIRST CHOICE IN THIS SPACE
KEY MARKET TRENDS
Market growth and consolidation We operate in a large, fragmented marketplace. The market is growing and we are seeing increasing signs of consolidation.
GDP+estimated market growth
Our strategic responseWe aim to grow market share both organically and by acquisition.
Digital transitionOnline penetration in the marketplace remains low. Looking ahead, we believe that an increasing percentage of revenue will be generated online, making a multi-channel sales model increasingly important.
Growthin online penetration
Our strategic responseWe are a leading player in digital, with 61% of revenue online. We have invested heavily in digital talent, our website, online design tools and our new mobile platform. We are also increasing our investment in eProcurement and inventory management tools to further differentiate our service.
Customers seeking a one-stop shopCustomers are seeking to simplify their procurement, manage their supply chain more actively and build more collaborative relationships with suppliers to increase their access to innovation.
2:1ratio of procurement cost to product cost (source: Manchester Business School)
Our strategic responseOur global presence, broad product range and breadth of service make us a perfect partner for customers wishing to consolidate their spend. We are expanding our range and value-added services and our global accounts programme is well positioned to benefit from these trends.
Industry 4.0, increasing factory connectivityTechnology is driving change: Industry 4.0, the trend of automation and data exchange in manufacturing technologies, is accelerating the connectivity of smart factories and smart buildings. It has the potential to transform the way our customers do things, bringing further opportunities to grow our business.
30bnconnected things by 2020
Our strategic responseOur broad product portfolio covers both industrial and electronic products, meaning we are well positioned to benefit from growth in the Industrial Internet of Things (IIoT). We are driving more innovation into our business and are piloting new IIoT solutions to ensure we are well placed to capitalise on this trend.
HOW WILL WE GAIN SHARE?
Our marketplace is large and growing. Scale, digital expertise and our ability to serve our customers globally will help us win in this market.
Growth in customer numbers and order frequency, driven by:• Market-leading customer service
• Leadership in digital
• Best-in-class sales process and go-to-market approach
• Differentiation with technology, innovation and data-led insight
Sell more to existing customers by:• Rationalising and expanding our
stocked range
• Expanding our non-stocked range
• Adding new value-added services
Accelerate growth of RS Pro by:• Expansion of the product range
• Increased brand awareness
• New channel partners in less developed markets
RS Industrial and electronic products and solutions supplied to customers across Europe and Asia Pacific.
Market growth trends Industrial markets growing at GDP+.
ALLIEDAuthorised A&C and IP&E products supplied to customers in the large automation market in the Americas.
Market growth trends Automation market growing above GDP, driven by factory refresh and customer investment to drive productivity.
RS PROHigh-quality, value-for-money own-brand products to meet the needs of global industrial Business to Business (B2B) customers.
Market growth trends Global industrial B2B market growing ahead of GDP and highly fragmented.
DESIGNSPARKAn online community of over 650,000 makers, students and design engineers. Our online platform of resources, communities and technical tools, to support the engineering design process.
Market growth trendsGrowing market of makers requiring technological skills to create innovative projects.

10
BECOMING FIRST CHOICE
Annual Report and Accounts for the year ended 31 March 2018 Electrocomponents plc10
SIMPLEWe make it easy to do business. Customers and suppliers
are at the heart of our business and our focus is on making it easy for them to do business with us.
BEST-IN-CLASS DIGITAL
EXPERIENCE
We have invested to significantly improve search, content and website speed such that our online customer satisfaction scores are now industry leading in the B2B sector. We have revamped our eProcurement and ePurchasing tools to offer our customers more control and personalisation throughout their RS / Allied experience.
MULTI-CHANNEL APPROACH
Our customers can work with us in whichever way suits them, whether through our website, via email, over the phone or in person. We also offer our customers choice in how and when they receive purchases and consolidate deliveries, helping to reduce procurement costs.
TECHNICAL AND CUSTOMER
SUPPORT
The significant product knowledge and technical expertise of our salesforce and our technical support team as well as information on our website help our customers find the right solutions to their problems. We are committed to supporting our customers 24/7 365 days a year, both over the phone and via Live Chat.

11
STR
ATEG
IC R
EPO
RT
Annual Report and Accounts for the year ended 31 March 2018 Electrocomponents plc
AGILE TEAMS
TRANSFORMING OUR ONLINE EXPERIENCEWe aim to make our customers’ lives easier and we work constantly to find solutions to their needs. We focus on user-centred design and collate around 90,000 pieces of real-time customer feedback in our global Voice of the Customer surveys. We regularly hold user testing sessions to gain insight on how we can improve our customers’ experience.
Over 60% of our revenues are now digital; we have invested in significant digital capabilities with over 300 people working in our digital team and 15 Agile teams working constantly on improving our website and online experience. During the year, we have more than doubled the number of Agile releases to improve the functionality, speed and content on our website and have added 128 new releases. Over the past year, our average page load speed has improved by 28% and our CSAT score, the customer satisfaction measure we use in the UK, France, Germany and Japan, has risen to 69, well above the B2B benchmark of 64.
“ This year we passed the significant landmark of £1 billion of annual digital revenues. This firmly cemented us as a global force in the B2B digital space. We constantly evolve to stay ahead of the market, adapting to the needs of our fast moving and highly knowledgeable customer base.” ALEX VON SCHIRMEISTER CHIEF INNOVATION OFFICER
12 Annual Report and Accounts for the year ended 31 March 2018 Electrocomponents plc
CEO’S REVIEW
Achievements over first phase of PIP
BECOMING FIRST CHOICE
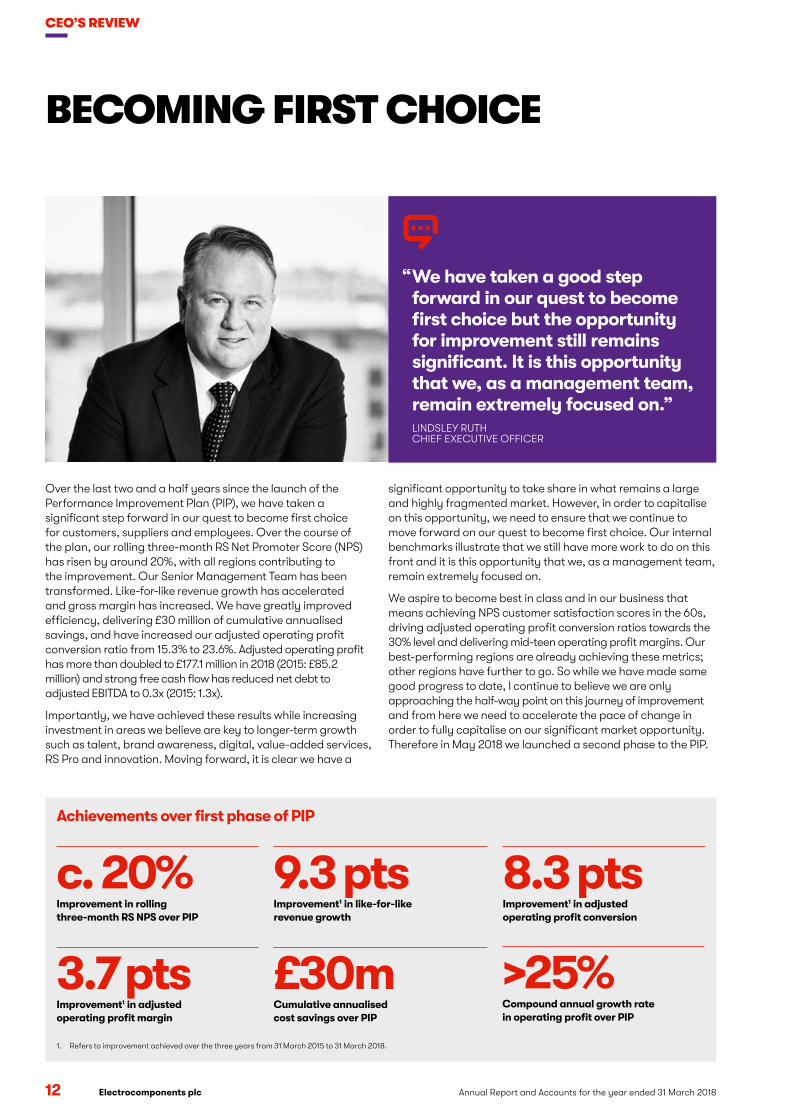
Over the last two and a half years since the launch of the Performance Improvement Plan (PIP), we have taken a significant step forward in our quest to become first choice for customers, suppliers and employees. Over the course of the plan, our rolling three-month RS Net Promoter Score (NPS) has risen by around 20%, with all regions contributing to the improvement. Our Senior Management Team has been transformed. Like-for-like revenue growth has accelerated and gross margin has increased. We have greatly improved efficiency, delivering £30 million of cumulative annualised savings, and have increased our adjusted operating profit conversion ratio from 15.3% to 23.6%. Adjusted operating profit has more than doubled to £177.1 million in 2018 (2015: £85.2 million) and strong free cash flow has reduced net debt to adjusted EBITDA to 0.3x (2015: 1.3x).
Importantly, we have achieved these results while increasing investment in areas we believe are key to longer-term growth such as talent, brand awareness, digital, value-added services, RS Pro and innovation. Moving forward, it is clear we have a
significant opportunity to take share in what remains a large and highly fragmented market. However, in order to capitalise on this opportunity, we need to ensure that we continue to move forward on our quest to become first choice. Our internal benchmarks illustrate that we still have more work to do on this front and it is this opportunity that we, as a management team, remain extremely focused on.
We aspire to become best in class and in our business that means achieving NPS customer satisfaction scores in the 60s, driving adjusted operating profit conversion ratios towards the 30% level and delivering mid-teen operating profit margins. Our best-performing regions are already achieving these metrics; other regions have further to go. So while we have made some good progress to date, I continue to believe we are only approaching the half-way point on this journey of improvement and from here we need to accelerate the pace of change in order to fully capitalise on our significant market opportunity. Therefore in May 2018 we launched a second phase to the PIP.
“ We have taken a good step forward in our quest to become first choice but the opportunity for improvement still remains significant. It is this opportunity that we, as a management team, remain extremely focused on.”LINDSLEY RUTH CHIEF EXECUTIVE OFFICER
c. 20%Improvement in rolling three-month RS NPS over PIP
3.7 ptsImprovement1 in adjusted operating profit margin
9.3 ptsImprovement1 in like-for-like revenue growth
£30mCumulative annualised cost savings over PIP
8.3 ptsImprovement1 in adjusted operating profit conversion
>25%Compound annual growth rate in operating profit over PIP
1. Refers to improvement achieved over the three years from 31 March 2015 to 31 March 2018.

Electrocomponents plcAnnual Report and Accounts for the year ended 31 March 2018 13
STR
ATEG
IC R
EPO
RTSecond phase of the PIP
The second phase of the PIP is aimed at further building and enhancing the organisation model and capabilities to enable us to continue to drive profitable growth and operational improvement across our five strategic priorities (see page 14). In order to move faster and adapt in an evolving marketplace, we need to make changes to our model to ensure it is simpler, even more customer centric, scalable and more efficient. Our proposals, which will be subject to consultation with employees, are based on two core principles:
SimplicityWe need to continue to make our organisation simpler, more customer centric and capable of driving success in both the industrial and electronics marketplaces.
• A regional model with a lean centre: We are proposing to move to a regional model, based around three regions; EMEA, Asia Pacific and the Americas, with the regional presidents reporting directly to the CEO. This structure would have a much leaner corporate centre with activities, such as product and supplier management and marketing, primarily being run within the regions, mirroring the way Allied is set up today in the Americas. Our aim is to be an even more customer-centric organisation where decisions on activities such as range and marketing are made closer to the customer. The proposed structure will give greater autonomy, agility and accountability to the region, which will enable us to adapt faster to changes in our customer needs and the marketplace. Finally, it should lead to efficiencies, removing duplicated cost between the centre and the region.
• Reporting structure: Under this proposed structure we would report results for the three regions: EMEA, Asia Pacific and Americas.
• Savings: As a result of a new simpler organisational structure we hope to generate significant efficiencies and savings. Our longer-term aim remains to drive a best-in-class adjusted operating profit conversion ratio of 30%. We are targeting cumulative annualised cost savings of £12 million by March 2021, with £4 million of cost savings in the current year to 31 March 2019. We expect to see reorganisation costs in relation to the second phase of the PIP in the region of £12 million, the large part of which are likely to be cash costs, depending on the final details following consultation. The majority of this charge would relate to labour-related restructuring costs.
ScalabilityWe are building a global scalable platform using shared services and increased automation and technology.
• Global shared services and automation strategy: We are rolling out a global shared services strategy aimed at driving an improved customer experience at lower cost to complement our existing shared services operations in the UK, China and the Americas. Initially our focus will be on increasing the use of shared services to handle standardised transactional activities driving improved accuracy and scalability. As part of this plan, we will increase the use of automation with robotic process automation and, in the future, machine learning tools to increase speed and accuracy of processing and efficiency. The first step of the programme will be to move our existing Asia Pacific customer services shared service centre into a new larger regional centre of expertise based in Foshan in China. This will have the capability to cater for additional activities in line with our strategic ambitions and will be completed in calendar 2019. This project will not only drive improved customer experience but will also create the capabilities required to drive scale and profitable growth in Asia Pacific in the longer term.
• Customer-centric supply chain: We will optimise and invest in supply chain to support our growth plans. The first phase includes an extension of the Allied warehouse in the Americas to house an expanded range and a project to optimise transport across the globe.
14 Annual Report and Accounts for the year ended 31 March 2018 Electrocomponents plc
CEO’S REVIEW CONTINUED
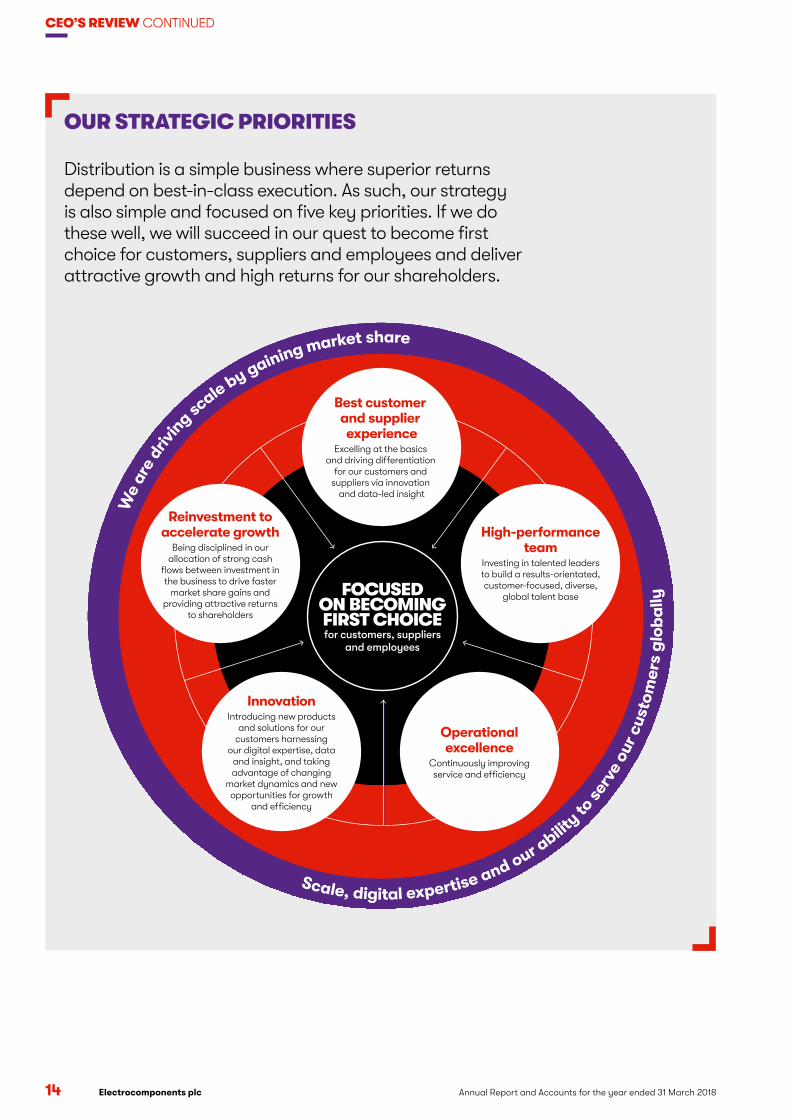
OUR STRATEGIC PRIORITIES Distribution is a simple business where superior returns depend on best-in-class execution. As such, our strategy is also simple and focused on five key priorities. If we do these well, we will succeed in our quest to become first choice for customers, suppliers and employees and deliver attractive growth and high returns for our shareholders.
We
are
driv
in
g scale by gaining market share
FOCUSED ON BECOMING FIRST CHOICEfor customers, suppliers
and employees
Best customer and supplier experience
Excelling at the basics and driving di�erentiation
for our customers and suppliers via innovation
and data-led insight
High-performance team
Investing in talented leaders to build a results-orientated, customer-focused, diverse,
global talent base
Operational excellence
Continuously improving service and e�ciency
InnovationIntroducing new products
and solutions for our customers harnessing
our digital expertise, data and insight, and taking advantage of changing
market dynamics and new opportunities for growth
and e�ciency
Reinvestment to accelerate growth
Being disciplined in our allocation of strong cash
flows between investment in the business to drive faster
market share gains and providing attractive returns
to shareholders
Scale, digital expertise and our abilit
y to se
rve
our
cust
om
ers
glo
ba
lly

Electrocomponents plcAnnual Report and Accounts for the year ended 31 March 2018 15
STR
ATEG
IC R
EPO
RT
Best customer and supplier experienceCustomer experienceOur business was conceived to make our customers’ lives easier and find them the right part or solution for each job. While much has changed in the way we serve our customers, as well as the products and services we offer them, the imperative to deliver a brilliant customer experience and make it easy for them to do business has not changed – in order to succeed, this needs to continue to be part of our DNA. During the year, we have made good progress on driving an improved customer experience, with our rolling 12-month RS NPS score improving year on year by 8.6% to 45.7 and our Allied NPS score improved 4.4% to 68.1. We still have room for improvement in all regions, particularly Asia Pacific (our lowest ranking region), but I am extremely pleased by the progress we have been making here and across the board since the launch of the PIP and excited by the future plans we have to accelerate this focus. Our plans to improve customer experience focus on three key areas:
• Driving a better online experience: We are building an industry-leading digital capability to ensure we continue to remain ahead of the game in digital and offer our customers a brilliant online experience. With over 60% of our revenue now online this is of vital importance. During the year ended 31 March 2018, we accelerated the number of Agile improvements we made to our website to 128 (2017: 58). These changes have been focused on improving areas such as: search, website speed, functionality, filtering and our mobile site. As a result of these actions, we have seen a 28% year-on-year improvement in the RS website speed and our CSAT online customer satisfaction score measured in the UK, France, Germany and Japan stands at 69, compared to the B2B industry benchmark of 64. Improvements in our online experience have enabled us to hold conversion rates firm while significantly increasing website traffic. Looking forward, we are committed to accelerating the pace of improvement and as such we have expanded our Agile approach to encompass all aspects of the customer experience both online and offline. Across the Group we now have 15 Agile teams (2017: six teams) working on improving customer experience and we expect to grow this resource further as we move into the year to 31 March 2019. During 2019, our teams will be focused on areas including, but not limited to, onsite and offsite search, mobile experience and localising the web experience in China and Japan.
• Delivering On Time To Promise (OTTP): OTTP is a key driver of customer satisfaction and as such a ratio which we watch carefully. During the first half of 2018, we took the decision to increase inventory levels to improve product availability and our OTTP ratio, which had trended down in H2 2017. We have also made good progress at driving a more consistent service offering across the globe with particular progress in Asia Pacific. Looking forward, our key areas of focus are offering our customers end-to-end supply chain visibility of their goods from order to delivery, and making sure we improve our processes and the way we communicate on orders when an item is out of stock; both of which should drive further improvement to the service we offer to our customers (see page 17).
• Providing world-class customer service: We continue to train our sales and service people so they can offer our customers a best-in-class experience. We upgraded our Live Chat programme and are now actively rolling it out in all our key markets. We also continue to increase the technical expertise within our sales functions via training and educating our people and recruiting additional technical talent.
48.5%improvement in our rolling three-month Asia Pacific NPS ratio since March 2016
IMPROVING CUSTOMER EXPERIENCE
NIKO NIKOIn early 2016, our Asia Pacific team launched a project called ‘Niko Niko’ aimed at accelerating improvements in customer service in the region. Niko Niko incorporated numerous different work streams, which included but were not limited to:
• Online experience improvements – improvements in website speed, content and functionality
• Improving OTTP in China by rationalising the range, increasing local sourcing and optimising the supply chain
• Tactical local IT changes – fixing local customer issues, for example offering increased payment optionality in the Philippines and improving invoicing in Australia
There has been a significant improvement in the OTTP in China. All this has led to a 48.5% improvement in Asia Pacific’s rolling three-month NPS over the two years to 31 March 2018.

16 Annual Report and Accounts for the year ended 31 March 2018 Electrocomponents plc
CEO’S REVIEW CONTINUED
Supplier experienceWe continue to believe that we have significant potential to drive faster growth and better terms by offering our suppliers an improved experience. We are unique in the marketplace with our global footprint, strong salesforce and leading digital position and, as such, are an important partner and lead generator for our suppliers. These strengths are helping us to add new suppliers and during 2018 we added over 40 new suppliers at RS and 23 at Allied. We are focusing on leveraging our extensive reach and data to give our suppliers the focus and insight they need so that we can accelerate growth together. Our key priorities are as follows:
• Building a partnership with key strategic suppliers: During 2018, we implemented a clear supplier segmentation allowing additional resource to be directed towards the Group’s strategic suppliers. We created a dedicated team to work
with suppliers to improve delivery performance and piloted a new dashboard with strategic suppliers, which gives them increased access to data and insight. During 2019, we aim to roll this out more extensively.
• Accelerating new product introduction (NPI): During 2018, we significantly simplified the data collection process for new products which has led to an approximate 41% year-on-year reduction in our NPI lead time in Q4 2018. During 2019, we will focus on a further significant reduction in NPI lead times.
• Improving end-to-end efficiency: We are focused on using continuous improvement techniques and automation to reduce end-to-end process costs. Looking forward to 2019, our focus is on driving more automation in the creation of supplier and product information, leading to improved service at lower cost.
IMPROVING SUPPLIER EXPERIENCE
WORKING TO EXPAND FESTO’S REACHFesto is a leading provider of pneumatic and automation and control products. Prior to 2016, RS did not have a relationship with Festo and it was an obvious gap in our range. We introduced the Festo products into our range for Europe in June 2016. Since then, our collaboration has extended to Asia Pacific, followed by the US in 2017. We are the first distributor to have a truly global relationship with Festo. Since the launch in June 2016, we have rolled out 2,200 products and attracted over 18,700 customers to the Festo portfolio. Festo’s analysis showed that over 70% of these customers were new to them, showing the scale of our reach.
41%year-on-year reduction in NPI lead time in Q4 2018
>63new suppliers added during 2018
Electrocomponents plcAnnual Report and Accounts for the year ended 31 March 2018 17
STR
ATEG
IC R
EPO
RT
High-performance teamOver the past two years we have transformed the leadership of this organisation, bringing in a more diverse team with significant industry experience; a team that shares my ambition and vision for the business and remains excited by the opportunity ahead of us. During 2018, we further strengthened this leadership team with the addition of a new President of Global Supply Chain and a new leader for Asia Pacific. With our leadership team in place, the key focus for 2018 has been to build a more aspirational, customer-focused and accountable culture across the Group; a culture where passion, innovation and collaboration are encouraged. We have also increased our investment in training and are in the process of setting up a central learning management system to offer our people the learning and development resources required to be the leaders of the future. One of our key differentiators is our people and we need to ensure we invest, educate and motivate them to drive best-in-class results for our customers, suppliers and shareholders.
Operational excellenceWe have made good progress at driving efficiency and in the year we delivered £5 million of net annualised savings, which took our total cumulative annualised savings over the duration of the PIP to £30 million. As a result of strong revenue growth and an increased focus on efficiency, our adjusted operating profit conversion ratio rose a further 3.3 percentage points to 23.6% (2017: 20.3%). We continue to aspire to move this ratio closer to 30%; as such we remain committed to operating for less and investing in shared services and automation to drive operational excellence and efficiency.
As part of the second phase of the PIP, we are planning to roll out a global shared services strategy to complement our existing shared service operations in the UK, China and the Americas. We aim to drive improved service and efficiency through standardisation. This will deliver the scalability that the organisation requires to support its growth plans, enabling us to deliver improved service at a lower cost.
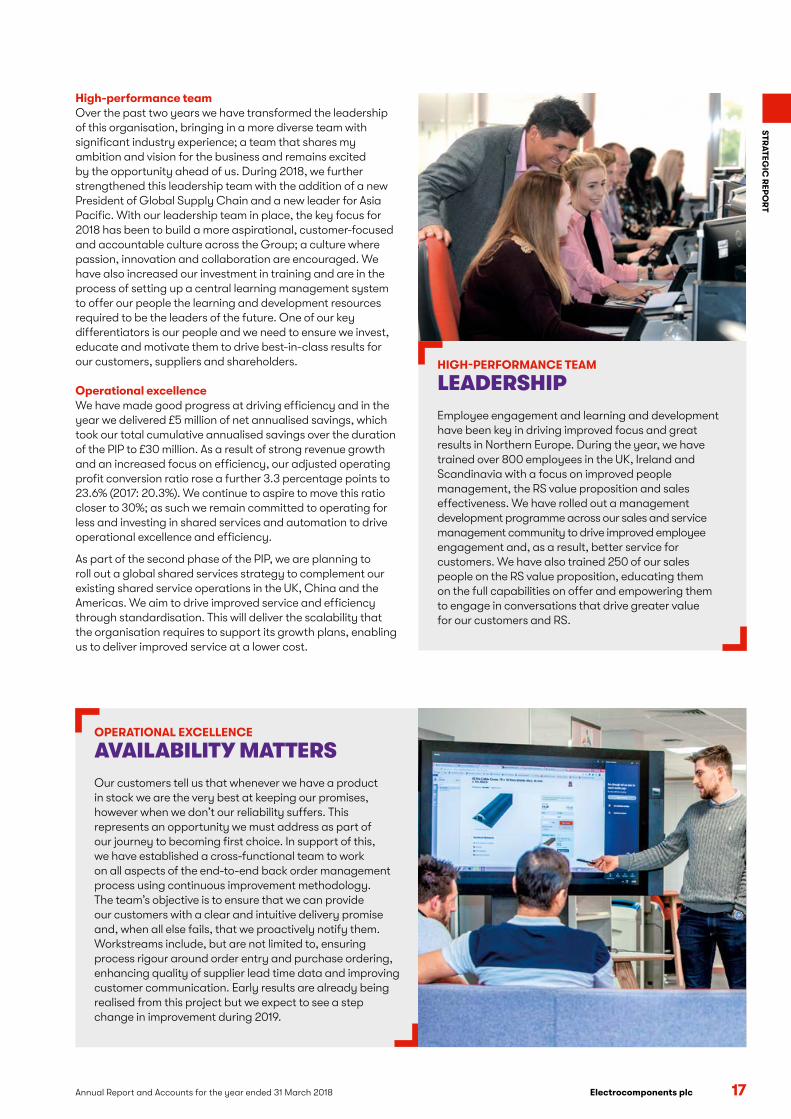
HIGH-PERFORMANCE TEAM
LEADERSHIP Employee engagement and learning and development have been key in driving improved focus and great results in Northern Europe. During the year, we have trained over 800 employees in the UK, Ireland and Scandinavia with a focus on improved people management, the RS value proposition and sales effectiveness. We have rolled out a management development programme across our sales and service management community to drive improved employee engagement and, as a result, better service for customers. We have also trained 250 of our sales people on the RS value proposition, educating them on the full capabilities on offer and empowering them to engage in conversations that drive greater value for our customers and RS.
OPERATIONAL EXCELLENCE
AVAILABILITY MATTERSOur customers tell us that whenever we have a product in stock we are the very best at keeping our promises, however when we don’t our reliability suffers. This represents an opportunity we must address as part of our journey to becoming first choice. In support of this, we have established a cross-functional team to work on all aspects of the end-to-end back order management process using continuous improvement methodology. The team’s objective is to ensure that we can provide our customers with a clear and intuitive delivery promise and, when all else fails, that we proactively notify them. Workstreams include, but are not limited to, ensuring process rigour around order entry and purchase ordering, enhancing quality of supplier lead time data and improving customer communication. Early results are already being realised from this project but we expect to see a step change in improvement during 2019.

18 Annual Report and Accounts for the year ended 31 March 2018 Electrocomponents plc
CEO’S REVIEW CONTINUED
INNOVATION
DESIGNSPARKDuring 2018, we developed a number of strategic partnerships to expand the DesignSpark platform through a franchise model as well as opening collaborative innovation labs across the globe.
The first of these was a strategic alliance with Eagle Labs, a Barclays initiative, to provide spaces that offer open and membership-based access to foster innovation in communities. As technology partner, RS is installing DesignSpark Labs within Eagle Labs, providing world-leading engineering equipment and technical expertise. Eagle Labs already has 13 innovation centres and are opening up more throughout the UK as well as in other markets across the world.
InnovationWe need to constantly innovate to remain relevant to our customers in an ever-changing marketplace. Our innovation has been focused in three key areas:
• Driving innovation into our existing solutions: A large part of our focus is making sure we make our customers’ lives easier by driving a best-in-class digital experience and improving the tools and insight we offer our suppliers. During 2018, we also redesigned our eProcurement and ePurchasing systems to offer customers more control and personalisation of their RS / Allied experience; these improvements will be rolled out to customers during 2019.
• Developing new tools and services: We are also designing and piloting new tools and services for both customers and suppliers and during 2018 we piloted a number of tools, such as chatbots and Internet of Things (IoT) solutions, with a view to rolling out some of these services to our customers in the future. During 2019, we will also be trialling a smart asset management solution with a select group of customers in Northern Europe, which in time could be rolled out more widely across the Group.
• Accelerating and monetising DesignSpark: We are focused on developing a community for makers and supporting innovators using new technology and DesignSpark tools and resources. We continue to invest to improve functionality and the range of services available; we are piloting DesignSpark Marketplace, which connects inventors with buyers to bring their creations to market. We continue to grow our DesignSpark membership and the future global roll-out of DesignSpark Labs, with partners such as Barclays, promises to further accelerate this growth and position DesignSpark right at the heart of innovation in our communities.
INNOVATION & OPERATIONAL EXCELLENCE
ROBOTIC PROCESS AUTOMATIONDuring 2018, the Group has been exploring the opportunity to increase the level of robotic process automation we use in areas of the business including finance, HR and customer services. We have been running a proof-of-concept exercise with technology vendors covering multiple processes. During 2019, we plan to roll out and industrialise this, making it a central plank of becoming first choice.

Electrocomponents plcAnnual Report and Accounts for the year ended 31 March 2018 19
STR
ATEG
IC R
EPO
RT
• Selling more to our customer base: We continue to look at opportunities to sell more to our customers and make our relationship with customers stronger.
– Range expansion: Both Allied and RS are continually reviewing opportunities to expand their range and capture a higher share of customer wallet; we have plans to significantly expand our stocked and non-stocked ranges during 2019 with a customer-led inventory strategy.
– Developing our value-added service proposition: We are also building a comprehensive range of value-added services for larger customers such as calibration services, eProcurement and inventory management solutions. The acquisition of IESA, a leading provider of value-added outsourcing services to industrial customers, further enhances our value-added service capabilities and will enable us to offer our customers a full service end-to-end solution for all their indirect procurement, inventory management and storeroom needs.
• Driving faster growth in RS Pro and electronics: – We are focused on building our electronics business. We have some key competitive advantages in electronics including: extensive customer reach in key markets such as the UK, Germany, Italy, China and Japan; DesignSpark, our community of over 650,000 design engineers, makers and students; and our leading presence in the single-board computing (SBC) market. All of these position us well to exploit growth opportunities in this market. We are focused on enhancing our electronics product range and adding new global supplier franchises and developing our SBC and IoT strategy.
– RS Pro also remains a key focus. During 2018, we increased investment in RS Pro inventory to improve availability, tailored our local product ranges to reflect local market needs and refreshed product packaging. This, and the continued salesforce education, has led to an acceleration in RS Pro revenue growth to 12.7% in H2 2018 versus 9.6% in H1 2018. Looking forward, we aim to continue the momentum as we accelerate NPI, with over 10,000 new products planned for 2019.
Reinvestment to accelerate growthWe have strong momentum in our business and we are taking advantage of this to increase investment in areas that we believe will be key to driving strong future growth and market share gains. We are focused on three key areas: investments to accelerate growth in customer numbers; investments to increase basket size via range and service expansion; and investments to accelerate the development of our RS Pro and electronics offering. While our primary focus to date has been on organic expansion, we will consider value-accretive acquisitions which fit well with our strategy to accelerate growth in these areas.
• Investing in our brands: We are investing in our brands again to ensure they are in the hearts and minds of our customers and we develop a brand leadership position in our space. During 2018, RS launched a global multi-channel brand awareness campaign, ‘for the inspired’, which celebrates some of the great achievements of inspired people within the engineering community. Likewise, Allied is investing in brand awareness to dominate mindshare in the automation and control space in the Americas. As a result of our social media campaigns we have seen a 111% year-on-year increase in engagement with our audiences. We have also significantly increased digital marketing investment right across the globe with higher pay-per-click (PPC) marketing, search engine optimisation (SEO) and link building, which is driving double-digit growth in website traffic during the year. Finally, the latest version of our interactive technology truck, Titan II, which showcases our new innovative products and technologies at trade events, customer site visits and educational establishments, is also playing a key role in increasing engagement with our customers, suppliers and, more importantly, our communities to encourage innovation and inspire the engineers of the future.
REINVESTMENT TO ACCELERATE GROWTH
ALLIED MEXICODuring 2018, we increased our sales presence in Mexico. As a major manufacturing economy, Mexico presents a significant opportunity for Allied; with the proximity of its distribution centre in Fort Worth, Texas, customers will benefit from the excellent multi-channel service and highly relevant offer. During 2018, we launched a local website and hired outside sales people to operate in Mexico, supported by our existing sales office in El Paso, Texas. Within 12 months, we have seen significant year-on-year revenue growth in Mexico and, as a result, we are expanding the resource and adding further outside sales people to capitalise on the growth potential in this market.
20 Annual Report and Accounts for the year ended 31 March 2018 Electrocomponents plc
CEO’S REVIEW CONTINUED
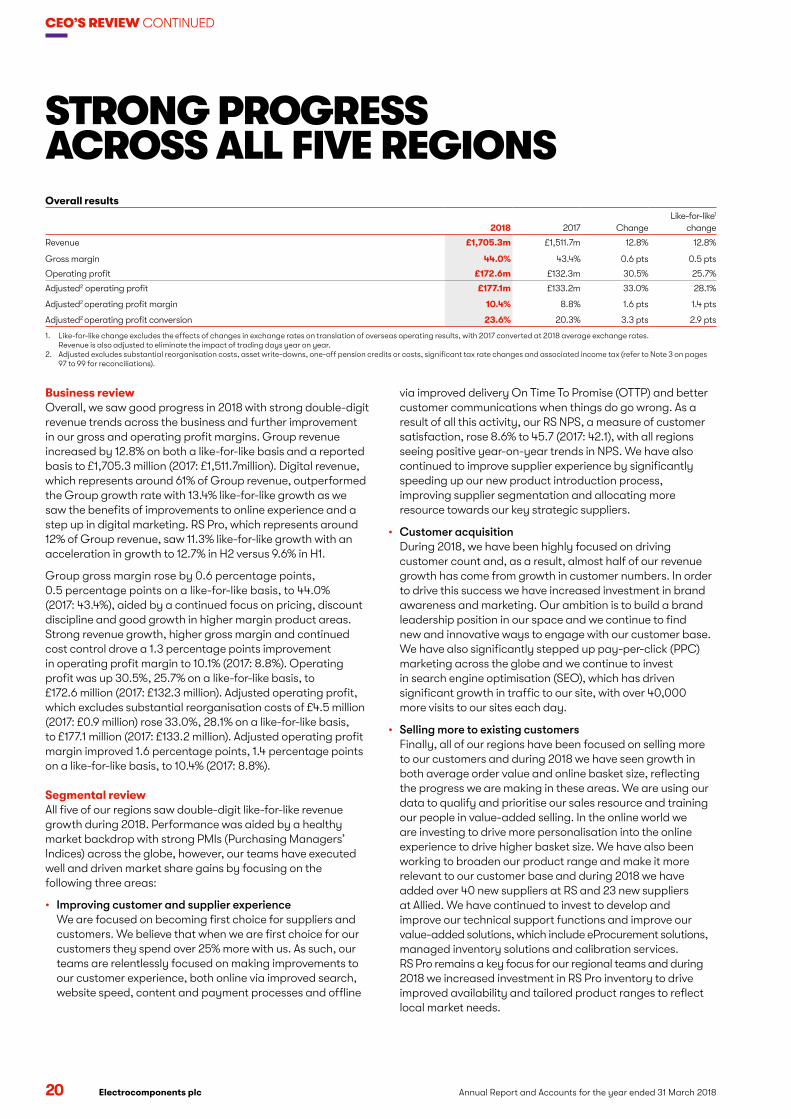
STRONG PROGRESS ACROSS ALL FIVE REGIONSOverall results
2018 2017 ChangeLike-for-like1
change
Revenue £1,705.3m £1,511.7m 12.8% 12.8%
Gross margin 44.0% 43.4% 0.6 pts 0.5 pts
Operating profit £172.6m £132.3m 30.5% 25.7%
Adjusted2 operating profit £177.1m £133.2m 33.0% 28.1%
Adjusted2 operating profit margin 10.4% 8.8% 1.6 pts 1.4 pts
Adjusted2 operating profit conversion 23.6% 20.3% 3.3 pts 2.9 pts
1. Like-for-like change excludes the effects of changes in exchange rates on translation of overseas operating results, with 2017 converted at 2018 average exchange rates. Revenue is also adjusted to eliminate the impact of trading days year on year.
2. Adjusted excludes substantial reorganisation costs, asset write-downs, one-off pension credits or costs, significant tax rate changes and associated income tax (refer to Note 3 on pages 97 to 99 for reconciliations).
Business reviewOverall, we saw good progress in 2018 with strong double-digit revenue trends across the business and further improvement in our gross and operating profit margins. Group revenue increased by 12.8% on both a like-for-like basis and a reported basis to £1,705.3 million (2017: £1,511.7million). Digital revenue, which represents around 61% of Group revenue, outperformed the Group growth rate with 13.4% like-for-like growth as we saw the benefits of improvements to online experience and a step up in digital marketing. RS Pro, which represents around 12% of Group revenue, saw 11.3% like-for-like growth with an acceleration in growth to 12.7% in H2 versus 9.6% in H1.
Group gross margin rose by 0.6 percentage points, 0.5 percentage points on a like-for-like basis, to 44.0% (2017: 43.4%), aided by a continued focus on pricing, discount discipline and good growth in higher margin product areas. Strong revenue growth, higher gross margin and continued cost control drove a 1.3 percentage points improvement in operating profit margin to 10.1% (2017: 8.8%). Operating profit was up 30.5%, 25.7% on a like-for-like basis, to £172.6 million (2017: £132.3 million). Adjusted operating profit, which excludes substantial reorganisation costs of £4.5 million (2017: £0.9 million) rose 33.0%, 28.1% on a like-for-like basis, to £177.1 million (2017: £133.2 million). Adjusted operating profit margin improved 1.6 percentage points, 1.4 percentage points on a like-for-like basis, to 10.4% (2017: 8.8%).
Segmental reviewAll five of our regions saw double-digit like-for-like revenue growth during 2018. Performance was aided by a healthy market backdrop with strong PMIs (Purchasing Managers’ Indices) across the globe, however, our teams have executed well and driven market share gains by focusing on the following three areas:
• Improving customer and supplier experience We are focused on becoming first choice for suppliers and customers. We believe that when we are first choice for our customers they spend over 25% more with us. As such, our teams are relentlessly focused on making improvements to our customer experience, both online via improved search, website speed, content and payment processes and offline
via improved delivery On Time To Promise (OTTP) and better customer communications when things do go wrong. As a result of all this activity, our RS NPS, a measure of customer satisfaction, rose 8.6% to 45.7 (2017: 42.1), with all regions seeing positive year-on-year trends in NPS. We have also continued to improve supplier experience by significantly speeding up our new product introduction process, improving supplier segmentation and allocating more resource towards our key strategic suppliers.
• Customer acquisition During 2018, we have been highly focused on driving customer count and, as a result, almost half of our revenue growth has come from growth in customer numbers. In order to drive this success we have increased investment in brand awareness and marketing. Our ambition is to build a brand leadership position in our space and we continue to find new and innovative ways to engage with our customer base. We have also significantly stepped up pay-per-click (PPC) marketing across the globe and we continue to invest in search engine optimisation (SEO), which has driven significant growth in traffic to our site, with over 40,000 more visits to our sites each day.
• Selling more to existing customers Finally, all of our regions have been focused on selling more to our customers and during 2018 we have seen growth in both average order value and online basket size, reflecting the progress we are making in these areas. We are using our data to qualify and prioritise our sales resource and training our people in value-added selling. In the online world we are investing to drive more personalisation into the online experience to drive higher basket size. We have also been working to broaden our product range and make it more relevant to our customer base and during 2018 we have added over 40 new suppliers at RS and 23 new suppliers at Allied. We have continued to invest to develop and improve our technical support functions and improve our value-added solutions, which include eProcurement solutions, managed inventory solutions and calibration services. RS Pro remains a key focus for our regional teams and during 2018 we increased investment in RS Pro inventory to drive improved availability and tailored product ranges to reflect local market needs.
Electrocomponents plcAnnual Report and Accounts for the year ended 31 March 2018 21
STR
ATEG
IC R
EPO
RT
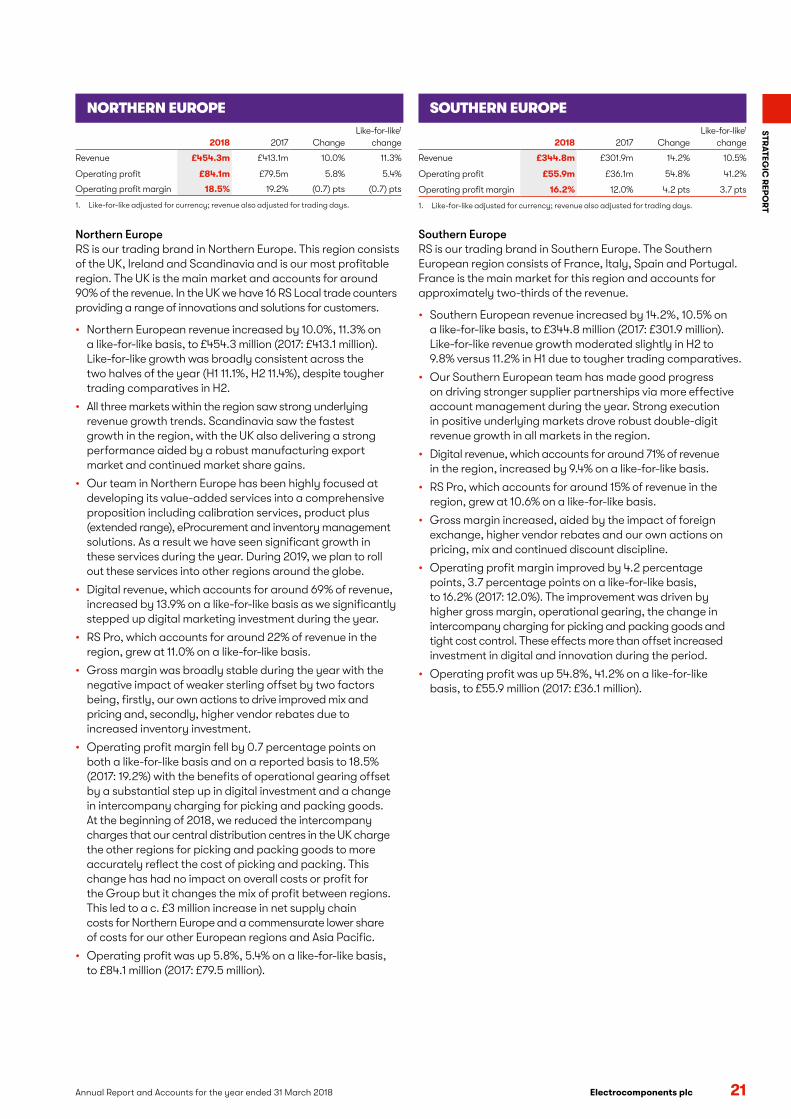
Northern EuropeRS is our trading brand in Northern Europe. This region consists of the UK, Ireland and Scandinavia and is our most profitable region. The UK is the main market and accounts for around 90% of the revenue. In the UK we have 16 RS Local trade counters providing a range of innovations and solutions for customers.
• Northern European revenue increased by 10.0%, 11.3% on a like-for-like basis, to £454.3 million (2017: £413.1 million). Like-for-like growth was broadly consistent across the two halves of the year (H1 11.1%, H2 11.4%), despite tougher trading comparatives in H2.
• All three markets within the region saw strong underlying revenue growth trends. Scandinavia saw the fastest growth in the region, with the UK also delivering a strong performance aided by a robust manufacturing export market and continued market share gains.
• Our team in Northern Europe has been highly focused at developing its value-added services into a comprehensive proposition including calibration services, product plus (extended range), eProcurement and inventory management solutions. As a result we have seen significant growth in these services during the year. During 2019, we plan to roll out these services into other regions around the globe.
• Digital revenue, which accounts for around 69% of revenue, increased by 13.9% on a like-for-like basis as we significantly stepped up digital marketing investment during the year.
• RS Pro, which accounts for around 22% of revenue in the region, grew at 11.0% on a like-for-like basis.
• Gross margin was broadly stable during the year with the negative impact of weaker sterling offset by two factors being, firstly, our own actions to drive improved mix and pricing and, secondly, higher vendor rebates due to increased inventory investment.
• Operating profit margin fell by 0.7 percentage points on both a like-for-like basis and on a reported basis to 18.5% (2017: 19.2%) with the benefits of operational gearing offset by a substantial step up in digital investment and a change in intercompany charging for picking and packing goods. At the beginning of 2018, we reduced the intercompany charges that our central distribution centres in the UK charge the other regions for picking and packing goods to more accurately reflect the cost of picking and packing. This change has had no impact on overall costs or profit for the Group but it changes the mix of profit between regions. This led to a c. £3 million increase in net supply chain costs for Northern Europe and a commensurate lower share of costs for our other European regions and Asia Pacific.
• Operating profit was up 5.8%, 5.4% on a like-for-like basis, to £84.1 million (2017: £79.5 million).
Southern EuropeRS is our trading brand in Southern Europe. The Southern European region consists of France, Italy, Spain and Portugal. France is the main market for this region and accounts for approximately two-thirds of the revenue.
• Southern European revenue increased by 14.2%, 10.5% on a like-for-like basis, to £344.8 million (2017: £301.9 million). Like-for-like revenue growth moderated slightly in H2 to 9.8% versus 11.2% in H1 due to tougher trading comparatives.
• Our Southern European team has made good progress on driving stronger supplier partnerships via more effective account management during the year. Strong execution in positive underlying markets drove robust double-digit revenue growth in all markets in the region.
• Digital revenue, which accounts for around 71% of revenue in the region, increased by 9.4% on a like-for-like basis.
• RS Pro, which accounts for around 15% of revenue in the region, grew at 10.6% on a like-for-like basis.
• Gross margin increased, aided by the impact of foreign exchange, higher vendor rebates and our own actions on pricing, mix and continued discount discipline.
• Operating profit margin improved by 4.2 percentage points, 3.7 percentage points on a like-for-like basis, to 16.2% (2017: 12.0%). The improvement was driven by higher gross margin, operational gearing, the change in intercompany charging for picking and packing goods and tight cost control. These effects more than offset increased investment in digital and innovation during the period.
• Operating profit was up 54.8%, 41.2% on a like-for-like basis, to £55.9 million (2017: £36.1 million).
NORTHERN EUROPE SOUTHERN EUROPE
2018 2017 ChangeLike-for-like1
change
Revenue £344.8m £301.9m 14.2% 10.5%
Operating profit £55.9m £36.1m 54.8% 41.2%
Operating profit margin 16.2% 12.0% 4.2 pts 3.7 pts
1. Like-for-like adjusted for currency; revenue also adjusted for trading days.
2018 2017 ChangeLike-for-like1
change
Revenue £454.3m £413.1m 10.0% 11.3%
Operating profit £84.1m £79.5m 5.8% 5.4%
Operating profit margin 18.5% 19.2% (0.7) pts (0.7) pts
1. Like-for-like adjusted for currency; revenue also adjusted for trading days.

22 Annual Report and Accounts for the year ended 31 March 2018 Electrocomponents plc
CEO’S REVIEW CONTINUED
Central EuropeRS is our trading brand in Central Europe. The Central European region consists of Germany, Austria, Benelux, Switzerland and Eastern Europe. Germany is the main market for this region and accounts for approximately two-thirds of the revenue.
• Overall, our Central European region saw strong 15.6% revenue growth, 12.8% like-for-like growth, to £238.8 million (2017: £206.6 million). Growth was consistent across the two halves of the year at 12.8%.
• All markets in the region saw double-digit like-for-like growth trends with some standout performances from the smaller markets of Austria, Eastern Europe and Switzerland.
• Digital revenue, which accounts for around 71% of revenue in the region, grew at 12.7% on a like-for-like basis.
• RS Pro, which accounts for 12% of revenue in the region, grew at 12.8% on a like-for-like basis.
• Gross margin increased, aided by foreign exchange benefits, higher vendor rebates, actions taken to improve discount discipline and pricing initiatives, including a new quotation process on our corporate account business.
• Operating profit margin improved by 5.0 percentage points, 4.3 percentage points on a like-for-like basis, to 11.9% (2017: 6.9%). Central Europe saw the benefits of higher gross margin, operational gearing and the change in intercompany charging for picking and packing goods, which more than offset increased investment in areas such as digital and innovation.
• Operating profit was up 99.3%, 71.7% on a like-for-like basis, to £28.5 million (2017: £14.3 million).
Asia Pacific RS is our trading brand in the Asia Pacific region. The Asia Pacific region consists of four similarly sized sub-regions: Australia and New Zealand, Greater China, Japan and South East Asia. We also have emerging markets operations in South Africa and India while using distributors in other territories.
• Asia Pacific revenue increased 15.0%, 18.2% on a like-for-like basis, to £226.6 million (2017: £197.1 million). Like-for-like revenue growth accelerated in H2 to 19.0% versus 17.2% in H1. All four sub-regions saw double-digit like-for-like growth during the year as the team executed well in a healthy underlying marketplace. Our emerging markets operation also saw strong double-digit like-for-like revenue growth.
• We have made significant progress in Asia Pacific over the last two and half years since the launch of the PIP. In August 2017 we hired a new leader for the Asia Pacific region, who has continued to develop his team with new leadership appointments in Australia, South East Asia, China, marketing, product management and a new head of digital for the region. The team’s work to drive improved customer experience has driven a further 20.9% improvement in Asia Pacific’s rolling 12-month NPS in the year to 32.4 (2017: 26.8). This is a good step forward but there still remains work to be done to bring customer service in Asia Pacific up to the Group benchmark. Next steps include localising our online experience and increasing engagement with local suppliers to drive a China-for-China inventory strategy, which will enable us to deliver a more relevant range to our customers and improve OTTP delivery.
• Digital revenue, which accounts for around 52% of revenue in the region, grew at 19.2% on a like-for-like basis.
• RS Pro, which accounts for around 12% of revenue in the region, grew at 10.1% on a like-for-like basis.
• Regional gross margin declined due primarily to product mix in our emerging market operations, where we saw faster growth in lower gross margin product areas such as single-board computers.
• Strong revenue growth and tight cost discipline has resulted in the Asia Pacific region delivering a profit for the first time during H2 and as a result we have seen a significant reduction in operating loss for the full year to £0.5 million (2017: £10.4 million). While this is a significant step forward and a great credit to the team in Asia Pacific, we remain committed to driving scale and improved profitability in the region.
ASIA PACIFICCENTRAL EUROPE
2018 2017 ChangeLike-for-like1
change
Revenue £226.6m £197.1m 15.0% 18.2%
Operating loss £(0.5)m £(10.4)m 95.2% 95.4%
Operating profit margin (0.2)% (5.3)% 5.1 pts 5.4 pts
1. Like-for-like adjusted for currency; revenue also adjusted for trading days.
2018 2017 ChangeLike-for-like1
change
Revenue £238.8m £206.6m 15.6% 12.8%
Operating profit £28.5m £14.3m 99.3% 71.7%
Operating profit margin 11.9% 6.9% 5.0 pts 4.3 pts
1. Like-for-like adjusted for currency; revenue also adjusted for trading days.
Electrocomponents plcAnnual Report and Accounts for the year ended 31 March 2018 23
STR
ATEG
IC R
EPO
RT
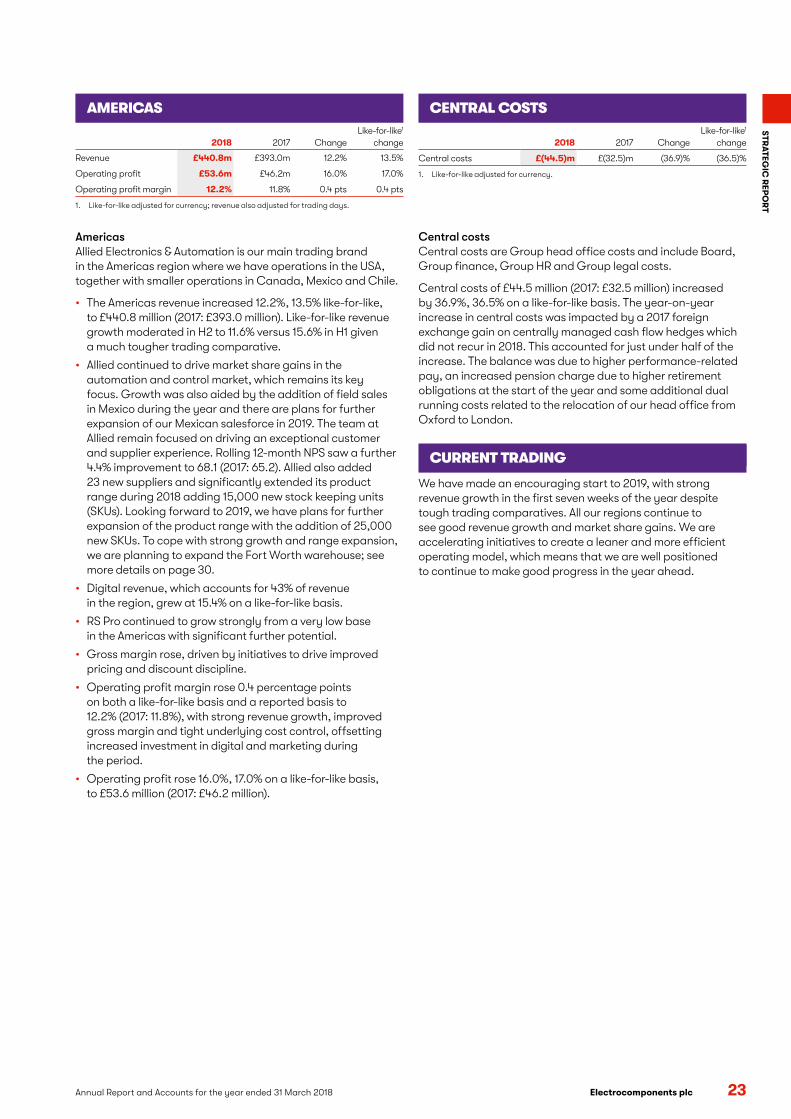
AmericasAllied Electronics & Automation is our main trading brand in the Americas region where we have operations in the USA, together with smaller operations in Canada, Mexico and Chile.
• The Americas revenue increased 12.2%, 13.5% like-for-like, to £440.8 million (2017: £393.0 million). Like-for-like revenue growth moderated in H2 to 11.6% versus 15.6% in H1 given a much tougher trading comparative.
• Allied continued to drive market share gains in the automation and control market, which remains its key focus. Growth was also aided by the addition of field sales in Mexico during the year and there are plans for further expansion of our Mexican salesforce in 2019. The team at Allied remain focused on driving an exceptional customer and supplier experience. Rolling 12-month NPS saw a further 4.4% improvement to 68.1 (2017: 65.2). Allied also added 23 new suppliers and significantly extended its product range during 2018 adding 15,000 new stock keeping units (SKUs). Looking forward to 2019, we have plans for further expansion of the product range with the addition of 25,000 new SKUs. To cope with strong growth and range expansion, we are planning to expand the Fort Worth warehouse; see more details on page 30.
• Digital revenue, which accounts for 43% of revenue in the region, grew at 15.4% on a like-for-like basis.
• RS Pro continued to grow strongly from a very low base in the Americas with significant further potential.
• Gross margin rose, driven by initiatives to drive improved pricing and discount discipline.
• Operating profit margin rose 0.4 percentage points on both a like-for-like basis and a reported basis to 12.2% (2017: 11.8%), with strong revenue growth, improved gross margin and tight underlying cost control, offsetting increased investment in digital and marketing during the period.
• Operating profit rose 16.0%, 17.0% on a like-for-like basis, to £53.6 million (2017: £46.2 million).
Central costsCentral costs are Group head office costs and include Board, Group finance, Group HR and Group legal costs.
Central costs of £44.5 million (2017: £32.5 million) increased by 36.9%, 36.5% on a like-for-like basis. The year-on-year increase in central costs was impacted by a 2017 foreign exchange gain on centrally managed cash flow hedges which did not recur in 2018. This accounted for just under half of the increase. The balance was due to higher performance-related pay, an increased pension charge due to higher retirement obligations at the start of the year and some additional dual running costs related to the relocation of our head office from Oxford to London.
CURRENT TRADING
We have made an encouraging start to 2019, with strong revenue growth in the first seven weeks of the year despite tough trading comparatives. All our regions continue to see good revenue growth and market share gains. We are accelerating initiatives to create a leaner and more efficient operating model, which means that we are well positioned to continue to make good progress in the year ahead.
CENTRAL COSTSAMERICAS
2018 2017 ChangeLike-for-like1
change
Central costs £(44.5)m £(32.5)m (36.9)% (36.5)%
1. Like-for-like adjusted for currency.
2018 2017 ChangeLike-for-like1
change
Revenue £440.8m £393.0m 12.2% 13.5%
Operating profit £53.6m £46.2m 16.0% 17.0%
Operating profit margin 12.2% 11.8% 0.4 pts 0.4 pts
1. Like-for-like adjusted for currency; revenue also adjusted for trading days.
24 Electrocomponents plc Annual Report and Accounts for the year ended 31 March 2018
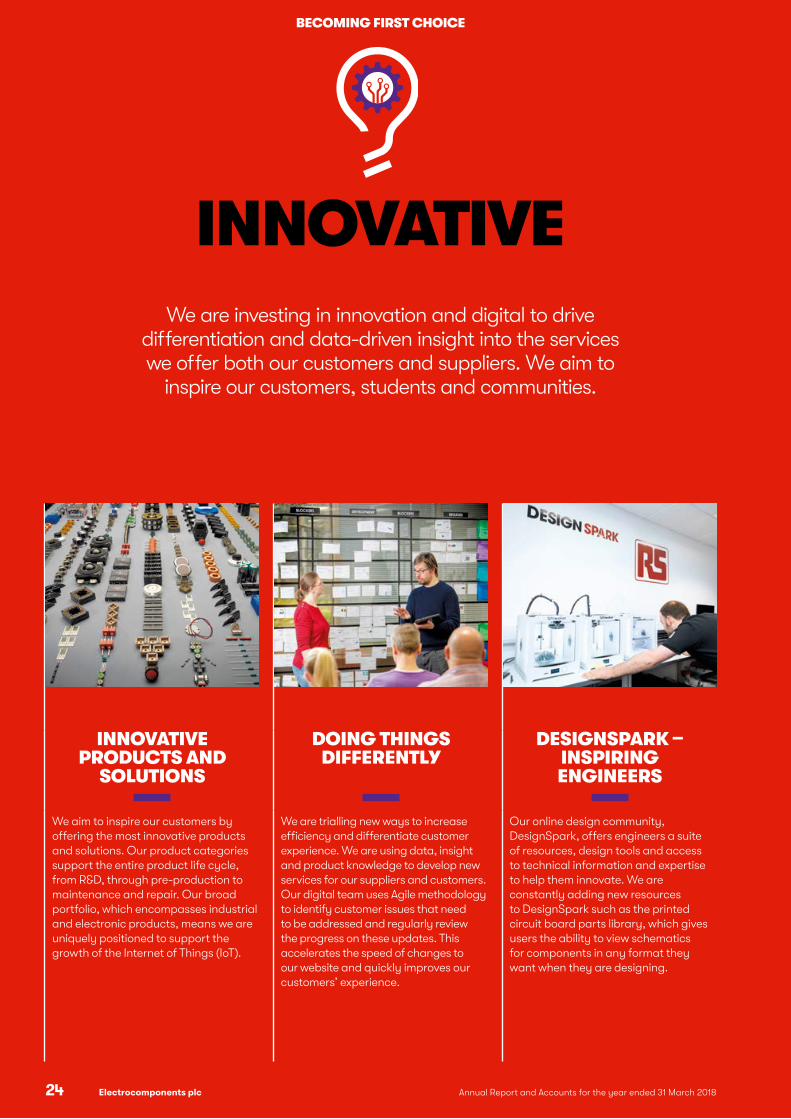
INNOVATIVE
BECOMING FIRST CHOICE
We are investing in innovation and digital to drive differentiation and data-driven insight into the services we offer both our customers and suppliers. We aim to
inspire our customers, students and communities.
INNOVATIVE PRODUCTS AND
SOLUTIONS
We aim to inspire our customers by offering the most innovative products and solutions. Our product categories support the entire product life cycle, from R&D, through pre-production to maintenance and repair. Our broad portfolio, which encompasses industrial and electronic products, means we are uniquely positioned to support the growth of the Internet of Things (IoT).
DOING THINGS DIFFERENTLY
We are trialling new ways to increase efficiency and differentiate customer experience. We are using data, insight and product knowledge to develop new services for our suppliers and customers.Our digital team uses Agile methodology to identify customer issues that need to be addressed and regularly review the progress on these updates. This accelerates the speed of changes to our website and quickly improves our customers’ experience.
DESIGNSPARK – INSPIRING ENGINEERS
Our online design community, DesignSpark, offers engineers a suite of resources, design tools and access to technical information and expertise to help them innovate. We are constantly adding new resources to DesignSpark such as the printed circuit board parts library, which gives users the ability to view schematics for components in any format they want when they are designing.

Electrocomponents plcAnnual Report and Accounts for the year ended 31 March 2018 25
STR
ATEG
IC R
EPO
RT
S
TRA
TEGIC
REP
OR
T
“ We want to not only demonstrate how technology is one of the coolest and most exciting areas to work in but also challenge some stereotypes associated with engineering as a career choice. The Titan II truck and the Gravity Jet Suit are initiatives that we expect should play a crucial part in engaging girls and boys and inspire them to be more open to innovating ideas in engineering.” RICHARD BROWNING FOUNDER OF GRAVITY SYSTEMS
DESIGNSPARK
ENABLING INNOVATION We strive to inspire and support great design and innovation. DesignSpark was used early on in the engineering process of the Daedalus jet- engine flight suit, conceived by Richard Browning, founder of Gravity Systems. The Daedalus design team used complex 3D design software, however, Richard wanted to make changes to the design and shape 3D models himself and the quickest way to do so was to use the free-to-download DesignSpark Mechanical 3D modelling software tool.
In November 2017, Richard flew Daedalus over Titan II, the new version of the 35-tonne RS interactive technology truck, at its launch event. Titan II showcases our innovative products to customers, universities and schools, inspiring innovation in both our existing customer base and the engineers of the future. The latest technologies include Raspberry Pi, 3D printing, robotics, the IoT and thermal engineering. Furthermore, visitors see demonstrations of virtual reality and augmented reality, bringing innovation to life.
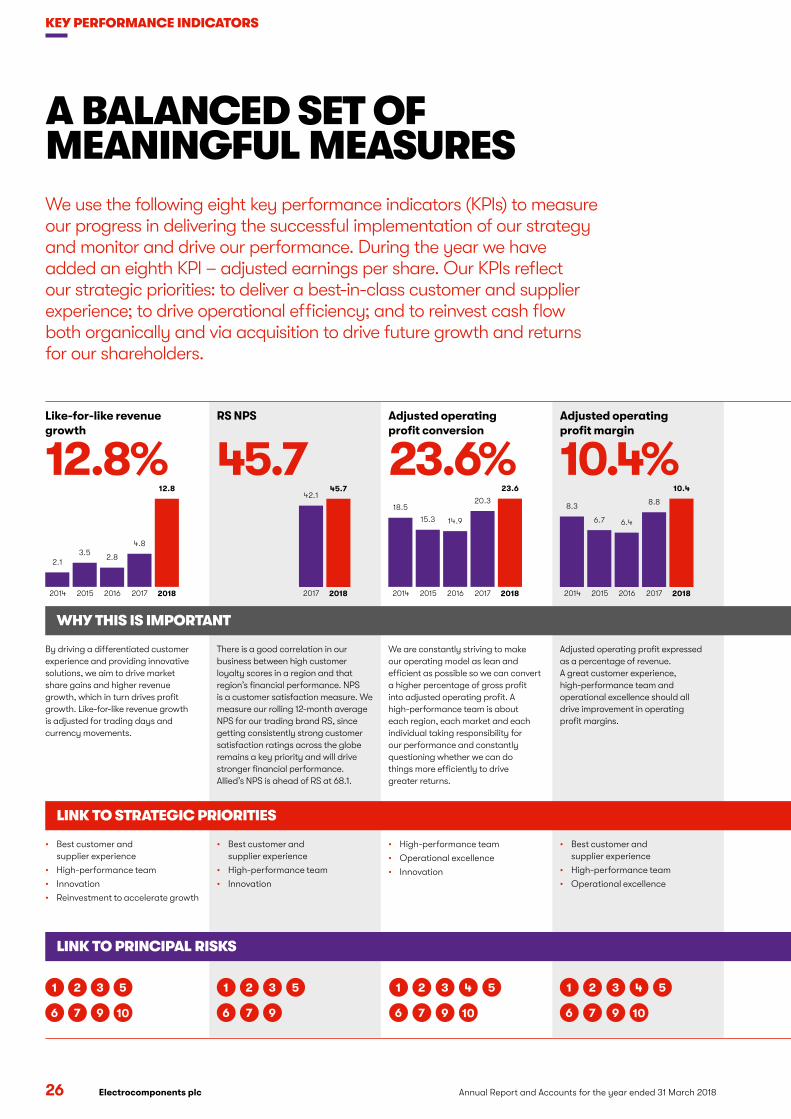
26 Annual Report and Accounts for the year ended 31 March 2018 Electrocomponents plc
KEY PERFORMANCE INDICATORS
20162015 2017 20182014
12.8
2.12.8
3.54.8
2017 2018
45.742.1
20162015 2017 20182014
18.5
14.915.3
20.3
23.6
20162015 2017 20182014
8.3
6.46.7
8.8
10.4
A BALANCED SET OF MEANINGFUL MEASURESWe use the following eight key performance indicators (KPIs) to measure our progress in delivering the successful implementation of our strategy and monitor and drive our performance. During the year we have added an eighth KPI – adjusted earnings per share. Our KPIs reflect our strategic priorities: to deliver a best-in-class customer and supplier experience; to drive operational efficiency; and to reinvest cash flow both organically and via acquisition to drive future growth and returns for our shareholders.
Like-for-like revenue growth
12.8%
By driving a differentiated customer experience and providing innovative solutions, we aim to drive market share gains and higher revenue growth, which in turn drives profit growth. Like-for-like revenue growth is adjusted for trading days and currency movements.
• Best customer and supplier experience
• High-performance team
• Innovation
• Best customer and supplier experience
• High-performance team
• Operational excellence
• High-performance team
• Operational excellence
• Innovation
• Best customer and supplier experience
• High-performance team
• Innovation
• Reinvestment to accelerate growth
There is a good correlation in our business between high customer loyalty scores in a region and that region’s financial performance. NPS is a customer satisfaction measure. We measure our rolling 12-month average NPS for our trading brand RS, since getting consistently strong customer satisfaction ratings across the globe remains a key priority and will drive stronger financial performance. Allied’s NPS is ahead of RS at 68.1.
Adjusted operating profit expressed as a percentage of revenue. A great customer experience, high-performance team and operational excellence should all drive improvement in operating profit margins.
We are constantly striving to make our operating model as lean and efficient as possible so we can convert a higher percentage of gross profit into adjusted operating profit. A high-performance team is about each region, each market and each individual taking responsibility for our performance and constantly questioning whether we can do things more efficiently to drive greater returns.
RS NPS
45.7Adjusted operating profit margin
10.4%Adjusted operating profit conversion
23.6%
1 2 3 5
6 7 9
1 2 3 5
6 7 9
11 22 33 44 55
66 77 9910
WHY THIS IS IMPORTANT
LINK TO STRATEGIC PRIORITIES
LINK TO PRINCIPAL RISKS
10 10
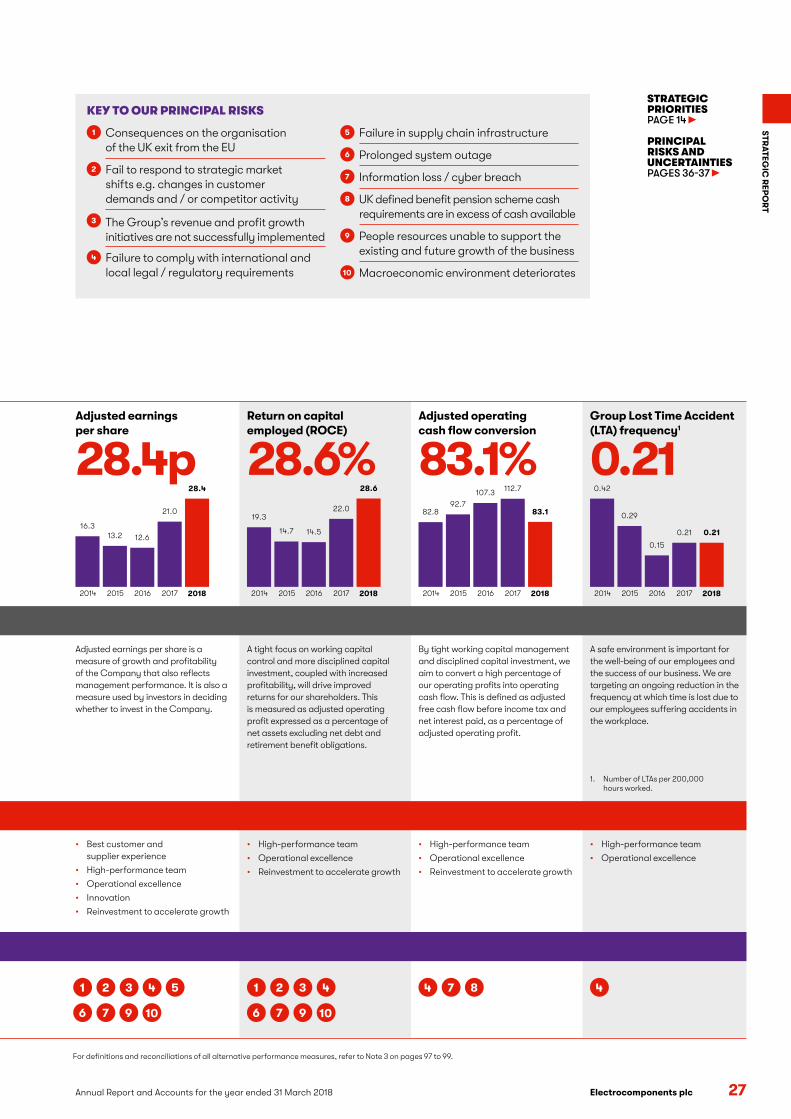
Electrocomponents plcAnnual Report and Accounts for the year ended 31 March 2018 27
STR
ATEG
IC R
EPO
RT
20162015 2017 20182014
16.3
12.613.2
21.0
28.4
20162015 2017 20182014
28.6
19.3
14.514.7
22.0
20162015 2017 20182014
83.182.8
107.3
92.7
112.7
20162015 2017 20182014
0.21
0.42
0.15
0.29
0.21
Adjusted earnings per share is a measure of growth and profitability of the Company that also reflects management performance. It is also a measure used by investors in deciding whether to invest in the Company.
• High-performance team
• Operational excellence
• Reinvestment to accelerate growth
• High-performance team
• Operational excellence
• High-performance team
• Operational excellence
• Reinvestment to accelerate growth
• Best customer and supplier experience
• High-performance team
• Operational excellence
• Innovation
• Reinvestment to accelerate growth
A tight focus on working capital control and more disciplined capital investment, coupled with increased profitability, will drive improved returns for our shareholders. This is measured as adjusted operating profit expressed as a percentage of net assets excluding net debt and retirement benefit obligations.
A safe environment is important for the well-being of our employees and the success of our business. We are targeting an ongoing reduction in the frequency at which time is lost due to our employees suffering accidents in the workplace.
1. Number of LTAs per 200,000 hours worked.
By tight working capital management and disciplined capital investment, we aim to convert a high percentage of our operating profits into operating cash flow. This is defined as adjusted free cash flow before income tax and net interest paid, as a percentage of adjusted operating profit.
Adjusted earnings per share
28.4p
21 3 4 5
6 7 9
KEY TO OUR PRINCIPAL RISKS
1 Consequences on the organisation of the UK exit from the EU
2 Fail to respond to strategic market shifts e.g. changes in customer demands and / or competitor activity
3 The Group’s revenue and profit growth initiatives are not successfully implemented
4 Failure to comply with international and local legal / regulatory requirements
5 Failure in supply chain infrastructure
6 Prolonged system outage
7 Information loss / cyber breach
8 UK defined benefit pension scheme cash requirements are in excess of cash available
9 People resources unable to support the existing and future growth of the business
10 Macroeconomic environment deteriorates
1 2 3 4
6 7 9 10
4
STRATEGIC PRIORITIESPAGE 14
PRINCIPAL RISKS AND UNCERTAINTIESPAGES 36-37
4 7 8
Return on capital employed (ROCE)
28.6%Adjusted operating cash flow conversion
83.1%Group Lost Time Accident (LTA) frequency1
0.21
WHY THIS IS IMPORTANT
LINK TO STRATEGIC PRIORITIES
LINK TO PRINCIPAL RISKS
10
For definitions and reconciliations of all alternative performance measures, refer to Note 3 on pages 97 to 99.
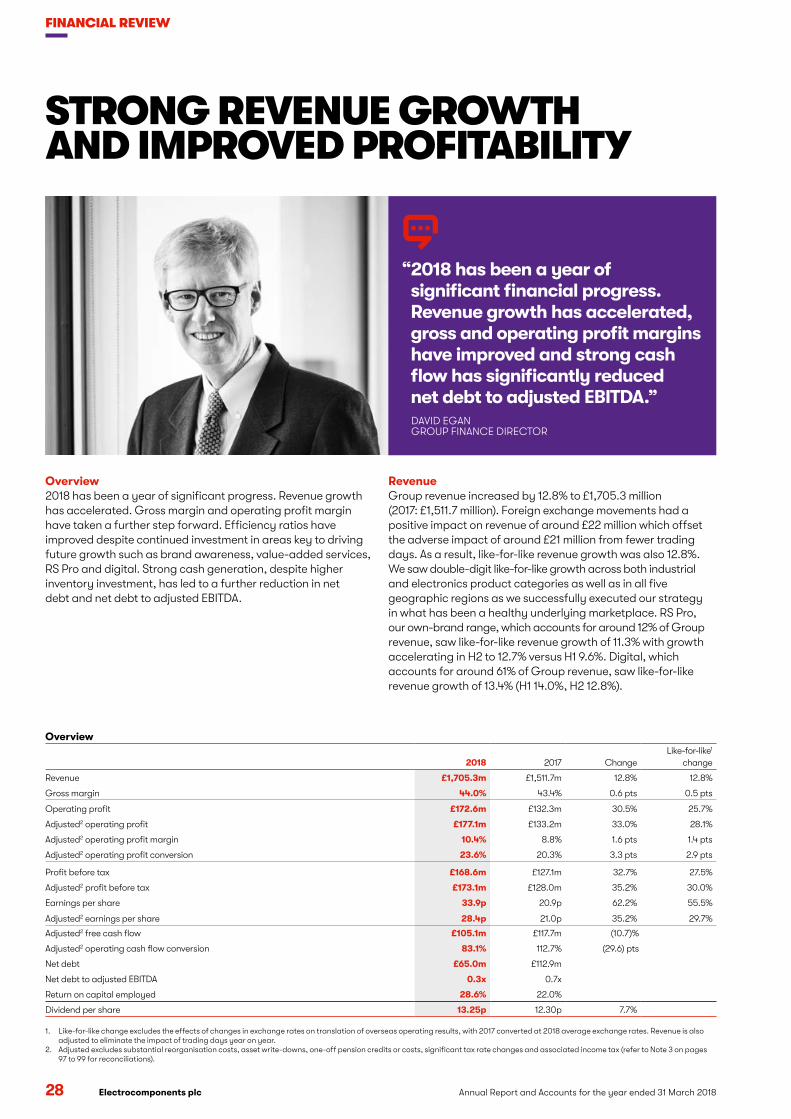
28 Annual Report and Accounts for the year ended 31 March 2018 Electrocomponents plc
FINANCIAL REVIEW
STRONG REVENUE GROWTH AND IMPROVED PROFITABILITY
Overview2018 has been a year of significant progress. Revenue growth has accelerated. Gross margin and operating profit margin have taken a further step forward. Efficiency ratios have improved despite continued investment in areas key to driving future growth such as brand awareness, value-added services, RS Pro and digital. Strong cash generation, despite higher inventory investment, has led to a further reduction in net debt and net debt to adjusted EBITDA.
RevenueGroup revenue increased by 12.8% to £1,705.3 million (2017: £1,511.7 million). Foreign exchange movements had a positive impact on revenue of around £22 million which offset the adverse impact of around £21 million from fewer trading days. As a result, like-for-like revenue growth was also 12.8%. We saw double-digit like-for-like growth across both industrial and electronics product categories as well as in all five geographic regions as we successfully executed our strategy in what has been a healthy underlying marketplace. RS Pro, our own-brand range, which accounts for around 12% of Group revenue, saw like-for-like revenue growth of 11.3% with growth accelerating in H2 to 12.7% versus H1 9.6%. Digital, which accounts for around 61% of Group revenue, saw like-for-like revenue growth of 13.4% (H1 14.0%, H2 12.8%).
“ 2018 has been a year of significant financial progress. Revenue growth has accelerated, gross and operating profit margins have improved and strong cash flow has significantly reduced net debt to adjusted EBITDA.”DAVID EGAN GROUP FINANCE DIRECTOR
Overview
2018 2017 ChangeLike-for-like1
change
Revenue £1,705.3m £1,511.7m 12.8% 12.8%
Gross margin 44.0% 43.4% 0.6 pts 0.5 pts
Operating profit £172.6m £132.3m 30.5% 25.7%
Adjusted2 operating profit £177.1m £133.2m 33.0% 28.1%
Adjusted2 operating profit margin 10.4% 8.8% 1.6 pts 1.4 pts
Adjusted2 operating profit conversion 23.6% 20.3% 3.3 pts 2.9 pts
Profit before tax £168.6m £127.1m 32.7% 27.5%
Adjusted2 profit before tax £173.1m £128.0m 35.2% 30.0%
Earnings per share 33.9p 20.9p 62.2% 55.5%
Adjusted2 earnings per share 28.4p 21.0p 35.2% 29.7%
Adjusted2 free cash flow £105.1m £117.7m (10.7)%
Adjusted2 operating cash flow conversion 83.1% 112.7% (29.6) pts
Net debt £65.0m £112.9m
Net debt to adjusted EBITDA 0.3x 0.7x
Return on capital employed 28.6% 22.0%
Dividend per share 13.25p 12.30p 7.7%
1. Like-for-like change excludes the effects of changes in exchange rates on translation of overseas operating results, with 2017 converted at 2018 average exchange rates. Revenue is also adjusted to eliminate the impact of trading days year on year.
2. Adjusted excludes substantial reorganisation costs, asset write-downs, one-off pension credits or costs, significant tax rate changes and associated income tax (refer to Note 3 on pages 97 to 99 for reconciliations).

Electrocomponents plcAnnual Report and Accounts for the year ended 31 March 2018 29
STR
ATEG
IC R
EPO
RT
Gross marginGroup gross margin increased by 0.6 percentage points, 0.5 percentage points on a like-for-like basis, to 44.0% (2017: 43.4%), a similar year-on-year increase to that seen in H1. This was a positive outcome given we saw gross margin comparatives toughen in H2 with the foreign exchange benefit in H2 2017 not repeated in 2018. Group gross margin has been driven by strong progress during the year on management initiatives to improve product mix and drive discount discipline. We saw an acceleration in growth at RS Pro in H2, which aided progress on product mix, and good momentum on initiatives to improve discount discipline, particularly at Allied in the Americas. Looking forward to 2019, we remain focused on driving initiatives to stabilise and, where possible, improve gross margin in order to drive higher operating profit margin.
Operating costs We continue to focus on increasing efficiency and simplification so we can convert a higher proportion of gross profit into operating profit.
During the year, total adjusted operating costs, which include regional costs and central costs (and exclude substantial reorganisation costs), increased by 9.4%, 8.2% on a like-for-like basis, to £572.7 million (2017: £523.5 million). Approximately half the underlying increase was due to inflationary increases in wages and higher variable costs including employee incentive costs driven by faster revenue growth and improved business results. The balance of the underlying increase was driven by continued investment in areas such as digital to improve online customer experience and drive more traffic to our websites as well as additional resource to support the growth of RS Pro.
As revenue growth outpaced cost growth, our adjusted operating profit conversion ratio improved by 3.3 percentage points, 2.9 percentage points on a like-for-like basis, to 23.6% (2017: 20.3%). Adjusted operating costs as a percentage of revenue fell by 1.0 percentage point to 33.6% (2017: 34.6%).
Substantial reorganisation costs The Group incurred substantial reorganisation costs of £4.5 million in the year (2017: £0.9 million). Approximately two-thirds of this cost related to the closure of our Oxford-based headquarters and the consolidation of our London-based digital office into one enlarged head office and digital hub in King’s Cross, London. The balance related to other labour-related restructuring charges also associated with the first phase of the Performance Improvement Plan.
Operating profitOperating profit rose 30.5% to £172.6 million (2017: £132.3 million). Excluding substantial reorganisation costs, adjusted operating profit increased by 33.0%, 28.1% on a like-for-like basis, to £177.1 million (2017: £133.2 million). Adjusted operating profit margin rose by 1.6 percentage points, 1.4 percentage points on a like-for-like basis, to 10.4% (2017: 8.8%).
Net finance costsNet finance costs reduced to £4.0 million (2017: £5.2 million) reflecting the strengthened balance sheet.
Profit before taxProfit before tax was up 32.7% to £168.6 million (2017: £127.1 million). Excluding substantial reorganisation costs, adjusted profit before tax was up 35.2%, 30.0% on a like-for-like basis, to £173.1 million (2017: £128.0 million).
Taxation The Group’s tax charge was £19.0 million. The enactment of the new US Tax Cuts and Jobs Act in December 2017 resulted in a non-cash tax credit of £27.9 million due to the recalculation of deferred tax balances at the new lower rate. This non-cash credit, along with a tax credit of £0.9 million relating to the tax effect of the substantial reorganisation costs, reduced the Group’s effective tax rate to 11%. Excluding these two items, the Group’s adjusted tax charge was £47.8 million (2017: £35.4 million), resulting in an effective tax rate of 28% on adjusted profit before tax, unchanged from the prior year. This includes a charge of £4.2 million relating to the Group’s assessment of uncertain tax provisions (2017: £1.1 million).
The Group’s effective tax rate is sensitive to the geographic mix of profits, and reflects the impact of higher rates in certain jurisdictions such as the US. Looking forward to 2019, we expect the impact of the US Tax Cuts and Jobs Act to reduce the Group’s adjusted effective tax rate percentage to the mid-20s.
During the year, the Group’s tax strategy was reviewed and endorsed by the Board. Further details can be found on the Group’s website. We continue to seek to ensure that key tax risks are appropriately mitigated, that appropriate taxes are paid in each jurisdiction where the Group operates, and that our reputation as a responsible taxpayer is safeguarded.
We are committed to having a positive relationship with tax authorities and to dealing with our tax affairs in a straightforward and honest manner.

30 Annual Report and Accounts for the year ended 31 March 2018 Electrocomponents plc
FINANCIAL REVIEW CONTINUED
Earnings per shareEarnings per share was up 62.2% to 33.9p (2017: 20.9p) as it benefited from the non-cash deferred tax credit as a result of the US tax legislation. Adjusted earnings per share of 28.4p (2017: 21.0p) was up 35.2%, 29.7% on a like-for-like basis, as a result of the growth in adjusted profit before tax.
Cash flowCash generated from operations increased to £168.9 million (2017: £160.1 million) with the increase being driven by strong growth in operating profit, partially offset by increased inventory investment. During the year faster revenue growth drove higher working capital absorption by the Group. We also took a decision during the first half to increase inventory levels to improve product availability and our On Time To Promise ratio (OTTP), which had trended downwards during H2 2017. Product availability and OTTP are both key drivers of Net Promoter Score (NPS) and customer satisfaction.
Working capital as a percentage of revenue improved by 0.7 percentage points to 20.2% (2017: 20.9%). Stock turn was 2.9 times (2017: 2.8 times).
Net interest paid was £4.2 million (2017: £4.9 million). Income tax paid rose to £37.8 million (2017: £27.5 million) as 2017’s tax cash flow benefited from a deduction for substantial reorganisation costs incurred during the prior year.
Net capital expenditure was £24.2 million (2017: £15.1 million) and, as a result, capital expenditure was 1.0 times depreciation (2017: 0.7 times). Key capital expenditure projects in 2018 included the upgrade to an Endeca search platform, data security upgrades to our online platform and the initiation of a project to ensure track and trace capability for RS customers. Looking forward to 2019 we are planning to increase investment in our supply chain to drive improved service for customers in two key areas. Firstly, we are continuing to invest in track and
trace capabilities at RS. Secondly, we are currently reviewing a two-year £40 million plan to expand our existing Allied warehouse in Fort Worth, Texas, to support future growth and product range expansion. This project is still under review but, if approved, could lead to capital expenditure to depreciation rising closer to 1.7 times over the next two years.
Free cash flow was £102.7 million (2017: £112.6 million). Adjusted free cash flow was £105.1 million (2017: £117.7 million) and excludes a net cash outflow related to substantial reorganisation activities of £2.4 million, which largely relates to labour restructuring charges and our head office relocation. Adjusted operating cash flow conversion, which is defined as adjusted free cash flow before income tax and net interest paid as a percentage of adjusted operating profit and is one of our eight KPIs, was 83.1% (2017: 112.7%).
Return on capital employed (ROCE)Net assets were £482.5 million (2017: £389.0 million). ROCE, calculated using adjusted operating profit for the 12 months to 31 March 2018 and year-end net assets excluding net debt and retirement benefit obligations, was 28.6% (2017: 22.0%).
Summary cash flow£m 2018 2017
Operating profit 172.6 132.3
Add back: depreciation and amortisation 25.8 29.2
EBITDA 198.4 161.5
Add back loss on disposal of non-current assets 1.7 0.9
Movement in working capital (38.5) 3.6
Movement in provisions 1.9 (9.3)
Other 5.4 3.4
Cash generated from operations 168.9 160.1
Net interest paid (4.2) (4.9)
Income tax paid (37.8) (27.5)
Net cash from operating activities 126.9 127.7
Net capital expenditure (24.2) (15.1)
Free cash flow 102.7 112.6
Add back cash effect of adjustments1 2.4 5.1
Adjusted¹ free cash flow 105.1 117.7
1. Adjusted excludes the impact of substantial reorganisation cash flows.
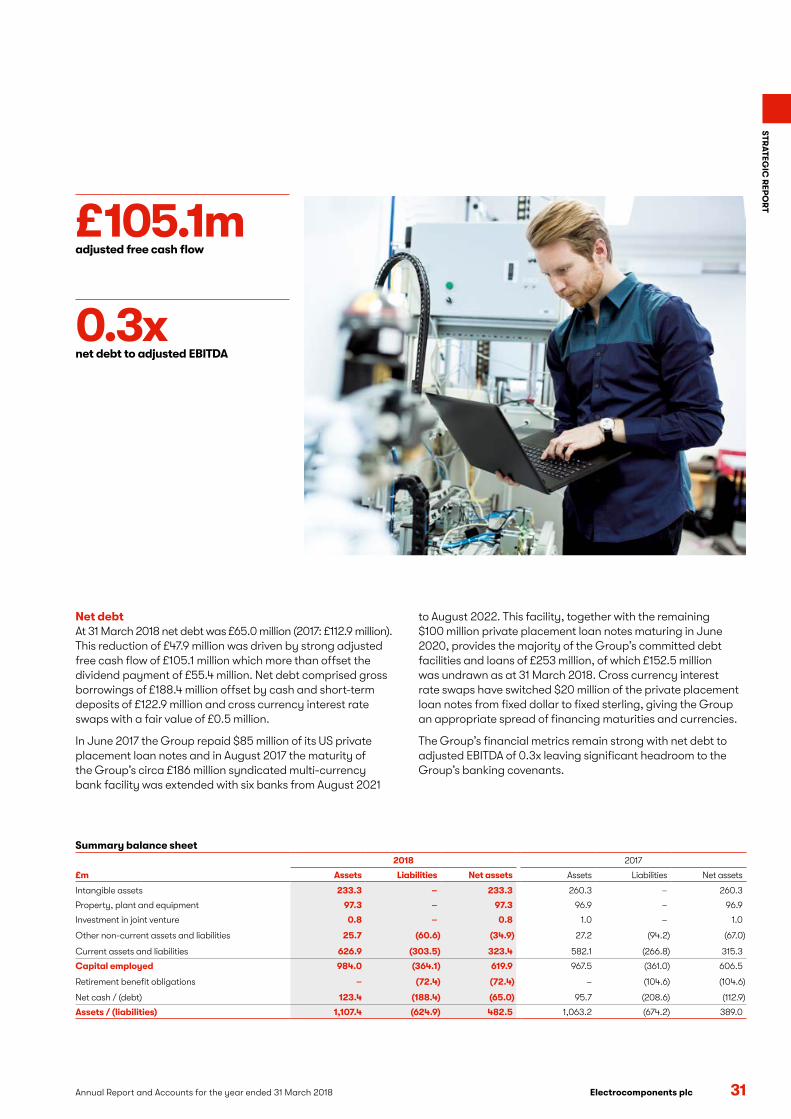
Electrocomponents plcAnnual Report and Accounts for the year ended 31 March 2018 31
STR
ATEG
IC R
EPO
RT
Net debt At 31 March 2018 net debt was £65.0 million (2017: £112.9 million). This reduction of £47.9 million was driven by strong adjusted free cash flow of £105.1 million which more than offset the dividend payment of £55.4 million. Net debt comprised gross borrowings of £188.4 million offset by cash and short-term deposits of £122.9 million and cross currency interest rate swaps with a fair value of £0.5 million.
In June 2017 the Group repaid $85 million of its US private placement loan notes and in August 2017 the maturity of the Group’s circa £186 million syndicated multi-currency bank facility was extended with six banks from August 2021
to August 2022. This facility, together with the remaining $100 million private placement loan notes maturing in June 2020, provides the majority of the Group’s committed debt facilities and loans of £253 million, of which £152.5 million was undrawn as at 31 March 2018. Cross currency interest rate swaps have switched $20 million of the private placement loan notes from fixed dollar to fixed sterling, giving the Group an appropriate spread of financing maturities and currencies.
The Group’s financial metrics remain strong with net debt to adjusted EBITDA of 0.3x leaving significant headroom to the Group’s banking covenants.
Summary balance sheet2018 2017
£m Assets Liabilities Net assets Assets Liabilities Net assets
Intangible assets 233.3 – 233.3 260.3 – 260.3
Property, plant and equipment 97.3 – 97.3 96.9 – 96.9
Investment in joint venture 0.8 – 0.8 1.0 – 1.0
Other non-current assets and liabilities 25.7 (60.6) (34.9) 27.2 (94.2) (67.0)
Current assets and liabilities 626.9 (303.5) 323.4 582.1 (266.8) 315.3
Capital employed 984.0 (364.1) 619.9 967.5 (361.0) 606.5
Retirement benefit obligations – (72.4) (72.4) – (104.6) (104.6)
Net cash / (debt) 123.4 (188.4) (65.0) 95.7 (208.6) (112.9)
Assets / (liabilities) 1,107.4 (624.9) 482.5 1,063.2 (674.2) 389.0
0.3x net debt to adjusted EBITDA
£105.1madjusted free cash flow
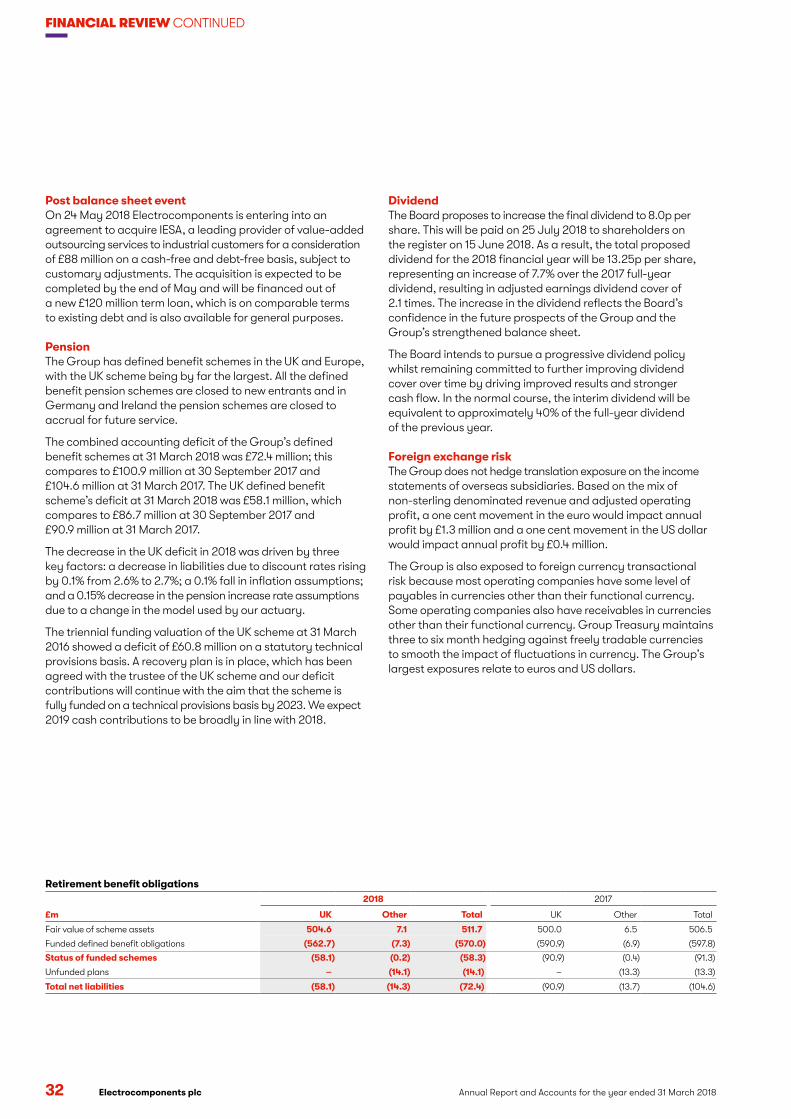
32 Annual Report and Accounts for the year ended 31 March 2018 Electrocomponents plc
FINANCIAL REVIEW CONTINUED
DividendThe Board proposes to increase the final dividend to 8.0p per share. This will be paid on 25 July 2018 to shareholders on the register on 15 June 2018. As a result, the total proposed dividend for the 2018 financial year will be 13.25p per share, representing an increase of 7.7% over the 2017 full-year dividend, resulting in adjusted earnings dividend cover of 2.1 times. The increase in the dividend reflects the Board’s confidence in the future prospects of the Group and the Group’s strengthened balance sheet.
The Board intends to pursue a progressive dividend policy whilst remaining committed to further improving dividend cover over time by driving improved results and stronger cash flow. In the normal course, the interim dividend will be equivalent to approximately 40% of the full-year dividend of the previous year.
Foreign exchange riskThe Group does not hedge translation exposure on the income statements of overseas subsidiaries. Based on the mix of non-sterling denominated revenue and adjusted operating profit, a one cent movement in the euro would impact annual profit by £1.3 million and a one cent movement in the US dollar would impact annual profit by £0.4 million.
The Group is also exposed to foreign currency transactional risk because most operating companies have some level of payables in currencies other than their functional currency. Some operating companies also have receivables in currencies other than their functional currency. Group Treasury maintains three to six month hedging against freely tradable currencies to smooth the impact of fluctuations in currency. The Group’s largest exposures relate to euros and US dollars.
Post balance sheet eventOn 24 May 2018 Electrocomponents is entering into an agreement to acquire IESA, a leading provider of value-added outsourcing services to industrial customers for a consideration of £88 million on a cash-free and debt-free basis, subject to customary adjustments. The acquisition is expected to be completed by the end of May and will be financed out of a new £120 million term loan, which is on comparable terms to existing debt and is also available for general purposes.
Pension The Group has defined benefit schemes in the UK and Europe, with the UK scheme being by far the largest. All the defined benefit pension schemes are closed to new entrants and in Germany and Ireland the pension schemes are closed to accrual for future service.
The combined accounting deficit of the Group’s defined benefit schemes at 31 March 2018 was £72.4 million; this compares to £100.9 million at 30 September 2017 and £104.6 million at 31 March 2017. The UK defined benefit scheme’s deficit at 31 March 2018 was £58.1 million, which compares to £86.7 million at 30 September 2017 and £90.9 million at 31 March 2017.
The decrease in the UK deficit in 2018 was driven by three key factors: a decrease in liabilities due to discount rates rising by 0.1% from 2.6% to 2.7%; a 0.1% fall in inflation assumptions; and a 0.15% decrease in the pension increase rate assumptions due to a change in the model used by our actuary.
The triennial funding valuation of the UK scheme at 31 March 2016 showed a deficit of £60.8 million on a statutory technical provisions basis. A recovery plan is in place, which has been agreed with the trustee of the UK scheme and our deficit contributions will continue with the aim that the scheme is fully funded on a technical provisions basis by 2023. We expect 2019 cash contributions to be broadly in line with 2018.
Retirement benefit obligations2018 2017
£m UK Other Total UK Other Total
Fair value of scheme assets 504.6 7.1 511.7 500.0 6.5 506.5
Funded defined benefit obligations (562.7) (7.3) (570.0) (590.9) (6.9) (597.8)
Status of funded schemes (58.1) (0.2) (58.3) (90.9) (0.4) (91.3)
Unfunded plans – (14.1) (14.1) – (13.3) (13.3)
Total net liabilities (58.1) (14.3) (72.4) (90.9) (13.7) (104.6)

STR
ATEG
IC R
EPO
RT
Electrocomponents plcAnnual Report and Accounts for the year ended 31 March 2018 33
AMBIONICS
FOR THE INSPIRED
“ My inspiration was simply to help my son.” BEN RYAN CEO AMBIONICS
RS has supported an innovative business start-up, Ambionics, which is helping to bring functional limbs with hydraulic technology to children around the world. The inventor of the technology and founder of Ambionics, Ben Ryan, began developing the first hydraulic limb for his own amputee baby son, Sol.
RS has provided all the 3D printing filament for the prototype development of body-powered hydraulic limbs, after Ben – dissatisfied by the standard limb options for babies and toddlers – gave up his career in teaching to devote himself to the development of a new arm for Sol.

34 Annual Report and Accounts for the year ended 31 March 2018 Electrocomponents plc
MANAGING OUR RISKS EFFECTIVELY
RISKS, VIABILITY AND GOING CONCERN
The Group has risk management and internal control processes to identify, assess and manage the risks likely to affect the achievement of its corporate objectives and business performance.
The risk management process The risk management process is co-ordinated by the Group’s risk team. The principal elements of the process are:
• Identification Risks are identified through a variety of sources both external, to ensure that developing risk themes are considered, and from within the Group, including senior, regional and country management teams. The focus of the risk identification is on those risks which, if they occurred, would have a material quantitative or reputation impact on the Group.
• Assessment Management identifies the controls for each risk and assesses (using consistent measures) the impact and likelihood of the risk occurring taking into account the effects of the existing controls (the net risk). This assessment is compared with the Group’s risk appetite to determine whether further mitigating actions are required. This process is supplemented by an annual risk and controls assessment, which all operating locations and the Group-wide functions are required to complete.
• Ownership The Group’s principal risks are owned by the Group’s Senior Management Team with specific mitigating actions / controls owned by individual members of the team. The Senior Management Team collectively reviews the risk register, the controls and mitigating actions at specific Group risk review meetings held periodically throughout the year.
• The Board The Board confirms it has undertaken a robust review of the Group’s principal risks (including those that could threaten its business model, future performance, solvency or liquidity) and assessed them against the Group’s risk appetite. For a number of the principal risks management will, as part of ongoing activities, update the Board on these risks and their management. This allows the Board to determine whether the actions taken by management are sufficient.
Risk appetiteIn accordance with the UK Corporate Governance Code, the Board defined its risk appetite across three risk categories: strategic, operating and regulatory / compliance. These three categories use both quantitative and qualitative criteria. During the year ended 31 March 2018, the Board again reviewed its risk appetite across the three categories with no significant changes being made.
Viability statementThe Board considers the longer-term viability of the Group as part of its regular monitoring and review of risk management internal control systems, as described on page 54. In addition to the risk mitigation plans, our business model is structured so that the Group is not reliant on one particular group of customers or geography, and has a very diverse customer base across our several geographies. Our capital position is supported by regular reviews of the Group’s funding facilities and banking covenants’ headroom, through the Board’s Treasury Committee. The Group’s financial position, in particular cash flow, is also reviewed through monthly management accounts and regular updates to the Board from the Group Finance Director and CEO. Details of the Group’s sources of finance are outlined on page 116 with the earliest facility expiring being the Group’s private placement loan notes of $100 million in June 2020.
The Group’s prospects are assessed primarily through its strategic and financial planning process. This includes the preparation of a detailed annual budget and a longer-term strategic plan, updated annually, which are reviewed and approved by the Board. In prior years the strategic plan covered three years, with the first year being the budget, and this year this has been extended out a further two years by a high level extrapolation. Progress against budget, together with regular forecast updates, is reviewed monthly by both the Senior Management Team and the Board.
Assessment periodIn their assessment of viability, the Directors have reviewed the assessment period and have determined that a three-year period to 31 March 2021 continues to be the most appropriate. The robustness of the strategic plan is significantly higher in the first three years. The Group has few contracts with either customers or suppliers extending beyond three years and, in the main, contracts are for one year or less. The business operates with a minimal forward order book, generally taking orders and shipping them on the same day. In addition, as more business moves online and we become more agile, speed of change increases and so visibility is relatively short term. Of our long-term obligations, the UK pension plan is the largest and its triennial funding valuation forms the basis of our agreeing its funding with the trustee.

Electrocomponents plcAnnual Report and Accounts for the year ended 31 March 2018 35
STR
ATEG
IC R
EPO
RT
Assessment of viabilityEach of the Group’s principal risks and uncertainties on pages 36 and 37 has a potential impact on the Group’s viability and so the Directors determined an appropriately severe but plausible stress test for each. They decided which stress tests would have the most impact on the viability of the Group and developed appropriate scenarios for these.
The strategic plan reflects the Directors’ best estimate of the future prospects of the Group. Therefore, in order to assess the viability of the Group, the scenarios were modelled by overlaying them onto the plan to quantify the potential impact of one or more of them crystallising over the assessment period.
Principal risks and uncertainties which have the most impact on the viability of the Group and scenarios modelled
Scenario modelled Principal risks and uncertainties tested
Scenario 1 – BrexitRevenue and operating profit margin fall with the impact of tariffs and higher costs; foreign exchange rates move back to pre-Brexit levels.
1 Consequences on the organisation of the UK exit from the EU
Scenario 2 – Revenue downRevenue falls significantly and takes time to recover.
2 Fail to respond to strategic market shifts
3 The Group’s revenue and profit growth initiatives are not successfully implemented
4 Failure to comply with international and local legal / regulatory requirements
10 Macroeconomic environment deteriorates
Scenario 3 – Revenue down and lower operating profit marginScenario 2 plus operating profit margin further declines.
2 Fail to respond to strategic market shifts
3 The Group’s revenue and profit growth initiatives are not successfully implemented
4 Failure to comply with international and local legal / regulatory requirements
10 Macroeconomic environment deteriorates
Scenario 4 – Significant site failureMajor incident at the largest warehouse which destroys the building and its contents.
5 Failure in supply chain infrastructure
Scenario 5 – Major system failureMajor system failure (possibly caused by a cyber attack) leading to a serious loss of service, fines for data breach and loss of reputation leading to halving of revenue growth.
6 Prolonged system outage
7 Information loss / cyber breach
The severe and plausible scenarios for the principal risks and uncertainties 8 ‘UK defined benefit pension scheme cash requirements are in excess of cash available’ and 9 ‘People resources unable to support the existing and future growth of the business’ were assessed to have less impact on the Group’s viability.
In performing the above tests it was assumed that no major reorganisations or significant working capital initiatives would occur in mitigation, the stated dividend policy is not changed, capital expenditure is maintained at current levels and all existing debt facilities are not refinanced as they mature.
The results of the above stress tests showed the Group would be able to withstand the impact of these scenarios occurring. A reverse stress test was also undertaken to assess the circumstances that would threaten the Group’s current financing arrangements and the Directors consider the risk of these circumstances occurring to be remote.
The above scenarios are hypothetical and extremely severe for the purpose of creating outcomes that have the ability to threaten the viability of the Group; however, multiple control measures are in place to prevent and mitigate any such occurrences from taking place. If any of these scenarios actually happened, various options are available to the Group to maintain liquidity so as to continue in operation.
Confirmation of viabilityBased on the assessment outlined above, the Directors have a reasonable expectation that the Group will be able to continue in operation and meet its liabilities as they fall due over the three years to 31 March 2021.
Going concernThe Directors also believe that it is appropriate to continue to adopt the going concern basis in preparing the Group’s accounts.

36 Annual Report and Accounts for the year ended 31 March 2018 Electrocomponents plc
RISKS, VIABILITY AND GOING CONCERN CONTINUED
Principal risks and uncertainties The Group has identified 10 principal risks, which are similar to those disclosed last year, with the only changes being the development of some already identified risks. The Group’s principal risks are categorised under one of three headings:
strategic (see the Group’s strategy on page 14), compliance and operating risks (see the Business Model on pages 4 and 5). These categories mirror those used by the Group to assess its risk appetite.
Risk description Risk direction Mitigating activities
Strategic risks
1
Consequences on the organisation of the UK exit from the EUThis includes the risk to the Group’s supply chain activities across the UK and the EU including possible changes to customs duties and tariffs (around 80% of our purchases for the global RS brand are routed through the UK to serve our global customer base). Other related risks include migration of employees and potential impact with changes to existing legislation.
Possible implications not fully defined and dependent on national negotiations with effects from 2020 onwards
• A Group risk assessment in advance of the UK referendum led to reviews across business areas that would be affected by a UK withdrawal from the EU.
• These reviews include: understanding the potential impacts on the Group’s global supply chain infrastructure, including the transport of products between the UK and EU; and Group purchasing arrangements both within and outside the EU. Other areas that are being considered include employee mobility, treasury management and indirect taxation.
• A specific team headed by the Group Finance Director with senior representatives from the business areas most likely to be affected by the UK exit, together with the Group Head of Risk, meet regularly to monitor the possible effects on, and mitigating actions open to, the Group.
2
Fail to respond to strategic market shifts e.g. changes in customer demands and / or competitor activityUnforeseen changes in customer and market assumptions that the Group performance plans are based upon.
No significant high-service level competitor changes anticipated
• Monitoring of market developments.
• Ongoing strategic and market reviews by the Board and the Senior Management Team.
• Annual strategic planning process including the assessment of external market changes.
• Ongoing review of the competitive environment.
3
The Group’s revenue and profit growth initiatives are not successfully implementedThis risk could lead to lower than forecast financial performance both in terms of revenue growth and cost savings with changes required to Group plans and any post-acquisition integration activities.
Second phase of the Performance Improvement Plan (PIP) will apply similar Group governance and internal control processes as used in the first phase
• Prioritised set of proposals and projects, including revenue growth initiatives and supporting activities across shared business services and supply chain infrastructure, focused on getting the basics right for our customers.
• Governance structure with accountabilities designed to support delivery on time and budget, within our resources and capabilities.
• Identification, assessment and management of the consequences of changes arising from plan initiatives with demonstrable and successful implementation of the first phase of the PIP.
• Specific and tailored post-acquisition integration plans.
Compliance risks
4
Failure to comply with international and local legal / regulatory requirementsFailure to manage these collective risks adequately could lead to:
• Death or serious injury of an employee or third party, and / or
• Penalties for non-compliance in health and safety or other compliance areas
No significant changes to new or existing legislation
• Employment of internal specialist expertise, supported, where needed, by suitably qualified / experienced external partners for example to provide relevant EU General Data Protection Regulation (GDPR) guidance.
• Ongoing reviews of relevant national and international compliance requirements.
• Training and awareness programmes in place focusing on anti-bribery, competition and data protection legislation.
• Global whistleblowing hotline managed by an independent third party providing employees with a process to raise non-compliance issues.
• Global Health and Safety policy, Target Zero accidents initiative.
• Local health and safety forums in place with the VP of Global Environment, Health and Safety.
• Real-time monitoring of customer orders to ensure compliance with international trade control regulations.
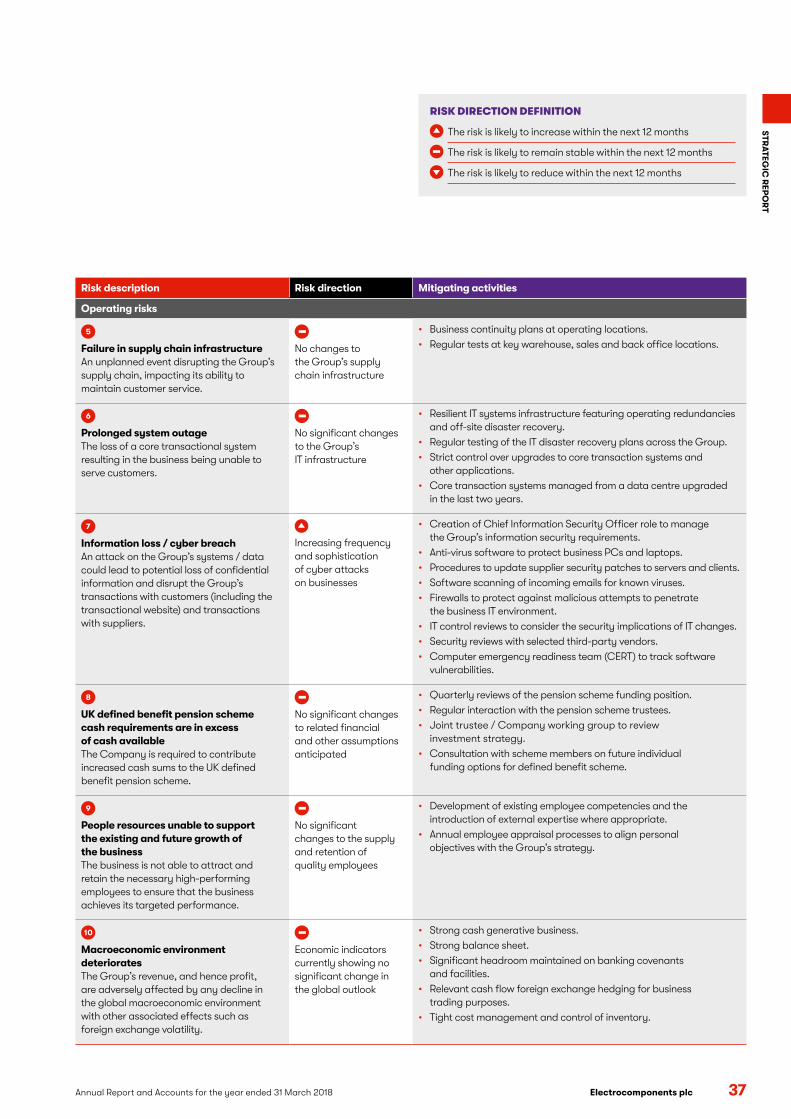
Electrocomponents plcAnnual Report and Accounts for the year ended 31 March 2018 37
STR
ATEG
IC R
EPO
RT
Risk description Risk direction Mitigating activities
Operating risks
5
Failure in supply chain infrastructureAn unplanned event disrupting the Group’s supply chain, impacting its ability to maintain customer service.
No changes to the Group’s supply chain infrastructure
• Business continuity plans at operating locations.
• Regular tests at key warehouse, sales and back office locations.
6
Prolonged system outageThe loss of a core transactional system resulting in the business being unable to serve customers.
No significant changes to the Group’s IT infrastructure
• Resilient IT systems infrastructure featuring operating redundancies and off-site disaster recovery.
• Regular testing of the IT disaster recovery plans across the Group.
• Strict control over upgrades to core transaction systems and other applications.
• Core transaction systems managed from a data centre upgraded in the last two years.
7
Information loss / cyber breachAn attack on the Group’s systems / data could lead to potential loss of confidential information and disrupt the Group’s transactions with customers (including the transactional website) and transactions with suppliers.
Increasing frequency and sophistication of cyber attacks on businesses
• Creation of Chief Information Security Officer role to manage the Group’s information security requirements.
• Anti-virus software to protect business PCs and laptops.
• Procedures to update supplier security patches to servers and clients.
• Software scanning of incoming emails for known viruses.
• Firewalls to protect against malicious attempts to penetrate the business IT environment.
• IT control reviews to consider the security implications of IT changes.
• Security reviews with selected third-party vendors.
• Computer emergency readiness team (CERT) to track software vulnerabilities.
8
UK defined benefit pension scheme cash requirements are in excess of cash availableThe Company is required to contribute increased cash sums to the UK defined benefit pension scheme.
No significant changes to related financial and other assumptions anticipated
• Quarterly reviews of the pension scheme funding position.
• Regular interaction with the pension scheme trustees.
• Joint trustee / Company working group to review investment strategy.
• Consultation with scheme members on future individual funding options for defined benefit scheme.
9
People resources unable to support the existing and future growth of the businessThe business is not able to attract and retain the necessary high-performing employees to ensure that the business achieves its targeted performance.
No significant changes to the supply and retention of quality employees
• Development of existing employee competencies and the introduction of external expertise where appropriate.
• Annual employee appraisal processes to align personal objectives with the Group’s strategy.
10
Macroeconomic environment deterioratesThe Group’s revenue, and hence profit, are adversely affected by any decline in the global macroeconomic environment with other associated effects such as foreign exchange volatility.
Economic indicators currently showing no significant change in the global outlook
• Strong cash generative business.
• Strong balance sheet.
• Significant headroom maintained on banking covenants and facilities.
• Relevant cash flow foreign exchange hedging for business trading purposes.
• Tight cost management and control of inventory.
RISK DIRECTION DEFINITION
The risk is likely to increase within the next 12 months
The risk is likely to remain stable within the next 12 months
The risk is likely to reduce within the next 12 months

Electrocomponents plc Annual Report and Accounts for the year ended 31 March 2018 38
COLLABORATIVE
BECOMING FIRST CHOICE
We partner with our broad range of suppliers to deliver what our customers need to do business. With over 500,000
items stocked and a much broader range of non-stocked products and a global distribution network we are the perfect
partner for customers wishing to consolidate spend.
FOR CUSTOMERS FOR SUPPLIERS FOR COMMUNITIES
Our internal and field sales teams help customers find the right component or solution for their needs. We have a broad range of products, including RS Pro, our highly competitive own-brand range, which means we are a perfect partner for customers wishing to consolidate spend. Meanwhile our high stock availability and our eProcurement and inventory management tools allow our customers to reduce inventories and improve productivity.
We are an extension of their salesforce and our broad global reach, technical expertise and strong customer relationships are key in driving demand creation for their products across the globe. Our significant digital reach means we can give them the insight and data they need to grow and develop their business.
We aim to inspire young people toward choosing science, technology, engineering and mathematics (STEM) subjects and support a variety of initiatives to encourage the next generation of engineers. Our aim is to influence the uptake of engineering as a career and help prevent a skills gap in the industry. We are also active in promoting innovation in local communities (see page 41).

Electrocomponents plcAnnual Report and Accounts for the year ended 31 March 2018
STR
ATEG
IC R
EPO
RT
Annual Report and Accounts for the year ended 31 March 2018 Electrocomponents plc 39
STR
ATEG
IC R
EPO
RT
ON SEMICONDUCTOR
ENABLING GROWTH IN APACON Semiconductor, a leading supplier of semiconductor products, offers a range of energy-efficient products that help engineers solve design challenges in many industries. Having been ON Semiconductor’s distributor in Europe for many years, RS has now helped the supplier to introduce new products across the Asia Pacific region, which would have been very difficult for it to do alone.
ON Semiconductor is a great supporter of DesignSpark, which increases the brand’s visibility online and helps the supplier reach potential customers. Through DesignSpark, ON Semiconductor can reach over 650,000 member engineers and help them develop innovative solutions quickly and efficiently using their tools and ideas. In the future ON Semiconductor has plans to work closely with RS to bring more innovative IoT solutions to the market.
“ RS is an ideal partner for us. The company’s solid experience and technical expertise along with its proactive attitude in providing suggestions for us are highly beneficial. RS has helped us introduce our new products to many customers in Asia Pacific that without RS we would find difficult to touch. DesignSpark is also a unique competitive advantage of RS.” EAMONN AHEARNE GLOBAL ACCOUNT MANAGER, ON SEMICONDUCTOR Through DesignSpark,
ON Semiconductor can reach over
650,000 member engineers
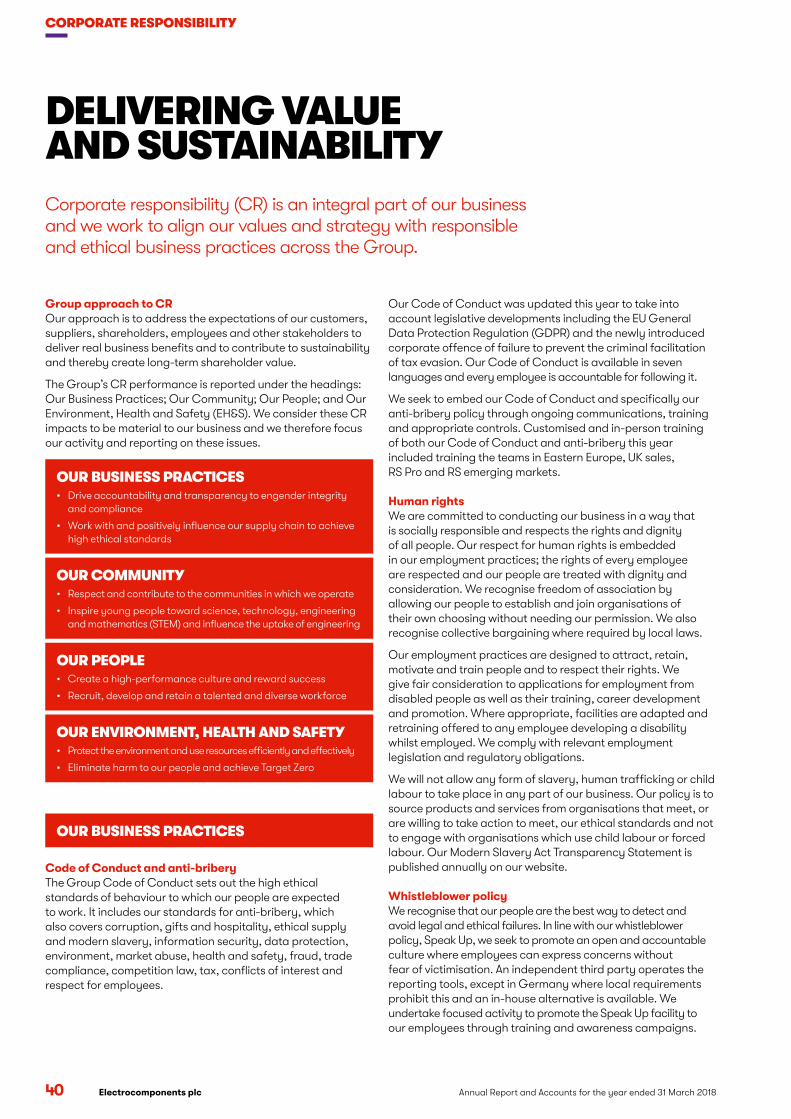
40 Annual Report and Accounts for the year ended 31 March 2018 Electrocomponents plc
DELIVERING VALUE AND SUSTAINABILITYCorporate responsibility (CR) is an integral part of our business and we work to align our values and strategy with responsible and ethical business practices across the Group.
Group approach to CR Our approach is to address the expectations of our customers, suppliers, shareholders, employees and other stakeholders to deliver real business benefits and to contribute to sustainability and thereby create long-term shareholder value.
The Group’s CR performance is reported under the headings: Our Business Practices; Our Community; Our People; and Our Environment, Health and Safety (EH&S). We consider these CR impacts to be material to our business and we therefore focus our activity and reporting on these issues.
OUR BUSINESS PRACTICES • Drive accountability and transparency to engender integrity
and compliance
• Work with and positively influence our supply chain to achieve high ethical standards
OUR COMMUNITY • Respect and contribute to the communities in which we operate
• Inspire young people toward science, technology, engineering and mathematics (STEM) and influence the uptake of engineering
OUR PEOPLE • Create a high-performance culture and reward success
• Recruit, develop and retain a talented and diverse workforce
OUR ENVIRONMENT, HEALTH AND SAFETY• Protect the environment and use resources efficiently and effectively
• Eliminate harm to our people and achieve Target Zero
OUR BUSINESS PRACTICES
Code of Conduct and anti-bribery The Group Code of Conduct sets out the high ethical standards of behaviour to which our people are expected to work. It includes our standards for anti-bribery, which also covers corruption, gifts and hospitality, ethical supply and modern slavery, information security, data protection, environment, market abuse, health and safety, fraud, trade compliance, competition law, tax, conflicts of interest and respect for employees.
Our Code of Conduct was updated this year to take into account legislative developments including the EU General Data Protection Regulation (GDPR) and the newly introduced corporate offence of failure to prevent the criminal facilitation of tax evasion. Our Code of Conduct is available in seven languages and every employee is accountable for following it.
We seek to embed our Code of Conduct and specifically our anti-bribery policy through ongoing communications, training and appropriate controls. Customised and in-person training of both our Code of Conduct and anti-bribery this year included training the teams in Eastern Europe, UK sales, RS Pro and RS emerging markets.
Human rightsWe are committed to conducting our business in a way that is socially responsible and respects the rights and dignity of all people. Our respect for human rights is embedded in our employment practices; the rights of every employee are respected and our people are treated with dignity and consideration. We recognise freedom of association by allowing our people to establish and join organisations of their own choosing without needing our permission. We also recognise collective bargaining where required by local laws.
Our employment practices are designed to attract, retain, motivate and train people and to respect their rights. We give fair consideration to applications for employment from disabled people as well as their training, career development and promotion. Where appropriate, facilities are adapted and retraining offered to any employee developing a disability whilst employed. We comply with relevant employment legislation and regulatory obligations.
We will not allow any form of slavery, human trafficking or child labour to take place in any part of our business. Our policy is to source products and services from organisations that meet, or are willing to take action to meet, our ethical standards and not to engage with organisations which use child labour or forced labour. Our Modern Slavery Act Transparency Statement is published annually on our website.
Whistleblower policyWe recognise that our people are the best way to detect and avoid legal and ethical failures. In line with our whistleblower policy, Speak Up, we seek to promote an open and accountable culture where employees can express concerns without fear of victimisation. An independent third party operates the reporting tools, except in Germany where local requirements prohibit this and an in-house alternative is available. We undertake focused activity to promote the Speak Up facility to our employees through training and awareness campaigns.
CORPORATE RESPONSIBILITY

Electrocomponents plcAnnual Report and Accounts for the year ended 31 March 2018 41
STR
ATEG
IC R
EPO
RT
OUR COMMUNITY
Our community activities this year have focused on STEM initiatives to promote engineering to the young and we are supporting government and industry programmes across the world, such as the UK government’s Year of Engineering 2018. This year-long campaign is aimed at raising the profile of engineering amongst schoolchildren, aged 7 to 16, and their parents and teachers, and widening the pool of young people that consider engineering as a career. Electrocomponents is on the stakeholder advisory board alongside government, engineering bodies and other stakeholders and partners from industry and education.
Our participation in a wide range of new activities now reaches students of university level down to primary school-aged children. These new programmes are in addition to our ongoing activities such as RS University, Landrover 4x4 in Schools Technology Challenge, Formula Student, women in engineering initiatives and our new Titan II innovation truck.
We partnered with Electronics Weekly (EW), a leading UK electronics publication, to introduce the EW BrightSparks programme to find the UK’s brightest young electronic design engineers. Aged 16 to 30, they could be in the early stages of their careers or still in education but already showing potential for future innovation in engineering. This inspiring and successful initiative has now been continued into its second year and the photo below shows this year’s 30 winners.
The Northern European team has partnered with STEM Learning, a UK organisation that has a network of over 30,000 STEM ambassadors. At an open day held in Corby, UK, more than 70 employees volunteered to become STEM Ambassadors. These volunteers will support a series of workshops for schoolchildren, aged 11 to 16, based on technologies such as Raspberry Pi, Arduino, 3D printing and robotics.
Our team in the Americas is supporting Colorado State University (CSU) to create a prototype for the 2018 NASA Robotic Mining Competition. They are helping students design and build an innovative excavation system to provide solutions to the lack of power supply and retrieval of another planet’s resources in major space travel. The CSU team is comprised of students currently enrolled in the Walter Scott, Jr. College of Engineering and will compete against more than 50 teams from across the US in this competition, which is now in its ninth year.
We have also supported the University of Edinburgh’s work to design and build a prototype pod for the revolutionary Hyperloop mass transportation system of the future. The university’s Hyperloop team, HYPED, which now totals more than 100 members, built a prototype pod for the 2017 Hyperloop Pod Competition, which was set up by technology entrepreneur and SpaceX CEO, Elon Musk. RS has renewed its sponsorship this year to support the next phase in the university’s prototype project by providing key components to build a low-weight, fully autonomous half-scale pod. The constructed pods will compete against other finalists from across the world at SpaceX’s mile-long test track in California in the summer.
We have established an apprenticeship programme for a group of Texas A&M University students. Two undergraduates began a project in September looking at the Internet of Things (IoT) in the food and beverage industry. They are investigating how IoT is having a disruptive impact on the industry through the use of single-board computing, such as Raspberry Pi. Six MBA students are also looking at how our innovation programme is driving performance in Central Europe and how our competition is using technology. These project-based studies are now in the students’ curriculum and are the start of a global apprenticeship programme for the students of Texas A&M.
Our internship programme is continuing to expand and during the year we ran 40 internships. The interns have come from universities in Singapore, Shanghai, Hong Kong, Tokyo and Yokohomo. The students joined us for different periods of time: project-based activity for one to three months; short-term holiday periods; and full-year internships where they worked in different departments across the business. The programmes have included DesignSpark community support, technical content creation and student competitions. The students have been particularly interested in learning about DesignSpark tools and software as well as getting involved in IoT.

42 Annual Report and Accounts for the year ended 31 March 2018 Electrocomponents plc
CORPORATE RESPONSIBILITY CONTINUED
OUR PEOPLE
We believe that to achieve our ambition of becoming first choice for our customers and suppliers we also need to become first choice for all our people, both those in the business today and any future employees.
Our changing cultureIn setting our ambition, we recognised the need to evolve the culture in the business too. The culture we aspire to is expressed in our ways of working: passion; integrity; innovation; collaboration; accountability; and aspiration.
Early in the year, we started to bring our ways of working to life and help employees understand why they are fundamental to the Group’s future success. Every employee was sent a booklet ‘Becoming first choice’ and all line managers were given materials and support to help them engage their teams.
We are committed to embedding our ways of working into the business and shaping our culture through them. Our employee recognition programme has been reviewed and we intend to launch a new platform in mid 2019 where, through this, employees can recognise others for demonstrating one or more of the ways of working.
Listening to our peopleIn March 2018, we launched a new quarterly employee engagement pulse survey, My Voice, generating a positive loop of listening to employees, responding to their feedback and building a rich picture of their experience and what we can do to improve it. We were very pleased with the results of this first survey with 79% of our employees having completed it. The survey shows that 71% of our employees are considered ‘engaged’.
Overall Group results for My Voice pulse survey
79%of colleagues completed the survey
71%of our people are ‘engaged’
A diverse and inclusive environmentAs a truly global business, we already have diverse nationalities represented by people across all locations.
Our focus is to embed a more diverse and inclusive culture. By embracing difference, our unique combination of views and experience will mean we can better understand and serve the diverse range of needs of our customers and suppliers.
Managing diversityAs part of our cultural evolution we have a new diversity and inclusion policy and the Senior Management Team are accountable for creating:
• An organisation which attracts, develops, motivates and retains a diverse workforce
• A culture where people everywhere feel able to give their best, where their views, opinions and talents are respected
We have also created a global Diversity and Inclusion Steering Committee, composed of senior representatives of different countries, languages, roles and functions to provide direction on the most effective ways of making real progress. As a priority the Committee is particularly focused on increasing the number of women in senior and critical roles throughout the business. Working with an external partner that specialises in building diverse and high-performing businesses, we will be using this insight to help us make appropriately targeted improvements.
We have launched employee communities to help us drive change, beginning with ‘Working for Women’ communities, sponsored by our President of Global Supply Chain. Groups are also being set up to drive change at a local level and provide a network for training and development opportunities. These internal networks are open to everyone across all locations. We are looking to launch further communities during the year to support other employee groups that are under-represented at a senior level. The key objectives will be career development and progression, providing a greater voice and driving action at all levels of the business.
While working on longer-term plans and actions to drive change, we are also communicating widely around our commitment to diversity and inclusion, ensuring that our people are informed at this time of cultural shift. For example, we took the opportunity to play an active part in wider global initiatives such as International Women’s Day.
Gender pay gapIn March 2018, we published our first gender pay gap report under The Equality Act 2010 (Gender Pay Gap Information) Regulations 2017. Although this is a report on the UK, our actions will go beyond the UK. We have a good balance of men and women but we do have a pay gap. During 2019, we will introduce initiatives to break down any perceived barriers to the advancement of women. We will also continue our strong focus on recruiting and retaining women in senior and critical roles. More information on our gender pay gap report can be found on our website.

Electrocomponents plcAnnual Report and Accounts for the year ended 31 March 2018 43
STR
ATEG
IC R
EPO
RT
Overall headcount
• We define diversity as the way an individual can differ from other individuals. These can include: age; disability; marriage and civil partnership status; race; ethnicity; nationality; colour; religion or belief; gender or gender reassignment; sexual orientation; and educational background. We believe these differences provide us with the diversity of thought, perspective and experience imperative to our success.
• Inclusion is about people within our organisation feeling trusted, respected, listened to and fully part of the team, whoever and wherever they are.
• A diverse and inclusive organisation is one that actively strives for diversity, and treats everyone fairly regardless of difference, to gain the best from its people and to provide the best experience for its customers and suppliers. This aim sits firmly within our first choice vision and our ways of working.
Acquiring and developing our talent A focus on our management and leadership talent is key to the delivery of our ambition.
People Manager AcademyThe People Manager Academy was launched to further build our management capability. The programme is built around the ‘7 essential talents’ that distinguish exceptional managers and aligns with our ambition. The programme uses both face-to-face and virtual learning techniques and has consistently positive feedback from its alumni and their managers. We aim to roll this out globally.
Competencies development moduleAn earlier engagement survey told us that our employees were not always clear how they could progress in our business. We designed a behavioural Global Competencies framework that defines which universal skills are important and what ‘good’ looks like across the organisation. A new online module has enabled all employees to assess themselves against the competencies, build targeted development plans and identify relevant learning solutions through a linked learning management system. The process is streamlined and dynamic, supporting quality manager-employee conversations and allowing everyone to keep track of their development in real-time and on an ongoing basis.
Talent acquisitionWe have completed a talent acquisition review, which is aligned to our business strategy to retain and attract top talent. From this, our focus is now on: the development of our senior hiring process; the development and launch of our Employee Value Proposition; the design and implementation of an enhanced talent acquisition model for the future; and a review of our associated processes and governance frameworks.
Learning and developmentTo meet our strategic aspirations and support the development of our people, we need to invest more broadly in upgrading skills and capabilities across the organisation. To that end, we have created a learning and development centre of expertise, which will develop a Group-wide learning academy and partner with local companies to evolve existing initiatives and best practices for the benefit of the entire business.
The new centre of expertise will specifically focus on creating tools, resources and programmes across several core areas including: business and product knowledge; professional skills; management skills; and the support of compliance, information security and health and safety initiatives. We will also improve the onboarding experience for all new joiners, from acceptance of offer through to the first months in the new role. We want to deepen our pool of early career talent and so will be investing in the development of intern, graduate and apprenticeship programmes.
“ We’re committed to creating a diverse and inclusive place to work where everyone can deliver their best. This is key to innovation, growth and profitability and will help us to deliver the best customer and supplier experience. Our efforts to improve diversity and inclusion are global.”
LINDSLEY RUTH CHIEF EXECUTIVE OFFICER
Female 3,151*
Male 2,792*
Management Team
Female 67
Male 167
Board composition
Female 2 Male 6
* Permanent employees as at 31 March 2018
Diversity and inclusion

44 Annual Report and Accounts for the year ended 31 March 2018 Electrocomponents plc
CORPORATE RESPONSIBILITY CONTINUED
OFFSETTING CO2 EMISSIONS
TREE PLANTING IN THE UKIn the UK, RS is partnering with Carbon Footprint Ltd to plant around 500 trees in the grounds of two primary schools local to our warehouses in Corby and Nuneaton and in the newly created RS woodland, which is located in the same area. This will help offset the CO2 emissions due to employees’ business air travel. The tree planting also engages the schoolchildren in digging, planting and backfilling the year-old saplings, helping to develop their school grounds and enhance wildlife habitats as well as improving the air quality in the school grounds. The trees that are planted are native broad leaf species to help enhance biodiversity.
OUR ENVIRONMENT, HEALTH AND SAFETY
EnvironmentThe Group’s key environmental impacts include energy use and the related CO2 emissions, waste and recycling, packaging use and water consumption. Electrocomponents’ Environmental Policy articulates our commitment to protect the environment and to use energy and other resources efficiently to provide our products and services.
The Group’s target is to continuously improve environmental performance in all key areas.
The Group complies with the CRC (Energy Efficiency) scheme applying to all our facilities in the UK and complies as well with Article 8 of the EU Energy Efficiency Directive applying to our facilities in France, Germany, Italy and the UK.
Environmental performance1,2
In 2018 the Group achieved its targets to improve performance indexed to revenue in all key areas. Revenue growth at constant exchange rates has benefited indexed performance as efficiencies have been improved. Performance over the past five years is shown in the charts on the following page, and is summarised below.
• CO2 emissions intensity was down 10.5% to 7.7 tonnes per £ million revenue. This is 20.6% lower than in 2016.
• Absolute CO2 emissions due to energy use in our premises were down by 100 tonnes or 0.8% to 13,100 tonnes as a result of energy efficiency measures and despite capacity expansions. Emissions were 7.1% lower than in 2016.
• Waste intensity was down 7.2% to 2.31 tonnes per £ million revenue and was 5.7% lower than in 2016.
• In absolute terms, total waste was up by 3.4% to 3,940 tonnes. The increase was mainly due to ongoing office refurbishment activities and the disposal and recycling of old furniture and other material.
• The proportion of total waste recycled was flat in the year as the tonnage of waste recycled rose in line with the increase in total waste.
• Packaging intensity was down by 17.5% to 2.45 tonnes per £ million revenue. This was a result of packaging rationalisation initiatives, which also allowed for lower inventories.
• Water use performance is reported indexed to headcount and this was down 1.8% to 7.21m3 per head per annum.
• Further progress was made to quantify the CO2 emissions due to the Group’s use of third-party logistics.
Environmental initiativesThroughout 2018, the Group undertook a series of projects and environmental programmes to help improve performance. These are focused on those locations with the largest impact supported by employee awareness initiatives covering all sites worldwide.
Awards and recognition
Electrocomponents has participated in the annual Carbon Disclosure Project (CDP) for 10 years and in 2017 was the top company out of 44 in the FTSE 350 ‘Information Technology’ sector with a score of ‘A-’, placing the Group in the CDP ‘Leadership’ category.
During the year, RS UK received the Carbon & Energy Management and Reduction Scheme (CEMARS) Gold Certification Award for the eighth year in a row, having reduced carbon emissions each year. Over the past five years, emissions are down by 27%.
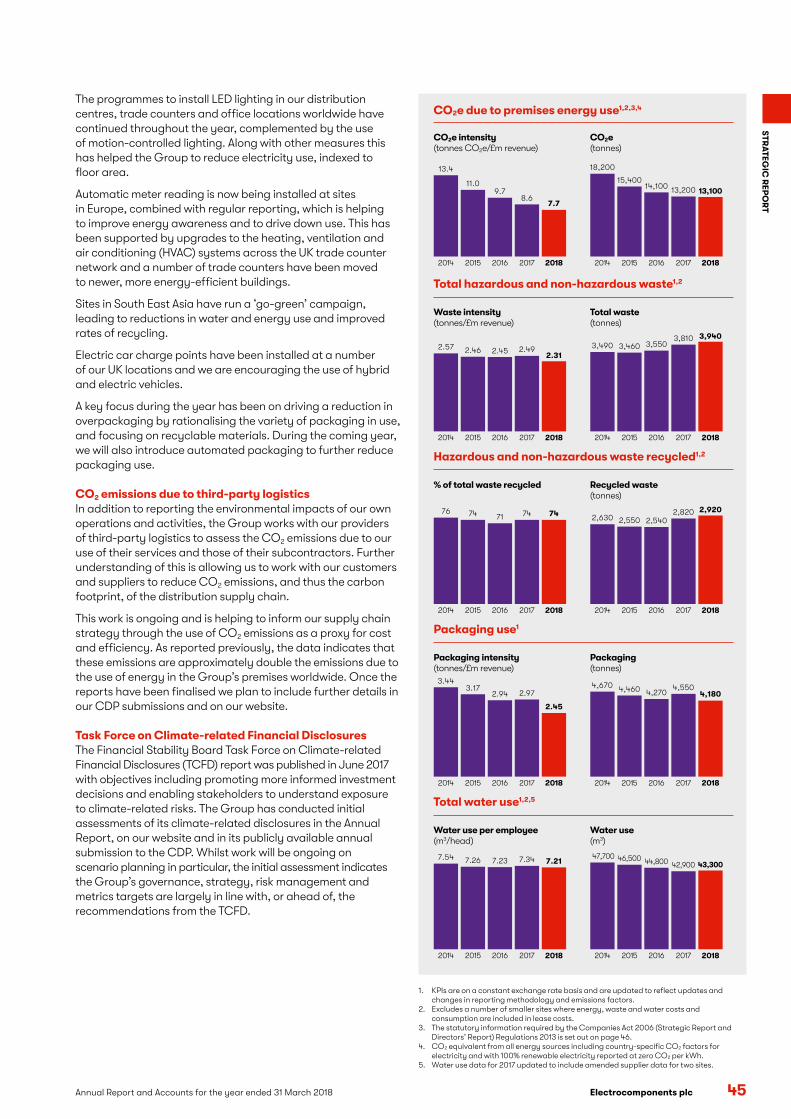
Electrocomponents plcAnnual Report and Accounts for the year ended 31 March 2018 45
STR
ATEG
IC R
EPO
RT
The programmes to install LED lighting in our distribution centres, trade counters and office locations worldwide have continued throughout the year, complemented by the use of motion-controlled lighting. Along with other measures this has helped the Group to reduce electricity use, indexed to floor area.
Automatic meter reading is now being installed at sites in Europe, combined with regular reporting, which is helping to improve energy awareness and to drive down use. This has been supported by upgrades to the heating, ventilation and air conditioning (HVAC) systems across the UK trade counter network and a number of trade counters have been moved to newer, more energy-efficient buildings.
Sites in South East Asia have run a ‘go-green’ campaign, leading to reductions in water and energy use and improved rates of recycling.
Electric car charge points have been installed at a number of our UK locations and we are encouraging the use of hybrid and electric vehicles.
A key focus during the year has been on driving a reduction in overpackaging by rationalising the variety of packaging in use, and focusing on recyclable materials. During the coming year, we will also introduce automated packaging to further reduce packaging use.
CO2 emissions due to third-party logisticsIn addition to reporting the environmental impacts of our own operations and activities, the Group works with our providers of third-party logistics to assess the CO2 emissions due to our use of their services and those of their subcontractors. Further understanding of this is allowing us to work with our customers and suppliers to reduce CO2 emissions, and thus the carbon footprint, of the distribution supply chain.
This work is ongoing and is helping to inform our supply chain strategy through the use of CO2 emissions as a proxy for cost and efficiency. As reported previously, the data indicates that these emissions are approximately double the emissions due to the use of energy in the Group’s premises worldwide. Once the reports have been finalised we plan to include further details in our CDP submissions and on our website.
Task Force on Climate-related Financial DisclosuresThe Financial Stability Board Task Force on Climate-related Financial Disclosures (TCFD) report was published in June 2017 with objectives including promoting more informed investment decisions and enabling stakeholders to understand exposure to climate-related risks. The Group has conducted initial assessments of its climate-related disclosures in the Annual Report, on our website and in its publicly available annual submission to the CDP. Whilst work will be ongoing on scenario planning in particular, the initial assessment indicates the Group’s governance, strategy, risk management and metrics targets are largely in line with, or ahead of, the recommendations from the TCFD.
CO2e intensity (tonnes CO2e/£m revenue)
CO2e (tonnes)
CO2e due to premises energy use1,2,3,4
7.7
9.7
2016
11.0
2015
13.4
2014
8.6
2017 2018
13,10014,100
2016
15,400
2015
18,200
2014
13,200
2017 2018
Waste intensity (tonnes/£m revenue)
Total waste (tonnes)
Total hazardous and non-hazardous waste1,2
2.312.45
2016
2.46
2015
2.57
2014
2.49
2017 2018
3,9403,550
2016
3,460
2015
3,490
2014
3,810
2017 2018
% of total waste recycled Recycled waste (tonnes)
Hazardous and non-hazardous waste recycled1,2
7471
2016
74
2015
76
2014
74
2017 2018
2,9202,540
2016
2,550
2015
2,630
2014
2,820
2017 2018
Packaging intensity (tonnes/£m revenue)
Packaging (tonnes)
Packaging use1
2.45
2.94
2016
3.17
2015
3.44
2014
2.97
2017 2018
4,1804,270
2016
4,460
2015
4,670
2014
4,550
2017 2018
1. KPIs are on a constant exchange rate basis and are updated to reflect updates and changes in reporting methodology and emissions factors.
2. Excludes a number of smaller sites where energy, waste and water costs and consumption are included in lease costs.
3. The statutory information required by the Companies Act 2006 (Strategic Report and Directors’ Report) Regulations 2013 is set out on page 46.
4. CO2 equivalent from all energy sources including country-specific CO2 factors for electricity and with 100% renewable electricity reported at zero CO2 per kWh.
5. Water use data for 2017 updated to include amended supplier data for two sites.
Water use per employee (m3/head)
Water use (m3)
Total water use1,2,5
7.217.23
2016
7.26
2015
7.54
2014
7.34
2017 2018
43,30044,800
2016
46,500
2015
47,700
2014
42,900
2017 2018

46 Annual Report and Accounts for the year ended 31 March 2018 Electrocomponents plc
CORPORATE RESPONSIBILITY CONTINUED
Health and safetyTo further the goal of respecting and safeguarding our people and others affected by our operations, we continue to work towards Target Zero on the basis that all incidents are preventable.
In 2018 the Group included All Accidents alongside Lost Time Accidents (LTAs) as our primary safety metrics. This has led to increased focus on every accident that occurs, not just the relative few that result in lost time. This has helped the Group to achieve a 50% overall decrease in reported accidents in the year.
Health and safety performanceThe Group succeeded in reducing the frequency of All Accidents by over 50% in the year. The Group’s safety reports include accidents which occur whilst employees are travelling on business. During 2018, an employee driving on business suffered a non-fault road traffic accident. This resulted in 98 lost working days and this one-off case adversely affected the overall lost time performance as noted below:
• The number of All Accidents, including first aid cases, reported in 2018 was 59 (2017: 118).
• The All Accidents frequency rate was reduced by over 50% to 1.02 per 200,000 hours worked (2017: 2.10).
• The number of LTAs reported in 2018 was 12 (2017: 12).
• The LTA frequency rate per 200,000 hours worked was 0.21 (2017: 0.21).
• Excluding the road traffic accident (RTA) mentioned above, a total of 59 working days were lost in 2018 (2017: 119 days), (2018: 157 days including the RTA).
• Excluding the RTA, the average number of lost working days per LTA was down to 5.4 compared with 9.9 in 2017 (13.1 including the RTA).
• A new programme of quarterly safety campaigns was launched. In 2018 these covered motor vehicle safety, ergonomics and health and wellbeing.
• The reporting of near misses gained momentum with a record number of reports in the year, demonstrating that safety awareness is increasingly embedded in the culture of the Group.
Health and safety initiativesThe significant reduction in All Accidents in 2018 has been led by a new process for accident reporting where every incident is reported, regardless of severity. Each case is reviewed and analysed prior to classification. This helps ensure consistency and ensures that only real accidents are included in the reported numbers.
2019 priorities for environmental performance• Environmental campaigns to engage employees in
environmental improvements across the Group. The first will be linked to Earth Week with a focus on plastics awareness and reductions at sites in the UK and China.
• Roll out the ‘RS treasure hunt’ energy audit programme designed to encourage people to think about energy-saving opportunities.
• Leverage our health and safety and environmental programmes, for example by linking Target Zero to our global target of zero waste to landfill.
• Focus on the robust ownership and delivery of environmental targets at site and regional levels.
Greenhouse gas (GHG) emissions disclosures In addition to the CO2e emissions due to premises energy use on page 45, the Companies Act 2006 (Strategic Report and Directors’ Report) Regulations 2013 requires the Group to also report emissions due to the fuel used in company vehicles, fugitive emissions and other sources. The table below includes the material emission sources from the operations and activities covered by the Group’s accounts.
2018tonnes CO2e
2017tonnes CO2e
Emissions from combustion of fuels and operation of facilities:
Combustion of fossil fuels1 4,837 5,014
Operation of facilities, including fugitive emissions2 137 46
Electricity purchased for own consumption:
Purchased electricity3 10,061 10,148
Intensity measurement
CO2e due to premises energy use per £m revenue 7.7 8.6
Total GHGs per £m revenue 8.8 9.9
Data is for the financial year as updated to reflect changes in reporting methodology and to use current emissions factors.1. Includes emissions of 1,795 tonnes relating to fuel use in company vehicles
(2017: 1,950 tonnes).2. 137 tonnes of CO2e due to fugitive emissions from air-conditioning systems
(2017: 46 tonnes).3. Electricity from renewable sources at zero CO2e per kWh. Emissions increased
by 1,244 tonnes at grid-average rates (2017: 1,258 tonnes).
The Group uses the GHG Protocol with emission factors for standard grid electricity by country from the International Energy Agency and other factors as published by the UK Department for Environment, Food & Rural Affairs in order to calculate the CO2e emissions included in this report.
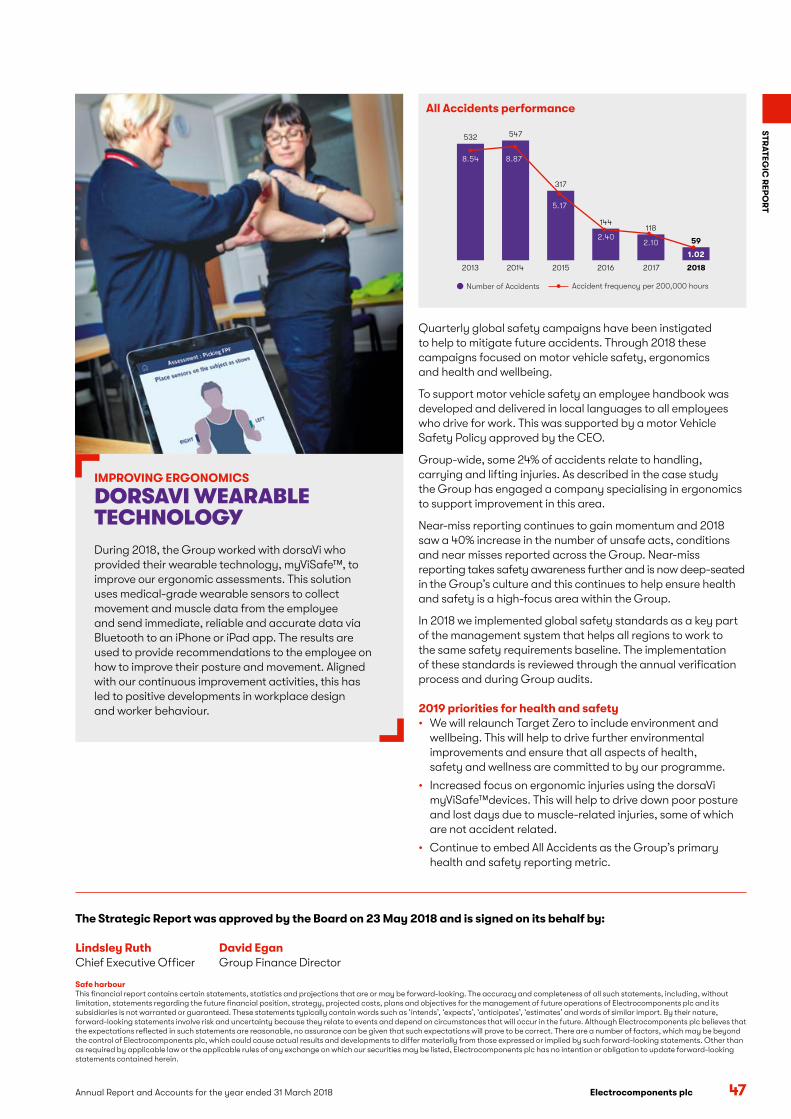
Electrocomponents plcAnnual Report and Accounts for the year ended 31 March 2018 47
STR
ATEG
IC R
EPO
RT
All Accidents performance
532
8.54
5.17
2.402.10
1.02
8.87
547
317
144118
59
2013 2014
Number of Accidents Accident frequency per 200,000 hours
2015 2016 2017 2018
Quarterly global safety campaigns have been instigated to help to mitigate future accidents. Through 2018 these campaigns focused on motor vehicle safety, ergonomics and health and wellbeing.
To support motor vehicle safety an employee handbook was developed and delivered in local languages to all employees who drive for work. This was supported by a motor Vehicle Safety Policy approved by the CEO.
Group-wide, some 24% of accidents relate to handling, carrying and lifting injuries. As described in the case study the Group has engaged a company specialising in ergonomics to support improvement in this area.
Near-miss reporting continues to gain momentum and 2018 saw a 40% increase in the number of unsafe acts, conditions and near misses reported across the Group. Near-miss reporting takes safety awareness further and is now deep-seated in the Group’s culture and this continues to help ensure health and safety is a high-focus area within the Group.
In 2018 we implemented global safety standards as a key part of the management system that helps all regions to work to the same safety requirements baseline. The implementation of these standards is reviewed through the annual verification process and during Group audits.
2019 priorities for health and safety• We will relaunch Target Zero to include environment and
wellbeing. This will help to drive further environmental improvements and ensure that all aspects of health, safety and wellness are committed to by our programme.
• Increased focus on ergonomic injuries using the dorsaVi myViSafe™devices. This will help to drive down poor posture and lost days due to muscle-related injuries, some of which are not accident related.
• Continue to embed All Accidents as the Group’s primary health and safety reporting metric.
IMPROVING ERGONOMICS
DORSAVI WEARABLE TECHNOLOGYDuring 2018, the Group worked with dorsaVi who provided their wearable technology, myViSafe™, to improve our ergonomic assessments. This solution uses medical-grade wearable sensors to collect movement and muscle data from the employee and send immediate, reliable and accurate data via Bluetooth to an iPhone or iPad app. The results are used to provide recommendations to the employee on how to improve their posture and movement. Aligned with our continuous improvement activities, this has led to positive developments in workplace design and worker behaviour.
The Strategic Report was approved by the Board on 23 May 2018 and is signed on its behalf by: Lindsley Ruth David EganChief Executive Officer Group Finance Director
Safe harbourThis financial report contains certain statements, statistics and projections that are or may be forward-looking. The accuracy and completeness of all such statements, including, without limitation, statements regarding the future financial position, strategy, projected costs, plans and objectives for the management of future operations of Electrocomponents plc and its subsidiaries is not warranted or guaranteed. These statements typically contain words such as ‘intends’, ‘expects’, ‘anticipates’, ‘estimates’ and words of similar import. By their nature, forward-looking statements involve risk and uncertainty because they relate to events and depend on circumstances that will occur in the future. Although Electrocomponents plc believes that the expectations reflected in such statements are reasonable, no assurance can be given that such expectations will prove to be correct. There are a number of factors, which may be beyond the control of Electrocomponents plc, which could cause actual results and developments to differ materially from those expressed or implied by such forward-looking statements. Other than as required by applicable law or the applicable rules of any exchange on which our securities may be listed, Electrocomponents plc has no intention or obligation to update forward-looking statements contained herein.

48 Annual Report and Accounts for the year ended 31 March 2018 Electrocomponents plc
BOARD OF DIRECTORS
OUR BOARD
We have strong international diversity at Board level, reflecting the global nature of our business, and we have a wealth of experience and knowledge, and the appropriate balance of skills.
Joined in October 2010
External rolesPeter is Vice Chairman of the Supervisory Board of Wienerberger AG.
Past rolesPeter was Chairman of DS Smith plc, a Non-Executive Director of SSL International plc, Chief Executive of George Wimpey plc and Chief Executive of The Rugby Group plc.
Skills and experience• International operations• Emerging markets• Mergers and acquisitions• Distribution• Sales and marketing• Manufacturing• Service industry• Chairman• Chief Executive Officer
Committee membershipChairman of the Nomination Committee.
Joined in March 2016
External rolesNone.
Past rolesDavid was Group Finance Director at Alent plc and he also held a variety of senior finance positions at ESAB Holdings and Hanson plc. David was also a Non-Executive Director of Tribal Group plc, and Chairman of its Audit Committee.
Skills and experience• Leadership• International operations• Emerging markets• Current financial
experience• Distribution• Manufacturing• Mergers and acquisitions• Service industry
Committee membershipChairman of the Treasury Committee.
Joined in April 2015
External rolesNone.
Past rolesLindsley was Executive Vice President of the Future Electronics Group of companies, the fourth largest electronics distributor in the world. He was a key member of its core leadership team. Lindsley has also held senior positions with TTI Inc and Solectron Corporation.
Skills and experience• Management• Leadership• Mergers and acquisitions• International operations• Emerging markets• Distribution• Sales and marketing• Manufacturing• Supply chain and
procurement
Committee membershipMember of the Treasury Committee.
Joined in January 2013
External rolesJohn is Chairman of V Group.
Past rolesJohn has been Chairman of NHS Blood and Transplant, Chair of In Kind Direct, Non-Executive Chairman of Marken Group and on the Boards of both GWI UK Acquisition Company Limited and CEVA Group plc. As a full-time executive, he served as Chief Executive Officer of CEVA Logistics and Chief Executive Officer of the EMEA division of Exel. He also ran the EMEA contract logistics business at DHL. He spent most of his early career working in supply chain management roles with Procter & Gamble.
Skills and experience• International operations• Emerging markets• Supply chain and logistics• Manufacturing• Service industry• Chief Executive Officer
Committee membershipChairman of the Remuneration Committee.* Member of the Audit and Nomination Committees.
Joined in June 2015
External rolesBertrand is Chief Digital Officer at Novartis International AG.
Past rolesBertrand has held a number of senior executive positions, including Chief Digital and Marketing Officer at Sainsbury’s Argos. Prior to that he had leading global responsibilities at Amazon and EMI Music and was co-founder / CEO at Bragster, which is now part of Guinness World Records.
Skills and experience• Digital• eCommerce• International operations• Product development• Sales and marketing• Supply chain and logistics
Committee membershipMember of the Audit, Nomination and Remuneration Committees.
Peter Johnson Chairman
Lindsley RuthChief Executive Officer
John Pattullo Senior Independent Director
David EganGroup Finance Director
Bertrand Bodson Independent Non-Executive Director
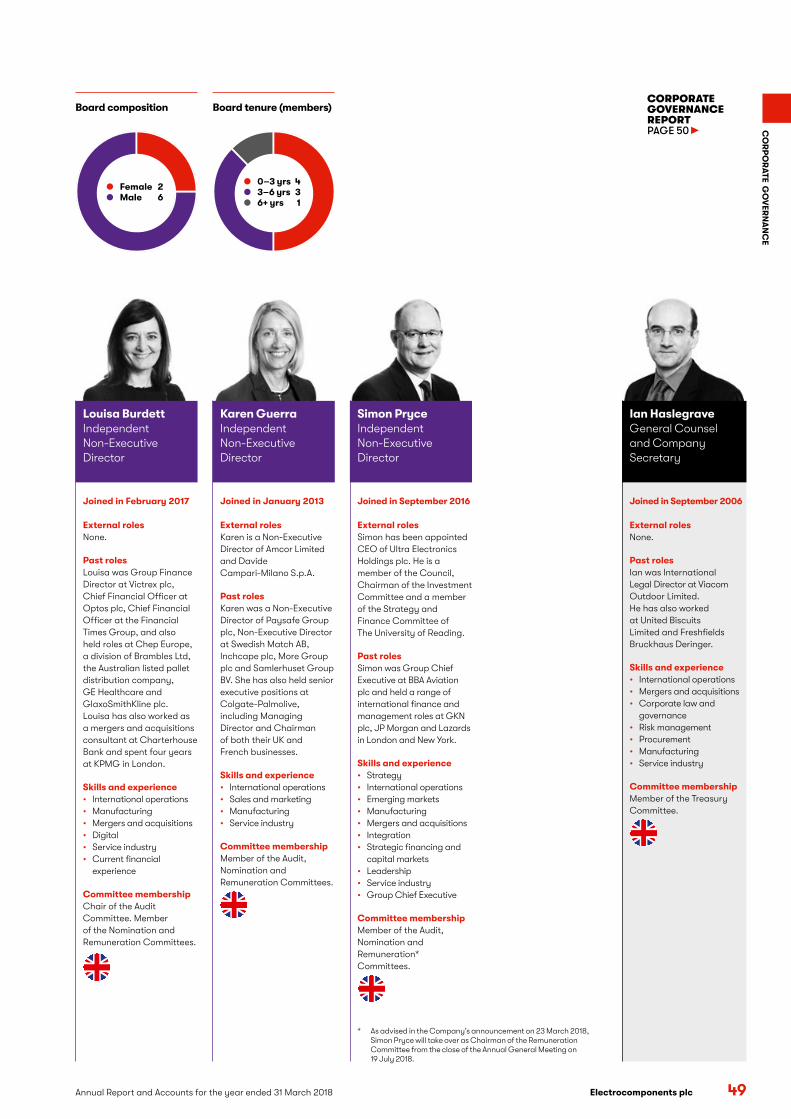
CO
RP
OR
ATE G
OV
ERN
AN
CE
Electrocomponents plcAnnual Report and Accounts for the year ended 31 March 2018 49
Joined in February 2017
External rolesNone.
Past rolesLouisa was Group Finance Director at Victrex plc, Chief Financial Officer at Optos plc, Chief Financial Officer at the Financial Times Group, and also held roles at Chep Europe, a division of Brambles Ltd, the Australian listed pallet distribution company, GE Healthcare and GlaxoSmithKline plc. Louisa has also worked as a mergers and acquisitions consultant at Charterhouse Bank and spent four years at KPMG in London.
Skills and experience• International operations• Manufacturing• Mergers and acquisitions• Digital• Service industry• Current financial
experience
Committee membershipChair of the Audit Committee. Member of the Nomination and Remuneration Committees.
Joined in September 2016
External rolesSimon has been appointed CEO of Ultra Electronics Holdings plc. He is a member of the Council, Chairman of the Investment Committee and a member of the Strategy and Finance Committee of The University of Reading.
Past rolesSimon was Group Chief Executive at BBA Aviation plc and held a range of international finance and management roles at GKN plc, JP Morgan and Lazards in London and New York.
Skills and experience• Strategy• International operations• Emerging markets• Manufacturing• Mergers and acquisitions• Integration• Strategic financing and
capital markets• Leadership• Service industry• Group Chief Executive
Committee membershipMember of the Audit, Nomination and Remuneration* Committees.
* As advised in the Company’s announcement on 23 March 2018, Simon Pryce will take over as Chairman of the Remuneration Committee from the close of the Annual General Meeting on 19 July 2018.
Joined in January 2013
External rolesKaren is a Non-Executive Director of Amcor Limited and Davide Campari-Milano S.p.A.
Past rolesKaren was a Non-Executive Director of Paysafe Group plc, Non-Executive Director at Swedish Match AB, Inchcape plc, More Group plc and Samlerhuset Group BV. She has also held senior executive positions at Colgate-Palmolive, including Managing Director and Chairman of both their UK and French businesses.
Skills and experience• International operations• Sales and marketing• Manufacturing• Service industry
Committee membershipMember of the Audit, Nomination and Remuneration Committees.
Joined in September 2006
External rolesNone.
Past rolesIan was International Legal Director at Viacom Outdoor Limited. He has also worked at United Biscuits Limited and Freshfields Bruckhaus Deringer.
Skills and experience• International operations• Mergers and acquisitions• Corporate law and
governance• Risk management• Procurement• Manufacturing• Service industry
Committee membershipMember of the Treasury Committee.
Louisa BurdettIndependent Non-Executive Director
Simon Pryce Independent Non-Executive Director
Karen GuerraIndependent Non-Executive Director
Ian Haslegrave General Counsel and Company Secretary
Board composition
Female 2 Male 6
Board tenure (members)
0–3 yrs 4 3–6 yrs 3 6+ yrs 1
CORPORATE GOVERNANCE REPORTPAGE 50

50 Annual Report and Accounts for the year ended 31 March 2018 Electrocomponents plc
CORPORATE GOVERNANCE REPORT
Dear fellow shareholderOn behalf of the Board, I am pleased to present our corporate governance reports for 2018.
The Company is committed to high standards of corporate governance to underpin the business through a period of high growth and change. The Board is accountable to the Company’s shareholders and actively engages in two-way communication with them. During the year management held numerous face-to-face meetings and invited shareholders to presentations on both the Group’s financial results and elements of its strategy, including meeting with analysts and investors during a visit to our US business. I also had a number of meetings with shareholders, whilst John Pattullo, our Senior Independent Director (SID), had introductory meetings with our larger shareholders.
As a UK-listed company, we are required to explain how we have applied the main principles set out in the UK Corporate Governance Code (Code) and whether the Company has complied with the relevant provisions throughout the financial year. This report explains how we have applied the Code during the year and confirms our compliance.
Looking aheadThis year has been a period of further development of the business with strong growth and changes continuing to be made throughout the organisation. The markets in which we operate continue to evolve rapidly and we must continue to adapt to these changes if our aspirations for the Group are to be met. Our ability to do so securely is supported by our commitment to strengthen continuously our robust corporate governance framework.
Further details of the Company’s strategy can be found in the Strategic Report on pages 1 to 47.
COMMITTED TO THE HIGHEST STANDARDS
Board developmentDuring the year, we said farewell to Paul Hollingworth and I would like to thank him for his outstanding performance as Audit Committee Chairman over the last nine years.
Our two most recent Non-Executive Director appointments, Simon Pryce (appointed in September 2016) and Louisa Burdett (appointed in February 2017), are settling in well and greatly adding to the breadth of skills on the Board with their combined experience in mergers and acquisitions, listed companies and financial management.
EvaluationWe continuously evaluate the balance of skills, experience, knowledge and independence of the Directors. In line with Code requirements, we carried out an externally facilitated Board evaluation last year, and this year the Company Secretary carried out an internal evaluation. The results and recommendations of the internal review are discussed in detail later in this report, together with progress made on last year’s external evaluation.
Peter JohnsonChairman 23 May 2018
“ The Company and the Group are committed to high standards of corporate governance to underpin the business through a period of high growth.”PETER JOHNSON CHAIRMAN

CO
RP
OR
ATE G
OV
ERN
AN
CE
Electrocomponents plcAnnual Report and Accounts for the year ended 31 March 2018 51
The BoardRole, effectiveness and compositionThe Board is collectively responsible for promoting the long-term success of the Company. The Board has carefully considered the guidance criteria regarding the composition of the Board under the Code. In the opinion of the Board, the Chairman and all the Non-Executive Directors bring independence of judgement and character, a wealth of experience and knowledge, the appropriate balance of skills, and assign sufficient time to enable them to effectively carry out their responsibilities and duties to the Board and to the Committees on which they sit. They are sufficiently independent of management and are free from any other circumstances or relationships that could interfere with the exercise of their judgement.
Biographical details of the Directors standing for re-election at the forthcoming Annual General Meeting (AGM) are set out on pages 48 and 49 and in the Notice of Meeting. These set out their skills and experience, details of roles and tenure, together with details of their membership of Board Committees.
The Board has a formal schedule of matters reserved for its approval which includes responsibility for:
• The review and approval of the Group’s long-term strategy and its budgetary and business plans
• The review and approval of major investment proposals and capital expenditure
• Major changes to the Group’s corporate structure (including acquisitions or disposals)
• The approval of full-year and half-year results and trading updates, including the review and approval of the going concern basis of accounting and the viability assessment
• The approval of the Group’s dividend policy and the payment and recommendation of interim and final dividends
• The review and approval of the Group’s tax strategy
• Ensuring the operation and maintenance of the Group’s systems of risk management, internal control and corporate governance
• Reviewing health and safety performance across the Group
• Setting the Group’s values and standards
• On the advice of the Nomination Committee, reviewing succession plans for the Board and Senior Management Team
• Evaluating Group and subsidiary performance and reviewing forecasts
Further details of the outcome of Board discussions regarding the above can be found in the Strategic Report.
The Board is fully committed to diversity of gender, ethnicity, race and nationality throughout the organisation and ensures it considers candidates from all such backgrounds when appointing new Board members. Further details of our approach to diversity in relation to appointments across the Group and at Board level can be found in the Our People section on pages 42 and 43 and the Nomination Committee Report on pages 62 and 63 respectively.
CommitteesThe Board has a number of standing committees consisting of certain Directors and, in the case of the Treasury Committee, certain senior managers to whom specific responsibilities have been delegated, and for which written terms of reference have been agreed. These terms of reference can be found in the corporate governance section of our website. A verbal update on the proceedings from each Committee meeting is provided to the Board by the Chair of the relevant Committee. Board members can also request presentations or reports on areas of interest.
The performance of the Audit, Nomination and Remuneration Committees are assessed annually as part of the evaluation process described later in this report. Further details of the work, composition, role and responsibilities of the Audit, Nomination and Remuneration Committees are provided in separate reports on pages 56 to 78.
Effective division of responsibilities and Board operationThe roles of Chairman and CEO are held by different individuals. The division of responsibilities between the Chairman and CEO has been clearly established; their responsibilities are set out in writing and have been agreed by the Board. Further information on the division of responsibilities between the Board members is available in the corporate governance section of our website.
During the year ended 31 March 2018, the Company has been subject to the provisions of the Code published in April 2016. The Code is publicly available at www.frc.org.uk. There are five main sections of the Code covering:
• Leadership
• Effectiveness
• Accountability
• Remuneration
• Relations with shareholders
The sections within this Corporate Governance Report explain how the Main Principles of the Code have been applied.
The information required by the Code on Directors’ accountability, our process for the appointment of Directors (including our approach to diversity) and our report on Directors’ remuneration, can be found in the following sections:
• Audit Committee Report on page 56
• Nomination Committee Report on page 62
• Directors’ Remuneration Report on page 64
The Code
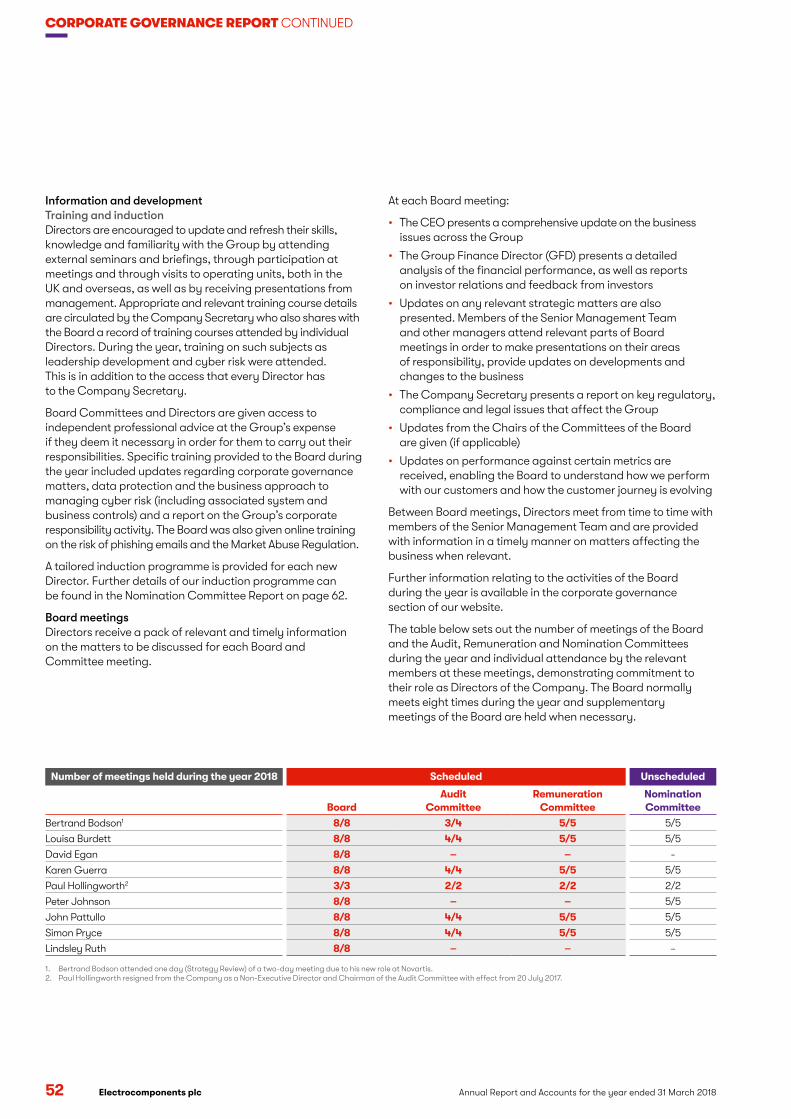
52 Annual Report and Accounts for the year ended 31 March 2018 Electrocomponents plc
CORPORATE GOVERNANCE REPORT CONTINUED
Information and developmentTraining and inductionDirectors are encouraged to update and refresh their skills, knowledge and familiarity with the Group by attending external seminars and briefings, through participation at meetings and through visits to operating units, both in the UK and overseas, as well as by receiving presentations from management. Appropriate and relevant training course details are circulated by the Company Secretary who also shares with the Board a record of training courses attended by individual Directors. During the year, training on such subjects as leadership development and cyber risk were attended. This is in addition to the access that every Director has to the Company Secretary.
Board Committees and Directors are given access to independent professional advice at the Group’s expense if they deem it necessary in order for them to carry out their responsibilities. Specific training provided to the Board during the year included updates regarding corporate governance matters, data protection and the business approach to managing cyber risk (including associated system and business controls) and a report on the Group’s corporate responsibility activity. The Board was also given online training on the risk of phishing emails and the Market Abuse Regulation.
A tailored induction programme is provided for each new Director. Further details of our induction programme can be found in the Nomination Committee Report on page 62.
Board meetingsDirectors receive a pack of relevant and timely information on the matters to be discussed for each Board and Committee meeting.
At each Board meeting:
• The CEO presents a comprehensive update on the business issues across the Group
• The Group Finance Director (GFD) presents a detailed analysis of the financial performance, as well as reports on investor relations and feedback from investors
• Updates on any relevant strategic matters are also presented. Members of the Senior Management Team and other managers attend relevant parts of Board meetings in order to make presentations on their areas of responsibility, provide updates on developments and changes to the business
• The Company Secretary presents a report on key regulatory, compliance and legal issues that affect the Group
• Updates from the Chairs of the Committees of the Board are given (if applicable)
• Updates on performance against certain metrics are received, enabling the Board to understand how we perform with our customers and how the customer journey is evolving
Between Board meetings, Directors meet from time to time with members of the Senior Management Team and are provided with information in a timely manner on matters affecting the business when relevant.
Further information relating to the activities of the Board during the year is available in the corporate governance section of our website.
The table below sets out the number of meetings of the Board and the Audit, Remuneration and Nomination Committees during the year and individual attendance by the relevant members at these meetings, demonstrating commitment to their role as Directors of the Company. The Board normally meets eight times during the year and supplementary meetings of the Board are held when necessary.
Number of meetings held during the year 2018 Scheduled Unscheduled
BoardAudit
CommitteeRemuneration
CommitteeNomination Committee
Bertrand Bodson1 8/8 3/4 5/5 5/5
Louisa Burdett 8/8 4/4 5/5 5/5
David Egan 8/8 – – -
Karen Guerra 8/8 4/4 5/5 5/5
Paul Hollingworth2 3/3 2/2 2/2 2/2
Peter Johnson 8/8 – – 5/5
John Pattullo 8/8 4/4 5/5 5/5
Simon Pryce 8/8 4/4 5/5 5/5
Lindsley Ruth 8/8 – – -
1. Bertrand Bodson attended one day (Strategy Review) of a two-day meeting due to his new role at Novartis.2. Paul Hollingworth resigned from the Company as a Non-Executive Director and Chairman of the Audit Committee with effect from 20 July 2017.

CO
RP
OR
ATE G
OV
ERN
AN
CE
Electrocomponents plcAnnual Report and Accounts for the year ended 31 March 2018 53
The aim of the questionnaire sent to Board members was to obtain views on certain key corporate governance areas as well as to gauge its own effectiveness. It also gave members an opportunity to say candidly what they thought; what was being done well and what needed to be improved. Views were also sought on the Chairman and SID and the workings of the Committees of the Board.
The questionnaire included issues such as:
• Effectiveness of Board and Committee meetings, including team dynamics
• Contributions of the Board and its Committees
• Relationships with Senior Management Team around the direction and values of the organisation and the decision-making process
• Delivery of strategy against performance measures
• Board’s understanding of the Company’s change journey and developing culture
• Risk management
• Training and development
• Shareholder and stakeholder communications
• Succession and talent management
Board evaluationLast year we undertook an external evaluation and we appointed Constal Limited to carry out this exercise for us. This year we carried out an internal evaluation of the Board, facilitated by the Company Secretary and followed up by one-to-one meetings by the Chairman with each Director. The Board recognises the benefit of a full evaluation of its performance and we believe it provides fresh insight and objectivity to its Committees and Directors, enabling it to improve its leadership, effectiveness and focus.
1 The Chairman and Company Secretary discussed and agreed the scope of the evaluation.
2 The Company Secretary prepared a questionnaire which was sent to Board members for completion. Feedback from Board members was provided on a no-name basis.
3 The Company Secretary analysed the responses and prepared separate reports of the findings for the Chairman, the SID and the Chairs of each Committee identifying strengths, challenges and priorities. The SID analysed the responses relating to the Company Secretary. A number of recommendations were also included for discussion by the Board and each of its Committees.
4 The Company Secretary presented the reports of the findings and recommendations to the Board and each of its Committees. These reports were then discussed and any relevant actions were agreed for the year ahead. The SID also discussed the feedback on the Chairman and the Company Secretary with the other Directors.
Evaluation process
In addition, the Chairman held one-to-one meetings with each of the Directors covering the themes outlined above, the dynamics of the Board, and the training and development needs of the Directors, as well as any other areas of concern. In relation to the performance of the Chairman, in addition to the questionnaire completed by all members of the Board, the SID had discussions with the CEO and GFD, and provided feedback to the Chairman and the Non-Executive Directors accordingly. It was agreed that the Company Secretary will also continue to seek regular feedback from the individual Directors. The SID also had a meeting with the Company Secretary to discuss his feedback.
The overall results of this year’s evaluation were positive and there was a consensus about the challenges ahead and the areas of focus for the Board. It was noted that the Board members identified that early engagement between the Executive Directors and Non-Executive Directors was key to maintaining the existing good progress.
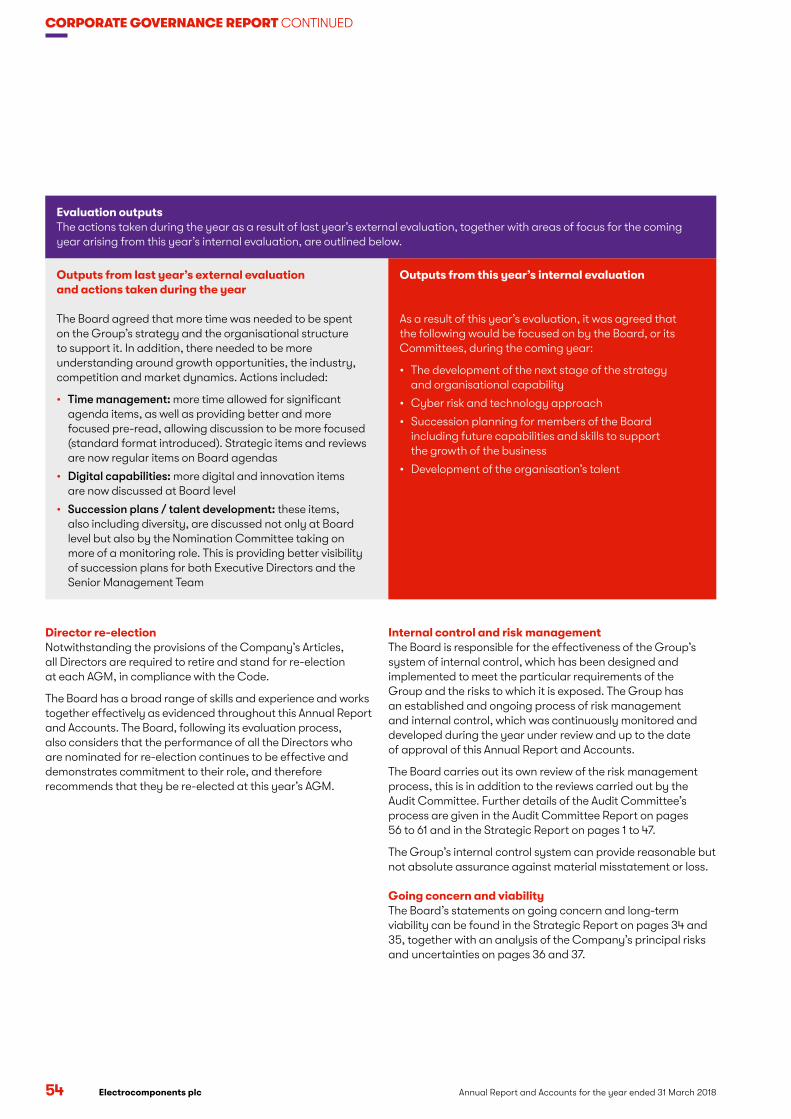
54 Annual Report and Accounts for the year ended 31 March 2018 Electrocomponents plc
CORPORATE GOVERNANCE REPORT CONTINUED
Outputs from last year’s external evaluation and actions taken during the year
The Board agreed that more time was needed to be spent on the Group’s strategy and the organisational structure to support it. In addition, there needed to be more understanding around growth opportunities, the industry, competition and market dynamics. Actions included:
• Time management: more time allowed for significant agenda items, as well as providing better and more focused pre-read, allowing discussion to be more focused (standard format introduced). Strategic items and reviews are now regular items on Board agendas
• Digital capabilities: more digital and innovation items are now discussed at Board level
• Succession plans / talent development: these items, also including diversity, are discussed not only at Board level but also by the Nomination Committee taking on more of a monitoring role. This is providing better visibility of succession plans for both Executive Directors and the Senior Management Team
Outputs from this year’s internal evaluation
As a result of this year’s evaluation, it was agreed that the following would be focused on by the Board, or its Committees, during the coming year:
• The development of the next stage of the strategy and organisational capability
• Cyber risk and technology approach
• Succession planning for members of the Board including future capabilities and skills to support the growth of the business
• Development of the organisation’s talent
Director re-electionNotwithstanding the provisions of the Company’s Articles, all Directors are required to retire and stand for re-election at each AGM, in compliance with the Code.
The Board has a broad range of skills and experience and works together effectively as evidenced throughout this Annual Report and Accounts. The Board, following its evaluation process, also considers that the performance of all the Directors who are nominated for re-election continues to be effective and demonstrates commitment to their role, and therefore recommends that they be re-elected at this year’s AGM.
Internal control and risk management The Board is responsible for the effectiveness of the Group’s system of internal control, which has been designed and implemented to meet the particular requirements of the Group and the risks to which it is exposed. The Group has an established and ongoing process of risk management and internal control, which was continuously monitored and developed during the year under review and up to the date of approval of this Annual Report and Accounts.
The Board carries out its own review of the risk management process, this is in addition to the reviews carried out by the Audit Committee. Further details of the Audit Committee’s process are given in the Audit Committee Report on pages 56 to 61 and in the Strategic Report on pages 1 to 47.
The Group’s internal control system can provide reasonable but not absolute assurance against material misstatement or loss.
Going concern and viabilityThe Board’s statements on going concern and long-term viability can be found in the Strategic Report on pages 34 and 35, together with an analysis of the Company’s principal risks and uncertainties on pages 36 and 37.
Evaluation outputsThe actions taken during the year as a result of last year’s external evaluation, together with areas of focus for the coming year arising from this year’s internal evaluation, are outlined below.
CO
RP
OR
ATE G
OV
ERN
AN
CE
Electrocomponents plcAnnual Report and Accounts for the year ended 31 March 2018 55
Relations with shareholdersThe Company encourages two-way communication with both institutional and private investors. The Annual Report and Accounts is sent to all shareholders who wish to receive a copy. It is also available on the Company’s website, which additionally contains up-to-date information on the Group’s activities and published financial results and presentations.
The Board ensures that regular and useful dialogue is maintained with shareholders. The AGM is used as an additional opportunity for the Chairman and other Board members to meet with shareholders and investors and gives them the opportunity to ask questions. Final voting results are published through a Regulatory Information Service and on the Company’s website following the AGM.
Executive Directors have frequent discussions with institutional shareholders on a range of issues affecting the Group’s performance, which include meetings following the announcements of the full-year and half-year results. At these meetings the Executive Directors meet with major shareholders to discuss performance, strategy and governance.
The GFD and Head of Investor Relations regularly report to the Board on investor relations, including reports compiled by the Company’s brokers containing feedback from institutional shareholders. This ensures that the views of shareholders are communicated to the Board.
This year we also took the step of inviting a shareholder to one of our Board meetings, with the aim being to provide the Board with a shareholder perspective of the market and how the Group is perceived.
Investor relations activity during the year included:
• Introductory meeting between the SID and larger shareholders
• Face-to-face meetings and telephone briefings for analysts, investors and potential investors in the UK, US and Europe, covering the vast majority of shareholdings
• Face-to-face presentations of full-year and half-year results
• Recorded webcasts and presentations available on the corporate website
• The AGM where each member of the Board is available to answer questions
• Meetings between the Chairman and shareholders
• Periodically, shareholders were invited to visit our various operations
Board activityDuring the year, the Board visited both our US and UK operations in Texas and Corby respectively. During the visit to our US site, the Board met with the local management team and also had a tour of the warehouse. During the UK site visit, the Board saw demonstrations on our technology truck, Titan II, and also spent time with the various teams in Corby including customer services, sales, digital marketing and operations, finance and product management. Our Executive Directors also visited the US, where they met with both analysts and key investors and our GFD also hosted an investor tour of our UK operations.

56 Annual Report and Accounts for the year ended 31 March 2018 Electrocomponents plc
AUDIT COMMITTEE REPORT
LETTER FROM THE CHAIR OF THE AUDIT COMMITTEE
Dear fellow shareholderAs Chair of the Audit Committee, I would first like to thank Paul Hollingworth for his great support in helping me transition into my new role as Chair of the Committee. I have come into a business with a strong corporate governance foundation which will underpin the next phase of its strategic development.
I am pleased to present our report detailing the role and responsibilities of the Committee and its activities during the year.
The Committee aims to protect the interests of shareholders by:• Assisting the Board in ensuring the integrity of the financial
and corporate reporting and auditing processes
• Ensuring effective internal control and risk management systems are in place
• Measuring the Group’s effectiveness in managing risk
• Assisting the Board to present a fair, balanced and understandable assessment of the Group’s position and prospects in the full-year and half-year financial reports
• Assisting the Board by reviewing and challenging the stress testing performed, based on plausible scenarios arising from selected principal risks, in assessing the long-term viability of the Group
• Approving the remit of the Internal Audit function and reviewing its effectiveness and findings
• Ensuring that an appropriate relationship is maintained between the Group and its external Auditor, including the recommendation to approve their appointment and fees
• Reviewing the scope and effectiveness of the external audit process
• Reviewing whistleblowing and fraud procedures
Specific focus during the yearWe noted in last year’s report that as the Group continued to change we would maintain our focus on the effective design and workings of the Group’s operating controls. With this in mind, we have reviewed a number of reports on the progress of strategic initiatives and the continued implementation of improved controls to underpin these changes. We specifically reviewed the continuously evolving area of cyber risk and the associated system and business controls. During the year we appointed a permanent Chief Information Security Officer who reported to the Audit Committee on the implementation of a programme to improve our Information Security capability. This includes improvements to cyber security compliance, readiness for the new EU General Data Protection Regulation (GDPR) and Payment Card Industry requirements, as well as a continuing programme of education and awareness to ensure that our people are appropriately briefed on, and able to take action against, common cyber threats.
We are always mindful of the necessity of a sound system of internal control to provide us with a good system of checks and balances, and this very much remained a focus of Internal Audit during the year.
Specific focus for the coming yearThe Information Security programme will continue to be a significant focus of the Committee, together with discussions around the risk appetite in a period of high growth for the Group. We will ensure that we closely monitor progress on the second phase of the Performance Improvement Plan (PIP) and assess the judgements applied in determining the fair values and goodwill for the acquisition of IESA and monitor its integration.
On behalf of the Committee, I would like to thank everyone for their hard work over the year including the external Auditor, PricewaterhouseCoopers (PwC), and the Internal Audit and Finance teams.
Louisa BurdettChair of the Audit Committee 23 May 2018
“ I have come into a business with a strong corporate governance foundation which will underpin the next phase of its strategic development.”LOUISA BURDETT CHAIR OF THE AUDIT COMMITTEE

CO
RP
OR
ATE G
OV
ERN
AN
CE
Electrocomponents plcAnnual Report and Accounts for the year ended 31 March 2018 57
Financial reporting The primary role of the Committee in relation to financial reporting is to review, with both management and the external Auditor, the full-year and half-year financial reports.
The Committee focuses on ensuring compliance with the relevant financial and governance reporting requirements and determines whether the Annual Report and Accounts taken as a whole, is fair, balanced and understandable. It also takes into account the significant accounting issues and judgements noted on page 58 and, to support its reviews, regular reports are also received from the Group Finance Director and the Group Financial Controller.
Further information about how we carry out the above processes is available in the corporate governance section of our website.
Fair, balanced and understandableIn its financial reporting to shareholders and other interested parties, the Board aims to present a fair, balanced and understandable assessment of the Group’s position and prospects, providing necessary information for shareholders to assess the Group’s business model, strategy and performance.
For the year ended 31 March 2018 the Group carried out a process for reviewing the Annual Report and Accounts to ensure that these requirements were met.
The process used includes:
• A thorough understanding of the regulatory requirements for the Annual Report and Accounts
• A draft copy provided to the Chair of the Committee early in the drafting process to assess the broad direction and key messages, with a further draft provided prior to sign-off of the Annual Report and Accounts
• A cascaded sign-off across the Group to determine the accuracy and consistency of the data and language
• A detailed review by all appropriate parties including the external advisors
A checklist of all the elements of the process was completed to document the process and presented to the Committee for review to provide assurance that the appropriate procedures had been undertaken.
The Committee has reviewed the Group’s Annual Report and Accounts for the year ended 31 March 2018 and has advised the Board that, in its opinion, the Annual Report and Accounts taken as a whole is fair, balanced and understandable and provides the information necessary to assess the Group’s position and performance, business model and strategy.
Committee members• Louisa Burdett (Chair from 20 July 2017)• Paul Hollingworth (Chairman up to 20 July 2017)• Bertrand Bodson• Karen Guerra• John Pattullo• Simon Pryce
Other regular attendees• Company Chairman • Chief Executive Officer• Group Finance Director• Company Secretary• Group Financial Controller• Head of Internal Audit and Risk• Senior Statutory Auditor
Composition of the CommitteeThe Board is satisfied that the Chair of the Committee has the current and relevant financial and accounting experience required by the provisions of the Code and that the other members of the Committee have a sufficiently wide range of business experience, expertise and competence such that the Committee can effectively fulfil its responsibilities. Details of the skills and experience of the Committee members are given in their biographies on pages 48 and 49.
Attendance of others is at the invitation of the Committee Chair only and does not restrict the Committee’s independent decision-making.
Meetings are scheduled in accordance with the financial and reporting cycles of the Company and generally take place prior to Board meetings to ensure effectiveness of the collaboration with the Board.
Members and their attendance at meetings during the year are set out in the Corporate Governance Report on page 52.
The Committee has independent access to the Internal Audit team and to the external Auditor. The Head of Internal Audit and Risk and the external Auditor have direct access to the Chair of the Committee outside formal Committee meetings.
The Chair provides updates to the Board on the proceedings of each meeting.
Activities during the year Further information on the activities of the Audit Committee during the year is available in the corporate governance section of our website.
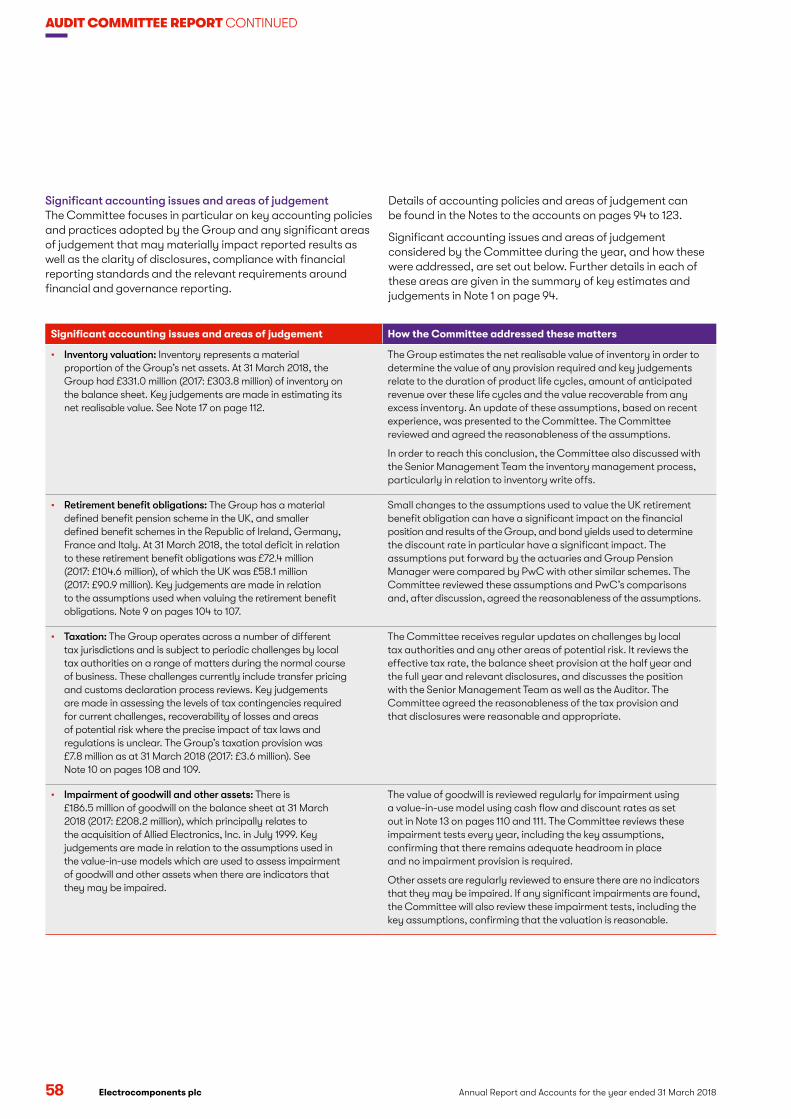
58 Annual Report and Accounts for the year ended 31 March 2018 Electrocomponents plc
AUDIT COMMITTEE REPORT CONTINUED
Details of accounting policies and areas of judgement can be found in the Notes to the accounts on pages 94 to 123.
Significant accounting issues and areas of judgement considered by the Committee during the year, and how these were addressed, are set out below. Further details in each of these areas are given in the summary of key estimates and judgements in Note 1 on page 94.
Significant accounting issues and areas of judgement The Committee focuses in particular on key accounting policies and practices adopted by the Group and any significant areas of judgement that may materially impact reported results as well as the clarity of disclosures, compliance with financial reporting standards and the relevant requirements around financial and governance reporting.
Significant accounting issues and areas of judgement How the Committee addressed these matters
• Inventory valuation: Inventory represents a material proportion of the Group’s net assets. At 31 March 2018, the Group had £331.0 million (2017: £303.8 million) of inventory on the balance sheet. Key judgements are made in estimating its net realisable value. See Note 17 on page 112.
The Group estimates the net realisable value of inventory in order to determine the value of any provision required and key judgements relate to the duration of product life cycles, amount of anticipated revenue over these life cycles and the value recoverable from any excess inventory. An update of these assumptions, based on recent experience, was presented to the Committee. The Committee reviewed and agreed the reasonableness of the assumptions.
In order to reach this conclusion, the Committee also discussed with the Senior Management Team the inventory management process, particularly in relation to inventory write offs.
• Retirement benefit obligations: The Group has a material defined benefit pension scheme in the UK, and smaller defined benefit schemes in the Republic of Ireland, Germany, France and Italy. At 31 March 2018, the total deficit in relation to these retirement benefit obligations was £72.4 million (2017: £104.6 million), of which the UK was £58.1 million (2017: £90.9 million). Key judgements are made in relation to the assumptions used when valuing the retirement benefit obligations. Note 9 on pages 104 to 107.
Small changes to the assumptions used to value the UK retirement benefit obligation can have a significant impact on the financial position and results of the Group, and bond yields used to determine the discount rate in particular have a significant impact. The assumptions put forward by the actuaries and Group Pension Manager were compared by PwC with other similar schemes. The Committee reviewed these assumptions and PwC’s comparisons and, after discussion, agreed the reasonableness of the assumptions.
• Taxation: The Group operates across a number of different tax jurisdictions and is subject to periodic challenges by local tax authorities on a range of matters during the normal course of business. These challenges currently include transfer pricing and customs declaration process reviews. Key judgements are made in assessing the levels of tax contingencies required for current challenges, recoverability of losses and areas of potential risk where the precise impact of tax laws and regulations is unclear. The Group’s taxation provision was £7.8 million as at 31 March 2018 (2017: £3.6 million). See Note 10 on pages 108 and 109.
The Committee receives regular updates on challenges by local tax authorities and any other areas of potential risk. It reviews the effective tax rate, the balance sheet provision at the half year and the full year and relevant disclosures, and discusses the position with the Senior Management Team as well as the Auditor. The Committee agreed the reasonableness of the tax provision and that disclosures were reasonable and appropriate.
• Impairment of goodwill and other assets: There is £186.5 million of goodwill on the balance sheet at 31 March 2018 (2017: £208.2 million), which principally relates to the acquisition of Allied Electronics, Inc. in July 1999. Key judgements are made in relation to the assumptions used in the value-in-use models which are used to assess impairment of goodwill and other assets when there are indicators that they may be impaired.
The value of goodwill is reviewed regularly for impairment using a value-in-use model using cash flow and discount rates as set out in Note 13 on pages 110 and 111. The Committee reviews these impairment tests every year, including the key assumptions, confirming that there remains adequate headroom in place and no impairment provision is required.
Other assets are regularly reviewed to ensure there are no indicators that they may be impaired. If any significant impairments are found, the Committee will also review these impairment tests, including the key assumptions, confirming that the valuation is reasonable.
CO
RP
OR
ATE G
OV
ERN
AN
CE
Electrocomponents plcAnnual Report and Accounts for the year ended 31 March 2018 59
Internal control and risk managementThe Board’s responsibilities for the systems of internal control and their effectiveness are detailed in the Corporate Governance Report on page 54, together with the going concern and viability statements on pages 34 and 35.
The Committee receives quarterly reports from the Head of Internal Audit and Risk on the performance of the system of internal control, and on its effectiveness in managing principal risks and in identifying control failings or weaknesses. In accordance with the requirements of the Code, the Financial Reporting Council (FRC) Guidance on Audit Committees, and the recommendations of the FRC Guidance on Risk Management, Internal Control and Related Financial and Business Reporting, the Committee reviews the Group’s risk management process annually. This year’s review reconfirmed the risk appetite. The outcomes of these reviews are reported to the Board. This, together with regular updates to the Board on the principal risks, allows the Board to assess the systems of internal control and the residual risk for the purposes of making its public statement.
These reviews include material controls, which cover financial, operational and compliance controls and risk management systems. Further information regarding principal risks and uncertainties to the business is given on pages 34, 36 and 37 of the Strategic Report.
A developing area of focus has been the Group’s processes to gain assurance from its more important third party vendors on their key controls. This risk area was reviewed by Internal Audit for a specific business area and the findings shared more widely. This area will continue to be monitored in the coming year.
Where weaknesses in the internal control system have been identified through the processes outlined above, plans for strengthening them are put in place and action plans regularly monitored. There were no control failings or weaknesses that resulted in unforeseen material losses.
Going concern and viability statementsAs part of the Committee’s responsibility to provide advice to the Board, the Committee reviewed the Group’s going concern assumptions and reviewed and challenged the process and assessment of the Group’s longer-term viability. For the viability statement, this included reviewing the assessment period selected as well as the assumptions used in the stress testing performed, which was based on plausible scenarios arising from selected principal risks. Details of these statements are noted on pages 34 and 35 of the Strategic Report.
Other mattersThe Committee also undertook a range of further activities in relation to the Group’s accounting and external reporting in the year, which included the following.
• We reviewed the items excluded from adjusted profit before tax of a charge of £4.5 million (2017: £0.9 million) and adjusted cash flow of an outflow of £2.4 million (2017: £5.1 million) and the non-cash deferred tax credit of £27.9 million excluded from adjusted profit for the year and agreed it was appropriate to do so. The Committee believes that separate disclosure of these items and other alternative performance measures enables the reader to understand more clearly the underlying financial and operating performance of the Group. Further details are set out in Note 3 on pages 97 to 99.
• During the year, the Group consolidated its Oxford-based headquarters with its London-based digital office into one enlarged head office and digital hub in King’s Cross, London. The Committee reviewed the Group’s plan for this relocation and the associated Group Finance staff retention implications. The Committee is satisfied that the relocation was completed successfully and allowed for sufficient continuity and handover to ensure any risk was mitigated.
• We received regular updates on the Group’s ongoing implementation of IFRS 9 ‘Financial Instruments’ and IFRS 15 ‘Revenue from Contracts with Customers’ which will be adopted in the year ending 31 March 2019 and IFRS 16 ‘Leases’ which will be adopted in the year ending 31 March 2020.
60 Annual Report and Accounts for the year ended 31 March 2018 Electrocomponents plc
AUDIT COMMITTEE REPORT CONTINUED
Other activities During the year the Committee also:
• Considered the Group’s tax strategy prior to its approval by the Board
• Received updates on the corporate offence of failing to prevent the criminal facilitation of tax evasion and management’s actions to mitigate such risks
AuditorEffectiveness and independenceThe Committee and the Board put great emphasis on the objectivity of our external Auditor, PwC, in their reporting to shareholders. To ensure full and transparent communication, the Senior Statutory Auditor from PwC was present at all of the Committee meetings.
The Committee is responsible for reviewing the performance and effectiveness of the external Auditor. This review takes place annually and covers qualification, expertise, resources and appointment as well as assurance that there are no issues which could adversely affect the external Auditor’s independence and objectivity taking into account the relevant standards. As part of risk evaluation planning, the Committee considers the risk of the external Auditor withdrawing from the market. The Committee also assesses how well the external Auditor exercised professional scepticism and an appropriate degree of constructive challenge to management.
Following a full review and having given full consideration to the performance and independence of the external Auditor, the Committee has recommended to the Board that a resolution to reappoint PwC be proposed at the AGM and the Board has accepted and endorsed this recommendation. The Company also considers the annual appointment of the external Auditor by the shareholders at the AGM to be a fundamental safeguard.
Further details of how we work with our external Auditor and how its independence is maintained can be found in the corporate governance section of our website. The Group will not engage the external Auditor to undertake any work that could threaten its independence.
The Company confirms that it has complied with the provisions of the Competition and Market Authority’s Order for the financial year under review.
Tender and rotationFollowing an external tender process carried out in 2014, we are not required to retender until 2024. This is in accordance with the EU Audit Regulation and Directive, and the Companies Act 2006, which states that there should be a public tender every 10 years and a change of external Auditor at least every 20 years. There are no contractual obligations that restrict the Committee’s choice of external Auditor.
Our Senior Statutory Audit Partner with PwC is Christopher Richmond. Chris has been involved on our audit since 2015 and has taken over from Ian Chambers as our Group Engagement Partner this year. He is due for rotation after the 2019 audit.
Internal financial controls Internal financial controls are the systems employed by the Group to support the Directors in discharging their responsibilities for financial matters. Those responsibilities are noted on page 83.
The main elements include:
• Assessments by Internal Audit on the effectiveness of operational controls
• Clear terms of reference setting out the duties of the Board and its Committees, with delegation to management in all locations
• Group Finance and Group Treasury manuals outlining the accounting policies and controls
• Weekly, monthly and annual reporting cycles, including an annual budget approved by the Board and regular forecast updates
• Local leadership teams reviewing results against forecast and agreed performance metrics and targets with overall performance reviewed at region and Group levels
• Specific reporting systems covering Treasury operations, major investment projects and legal and insurance activities, which are reviewed by the Board and its Committees on a regular basis
• Whistleblowing procedures allowing individuals to report fraud or financial irregularities and other matters of concern
Internal Audit The Committee reviews and approves the scope and resourcing of the Internal Audit programme annually with the Group’s internal auditors. The scope is decided upon by reference to the perceived geographic, functional and operating risks around the business. These risks are identified from previous audit experience, input from the Senior Management Team and other external sources.
The Committee reviews:
• The level and skills of resources allocated to the Internal Audit function to conduct this programme of work
• The summary of the results of each audit and the resolution of any control issues identified
• The effectiveness of the Internal Audit function
The Head of Internal Audit and Risk has regular contact with the Chair of the Committee, through telephone calls and face-to-face meetings. These discussions are around audit planning and matters noted during Internal Audit assignments. The Company Chairman and other members of the Committee are also available as required. At least annually the Committee meets with the Head of Internal Audit and Risk without the presence of the Senior Management Team.
CO
RP
OR
ATE G
OV
ERN
AN
CE
Electrocomponents plcAnnual Report and Accounts for the year ended 31 March 2018 61
Fraud The Committee reviews the procedures for prevention and detection of fraud in the Group. Suspected cases of fraud must be reported to the Company Secretary within 48 hours and investigated by operational management or Internal Audit, as appropriate. The outcome of any investigation is reported to the Company Secretary and the Group Finance Director. A register of all suspected fraudulent activity and the outcome of any investigation is kept and circulated to the Board on a regular basis, with the Committee also receiving regular updates. We take steps in line with good business practice to detect and prevent fraudulent activity. During the year, there were no frauds of a material nature, although as a business we are subject to various attempts at external and low-level credit card and online fraud.
WhistleblowingIn accordance with the provisions of our Code of Conduct, the Committee is responsible for reviewing the arrangements whereby staff may, in confidence, raise concerns about illegal, unethical or improper behaviour or other matters and for ensuring that these concerns are investigated and escalated as appropriate. An external third party operates the reporting tools, except in Germany where local regulations prohibit this and an in-house alternative has been set up. Whistleblowing is referred to as “Speak Up” internally and is available to all employees. There was focused activity to promote the facility to our employees over the course of this year which included management briefings and face-to-face presentations in the UK and Eastern Europe. The Committee receives aggregated reports on matters raised through these services and monitors their resolution.
Non-audit assignments undertaken by the AuditorThe Group has a policy to ensure that the provision of such services does not impair the external Auditor’s independence or objectivity. In determining the policy, the Committee has also taken into account possible threats to the external Auditor’s independence and objectivity.
Policy on non-audit services includes:
• In providing a non-audit service, the external Auditor should not:
– audit their own work – make management decisions for the Group – create a mutuality of interest – find themselves in the role of advocate for the Group
• The total non-audit fees for any financial year should not exceed 70% of the average of the external audit fee over the last three years. In practice the non-audit fees are normally significantly below this level
Full details of our policy in relation to non-audit services can be found in the corporate governance section of our website. We have reviewed this policy during the year and no changes were required.
During the year under review the non-audit fees for PwC were £16,000, compared to audit fees of £1.2 million. Further information on fees payable to PwC are included in Note 5 on page 100.
Interaction with regulatorsThe FRC’s Audit Quality Review team carried out a review of PwC’s audit of the Group’s Annual Report and Accounts for the year ended 31 March 2017 as part of its 2017/18 inspection cycle. We received a copy of the report, discussed it with PwC and are pleased to confirm that there were no significant findings.
Committee evaluationThe activities of the Committee were reviewed as part of this year’s internal Board evaluation process. The responses to the questionnaires strongly supported the way the Committee operates and is chaired. There was unanimous support for the smooth transition to the new Chair of the Committee, with Committee meetings being described as very efficient and well chaired. There were very few suggestions for change but actions agreed included looking at streamlining processes such as those between the Board and the Committee for trading statements and continuing to focus on the Group’s risk appetite in a period of high growth for the Group.
Further details of the evaluation process can be found in the Corporate Governance Report on pages 53 and 54.

62 Annual Report and Accounts for the year ended 31 March 2018 Electrocomponents plc
NOMINATION COMMITTEE REPORT
Dear fellow shareholderAs Chairman of the Nomination Committee, I present our report detailing the role and responsibilities of the Committee and its activities during the year.
The Committee is responsible for:• Considering the structure, size and composition of
the Board to ensure it has an appropriate balance and diversity of skills, experience and independence
• Developing short-term and long-term succession plans for the Board and management team
• Reviewing the standard process for appointing Directors, ensuring it is rigorous, transparent, inclusive and objective
• Recommending suitable candidates for appointment to the Board and ensuring new Directors undergo an appropriate induction
• Reviewing the Board’s diversity policy
• Reviewing the talent development programme and tracking progress
Specific focus during the yearThis year we welcomed Louisa Burdett as our Chair of the Audit Committee, and we are delighted with the way she has so smoothly transitioned into her new role and quickly gained the respect of her colleagues.
Simon Pryce, who joined the Board in September 2016, has settled in well and has already demonstrated a strong ability to contribute across a wide range of topics.
LETTER FROM THE CHAIRMAN OF THE NOMINATION COMMITTEE
The Committee has continued to review succession planning for Executive and Non-Executive Directors, as well as for the Senior Management Team, to ensure we have the capability to drive the long-term growth and development of the business.
Specific focus for the coming yearTalent development will be a key focus of the Committee this year to gain greater visibility of the talent pipeline below the Senior Management Team, particularly the development plans of high-potential individuals. The Committee will also consider the skills and capabilities needed on the Board to support the next stage of the Group’s strategic development.
Succession planning for the Board, as well as for the Senior Management Team, will remain a focus of our work. We will continue to consider how to increase diversity at Board and executive levels, a matter I personally take very seriously, and the Nomination Committee will track progress in this area.
Peter JohnsonChairman of the Nomination Committee 23 May 2018
“ The Company and the Group are committed to high standards of corporate governance to underpin the business through a period of high growth.”PETER JOHNSON CHAIRMAN

CO
RP
OR
ATE G
OV
ERN
AN
CE
Electrocomponents plcAnnual Report and Accounts for the year ended 31 March 2018 63
as well as technical training on legal and governance issues and any other relevant documentation.
Towards the end of the last financial year, Louisa Burdett received her induction to the Group and to her role as Audit Committee Chair. This induction included a thorough handover from Paul Hollingworth, corporate governance and compliance training from the Company Secretary and his team, meetings with the CEO, Group Finance Director and our Senior Management Team, as well as visits to our Corby and Nuneaton sites and meetings with the Group’s advisors.
Terms of appointmentExecutive Directors have one-year rolling contracts. Non-Executive Directors do not have service contracts but instead have a letter of appointment which sets out expected time commitments. Such time commitments can involve peaks of activity at particular times. Details of the Company’s policy on Executive Directors’ service contracts and terms of appointment for Non-Executive Directors are set out in the Directors’ Remuneration Report on page 78.
The Board takes into account the need for it to refresh its membership progressively over time. Non-Executive Directors are normally expected to serve for six years. They may be invited to serve longer, but additional service beyond six years is subject to rigorous review, and service beyond nine years is unlikely. The terms of appointment for the Board members are available for inspection at the Company’s registered office and will be available at our AGM.
Succession planningSuccession planning, both at Executive and Non-Executive level, in both the short and long-term, remains a key focus for the Board. The Chief HR Officer gave presentations to the Board during the year on short-term and long-term organisational capability and succession planning for key Senior Management Team roles. On recommendation from the Committee, the Board agrees details of the key competencies required to enhance the composition of the Board.
DiversityThe Committee has a Policy Statement which emphasises its adherence to the Group Diversity and Inclusion Policy (Policy) in considering succession planning and recruitment at Board level, and is mindful of the Policy when instructing any recruitment consultants or other advisors it appoints. The Policy states that it is in the best interests of the Company to ensure balance and diversity at Board level, and strongly encourages recruitment consultants to widen search parameters so that a diverse range of candidates may be considered, where appropriate. The Committee has actively sought to increase both gender and national diversity whilst also recognising the importance of inherent diversity of experience and approach and ensuring we recruit the best possible person for the job.
We continue to have strong international diversity both at Board level and within the Senior Management Team, reflecting the global nature of our business. More information on activities within the Group to promote diversity is given in the Strategic Report on pages 42 and 43.
Succession planning
Reviews were carried out for both Executive and Non-Executive Directors, as well as for the Senior Management Team.
Talent reviews The Committee reviewed the Group’s approach to talent, assessing where talent might be encouraged to progress further within the organisation.
Organisational capability review
The Committee reviewed the organisation’s leadership and technical capability, identifying priorities for the coming year in relation to talent acquisition, leadership development, diversity and inclusion.
Diversity The Committee received reports setting out the Company’s progress against objectives in relation to diversity, noting the continuing focus on creating an inclusive culture within the organisation. It also noted the appointment of a new Head of Diversity and Inclusion, who is driving this agenda forward.
Activities during the year
Appointment of Directors Where a new director is to be appointed, a candidate profile is developed based on a review of future business issues against the experience and skills of existing Board members. This is used to brief external recruitment consultants appointed by the Committee to undertake the selection process. Initial meetings with prospective candidates are held by a combination of the Company Chairman, the Company Secretary and sometimes another Board Director, and a shortlist is selected to meet all other Board members. The Committee then meets and decides which candidate, if any, will be recommended to join the Board.
Any appointees to the Board receive an induction in respect of their directorship. This will typically include meetings with senior management and our corporate advisors, sales visits to customers, presentations from key business areas, tours of our UK warehouses, and the option to visit our overseas businesses,
Committee members• Peter Johnson (Chairman) • Bertrand Bodson • Louisa Burdett • Karen Guerra• John Pattullo• Simon Pryce
Details of the skills, experience and tenure of the Committee members are given in their biographies on pages 48 and 49.
Membership of the Committee, the number of meetings that took place in the year and attendance at those meetings, are set out in the Corporate Governance Report on page 52. The Chairman provides updates to the Board on the proceedings of each meeting.
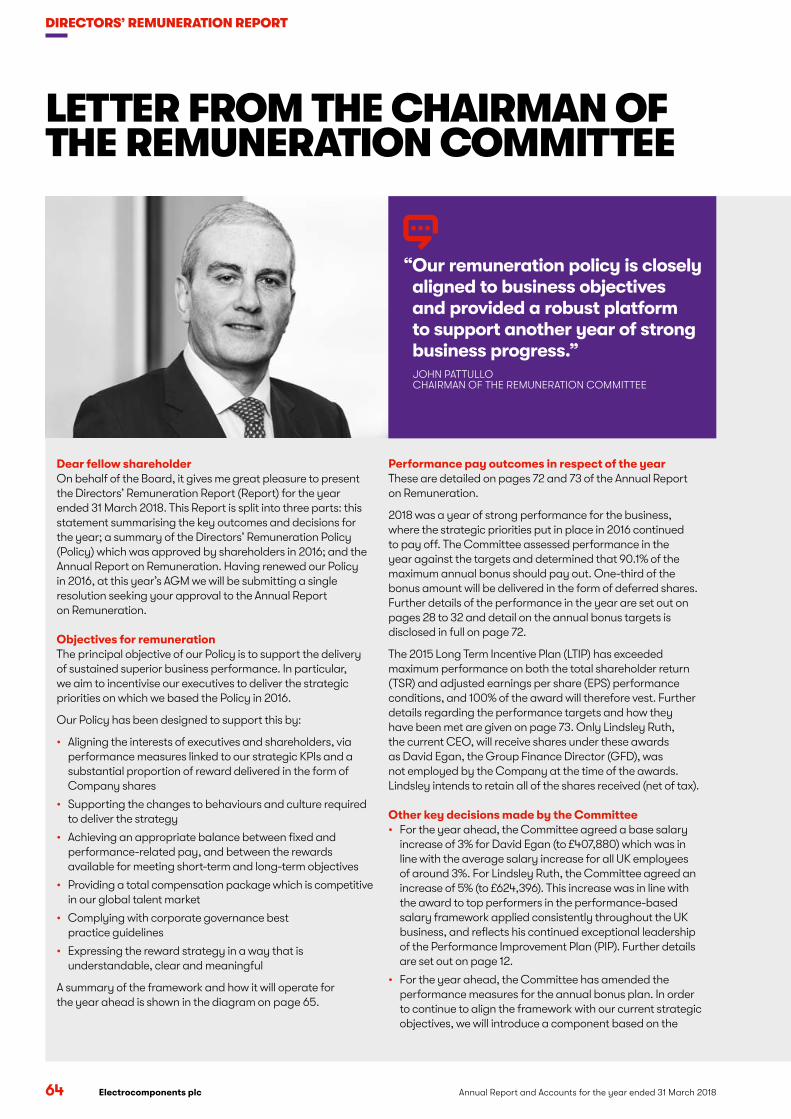
LETTER FROM THE CHAIRMAN OF THE REMUNERATION COMMITTEE
64 Annual Report and Accounts for the year ended 31 March 2018 Electrocomponents plc
DIRECTORS’ REMUNERATION REPORT
“ Our remuneration policy is closely aligned to business objectives and provided a robust platform to support another year of strong business progress.”JOHN PATTULLO CHAIRMAN OF THE REMUNERATION COMMITTEE
Dear fellow shareholderOn behalf of the Board, it gives me great pleasure to present the Directors’ Remuneration Report (Report) for the year ended 31 March 2018. This Report is split into three parts: this statement summarising the key outcomes and decisions for the year; a summary of the Directors’ Remuneration Policy (Policy) which was approved by shareholders in 2016; and the Annual Report on Remuneration. Having renewed our Policy in 2016, at this year’s AGM we will be submitting a single resolution seeking your approval to the Annual Report on Remuneration.
Objectives for remunerationThe principal objective of our Policy is to support the delivery of sustained superior business performance. In particular, we aim to incentivise our executives to deliver the strategic priorities on which we based the Policy in 2016.
Our Policy has been designed to support this by:
• Aligning the interests of executives and shareholders, via performance measures linked to our strategic KPIs and a substantial proportion of reward delivered in the form of Company shares
• Supporting the changes to behaviours and culture required to deliver the strategy
• Achieving an appropriate balance between fixed and performance-related pay, and between the rewards available for meeting short-term and long-term objectives
• Providing a total compensation package which is competitive in our global talent market
• Complying with corporate governance best practice guidelines
• Expressing the reward strategy in a way that is understandable, clear and meaningful
A summary of the framework and how it will operate for the year ahead is shown in the diagram on page 65.
Performance pay outcomes in respect of the yearThese are detailed on pages 72 and 73 of the Annual Report on Remuneration.
2018 was a year of strong performance for the business, where the strategic priorities put in place in 2016 continued to pay off. The Committee assessed performance in the year against the targets and determined that 90.1% of the maximum annual bonus should pay out. One-third of the bonus amount will be delivered in the form of deferred shares. Further details of the performance in the year are set out on pages 28 to 32 and detail on the annual bonus targets is disclosed in full on page 72.
The 2015 Long Term Incentive Plan (LTIP) has exceeded maximum performance on both the total shareholder return (TSR) and adjusted earnings per share (EPS) performance conditions, and 100% of the award will therefore vest. Further details regarding the performance targets and how they have been met are given on page 73. Only Lindsley Ruth, the current CEO, will receive shares under these awards as David Egan, the Group Finance Director (GFD), was not employed by the Company at the time of the awards. Lindsley intends to retain all of the shares received (net of tax).
Other key decisions made by the Committee • For the year ahead, the Committee agreed a base salary
increase of 3% for David Egan (to £407,880) which was in line with the average salary increase for all UK employees of around 3%. For Lindsley Ruth, the Committee agreed an increase of 5% (to £624,396). This increase was in line with the award to top performers in the performance-based salary framework applied consistently throughout the UK business, and reflects his continued exceptional leadership of the Performance Improvement Plan (PIP). Further details are set out on page 12.
• For the year ahead, the Committee has amended the performance measures for the annual bonus plan. In order to continue to align the framework with our current strategic objectives, we will introduce a component based on the

Remuneration framework for the year ending 31 March 2019
CO
RP
OR
ATE G
OV
ERN
AN
CE
Electrocomponents plcAnnual Report and Accounts for the year ended 31 March 2018 65
Over the next year, meetings with major shareholders will be set up to obtain their views on the longer-term compensation strategy. Shareholders will recall that the Policy approved in 2016 will need to be renewed in 2019 and this consultation will be a significant step in the process to review and update the Policy. One major area of the Policy review will be consideration of the LTIP and how it should evolve to support the business. The review will be a major focus for the Committee over the forthcoming year and it will result in a new Policy being put to shareholders at the AGM in 2019.
Finally, and as advised by the Company in its announcement to the market on 23 March 2018, I will be stepping down as Chairman of the Remuneration Committee after this year’s AGM. This will enable me to focus more on my role of Senior Independent Director. Simon Pryce will be taking over as Chairman of Remuneration Committee and I wish him well as he takes the Committee forward.
I hope we can continue to count on your support at the forthcoming AGM.
John PattulloChairman of the Remuneration Committee 23 May 2018
performance of RS Pro (our strategic objectives here are discussed further on page 9). We will also amend the net promoter score to include the whole Group, as opposed to simply RS. The revised measures and weights are shown in the diagram above. For any payout to occur, a threshold level of adjusted PBT must be met.
• For the forthcoming LTIP awards, the measures will remain unchanged and the Committee agreed targets which continue to be stretching in light of significant progress made during the year under review. The Committee is aware that for 2018 LTIP awards the ROCE target range (24% to 28%) is below ROCE performance for 2018 of 28.6%. This target range was set to anticipate new investments during the performance period which are expected to reduce ROCE from the exceptional performance delivered in 2018. Further details of the performance conditions for the LTIP are given on page 70.
• In recognition of the continued increased scale and improved performance of the business, the Committee agreed to increase the Chairman’s fee to £260,000 in line with companies of a similar size.
I am also delighted that our Compensation Policy has continued to facilitate the appointment of several key executives during the year including a new member of the Senior Management Team. This appointment is covered by Lindsley in more detail on page 17. We will continue to develop our remuneration approach to help attract the high calibre of leaders required to drive transformational change in the business.
Annual bonusMaximum 150% base salary
LTIPMaximum 225% base salary
Adjusted profit before tax (PBT) (30%)
Like-for-like Group revenue growth (30%)
Like-for-like RS Pro revenue growth (10%)
Adjusted free cash flow (10%)
Group net promoter score (NPS) (20%)
One-third delivered in deferred shares Three-year performance period + two-year holding period
Malus and clawback provisons apply to elements of variable remuneration
Base LTIP award Maximum 150% of base salary
Drive and reward the delivery of annual performance against a balanced set of strategically aligned KPIs
Opportunity to multiply the base LTIP vesting by up to 1.5 times for the delivery of exceptional adjusted EPS performance from the transformation of the business
Market-competitive LTIP based on long-term performance against key KPIs and shareholder value metrics
Transformation multiplier Multiply base LTIP award by up to 1.5 times (Additional opportunity of up to 75% of salary)
Adjusted EPS (50%)
TSR (25%)
Return on capital employed (ROCE) (25%)
Exceptional adjusted EPS performance (100%)
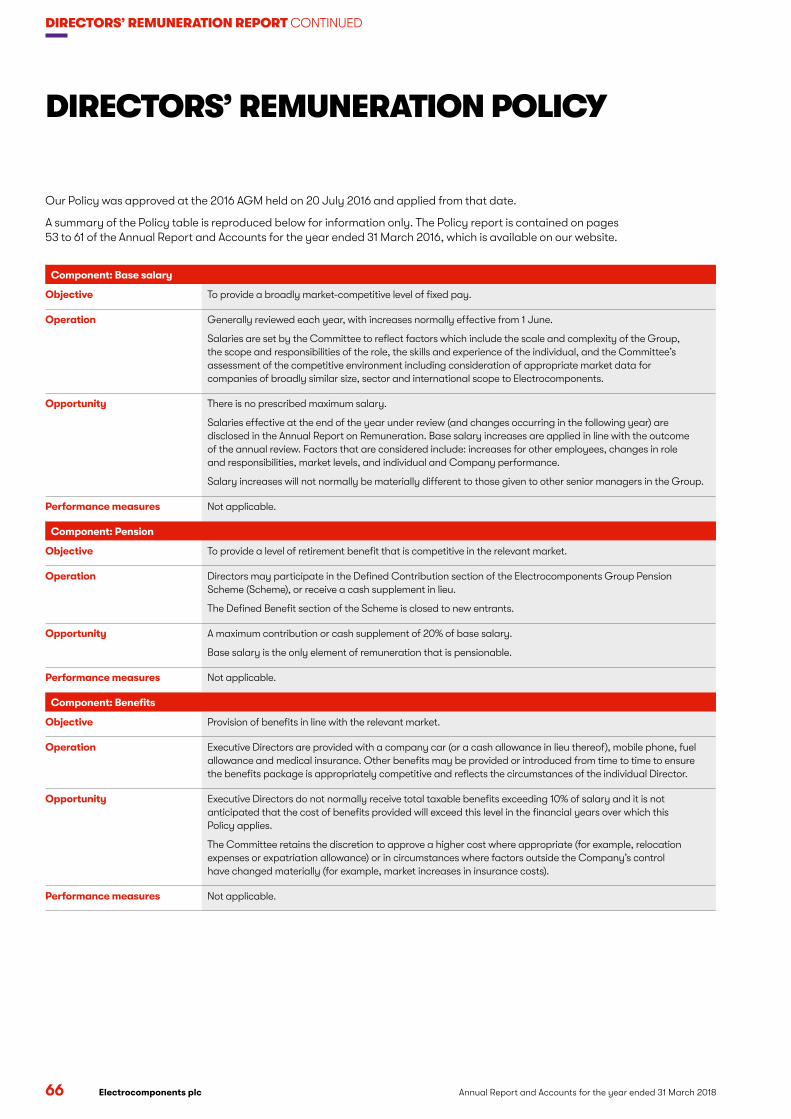
66 Annual Report and Accounts for the year ended 31 March 2018 Electrocomponents plc
DIRECTORS’ REMUNERATION REPORT CONTINUED
DIRECTORS’ REMUNERATION POLICY
Component: Base salary
Objective To provide a broadly market-competitive level of fixed pay.
Operation Generally reviewed each year, with increases normally effective from 1 June.
Salaries are set by the Committee to reflect factors which include the scale and complexity of the Group, the scope and responsibilities of the role, the skills and experience of the individual, and the Committee’s assessment of the competitive environment including consideration of appropriate market data for companies of broadly similar size, sector and international scope to Electrocomponents.
Opportunity There is no prescribed maximum salary.
Salaries effective at the end of the year under review (and changes occurring in the following year) are disclosed in the Annual Report on Remuneration. Base salary increases are applied in line with the outcome of the annual review. Factors that are considered include: increases for other employees, changes in role and responsibilities, market levels, and individual and Company performance.
Salary increases will not normally be materially different to those given to other senior managers in the Group.
Performance measures Not applicable.
Component: Pension
Objective To provide a level of retirement benefit that is competitive in the relevant market.
Operation Directors may participate in the Defined Contribution section of the Electrocomponents Group Pension Scheme (Scheme), or receive a cash supplement in lieu.
The Defined Benefit section of the Scheme is closed to new entrants.
Opportunity A maximum contribution or cash supplement of 20% of base salary.
Base salary is the only element of remuneration that is pensionable.
Performance measures Not applicable.
Component: Benefits
Objective Provision of benefits in line with the relevant market.
Operation Executive Directors are provided with a company car (or a cash allowance in lieu thereof), mobile phone, fuel allowance and medical insurance. Other benefits may be provided or introduced from time to time to ensure the benefits package is appropriately competitive and reflects the circumstances of the individual Director.
Opportunity Executive Directors do not normally receive total taxable benefits exceeding 10% of salary and it is not anticipated that the cost of benefits provided will exceed this level in the financial years over which this Policy applies.
The Committee retains the discretion to approve a higher cost where appropriate (for example, relocation expenses or expatriation allowance) or in circumstances where factors outside the Company’s control have changed materially (for example, market increases in insurance costs).
Performance measures Not applicable.
Our Policy was approved at the 2016 AGM held on 20 July 2016 and applied from that date.
A summary of the Policy table is reproduced below for information only. The Policy report is contained on pages 53 to 61 of the Annual Report and Accounts for the year ended 31 March 2016, which is available on our website.

CO
RP
OR
ATE G
OV
ERN
AN
CE
Electrocomponents plcAnnual Report and Accounts for the year ended 31 March 2018 67
Component: Annual bonus
Objective To focus Executive Directors on achieving demanding annual targets relating to Company performance.
Operation Performance targets are set at the start of the financial year taking into account the annual budget agreed by the Board. After the end of the financial year, the Committee determines the extent to which these targets have been achieved.
A proportion of the total bonus payment (currently one-third) is delivered in the form of deferred shares in the Company under the Deferred Share Bonus Plan (DSBP). These shares normally vest after a period of two years, subject to continued employment. Dividend equivalents may be payable on shares which vest. The remainder is paid in cash after the year end. Malus and clawback provisions apply to all elements of the annual bonus (see notes to this table).
Opportunity Maximum opportunity: 150% of base salary.
Performance measures Payment is determined by reference to performance, assessed over one financial year based on financial and strategic performance measures which the Committee considers to be aligned to the annual strategy and the creation of shareholder value. Such measures may include:
• Revenue growth
• Profit before tax and reorganisation costs (PBTR)1
• Cash flow
• Net Promoter Score
The weightings of these performance measures are agreed by the Committee at the start of each year, according to annual business priorities. The overall framework will normally be weighted towards financial measures of performance. The Committee retains discretion to use different or additional measures and weightings to ensure that the bonus framework appropriately supports the business strategy and objectives for the relevant year.
Before any bonus may pay out, a threshold level of PBTR must be achieved.
The Committee has discretion to adjust the formulaic bonus outcomes (including down to zero) to ensure alignment of pay with performance and fairness to shareholders and participants. The Committee also has the discretion to adjust targets for any exceptional events that may occur during the year. Any such discretion will be within the limits of the scheme and will be fully disclosed in the relevant Annual Report on Remuneration.
For threshold performance, the bonus payout will normally be nil, but in no circumstances will it exceed 10% of the maximum opportunity. For target performance, the bonus payout will typically be 50% of the maximum opportunity.
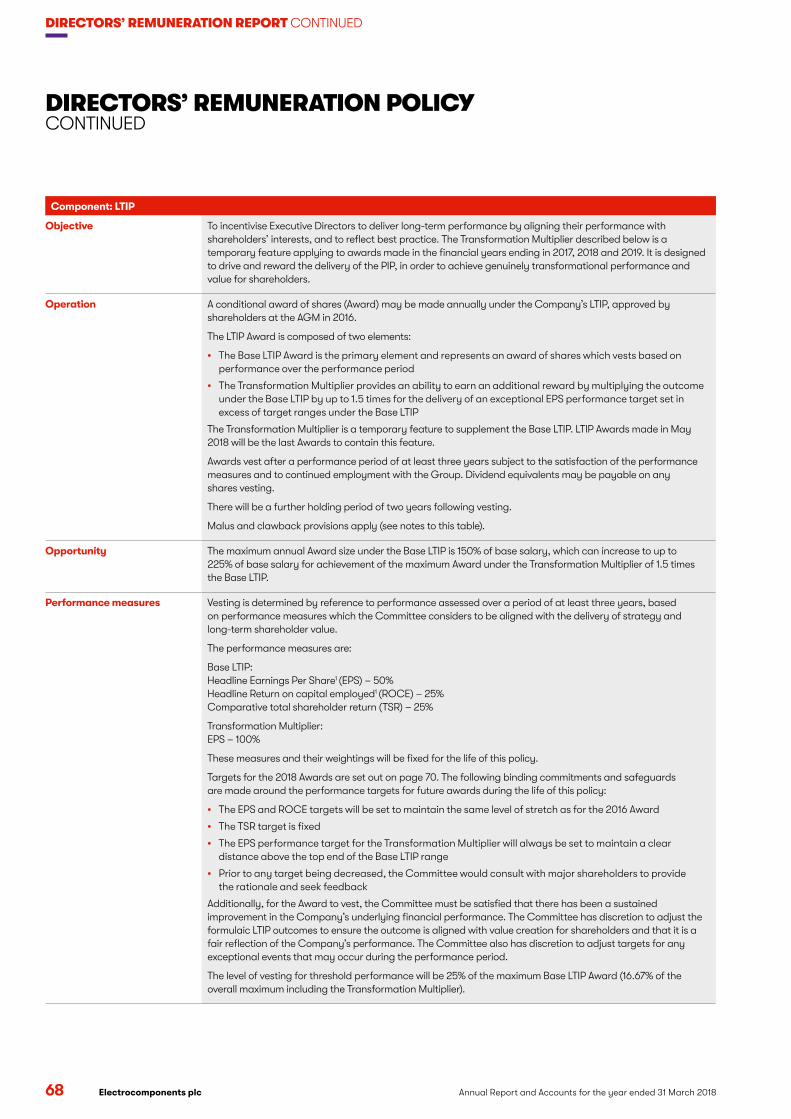
68 Annual Report and Accounts for the year ended 31 March 2018 Electrocomponents plc
DIRECTORS’ REMUNERATION REPORT CONTINUED
Component: LTIP
Objective To incentivise Executive Directors to deliver long-term performance by aligning their performance with shareholders’ interests, and to reflect best practice. The Transformation Multiplier described below is a temporary feature applying to awards made in the financial years ending in 2017, 2018 and 2019. It is designed to drive and reward the delivery of the PIP, in order to achieve genuinely transformational performance and value for shareholders.
Operation A conditional award of shares (Award) may be made annually under the Company’s LTIP, approved by shareholders at the AGM in 2016.
The LTIP Award is composed of two elements:
• The Base LTIP Award is the primary element and represents an award of shares which vests based on performance over the performance period
• The Transformation Multiplier provides an ability to earn an additional reward by multiplying the outcome under the Base LTIP by up to 1.5 times for the delivery of an exceptional EPS performance target set in excess of target ranges under the Base LTIP
The Transformation Multiplier is a temporary feature to supplement the Base LTIP. LTIP Awards made in May 2018 will be the last Awards to contain this feature.
Awards vest after a performance period of at least three years subject to the satisfaction of the performance measures and to continued employment with the Group. Dividend equivalents may be payable on any shares vesting.
There will be a further holding period of two years following vesting.
Malus and clawback provisions apply (see notes to this table).
Opportunity The maximum annual Award size under the Base LTIP is 150% of base salary, which can increase to up to 225% of base salary for achievement of the maximum Award under the Transformation Multiplier of 1.5 times the Base LTIP.
Performance measures Vesting is determined by reference to performance assessed over a period of at least three years, based on performance measures which the Committee considers to be aligned with the delivery of strategy and long-term shareholder value.
The performance measures are:
Base LTIP: Headline Earnings Per Share1 (EPS) – 50% Headline Return on capital employed1 (ROCE) – 25% Comparative total shareholder return (TSR) – 25%
Transformation Multiplier: EPS – 100%
These measures and their weightings will be fixed for the life of this policy.
Targets for the 2018 Awards are set out on page 70. The following binding commitments and safeguards are made around the performance targets for future awards during the life of this policy:
• The EPS and ROCE targets will be set to maintain the same level of stretch as for the 2016 Award
• The TSR target is fixed
• The EPS performance target for the Transformation Multiplier will always be set to maintain a clear distance above the top end of the Base LTIP range
• Prior to any target being decreased, the Committee would consult with major shareholders to provide the rationale and seek feedback
Additionally, for the Award to vest, the Committee must be satisfied that there has been a sustained improvement in the Company’s underlying financial performance. The Committee has discretion to adjust the formulaic LTIP outcomes to ensure the outcome is aligned with value creation for shareholders and that it is a fair reflection of the Company’s performance. The Committee also has discretion to adjust targets for any exceptional events that may occur during the performance period.
The level of vesting for threshold performance will be 25% of the maximum Base LTIP Award (16.67% of the overall maximum including the Transformation Multiplier).
DIRECTORS’ REMUNERATION POLICYCONTINUED

CO
RP
OR
ATE G
OV
ERN
AN
CE
Electrocomponents plcAnnual Report and Accounts for the year ended 31 March 2018 69
Component: Save As You Earn (SAYE)
Objective To encourage the ownership of Electrocomponents plc shares.
Operation An HMRC approved scheme where employees (including Executive Directors) may save an agreed amount up to the individual monthly limit set by HMRC from time to time over three or five years. Options are normally granted at a discount of up to 20%.
Opportunity Savings are capped at an agreed amount up to the individual monthly limit set by HMRC from time to time.
Performance measures Not applicable.
Component: Share ownership
Objective To align Executive Director and shareholder interests and reinforce long-term decision-making.
Operation Executive Directors are expected to retain at least 50% of any share awards that vest (net of tax) in order to help build up the following required personal holdings of Electrocomponents plc shares:
• CEO: 200% of salary
• Group Finance Director: 100% of salary
Opportunity Not applicable.
Performance measures Not applicable.
1. Since this policy was approved in July 2016, PBTR has been renamed adjusted profit before tax, headline earnings per share to adjusted earnings per share and headline return on capital employed to return on capital employed.
Notes to the policy tableMalus and clawback provisionsAll elements of the annual bonus and the LTIP are subject to malus and clawback provisions. In the event of misconduct of the participant or their team or materially adverse misstatement of the Company’s financial statements, the Committee has discretion to apply the following malus and clawback provisions in respect of the annual bonus (including DSBP) and the LTIP. The Committee may:
• Require a participant to return a cash bonus at any time up to the second anniversary of payment
• Reduce (including down to zero) a DSBP award prior to vesting
• Reduce (including down to zero) an LTIP award prior to vesting and / or require, at any time prior to the end of the holding period, a participant to return part or all of the value of the LTIP award received
Performance measure selection and approach to target settingThe annual bonus performance measures are selected each year to reflect the financial and strategic performance measures which the Committee considers to be aligned with the delivery of the strategic priorities and which directly reinforce the medium-term performance framework. The LTIP performance measures were selected to provide a balance between external and internal measures of performance, reflect the Group’s long-term strategic KPIs, as well as measure absolute and relative performance. TSR aligns performance with shareholders’ interests. EPS is a measure of the growth and profitability of the Group that also reflects management performance and is a measure used by investors in deciding whether to invest in the Company. ROCE reflects the efficiency of profit generation and balance sheet management.
Targets applying to the bonus and LTIP are reviewed annually, based on a number of internal and external reference points. Bonus targets are set by reference to the annual budget agreed by the Board. LTIP targets reflect industry context, expectations of what will constitute appropriately challenging performance levels, and factors specific to the Company. Targets for the Transformation Multiplier element of the LTIP reflect exceptional levels of performance from the delivery of strategic objectives which transform long-term financial performance, and must be set in excess of the upper end of equivalent performance ranges under the Base LTIP. In accordance with the rules of the LTIP, performance conditions applicable to Awards may be adjusted if an event occurs or circumstances arise which cause the Committee to determine that the performance conditions have ceased to be appropriate. In such circumstances, the Committee may make such adjustments to the calculations as it deems necessary in order to ensure that the performance conditions suitably measure performance in a manner which is consistent with the objectives of the targets.

70 Annual Report and Accounts for the year ended 31 March 2018 Electrocomponents plc
DIRECTORS’ REMUNERATION REPORT CONTINUED
ANNUAL REPORT ON REMUNERATION
Implementation of Executive Director remuneration policy for the year ending 31 March 2019Base salaryBase salaries for the Executive Directors effective from 1 June 2018 (with the prior year comparator and the change) are:
Salary effective1 June 2018
Salary effective1 June 2017 Change
Lindsley Ruth £624,396 £594,663 5.0%
David Egan £407,880 £396,000 3.0%
A salary increase averaging 3% across the Group was awarded at the annual pay review, effective 1 June 2018. Lindsley Ruth’s increase is in line with the 5% increase for top performers under the performance-based salary framework applied consistently throughout the UK business. It reflects the continued exceptional leadership in the execution of the Performance Improvement Plan (PIP) and the delivery of outstanding business performance since Lindsley’s appointment. This includes the execution of the strategic priorities under the PIP (discussed on page 12) which has helped to support the significant increases in revenue and adjusted PBT since his appointment and the delivery of over £1.8 billion in shareholder value (including both share price growth and dividends), taking the business from a market cap of £1.1 billion to £2.6 billion.
PensionFor the forthcoming year, the Executive Directors will receive a cash contribution in lieu of pension of 20% of base salary.
Performance-related annual bonusThe maximum annual bonus opportunity for Executive Directors will remain unchanged (at 150% of base salary) for the forthcoming financial year. The bonus outcome for Executive Directors will be based on the following performance measures:
Performance measure Weighting
Like-for-like Group revenue growth 30%
Like-for-like RS Pro revenue growth 10%
Adjusted PBT 30%
Adjusted free cash flow 10%
Group NPS 20%
In accordance with the Policy, before any bonus may pay out, a threshold level of adjusted PBT must be achieved.
One-third of any bonus earned will be deferred into shares for a further two years under the DSBP.
Annual bonus targets are considered to be commercially sensitive and will not be disclosed in advance but, to the extent the Directors consider them to no longer be sensitive, are disclosed retrospectively in the Annual Report on Remuneration for the relevant year.
LTIPLindsley Ruth and David Egan will receive awards under the LTIP with a face value of 150% and 125% of base salary (225% and 187.5% including the maximum Transformation Multiplier of 1.5 times the Base LTIP vesting) respectively.
Vesting of these awards will be determined in accordance with the following performance targets measured over the three years to 31 March 2021:
Base LTIP targets Multiplier targets
Weight
Threshold(25% of
base)
Maximum(100% of
base) Measure
Threshold(1x base vesting)
Maximum(1.5x base
vesting)
Adjusted EPS (cumulative FY19, FY20, FY21) 50% 98p 108p
The vesting outcome under the Base LTIP is multiplied by up to 1.5 times based on performance
against the Multiplier adjusted EPS targets
TSR (vs Industrial / Electronics peer group1) 25% Median
Upper quartile
Adjusted EPS (cumulative
FY19, FY20, FY21) 112p 119p
ROCE (average over FY19, FY20, FY21) 25% 24% 28%
Straight-line vesting between points (Base LTIP and Multiplier). 1. Comprises Bodycote, DCC, Dialight, Diploma, Discoverie Group, Essentra, Fenner, Ferguson (previously Wolseley), Goodwin, Grafton Group UTS, Halma, Hill & Smith, Howden Joinery
GP, IMI, Luceco, Morgan Advanced Material, Oxford Instruments, Porvair, Renishaw, Renold, RHI Magnesita, Rotork, Severfield, SIG, Spectris, Spirax-Sarco Engr, Travis Perkins, Trifast, TT Electronics, Weir Group, Xaar, XP Power (DI). The TSR group contains all companies from the Electrical and Electronic Equipment, Industrial Machinery and Industrial Suppliers sectors of the FTSE All Share. The group for this year’s award has been amended from that used last year to add an additional company (RHI Magnesita) which meets the previously agreed criteria.
Following vesting, the 2018 awards will be subject to a two-year holding period.

CO
RP
OR
ATE G
OV
ERN
AN
CE
Electrocomponents plcAnnual Report and Accounts for the year ended 31 March 2018 71
SAYEExecutive Directors will be able to participate in any SAYE scheme offered to all employees, on identical terms.
Implementation of Chairman and Non-Executive Director remuneration policy for the year ending 31 March 2019In recognition of the continued increased scale and performance of the business the Chairman’s fee increased from £220,000 to £260,000 from 1 April 2018. Non-Executive Director fees have increased from £50,000 to £55,000, in line with market practice. These increases took effect from 1 April 2018.
Implementation of Executive Director remuneration policy for the year ended 31 March 2018Single figure for total remuneration for Executive Directors (audited)The following table provides a single figure for total remuneration of the Executive Directors for the year ended 31 March 2018 and the prior year. The value of the annual bonus includes the element of bonus deferred under the DSBP, where relevant.
2018£
2017£
Lindsley Ruth
Base salary 589,719 562,500
Taxable benefits1 25,996 27,056
Annual bonus2 803,687 699,188
LTIP3 2,518,514 –
Pension benefit4 117,944 112,500
Other – –
Total 4,055,860 1,401,244
David Egan
Base salary 394,167 385,000
Taxable benefits1 14,443 14,938
Annual bonus2 535,194 476,438
LTIP3 – –
Pension benefit4 78,833 77,000
Other5 – 7,336
Total 1,022,637 960,712
1. Taxable benefits consist of medical insurance, company car (or allowance) and personal fuel allowance.2. Annual bonus comprises both the cash annual bonus for performance during the year and the value of the deferred share element on the date of deferral, where relevant. The deferred
share element (one-third of the figure shown in the table above) is deferred for two years. See ‘Annual bonus in respect of performance for the year ended 31 March 2018’, on page 72 for further details.
3. The LTIP value would show the value of LTIP awards made in July 2015 and will vest in full on 1 July 2018. Only Lindsley Ruth held LTIP awards made in 2015. The value on vesting of the LTIP performance award has been calculated using the share price of £6.1731 being the average share price for the last 90 days of the year and will be updated in the 2019 Annual Report based on the actual share price on the date of vesting. The figure includes a dividend equivalent payment of £143,506 in respect of the shares vesting.
4. Each of the Directors received the amounts shown above (20% of base salary) as a cash supplement in lieu of pension.5. On 22 June 2016, David Egan was granted 13,100 SAYE options; the value of SAYE options is £7,336 (i.e. the 20% discount of the share price used at grant, multiplied by the number of
options granted).

72 Annual Report and Accounts for the year ended 31 March 2018 Electrocomponents plc
DIRECTORS’ REMUNERATION REPORT CONTINUED
Single figure for total remuneration for Non-Executive Directors (audited)For the year ended 31 March 2018, the Chairman’s fee was £220,000 per annum. The Non-Executive Directors received base fees of £50,000 per annum. Paul Hollingworth (up until 20 July 2017) and Louisa Burdett (thereafter), as Chair of the Audit Committee, and John Pattullo, as Chairman of the Remuneration Committee, each received an additional fee of £10,000 per annum. John Pattullo received additional fees of £7,500 per annum for his responsibilities as Senior Independent Director.
The table below sets out a single figure for the total remuneration received by each Non-Executive Director for the year ended 31 March 2018 and the prior year:
Total fee
2018£
2017£
Peter Johnson 220,000 190,000
Bertrand Bodson 50,000 50,000
Louisa Burdett1 58,333 8,333
Karen Guerra 50,000 50,000
Paul Hollingworth2 16,859 60,000
John Pattullo 67,500 65,000
Simon Pryce 50,000 25,000
1. Louisa Burdett took over the role as Audit Committee Chair on 20 July 2017. 2. Paul Hollingworth ceased to be a Director on 20 July 2017.
Incentive outcomes for the year ended 31 March 2018 (audited)Annual bonus in respect of performance for the year ended 31 March 2018 The performance measures attached to the 2018 annual bonus plan were revenue growth (weighted 30%), adjusted PBT (30%), adjusted free cash flow (20%) and RS NPS (20%). Target performance was calibrated to deliver a bonus of 75% of salary for the Executive Directors, with bonus payments worth up to 150% of salary for achieving stretch performance targets.
Based on the Group’s performance in the year ended 31 March 2018, against targets set at the start of the year for each performance measure, the Committee confirmed a bonus outcome of 90.1% of maximum for each of the Executive Directors. Full details of the target ranges and performance against each of the metrics, are as follows:
Measure and weightingPerformance
level
Payout(% of
max bonus) TargetActual
performanceEarned bonus
(% of max)
Revenue growth (30% weighting) (excluding the effects of changes in exchange rates but not adjusted for the impact of trading days)
Threshold 0% 2.4% 11.2% 100%
Target 15% 4.4%
Maximum 30% 6.5%
Adjusted PBT (30% weighting) Threshold 0% £137.6m £173.1m 100%
Target 15% £148.0m
Maximum 30% £158.3m
Adjusted free cash flow (20% weighting) Threshold 0% £96.8m £105.1m 64.9%
Target 10% £103.2m
Maximum 20% £109.6m
RS NPS (20% weighting) Threshold 0% 42.1 45.7 85.7%
Target 10% 44.2
Maximum 20% 46.3
Total 90.1%
Cash flow targets were adjusted to reflect an unanticipated change in working capital practices / policies during the year in order to ensure the targets retained the same degree of difficulty as when they were originally set.
One-third of the annual bonus award will be deferred into shares under the DSBP which vest on the second anniversary of grant subject, normally, to continued employment. The deferred shares have not been awarded at the date of this Report. The number of deferred shares awarded, the date of award and the share price used will be disclosed in next year’s Annual Report on Remuneration.
ANNUAL REPORT ON REMUNERATIONCONTINUED
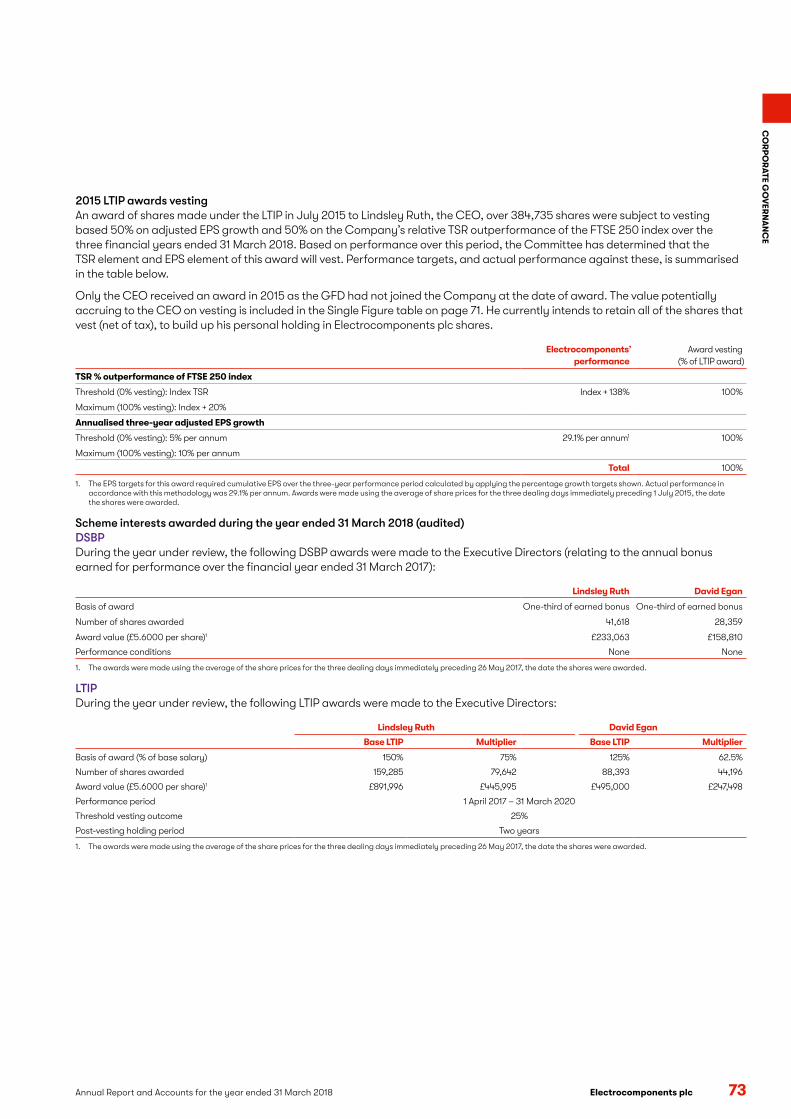
CO
RP
OR
ATE G
OV
ERN
AN
CE
Electrocomponents plcAnnual Report and Accounts for the year ended 31 March 2018 73
2015 LTIP awards vesting An award of shares made under the LTIP in July 2015 to Lindsley Ruth, the CEO, over 384,735 shares were subject to vesting based 50% on adjusted EPS growth and 50% on the Company’s relative TSR outperformance of the FTSE 250 index over the three financial years ended 31 March 2018. Based on performance over this period, the Committee has determined that the TSR element and EPS element of this award will vest. Performance targets, and actual performance against these, is summarised in the table below.
Only the CEO received an award in 2015 as the GFD had not joined the Company at the date of award. The value potentially accruing to the CEO on vesting is included in the Single Figure table on page 71. He currently intends to retain all of the shares that vest (net of tax), to build up his personal holding in Electrocomponents plc shares.
Electrocomponents’performance
Award vesting(% of LTIP award)
TSR % outperformance of FTSE 250 index
Threshold (0% vesting): Index TSR Index + 138% 100%
Maximum (100% vesting): Index + 20%
Annualised three-year adjusted EPS growth
Threshold (0% vesting): 5% per annum 29.1% per annum1 100%
Maximum (100% vesting): 10% per annum
Total 100%
1. The EPS targets for this award required cumulative EPS over the three-year performance period calculated by applying the percentage growth targets shown. Actual performance in accordance with this methodology was 29.1% per annum. Awards were made using the average of share prices for the three dealing days immediately preceding 1 July 2015, the date the shares were awarded.
Scheme interests awarded during the year ended 31 March 2018 (audited)DSBPDuring the year under review, the following DSBP awards were made to the Executive Directors (relating to the annual bonus earned for performance over the financial year ended 31 March 2017):
Lindsley Ruth David Egan
Basis of award One-third of earned bonus One-third of earned bonus
Number of shares awarded 41,618 28,359
Award value (£5.6000 per share)1 £233,063 £158,810
Performance conditions None None
1. The awards were made using the average of the share prices for the three dealing days immediately preceding 26 May 2017, the date the shares were awarded.
LTIPDuring the year under review, the following LTIP awards were made to the Executive Directors:
Lindsley Ruth David Egan
Base LTIP Multiplier Base LTIP Multiplier
Basis of award (% of base salary) 150% 75% 125% 62.5%
Number of shares awarded 159,285 79,642 88,393 44,196
Award value (£5.6000 per share)1 £891,996 £445,995 £495,000 £247,498
Performance period 1 April 2017 – 31 March 2020
Threshold vesting outcome 25%
Post-vesting holding period Two years
1. The awards were made using the average of the share prices for the three dealing days immediately preceding 26 May 2017, the date the shares were awarded.

74 Annual Report and Accounts for the year ended 31 March 2018 Electrocomponents plc
DIRECTORS’ REMUNERATION REPORT CONTINUED
The performance conditions were as follows:
Base LTIP targets Multiplier targets
Weight
Threshold(25% of
base)
Maximum(100% of
base) Measure
Threshold(1x base vesting)
Maximum(1.5x base
vesting)
Adjusted EPS (cumulative FY18, FY19, FY20) 50% 71p 80p The vesting outcome
under the Base LTIP is multiplied by up to 1.5 times based on performance
against the Multiplier EPS targets.
TSR (vs Industrial / Electronics peer group)1 25% Median
Upper quartile
Adjusted EPS (cumulative
FY18, FY19, FY 20)83p 88p
ROCE (average over FY18, FY19, FY20) 25% 20% 24%
Straight-line vesting between points (Base LTIP and Multiplier). 1. Comprises Acal, Bodycote, DCC, Dialight, Diploma, Essentra, Fenner, Ferguson (previously Wolseley), Goodwin, Grafton Group UTS, Halma, Hill & Smith, Howden Joinery GP, IMI, Luceco,
Morgan Advanced Material, Oxford Instruments, Porvair, Renishaw, Renold, Rotork, Severfield, SIG, Spectris, Spirax-Sarco Engr, Travis Perkins, Trifast, TT Electronics, Weir Group, Xaar, XP Power (DI). The TSR group contains all companies from the Electrical and Electronic Equipment, Industrial Machinery and Industrial Suppliers sectors of the FTSE All Share.
SAYEDuring the year under review, no SAYE awards were granted to the Executive Directors.
Total pension entitlements (audited)Lindsley Ruth and David Egan are able to participate in the Defined Contribution section of the Scheme. Both have chosen to take a cash allowance of 20% of base salary instead, the value of which is captured in the single figure for total remuneration table on page 71.
Payments to past Directors (audited)There were no payments to past Directors during the year.
External appointments in the yearNeither of the Executive Directors held external roles during the financial year.
Percentage change in remuneration for the CEO The table below shows the percentage change in the annual cash remuneration of the CEO (comprising base salary, the value of taxable benefits and earned annual bonus), as disclosed in the single figure for total remuneration (table on page 71) from the prior year compared with the average percentage change for the members of our Management Team. This group is considered most representative as similarity of remuneration structures facilitates a more meaningful comparison than considering all employees as a whole. To ensure a consistent like-for-like comparison, only those employed and eligible over both periods (267 managers) have been included in this calculation.
CEO Management Team
change 2017-2018
change 2017-2018
Base salary1 4.8% 6.7%
Taxable benefits2 (3.9)% 4.0%
Annual bonus3 14.9% 45.0%
1. A salary increase averaging 3.05% across the Group was awarded at the annual pay review effective 1 June 2017.2. The reduction in the taxable benefits for Lindsley Ruth is as a result of moving from a company car to a car cash allowance. The increase for the Management Team is driven by medical
plan inflation.3. Whilst the annual bonus outcomes are similar between 2017 and 2018, the large increase for the Management Team is caused by a high number of recently hired members receiving their
first full-year bonus, rather than a pro rata bonus in the prior year.
ANNUAL REPORT ON REMUNERATIONCONTINUED

CO
RP
OR
ATE G
OV
ERN
AN
CE
Electrocomponents plcAnnual Report and Accounts for the year ended 31 March 2018 75
Relative importance of spend on payThe graphs below show Electrocomponents’ shareholder distributions (i.e. dividends) and expenditure on total employee pay for the year under review and the prior year, and the percentage change year on year.
The total employee pay expenditure figures above include labour exit costs set out in Note 7 on page 101.
Performance graph and tableThe following graph shows the nine-year TSR performance of the Company relative to the FTSE All Share and the FTSE 250 Indices. The FTSE All Share and FTSE 250 are broad equity market indices of which Electrocomponents is a member. The table below details the CEO’s single figure of remuneration over the same period.
Total shareholder return (TSR)(Value of £100 invested on 31 March 2009)
Electrocomponents FTSE 250 FTSE All Share
2009 2010 2011 2012 2013 2014 2015 2016 2017 2018
100
200
300
400
500
600
700
800
CEO single figure ofremuneration (£000)
Year ended 31 March
2010
Year ended 31 March
2011
Year ended 31 March
2012
Year ended 31 March
2013
Year ended 31 March
2014
Year ended 31 March
2015
Year ended 31 March
2016
Year ended 31 March
2017
Year ended31 March
2018
Ian Mason Ian Mason Ian Mason Ian Mason Ian Mason Ian MasonLindsley
RuthLindsley
RuthLindsley
Ruth
CEO total remuneration 1,472 1,862 1,176 1,223 1,287 891 2,072 1,401 4,056
Annual bonus award (as a % of maximum opportunity) 74.1% 100.0% 28.2% 3.7% 89.1% 16.9% 23.8% 82.5% 90.1%
LTIP vesting (as a % of maximum opportunity) 21.4% 50.0% 20.5% 55.5% 0% 0% N/A N/A 100%
55.451.7
2017 2018
282.5
244.5
2017 2018
Dividend (£ millions)
7.2%Total employee pay expenditure (£ millions)
15.5%

76 Annual Report and Accounts for the year ended 31 March 2018 Electrocomponents plc
DIRECTORS’ REMUNERATION REPORT CONTINUED
Directors’ shareholdings (audited)The interests of the Directors and their connected persons in the Company’s ordinary shares are shown below, together with total share awards and share options and information on whether the Executive Directors had met their shareholding requirements at 31 March 2018. For Paul Hollingworth, this information is given to 20 July 2017, the date he ceased to be a Director.
Shares held Share awards held Options held
Ownedoutright
Shareholdingguideline
% base salary
Currentholding
% salaryGuideline
met?
Recruitment Award notsubject to
performance(A)
LTIP unvested,subject to
performance(B)
DSBP unvested,
not subject toperformance
(C)
SAYEunvested, butnot subject toperformance
(D)
Lindsley Ruth 155,728 200% 163% No 256,892 1,097,074 66,638 15,706
David Egan 70,000 100% 110% Yes – 408,746 29,842 13,100
Bertrand Bodson 20,000
Louisa Burdett –
Karen Guerra 29,351
Paul Hollingworth 10,000
Peter Johnson 159,400
John Pattullo 16,344
Simon Pryce 10,000
The value of the shares used to calculate whether the shareholding guideline is met is £6.1731, being the average share price over the three months to 31 March 2018. Between the year end and the date of this Report, there has been no movement in Directors’ shareholdings. Details of the scheme interests contained in columns A–D are provided in the tables below and on page 77.
Directors’ share scheme interests (audited) Share awards
Scheme NotesDate of Award
Sharesawarded at 1 April 2017
Awardedduring
the year
Vested during
the year
Lapsed during
the year
Sharesawarded at
31 March 2018 Normal
vesting date
Lindsley Ruth LTIP 1 1 Jul 15 384,735 – – – 384,735 1 Jul 18
20 Jul 16 473,412 – – – 473,412 20 Jul 19
26 May 17 – 238,927 – – 238,927 26 May 20
DSBP 2 17 Jun 16 25,020 – – – 25,020 17 Jun 18
26 May 17 – 41,618 – – 41,618 26 May 19
RecruitmentAward
3 21 May 15 256,892 – 256,892 – – 31 Dec 17
21 May 15 256,892 – – – 256,892 31 Dec 18
Total 1,396,951 280,545 256,892 – 1,420,604
David Egan LTIP 1 20 Jul 16 276,157 – – – 276,157 20 Jul 19
26 May 17 – 132,589 – – 132,589 26 May 20
DSBP 2 17 Jun 16 1,483 – – – 1,483 17 Jun 18
26 May 17 – 28,359 – – 28,359 26 May 19
Total 277,640 160,948 – – 438,588
1. All awards made to the Executive Directors under the LTIP are subject to the performance conditions set out on page 68. The normal vesting date for the LTIP is the third anniversary of grant or such earlier date as the performance conditions are determined.
2. DSBP awards are subject to the terms set out on page 67. 3. The Recruitment Award is subject to the conditions set out in Note 8 on page 101. In December 2017 part of the Recruitment Award vested which was calculated as 256,892 shares using
a share price of £6.261 being the share price upon vesting, giving a gain of £1,608,401.
ANNUAL REPORT ON REMUNERATIONCONTINUED
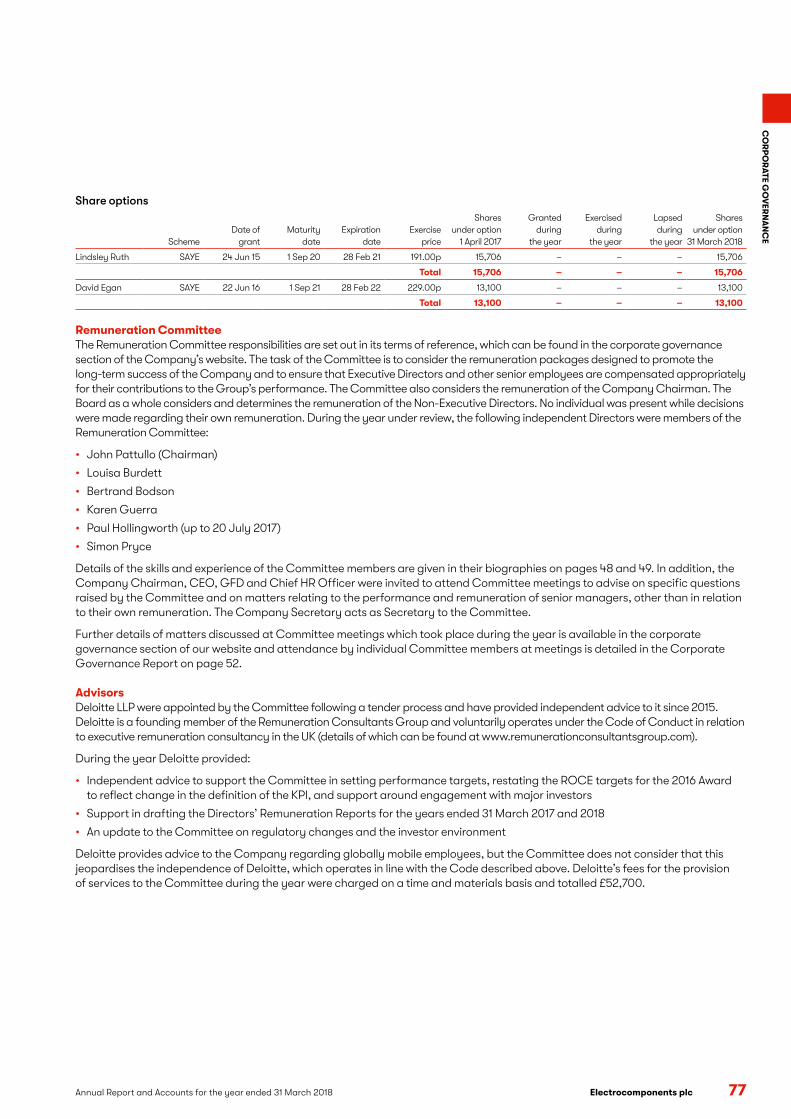
CO
RP
OR
ATE G
OV
ERN
AN
CE
Electrocomponents plcAnnual Report and Accounts for the year ended 31 March 2018 77
Share options
SchemeDate of
grant Maturity
dateExpiration
dateExercise
price
Sharesunder option
1 April 2017
Grantedduring
the year
Exercisedduring
the year
Lapsedduring
the year
Shares under option
31 March 2018
Lindsley Ruth SAYE 24 Jun 15 1 Sep 20 28 Feb 21 191.00p 15,706 – – – 15,706
Total 15,706 – – – 15,706
David Egan SAYE 22 Jun 16 1 Sep 21 28 Feb 22 229.00p 13,100 – – – 13,100
Total 13,100 – – – 13,100
Remuneration Committee The Remuneration Committee responsibilities are set out in its terms of reference, which can be found in the corporate governance section of the Company’s website. The task of the Committee is to consider the remuneration packages designed to promote the long-term success of the Company and to ensure that Executive Directors and other senior employees are compensated appropriately for their contributions to the Group’s performance. The Committee also considers the remuneration of the Company Chairman. The Board as a whole considers and determines the remuneration of the Non-Executive Directors. No individual was present while decisions were made regarding their own remuneration. During the year under review, the following independent Directors were members of the Remuneration Committee:
• John Pattullo (Chairman)
• Louisa Burdett
• Bertrand Bodson
• Karen Guerra
• Paul Hollingworth (up to 20 July 2017)
• Simon Pryce
Details of the skills and experience of the Committee members are given in their biographies on pages 48 and 49. In addition, the Company Chairman, CEO, GFD and Chief HR Officer were invited to attend Committee meetings to advise on specific questions raised by the Committee and on matters relating to the performance and remuneration of senior managers, other than in relation to their own remuneration. The Company Secretary acts as Secretary to the Committee.
Further details of matters discussed at Committee meetings which took place during the year is available in the corporate governance section of our website and attendance by individual Committee members at meetings is detailed in the Corporate Governance Report on page 52.
AdvisorsDeloitte LLP were appointed by the Committee following a tender process and have provided independent advice to it since 2015. Deloitte is a founding member of the Remuneration Consultants Group and voluntarily operates under the Code of Conduct in relation to executive remuneration consultancy in the UK (details of which can be found at www.remunerationconsultantsgroup.com).
During the year Deloitte provided:
• Independent advice to support the Committee in setting performance targets, restating the ROCE targets for the 2016 Award to reflect change in the definition of the KPI, and support around engagement with major investors
• Support in drafting the Directors’ Remuneration Reports for the years ended 31 March 2017 and 2018
• An update to the Committee on regulatory changes and the investor environment
Deloitte provides advice to the Company regarding globally mobile employees, but the Committee does not consider that this jeopardises the independence of Deloitte, which operates in line with the Code described above. Deloitte’s fees for the provision of services to the Committee during the year were charged on a time and materials basis and totalled £52,700.
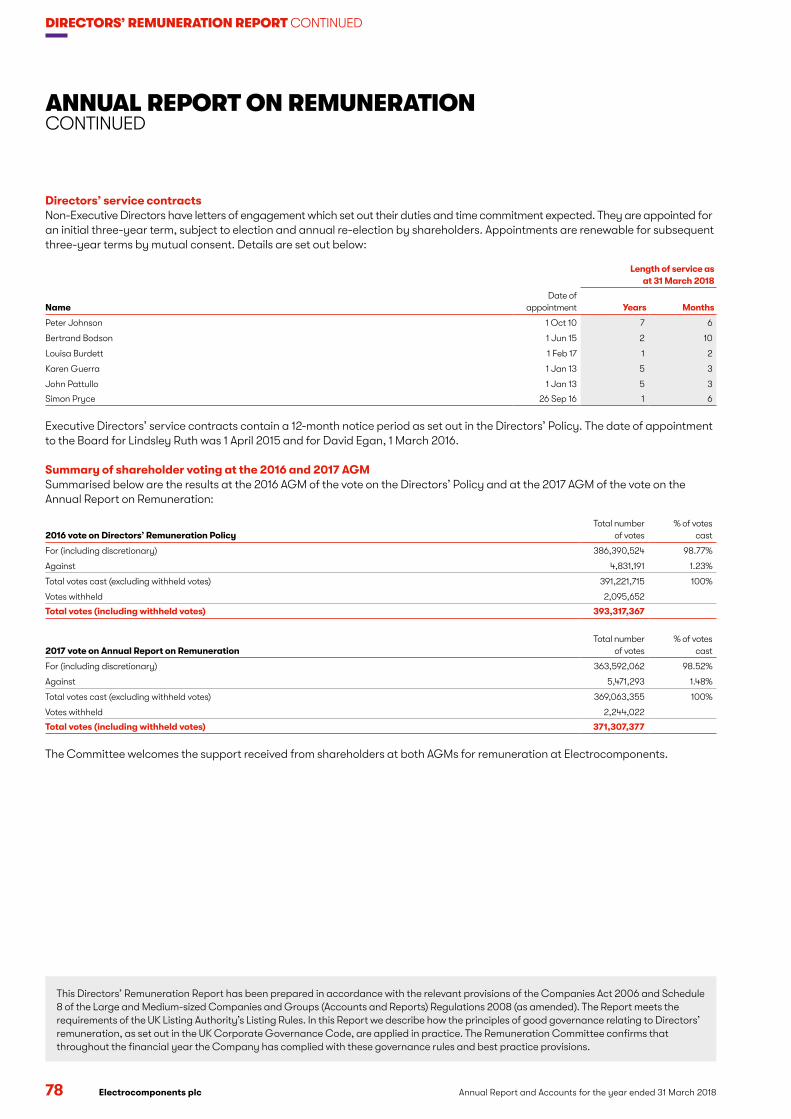
78 Annual Report and Accounts for the year ended 31 March 2018 Electrocomponents plc
DIRECTORS’ REMUNERATION REPORT CONTINUED
Directors’ service contractsNon-Executive Directors have letters of engagement which set out their duties and time commitment expected. They are appointed for an initial three-year term, subject to election and annual re-election by shareholders. Appointments are renewable for subsequent three-year terms by mutual consent. Details are set out below:
Length of service as at 31 March 2018
NameDate of
appointment Years Months
Peter Johnson 1 Oct 10 7 6
Bertrand Bodson 1 Jun 15 2 10
Louisa Burdett 1 Feb 17 1 2
Karen Guerra 1 Jan 13 5 3
John Pattullo 1 Jan 13 5 3
Simon Pryce 26 Sep 16 1 6
Executive Directors’ service contracts contain a 12-month notice period as set out in the Directors’ Policy. The date of appointment to the Board for Lindsley Ruth was 1 April 2015 and for David Egan, 1 March 2016.
Summary of shareholder voting at the 2016 and 2017 AGMSummarised below are the results at the 2016 AGM of the vote on the Directors’ Policy and at the 2017 AGM of the vote on the Annual Report on Remuneration:
2016 vote on Directors’ Remuneration PolicyTotal number
of votes% of votes
cast
For (including discretionary) 386,390,524 98.77%
Against 4,831,191 1.23%
Total votes cast (excluding withheld votes) 391,221,715 100%
Votes withheld 2,095,652
Total votes (including withheld votes) 393,317,367
2017 vote on Annual Report on RemunerationTotal number
of votes% of votes
cast
For (including discretionary) 363,592,062 98.52%
Against 5,471,293 1.48%
Total votes cast (excluding withheld votes) 369,063,355 100%
Votes withheld 2,244,022
Total votes (including withheld votes) 371,307,377
The Committee welcomes the support received from shareholders at both AGMs for remuneration at Electrocomponents.
This Directors’ Remuneration Report has been prepared in accordance with the relevant provisions of the Companies Act 2006 and Schedule 8 of the Large and Medium-sized Companies and Groups (Accounts and Reports) Regulations 2008 (as amended). The Report meets the requirements of the UK Listing Authority’s Listing Rules. In this Report we describe how the principles of good governance relating to Directors’ remuneration, as set out in the UK Corporate Governance Code, are applied in practice. The Remuneration Committee confirms that throughout the financial year the Company has complied with these governance rules and best practice provisions.
ANNUAL REPORT ON REMUNERATIONCONTINUED

CO
RP
OR
ATE G
OV
ERN
AN
CE
Electrocomponents plcAnnual Report and Accounts for the year ended 31 March 2018 79
DIRECTORS’ REPORT
The Directors present their report and the audited financial statements of Electrocomponents plc (Company) together with its subsidiary undertakings (Group) for the year ended 31 March 2018.
IntroductionThis section contains additional information which the Directors are required by law and regulation to include in the Annual Report. This section (together with the information from pages 48 to 78 and other information cross-referenced by this section which is incorporated by reference) constitutes the Directors’ Report for the purposes of the Companies Act 2006.
Management report and future developmentsThe Directors’ Report together with the Strategic Report on pages 1 to 47 form the management report for the purposes of Rule 4.1.8R of the Disclosure Guidance and Transparency Rules. The Company has chosen, in accordance with the Companies Act 2006 Section 414C(11), to include the disclosure of likely future developments in the Strategic Report.
A summary of general disclosures (incorporated in this Directors’ Report)The following information required to be disclosed in this Directors’ Report is set out on the page numbers below:
Page numbers
Likely future developments¹ 12 to 23
Policy on disability¹ 40
Employee engagement¹ 42
Greenhouse gas emissions¹ 46
Names of Directors who served during the year 48 and 49
Results 90
Details of employee share schemes 68 and 69
Subsidiary and associated undertakings and branches 121 to 123
Financial risk management (including hedging) 113 to 119
1. Information required by the Large and Medium-sized Companies and Groups (Accounts and Reports) Regulations 2008 and included in the Strategic Report.
Information required to be disclosed in accordance with Listing Rule (LR) 9.8.4R can be found in the following sections of this Annual Report:
Page numbers
LR 9.4.3 Long Term Incentive SchemesShareholder waivers of dividends
68
109
Other than as set out above, there is no further applicable information to disclose in relation to LR 9.8.4R.
A SUMMARY OF GENERAL DISCLOSURES
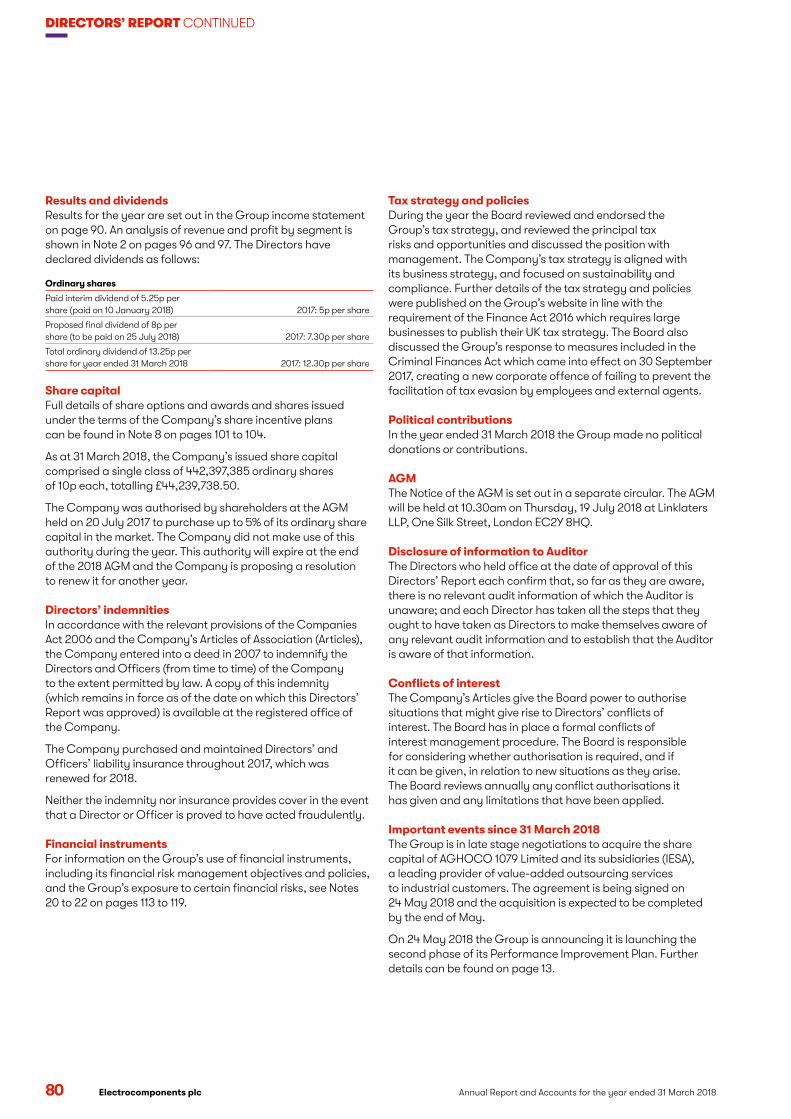
80 Annual Report and Accounts for the year ended 31 March 2018 Electrocomponents plc
DIRECTORS’ REPORT CONTINUED
Results and dividendsResults for the year are set out in the Group income statement on page 90. An analysis of revenue and profit by segment is shown in Note 2 on pages 96 and 97. The Directors have declared dividends as follows:
Ordinary shares
Paid interim dividend of 5.25p per share (paid on 10 January 2018) 2017: 5p per share
Proposed final dividend of 8p per share (to be paid on 25 July 2018) 2017: 7.30p per share
Total ordinary dividend of 13.25p per share for year ended 31 March 2018 2017: 12.30p per share
Share capitalFull details of share options and awards and shares issued under the terms of the Company’s share incentive plans can be found in Note 8 on pages 101 to 104.
As at 31 March 2018, the Company’s issued share capital comprised a single class of 442,397,385 ordinary shares of 10p each, totalling £44,239,738.50.
The Company was authorised by shareholders at the AGM held on 20 July 2017 to purchase up to 5% of its ordinary share capital in the market. The Company did not make use of this authority during the year. This authority will expire at the end of the 2018 AGM and the Company is proposing a resolution to renew it for another year.
Directors’ indemnitiesIn accordance with the relevant provisions of the Companies Act 2006 and the Company’s Articles of Association (Articles), the Company entered into a deed in 2007 to indemnify the Directors and Officers (from time to time) of the Company to the extent permitted by law. A copy of this indemnity (which remains in force as of the date on which this Directors’ Report was approved) is available at the registered office of the Company.
The Company purchased and maintained Directors’ and Officers’ liability insurance throughout 2017, which was renewed for 2018.
Neither the indemnity nor insurance provides cover in the event that a Director or Officer is proved to have acted fraudulently.
Financial instrumentsFor information on the Group’s use of financial instruments, including its financial risk management objectives and policies, and the Group’s exposure to certain financial risks, see Notes 20 to 22 on pages 113 to 119.
Tax strategy and policiesDuring the year the Board reviewed and endorsed the Group’s tax strategy, and reviewed the principal tax risks and opportunities and discussed the position with management. The Company’s tax strategy is aligned with its business strategy, and focused on sustainability and compliance. Further details of the tax strategy and policies were published on the Group’s website in line with the requirement of the Finance Act 2016 which requires large businesses to publish their UK tax strategy. The Board also discussed the Group’s response to measures included in the Criminal Finances Act which came into effect on 30 September 2017, creating a new corporate offence of failing to prevent the facilitation of tax evasion by employees and external agents.
Political contributionsIn the year ended 31 March 2018 the Group made no political donations or contributions.
AGMThe Notice of the AGM is set out in a separate circular. The AGM will be held at 10.30am on Thursday, 19 July 2018 at Linklaters LLP, One Silk Street, London EC2Y 8HQ.
Disclosure of information to AuditorThe Directors who held office at the date of approval of this Directors’ Report each confirm that, so far as they are aware, there is no relevant audit information of which the Auditor is unaware; and each Director has taken all the steps that they ought to have taken as Directors to make themselves aware of any relevant audit information and to establish that the Auditor is aware of that information.
Conflicts of interestThe Company’s Articles give the Board power to authorise situations that might give rise to Directors’ conflicts of interest. The Board has in place a formal conflicts of interest management procedure. The Board is responsible for considering whether authorisation is required, and if it can be given, in relation to new situations as they arise. The Board reviews annually any conflict authorisations it has given and any limitations that have been applied.
Important events since 31 March 2018The Group is in late stage negotiations to acquire the share capital of AGHOCO 1079 Limited and its subsidiaries (IESA), a leading provider of value-added outsourcing services to industrial customers. The agreement is being signed on 24 May 2018 and the acquisition is expected to be completed by the end of May.
On 24 May 2018 the Group is announcing it is launching the second phase of its Performance Improvement Plan. Further details can be found on page 13.

CO
RP
OR
ATE G
OV
ERN
AN
CE
Electrocomponents plcAnnual Report and Accounts for the year ended 31 March 2018 81
Deadlines for exercising voting rightsVoting rights may be exercised in person, by proxy or, in relation to corporate members, by a corporate representative. The Articles provide a deadline for submission of proxy forms of not less than 48 hours before the time appointed for the holding of the meeting or adjourned meeting.
Variation of rightsSubject to the relevant law, the Articles specify that rights attached to any class of shares may be varied with the written consent of the holders of not less than three-quarters in nominal value of the issued shares of that class, or with the sanction of a special resolution passed at a separate general meeting of the holders of those shares.
Transfer of sharesAll transfers of shares may be effected by transfer in writing in any usual or common form or in any other form acceptable to the Directors. The instrument of transfer shall be signed by or on behalf of the transferor and (except in the case of fully paid shares) by or on behalf of the transferee. Transfers of shares which are in uncertificated form are effected by means of the CREST system.
The Directors may, in the case of shares in certificated form, in their absolute discretion and without assigning any reason, refuse to register any transfer of shares (not being fully paid shares) provided that such discretion may not be exercised in such a way as to prevent dealings in the shares of that class from taking place on an open and proper basis.
The Directors may also refuse to register an allotment or transfer of shares (whether fully paid or not) in favour of more than four persons jointly. If the Directors refuse to register an allotment or transfer they shall, within two months after the date on which the letter of allotment or transfer was lodged with the Company, send to the allottee or transferee a notice of the refusal.
Subject to statutes and applicable CREST rules, the Directors may determine that any class of shares may be held in uncertificated form and that title to such shares may be transferred by means of the CREST system or that shares of any class should cease to be so held and transferred.
A shareholder does not need to obtain the approval of the Company, or of other shareholders of shares in the Company, for a transfer of shares to take place.
A summary of certain provisions of the Company’s current Articles and applicable English law concerning UK companies (the Companies Act 2006 (Companies Act)) is set out below. This is a summary only and the relevant provisions of the Articles or the Companies Act should be consulted if further information is required.
Dividends and distributionsSubject to the provisions of the Companies Act, the Company may, by ordinary resolution from time to time, declare dividends not exceeding the amount recommended by the Board. The Board may pay interim dividends whenever the financial position of the Company, in the opinion of the Board, justifies such payment. The Board may withhold payment of all or part of any dividends or other monies payable in respect of the Company’s shares from a person with a 0.25% interest (as defined in the Articles) if such a person has been served with a notice after failure to provide the Company with information concerning their interest in those shares required to be provided under the Companies Act.
Voting rightsSubject to any special rights or restrictions attaching to any class of shares, at a general meeting, every member present in person and every duly appointed proxy has, upon a show of hands, one vote, and on a poll every member who is present in person or by proxy has one vote for each share. In the case of joint holders of a share, the vote of the senior holder who tenders a vote, whether in person or by proxy, shall be accepted to the exclusion of the votes of the other joint holders. For this purpose seniority shall be determined by the order in which the names stand in the Register of Members in respect of the shares.
Restrictions on votingNo member shall be entitled to vote either in person or by proxy at any general meeting or class meeting in respect of any shares held by him if any call or other sum then payable by him in respect of that share remains unpaid. In addition, no member shall be entitled to vote if he has been served with a notice after failure to provide the Company with information concerning interests in those shares required to be provided under the Companies Act.
Substantial shareholdersIn accordance with the Financial Conduct Authority’s Listing and Disclosure and Transparency Rules, the Company has been notified of the following interests in the voting rights of the Company:
As at 31 March 2018 As at the date of this report
Number ofshares
Percentage held
Number ofshares
Percentage held
Columbia Threadneedle Investments 69,179.307 15.64 68,536,955 15.64
Majedie Asset Management 32,732,344 7.40 32,683,818 7.40
Silchester International Investors 30,528,291 6.90 30,023,009 6.90
Old Mutual Global Investors 20,620,537 4.66 20,111,236 4.66
M&G Investment Management 18,921,931 4.28 19,781,434 4.28
82 Annual Report and Accounts for the year ended 31 March 2018 Electrocomponents plc
DIRECTORS’ REPORT CONTINUED
Appointment and replacement of DirectorsDirectors shall be no less than three and no more than 12 in number. A Director is not required to hold any shares of the Company by way of qualification. The Company may by ordinary resolution increase or reduce the maximum or minimum number of Directors.
Any Director who was elected or last re-elected a Director at or before the AGM held in the third calendar year before the current calendar year shall retire by rotation. In addition, each Director (other than the Chairman and any Director holding an executive office) shall retire at each AGM following the ninth anniversary of the date on which they were elected.
A retiring Director is eligible for re-election.
The Board may appoint any person to be a Director (so long as the total number of Directors does not exceed the limit prescribed in the Articles). Any such Director shall hold office only until the next AGM and shall then be eligible for re-election.
Powers of the DirectorsSubject to the Articles, the Companies Act and any directions given by special resolution, the business of the Company will be managed by the Board, who may exercise all the powers of the Company.
The Board may exercise all the powers of the Company to borrow money and to mortgage or charge any of its undertaking, property and uncalled capital and to issue debentures and other securities, whether outright or as collateral security for any debt, liability or obligation of the Company or of any third party.
Significant agreements: change of controlAll of the Company’s share plans contain provisions relating to a change of control. Outstanding awards and options would normally vest and become exercisable on a change of control, subject to the satisfaction of any performance conditions at that time. There are no other significant agreements that take effect upon a change of control.
Amendment of Articles of AssociationAny amendments to the Articles of the Company may be made in accordance with the provisions of the Companies Act by way of special resolution.
Gender pay gap reporting We published our first set of gender pay information in March 2018 as required by law. Our median base pay gap was 29%. The data revealed two factors heavily influencing the gap. These influences were that our highest paid roles are mainly filled by men and we have an occupational segregation issue, with men clustered in roles such as innovation which command high pay premiums in the market, whilst women are typically clustered in support functions, which tend not to attract similar premiums. Whilst we have been seeking to recruit more women into senior roles and have made progress with two female Senior Management Team hires in the last two years, we have further progress to make.
We will be taking actions to create a more diverse and inclusive place to work and reduce our gender pay gap over time. Specific actions in the short term include:
• Analyse employee data and employee feedback to best understand the current state of gender diversity across the organisation and the perceived barriers to the advancement of women
• Introduce initatives to help break down those barriers
• Continue to focus on recruiting and retaining women in senior and critical roles
• Support Working for Women communities across locations to drive change at all levels
We recognise that progress will inevitably be gradual, however, improving diversity and inclusiveness will remain a business key priority.
The Directors’ Report was approved by the Board on 23 May 2018 and signed on its behalf by:
Ian HaslegraveGeneral Counsel and Company Secretary
CO
RP
OR
ATE G
OV
ERN
AN
CE
Electrocomponents plcAnnual Report and Accounts for the year ended 31 March 2018 83
STATEMENT OF DIRECTORS’ RESPONSIBILITIES
The Directors are responsible for preparing the Annual Report and Accounts in accordance with applicable law and regulation.
Company law requires the Directors to prepare accounts for each financial year. Under that law the Directors have prepared the Group accounts in accordance with International Financial Reporting Standards (IFRS) as adopted by the European Union and Company accounts in accordance with United Kingdom Generally Accepted Accounting Practice (United Kingdom Accounting Standards, comprising FRS 102 ‘The Financial Reporting Standard applicable in the UK and Republic of Ireland’, and applicable law). Under company law the Directors must not approve the accounts unless they are satisfied that they give a true and fair view of the state of affairs of the Group and Company and of the profit or loss of the Group and Company for that period. In preparing the accounts, the Directors are required to:
• select suitable accounting policies and then apply them consistently
• state whether applicable IFRS as adopted by the European Union have been followed for the Group accounts and United Kingdom Accounting Standards, comprising FRS 102, have been followed for the Company accounts, subject to any material departures disclosed and explained in the accounts
• make judgements and accounting estimates that are reasonable and prudent and
• prepare the accounts on the going concern basis unless it is inappropriate to presume that the Group and Company will continue in business.
The Directors are responsible for keeping adequate accounting records that are sufficient to show and explain the Group and Company’s transactions and disclose with reasonable accuracy at any time the financial position of the Group and Company and enable them to ensure that the accounts and the Directors’ Remuneration Report comply with the Companies Act 2006 and, as regards the Group accounts, Article 4 of the IAS Regulation.
The Directors are also responsible for safeguarding the assets of the Group and Company and hence for taking reasonable steps for the prevention and detection of fraud and other irregularities.
The Directors are responsible for the maintenance and integrity of the Company’s website. Legislation in the United Kingdom governing the preparation and dissemination of accounts may differ from legislation in other jurisdictions.
The Directors consider that the Annual Report and Accounts, taken as a whole, are fair, balanced and understandable and provide the information necessary for shareholders to assess the Group and Company’s position and performance, business model and strategy.
Each of the Directors, whose names and functions are listed on pages 48 and 49 confirm that, to the best of their knowledge:
• the Company accounts, which have been prepared in accordance with United Kingdom Generally Accepted Accounting Practice (United Kingdom Accounting Standards, comprising FRS 102 ‘The Financial Reporting Standard applicable in the UK and Republic of Ireland’, and applicable law), give a true and fair view of the assets, liabilities, financial position and profit / loss of the Company
• the Group accounts, which have been prepared in accordance with IFRS as adopted by the European Union, give a true and fair view of the assets, liabilities, financial position and profit of the Group and
• the Strategic Report includes a fair review of the development and performance of the business and the position of the Group and Company, together with a description of the principal risks and uncertainties that it faces.
In the case of each Director in office at the date the Directors’ Report is approved:
• so far as the Director is aware, there is no relevant audit information of which the Group and Company’s Auditors are unaware and
• they have taken all the steps that they ought to have taken as a Director in order to make themselves aware of any relevant audit information and to establish that the Group and Company’s Auditors are aware of that information.
By order of the Board:
Lindsley Ruth David EganChief Executive Officer Group Finance Director
RESPONSIBILITY OF DIRECTORS FOR ANNUAL REPORT AND ACCOUNTS

84 Annual Report and Accounts for the year ended 31 March 2018 Electrocomponents plc
INDEPENDENT AUDITORS’ REPORT
INDEPENDENT AUDITORS’ REPORT TO THE MEMBERS OF ELECTROCOMPONENTS PLCReport on the audit of the financial statementsOpinionIn our opinion:
• Electrocomponents plc’s Group accounts and Company accounts (the “financial statements”) give a true and fair view of the state of the Group’s and of the Company’s affairs as at 31 March 2018 and of the Group’s profit and cash flows for the year then ended;
• the Group accounts have been properly prepared in accordance with IFRSs as adopted by the European Union;
• the Company accounts have been properly prepared in accordance with United Kingdom Generally Accepted Accounting Practice (United Kingdom Accounting Standards, comprising FRS 102 “The Financial Reporting Standard applicable in the UK and Republic of Ireland”, and applicable law); and
• the financial statements have been prepared in accordance with the requirements of the Companies Act 2006 and, as regards the Group accounts, Article 4 of the IAS Regulation.
We have audited the financial statements, included within the Annual Report and Accounts for the year ended 31 March 2018 (the “Annual Report”), which comprise: the Group and Company balance sheets as at 31 March 2018; the Group income statement and Group statement of comprehensive income, the Group cash flow statement, and the Group and Company statements of changes in equity for the year then ended; and the notes to the financial statements, which include a description of the significant accounting policies.
Our opinion is consistent with our reporting to the Audit Committee.
Basis for opinionWe conducted our audit in accordance with International Standards on Auditing (UK) (“ISAs (UK)”) and applicable law. Our responsibilities under ISAs (UK) are further described in the Auditors’ responsibilities for the audit of the financial statements section of our report. We believe that the audit evidence we have obtained is sufficient and appropriate to provide a basis for our opinion.
IndependenceWe remained independent of the Group in accordance with the ethical requirements that are relevant to our audit of the financial statements in the UK, which includes the FRC’s Ethical Standard, as applicable to listed public interest entities, and we have fulfilled our other ethical responsibilities in accordance with these requirements.
During the period, we identified that an overseas network firm had provided assistance with the preparation of the 2017 statutory financial statements of an immaterial subsidiary that did not form part of our audit evidence for the Group audit which is prohibited by paragraph 5.173R of the FRC Ethical Standard. This service is no longer being provided. We confirm that based on our assessment of this breach we have not, in our view, compromised our independence.
Other than the matter referred to above, and to the best of our knowledge and belief, we declare that non-audit services prohibited by the FRC’s Ethical Standard were not provided to the Group or the Company.
Other than those disclosed in the Audit Committee Report, we have provided no non-audit services to the Group or the Company in the period from 1 April 2017 to 31 March 2018.
FINA
NC
IAL S
TATEM
ENT
S
Electrocomponents plcAnnual Report and Accounts for the year ended 31 March 2018 85
Our audit approachOverview
Materiality
Audit scope
Key audit matters
• Overall Group materiality: £8.65 million (2017: £6.4 million), based on 5% of Group profit before tax adjusted for substantial reorganisation costs.
• Overall Company materiality: £0.90 million (2017: £1.2 million), based on 0.5% of net assets.
• We identified 7 reporting units which, in our view, required a full scope audit based on their size or risk.
• We used component teams in 6 countries to perform full scope audits, with the Group team performing the remainder.
• The Group consolidation, financial statement disclosures and a number of complex items (including tax and inventory provisioning) prepared by the head office finance function, were audited by the Group engagement team.
• The Group engagement team visited the 2 financially significant component audit teams (being the UK and US) to discuss the audit approach and findings with those local teams. For those countries not visited we maintained regular contact with the local team and evaluated the outcome of their audit work.
• The components that are part of our audit scope as set out above account for 79% of Group revenue and 92% of Group profit before tax and substantial reorganisation costs.
Key audit matters were:
• Inventory obsolescence provision (Group).
• Tax provisioning (Group).
• Revenue cut off (Group).
The scope of our auditAs part of designing our audit, we determined materiality and assessed the risks of material misstatement in the financial statements. In particular, we looked at where the directors made subjective judgements, for example in respect of significant accounting estimates that involved making assumptions and considering future events that are inherently uncertain.
We gained an understanding of the legal and regulatory framework applicable to the Group and the industry in which it operates, and considered the risk of acts by the Group which were contrary to applicable laws and regulations, including fraud. We designed audit procedures at a Group and significant component level to respond to the risk, recognising that the risk of not detecting a material misstatement due to fraud is higher than the risk of not detecting one resulting from error, as fraud may involve deliberate concealment by, for example, forgery or intentional misrepresentations, or through collusion. We focused on laws and regulations that could give rise to a material misstatement in the Group and Company financial statements, including, but not limited to, Companies Act 2016, the Listing Rules, Pensions legislation, UK and other relevant tax legislation. Our tests included, but were not limited to, review of the financial statement disclosures to underlying supporting documentation, review of correspondence with legal and tax advisors, review of minutes, enquiries of management, review of significant components auditors’ work, correspondence from non-significant components and review of internal audit reports in so far as they related to the financial statements. There are inherent limitations in the audit procedures described above and the further removed non-compliance with laws and regulations is from the events and transactions reflected in the financial statements, the less likely we would become aware of it.
We did not identify any key audit matters relating to irregularities, including fraud. As in all of our audits we also addressed the risk of management override of internal controls, including testing journals and evaluating whether there was evidence of bias by the directors that represented a risk of material misstatement due to fraud.
Key audit mattersKey audit matters are those matters that, in the auditors’ professional judgement, were of most significance in the audit of the financial statements of the current period and include the most significant assessed risks of material misstatement (whether or not due to fraud) identified by the auditors, including those which had the greatest effect on: the overall audit strategy; the allocation of resources in the audit; and directing the efforts of the engagement team. These matters, and any comments we make on the results of our procedures thereon, were addressed in the context of our audit of the financial statements as a whole, and in forming our opinion thereon, and we do not provide a separate opinion on these matters. This is not a complete list of all risks identified by our audit.
86 Annual Report and Accounts for the year ended 31 March 2018 Electrocomponents plc
INDEPENDENT AUDITORS’ REPORT CONTINUED
Key audit matter How our audit addressed the key audit matter
Inventory obsolescence provision (Group)Refer to page 58 (Audit Committee Report), page 112 (Note 17 Inventories) and page 94 (Note 1 Basis of preparation).
The balance of gross inventories at 31 March 2018 was £359.3 million, against which a provision of £28.3 million was held.
The valuation of the inventory provision was a focus of our audit for the following reasons:
• Electrocomponents’ business model is based on having the broadest range in the industry and delivering products on time, often next day. This results in large quantities of inventory comprising many different types of product, being held for long periods of time which raises the risk of inventory obsolescence.
• There is uncertainty about the impact of product life cycles, the value recoverable from any excess inventory, and future sales levels which require management to make assumptions based on historic trends.
The inventory provision is calculated within the Group’s accounting systems using an automated process. Where necessary manual overlays are applied to this provision to account for unusual circumstances that may have arisen during the year.
We updated our understanding of the inventory provisioning methodology and how it is applied. We assessed the completeness of the data used by the system to calculate the provision by agreeing the sub-ledger to the general ledger. We recalculated the provision to ensure mathematical accuracy. We noted no material exceptions.
We assessed the reasonableness of management’s judgement regarding the obsolescence percentages applied and expected future sales levels by comparing these assumptions to historical write-offs and historical sales. We found the assumptions to be reasonable.
We also assessed the reasonableness of the product life cycles by comparing these against historical life cycles of similar products. We noted no material exceptions.
We tested manual overlays to the automated calculation by understanding the market-specific considerations behind the adjustments and whether there was a right of return under the contractual arrangements. We noted no material exceptions.
Tax provisioning (Group)Refer to page 58 (Audit Committee Report), page 94 (Note 1 Basis of preparation) and page 108 (Note 10 Taxation).
Due to the Group operating across a number of different tax jurisdictions it is subject to periodic challenges by local tax authorities on a range of tax matters during the normal course of business. These challenges include transaction related tax matters, financing and transfer pricing arrangements arising from centralised functions that drive value across a number of different countries.
The Group continues to provide for uncertain tax positions in respect of transfer pricing and other matters. The provision is based on the estimates of the potential outcome of audits by tax authorities in jurisdictions in which the Group operates and totals £7.8 million.
We updated our detailed understanding of the Group’s tax strategy and Group transfer pricing policy, considering whether any changes have been implemented during the year.
Management commissioned a study by the Group’s external advisors specifically to consider transfer pricing when the current policy was implemented in 2017. We have reassessed this for developments and note that it remains consistent with the conclusions reached by our own transfer pricing specialists. We have also considered the position on transfer pricing with respect to entities outside the Group’s transfer pricing policy.
We assessed key country technical tax issues and risks related to the business and legislative developments using, where applicable, our local and international tax specialists. We also considered any new developments in the application of these laws based on our knowledge of tax legislation and the current position adopted by tax authorities on similar matters. We further performed analysis on the provisions to assess the risk that challenge on transfer pricing could arise from opposing territories.
Where individual countries’ tax authorities have either started enquiries or concluded on the Group’s tax position in key jurisdictions we have reviewed the associated correspondence and utilised our own specialists to assess the accuracy of management’s estimates, including discussions directly with management’s local advisors to corroborate the likely impact.
We also considered the impact of audits which have been concluded during the year on the level of provisions to assess the accuracy of management’s estimates of potential tax exposures. We found management’s judgements on likely exposure and overall position to be supportable.
We also evaluated whether the liabilities and potential exposures were appropriately disclosed in the financial statements.
Revenue cut off (Group)Refer to page 100 (Note 4 Revenue recognition).
The Group’s accounting systems recognise revenue at the point that goods are dispatched. This reflects the fact that the terms and conditions are such that the risks and rewards have passed to the customer or that the majority of goods have a guaranteed next day delivery and so the year on year impact is not material.
Our work identified that the shipping terms are different across the Group and therefore the risks and rewards do not always pass to the customer on dispatch.
We have assessed differences between the date of revenue recognition and the transfer of risks and rewards through understanding the terms of shipment and the associated lead times for delivery to the customer. We tested a sample of revenue transactions during the period and around the year end, and also considered the value and nature of the transactions at the prior year end. Based on our audit procedures we noted no material exceptions.
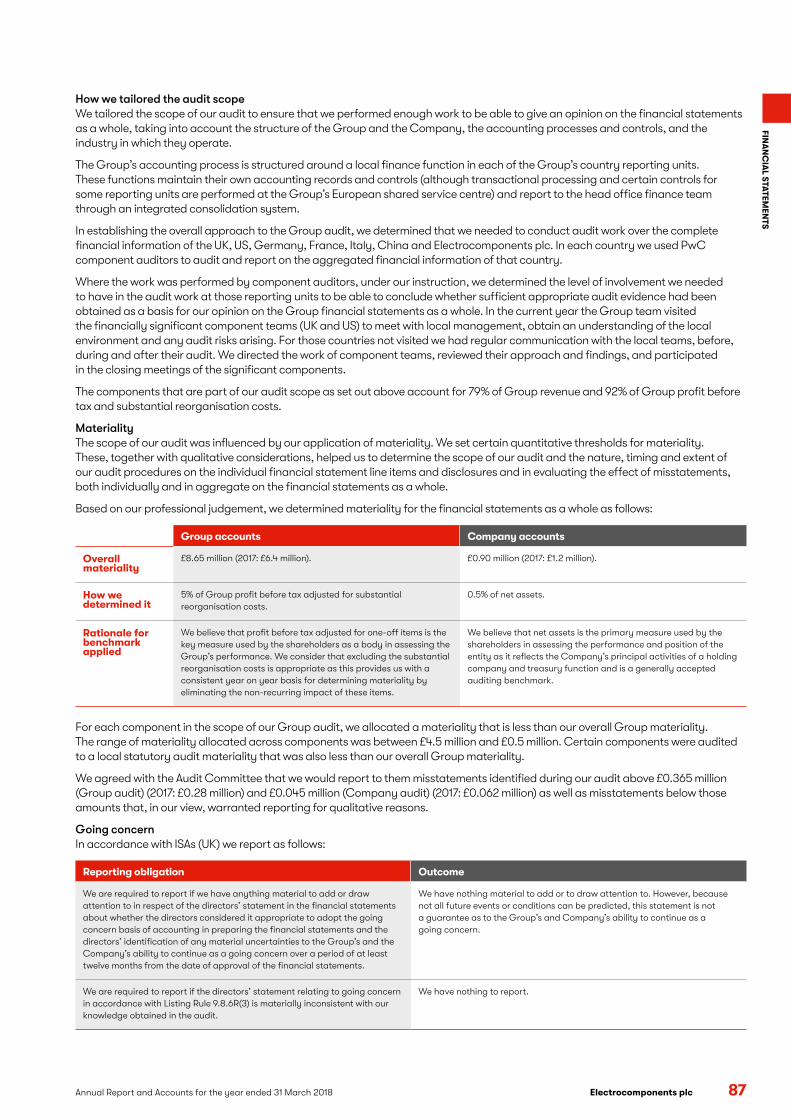
FINA
NC
IAL S
TATEM
ENT
S
Electrocomponents plcAnnual Report and Accounts for the year ended 31 March 2018 87
How we tailored the audit scopeWe tailored the scope of our audit to ensure that we performed enough work to be able to give an opinion on the financial statements as a whole, taking into account the structure of the Group and the Company, the accounting processes and controls, and the industry in which they operate.
The Group’s accounting process is structured around a local finance function in each of the Group’s country reporting units. These functions maintain their own accounting records and controls (although transactional processing and certain controls for some reporting units are performed at the Group’s European shared service centre) and report to the head office finance team through an integrated consolidation system.
In establishing the overall approach to the Group audit, we determined that we needed to conduct audit work over the complete financial information of the UK, US, Germany, France, Italy, China and Electrocomponents plc. In each country we used PwC component auditors to audit and report on the aggregated financial information of that country.
Where the work was performed by component auditors, under our instruction, we determined the level of involvement we needed to have in the audit work at those reporting units to be able to conclude whether sufficient appropriate audit evidence had been obtained as a basis for our opinion on the Group financial statements as a whole. In the current year the Group team visited the financially significant component teams (UK and US) to meet with local management, obtain an understanding of the local environment and any audit risks arising. For those countries not visited we had regular communication with the local teams, before, during and after their audit. We directed the work of component teams, reviewed their approach and findings, and participated in the closing meetings of the significant components.
The components that are part of our audit scope as set out above account for 79% of Group revenue and 92% of Group profit before tax and substantial reorganisation costs.
MaterialityThe scope of our audit was influenced by our application of materiality. We set certain quantitative thresholds for materiality. These, together with qualitative considerations, helped us to determine the scope of our audit and the nature, timing and extent of our audit procedures on the individual financial statement line items and disclosures and in evaluating the effect of misstatements, both individually and in aggregate on the financial statements as a whole.
Based on our professional judgement, we determined materiality for the financial statements as a whole as follows:
Group accounts Company accounts
Overall materiality
£8.65 million (2017: £6.4 million). £0.90 million (2017: £1.2 million).
How we determined it
5% of Group profit before tax adjusted for substantial reorganisation costs.
0.5% of net assets.
Rationale for benchmark applied
We believe that profit before tax adjusted for one-off items is the key measure used by the shareholders as a body in assessing the Group’s performance. We consider that excluding the substantial reorganisation costs is appropriate as this provides us with a consistent year on year basis for determining materiality by eliminating the non-recurring impact of these items.
We believe that net assets is the primary measure used by the shareholders in assessing the performance and position of the entity as it reflects the Company’s principal activities of a holding company and treasury function and is a generally accepted auditing benchmark.
For each component in the scope of our Group audit, we allocated a materiality that is less than our overall Group materiality. The range of materiality allocated across components was between £4.5 million and £0.5 million. Certain components were audited to a local statutory audit materiality that was also less than our overall Group materiality.
We agreed with the Audit Committee that we would report to them misstatements identified during our audit above £0.365 million (Group audit) (2017: £0.28 million) and £0.045 million (Company audit) (2017: £0.062 million) as well as misstatements below those amounts that, in our view, warranted reporting for qualitative reasons.
Going concernIn accordance with ISAs (UK) we report as follows:
Reporting obligation Outcome
We are required to report if we have anything material to add or draw attention to in respect of the directors’ statement in the financial statements about whether the directors considered it appropriate to adopt the going concern basis of accounting in preparing the financial statements and the directors’ identification of any material uncertainties to the Group’s and the Company’s ability to continue as a going concern over a period of at least twelve months from the date of approval of the financial statements.
We have nothing material to add or to draw attention to. However, because not all future events or conditions can be predicted, this statement is not a guarantee as to the Group’s and Company’s ability to continue as a going concern.
We are required to report if the directors’ statement relating to going concern in accordance with Listing Rule 9.8.6R(3) is materially inconsistent with our knowledge obtained in the audit.
We have nothing to report.
88 Annual Report and Accounts for the year ended 31 March 2018 Electrocomponents plc
INDEPENDENT AUDITORS’ REPORT CONTINUED
Reporting on other information The other information comprises all of the information in the Annual Report other than the financial statements and our auditors’ report thereon. The directors are responsible for the other information. Our opinion on the financial statements does not cover the other information and, accordingly, we do not express an audit opinion or, except to the extent otherwise explicitly stated in this report, any form of assurance thereon.
In connection with our audit of the financial statements, our responsibility is to read the other information and, in doing so, consider whether the other information is materially inconsistent with the financial statements or our knowledge obtained in the audit, or otherwise appears to be materially misstated. If we identify an apparent material inconsistency or material misstatement, we are required to perform procedures to conclude whether there is a material misstatement of the financial statements or a material misstatement of the other information. If, based on the work we have performed, we conclude that there is a material misstatement of this other information, we are required to report that fact. We have nothing to report based on these responsibilities.
With respect to the Strategic Report and Directors’ Report, we also considered whether the disclosures required by the UK Companies Act 2006 have been included.
Based on the responsibilities described above and our work undertaken in the course of the audit, the Companies Act 2006 (CA06), ISAs (UK) and the Listing Rules of the Financial Conduct Authority (FCA) require us also to report certain opinions and matters as described below (required by ISAs (UK) unless otherwise stated).
Strategic Report and Directors’ ReportIn our opinion, based on the work undertaken in the course of the audit, the information given in the Strategic Report and Directors’ Report for the year ended 31 March 2018 is consistent with the financial statements and has been prepared in accordance with applicable legal requirements. (CA06)
In light of the knowledge and understanding of the Group and Company and their environment obtained in the course of the audit, we did not identify any material misstatements in the Strategic Report and Directors’ Report. (CA06)
The directors’ assessment of the prospects of the Group and of the principal risks that would threaten the solvency or liquidity of the GroupWe have nothing material to add or draw attention to regarding:
• The directors’ confirmation on page 34 of the Annual Report that they have carried out a robust assessment of the principal risks facing the Group, including those that would threaten its business model, future performance, solvency or liquidity.
• The disclosures in the Annual Report that describe those risks and explain how they are being managed or mitigated.• The directors’ explanation on pages 34 and 35 of the Annual Report as to how they have assessed the prospects of the Group, over what period they have
done so and why they consider that period to be appropriate, and their statement as to whether they have a reasonable expectation that the Group will be able to continue in operation and meet its liabilities as they fall due over the period of their assessment, including any related disclosures drawing attention to any necessary qualifications or assumptions.
We have nothing to report having performed a review of the directors’ statement that they have carried out a robust assessment of the principal risks facing the Group and statement in relation to the longer-term viability of the Group. Our review was substantially less in scope than an audit and only consisted of making inquiries and considering the directors’ process supporting their statements; checking that the statements are in alignment with the relevant provisions of the UK Corporate Governance Code (the “Code”); and considering whether the statements are consistent with the knowledge and understanding of the Group and Company and their environment obtained in the course of the audit. (Listing Rules)
Other Code ProvisionsWe have nothing to report in respect of our responsibility to report when:
• The statement given by the directors, on page 83, that they consider the Annual Report taken as a whole to be fair, balanced and understandable, and provides the information necessary for the members to assess the Group’s and Company’s position and performance, business model and strategy is materially inconsistent with our knowledge of the Group and Company obtained in the course of performing our audit.
• The section of the Annual Report on pages 56 to 61 describing the work of the Audit Committee does not appropriately address matters communicated by us to the Audit Committee.
• The directors’ statement relating to the Company’s compliance with the Code does not properly disclose a departure from a relevant provision of the Code specified, under the Listing Rules, for review by the auditors.
Directors’ RemunerationIn our opinion, the part of the Directors’ Remuneration Report to be audited has been properly prepared in accordance with the Companies Act 2006. (CA06)

FINA
NC
IAL S
TATEM
ENT
S
Electrocomponents plcAnnual Report and Accounts for the year ended 31 March 2018 89
Responsibilities for the financial statements and the audit Responsibilities of the directors for the financial statementsAs explained more fully in the Statement of Directors’ Responsibilities set out on page 83, the directors are responsible for the preparation of the financial statements in accordance with the applicable framework and for being satisfied that they give a true and fair view. The directors are also responsible for such internal control as they determine is necessary to enable the preparation of financial statements that are free from material misstatement, whether due to fraud or error.
In preparing the financial statements, the directors are responsible for assessing the Group’s and the Company’s ability to continue as a going concern, disclosing as applicable, matters related to going concern and using the going concern basis of accounting unless the directors either intend to liquidate the Group or the Company or to cease operations, or have no realistic alternative but to do so.
Auditors’ responsibilities for the audit of the financial statementsOur objectives are to obtain reasonable assurance about whether the financial statements as a whole are free from material misstatement, whether due to fraud or error, and to issue an auditors’ report that includes our opinion. Reasonable assurance is a high level of assurance, but is not a guarantee that an audit conducted in accordance with ISAs (UK) will always detect a material misstatement when it exists. Misstatements can arise from fraud or error and are considered material if, individually or in the aggregate, they could reasonably be expected to influence the economic decisions of users taken on the basis of these financial statements.
A further description of our responsibilities for the audit of the financial statements is located on the FRC’s website at: www.frc.org.uk/ auditorsresponsibilities. This description forms part of our auditors’ report.
Use of this reportThis report, including the opinions, has been prepared for and only for the Company’s members as a body in accordance with Chapter 3 of Part 16 of the Companies Act 2006 and for no other purpose. We do not, in giving these opinions, accept or assume responsibility for any other purpose or to any other person to whom this report is shown or into whose hands it may come save where expressly agreed by our prior consent in writing.
Other required reportingCompanies Act 2006 exception reportingUnder the Companies Act 2006 we are required to report to you if, in our opinion:
• we have not received all the information and explanations we require for our audit; or
• adequate accounting records have not been kept by the Company, or returns adequate for our audit have not been received from branches not visited by us; or
• certain disclosures of directors’ remuneration specified by law are not made; or
• the Company accounts and the part of the Directors’ Remuneration Report to be audited are not in agreement with the accounting records and returns.
We have no exceptions to report arising from this responsibility.
AppointmentFollowing the recommendation of the Audit Committee, we were appointed by the members on 11 August 2014 to audit the financial statements for the year ended 31 March 2015 and subsequent financial periods. The period of total uninterrupted engagement is 4 years, covering the years ended 31 March 2015 to 31 March 2018.
Christopher Richmond(Senior Statutory Auditor) for and on behalf of PricewaterhouseCoopers LLP Chartered Accountants and Statutory Auditors London 23 May 2018
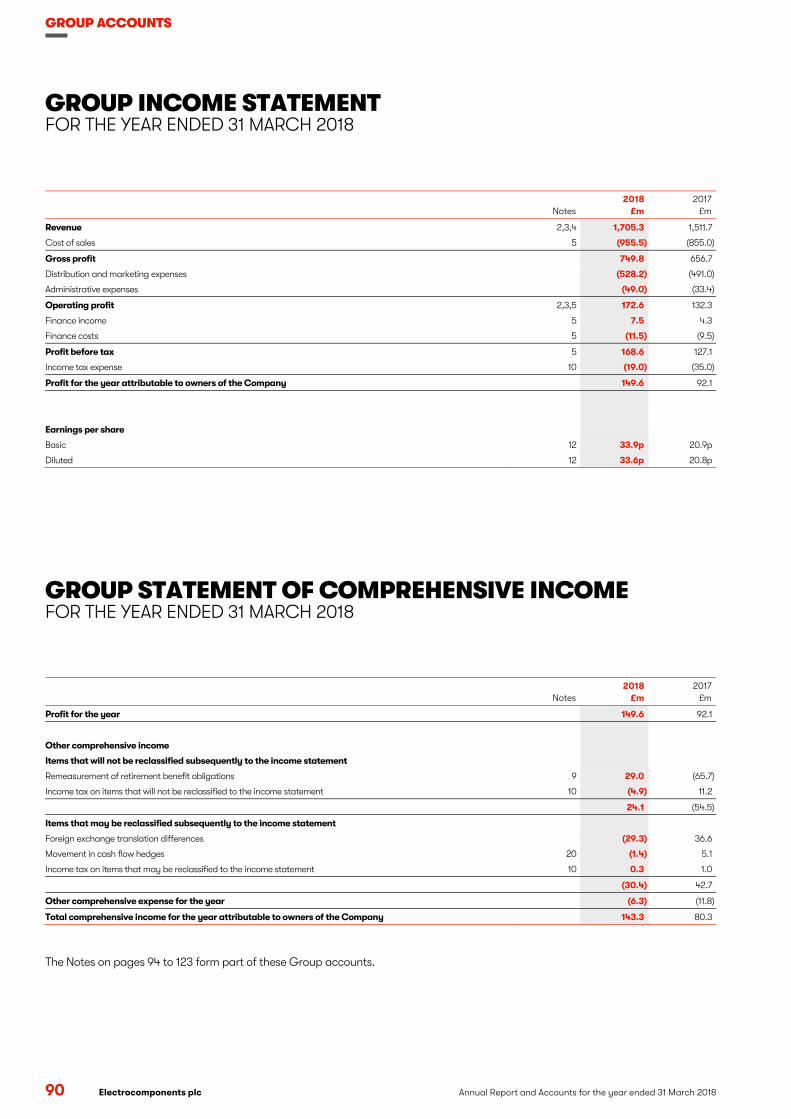
GROUP ACCOUNTS
GROUP INCOME STATEMENT FOR THE YEAR ENDED 31 MARCH 2018
90 Electrocomponents plc Annual Report and Accounts for the year ended 31 March 2018
Notes 2018
£m 2017
£m
Revenue 2,3,4 1,705.3 1,511.7
Cost of sales 5 (955.5) (855.0)
Gross profit 749.8 656.7
Distribution and marketing expenses (528.2) (491.0)
Administrative expenses (49.0) (33.4)
Operating profit 2,3,5 172.6 132.3
Finance income 5 7.5 4.3
Finance costs 5 (11.5) (9.5)
Profit before tax 5 168.6 127.1
Income tax expense 10 (19.0) (35.0)
Profit for the year attributable to owners of the Company 149.6 92.1
Earnings per share
Basic 12 33.9p 20.9p
Diluted 12 33.6p 20.8p
GROUP STATEMENT OF COMPREHENSIVE INCOME FOR THE YEAR ENDED 31 MARCH 2018
Notes 2018
£m 2017
£m
Profit for the year 149.6 92.1
Other comprehensive income
Items that will not be reclassified subsequently to the income statement
Remeasurement of retirement benefit obligations 9 29.0 (65.7)
Income tax on items that will not be reclassified to the income statement 10 (4.9) 11.2
24.1 (54.5)
Items that may be reclassified subsequently to the income statement
Foreign exchange translation differences (29.3) 36.6
Movement in cash flow hedges 20 (1.4) 5.1
Income tax on items that may be reclassified to the income statement 10 0.3 1.0
(30.4) 42.7
Other comprehensive expense for the year (6.3) (11.8)
Total comprehensive income for the year attributable to owners of the Company 143.3 80.3
The Notes on pages 94 to 123 form part of these Group accounts.
90 Annual Report and Accounts for the year ended 31 March 2018 Electrocomponents plc
GROUP ACCOUNTS

GROUP BALANCE SHEET AS AT 31 MARCH 2018 Company number: 647788
Annual Report and Accounts for the year ended 31 March 2018 Electrocomponents plc 91
FINA
NC
IAL S
TA
TEMEN
TS
Notes 2018
£m 2017
£m
Non-current assets
Intangible assets 13 233.3 260.3
Property, plant and equipment 14 97.3 96.9
Investment in joint venture 16 0.8 1.0
Other receivables 18 5.5 4.7
Cross currency interest rate swaps 21 0.5 2.2
Deferred tax assets 10 20.2 22.5
Total non-current assets 357.6 387.6
Current assets
Inventories 17 331.0 303.8
Trade and other receivables 18 294.2 277.1
Cash and cash equivalents – cash and short-term deposits 21 122.9 76.7
Cross currency interest rate swaps 21 – 16.8
Other derivative assets 20 0.8 0.8
Current income tax receivables 0.9 0.4
Total current assets 749.8 675.6
Total assets 1,107.4 1,063.2
Current liabilities
Trade and other payables 19 (280.9) (256.6)
Cash and cash equivalents – bank overdrafts 21 (87.5) (55.3)
Other borrowings 21 – (68.1)
Other derivative liabilities 20 (2.8) (0.3)
Provisions 23 (1.5) (0.8)
Current income tax liabilities (18.3) (9.1)
Total current liabilities (391.0) (390.2)
Non-current liabilities
Other payables 19 (12.7) (13.4)
Retirement benefit obligations 9 (72.4) (104.6)
Borrowings 21 (100.9) (85.2)
Provisions 23 (1.2) –
Deferred tax liabilities 10 (46.7) (80.8)
Total non-current liabilities (233.9) (284.0)
Total liabilities (624.9) (674.2)
Net assets 482.5 389.0
Equity
Share capital 24 44.2 44.2
Share premium account 47.1 44.5
Hedging reserve (0.5) 0.6
Own shares held by Employee Benefit Trust (EBT) 24 (4.2) (2.3)
Cumulative translation reserve 41.1 70.4
Retained earnings 354.8 231.6
Equity attributable to owners of the Company 482.5 389.0
The Notes on pages 94 to 123 form part of these Group accounts.
These Group accounts were approved by the Board of Directors on 23 May 2018 and signed on its behalf by:
David Egan Group Finance Director
Electrocomponents plcAnnual Report and Accounts for the year ended 31 March 2018 91
FINA
NC
IAL S
TATEM
ENT
S
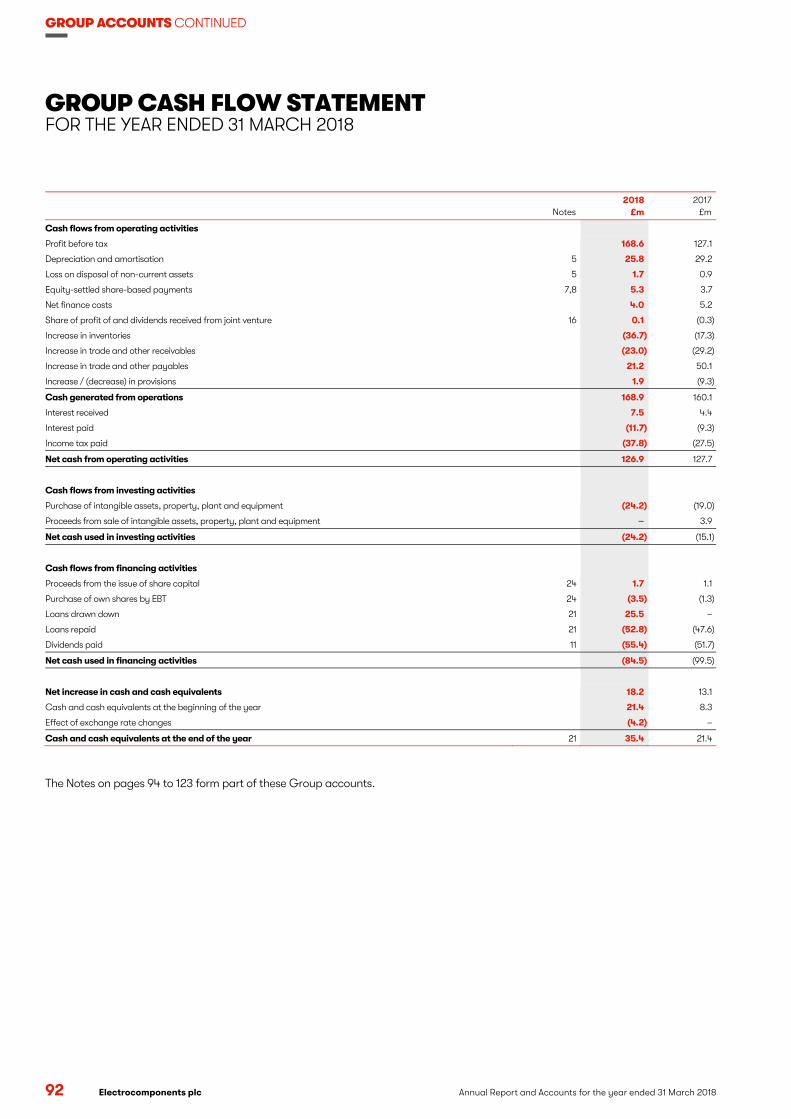
GROUP ACCOUNTS CONTINUED
GROUP CASH FLOW STATEMENT FOR THE YEAR ENDED 31 MARCH 2018
92 Electrocomponents plc Annual Report and Accounts for the year ended 31 March 2018
Notes 2018
£m 2017
£m
Cash flows from operating activities
Profit before tax 168.6 127.1
Depreciation and amortisation 5 25.8 29.2
Loss on disposal of non-current assets 5 1.7 0.9
Equity-settled share-based payments 7,8 5.3 3.7
Net finance costs 4.0 5.2
Share of profit of and dividends received from joint venture 16 0.1 (0.3)
Increase in inventories (36.7) (17.3)
Increase in trade and other receivables (23.0) (29.2)
Increase in trade and other payables 21.2 50.1
Increase / (decrease) in provisions 1.9 (9.3)
Cash generated from operations 168.9 160.1
Interest received 7.5 4.4
Interest paid (11.7) (9.3)
Income tax paid (37.8) (27.5)
Net cash from operating activities 126.9 127.7
Cash flows from investing activities
Purchase of intangible assets, property, plant and equipment (24.2) (19.0)
Proceeds from sale of intangible assets, property, plant and equipment – 3.9
Net cash used in investing activities (24.2) (15.1)
Cash flows from financing activities
Proceeds from the issue of share capital 24 1.7 1.1
Purchase of own shares by EBT 24 (3.5) (1.3)
Loans drawn down 21 25.5 –
Loans repaid 21 (52.8) (47.6)
Dividends paid 11 (55.4) (51.7)
Net cash used in financing activities (84.5) (99.5)
Net increase in cash and cash equivalents 18.2 13.1
Cash and cash equivalents at the beginning of the year 21.4 8.3
Effect of exchange rate changes (4.2) –
Cash and cash equivalents at the end of the year 21 35.4 21.4
The Notes on pages 94 to 123 form part of these Group accounts.
92 Annual Report and Accounts for the year ended 31 March 2018 Electrocomponents plc
GROUP ACCOUNTS CONTINUED
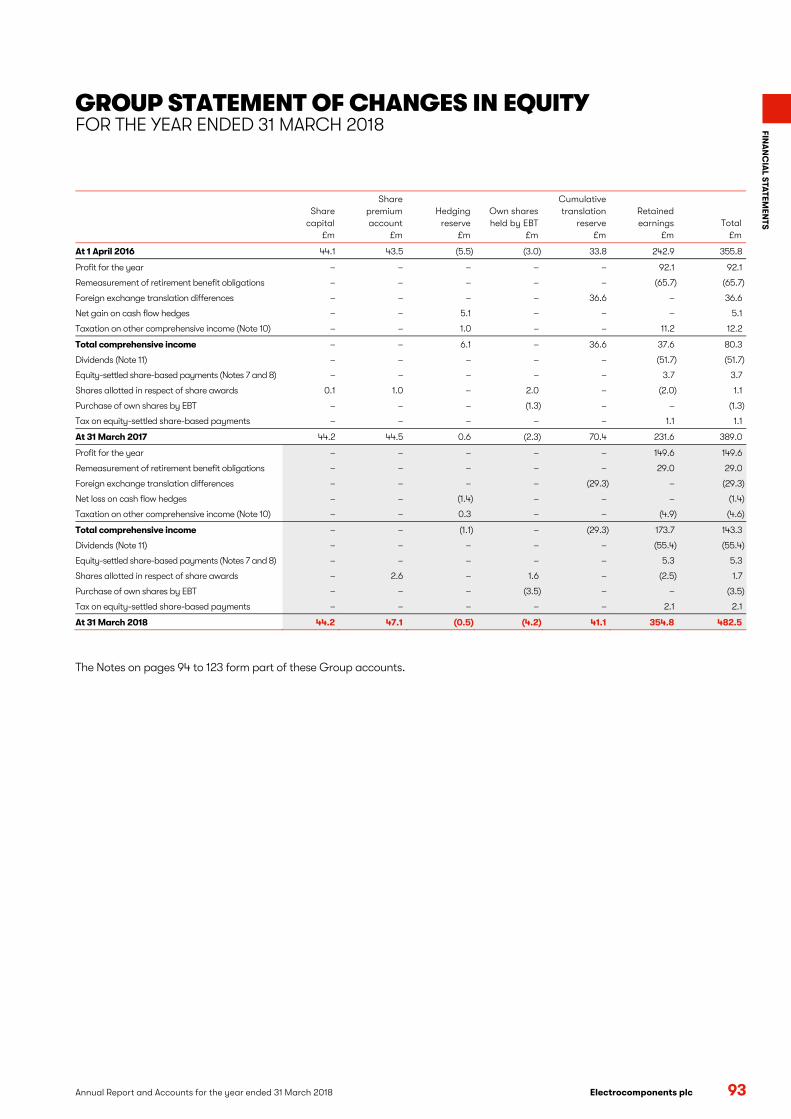
GROUP STATEMENT OF CHANGES IN EQUITY FOR THE YEAR ENDED 31 MARCH 2018
Annual Report and Accounts for the year ended 31 March 2018 Electrocomponents plc 93
FINA
NC
IAL S
TA
TEMEN
TS
Share capital
£m
Share premium account
£m
Hedging reserve
£m
Own shares held by EBT
£m
Cumulative translation
reserve £m
Retained earnings
£m Total
£m
At 1 April 2016 44.1 43.5 (5.5) (3.0) 33.8 242.9 355.8
Profit for the year – – – – – 92.1 92.1
Remeasurement of retirement benefit obligations – – – – – (65.7) (65.7)
Foreign exchange translation differences – – – – 36.6 – 36.6
Net gain on cash flow hedges – – 5.1 – – – 5.1
Taxation on other comprehensive income (Note 10) – – 1.0 – – 11.2 12.2
Total comprehensive income – – 6.1 – 36.6 37.6 80.3
Dividends (Note 11) – – – – – (51.7) (51.7)
Equity-settled share-based payments (Notes 7 and 8) – – – – – 3.7 3.7
Shares allotted in respect of share awards 0.1 1.0 – 2.0 – (2.0) 1.1
Purchase of own shares by EBT – – – (1.3) – – (1.3)
Tax on equity-settled share-based payments – – – – – 1.1 1.1
At 31 March 2017 44.2 44.5 0.6 (2.3) 70.4 231.6 389.0
Profit for the year – – – – – 149.6 149.6
Remeasurement of retirement benefit obligations – – – – – 29.0 29.0
Foreign exchange translation differences – – – – (29.3) – (29.3)
Net loss on cash flow hedges – – (1.4) – – – (1.4)
Taxation on other comprehensive income (Note 10) – – 0.3 – – (4.9) (4.6)
Total comprehensive income – – (1.1) – (29.3) 173.7 143.3
Dividends (Note 11) – – – – – (55.4) (55.4)
Equity-settled share-based payments (Notes 7 and 8) – – – – – 5.3 5.3
Shares allotted in respect of share awards – 2.6 – 1.6 – (2.5) 1.7
Purchase of own shares by EBT – – – (3.5) – – (3.5)
Tax on equity-settled share-based payments – – – – – 2.1 2.1
At 31 March 2018 44.2 47.1 (0.5) (4.2) 41.1 354.8 482.5
The Notes on pages 94 to 123 form part of these Group accounts.
Electrocomponents plcAnnual Report and Accounts for the year ended 31 March 2018 93
FINA
NC
IAL S
TATEM
ENT
S
GROUP ACCOUNTS CONTINUED
NOTES TO THE GROUP ACCOUNTS
94 Electrocomponents plc Annual Report and Accounts for the year ended 31 March 2018
1 Basis of preparation Electrocomponents plc (the Company) is a public limited company registered in England and Wales and listed on the London Stock Exchange.
The Group accounts for the year ended 31 March 2018 are presented in sterling and rounded to £0.1 million. They are prepared in accordance with International Financial Reporting Standards (IFRS) as adopted by the European Union. The accounts have been prepared on a going concern basis under the historical cost convention, modified by the revaluation of retirement benefit obligations and certain financial assets and liabilities (including derivative financial instruments) as explained in the relevant note. The principal accounting policies have been consistently applied unless otherwise stated.
Basis of consolidation The Group accounts comprise the results, assets and liabilities of the Company and all its subsidiaries (together referred to as the Group) and include the Employee Benefit Trust (EBT) and the Group’s interest in a joint venture. Subsidiaries are entities controlled by the Company. The joint venture is accounted for using the equity method of accounting.
Intra-group transactions and balances are eliminated in preparing the Group accounts and no profit or loss is recognised on intra-group transactions. Unrealised gains or losses arising from transactions with the joint venture are eliminated to the extent of the Group’s interest in the entity.
Estimates and judgements The preparation of accounts in conformity with IFRS requires the Group to make judgements, estimates and assumptions that affect the application of accounting policies and reported amounts of assets and liabilities, income and expenses. Except for judgements involved in estimations, no judgements have been made in the process of applying the Group’s accounting policies that have had a significant effect on the amounts recognised in the accounts.
The significant estimates made in preparing the accounts were in relation to retirement benefit obligations (Note 9), inventories (Note 17), and uncertain tax positions (Note 10). Further details on the application of these estimates can be found in the relevant notes. The Group is also required to make estimates in the review of intangibles and other assets for impairment. Further details are provided in Note 13. Actual results in the longer term may differ from these estimates.
Foreign currency Foreign currency transactions Transactions in foreign currencies are recorded using the rate ruling at the date of the transaction. Monetary assets and liabilities denominated in foreign currencies at the balance sheet date are retranslated at the rate ruling at that date and the gains and losses on translation are recognised in operating profit. Non-monetary assets and liabilities that are measured in terms of historical cost in a foreign currency are translated using the rate at the date of the transaction. Non-monetary assets and liabilities denominated in foreign currencies that are stated at fair value are translated at the rate ruling at the date the fair value was determined.
Translation of foreign operations The assets and liabilities of foreign operations, including goodwill and fair value adjustments arising on acquisition, are translated at exchange rates ruling at the balance sheet date. The income statement and cash flows of foreign operations are translated at the average rate for the period.
Exchange differences arising from the translation of foreign operations, and of related qualifying hedges, are taken to other comprehensive income. They are reclassified to the income statement upon disposal of the net investment. The Group elected under IFRS 1 on transition to IFRS to set the cumulative translation differences balance at 1 April 2004 to £nil.
94 Annual Report and Accounts for the year ended 31 March 2018 Electrocomponents plc
GROUP ACCOUNTS CONTINUED
Annual Report and Accounts for the year ended 31 March 2018 Electrocomponents plc 95
FINA
NC
IAL S
TA
TEMEN
TS
1 Basis of preparation continued Standards and interpretations adopted in the year Amendments to International Accounting Standard (IAS) 7 ‘Disclosure Initiative’, Amendments to IAS 12 ‘Recognition of Deferred Tax Assets for Unrealised Losses’, and ‘Annual Improvements to IFRSs 2014-2016 Cycle’ were adopted in the year. There was no material impact on the reported results or financial position of the Group.
Standards or interpretations issued but not yet applied The following standards and interpretations have been issued but are not yet applicable. The Group does not consider that any other standards or interpretations issued by the International Accounting Standards Board, but not yet applicable, will have a significant impact on the accounts.
IFRS 9 ‘Financial Instruments’ IFRS 9 replaces the existing guidance in IAS 39 ‘Financial Instruments: Recognition and Measurement’. IFRS 9 includes revised guidance on the classification and measurement of financial instruments, impairment on financial assets and new general hedge accounting requirements plus expanded disclosures. The Group will apply IFRS 9 retrospectively from 1 April 2018, with the practical expedients permitted under the standard. Comparatives for 2018 will not be restated and the impact will be adjusted in opening retained earnings as of 1 April 2018.
Under the new standard, the assessment of impairment of the Group’s trade receivables will change from an incurred loss model to an expected loss model, which is not expected to have a material effect on the level of impairment of trade receivables. There are no other changes that impact the Group’s accounting for financial instruments or hedging.
IFRS 15 ‘Revenue from Contracts with Customers’ IFRS 15 establishes a comprehensive framework for determining whether, how much and when revenue is recognised. The standard is based on the principle that revenue is recognised when control of goods or services transfers to the customer. The Group has performed an impact assessment and does not expect the new standard to have a material impact on the Group’s results but there will be an increase in disclosures. The Group will adopt IFRS 15 on 1 April 2018 using the modified retrospective approach, comparatives will not be restated and the cumulative impact will be recognised in retained earnings as of 1 April 2018.
IFRS 16 ‘Leases’ IFRS 16 will be adopted by the Group on 1 April 2019 and will result in almost all leases being recognised on the balance sheet, as the distinction between operating and finance leases is removed. Under the new standard, an asset (the right to use the leased item) and a financial liability to pay rentals discounted to present value will be recognised. The only exceptions are short-term and low-value leases.
As at 31 March 2018, the Group has non-cancellable operating lease commitments of £45.5 million (see Note 25). Some of this relates to contracts that are short term or for low-value assets which will be recognised on a straight-line basis over the lease term as an operating expense. The accounting for leases under IFRS 16 will result in higher operating profit, with a lower lease expense partly offset by depreciation of the right-of-use asset, and higher interest expense due to the unwinding of the discount on the present value of the liability. There will be changes to the Group’s net assets due to bringing the right-of-use assets and the financial liabilities onto the balance sheet. The Group is currently reviewing its leases and quantifying the likely effect of these changes.
Electrocomponents plcAnnual Report and Accounts for the year ended 31 March 2018 95
FINA
NC
IAL S
TATEM
ENT
S
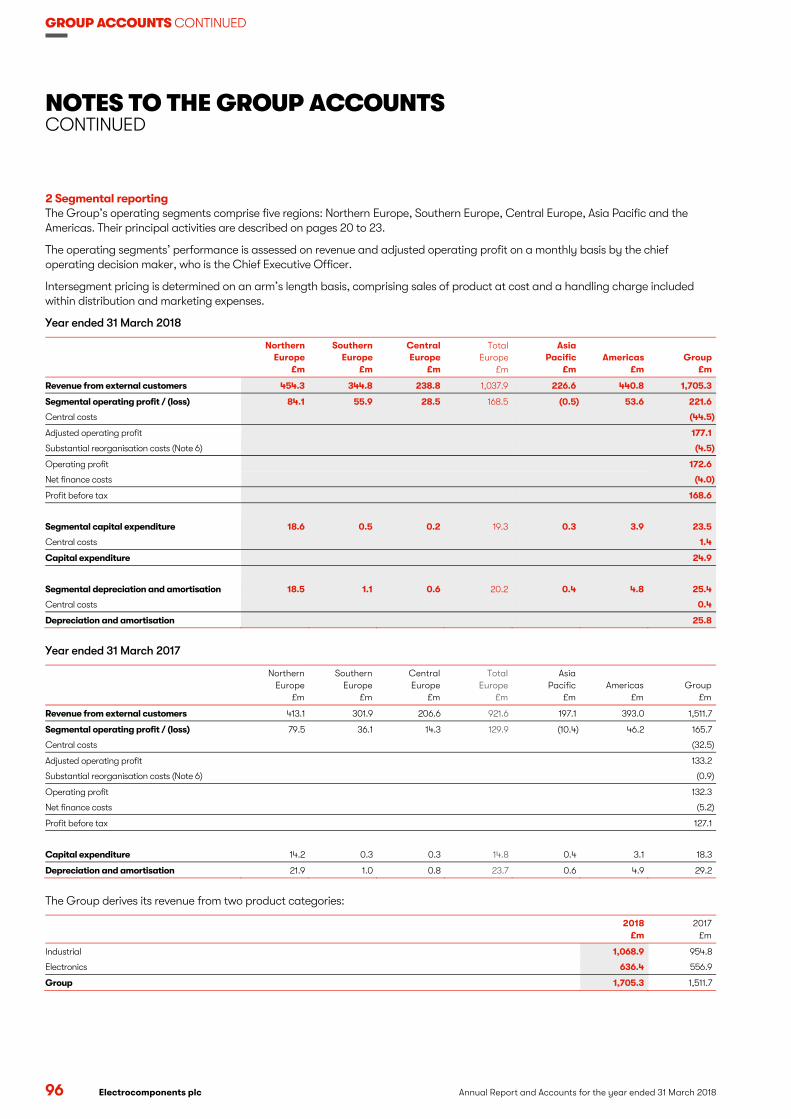
GROUP ACCOUNTS CONTINUED
NOTES TO THE GROUP ACCOUNTS CONTINUED
96 Electrocomponents plc Annual Report and Accounts for the year ended 31 March 2018
2 Segmental reporting The Group’s operating segments comprise five regions: Northern Europe, Southern Europe, Central Europe, Asia Pacific and the Americas. Their principal activities are described on pages 20 to 23.
The operating segments’ performance is assessed on revenue and adjusted operating profit on a monthly basis by the chief operating decision maker, who is the Chief Executive Officer.
Intersegment pricing is determined on an arm’s length basis, comprising sales of product at cost and a handling charge included within distribution and marketing expenses.
Year ended 31 March 2018
Northern Europe
£m
Southern Europe
£m
Central Europe
£m
Total Europe
£m
Asia Pacific
£m Americas
£m Group
£m
Revenue from external customers 454.3 344.8 238.8 1,037.9 226.6 440.8 1,705.3
Segmental operating profit / (loss) 84.1 55.9 28.5 168.5 (0.5) 53.6 221.6
Central costs (44.5)
Adjusted operating profit 177.1
Substantial reorganisation costs (Note 6) (4.5)
Operating profit 172.6
Net finance costs (4.0)
Profit before tax 168.6
Segmental capital expenditure 18.6 0.5 0.2 19.3 0.3 3.9 23.5
Central costs 1.4
Capital expenditure 24.9
Segmental depreciation and amortisation 18.5 1.1 0.6 20.2 0.4 4.8 25.4
Central costs 0.4
Depreciation and amortisation 25.8
Year ended 31 March 2017
Northern Europe
£m
Southern Europe
£m
Central Europe
£m
Total Europe
£m
Asia Pacific
£m Americas
£m Group
£m
Revenue from external customers 413.1 301.9 206.6 921.6 197.1 393.0 1,511.7
Segmental operating profit / (loss) 79.5 36.1 14.3 129.9 (10.4) 46.2 165.7
Central costs (32.5)
Adjusted operating profit 133.2
Substantial reorganisation costs (Note 6) (0.9)
Operating profit 132.3
Net finance costs (5.2)
Profit before tax 127.1
Capital expenditure 14.2 0.3 0.3 14.8 0.4 3.1 18.3
Depreciation and amortisation 21.9 1.0 0.8 23.7 0.6 4.9 29.2
The Group derives its revenue from two product categories:
2018 £m
2017 £m
Industrial 1,068.9 954.8
Electronics 636.4 556.9
Group 1,705.3 1,511.7
96 Annual Report and Accounts for the year ended 31 March 2018 Electrocomponents plc
GROUP ACCOUNTS CONTINUED
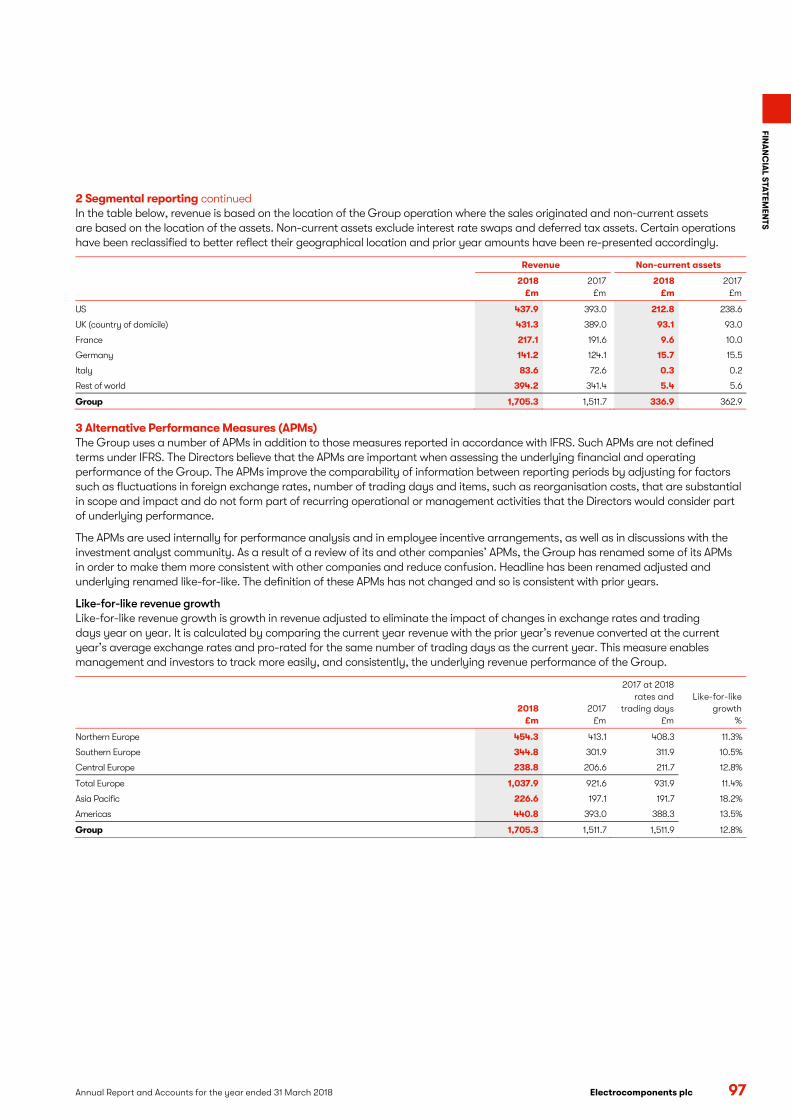
Annual Report and Accounts for the year ended 31 March 2018 Electrocomponents plc 97
FINA
NC
IAL S
TA
TEMEN
TS
2 Segmental reporting continued In the table below, revenue is based on the location of the Group operation where the sales originated and non-current assets are based on the location of the assets. Non-current assets exclude interest rate swaps and deferred tax assets. Certain operations have been reclassified to better reflect their geographical location and prior year amounts have been re-presented accordingly.
Revenue Non-current assets
2018 £m
2017 £m
2018 £m
2017 £m
US 437.9 393.0 212.8 238.6
UK (country of domicile) 431.3 389.0 93.1 93.0
France 217.1 191.6 9.6 10.0
Germany 141.2 124.1 15.7 15.5
Italy 83.6 72.6 0.3 0.2
Rest of world 394.2 341.4 5.4 5.6
Group 1,705.3 1,511.7 336.9 362.9
3 Alternative Performance Measures (APMs) The Group uses a number of APMs in addition to those measures reported in accordance with IFRS. Such APMs are not defined terms under IFRS. The Directors believe that the APMs are important when assessing the underlying financial and operating performance of the Group. The APMs improve the comparability of information between reporting periods by adjusting for factors such as fluctuations in foreign exchange rates, number of trading days and items, such as reorganisation costs, that are substantial in scope and impact and do not form part of recurring operational or management activities that the Directors would consider part of underlying performance.
The APMs are used internally for performance analysis and in employee incentive arrangements, as well as in discussions with the investment analyst community. As a result of a review of its and other companies’ APMs, the Group has renamed some of its APMs in order to make them more consistent with other companies and reduce confusion. Headline has been renamed adjusted and underlying renamed like-for-like. The definition of these APMs has not changed and so is consistent with prior years.
Like-for-like revenue growth Like-for-like revenue growth is growth in revenue adjusted to eliminate the impact of changes in exchange rates and trading days year on year. It is calculated by comparing the current year revenue with the prior year’s revenue converted at the current year’s average exchange rates and pro-rated for the same number of trading days as the current year. This measure enables management and investors to track more easily, and consistently, the underlying revenue performance of the Group.
2018 £m
2017 £m
2017 at 2018 rates and
trading days £m
Like-for-like growth
%
Northern Europe 454.3 413.1 408.3 11.3%
Southern Europe 344.8 301.9 311.9 10.5%
Central Europe 238.8 206.6 211.7 12.8%
Total Europe 1,037.9 921.6 931.9 11.4%
Asia Pacific 226.6 197.1 191.7 18.2%
Americas 440.8 393.0 388.3 13.5%
Group 1,705.3 1,511.7 1,511.9 12.8%
Electrocomponents plcAnnual Report and Accounts for the year ended 31 March 2018 97
FINA
NC
IAL S
TATEM
ENT
S
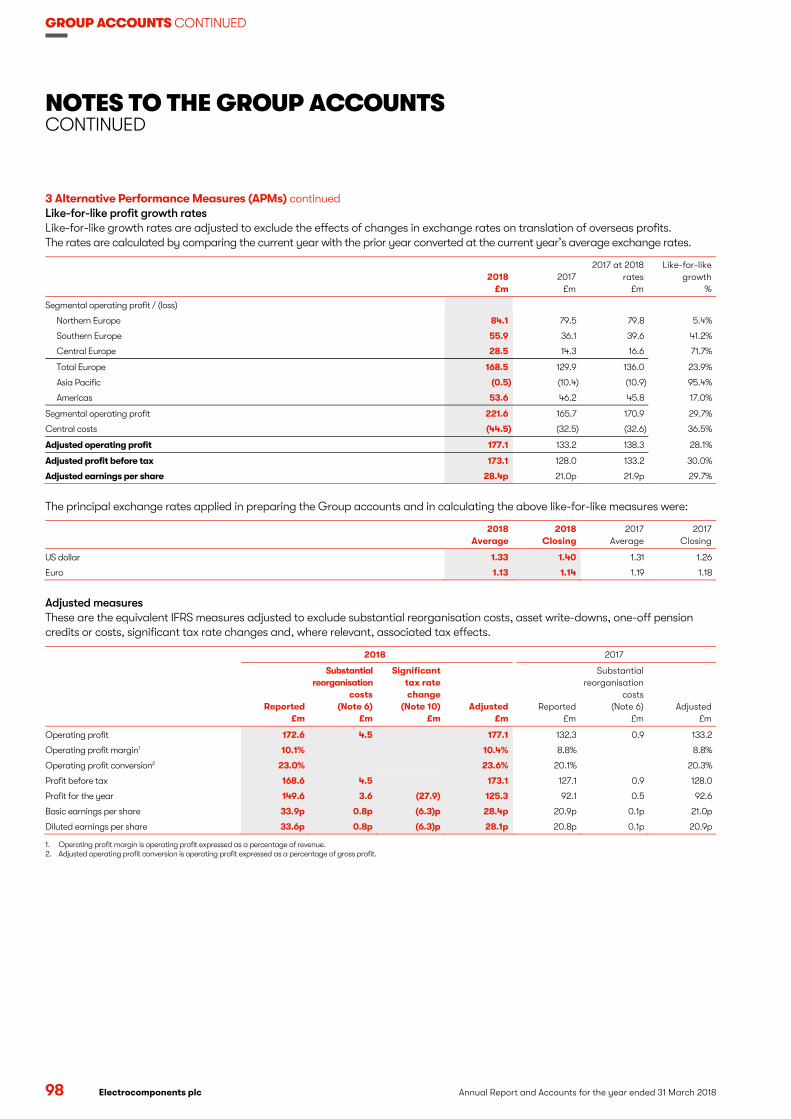
GROUP ACCOUNTS CONTINUED
NOTES TO THE GROUP ACCOUNTS CONTINUED
98 Electrocomponents plc Annual Report and Accounts for the year ended 31 March 2018
3 Alternative Performance Measures (APMs) continued Like-for-like profit growth rates Like-for-like growth rates are adjusted to exclude the effects of changes in exchange rates on translation of overseas profits. The rates are calculated by comparing the current year with the prior year converted at the current year’s average exchange rates.
2018 £m
2017 £m
2017 at 2018 rates
£m
Like-for-like growth
%
Segmental operating profit / (loss)
Northern Europe 84.1 79.5 79.8 5.4%
Southern Europe 55.9 36.1 39.6 41.2%
Central Europe 28.5 14.3 16.6 71.7%
Total Europe 168.5 129.9 136.0 23.9%
Asia Pacific (0.5) (10.4) (10.9) 95.4%
Americas 53.6 46.2 45.8 17.0%
Segmental operating profit 221.6 165.7 170.9 29.7%
Central costs (44.5) (32.5) (32.6) 36.5%
Adjusted operating profit 177.1 133.2 138.3 28.1%
Adjusted profit before tax 173.1 128.0 133.2 30.0%
Adjusted earnings per share 28.4p 21.0p 21.9p 29.7%
The principal exchange rates applied in preparing the Group accounts and in calculating the above like-for-like measures were:
2018
Average 2018
Closing 2017
Average 2017
Closing
US dollar 1.33 1.40 1.31 1.26
Euro 1.13 1.14 1.19 1.18
Adjusted measures These are the equivalent IFRS measures adjusted to exclude substantial reorganisation costs, asset write-downs, one-off pension credits or costs, significant tax rate changes and, where relevant, associated tax effects.
2018 2017
Reported £m
Substantial reorganisation
costs (Note 6)
£m
Significant tax rate change
(Note 10) £m
Adjusted £m
Reported £m
Substantial reorganisation
costs (Note 6)
£m Adjusted
£m
Operating profit 172.6 4.5 177.1 132.3 0.9 133.2
Operating profit margin1 10.1% 10.4% 8.8% 8.8%
Operating profit conversion2 23.0% 23.6% 20.1% 20.3%
Profit before tax 168.6 4.5 173.1 127.1 0.9 128.0
Profit for the year 149.6 3.6 (27.9) 125.3 92.1 0.5 92.6
Basic earnings per share 33.9p 0.8p (6.3)p 28.4p 20.9p 0.1p 21.0p
Diluted earnings per share 33.6p 0.8p (6.3)p 28.1p 20.8p 0.1p 20.9p
1. Operating profit margin is operating profit expressed as a percentage of revenue. 2. Adjusted operating profit conversion is operating profit expressed as a percentage of gross profit.
98 Annual Report and Accounts for the year ended 31 March 2018 Electrocomponents plc
GROUP ACCOUNTS CONTINUED
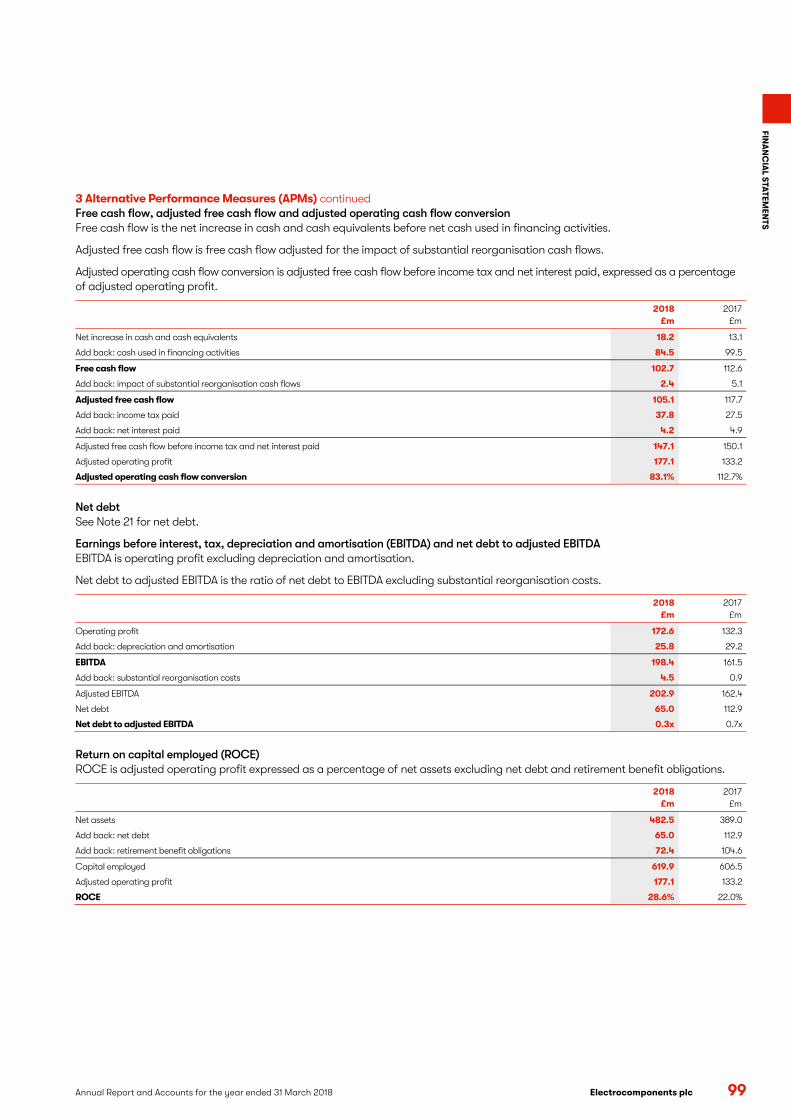
Annual Report and Accounts for the year ended 31 March 2018 Electrocomponents plc 99
FINA
NC
IAL S
TA
TEMEN
TS
3 Alternative Performance Measures (APMs) continued Free cash flow, adjusted free cash flow and adjusted operating cash flow conversion Free cash flow is the net increase in cash and cash equivalents before net cash used in financing activities.
Adjusted free cash flow is free cash flow adjusted for the impact of substantial reorganisation cash flows.
Adjusted operating cash flow conversion is adjusted free cash flow before income tax and net interest paid, expressed as a percentage of adjusted operating profit.
2018
£m 2017
£m
Net increase in cash and cash equivalents 18.2 13.1
Add back: cash used in financing activities 84.5 99.5
Free cash flow 102.7 112.6
Add back: impact of substantial reorganisation cash flows 2.4 5.1
Adjusted free cash flow 105.1 117.7
Add back: income tax paid 37.8 27.5
Add back: net interest paid 4.2 4.9
Adjusted free cash flow before income tax and net interest paid 147.1 150.1
Adjusted operating profit 177.1 133.2
Adjusted operating cash flow conversion 83.1% 112.7%
Net debt See Note 21 for net debt.
Earnings before interest, tax, depreciation and amortisation (EBITDA) and net debt to adjusted EBITDA EBITDA is operating profit excluding depreciation and amortisation.
Net debt to adjusted EBITDA is the ratio of net debt to EBITDA excluding substantial reorganisation costs.
2018 £m
2017 £m
Operating profit 172.6 132.3
Add back: depreciation and amortisation 25.8 29.2
EBITDA 198.4 161.5
Add back: substantial reorganisation costs 4.5 0.9
Adjusted EBITDA 202.9 162.4
Net debt 65.0 112.9
Net debt to adjusted EBITDA 0.3x 0.7x
Return on capital employed (ROCE) ROCE is adjusted operating profit expressed as a percentage of net assets excluding net debt and retirement benefit obligations.
2018 £m
2017 £m
Net assets 482.5 389.0
Add back: net debt 65.0 112.9
Add back: retirement benefit obligations 72.4 104.6
Capital employed 619.9 606.5
Adjusted operating profit 177.1 133.2
ROCE 28.6% 22.0%
Electrocomponents plcAnnual Report and Accounts for the year ended 31 March 2018 99
FINA
NC
IAL S
TATEM
ENT
S
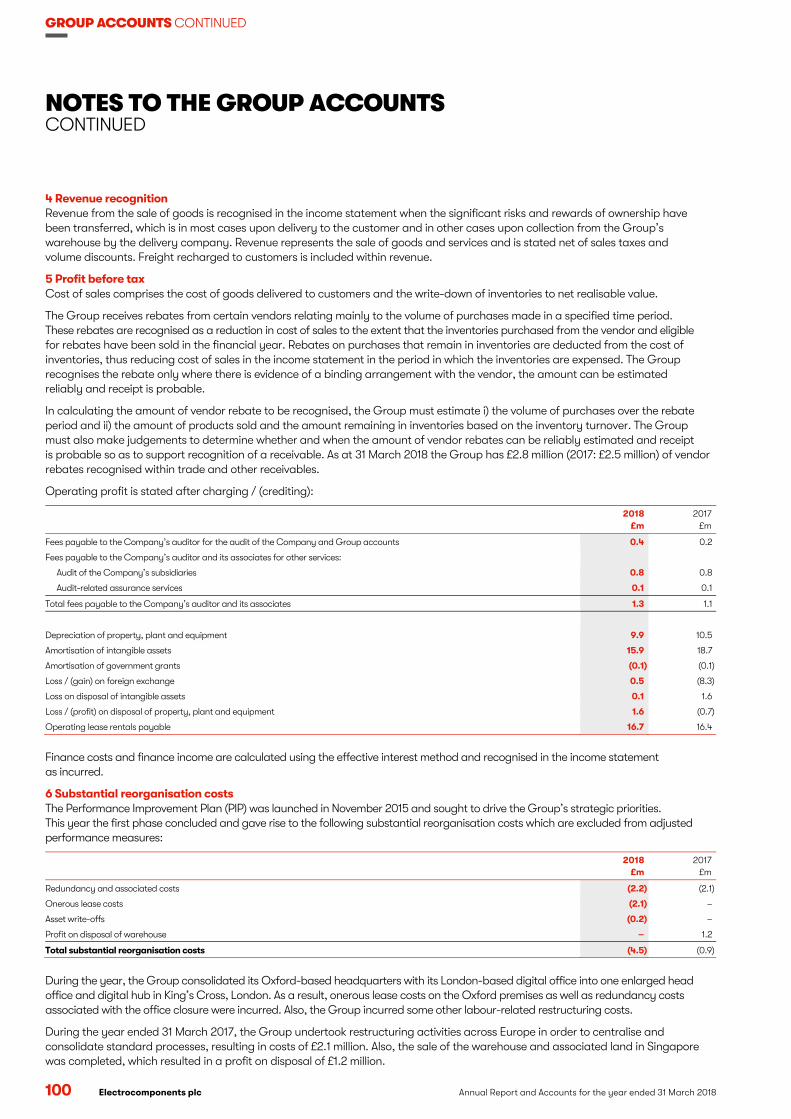
GROUP ACCOUNTS CONTINUED
NOTES TO THE GROUP ACCOUNTS CONTINUED
100 Electrocomponents plc Annual Report and Accounts for the year ended 31 March 2018
4 Revenue recognition Revenue from the sale of goods is recognised in the income statement when the significant risks and rewards of ownership have been transferred, which is in most cases upon delivery to the customer and in other cases upon collection from the Group’s warehouse by the delivery company. Revenue represents the sale of goods and services and is stated net of sales taxes and volume discounts. Freight recharged to customers is included within revenue.
5 Profit before tax Cost of sales comprises the cost of goods delivered to customers and the write-down of inventories to net realisable value.
The Group receives rebates from certain vendors relating mainly to the volume of purchases made in a specified time period. These rebates are recognised as a reduction in cost of sales to the extent that the inventories purchased from the vendor and eligible for rebates have been sold in the financial year. Rebates on purchases that remain in inventories are deducted from the cost of inventories, thus reducing cost of sales in the income statement in the period in which the inventories are expensed. The Group recognises the rebate only where there is evidence of a binding arrangement with the vendor, the amount can be estimated reliably and receipt is probable.
In calculating the amount of vendor rebate to be recognised, the Group must estimate i) the volume of purchases over the rebate period and ii) the amount of products sold and the amount remaining in inventories based on the inventory turnover. The Group must also make judgements to determine whether and when the amount of vendor rebates can be reliably estimated and receipt is probable so as to support recognition of a receivable. As at 31 March 2018 the Group has £2.8 million (2017: £2.5 million) of vendor rebates recognised within trade and other receivables.
Operating profit is stated after charging / (crediting):
2018 £m
2017 £m
Fees payable to the Company’s auditor for the audit of the Company and Group accounts 0.4 0.2
Fees payable to the Company’s auditor and its associates for other services:
Audit of the Company’s subsidiaries 0.8 0.8
Audit-related assurance services 0.1 0.1
Total fees payable to the Company’s auditor and its associates 1.3 1.1
Depreciation of property, plant and equipment 9.9 10.5
Amortisation of intangible assets 15.9 18.7
Amortisation of government grants (0.1) (0.1)
Loss / (gain) on foreign exchange 0.5 (8.3)
Loss on disposal of intangible assets 0.1 1.6
Loss / (profit) on disposal of property, plant and equipment 1.6 (0.7)
Operating lease rentals payable 16.7 16.4
Finance costs and finance income are calculated using the effective interest method and recognised in the income statement as incurred.
6 Substantial reorganisation costs The Performance Improvement Plan (PIP) was launched in November 2015 and sought to drive the Group’s strategic priorities. This year the first phase concluded and gave rise to the following substantial reorganisation costs which are excluded from adjusted performance measures:
2018
£m 2017
£m
Redundancy and associated costs (2.2) (2.1)
Onerous lease costs (2.1) –
Asset write-offs (0.2) –
Profit on disposal of warehouse – 1.2
Total substantial reorganisation costs (4.5) (0.9)
During the year, the Group consolidated its Oxford-based headquarters with its London-based digital office into one enlarged head office and digital hub in King’s Cross, London. As a result, onerous lease costs on the Oxford premises as well as redundancy costs associated with the office closure were incurred. Also, the Group incurred some other labour-related restructuring costs.
During the year ended 31 March 2017, the Group undertook restructuring activities across Europe in order to centralise and consolidate standard processes, resulting in costs of £2.1 million. Also, the sale of the warehouse and associated land in Singapore was completed, which resulted in a profit on disposal of £1.2 million.
100 Annual Report and Accounts for the year ended 31 March 2018 Electrocomponents plc
GROUP ACCOUNTS CONTINUED

Annual Report and Accounts for the year ended 31 March 2018 Electrocomponents plc 101
FINA
NC
IAL S
TA
TEMEN
TS
7 Employees
Average number of employees 2018 2017
Management and administration 747 690
Distribution and marketing 5,121 5,079
5,868 5,769
Aggregate employment costs 2018
£m 2017
£m
Wages and salaries 224.5 194.5
Social security costs 23.6 21.8
Share-based payments – equity-settled (Note 8) 5.3 3.7
Share-based payments – cash-settled (Note 8) 5.5 5.8
Defined contribution retirement benefit costs (Note 9) 11.3 11.0
Defined benefit retirement benefit costs (Note 9) 7.3 5.6
277.5 242.4
Termination benefits 5.0 2.1
Total 282.5 244.5
Information on the Directors’ remuneration is given in the Directors’ Remuneration Report on pages 64 to 78.
8 Share-based payments The Group operates several share-based payment schemes which are the Deferred Share Bonus Plan, the Recruitment Award, the Long Term Incentive Plan and the Savings-Related Share Option Scheme.
Equity-settled share-based payments are measured at fair value at the grant date, calculated using an appropriate option pricing model. The fair value is expensed with a corresponding increase in equity on a straight-line basis over the period that employees become unconditionally entitled to the awards. The income statement charge is adjusted to reflect expected and actual levels of vesting associated with non-market performance related criteria.
Cash-settled share-based payments are measured at fair value at the balance sheet date, taking into account the estimated number of awards that will actually vest and the relative completion of the vesting period. This fair value is included in liabilities and changes in the value of these liabilities are recognised in the income statement.
The EBT established to administer the schemes owns shares in the Company which are shown in equity.
Deferred Share Bonus Plan (DSBP) – equity settled Under the DSBP, one-third of the total bonus earned by plan participants is awarded as shares and deferred for two years, normally subject to the continued employment of the participant within the Group. There are no other performance conditions. A cash payment equivalent to the dividends that would have accrued on the shares is made to the participants on vesting. Deferred share awards relating to the bonus for the year ended 31 March 2018 will be awarded in June 2018. The fair value of the shares awarded during the year was 579.5p (2017: 261.7p) per share award which was the share price at the date of award.
The movements in the DSBP awards were:
2018 Number of
awards
2017 Number of
awards
Outstanding at 1 April 107,693 197,151
Forfeited during the year (16,934) (18,557)
Exercised during the year (30,561) (152,080)
Granted during the year 150,368 81,179
Outstanding at 31 March 210,566 107,693
Recruitment Award – equity settled During the year ended 31 March 2016, Lindsley Ruth was granted 513,784 awards under the Recruitment Award plan. The awards will vest subject, in normal circumstances, to continued service and to the Remuneration Committee being satisfied that the remuneration arrangements from his previous employment have been forfeited. There are no other performance conditions. During the year ended 31 March 2018, 256,892 shares vested. The remaining 256,892 shares will vest on 31 December 2018.
Electrocomponents plcAnnual Report and Accounts for the year ended 31 March 2018 101
FINA
NC
IAL S
TATEM
ENT
S

GROUP ACCOUNTS CONTINUED
NOTES TO THE GROUP ACCOUNTS CONTINUED
102 Electrocomponents plc Annual Report and Accounts for the year ended 31 March 2018
8 Share-based payments continued Long Term Incentive Plan (LTIP) – equity settled and cash settled The Group has two active LTIPs: the LTIP 2014 and the LTIP 2016. Under the LTIPs, awards of shares are made to plan participants subject to service conditions and, generally, performance conditions. At the vesting date, the share award will either vest, in full or in part, or expire depending on the outcome of the performance conditions.
Those awards made under the LTIP 2014 in July 2014 and July 2015 that are subject to performance conditions are subject to a market performance condition based on Total Shareholder Return (TSR) of the Group versus the FTSE 250 and a non-market performance condition based on cumulative growth in adjusted earnings per share (EPS) over the vesting period.
Under the LTIP 2016, awards are subject to a market performance condition based on TSR of the Group versus a defined comparator group (see the Directors’ Remuneration Report for details), a non-market performance condition based on cumulative growth in adjusted EPS over the vesting period and a non-market performance condition based on Group ROCE. Awards under the LTIP 2016 may include a further award (a multiplier) that vests if the Group achieves exceptional adjusted EPS performance over the vesting period.
Some of the awards are equity-settled and some are cash-settled. All awards have nil exercise price and receive accrued dividends on settlement.
The fair value of equity-settled LTIP awards subject to market conditions was calculated at the grant date using a Monte Carlo model, with the assumptions below.
Equity-settled LTIPs 2018 2017
Grant date Dec 2017 Jul 2017 May 2017 Nov 2016 Jul 2016
Market performance conditions
Awards granted 37,939 170 210,816 37,500 297,971
Fair value at grant date 334p 343p 330p 162p 123p
Assumptions used:
Share price 610p 602p 580p 442p 285p
Expected volatility 32.2% 33.0% 33.2% 36.8% 34.5%
Expected life 2 years
5 months 3 years 3 years 2 years
8 months 3 years
Expected dividend yield 2.02% 2.85% 2.03% 4.35% 4.94%
Risk-free interest rate 0.49% 0.44% 0.15% 0.26% 0.25%
Other conditions
Awards granted 199,951 511 987,430 187,499 1,616,170
Fair value at grant date 610p 602p 580p 442p 285p
Expected volatility was estimated based on the historical volatility of the Company’s shares over the most recent period commensurate to the expected life of the award. Expected dividend yield was the annual dividend yield as of the grant date. The risk-free interest rate represents the yield, at the grant date, of UK government bonds with duration commensurate to the expected life of the award.
The fair value of cash-settled LTIP awards is the year-end share price of 600p (2017: 437p).
Cash-settled LTIPs 2018 2017
Grant date Dec 2017 Jul 2017 May 2017 Jul 2016
Market performance conditions – awards granted 6,628 3,292 58,492 78,896
Other conditions – awards granted 33,142 16,461 250,886 461,532
The movements in the LTIP awards (equity and cash settled) were:
2018 Number of
awards
2017 Number of
awards
Outstanding at 1 April 4,655,958 3,374,386
Forfeited during the year (409,217) (840,838)
Expired during the year (198,863) (369,925)
Exercised during the year (402,969) (187,233)
Granted during the year 1,805,718 2,679,568
Outstanding at 31 March 5,450,627 4,655,958
102 Annual Report and Accounts for the year ended 31 March 2018 Electrocomponents plc
GROUP ACCOUNTS CONTINUED
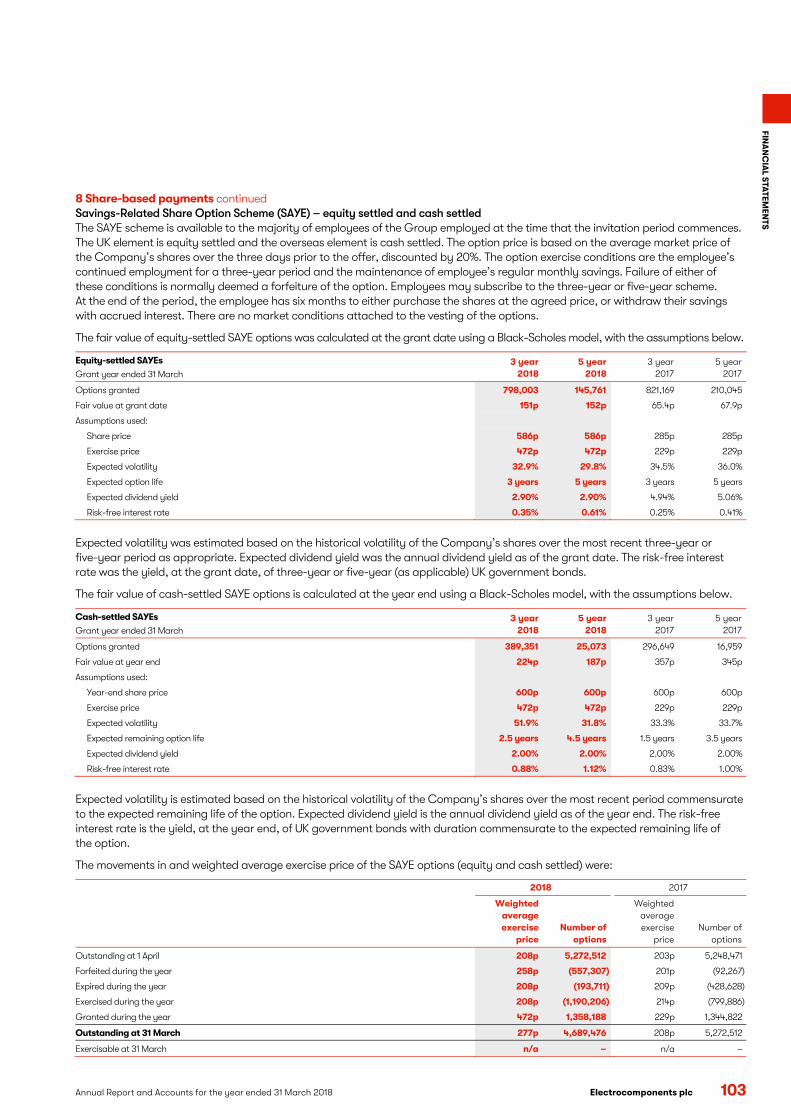
Annual Report and Accounts for the year ended 31 March 2018 Electrocomponents plc 103
FINA
NC
IAL S
TA
TEMEN
TS
8 Share-based payments continued Savings-Related Share Option Scheme (SAYE) – equity settled and cash settled The SAYE scheme is available to the majority of employees of the Group employed at the time that the invitation period commences. The UK element is equity settled and the overseas element is cash settled. The option price is based on the average market price of the Company’s shares over the three days prior to the offer, discounted by 20%. The option exercise conditions are the employee’s continued employment for a three-year period and the maintenance of employee’s regular monthly savings. Failure of either of these conditions is normally deemed a forfeiture of the option. Employees may subscribe to the three-year or five-year scheme. At the end of the period, the employee has six months to either purchase the shares at the agreed price, or withdraw their savings with accrued interest. There are no market conditions attached to the vesting of the options.
The fair value of equity-settled SAYE options was calculated at the grant date using a Black-Scholes model, with the assumptions below.
Equity-settled SAYEs
Grant year ended 31 March 3 year
2018 5 year
2018 3 year
2017 5 year
2017
Options granted 798,003 145,761 821,169 210,045
Fair value at grant date 151p 152p 65.4p 67.9p
Assumptions used:
Share price 586p 586p 285p 285p
Exercise price 472p 472p 229p 229p
Expected volatility 32.9% 29.8% 34.5% 36.0%
Expected option life 3 years 5 years 3 years 5 years
Expected dividend yield 2.90% 2.90% 4.94% 5.06%
Risk-free interest rate 0.35% 0.61% 0.25% 0.41%
Expected volatility was estimated based on the historical volatility of the Company’s shares over the most recent three-year or five-year period as appropriate. Expected dividend yield was the annual dividend yield as of the grant date. The risk-free interest rate was the yield, at the grant date, of three-year or five-year (as applicable) UK government bonds.
The fair value of cash-settled SAYE options is calculated at the year end using a Black-Scholes model, with the assumptions below.
Cash-settled SAYEs
Grant year ended 31 March 3 year
2018 5 year
2018 3 year
2017 5 year
2017
Options granted 389,351 25,073 296,649 16,959
Fair value at year end 224p 187p 357p 345p
Assumptions used:
Year-end share price 600p 600p 600p 600p
Exercise price 472p 472p 229p 229p
Expected volatility 51.9% 31.8% 33.3% 33.7%
Expected remaining option life 2.5 years 4.5 years 1.5 years 3.5 years
Expected dividend yield 2.00% 2.00% 2.00% 2.00%
Risk-free interest rate 0.88% 1.12% 0.83% 1.00%
Expected volatility is estimated based on the historical volatility of the Company’s shares over the most recent period commensurate to the expected remaining life of the option. Expected dividend yield is the annual dividend yield as of the year end. The risk-free interest rate is the yield, at the year end, of UK government bonds with duration commensurate to the expected remaining life of the option.
The movements in and weighted average exercise price of the SAYE options (equity and cash settled) were:
2018 2017
Weighted average exercise
price Number of
options
Weighted average exercise
price Number of
options
Outstanding at 1 April 208p 5,272,512 203p 5,248,471
Forfeited during the year 258p (557,307) 201p (92,267)
Expired during the year 208p (193,711) 209p (428,628)
Exercised during the year 208p (1,190,206) 214p (799,886)
Granted during the year 472p 1,358,188 229p 1,344,822
Outstanding at 31 March 277p 4,689,476 208p 5,272,512
Exercisable at 31 March n/a – n/a –
Electrocomponents plcAnnual Report and Accounts for the year ended 31 March 2018 103
FINA
NC
IAL S
TATEM
ENT
S

GROUP ACCOUNTS CONTINUED
NOTES TO THE GROUP ACCOUNTS CONTINUED
104 Electrocomponents plc Annual Report and Accounts for the year ended 31 March 2018
8 Share-based payments continued SAYE options outstanding at the year end were:
2018 2017
Option prices:
£1.00–£1.99 2,019,398 2,617,232
£2.00–£2.99 1,772,882 2,655,280
£4.00–£4.99 897,196 –
4,689,476 5,272,512
Weighted average remaining contractual life (in years) 1.59 1.71
The weighted average share price during the period of exercise of SAYE options was 517p (2017: 313p).
9 Retirement benefit obligations For defined benefit schemes, the surplus or deficit recognised in the balance sheet is the difference between the fair value of the scheme assets and the present value of the obligations at the balance sheet date. The present value of the obligations is measured using the projected unit credit method and a discount rate reflecting yields on high-quality corporate bonds. The operating profit charge comprises the current service cost, net interest cost, past service costs, curtailment gains and losses and settlement gains and losses. The net interest cost is based on the discount rate at the beginning of the year, contributions paid in and the surplus or deficit during the year. Past service costs and curtailment gains and losses are recognised at the earlier of when the scheme amendment or curtailment occurs and when any related reorganisation costs or termination benefits are recognised. Settlement gains and losses are recognised when the settlement occurs. Remeasurements, representing returns on scheme assets excluding amounts included in interest and actuarial gains and losses arising from changes in demographic and financial assumptions and experience adjustments, are recognised in other comprehensive income.
The Group’s largest defined benefit pension scheme is in the UK, providing benefits based on final pensionable pay for eligible employees who joined on or before 1 April 2003. The scheme is administered by a corporate trustee and the funds are independent of the Group’s finances. For UK employees who joined after 1 April 2003 the Group provides a defined contribution pension scheme. The Group also has defined benefit pension schemes in Germany and the Republic of Ireland, which are closed to both new members and accruals for future service, and defined benefit retirement indemnity schemes in France and Italy.
For defined contribution schemes, the costs are charged to operating profit as they fall due. The Group has defined contribution schemes in the UK, Australia, North America, Germany and the Republic of Ireland. The Group also contributes to government schemes in France, Italy, Scandinavia and Asia and these are defined contribution schemes.
Regulatory framework and governance The UK scheme, the Electrocomponents Group Pension Scheme, is a registered scheme established under trust law and, as such, is subject to UK pension, tax and trust legislation. It is managed by a corporate trustee, Electrocomponents Pension Trustees Limited (the Trustee). The Trustee includes representatives appointed by both the Company and employees. Although the Company bears the financial cost of the scheme the Trustee directors are responsible for the overall management of the scheme, including compliance with applicable regulations and legislation. The Trustee directors are required by law to act in the interest of all relevant beneficiaries and to set certain policies, to manage the day-to-day administration of the benefits and to set the scheme investment strategy in consultation with the Company.
UK pensions are regulated by the Pensions Regulator whose statutory objectives and regulatory powers are described on its website: www.thepensionsregulator.gov.uk.
Deficit position and funding The rules of the Electrocomponents Group Pension Scheme give the Trustee powers to wind up the scheme, which it may exercise if the Trustee is aware that the assets of the scheme are insufficient to meet its liabilities. Although the scheme is currently in deficit on a statutory funding basis, the Trustee and the Company have agreed a plan to eliminate the deficit over time and the Trustee has confirmed that it has no current intention of exercising its power to wind up the scheme.
The funding of the UK defined benefit scheme is assessed using assumptions in accordance with the advice of independent actuaries. These assumptions may be different to those used for the accounting valuation. The last triennial funding valuation was carried out as at 31 March 2016 and revealed a funding deficit of £60.8 million. Under the associated recovery plan, the Company agreed to make shortfall contribution payments of £4.3 million per annum throughout the period to 28 February 2023. For the period up to 28 February 2023, the Company may also be required to pay an additional shortfall contribution of up to £2.7 million per annum and this payment will be dependent on the Trustee’s assessment of the scheme’s funding position at the preceding March. Both of these shortfall contributions increase at each 1 April in line with the Retail Price Index for the year to the preceding December.
Based on the funding position as at 31 March 2018, in the year to 31 March 2019 the Group expects to contribute £10.4 million to the UK defined benefit scheme, including £7.5 million of shortfall contribution payments, and £0.5 million to the other defined benefit schemes.
104 Annual Report and Accounts for the year ended 31 March 2018 Electrocomponents plc
GROUP ACCOUNTS CONTINUED

Annual Report and Accounts for the year ended 31 March 2018 Electrocomponents plc 105
FINA
NC
IAL S
TA
TEMEN
TS
9 Retirement benefit obligations continued Based on the schemes’ rules IFRIC 14 applies, as the Company has assessed it does not have an unconditional right to any surplus that may arise on the schemes. At 31 March 2018, all schemes were in a deficit position so no adjustments under IFRIC 14 have been made. In addition, the Company has not disclosed any further liabilities at 31 March 2018 under the minimum funding requirements as these are lower than the accounting deficit.
Investment strategy and risk exposure The defined benefit schemes expose the Group to actuarial risks such as longevity, interest rate, inflation and investment risks. For the UK scheme, following consultation with the Company, the Trustee has reviewed the investment strategy with the aim of de-risking the investments over time. Following this review, a de-risking cash flow driven investment strategy has been developed which will see a move away from growth assets (equities and diversified growth funds) to a predominantly fixed income strategy with lower risk credit assets, gilts and corporate bonds. The approach for managing the UK scheme’s risks is set out below.
Interest rate risk The Trustee has set a benchmark for total investment in bonds (government and corporate), interest rate swaps, inflation swaps, gilt repurchase agreements and cash as part of its matching asset portfolio (comprising the qualifying investor alternative investment fund (QIAIF), a bespoke pooled structure in which the scheme is the sole investor). Under this strategy, if gilt yields fall, the value of the investments within the matching asset portfolio will rise to help match the increase in the valuation of the liabilities arising from a fall in the discount rate, which is derived from gilt yields. Similarly, if gilt yields rise, the value of the matching asset portfolio will fall, as will the valuation of the liabilities because of an increase in the discount rate.
Inflation risk The scheme holds index-linked gilts, inflation swaps and repurchase agreements to manage against inflation risk associated with pension liability increases.
Longevity risk Prudent mortality assumptions are used that appropriately allow for future improvements in life expectancy. These assumptions are reviewed on a regular basis to ensure they remain appropriate. The Trustee uses the Club Vita Service to provide a better estimate of the mortality rates of the scheme’s membership than the standard tables. With effect from 1 June 2008 the scheme introduced a mortality risk sharing mechanism whereby members’ benefits for pensionable service after 1 June 2008 will be reduced if the life expectancy of the scheme’s members increase more quickly than a pre-determined rate.
Assumptions Financial assumptions The principal assumptions used to determine the defined benefit obligations were:
2018 2017
UK Other UK Other
Discount rate 2.70% 1.74% 2.60% 1.87%
Rate of increase in pensionable salaries Nil 2.13% Nil 2.13%
Rate of RPI inflation 3.00% 1.73% 3.10% 1.73%
Rate of CPI inflation 2.00% 1.73% 2.10% 1.73%
Rate of pension increases
RPI inflation capped at 5.0% p.a. 2.90% n/a 3.05% n/a
RPI inflation capped at 2.5% p.a. 2.05% n/a 2.20% n/a
Life expectancy assumptions Based upon the demographics of scheme members, the weighted average life expectancy assumptions used to determine the UK defined benefit obligations were:
2018 Years
2017 Years
Member aged 65 (current life expectancy) – male 22.7 22.7
Member aged 65 (current life expectancy) – female 24.0 23.9
Member aged 45 (life expectancy at aged 65) – male 24.0 23.9
Member aged 45 (life expectancy at aged 65) – female 26.6 26.5
At 31 March 2018, the weighted average duration of the UK defined benefit obligation was 20 years.
Electrocomponents plcAnnual Report and Accounts for the year ended 31 March 2018 105
FINA
NC
IAL S
TATEM
ENT
S
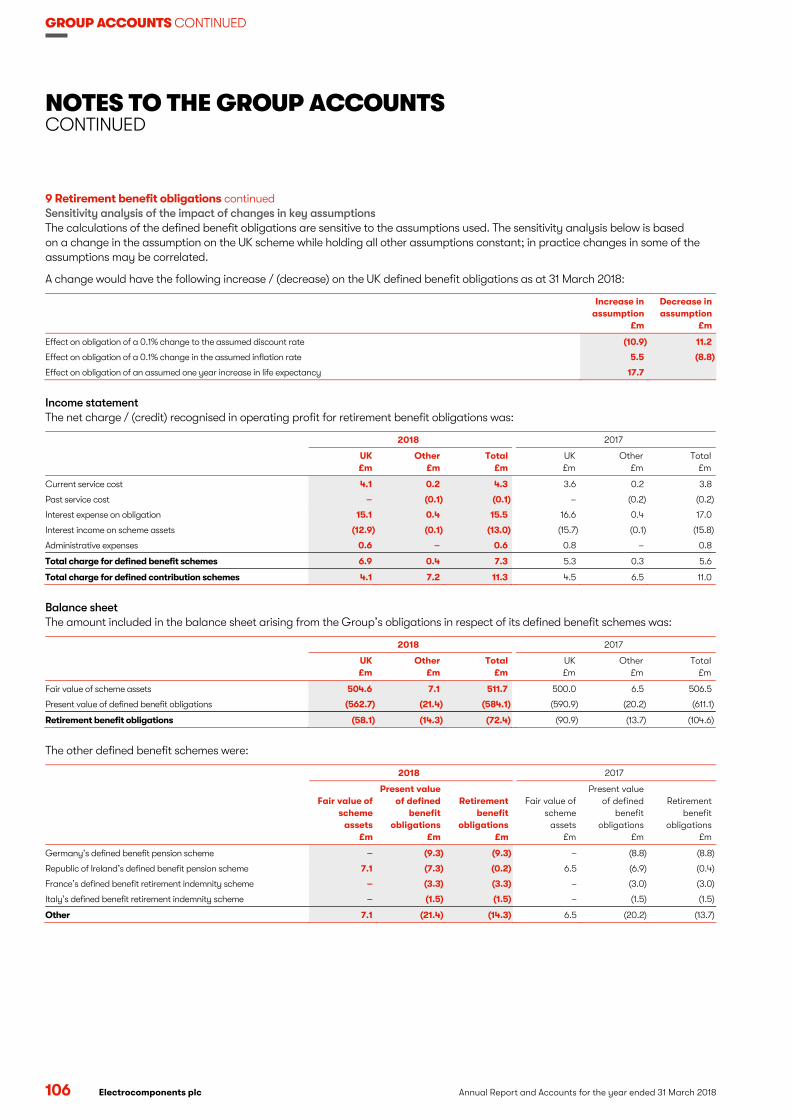
GROUP ACCOUNTS CONTINUED
NOTES TO THE GROUP ACCOUNTS CONTINUED
106 Electrocomponents plc Annual Report and Accounts for the year ended 31 March 2018
9 Retirement benefit obligations continued Sensitivity analysis of the impact of changes in key assumptions The calculations of the defined benefit obligations are sensitive to the assumptions used. The sensitivity analysis below is based on a change in the assumption on the UK scheme while holding all other assumptions constant; in practice changes in some of the assumptions may be correlated.
A change would have the following increase / (decrease) on the UK defined benefit obligations as at 31 March 2018:
Increase in assumption
£m
Decrease in assumption
£m
Effect on obligation of a 0.1% change to the assumed discount rate (10.9) 11.2
Effect on obligation of a 0.1% change in the assumed inflation rate 5.5 (8.8)
Effect on obligation of an assumed one year increase in life expectancy 17.7
Income statement The net charge / (credit) recognised in operating profit for retirement benefit obligations was:
2018 2017
UK £m
Other £m
Total £m
UK £m
Other £m
Total £m
Current service cost 4.1 0.2 4.3 3.6 0.2 3.8
Past service cost – (0.1) (0.1) – (0.2) (0.2)
Interest expense on obligation 15.1 0.4 15.5 16.6 0.4 17.0
Interest income on scheme assets (12.9) (0.1) (13.0) (15.7) (0.1) (15.8)
Administrative expenses 0.6 – 0.6 0.8 – 0.8
Total charge for defined benefit schemes 6.9 0.4 7.3 5.3 0.3 5.6
Total charge for defined contribution schemes 4.1 7.2 11.3 4.5 6.5 11.0
Balance sheet The amount included in the balance sheet arising from the Group’s obligations in respect of its defined benefit schemes was:
2018 2017
UK £m
Other £m
Total £m
UK £m
Other £m
Total £m
Fair value of scheme assets 504.6 7.1 511.7 500.0 6.5 506.5
Present value of defined benefit obligations (562.7) (21.4) (584.1) (590.9) (20.2) (611.1)
Retirement benefit obligations (58.1) (14.3) (72.4) (90.9) (13.7) (104.6)
The other defined benefit schemes were:
2018 2017
Fair value of scheme
assets £m
Present value of defined
benefit obligations
£m
Retirement benefit
obligations £m
Fair value of scheme
assets £m
Present value of defined
benefit obligations
£m
Retirement benefit
obligations £m
Germany’s defined benefit pension scheme – (9.3) (9.3) – (8.8) (8.8)
Republic of Ireland’s defined benefit pension scheme 7.1 (7.3) (0.2) 6.5 (6.9) (0.4)
France’s defined benefit retirement indemnity scheme – (3.3) (3.3) – (3.0) (3.0)
Italy’s defined benefit retirement indemnity scheme – (1.5) (1.5) – (1.5) (1.5)
Other 7.1 (21.4) (14.3) 6.5 (20.2) (13.7)
106 Annual Report and Accounts for the year ended 31 March 2018 Electrocomponents plc
GROUP ACCOUNTS CONTINUED
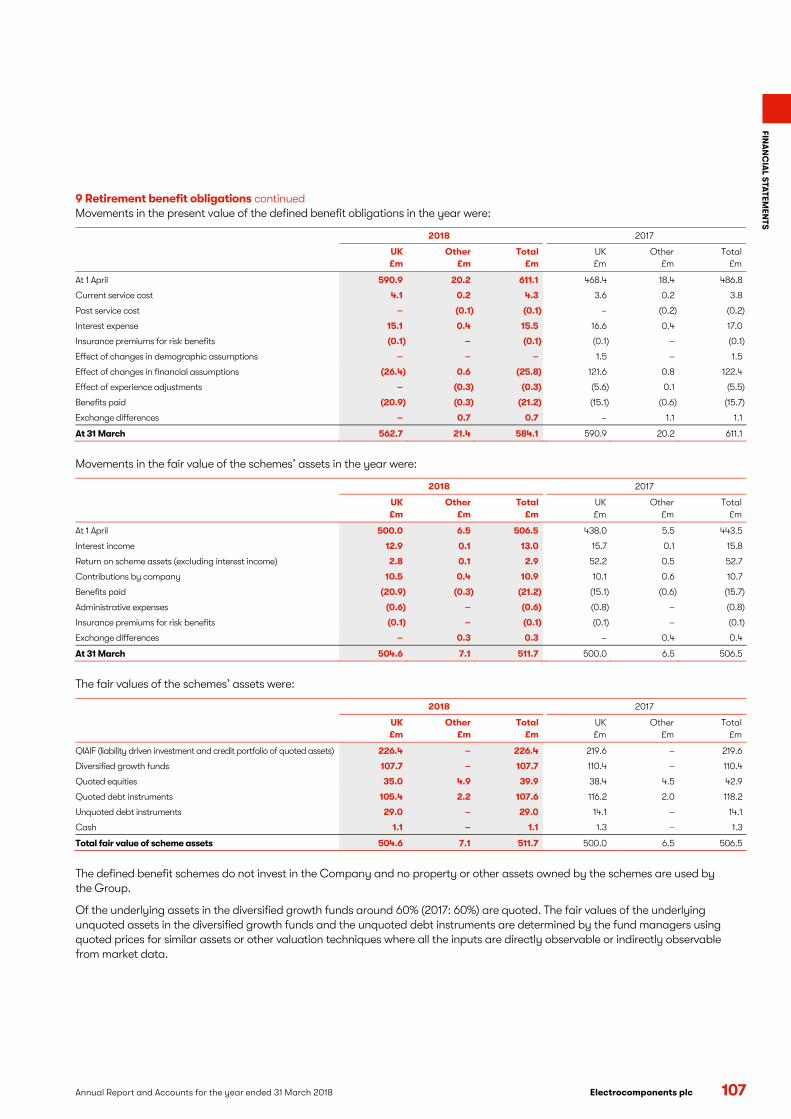
Annual Report and Accounts for the year ended 31 March 2018 Electrocomponents plc 107
FINA
NC
IAL S
TA
TEMEN
TS
9 Retirement benefit obligations continued Movements in the present value of the defined benefit obligations in the year were:
2018 2017
UK £m
Other £m
Total £m
UK £m
Other £m
Total £m
At 1 April 590.9 20.2 611.1 468.4 18.4 486.8
Current service cost 4.1 0.2 4.3 3.6 0.2 3.8
Past service cost – (0.1) (0.1) – (0.2) (0.2)
Interest expense 15.1 0.4 15.5 16.6 0.4 17.0
Insurance premiums for risk benefits (0.1) – (0.1) (0.1) – (0.1)
Effect of changes in demographic assumptions – – – 1.5 – 1.5
Effect of changes in financial assumptions (26.4) 0.6 (25.8) 121.6 0.8 122.4
Effect of experience adjustments – (0.3) (0.3) (5.6) 0.1 (5.5)
Benefits paid (20.9) (0.3) (21.2) (15.1) (0.6) (15.7)
Exchange differences – 0.7 0.7 – 1.1 1.1
At 31 March 562.7 21.4 584.1 590.9 20.2 611.1
Movements in the fair value of the schemes’ assets in the year were:
2018 2017
UK £m
Other £m
Total £m
UK £m
Other £m
Total £m
At 1 April 500.0 6.5 506.5 438.0 5.5 443.5
Interest income 12.9 0.1 13.0 15.7 0.1 15.8
Return on scheme assets (excluding interest income) 2.8 0.1 2.9 52.2 0.5 52.7
Contributions by company 10.5 0.4 10.9 10.1 0.6 10.7
Benefits paid (20.9) (0.3) (21.2) (15.1) (0.6) (15.7)
Administrative expenses (0.6) – (0.6) (0.8) – (0.8)
Insurance premiums for risk benefits (0.1) – (0.1) (0.1) – (0.1)
Exchange differences – 0.3 0.3 – 0.4 0.4
At 31 March 504.6 7.1 511.7 500.0 6.5 506.5
The fair values of the schemes’ assets were:
2018 2017
UK £m
Other £m
Total £m
UK £m
Other £m
Total £m
QIAIF (liability driven investment and credit portfolio of quoted assets) 226.4 – 226.4 219.6 – 219.6
Diversified growth funds 107.7 – 107.7 110.4 – 110.4
Quoted equities 35.0 4.9 39.9 38.4 4.5 42.9
Quoted debt instruments 105.4 2.2 107.6 116.2 2.0 118.2
Unquoted debt instruments 29.0 – 29.0 14.1 – 14.1
Cash 1.1 – 1.1 1.3 – 1.3
Total fair value of scheme assets 504.6 7.1 511.7 500.0 6.5 506.5
The defined benefit schemes do not invest in the Company and no property or other assets owned by the schemes are used by the Group.
Of the underlying assets in the diversified growth funds around 60% (2017: 60%) are quoted. The fair values of the underlying unquoted assets in the diversified growth funds and the unquoted debt instruments are determined by the fund managers using quoted prices for similar assets or other valuation techniques where all the inputs are directly observable or indirectly observable from market data.
Electrocomponents plcAnnual Report and Accounts for the year ended 31 March 2018 107
FINA
NC
IAL S
TATEM
ENT
S
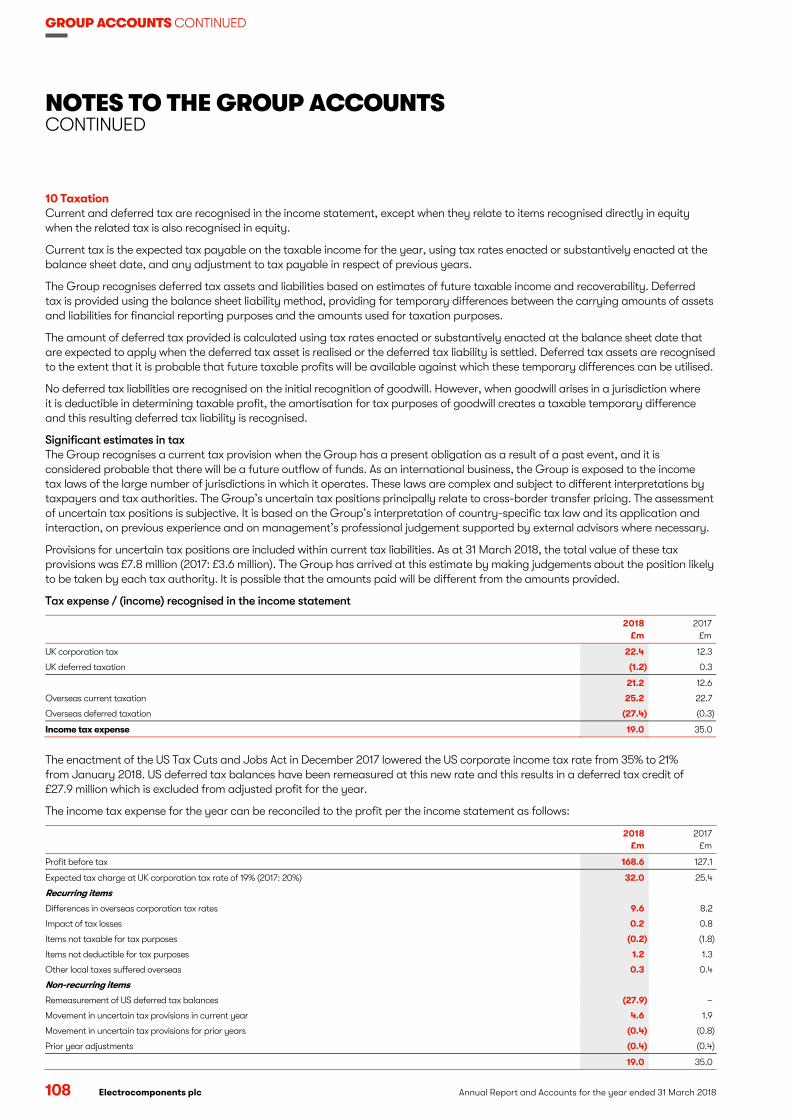
GROUP ACCOUNTS CONTINUED
NOTES TO THE GROUP ACCOUNTS CONTINUED
108 Electrocomponents plc Annual Report and Accounts for the year ended 31 March 2018
10 Taxation Current and deferred tax are recognised in the income statement, except when they relate to items recognised directly in equity when the related tax is also recognised in equity.
Current tax is the expected tax payable on the taxable income for the year, using tax rates enacted or substantively enacted at the balance sheet date, and any adjustment to tax payable in respect of previous years.
The Group recognises deferred tax assets and liabilities based on estimates of future taxable income and recoverability. Deferred tax is provided using the balance sheet liability method, providing for temporary differences between the carrying amounts of assets and liabilities for financial reporting purposes and the amounts used for taxation purposes.
The amount of deferred tax provided is calculated using tax rates enacted or substantively enacted at the balance sheet date that are expected to apply when the deferred tax asset is realised or the deferred tax liability is settled. Deferred tax assets are recognised to the extent that it is probable that future taxable profits will be available against which these temporary differences can be utilised.
No deferred tax liabilities are recognised on the initial recognition of goodwill. However, when goodwill arises in a jurisdiction where it is deductible in determining taxable profit, the amortisation for tax purposes of goodwill creates a taxable temporary difference and this resulting deferred tax liability is recognised.
Significant estimates in tax The Group recognises a current tax provision when the Group has a present obligation as a result of a past event, and it is considered probable that there will be a future outflow of funds. As an international business, the Group is exposed to the income tax laws of the large number of jurisdictions in which it operates. These laws are complex and subject to different interpretations by taxpayers and tax authorities. The Group’s uncertain tax positions principally relate to cross-border transfer pricing. The assessment of uncertain tax positions is subjective. It is based on the Group’s interpretation of country-specific tax law and its application and interaction, on previous experience and on management’s professional judgement supported by external advisors where necessary.
Provisions for uncertain tax positions are included within current tax liabilities. As at 31 March 2018, the total value of these tax provisions was £7.8 million (2017: £3.6 million). The Group has arrived at this estimate by making judgements about the position likely to be taken by each tax authority. It is possible that the amounts paid will be different from the amounts provided.
Tax expense / (income) recognised in the income statement
2018 £m
2017 £m
UK corporation tax 22.4 12.3
UK deferred taxation (1.2) 0.3
21.2 12.6
Overseas current taxation 25.2 22.7
Overseas deferred taxation (27.4) (0.3)
Income tax expense 19.0 35.0
The enactment of the US Tax Cuts and Jobs Act in December 2017 lowered the US corporate income tax rate from 35% to 21% from January 2018. US deferred tax balances have been remeasured at this new rate and this results in a deferred tax credit of £27.9 million which is excluded from adjusted profit for the year.
The income tax expense for the year can be reconciled to the profit per the income statement as follows:
2018
£m 2017
£m
Profit before tax 168.6 127.1
Expected tax charge at UK corporation tax rate of 19% (2017: 20%) 32.0 25.4
Recurring items
Differences in overseas corporation tax rates 9.6 8.2
Impact of tax losses 0.2 0.8
Items not taxable for tax purposes (0.2) (1.8)
Items not deductible for tax purposes 1.2 1.3
Other local taxes suffered overseas 0.3 0.4
Non-recurring items
Remeasurement of US deferred tax balances (27.9) –
Movement in uncertain tax provisions in current year 4.6 1.9
Movement in uncertain tax provisions for prior years (0.4) (0.8)
Prior year adjustments (0.4) (0.4)
19.0 35.0
108 Annual Report and Accounts for the year ended 31 March 2018 Electrocomponents plc
GROUP ACCOUNTS CONTINUED
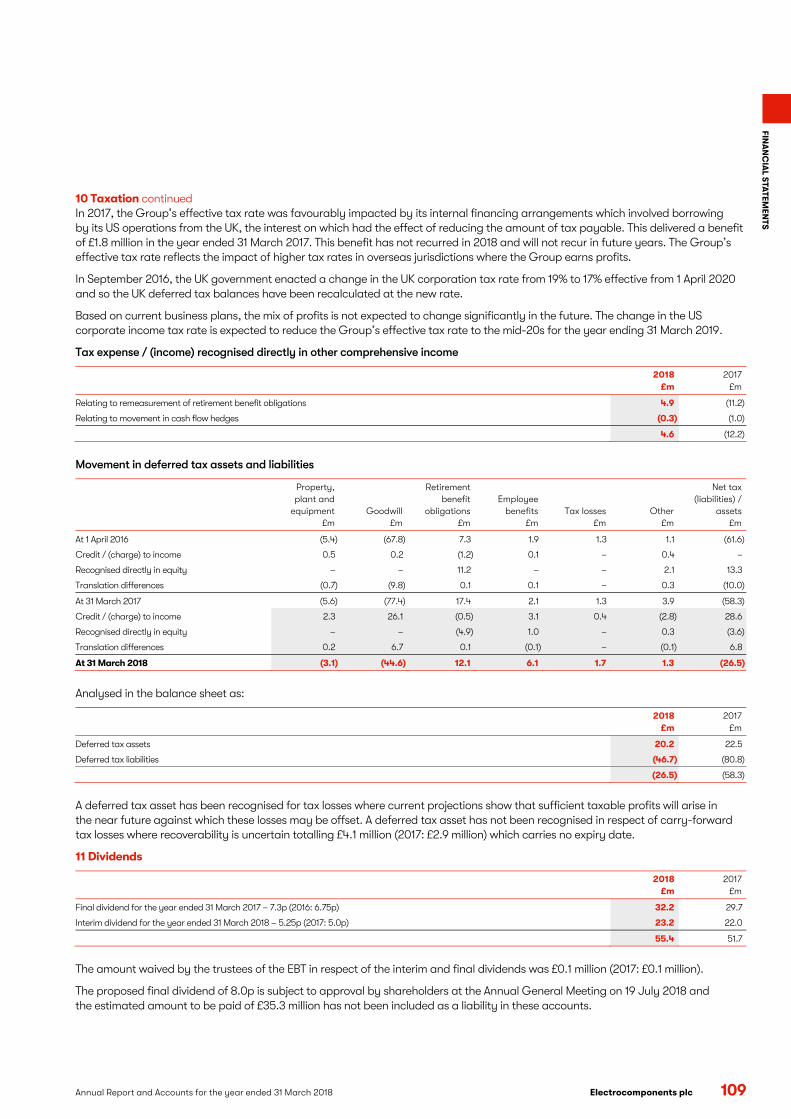
Annual Report and Accounts for the year ended 31 March 2018 Electrocomponents plc 109
FINA
NC
IAL S
TA
TEMEN
TS
10 Taxation continued In 2017, the Group’s effective tax rate was favourably impacted by its internal financing arrangements which involved borrowing by its US operations from the UK, the interest on which had the effect of reducing the amount of tax payable. This delivered a benefit of £1.8 million in the year ended 31 March 2017. This benefit has not recurred in 2018 and will not recur in future years. The Group’s effective tax rate reflects the impact of higher tax rates in overseas jurisdictions where the Group earns profits.
In September 2016, the UK government enacted a change in the UK corporation tax rate from 19% to 17% effective from 1 April 2020 and so the UK deferred tax balances have been recalculated at the new rate.
Based on current business plans, the mix of profits is not expected to change significantly in the future. The change in the US corporate income tax rate is expected to reduce the Group’s effective tax rate to the mid-20s for the year ending 31 March 2019.
Tax expense / (income) recognised directly in other comprehensive income
2018
£m 2017
£m
Relating to remeasurement of retirement benefit obligations 4.9 (11.2)
Relating to movement in cash flow hedges (0.3) (1.0)
4.6 (12.2)
Movement in deferred tax assets and liabilities
Property, plant and
equipment £m
Goodwill £m
Retirement benefit
obligations £m
Employee benefits
£m Tax losses
£m Other
£m
Net tax (liabilities) /
assets £m
At 1 April 2016 (5.4) (67.8) 7.3 1.9 1.3 1.1 (61.6)
Credit / (charge) to income 0.5 0.2 (1.2) 0.1 – 0.4 –
Recognised directly in equity – – 11.2 – – 2.1 13.3
Translation differences (0.7) (9.8) 0.1 0.1 – 0.3 (10.0)
At 31 March 2017 (5.6) (77.4) 17.4 2.1 1.3 3.9 (58.3)
Credit / (charge) to income 2.3 26.1 (0.5) 3.1 0.4 (2.8) 28.6
Recognised directly in equity – – (4.9) 1.0 – 0.3 (3.6)
Translation differences 0.2 6.7 0.1 (0.1) – (0.1) 6.8
At 31 March 2018 (3.1) (44.6) 12.1 6.1 1.7 1.3 (26.5)
Analysed in the balance sheet as:
2018
£m 2017
£m
Deferred tax assets 20.2 22.5
Deferred tax liabilities (46.7) (80.8)
(26.5) (58.3)
A deferred tax asset has been recognised for tax losses where current projections show that sufficient taxable profits will arise in the near future against which these losses may be offset. A deferred tax asset has not been recognised in respect of carry-forward tax losses where recoverability is uncertain totalling £4.1 million (2017: £2.9 million) which carries no expiry date.
11 Dividends
2018 £m
2017 £m
Final dividend for the year ended 31 March 2017 – 7.3p (2016: 6.75p) 32.2 29.7
Interim dividend for the year ended 31 March 2018 – 5.25p (2017: 5.0p) 23.2 22.0
55.4 51.7
The amount waived by the trustees of the EBT in respect of the interim and final dividends was £0.1 million (2017: £0.1 million).
The proposed final dividend of 8.0p is subject to approval by shareholders at the Annual General Meeting on 19 July 2018 and the estimated amount to be paid of £35.3 million has not been included as a liability in these accounts.
Electrocomponents plcAnnual Report and Accounts for the year ended 31 March 2018 109
FINA
NC
IAL S
TATEM
ENT
S

GROUP ACCOUNTS CONTINUED
NOTES TO THE GROUP ACCOUNTS CONTINUED
110 Electrocomponents plc Annual Report and Accounts for the year ended 31 March 2018
12 Earnings per share Basic earnings per share is calculated by dividing the profit for the year attributable to owners of the Company by the weighted average number of shares in issue during the year excluding shares held by the EBT.
Diluted earnings per share is calculated by adjusting the weighted average number of shares to assume the conversion of all potentially dilutive ordinary shares. The share-based payment schemes which result in the issue of shares at a value below the market price of the shares are potentially dilutive.
2018 Number
2017 Number
Weighted average number of shares 441,149,637 440,383,896
Dilutive effect of share-based payments 4,107,325 3,339,180
Diluted weighted average number of shares 445,256,962 443,723,076
Basic earnings per share 33.9p 20.9p
Diluted earnings per share 33.6p 20.8p
13 Intangible assets Goodwill represents the excess of the fair value of the consideration of an acquisition over the fair value attributed to the net assets acquired (including contingent liabilities). Goodwill is not amortised but is reviewed annually for impairment. Acquisition-related costs are charged to the income statement as incurred.
Software and other intangible assets are stated at cost less accumulated amortisation and any provisions for impairment. Amortisation is calculated to write off the cost of software on a straight-line basis at annual rates of 10% – 50%.
Amortisation is included in distribution and marketing expenses in the income statement. The residual value is reassessed annually. Expenditure on internally generated goodwill and brands is recognised in the income statement as an expense as incurred.
Goodwill £m
Software £m
Other intangibles
£m Total
£m
Cost
At 1 April 2016 182.0 221.2 0.4 403.6
Additions – 11.9 – 11.9
Disposals – (4.2) – (4.2)
Translation differences 26.2 3.7 – 29.9
At 31 March 2017 208.2 232.6 0.4 441.2
Additions – 11.5 – 11.5
Disposals – (0.1) (0.4) (0.5)
Translation differences (21.7) (1.9) – (23.6)
At 31 March 2018 186.5 242.1 – 428.6
Amortisation
At 1 April 2016 – 161.9 0.4 162.3
Charge for the year – 18.7 – 18.7
Disposals – (2.5) – (2.5)
Translation differences – 2.4 – 2.4
At 31 March 2017 – 180.5 0.4 180.9
Charge for the year – 15.9 – 15.9
Disposals – – (0.4) (0.4)
Translation differences – (1.1) – (1.1)
At 31 March 2018 – 195.3 – 195.3
Net book value
At 31 March 2018 186.5 46.8 – 233.3
At 31 March 2017 208.2 52.1 – 260.3
As at 31 March 2018, the net book value of internally generated intangible assets included in software above was £7.1 million (2017: £6.3 million).
Of the total goodwill, £186.0 million (2017: £207.7 million) relates to the Allied cash generating unit (CGU) which is the Group’s North American business. The goodwill relating to Allied has been fully amortised for tax purposes.
110 Annual Report and Accounts for the year ended 31 March 2018 Electrocomponents plc
GROUP ACCOUNTS CONTINUED

Annual Report and Accounts for the year ended 31 March 2018 Electrocomponents plc 111
FINA
NC
IAL S
TA
TEMEN
TS
13 Intangible assets continued The Group reviews its intangible assets regularly to assess if there are any indications the assets may be impaired. In addition, goodwill and any other intangible assets that are not yet being amortised are subject to annual impairment reviews.
An impairment loss is recognised whenever the carrying amount of an asset or its CGU exceeds its recoverable amount. The recoverable amount is calculated as the higher of fair value less costs of disposal and value in use. For an asset that does not generate largely independent cash flows, the recoverable amount is determined for the CGU to which the asset belongs.
The recoverable amount of goodwill is based on value-in-use calculations, which use cash flow projections based on the Group’s budget and strategic plan which cover the next five years. The key assumptions used are the revenue and gross margin growth rates, the selection of which involves significant judgement. These are determined using internal forecasts based upon historical growth rates and future medium-term plans together with relevant macroeconomic indicators. These cash flow projections are then extrapolated using the relevant long-term growth rate for the CGU and discounted at the Group’s pre-tax weighted average cost of capital adjusted for the estimated tax cash flows and risk applicable for the CGU.
For the Allied CGU, the long-term growth rate is 2.0% (2017: 2.0%) which is consistent with the prudent market estimate of long-term average growth rates for the distribution industry and does not exceed expected long-term GDP growth for North America. The pre-tax discount rate is 9.0% (2017: 12.6%). The selection of both of these involves significant judgement.
There is significant headroom between the carrying amount and the value in use of goodwill, therefore the Directors believe that currently all reasonably likely changes in the key assumptions referred to above would not give rise to an impairment charge.
14 Property, plant and equipment Property, plant and equipment are stated at cost less accumulated depreciation and any provisions for impairment. The cost of self-constructed assets includes the cost of materials, direct labour and certain direct overheads.
No depreciation has been charged on freehold land. Other assets are depreciated to residual value, which is reassessed annually, on a straight-line basis at the following annual rates:
Freehold and leasehold buildings 2% (or the lease term if shorter) Plant and machinery 10% – 20% Computer equipment 20% – 33%
Land and buildings
£m
Plant and machinery
£m
Computer equipment
£m Total
£m
Cost
At 1 April 2016 110.8 142.4 71.4 324.6
Additions 0.3 4.2 1.9 6.4
Disposals (1.5) (2.1) (4.3) (7.9)
Translation differences 5.7 4.1 2.3 12.1
At 31 March 2017 115.3 148.6 71.3 335.2
Additions 2.0 8.2 3.2 13.4
Disposals (1.8) (0.6) (0.3) (2.7)
Translation differences (1.0) (0.9) (1.0) (2.9)
At 31 March 2018 114.5 155.3 73.2 343.0
Depreciation
At 1 April 2016 43.0 121.3 64.3 228.6
Charge for the year 2.4 5.0 3.1 10.5
Disposals (1.8) (1.7) (4.3) (7.8)
Translation differences 1.7 3.3 2.0 7.0
At 31 March 2017 45.3 127.9 65.1 238.3
Charge for the year 2.3 4.9 2.7 9.9
Disposals (0.3) (0.3) (0.3) (0.9)
Translation differences (0.1) (0.7) (0.8) (1.6)
At 31 March 2018 47.2 131.8 66.7 245.7
Net book value
At 31 March 2018 67.3 23.5 6.5 97.3
At 31 March 2017 70.0 20.7 6.2 96.9
Included in above are £2.1 million of property, plant and equipment under construction at 31 March 2018 (2017: £nil).
Electrocomponents plcAnnual Report and Accounts for the year ended 31 March 2018 111
FINA
NC
IAL S
TATEM
ENT
S

GROUP ACCOUNTS CONTINUED
NOTES TO THE GROUP ACCOUNTS CONTINUED
112 Electrocomponents plc Annual Report and Accounts for the year ended 31 March 2018
15 Capital commitments There is no capital expenditure contracted for which no provision has been made in these accounts (2017: nil).
16 Investment in joint venture The Group’s share of the post-tax profit of its joint venture is included in operating profit. The investment in the joint venture is carried in the Group balance sheet at historical cost plus post-acquisition changes in the Group’s share of the joint venture’s net assets.
2018
£m 2017
£m
At 1 April 1.0 0.7
Group’s share of profit for the year – 0.3
Group’s share of other comprehensive expense (0.1) –
Group’s share of total comprehensive (expense) / income (0.1) 0.3
Dividends (0.1) –
At 31 March 0.8 1.0
The Group owns 50% of the share capital of RS Components & Controls (India) Limited, its joint venture.
17 Inventories Inventories are valued at the lower of cost and net realisable value. Cost is calculated on a weighted average basis and for finished goods and goods for resale includes attributable overheads.
The Group estimates the net realisable value of inventories in order to determine the value of any provision required and in this estimation judgements are made in relation to the duration of product life cycles, anticipated revenue over these life cycles and the value recoverable from any inventories that exceed anticipated demand. The Group bases its estimates on historical experience and knowledge of the products on hand.
2018
£m 2017
£m
Raw materials and consumables 62.7 55.6
Finished goods and goods for resale 296.6 277.7
Gross inventories 359.3 333.3
Inventory provisions (28.3) (29.5)
Net inventories 331.0 303.8
During the year £7.9 million (2017: £6.7 million) was recognised as an expense relating to the write-down of inventories to net realisable value.
A reduction in product life cycles of one year would increase the inventory provision by £0.6 million (2017: £0.7 million). A reduction by 10 percentage points in the value recoverable from excess inventories would increase the inventory provision by £2.7 million (2017: £2.8 million).
18 Trade and other receivables
2018
£m 2017
£m
Current
Gross trade receivables 275.5 257.4
Impairment provision (4.8) (4.8)
Net trade receivables 270.7 252.6
Amounts owed by joint venture 1.8 1.2
Prepayments and accrued income 18.1 19.8
Other receivables 3.6 3.5
Current trade and other receivables 294.2 277.1
Non-current
Prepayments 0.9 –
Other receivables 4.6 4.7
Non-current other receivables 5.5 4.7
112 Annual Report and Accounts for the year ended 31 March 2018 Electrocomponents plc
GROUP ACCOUNTS CONTINUED

Annual Report and Accounts for the year ended 31 March 2018 Electrocomponents plc 113
FINA
NC
IAL S
TA
TEMEN
TS
19 Trade and other payables
2018
£m 2017
£m
Current
Trade payables 174.1 161.6
Other taxation and social security 13.5 11.8
Government grants 0.1 0.1
Cash-settled share-based payment liability 4.4 –
Accruals 88.8 83.1
Current trade and other payables 280.9 256.6
Non-current
Government grants 3.3 3.3
Cash-settled share-based payment liability 4.9 6.4
Other payables 2.0 1.9
Other employee benefits 2.5 1.8
Non-current other payables 12.7 13.4
Government grants related to expenditure on property, plant and equipment are credited to the income statement at the same rate as the depreciation on the asset to which the grants relate.
20 Financial instruments The Group uses derivative financial instruments to cover its exposure to foreign exchange and interest rate risks arising from operational and financing activities. It principally employs forward foreign exchange contracts to hedge against changes in exchange rates over fixed terms of between three and six months for the majority of its operating companies. In addition, there are a small number of cross currency interest rate swaps which swap certain fixed rate loans into fixed rates or floating rates in different currencies.
In accordance with its treasury policies, the Group designates the majority of its derivative financial instruments as cash flow hedges, fair value hedges or net investment hedges. The Group does not hold or issue derivative financial instruments for trading purposes.
Derivatives are recognised at fair value. Derivative financial instruments that do not qualify for cash flow or net investment hedge accounting are classified as held for trading and changes in their fair values are recognised in the income statement as they arise.
Cash flow hedge accounting The Group uses derivative financial instruments to hedge variability in cash flows of a recognised asset or liability, or a highly probable forecast transaction. The effective part of any gain or loss on the derivative financial instrument is recognised in other comprehensive income, whilst any ineffective part is recognised immediately in the income statement. When the hedged item subsequently results in the recognition of a non-financial asset or liability the associated cumulative gain or loss previously recognised in other comprehensive income is reclassified from equity to the initial carrying amount of the asset or liability. When the hedged item subsequently results in the recognition of a financial asset or liability, the associated cumulative gain or loss that was recognised in other comprehensive income is reclassified from equity to the income statement in the same period that the hedged item affects the income statement.
When a hedging instrument expires or is sold, terminated or exercised, or the entity revokes designation of the hedge relationship but the hedged forecast transaction is still expected to occur, the cumulative gain or loss at that point remains in equity and is reclassified from equity when the transaction occurs in accordance with the above policy. If the hedged transaction is no longer expected to take place, the cumulative unrealised gain or loss recognised in equity is reclassified to the income statement.
The fair value of forward foreign exchange contracts is the difference between their discounted contractual forward price and their current forward price. For the year ended 31 March 2018, cash flow hedge losses of £4.8 million (2017: £3.0 million gains) were reclassified from equity to inventories and cash flow hedge losses of £6.2 million (2017: £8.1 million gains) were recognised directly in equity.
Fair value hedge accounting The Group uses derivative financial instruments to hedge exposure to interest rate and exchange rate risks arising from financing activities, holding cross currency interest rate swaps which swap certain fixed rate loans into floating rates or into fixed rates in the relevant currency.
The fair value of the swaps is the market value of the swap at the balance sheet date, taking into account current interest rates. Changes in fair values of derivatives designated as fair value hedges and changes in fair value of the related hedged item are recognised directly in the income statement.
Electrocomponents plcAnnual Report and Accounts for the year ended 31 March 2018 113
FINA
NC
IAL S
TATEM
ENT
S
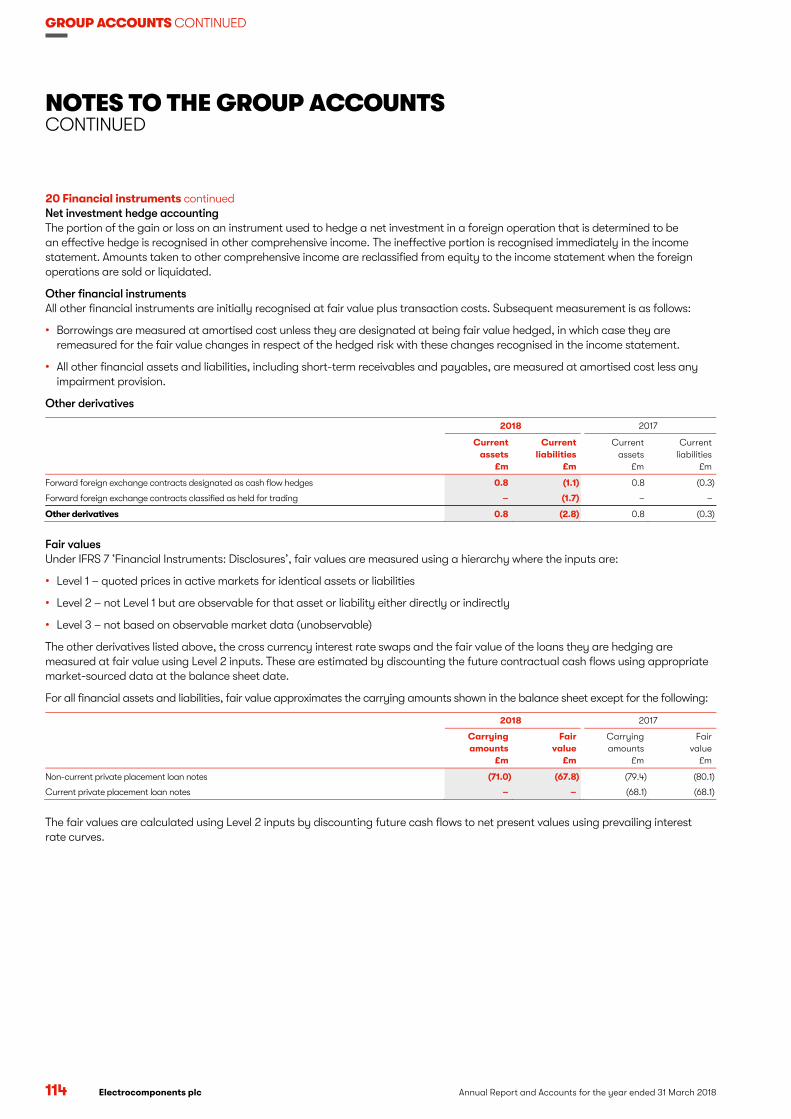
GROUP ACCOUNTS CONTINUED
NOTES TO THE GROUP ACCOUNTS CONTINUED
114 Electrocomponents plc Annual Report and Accounts for the year ended 31 March 2018
20 Financial instruments continued Net investment hedge accounting The portion of the gain or loss on an instrument used to hedge a net investment in a foreign operation that is determined to be an effective hedge is recognised in other comprehensive income. The ineffective portion is recognised immediately in the income statement. Amounts taken to other comprehensive income are reclassified from equity to the income statement when the foreign operations are sold or liquidated.
Other financial instruments All other financial instruments are initially recognised at fair value plus transaction costs. Subsequent measurement is as follows:
• Borrowings are measured at amortised cost unless they are designated at being fair value hedged, in which case they are remeasured for the fair value changes in respect of the hedged risk with these changes recognised in the income statement.
• All other financial assets and liabilities, including short-term receivables and payables, are measured at amortised cost less any impairment provision.
Other derivatives
2018 2017
Current assets
£m
Current liabilities
£m
Current assets
£m
Current liabilities
£m
Forward foreign exchange contracts designated as cash flow hedges 0.8 (1.1) 0.8 (0.3)
Forward foreign exchange contracts classified as held for trading – (1.7) – –
Other derivatives 0.8 (2.8) 0.8 (0.3)
Fair values Under IFRS 7 ‘Financial Instruments: Disclosures’, fair values are measured using a hierarchy where the inputs are:
• Level 1 – quoted prices in active markets for identical assets or liabilities
• Level 2 – not Level 1 but are observable for that asset or liability either directly or indirectly
• Level 3 – not based on observable market data (unobservable)
The other derivatives listed above, the cross currency interest rate swaps and the fair value of the loans they are hedging are measured at fair value using Level 2 inputs. These are estimated by discounting the future contractual cash flows using appropriate market-sourced data at the balance sheet date.
For all financial assets and liabilities, fair value approximates the carrying amounts shown in the balance sheet except for the following:
2018 2017
Carrying amounts
£m
Fair value
£m
Carrying amounts
£m
Fair value
£m
Non-current private placement loan notes (71.0) (67.8) (79.4) (80.1)
Current private placement loan notes – – (68.1) (68.1)
The fair values are calculated using Level 2 inputs by discounting future cash flows to net present values using prevailing interest rate curves.
114 Annual Report and Accounts for the year ended 31 March 2018 Electrocomponents plc
GROUP ACCOUNTS CONTINUED

Annual Report and Accounts for the year ended 31 March 2018 Electrocomponents plc 115
FINA
NC
IAL S
TA
TEMEN
TS
20 Financial instruments continued Netting arrangements for financial instruments The Group operates a number of cash pooling arrangements to provide the benefits of settling interest on a net basis. The balances on these accounts do not meet the criteria for offsetting and so are not presented on a net basis in the balance sheet. Where a legal right of offset exists, these are shown in the table below along with any financial instruments which can be netted under master netting arrangements.
Gross and net amounts in
balance sheet £m
Financial instruments
not offset £m
Net amounts
£m
31 March 2018
Cash and cash equivalents – cash and short-term deposits 122.9 (87.1) 35.8
Other derivative assets 0.8 (0.5) 0.3
Cash and cash equivalents – bank overdrafts (87.5) 87.1 (0.4)
Other derivative liabilities (2.8) 0.5 (2.3)
31 March 2017
Cash and cash equivalents – cash and short-term deposits 76.7 (54.3) 22.4
Other derivative assets 0.8 (0.2) 0.6
Cash and cash equivalents – bank overdrafts (55.3) 54.3 (1.0)
Other derivative liabilities (0.3) 0.2 (0.1)
21 Net debt Net debt comprises cash and cash equivalents, borrowings and cross currency interest rate swaps. Cash and cash equivalents comprises cash in hand and in current accounts, overnight deposits and short-term deposits net of overdrafts with qualifying financial institutions plus investments in money market funds. Borrowings represent term loans from qualifying financial institutions.
2018
£m 2017
£m
Cash and short-term deposits 122.9 76.7
Bank overdrafts (87.5) (55.3)
Cash and cash equivalents 35.4 21.4
2018
£m 2017
£m
Non-current borrowings
Unsecured bank facilities repayable from four to five years (29.9) (5.8)
Unsecured private placement loan notes repayable from three to four years – (79.4)
Unsecured private placement loan notes repayable from two to three years (71.0) –
Non-current borrowings (100.9) (85.2)
Current other borrowings
Unsecured private placement loan notes – (68.1)
Current other borrowings – (68.1)
Cross currency interest rate swaps designated as fair value hedges – non-current 0.5 2.2
Cross currency interest rate swaps designated as fair value hedges – current – 16.8
Cash and cash equivalents 35.4 21.4
Net debt (65.0) (112.9)
The non-current cross currency interest rate swaps designated as fair value hedges swap $20 million of the private placement loan notes from US dollars into sterling at a fixed interest rate.
Movements in net debt were:
2018
£m 2017
£m
Net debt at 1 April (112.9) (165.1)
Net increase in cash and cash equivalents 18.2 13.1
Loans drawn down (25.5) –
Loans repaid 52.8 47.6
Translation differences 2.4 (8.5)
Net debt at 31 March (65.0) (112.9)
Electrocomponents plcAnnual Report and Accounts for the year ended 31 March 2018 115
FINA
NC
IAL S
TATEM
ENT
S
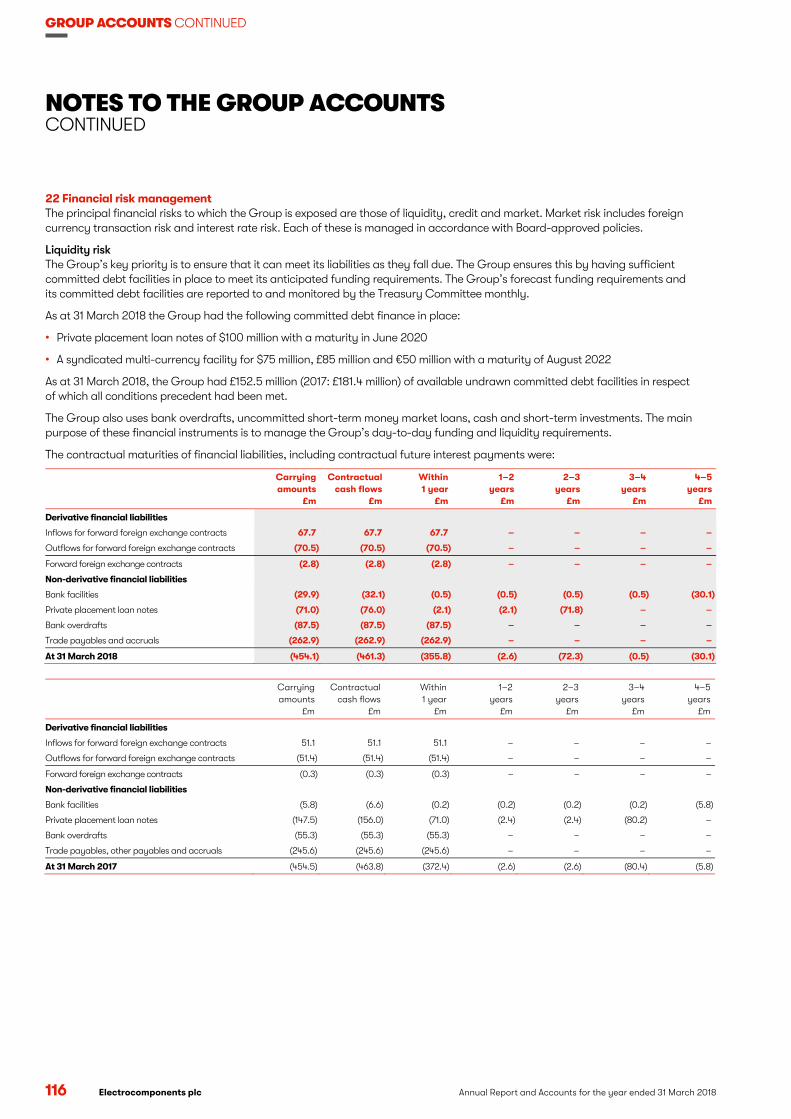
GROUP ACCOUNTS CONTINUED
NOTES TO THE GROUP ACCOUNTS CONTINUED
116 Electrocomponents plc Annual Report and Accounts for the year ended 31 March 2018
22 Financial risk management The principal financial risks to which the Group is exposed are those of liquidity, credit and market. Market risk includes foreign currency transaction risk and interest rate risk. Each of these is managed in accordance with Board-approved policies.
Liquidity risk The Group’s key priority is to ensure that it can meet its liabilities as they fall due. The Group ensures this by having sufficient committed debt facilities in place to meet its anticipated funding requirements. The Group’s forecast funding requirements and its committed debt facilities are reported to and monitored by the Treasury Committee monthly.
As at 31 March 2018 the Group had the following committed debt finance in place:
• Private placement loan notes of $100 million with a maturity in June 2020
• A syndicated multi-currency facility for $75 million, £85 million and €50 million with a maturity of August 2022
As at 31 March 2018, the Group had £152.5 million (2017: £181.4 million) of available undrawn committed debt facilities in respect of which all conditions precedent had been met.
The Group also uses bank overdrafts, uncommitted short-term money market loans, cash and short-term investments. The main purpose of these financial instruments is to manage the Group’s day-to-day funding and liquidity requirements.
The contractual maturities of financial liabilities, including contractual future interest payments were:
Carrying amounts
£m
Contractual cash flows
£m
Within 1 year
£m
1–2 years
£m
2–3 years
£m
3–4 years
£m
4–5 years
£m
Derivative financial liabilities
Inflows for forward foreign exchange contracts 67.7 67.7 67.7 – – – –
Outflows for forward foreign exchange contracts (70.5) (70.5) (70.5) – – – –
Forward foreign exchange contracts (2.8) (2.8) (2.8) – – – –
Non-derivative financial liabilities
Bank facilities (29.9) (32.1) (0.5) (0.5) (0.5) (0.5) (30.1)
Private placement loan notes (71.0) (76.0) (2.1) (2.1) (71.8) – –
Bank overdrafts (87.5) (87.5) (87.5) – – – –
Trade payables and accruals (262.9) (262.9) (262.9) – – – –
At 31 March 2018 (454.1) (461.3) (355.8) (2.6) (72.3) (0.5) (30.1)
Carrying amounts
£m
Contractual cash flows
£m
Within 1 year
£m
1–2 years
£m
2–3 years
£m
3–4 years
£m
4–5 years
£m
Derivative financial liabilities
Inflows for forward foreign exchange contracts 51.1 51.1 51.1 – – – –
Outflows for forward foreign exchange contracts (51.4) (51.4) (51.4) – – – –
Forward foreign exchange contracts (0.3) (0.3) (0.3) – – – –
Non-derivative financial liabilities
Bank facilities (5.8) (6.6) (0.2) (0.2) (0.2) (0.2) (5.8)
Private placement loan notes (147.5) (156.0) (71.0) (2.4) (2.4) (80.2) –
Bank overdrafts (55.3) (55.3) (55.3) – – – –
Trade payables, other payables and accruals (245.6) (245.6) (245.6) – – – –
At 31 March 2017 (454.5) (463.8) (372.4) (2.6) (2.6) (80.4) (5.8)
116 Annual Report and Accounts for the year ended 31 March 2018 Electrocomponents plc
GROUP ACCOUNTS CONTINUED

Annual Report and Accounts for the year ended 31 March 2018 Electrocomponents plc 117
FINA
NC
IAL S
TA
TEMEN
TS
22 Financial risk management continued Credit risk The Group is exposed to credit risk on financial assets such as cash deposits, derivative instruments and trade and other receivables.
The amounts in the balance sheet represent the maximum credit risk exposure at the balance sheet date. There were no significant concentrations of credit risk at the balance sheet date, as exposure is spread over a large number of counterparties, customers and geographic locations. The Group does not believe its credit risk has materially altered during the year.
The Group identifies counterparties of suitable creditworthiness based on ratings assigned by international credit-rating agencies and has procedures to ensure that only these parties are used, that exposure limits are set based on the external credit ratings and that these limits are not exceeded.
All operating companies have credit policies and monitor their credit exposure on an ongoing basis. Each operating company performs credit evaluations on all customers seeking credit over a certain amount. Trade receivables are stated net of allowances for doubtful receivables, estimated by local management based on prior experience of customers and assessment of their current economic environment. There are no significant individual allowances for doubtful receivables included within this amount.
For countries with no local operating company presence, export credit limits are set and monitored on a country basis monthly by the Treasury Committee.
Given the profile of our customers, whereby credit risk is spread amongst a large number of customers with small balances, no further material credit risk has been identified with the trade receivables not past due other than those balances for which an allowance has been made.
The maximum exposure to credit risk for trade receivables at the reporting date by segment was:
2018
£m 2017
£m
Northern Europe 80.9 76.8
Southern Europe 78.4 68.9
Central Europe 31.8 29.1
Total Europe 191.1 174.8
Asia Pacific 24.4 23.9
Americas 55.2 53.9
Group 270.7 252.6
The ageing of net trade receivables at the reporting date was:
2018
£m 2017
£m
Not past due 218.4 189.9
Past due 0–60 days 45.2 54.1
Past due 60–120 days 3.8 3.9
Past due >120 days 3.3 4.7
270.7 252.6
The movement in the allowance for impairment in respect of receivables during the year was as follows:
2018
£m 2017
£m
Balance at 1 April (4.8) (5.3)
Gain recognised – 0.5
Balance at 31 March (4.8) (4.8)
Financial assets included in other receivables are not past due and are not impaired.
At 31 March 2018 the maximum exposure with a single bank for deposits was £8.6 million (2017: £13.2 million) and the largest mark to market exposure for derivative financial instruments to a single bank was £0.2 million (2017: £0.5 million). The Group also uses money market funds to invest surplus cash thereby diversifying credit risk and at 31 March 2018 its exposure to these funds was £15.0 million (2017: £6.8 million).
Electrocomponents plcAnnual Report and Accounts for the year ended 31 March 2018 117
FINA
NC
IAL S
TATEM
ENT
S

GROUP ACCOUNTS CONTINUED
NOTES TO THE GROUP ACCOUNTS CONTINUED
118 Electrocomponents plc Annual Report and Accounts for the year ended 31 March 2018
22 Financial risk management continued Market risk – foreign currency transaction risk The Group is exposed to foreign currency transaction risk as it has operating companies with payables and receivables in currencies other than their functional currency. The Group also has foreign currency translation risk resulting from investment in US and European subsidiaries and debt mainly in US dollars.
Hedging of currency exposures during periods when operating companies cannot easily change their selling prices is implemented in order to shelter the forecast gross profits during those periods. In this way the impacts of currency fluctuations can be smoothed until selling prices can be changed in the light of movements in exchange rates. The hedges are enacted through forward foreign exchange contracts entered into by Group Treasury based on trading projections provided by the operating companies. The Group’s largest exposures relate to euros and US dollars. As at 31 March 2018, net forecasted exposures in euros and US dollars were hedged by euro forward foreign exchange contracts of £32.6 million (2017: £35.8 million) and US dollar forward foreign exchange contracts of £34.5 million (2017: £40.8 million).
In addition specific cash flows relating to material transactions in currencies other than the functional currency of the local business are hedged when the commitment is made.
The Group classifies forward foreign exchange contracts as hedging instruments against forecast receivables / payables and designates them as cash flow hedges for accounting purposes. The forecast cash flows are expected to occur evenly throughout the forecast period from the year end, which is between three and six months, and will affect the income statement in the period in which they occur.
Foreign currency transaction exposures, and the hedges in place to mitigate them, are monitored monthly by the Treasury Committee. The Group does not believe its foreign currency transaction risk has materially altered during the year.
The $85 million of fixed interest private placement loan notes issued in June 2010 and the related cross currency interest rate swaps (both contracted and bifurcated) that swapped the debt into sterling at floating interest rates and were designated as a fair value hedge, matured in June 2017.
In June 2015 the Group issued a further $100 million of fixed interest private placement loan notes, maturing in June 2020. Using cross currency interest rate swaps, $20 million of this debt is swapped, at a fixed interest rate into sterling and designated as a fair value hedge. It is expected to remain highly effective over the life of the private placement loan notes.
The Group has designated $80 million (2017: $80 million) of the private placement loan notes and €32.7 million (2017: €4.4 million) of external borrowings (and 2017: €28.3 million of cross currency interest rate swaps) as hedges of net investments in its US and European subsidiaries. In the year ended 31 March 2018, a foreign exchange gain of £5.7 million (2017: £9.8 million loss) was recognised in equity on net investment hedges. No other foreign currency translation exposures are explicitly hedged although local currency debt is used where economically and fiscally efficient in the financing of subsidiaries and this provides a degree of natural hedging. Guidelines are in place to manage the currency mix of the Group’s net debt. The Group does not believe its foreign currency translational risk has materially altered during the year.
Borrowings (after taking into account the effect of the cross currency interest rate swaps) are analysed by currency as:
Unsecured bank
overdrafts £m
Unsecured bank
facilities £m
Unsecured private
placement loan notes
£m Total
£m
31 March 2018
Sterling (73.0) – (13.4) (86.4)
US dollar (3.9) – (57.6) (61.5)
Hong Kong dollar (4.3) – – (4.3)
Euro (0.4) (28.7) – (29.1)
Other (5.9) (1.2) – (7.1)
Total borrowings (87.5) (29.9) (71.0) (188.4)
31 March 2017
Sterling (40.5) – (41.3) (81.8)
US dollar (2.3) – (82.1) (84.4)
Hong Kong dollar (8.5) – – (8.5)
Euro (0.3) (3.8) (24.1) (28.2)
Other (3.7) (2.0) – (5.7)
Total borrowings (55.3) (5.8) (147.5) (208.6)
118 Annual Report and Accounts for the year ended 31 March 2018 Electrocomponents plc
GROUP ACCOUNTS CONTINUED
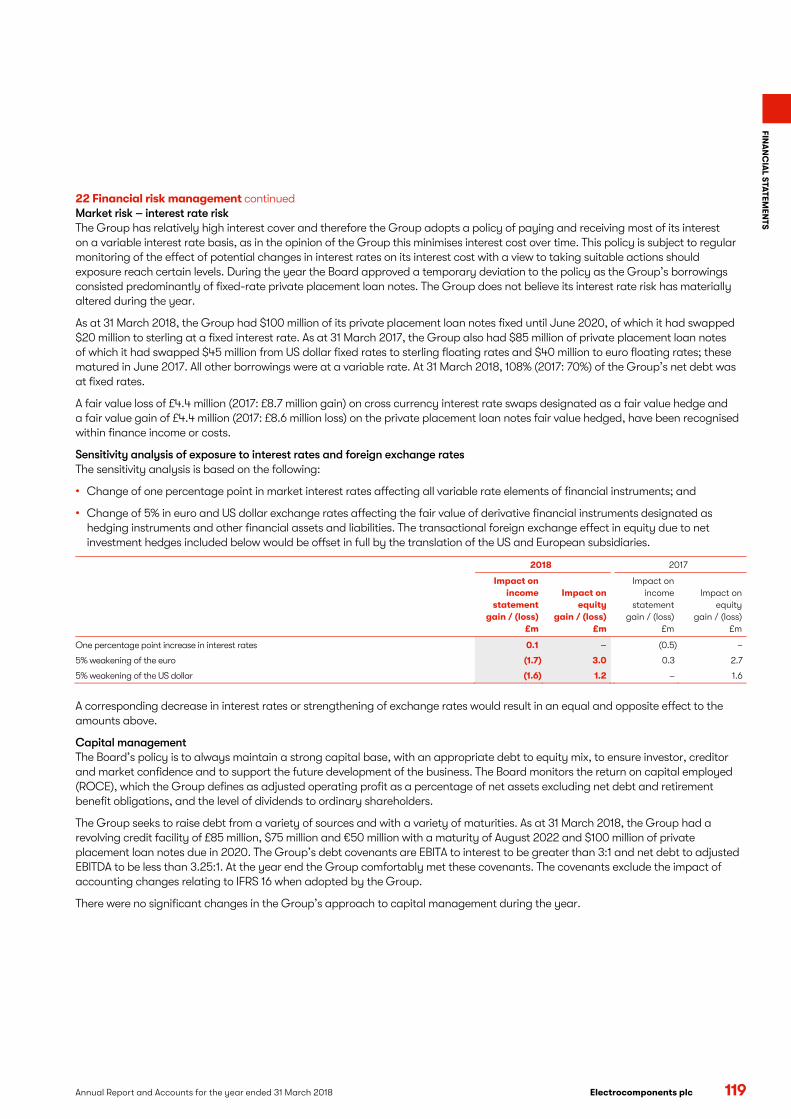
Annual Report and Accounts for the year ended 31 March 2018 Electrocomponents plc 119
FINA
NC
IAL S
TA
TEMEN
TS
22 Financial risk management continued Market risk – interest rate risk The Group has relatively high interest cover and therefore the Group adopts a policy of paying and receiving most of its interest on a variable interest rate basis, as in the opinion of the Group this minimises interest cost over time. This policy is subject to regular monitoring of the effect of potential changes in interest rates on its interest cost with a view to taking suitable actions should exposure reach certain levels. During the year the Board approved a temporary deviation to the policy as the Group’s borrowings consisted predominantly of fixed-rate private placement loan notes. The Group does not believe its interest rate risk has materially altered during the year.
As at 31 March 2018, the Group had $100 million of its private placement loan notes fixed until June 2020, of which it had swapped $20 million to sterling at a fixed interest rate. As at 31 March 2017, the Group also had $85 million of private placement loan notes of which it had swapped $45 million from US dollar fixed rates to sterling floating rates and $40 million to euro floating rates; these matured in June 2017. All other borrowings were at a variable rate. At 31 March 2018, 108% (2017: 70%) of the Group’s net debt was at fixed rates.
A fair value loss of £4.4 million (2017: £8.7 million gain) on cross currency interest rate swaps designated as a fair value hedge and a fair value gain of £4.4 million (2017: £8.6 million loss) on the private placement loan notes fair value hedged, have been recognised within finance income or costs.
Sensitivity analysis of exposure to interest rates and foreign exchange rates The sensitivity analysis is based on the following:
• Change of one percentage point in market interest rates affecting all variable rate elements of financial instruments; and
• Change of 5% in euro and US dollar exchange rates affecting the fair value of derivative financial instruments designated as hedging instruments and other financial assets and liabilities. The transactional foreign exchange effect in equity due to net investment hedges included below would be offset in full by the translation of the US and European subsidiaries.
2018 2017
Impact on income
statement gain / (loss)
£m
Impact on equity
gain / (loss) £m
Impact on income
statement gain / (loss)
£m
Impact on equity
gain / (loss) £m
One percentage point increase in interest rates 0.1 – (0.5) –
5% weakening of the euro (1.7) 3.0 0.3 2.7
5% weakening of the US dollar (1.6) 1.2 – 1.6
A corresponding decrease in interest rates or strengthening of exchange rates would result in an equal and opposite effect to the amounts above.
Capital management The Board’s policy is to always maintain a strong capital base, with an appropriate debt to equity mix, to ensure investor, creditor and market confidence and to support the future development of the business. The Board monitors the return on capital employed (ROCE), which the Group defines as adjusted operating profit as a percentage of net assets excluding net debt and retirement benefit obligations, and the level of dividends to ordinary shareholders.
The Group seeks to raise debt from a variety of sources and with a variety of maturities. As at 31 March 2018, the Group had a revolving credit facility of £85 million, $75 million and €50 million with a maturity of August 2022 and $100 million of private placement loan notes due in 2020. The Group’s debt covenants are EBITA to interest to be greater than 3:1 and net debt to adjusted EBITDA to be less than 3.25:1. At the year end the Group comfortably met these covenants. The covenants exclude the impact of accounting changes relating to IFRS 16 when adopted by the Group.
There were no significant changes in the Group’s approach to capital management during the year.
Electrocomponents plcAnnual Report and Accounts for the year ended 31 March 2018 119
FINA
NC
IAL S
TATEM
ENT
S
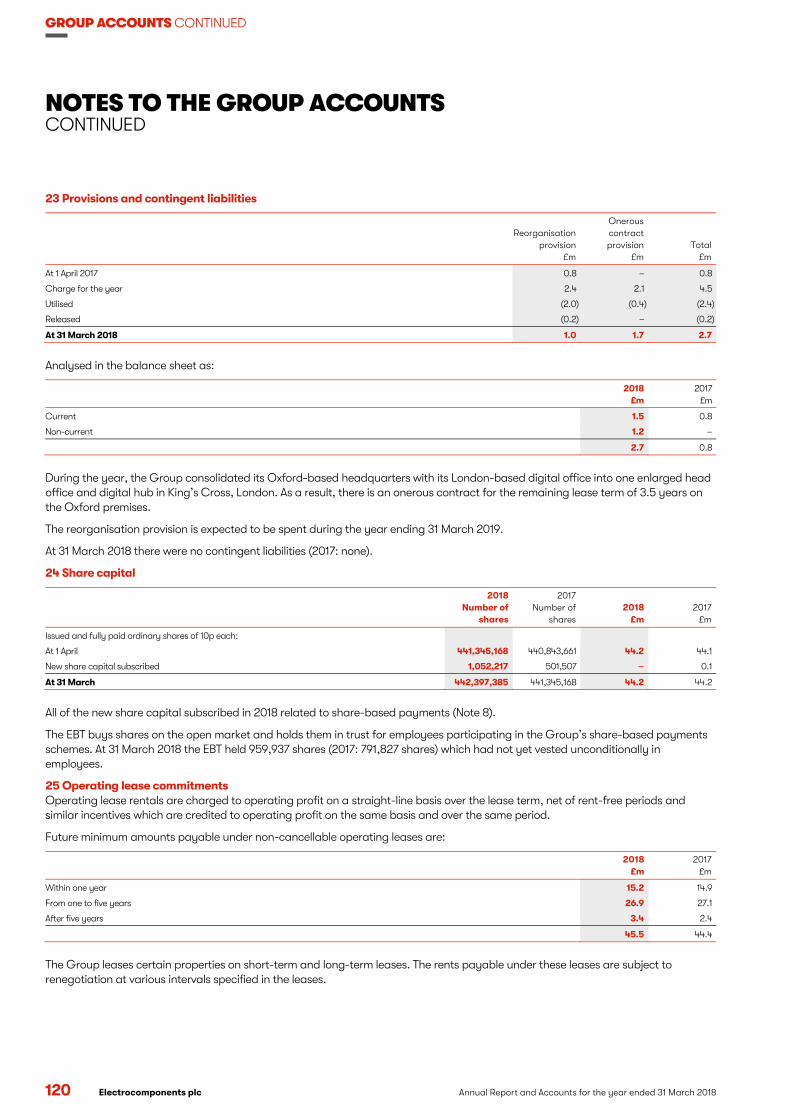
GROUP ACCOUNTS CONTINUED
NOTES TO THE GROUP ACCOUNTS CONTINUED
120 Electrocomponents plc Annual Report and Accounts for the year ended 31 March 2018
23 Provisions and contingent liabilities
Reorganisation provision
£m
Onerous contract provision
£m Total
£m
At 1 April 2017 0.8 – 0.8
Charge for the year 2.4 2.1 4.5
Utilised (2.0) (0.4) (2.4)
Released (0.2) – (0.2)
At 31 March 2018 1.0 1.7 2.7
Analysed in the balance sheet as:
2018 £m
2017 £m
Current 1.5 0.8
Non-current 1.2 –
2.7 0.8
During the year, the Group consolidated its Oxford-based headquarters with its London-based digital office into one enlarged head office and digital hub in King’s Cross, London. As a result, there is an onerous contract for the remaining lease term of 3.5 years on the Oxford premises.
The reorganisation provision is expected to be spent during the year ending 31 March 2019.
At 31 March 2018 there were no contingent liabilities (2017: none).
24 Share capital
2018 Number of
shares
2017 Number of
shares 2018
£m 2017
£m
Issued and fully paid ordinary shares of 10p each:
At 1 April 441,345,168 440,843,661 44.2 44.1
New share capital subscribed 1,052,217 501,507 – 0.1
At 31 March 442,397,385 441,345,168 44.2 44.2
All of the new share capital subscribed in 2018 related to share-based payments (Note 8).
The EBT buys shares on the open market and holds them in trust for employees participating in the Group’s share-based payments schemes. At 31 March 2018 the EBT held 959,937 shares (2017: 791,827 shares) which had not yet vested unconditionally in employees.
25 Operating lease commitments Operating lease rentals are charged to operating profit on a straight-line basis over the lease term, net of rent-free periods and similar incentives which are credited to operating profit on the same basis and over the same period.
Future minimum amounts payable under non-cancellable operating leases are:
2018
£m 2017
£m
Within one year 15.2 14.9
From one to five years 26.9 27.1
After five years 3.4 2.4
45.5 44.4
The Group leases certain properties on short-term and long-term leases. The rents payable under these leases are subject to renegotiation at various intervals specified in the leases.
120 Annual Report and Accounts for the year ended 31 March 2018 Electrocomponents plc
GROUP ACCOUNTS CONTINUED

Annual Report and Accounts for the year ended 31 March 2018 Electrocomponents plc 121
FINA
NC
IAL S
TA
TEMEN
TS
26 Related parties Transactions and balances between the Company and its subsidiaries, which are related parties, have been eliminated on consolidation.
The Group’s joint venture (Note 16) is a related party and during the year, the Group made sales of £2.1 million (2017: £1.4 million) to the joint venture, and a balance of £1.8 million (2017: £1.2 million) was outstanding at the year end.
The Group’s pension schemes are related parties and the Group’s transactions with them are disclosed in Note 9.
The key management personnel of the Group are the Directors and the Senior Management Team, whose compensation was:
2018
£m 2017
£m
Short-term employee benefits 7.9 6.3
Post-employment benefits 0.2 0.2
Termination benefits – 0.3
Share-based payments 2.3 2.6
10.4 9.4
27 Related undertakings A full list of related undertakings (comprising subsidiaries and a joint venture) is set out below. All subsidiaries are wholly owned and operate within their countries of incorporation. Those companies marked with an asterisk (*) are indirectly held by the Company.
Name and registered address of undertaking Country of incorporation
Class of share held
High-service distribution of industrial and electronic products
RS Components Pty Limited* Australia Ordinary
25, Pavesi Street, Smithfield, Sydney NSW 2164, Australia
RS Components Handelsgesellschaft m.b.H* Austria Share of equity
Albrechtser Straße 11, 3950, Gmünd, Austria
Allied Electronics (Canada), Inc.* Canada Common
199 Bay Street, Suite 5300, Toronto ON M5L 1B9, Canada
RS Componentes Electronicos Limitada* Chile Ordinary
Av. Eduardo Frei Montalva, 6001-71 Conchali, Santiago, Chile
RS Components Limited* China Ordinary
Suite 1601, Level 16, Tower 1, Kowloon Commerce Centre, 51 Kwai Cheong Road, Kwai Chung, Hong Kong
RS Components (Shanghai) Company Limited* China Common and preference 2F of No. 53 Factory Building, No. 311 of Fu Te Road (South), Waigaoqiao Free Trade Zone, Shanghai, China
RS Components A/S* Denmark Ordinary
Nattergalevej 6, 2400, København NV, Denmark
RS Components SAS* France Ordinary
Rue Norman King, 60000, Beauvais, France
RS Components GmbH* Germany Ordinary
Hessenring 13b, D-64546 Moerfelden-Walldorf, Germany
RS Components & Controls (India) Limited*† India Ordinary
222 Okhla Industrial Estate, New Delhi, India
RS Components Srl* Italy Ordinary
Viale M. De Vizzi 93/95, Cinisello Balsamo, (MI) CAP 20092, Milan, Italy
RS Components KK* Japan Ordinary
West Tower 12F, Yokohama Business Park, 134 Godocho, Hodogaya, Yokohama, Kanagawa, 240-0005, Japan
RS Components Sdn Bhd* Malaysia Ordinary
Suite 7E, Level 7, Menara Ansar, 65, Jalan Trus, Johor, 80000 Johor Bahru, Malaysia
RS Components BV* Netherlands Ordinary
Bingerweg 19, 2031 AZ Haarlem, Netherlands
RS Components Ltd* New Zealand Ordinary
Level 6, 56 Cawley Street, Ellerslie, Auckland, New Zealand
RS Components AS* Norway Ordinary
10. etg., Fredrik Selmers vei 6, Oslo, 0663, Norway
RS Components Corporation* Philippines Ordinary
21st Floor Multinational Bancorporation Centre, 6805 Ayala Avenue, Makati City, Philippines
Electrocomponents plcAnnual Report and Accounts for the year ended 31 March 2018 121
FINA
NC
IAL S
TATEM
ENT
S
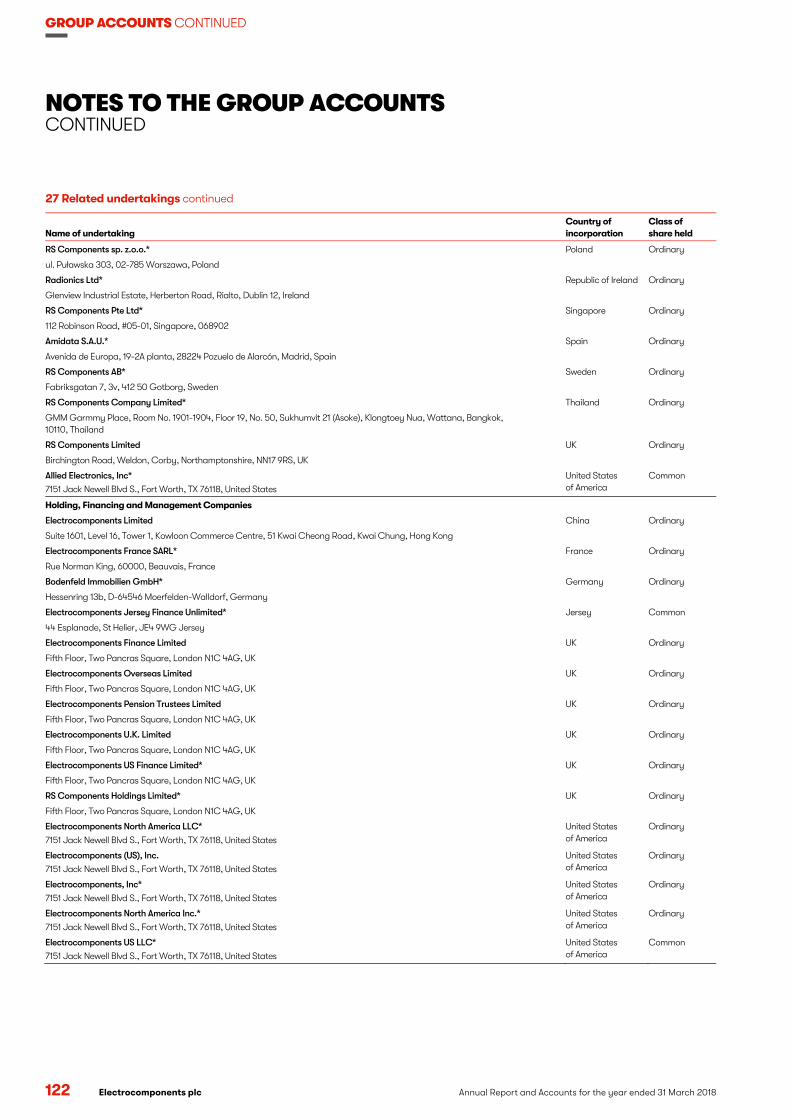
GROUP ACCOUNTS CONTINUED
NOTES TO THE GROUP ACCOUNTS CONTINUED
122 Electrocomponents plc Annual Report and Accounts for the year ended 31 March 2018
27 Related undertakings continued
Name of undertaking Country of incorporation
Class of share held
RS Components sp. z.o.o.* Poland Ordinary
ul. Puławska 303, 02-785 Warszawa, Poland
Radionics Ltd* Republic of Ireland Ordinary
Glenview Industrial Estate, Herberton Road, Rialto, Dublin 12, Ireland
RS Components Pte Ltd* Singapore Ordinary
112 Robinson Road, #05-01, Singapore, 068902
Amidata S.A.U.* Spain Ordinary
Avenida de Europa, 19-2A planta, 28224 Pozuelo de Alarcón, Madrid, Spain
RS Components AB* Sweden Ordinary
Fabriksgatan 7, 3v, 412 50 Gotborg, Sweden
RS Components Company Limited* Thailand Ordinary
GMM Garmmy Place, Room No. 1901-1904, Floor 19, No. 50, Sukhumvit 21 (Asoke), Klongtoey Nua, Wattana, Bangkok, 10110, Thailand
RS Components Limited UK Ordinary
Birchington Road, Weldon, Corby, Northamptonshire, NN17 9RS, UK
Allied Electronics, Inc*
7151 Jack Newell Blvd S., Fort Worth, TX 76118, United States
United States of America
Common
Holding, Financing and Management Companies
Electrocomponents Limited China Ordinary
Suite 1601, Level 16, Tower 1, Kowloon Commerce Centre, 51 Kwai Cheong Road, Kwai Chung, Hong Kong
Electrocomponents France SARL* France Ordinary
Rue Norman King, 60000, Beauvais, France
Bodenfeld Immobilien GmbH* Germany Ordinary
Hessenring 13b, D-64546 Moerfelden-Walldorf, Germany
Electrocomponents Jersey Finance Unlimited* Jersey Common
44 Esplanade, St Helier, JE4 9WG Jersey
Electrocomponents Finance Limited UK Ordinary
Fifth Floor, Two Pancras Square, London N1C 4AG, UK
Electrocomponents Overseas Limited UK Ordinary
Fifth Floor, Two Pancras Square, London N1C 4AG, UK
Electrocomponents Pension Trustees Limited UK Ordinary
Fifth Floor, Two Pancras Square, London N1C 4AG, UK
Electrocomponents U.K. Limited UK Ordinary
Fifth Floor, Two Pancras Square, London N1C 4AG, UK
Electrocomponents US Finance Limited* UK Ordinary
Fifth Floor, Two Pancras Square, London N1C 4AG, UK
RS Components Holdings Limited* UK Ordinary
Fifth Floor, Two Pancras Square, London N1C 4AG, UK
Electrocomponents North America LLC*
7151 Jack Newell Blvd S., Fort Worth, TX 76118, United States
United States of America
Ordinary
Electrocomponents (US), Inc.
7151 Jack Newell Blvd S., Fort Worth, TX 76118, United States
United States of America
Ordinary
Electrocomponents, Inc*
7151 Jack Newell Blvd S., Fort Worth, TX 76118, United States
United States of America
Ordinary
Electrocomponents North America Inc.*
7151 Jack Newell Blvd S., Fort Worth, TX 76118, United States
United States of America
Ordinary
Electrocomponents US LLC*
7151 Jack Newell Blvd S., Fort Worth, TX 76118, United States
United States of America
Common
122 Annual Report and Accounts for the year ended 31 March 2018 Electrocomponents plc
GROUP ACCOUNTS CONTINUED

Annual Report and Accounts for the year ended 31 March 2018 Electrocomponents plc 123
FINA
NC
IAL S
TA
TEMEN
TS
27 Related undertakings continued
Name of undertaking Country of incorporation
Class of share held
Not currently trading
RS Components Distribuição de Produtos Eletrônicos e de Manutenção Ltda* Brazil Ordinary
Av. Brigadeiro Faria Lima, 3477 – 16º andar – Itaim Bibi, São Paulo – SP, CEP 04538-133, Brazil
RS Components (Proprietary) Limited* South Africa Ordinary
20 Indianapolis Street, Kyalami Business Park, Kyalami Midrand, Gauteng, 1684, South Africa
Electro Lighting Group Ltd UK Ordinary
Fifth Floor, Two Pancras Square, London N1C 4AG, UK
Electro-Leasing Limited UK Ordinary
Fifth Floor, Two Pancras Square, London N1C 4AG, UK
Electromail Limited UK Ordinary
Fifth Floor, Two Pancras Square, London N1C 4AG, UK
Radiospares Limited UK Ordinary
Fifth Floor, Two Pancras Square, London N1C 4AG, UK
Reading Windings Limited UK Ordinary
Fifth Floor, Two Pancras Square, London N1C 4AG, UK
RS Components International Ltd UK Ordinary
Fifth Floor, Two Pancras Square, London N1C 4AG, UK
RS Group Limited UK Ordinary
Fifth Floor, Two Pancras Square, London N1C 4AG, UK
RS Limited UK Ordinary
Fifth Floor, Two Pancras Square, London N1C 4AG, UK
RS Supplies Limited UK Ordinary
Fifth Floor, Two Pancras Square, London N1C 4AG, UK
ECI-NJ, Inc *
7151 Jack Newell Blvd S., Fort Worth, TX 76118, United States
United States of America
Ordinary
† Note 16 provides details about the Company’s interest in the joint venture.
RS Components Limited (UK), Electrocomponents Limited (Hong Kong), RS Components BV (Netherlands) and RS Components GmbH (Germany) export to most countries where the Group does not have a trading company and operate branch offices in South Africa, Belgium, Switzerland, the Philippines and China (Guangzhou, Shanghai and Taiwan). RS Components Limited also operates under the names of RS Calibration, RS Mechanical and RS Health & Safety in the UK.
28 Post balance sheet events The Group is in late stage negotiations to acquire the share capital of AGHOCO 1079 Limited and its subsidiaries (IESA), a leading provider of value-added outsourcing services to industrial customers for a cash consideration of £88 million on a cash-free and debt-free basis, subject to customary adjustments. The agreement is being signed on 24 May 2018 and the acquisition is expected to be completed by the end of May and will be financed out of a new £120 million term loan, which is on comparable terms to existing debt and is also available for general purposes.
On 24 May 2018 the Group is announcing it is launching the second phase of its Performance Improvement Plan. Reorganisation costs are expected to be in the region of £12 million, likely to be mainly cash costs, depending on the final details following consultation. It is targeting annualised cost savings of £12 million by March 2021, with £4 million in the year to 31 March 2019. See page 13 for further details.
Electrocomponents plcAnnual Report and Accounts for the year ended 31 March 2018 123
FINA
NC
IAL S
TATEM
ENT
S
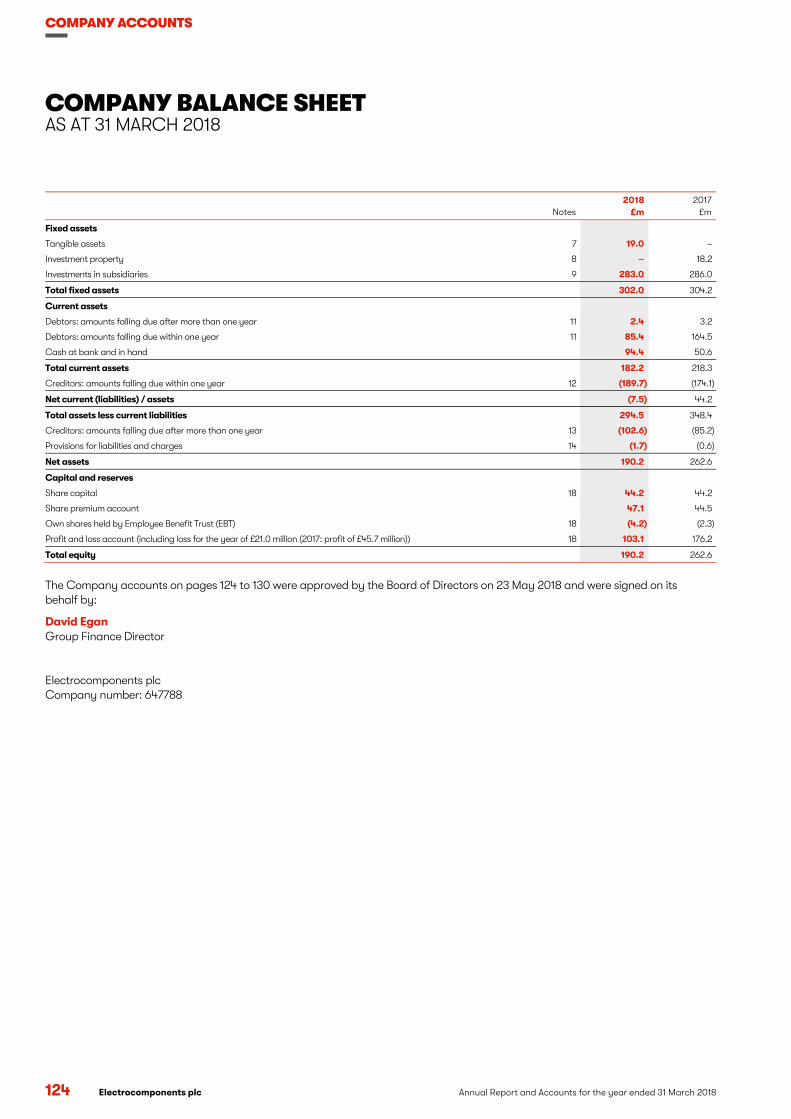
COMPANY ACCOUNTS
COMPANY BALANCE SHEET AS AT 31 MARCH 2018
124 Electrocomponents plc Annual Report and Accounts for the year ended 31 March 2018
Notes 2018
£m 2017
£m
Fixed assets
Tangible assets 7 19.0 –
Investment property 8 – 18.2
Investments in subsidiaries 9 283.0 286.0
Total fixed assets 302.0 304.2
Current assets
Debtors: amounts falling due after more than one year 11 2.4 3.2
Debtors: amounts falling due within one year 11 85.4 164.5
Cash at bank and in hand 94.4 50.6
Total current assets 182.2 218.3
Creditors: amounts falling due within one year 12 (189.7) (174.1)
Net current (liabilities) / assets (7.5) 44.2
Total assets less current liabilities 294.5 348.4
Creditors: amounts falling due after more than one year 13 (102.6) (85.2)
Provisions for liabilities and charges 14 (1.7) (0.6)
Net assets 190.2 262.6
Capital and reserves
Share capital 18 44.2 44.2
Share premium account 47.1 44.5
Own shares held by Employee Benefit Trust (EBT) 18 (4.2) (2.3)
Profit and loss account (including loss for the year of £21.0 million (2017: profit of £45.7 million)) 18 103.1 176.2
Total equity 190.2 262.6
The Company accounts on pages 124 to 130 were approved by the Board of Directors on 23 May 2018 and were signed on its behalf by:
David Egan Group Finance Director
Electrocomponents plc Company number: 647788
Annual Report and Accounts for the year ended 31 March 2018 Electrocomponents plc124
COMPANY ACCOUNTS
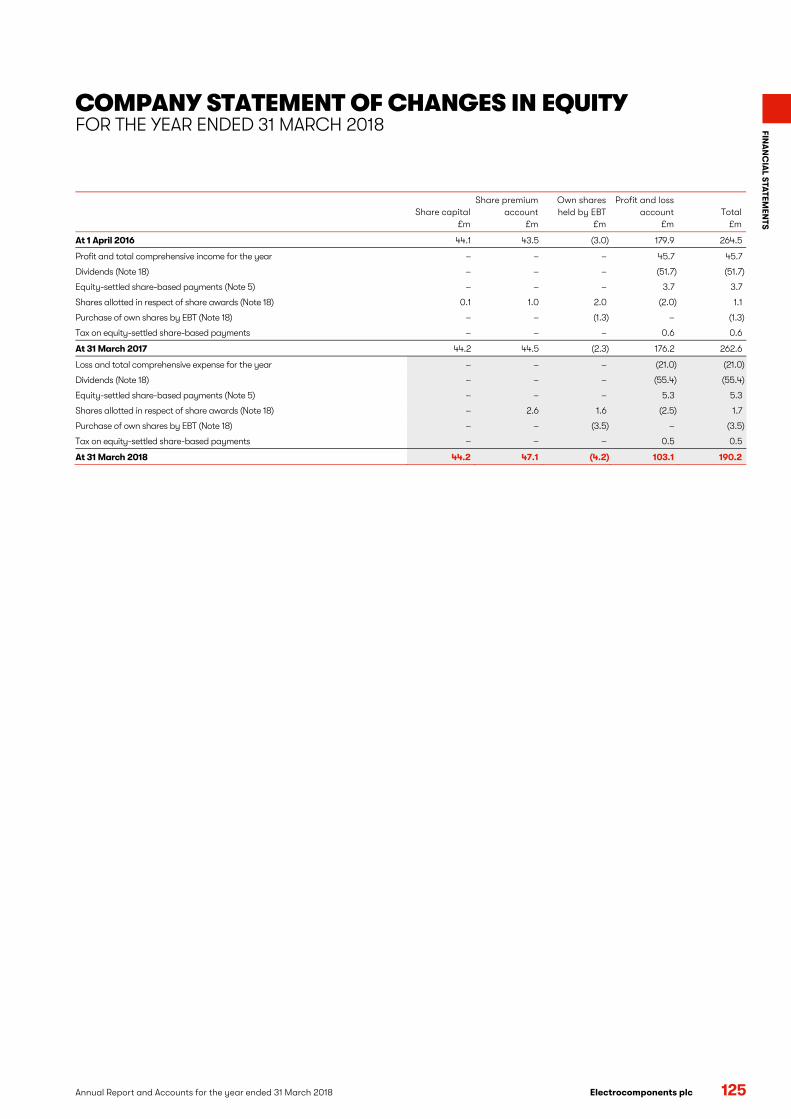
COMPANY STATEMENT OF CHANGES IN EQUITY FOR THE YEAR ENDED 31 MARCH 2018
Annual Report and Accounts for the year ended 31 March 2018 Electrocomponents plc 125
FINA
NC
IAL S
TA
TEMEN
TS
Share capital £m
Share premium account
£m
Own shares held by EBT
£m
Profit and loss account
£m Total
£m
At 1 April 2016 44.1 43.5 (3.0) 179.9 264.5
Profit and total comprehensive income for the year – – – 45.7 45.7
Dividends (Note 18) – – – (51.7) (51.7)
Equity-settled share-based payments (Note 5) – – – 3.7 3.7
Shares allotted in respect of share awards (Note 18) 0.1 1.0 2.0 (2.0) 1.1
Purchase of own shares by EBT (Note 18) – – (1.3) – (1.3)
Tax on equity-settled share-based payments – – – 0.6 0.6
At 31 March 2017 44.2 44.5 (2.3) 176.2 262.6
Loss and total comprehensive expense for the year – – – (21.0) (21.0)
Dividends (Note 18) – – – (55.4) (55.4)
Equity-settled share-based payments (Note 5) – – – 5.3 5.3
Shares allotted in respect of share awards (Note 18) – 2.6 1.6 (2.5) 1.7
Purchase of own shares by EBT (Note 18) – – (3.5) – (3.5)
Tax on equity-settled share-based payments – – – 0.5 0.5
At 31 March 2018 44.2 47.1 (4.2) 103.1 190.2
Electrocomponents plcAnnual Report and Accounts for the year ended 31 March 2018 125
FINA
NC
IAL S
TATEM
ENT
S

COMPANY ACCOUNTS CONTINUED
NOTES TO THE COMPANY ACCOUNTS
126 Electrocomponents plc Annual Report and Accounts for the year ended 31 March 2018
1 General information Electrocomponents plc (the Company) is the parent company of the Electrocomponents Group and is included in the consolidated accounts of Electrocomponents plc (the Group accounts). The Company is a public limited company and is incorporated and domiciled in England and Wales. The address of its registered office is Fifth Floor, Two Pancras Square, London N1C 4AG, UK.
2 Statement of compliance The individual accounts of the Company have been prepared in compliance with United Kingdom Accounting Standards, including Financial Reporting Standard 102 ‘The Financial Reporting Standard applicable in the UK and Republic of Ireland’ (FRS 102), and the Companies Act 2006.
3 Basis of preparation These are the Company’s separate accounts and have been prepared on a going concern basis, under the historical cost convention, as modified by the recognition of certain financial assets and liabilities measured at fair value through profit and loss. The principal accounting policies have been consistently applied unless otherwise stated.
The preparation of accounts under FRS 102 requires the Company to make judgements, estimates and assumptions that affect the application of accounting policies and reported amounts of assets and liabilities, income and expenses. There are no areas involving a higher degree of judgement or complexity, or areas where assumptions and estimates are significant that are included in these accounts.
Under section 408 of the Companies Act 2006 the Company is exempt from the requirement to present its own profit and loss account.
The Company has taken advantage of the following disclosure exemptions available under FRS 102:
i. preparation of a cash flow statement ii. financial instrument disclosures iii. share-based payment disclosures iv. key management personnel compensation disclosure
Transactions in foreign currencies are recorded using the rate ruling at the date of the transaction. Monetary assets and liabilities denominated in foreign currencies at the balance sheet date are retranslated at the rate ruling at that date and the gains and losses on translation are recognised in profit or loss.
4 Employees
Average number of employees 2018 2017
Management and administration 41 45
Aggregate employment costs 2018
£m 2017
£m
Wages and salaries 5.4 4.9
Social security costs 0.8 0.6
Share-based payments – equity-settled (Note 5) 2.6 1.4
Share-based payments – cash-settled 1.7 0.4
Defined contribution retirement benefit costs (Note 6) 0.4 0.5
Defined benefit retirement benefit costs (Note 6) – 0.1
10.9 7.9
Termination benefits 0.3 –
Total 11.2 7.9
Information on the Directors’ remuneration is given in the Directors’ Remuneration Report on pages 64 to 78.
The numbers and costs above are for employees who work for the Company. There are a number of Group employees whose contracts of employment are with the Company but who actually work in its subsidiaries. These employees are not included above.
5 Share-based payments The Company operates a number of share-based payment schemes for employees of the Group, details of which are in Note 8 of the Group accounts. Certain of the Company’s employees participate in the DSBP, equity-settled LTIP, equity-settled SAYE and the Recruitment Award which grant rights to the Company’s own equity instruments and hence are accounted for as equity-settled share-based payments.
Annual Report and Accounts for the year ended 31 March 2018 Electrocomponents plc126
COMPANY ACCOUNTS CONTINUED

Annual Report and Accounts for the year ended 31 March 2018 Electrocomponents plc 127
FINA
NC
IAL S
TA
TEMEN
TS
6 Post-employment benefits Employees of the Company may be members of the Group’s UK pension schemes.
Defined benefit scheme There is no agreement or stated policy for charging the net defined benefit cost for the scheme to the individual Group entities. Both the Company and RS Components Limited, the main UK trading subsidiary of the Company, are the sponsoring employers. The majority of the scheme members work for RS Components Limited and so it accounts for the UK scheme as a defined benefit scheme in its accounts. The Company recognises a cost equal to its contributions.
The UK defined benefit scheme is described in Note 9 of the Group accounts.
Defined contribution scheme Contributions to the defined contribution scheme are expensed as they fall due.
7 Tangible assets Tangible assets are stated at cost (or deemed cost) less accumulated depreciation and any provisions for impairment. Cost includes the original purchase price, costs directly attributable to bringing the asset to its working condition for its intended use and any dismantling and restoration costs.
No depreciation has been charged on land. Other assets are depreciated to residual value, on a straight-line basis at the following annual rates:
Investment property (occupied by a wholly-owned subsidiary) 2% Leasehold improvements 10% Plant and machinery 10% Computer equipment 20%
Investment property
£m
Leasehold improvements
£m
Plant and machinery
£m
Computer equipment
£m Total
£m
Cost
At 1 April 2017 – – 9.2 0.5 9.7
Additions – 1.1 – 0.3 1.4
Transferred from investment property (Note 8) 18.2 – – – 18.2
At 31 March 2018 18.2 1.1 9.2 0.8 29.3
Depreciation
At 1 April 2017 – – 9.2 0.5 9.7
Charged in the year 0.5 0.1 – – 0.6
At 31 March 2018 0.5 0.1 9.2 0.5 10.3
Net book value
At 31 March 2018 17.7 1.0 – 0.3 19.0
At 31 March 2017 – – – – –
8 Investment property The Company owns a freehold warehouse facility, which is occupied by a wholly-owned subsidiary. This was carried at fair value, with the change in fair value recognised in profit or loss for the year. In the current year, the Company has early adopted the Amendments to FRS 102 ‘Triennial review 2017’ and transferred its investment property to tangible assets.
2018 £m
2017 £m
At 1 April 18.2 17.2
Net gain from fair value adjustment – 1.0
Transferred to tangible assets (Note 7) (18.2) –
At 31 March – 18.2
Electrocomponents plcAnnual Report and Accounts for the year ended 31 March 2018 127
FINA
NC
IAL S
TATEM
ENT
S
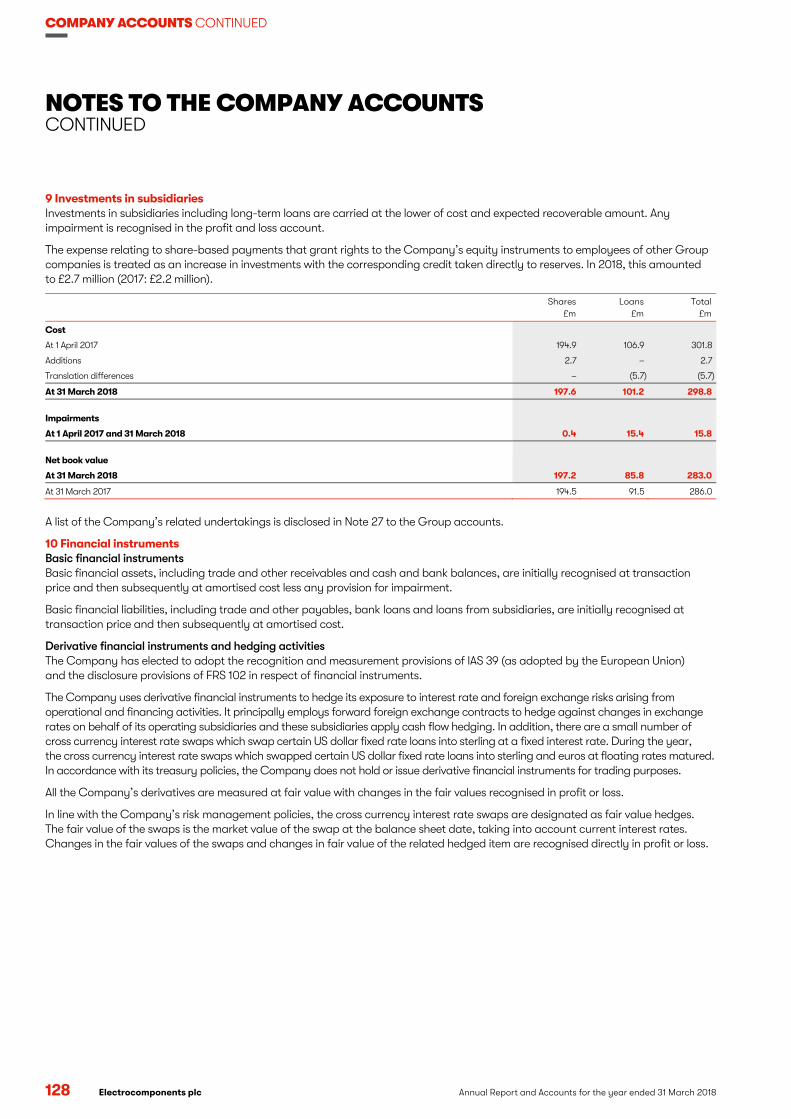
COMPANY ACCOUNTS CONTINUED
NOTES TO THE COMPANY ACCOUNTS CONTINUED
128 Electrocomponents plc Annual Report and Accounts for the year ended 31 March 2018
9 Investments in subsidiaries Investments in subsidiaries including long-term loans are carried at the lower of cost and expected recoverable amount. Any impairment is recognised in the profit and loss account.
The expense relating to share-based payments that grant rights to the Company’s equity instruments to employees of other Group companies is treated as an increase in investments with the corresponding credit taken directly to reserves. In 2018, this amounted to £2.7 million (2017: £2.2 million).
Shares £m
Loans £m
Total £m
Cost
At 1 April 2017 194.9 106.9 301.8
Additions 2.7 – 2.7
Translation differences – (5.7) (5.7)
At 31 March 2018 197.6 101.2 298.8
Impairments
At 1 April 2017 and 31 March 2018 0.4 15.4 15.8
Net book value
At 31 March 2018 197.2 85.8 283.0
At 31 March 2017 194.5 91.5 286.0
A list of the Company’s related undertakings is disclosed in Note 27 to the Group accounts.
10 Financial instruments Basic financial instruments Basic financial assets, including trade and other receivables and cash and bank balances, are initially recognised at transaction price and then subsequently at amortised cost less any provision for impairment.
Basic financial liabilities, including trade and other payables, bank loans and loans from subsidiaries, are initially recognised at transaction price and then subsequently at amortised cost.
Derivative financial instruments and hedging activities The Company has elected to adopt the recognition and measurement provisions of IAS 39 (as adopted by the European Union) and the disclosure provisions of FRS 102 in respect of financial instruments.
The Company uses derivative financial instruments to hedge its exposure to interest rate and foreign exchange risks arising from operational and financing activities. It principally employs forward foreign exchange contracts to hedge against changes in exchange rates on behalf of its operating subsidiaries and these subsidiaries apply cash flow hedging. In addition, there are a small number of cross currency interest rate swaps which swap certain US dollar fixed rate loans into sterling at a fixed interest rate. During the year, the cross currency interest rate swaps which swapped certain US dollar fixed rate loans into sterling and euros at floating rates matured. In accordance with its treasury policies, the Company does not hold or issue derivative financial instruments for trading purposes.
All the Company’s derivatives are measured at fair value with changes in the fair values recognised in profit or loss.
In line with the Company’s risk management policies, the cross currency interest rate swaps are designated as fair value hedges. The fair value of the swaps is the market value of the swap at the balance sheet date, taking into account current interest rates. Changes in the fair values of the swaps and changes in fair value of the related hedged item are recognised directly in profit or loss.
Annual Report and Accounts for the year ended 31 March 2018 Electrocomponents plc128
COMPANY ACCOUNTS CONTINUED
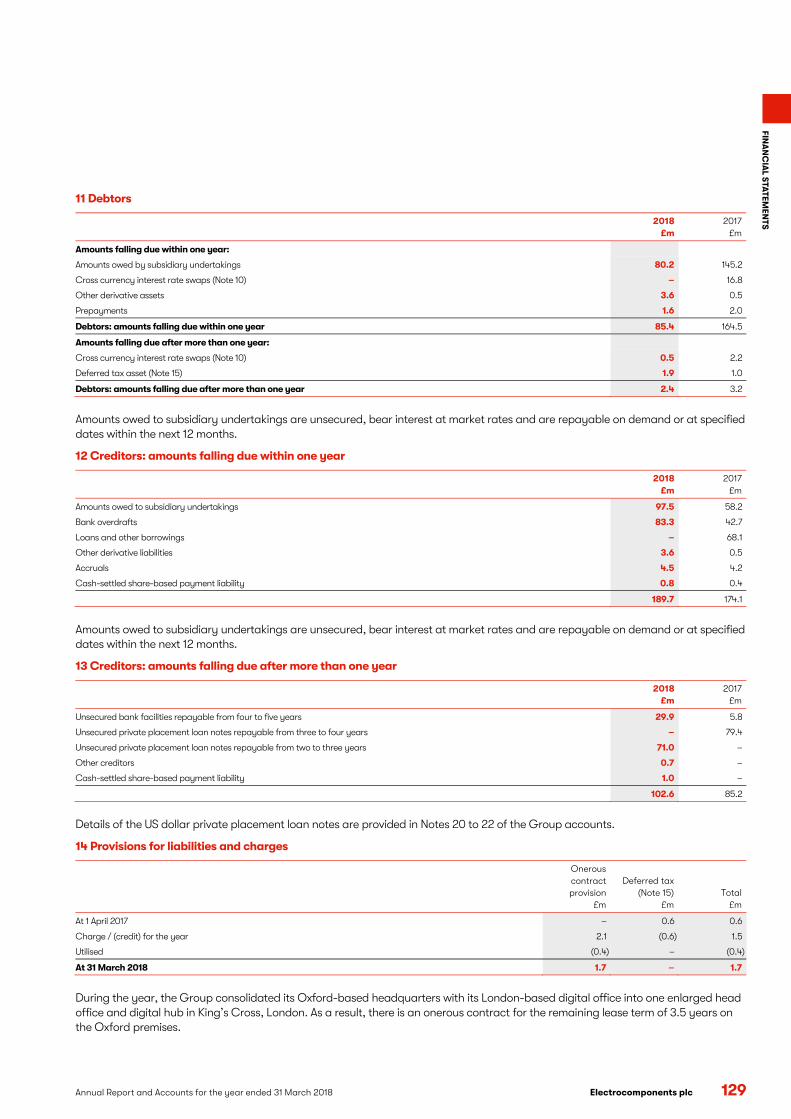
Annual Report and Accounts for the year ended 31 March 2018 Electrocomponents plc 129
FINA
NC
IAL S
TA
TEMEN
TS
11 Debtors
2018 £m
2017 £m
Amounts falling due within one year:
Amounts owed by subsidiary undertakings 80.2 145.2
Cross currency interest rate swaps (Note 10) – 16.8
Other derivative assets 3.6 0.5
Prepayments 1.6 2.0
Debtors: amounts falling due within one year 85.4 164.5
Amounts falling due after more than one year:
Cross currency interest rate swaps (Note 10) 0.5 2.2
Deferred tax asset (Note 15) 1.9 1.0
Debtors: amounts falling due after more than one year 2.4 3.2
Amounts owed to subsidiary undertakings are unsecured, bear interest at market rates and are repayable on demand or at specified dates within the next 12 months.
12 Creditors: amounts falling due within one year
2018 £m
2017 £m
Amounts owed to subsidiary undertakings 97.5 58.2
Bank overdrafts 83.3 42.7
Loans and other borrowings – 68.1
Other derivative liabilities 3.6 0.5
Accruals 4.5 4.2
Cash-settled share-based payment liability 0.8 0.4
189.7 174.1
Amounts owed to subsidiary undertakings are unsecured, bear interest at market rates and are repayable on demand or at specified dates within the next 12 months.
13 Creditors: amounts falling due after more than one year
2018 £m
2017 £m
Unsecured bank facilities repayable from four to five years 29.9 5.8
Unsecured private placement loan notes repayable from three to four years – 79.4
Unsecured private placement loan notes repayable from two to three years 71.0 –
Other creditors 0.7 –
Cash-settled share-based payment liability 1.0 –
102.6 85.2
Details of the US dollar private placement loan notes are provided in Notes 20 to 22 of the Group accounts.
14 Provisions for liabilities and charges
Onerous contract provision
£m
Deferred tax (Note 15)
£m Total
£m
At 1 April 2017 – 0.6 0.6
Charge / (credit) for the year 2.1 (0.6) 1.5
Utilised (0.4) – (0.4)
At 31 March 2018 1.7 – 1.7
During the year, the Group consolidated its Oxford-based headquarters with its London-based digital office into one enlarged head office and digital hub in King’s Cross, London. As a result, there is an onerous contract for the remaining lease term of 3.5 years on the Oxford premises.
Electrocomponents plcAnnual Report and Accounts for the year ended 31 March 2018 129
FINA
NC
IAL S
TATEM
ENT
S
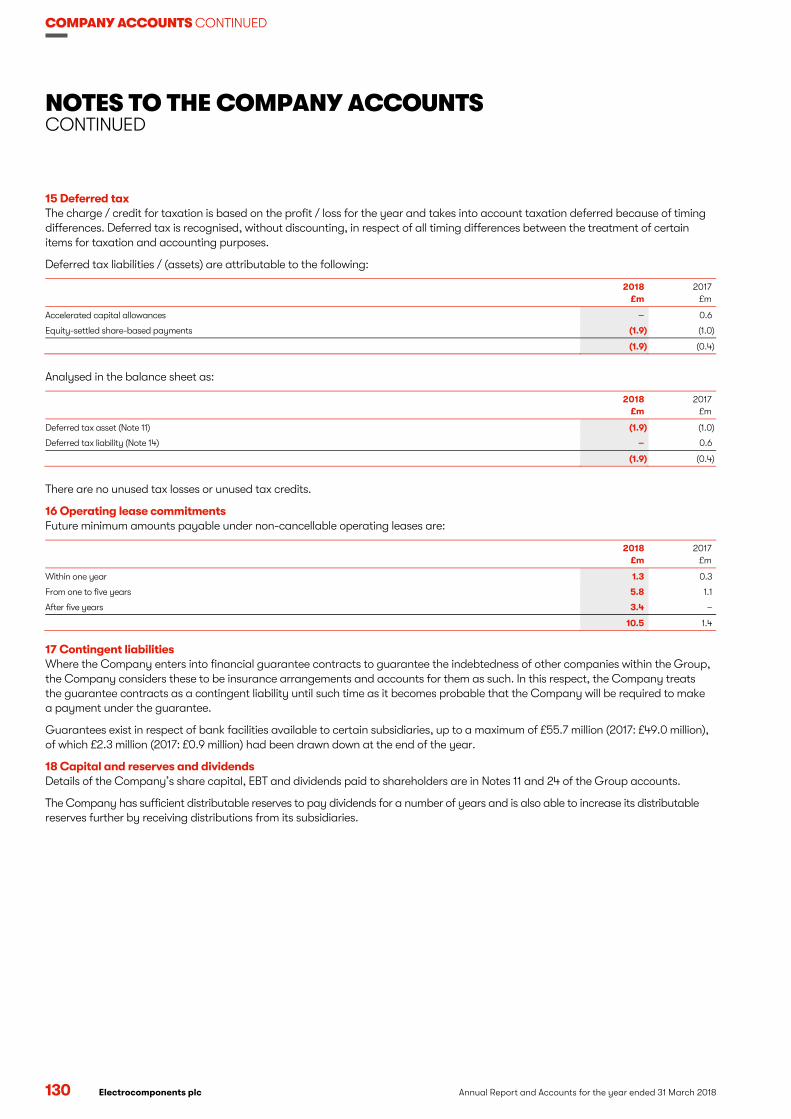
COMPANY ACCOUNTS CONTINUED
NOTES TO THE COMPANY ACCOUNTS CONTINUED
130 Electrocomponents plc Annual Report and Accounts for the year ended 31 March 2018
15 Deferred tax The charge / credit for taxation is based on the profit / loss for the year and takes into account taxation deferred because of timing differences. Deferred tax is recognised, without discounting, in respect of all timing differences between the treatment of certain items for taxation and accounting purposes.
Deferred tax liabilities / (assets) are attributable to the following:
2018 £m
2017 £m
Accelerated capital allowances – 0.6
Equity-settled share-based payments (1.9) (1.0)
(1.9) (0.4)
Analysed in the balance sheet as:
2018 £m
2017 £m
Deferred tax asset (Note 11) (1.9) (1.0)
Deferred tax liability (Note 14) – 0.6
(1.9) (0.4)
There are no unused tax losses or unused tax credits.
16 Operating lease commitments Future minimum amounts payable under non-cancellable operating leases are:
2018 £m
2017 £m
Within one year 1.3 0.3
From one to five years 5.8 1.1
After five years 3.4 –
10.5 1.4
17 Contingent liabilities Where the Company enters into financial guarantee contracts to guarantee the indebtedness of other companies within the Group, the Company considers these to be insurance arrangements and accounts for them as such. In this respect, the Company treats the guarantee contracts as a contingent liability until such time as it becomes probable that the Company will be required to make a payment under the guarantee.
Guarantees exist in respect of bank facilities available to certain subsidiaries, up to a maximum of £55.7 million (2017: £49.0 million), of which £2.3 million (2017: £0.9 million) had been drawn down at the end of the year.
18 Capital and reserves and dividends Details of the Company’s share capital, EBT and dividends paid to shareholders are in Notes 11 and 24 of the Group accounts.
The Company has sufficient distributable reserves to pay dividends for a number of years and is also able to increase its distributable reserves further by receiving distributions from its subsidiaries.
Annual Report and Accounts for the year ended 31 March 2018 Electrocomponents plc130
COMPANY ACCOUNTS CONTINUED
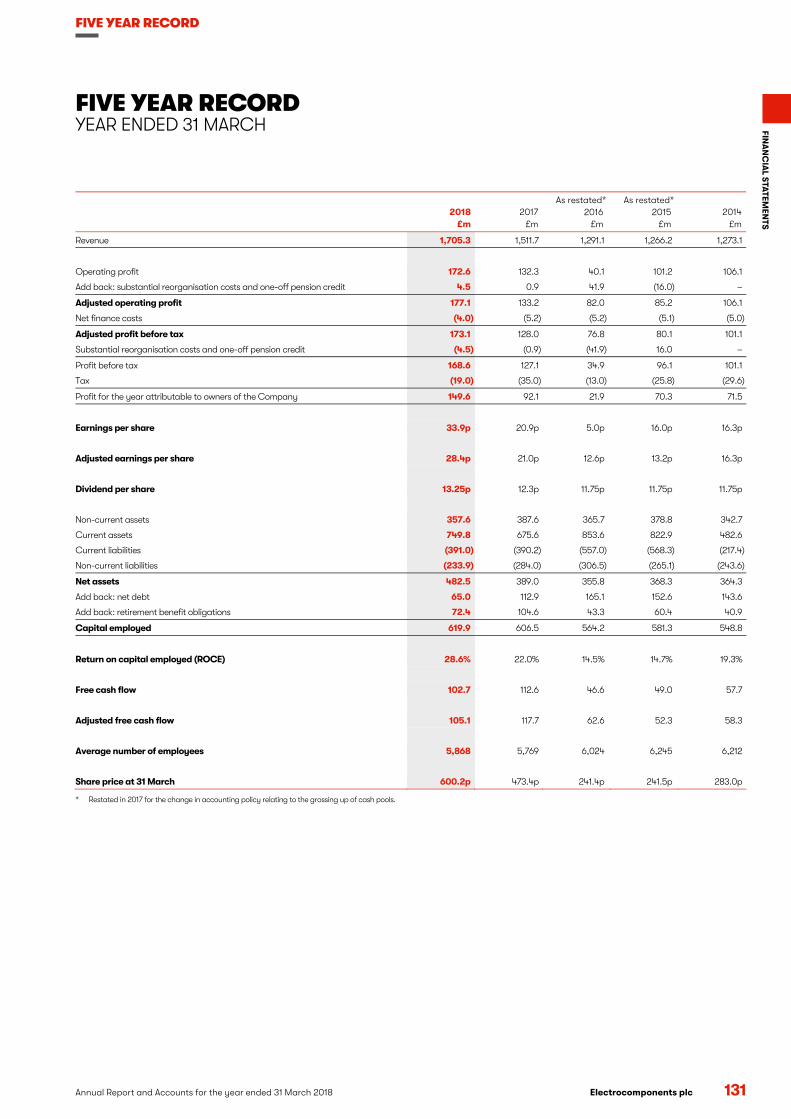
FIVE YEAR RECORD
FIVE YEAR RECORD YEAR ENDED 31 MARCH
Annual Report and Accounts for the year ended 31 March 2018 Electrocomponents plc 131
FINA
NC
IAL S
TA
TEMEN
TS
2018
£m 2017
£m
As restated* 2016
£m
As restated* 2015
£m 2014
£m
Revenue 1,705.3 1,511.7 1,291.1 1,266.2 1,273.1
Operating profit 172.6 132.3 40.1 101.2 106.1
Add back: substantial reorganisation costs and one-off pension credit 4.5 0.9 41.9 (16.0) –
Adjusted operating profit 177.1 133.2 82.0 85.2 106.1
Net finance costs (4.0) (5.2) (5.2) (5.1) (5.0)
Adjusted profit before tax 173.1 128.0 76.8 80.1 101.1
Substantial reorganisation costs and one-off pension credit (4.5) (0.9) (41.9) 16.0 –
Profit before tax 168.6 127.1 34.9 96.1 101.1
Tax (19.0) (35.0) (13.0) (25.8) (29.6)
Profit for the year attributable to owners of the Company 149.6 92.1 21.9 70.3 71.5
Earnings per share 33.9p 20.9p 5.0p 16.0p 16.3p
Adjusted earnings per share 28.4p 21.0p 12.6p 13.2p 16.3p
Dividend per share 13.25p 12.3p 11.75p 11.75p 11.75p
Non-current assets 357.6 387.6 365.7 378.8 342.7
Current assets 749.8 675.6 853.6 822.9 482.6
Current liabilities (391.0) (390.2) (557.0) (568.3) (217.4)
Non-current liabilities (233.9) (284.0) (306.5) (265.1) (243.6)
Net assets 482.5 389.0 355.8 368.3 364.3
Add back: net debt 65.0 112.9 165.1 152.6 143.6
Add back: retirement benefit obligations 72.4 104.6 43.3 60.4 40.9
Capital employed 619.9 606.5 564.2 581.3 548.8
Return on capital employed (ROCE) 28.6% 22.0% 14.5% 14.7% 19.3%
Free cash flow 102.7 112.6 46.6 49.0 57.7
Adjusted free cash flow 105.1 117.7 62.6 52.3 58.3
Average number of employees 5,868 5,769 6,024 6,245 6,212
Share price at 31 March 600.2p 473.4p 241.4p 241.5p 283.0p
* Restated in 2017 for the change in accounting policy relating to the grossing up of cash pools.
Electrocomponents plcAnnual Report and Accounts for the year ended 31 March 2018 131
FINA
NC
IAL S
TATEM
ENT
SFIVE YEAR RECORD

132 Annual Report and Accounts for the year ended 31 March 2018 Electrocomponents plc
SHAREHOLDER INFORMATION
REGISTERED OFFICE, FINANCIAL CALENDAR AND ADVISORS
Registered officeElectrocomponents plc Fifth Floor Two Pancras Square London N1C 4AG United Kingdom Tel: +44 (0)20 7239 8400 www.electrocomponents.com Registered number: 647788 Registered in England and Wales
Shareholder servicesRegistrar If you have any questions about your shareholding in the Company, please contact our Registrar: Equiniti Ltd, Aspect House, Spencer Road, Lancing, West Sussex BN99 6DA, United Kingdom. Telephone 0371 384 2158 (+44 121 415 7047 from outside the UK). Lines are open between 8.30am and 5.30pm Monday to Friday excluding public holidays in England and Wales.
ShareviewTo access online information about your shareholdings visit www.shareview.co.uk. The website also provides information useful to the management of investments together with an extensive schedule of frequently asked questions. In order to view your shareholdings the shareholder reference number is required which can be found at the top of the share certificate or on the last dividend tax voucher.
Dividend Reinvestment Plan (DRIP)Should you wish to reinvest your dividends in the Company, you can take advantage of our DRIP. It will allow you to use your cash dividend to buy more Electrocomponents shares in the market. You will need to complete a DRIP application form and return it to Equiniti. This can be found, together with plan terms and conditions, at www.shareview.co.uk or in the Investor Centre section of our website under FAQs. Alternatively, please contact Equiniti on the number given above, and details and a form will be sent to you.
Share price informationThe latest information on Electrocomponents plc share price is available on our website.
Be scam smartInvestment scams are designed to look like genuine investments.
Spot the warning signsHave you been:• contacted out of the blue?
• promised tempting returns and told the investment is safe?
• called repeatedly?
• told the offer is only available for a limited time?
If so, you might have been contacted by fraudsters.
Avoid investment fraudReject cold calls: If you have received unsolicited contact about an investment opportunity, the chances are it is a high risk investment or a scam. You should treat the call with extreme caution. The safest thing to do is to hang up.
Check the FCA Warning List: The FCA Warning List is a list of firms and individuals we know are operating without our authorisation.
Get impartial advice: Think about getting impartial financial advice before you hand over any money. Seek advice from someone unconnected to the firm that has approached you.
Report a ScamIf you suspect that you have been approached by fraudsters please tell the FCA using the reporting form at www.fca.org.uk/ consumers/report-scam-unauthorised-firm. You can also call the FCA Consumer Helpline on 0800 111 6768.
If you have lost money to investment fraud, you should report it to Action Fraud on 0300 123 2040 or online at www.actionfraud.police.uk
Find out more at www.fca.org.uk/scamsmart
Remember: if it sounds too good to be true, it probably is!

Electrocomponents plcAnnual Report and Accounts for the year ended 31 March 2018 133
SH
AR
EHO
LDER
INFO
RM
ATIO
N
Financial calendarAnnouncement of resultsThe results of the Group are normally published at the following times:
• Half-year results for the six months to 30 September in mid-November.
• Preliminary announcement for the year to 31 March in late May.
• Annual Report and Accounts for the year to 31 March in mid-June.
Dividend paymentsOur current policy is to make dividend payments at the following times:
• Interim dividend in January
• Final dividend in July
2018 final dividend timetable:
• Ex-dividend date: 14 June
• Record date: 15 June
• Annual General Meeting: 19 July
• Dividend paid: 25 July
AdvisorsAuditorPricewaterhouseCoopers LLP 1 Embankment Place London WC2N 6RH
Investment bankerCitigroup Citigroup Centre 33 Canada Square London E14 5LB
Registrar and transfer officeEquiniti Limited Aspect House Spencer Road Lancing West Sussex BN99 6DA
SolicitorLinklaters LLP One Silk Street London EC2Y 8HQ
StockbrokersUBS 5 Broadgate London EC2M 2QS
Numis Securities Limited The London Stock Exchange 10 Paternoster Square London EC4M 7LT
Financial PR advisorTulchan Communications LLP 85 Fleet Street London EC4Y 1AE
Remuneration consultantDeloitte LLP 2 New Street Square London EC4A 3BZ
134 Annual Report and Accounts for the year ended 31 March 2018 Electrocomponents plc
SHAREHOLDER INFORMATION CONTINUED
Get more onlineLatest shareholder information• Share price
• Corporate Governance
• Analyst consensus estimates
• Updates via email
Europe, Middle East and AfricaAustria at.rs-online.com
Belgium benl.rs-online.com
Czech Republic cz.rs-online.com
Denmark dk.rs-online.com
France fr.rs-online.com
Germany de.rs-online.com
Hungary hu.rs-online.com
Ireland ie.rs-online.com
Italy it.rs-online.com
For more information and the latest news visit: www.electrocomponents.com
Netherlands nl.rs-online.com
Norway no.rs-online.com
Poland pl.rs-online.com
Portugal pt.rs-online.com
South Africa za.rs-online.com
Spain es.rs-online.com
Sweden se.rs-online.com
Switzerland ch.rs-online.com
United Kingdom uk.rs-online.com
AmericasCanada ca-en.alliedelec.com
Chile en-cl.alliedelec.com
Mexico mx-en.alliedelec.com
USA www.alliedelec.com
Asia PacificAustralia au.rs-online.com
China rsonline.cntwen.rs-online.com
India in.rsdelivers.com
Japan jp.rs-online.com
Malaysia my.rs-online.com
New Zealand nz.rs-online.com
Philippines ph.rs-online.com
Singapore sg.rs-online.com
South Korea kr.rs-online.com
Thailand th.rs-online.com
Archive information• Financial results
• Annual Reports
• Company news
• Video library
LOCATIONS
Principal locations

This Report is printed on material which is derived from sustainable sources. Both the manufacturing paper mill and printer are registered to the Environmental Management System ISO 14001 and are Forest Stewardship Council® (FSC) chain-of-custody certified
Designed and produced by

Electrocomponents plcFifth Floor Two Pancras Square, London N1C 4AG United Kingdom Tel: +44 (0)20 7239 8400www.electrocomponents.com
Elec
troc
om
po
ne
nts p
lc Annual R
eport and Accounts for the year end
ed 31 March 20
18