electromagnetic interference test report for … · for the stanford linear accelerator center...
TRANSCRIPT
Page 1 of 224Report No.: MIL05-015
ELECTROMAGNETIC INTERFERENCE TEST REPORT
FOR THE STANFORD LINEAR ACCELERATOR CENTER (SLAC)
TOWER EQUIPMENT MODULE/TOWER POWER SUPPLY, TEM/TPS
MIL-STD-461E (1999), SECTIONS CE102, RE101, RE102, RS101 AND RS103MIL-STD-462 SECTIONS: CS102 (NOTICE 5 1986) AND CS06 (NOTICE 3 1971)
TESTING IN ACCORDANCE WITH TEST PLAN TP05-82840-1
DATE OF ISSUE: MARCH 18, 2005
PREPARED FOR:
Stanford Linear Accelerator Center (SLAC)P.O. Box 20450Stanford, CA 94309
PREPARED BY:
Valerie HonsingerCKC Laboratories, Inc.5473A Clouds RestMariposa, CA 95338
P.O. No.: 0000053584W.O. No.: 82840
Date of test: February 21 - March 4, 2005
Report No.: MIL05-015
This report contains a total of 224 pages and may be reproduced in full only. Partial reproduction may only be donewith the written consent of CKC Laboratories, Inc. The results in this report apply only to the items tested, asidentified herein.

Page 2 of 224Report No.: MIL05-015
TABLE OF CONTENTS
Administrative Information .............................................................................................3Approvals.........................................................................................................................4Unit Under Test (UUT) Description ................................................................................5Unit Under Test ...............................................................................................................5Peripheral Devices ...........................................................................................................5Summary of Results.........................................................................................................6Report of Measurements ..................................................................................................8
CE102 - Conducted Emissions, Power Leads, 10kHz to 10MHz........................8CECM – Conducted Emissions, Common Mode, DC to 150MHz .....................31RE101 - Radiated Emissions, Magnetic Field, 30Hz to 100kHz.........................39RE102 - Radiated Emissions, Electric Field, 10kHz to 18GHz ..........................60CS06 - Conducted Susceptibility, Spikes on Power Leads .................................186CS102 - Conducted Susceptibility, Powert Leads, 10kHz to 10MHz .................189CSCM - Conducted Susceptibility, Common Mode, 30Hz to 150MHz..............197RS101 - Radiated Susceptibility, Magnetic Field, 30Hz to 100kHz ...................202RS103 - Radiated Susceptibility, Electric Field, 10kHz to 18GHz .....................205
Test Log ...........................................................................................................................213

Page 3 of 224Report No.: MIL05-015
ADMINISTRATIVE INFORMATION
SCOPE:To demonstrate testing of the Tower Equipment Module/Tower Power Supply, TEM/TPS withthe requirements for MIL-STD-461E in accordance with test plan TP05-82840-1.
CONTRACT NUMBERS:NA
APPLICABLE DOCUMENTS:1. MIL-STD-461E - Electromagnetic Emission and Susceptibility Requirements for the Control
of Electromagnetic Interference2. MIL-STD-462E - .Measurements of Electromagnetic Interference Characteristics3. MIL-STD-464A – Electromagnetic Environmental Effects Requirements for Systems4. 433-RQMT-0005, Rev A – GLAST Observatory Electromagnetic Interference (EMI)
Requirements Document, NASA/GSFC, Oct 6, 20035. LAT-MD-00408 - “LAT Instrument Performance Verification Plan”, SLAC6. CKC Test Procedure: TP05-82840-1.
MANUFACTURER:Stanford Linear Accelerator Center (SLAC)P.O. Box 20450Stanford, CA 94309
REPRESENTATIVE:Dave Nelson
TEST LOCATION:CKC Laboratories, Inc.1120 Fulton PlaceFremont, CA 94539

Page 4 of 224Report No.: MIL05-015
FREMONT, CA MILITARY CHAMBER #2The CKC Laboratories, Inc. Fremont EMI Chamber used for the testing was a 32' x 21'9" x 10'high shielded enclosure designed to attenuate radio frequency noise over 80 dB up to 1 GHz, andover 60 dB at 18 GHz. The enclosure uses ferrite tiles on all six internal faces with foamanechoic material in key areas to achieve uniform testing from 1 MHz to 40GHz. Power broughtinto the room is filtered over 100 dB for frequencies over 14 kHz. All emissions measurementequipment is operated from isolation transformers, which help eliminate the possibility ofground loops. All lighting in the laboratory is filtered to reduce electrical noise. In addition,incandescent lights are used during emissions testing to further reduce the potential for electricalnoise.
The ground plane in the chamber consists of a 3' x 10'6" x 0.020" thick copper sheet bonded tothe shield room wall with 0.1 mΩ of bonding resistance.
APPROVALS
QUALITY ASSURANCE: TEST PERSONNEL:
Steve Behm, Director of Engineering Services Christine Nicklas, Project Manager &Principal Consultant
Joyce Walker, Quality Assurance AdministrativeManager
Amrinder Brar, EMC Test Engineer
Page 5 of 224Report No.: MIL05-015
UNIT UNDER TEST (UUT) DESCRIPTION
UNIT UNDER TEST
TEM/TPSManuf: Stanford Linear Accelerator Center (SLAC)Model: TEM/TPSSerial: GLA1754
PERIPHERAL DEVICES
The UUT was tested with the following peripheral device(s):
VME ProcessorManuf: DAWN VMEModel: NASerial: GLAT0404
MouseManuf: DellModel: X09-13962Serial: 69557-492-6014557-20350
KeyboardManuf: DellModel: RT6D20Serial: TH-04N454-37171-399-5494
MonitorManuf: DellModel: 1901FPSerial: CN-05Y232071616041R0B363
PCManuf: DellModel: DHMSerial: HXNLB41
Power SupplyManuf: BK PrecisionModel: 1697Serial: S240500299
1 MHz Filter (7 each)Manuf: SLACModel: LAT-DS-04767Serial: GLAT1962, GLAT1958, GLAT1963, GLAT1957, GLAT1504, GLAT1501 & GLAT1500
Voltmeter (7 each)Manuf: HPModel: 3400ASerial: 1218A26780, 2415A33270, 1218A19573, 2415A37548, 1218A27552, 2225A28975 & 14-006698

Page 6 of 224Report No.: MIL05-015
SUMMARY OF RESULTSAs received, the Stanford Linear Accelerator Center Tower Equipment Module (TEM)/TowerPower Supply (TPS) was tested to following standards and specifications:
The following table summarizes the results of this testing.
Test Description Results OutcomeCE102 - ConductedEmissions, PowerLeads, 10kHz to10MHz
No emissions exceeding the limit were observed from10kHz to 10MHz on the 28VDC Input Power Lead andon the 28VDC Return Lead with input power set to28VDC and 33VDC.
PASS
CECM - ConductedEmissions,Common Mode,DC to 150 MHz
No emissions exceeding the limit were observed on the28VDC Input Power Lead and on the 28VDC ReturnLead to 150MHz.
PASS
RE101 – RadiatedEmissions, 20Hz to50kHz
No out of spec emissions were observed exceeding the7cm and 50cm limits from 30Hz to 100kHz on all sixfaces of the UUT.
PASS
RE102 - RadiatedEmissions, 10kHzto 18GHz
The UUT exhibited no out of spec emissions from10kHz to 30MHz in Vertical polarization and from30MHz to 1GHz in Vertical and Horizontal antennapolarizations. From 2.3 – 18GHz no out of specemissions were observed.
Emissions exceeding the limit were observed from 1.55– 2.3GHz in both Vertical and Horizontal Polarizations.
FAIL
CS06 – ConductedSusceptibility,Spikes on PowerLeads
The UUT exhibited no signs of susceptibility during theextent of the testing on the 28VDC Input Power Line,the 28VDC Return Line.
PASS
CS102 – ConductedSusceptibility,Power Leads,10kHz to 10MHz
The UUT exhibited no signs of susceptibility during theextent of the testing from 10kHz to 10MHz on the28VDC Power and 28VDC Return Lines.
PASS
Page 7 of 224Report No.: MIL05-015
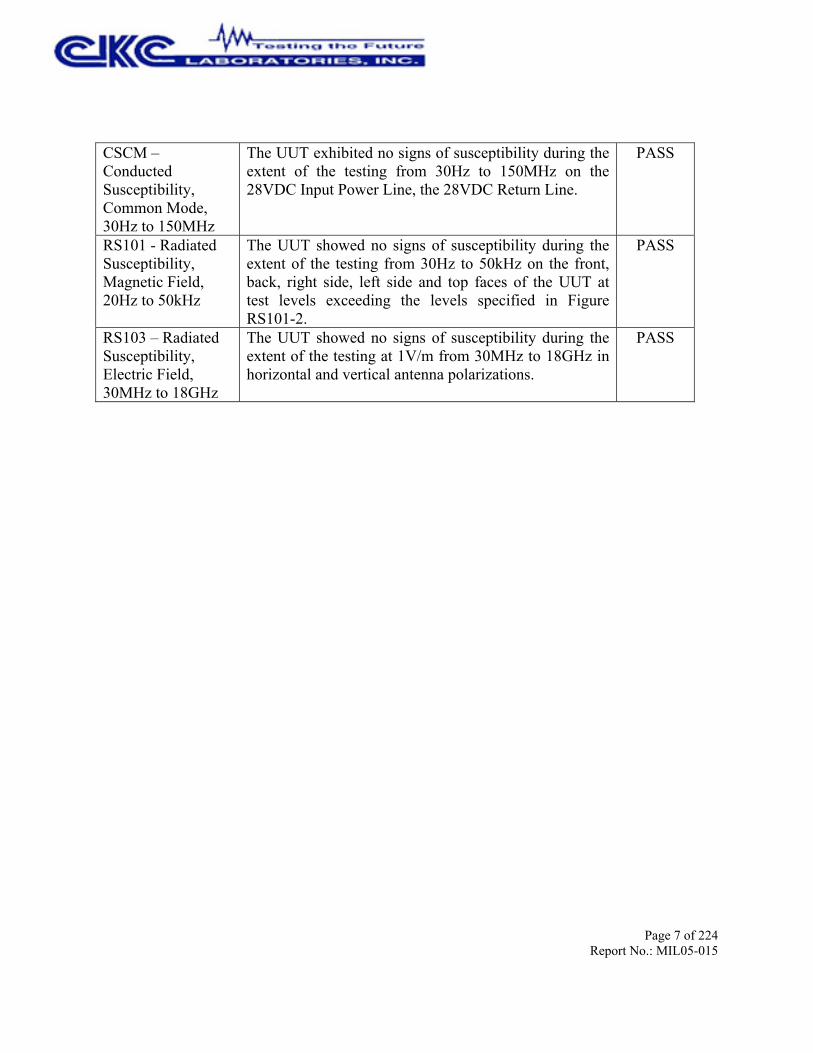
CSCM –ConductedSusceptibility,Common Mode,30Hz to 150MHz
The UUT exhibited no signs of susceptibility during theextent of the testing from 30Hz to 150MHz on the28VDC Input Power Line, the 28VDC Return Line.
PASS
RS101 - RadiatedSusceptibility,Magnetic Field,20Hz to 50kHz
The UUT showed no signs of susceptibility during theextent of the testing from 30Hz to 50kHz on the front,back, right side, left side and top faces of the UUT attest levels exceeding the levels specified in FigureRS101-2.
PASS
RS103 – RadiatedSusceptibility,Electric Field,30MHz to 18GHz
The UUT showed no signs of susceptibility during theextent of the testing at 1V/m from 30MHz to 18GHz inhorizontal and vertical antenna polarizations.
PASS
Page 8 of 224Report No.: MIL05-015
REPORT OF MEASUREMENTS
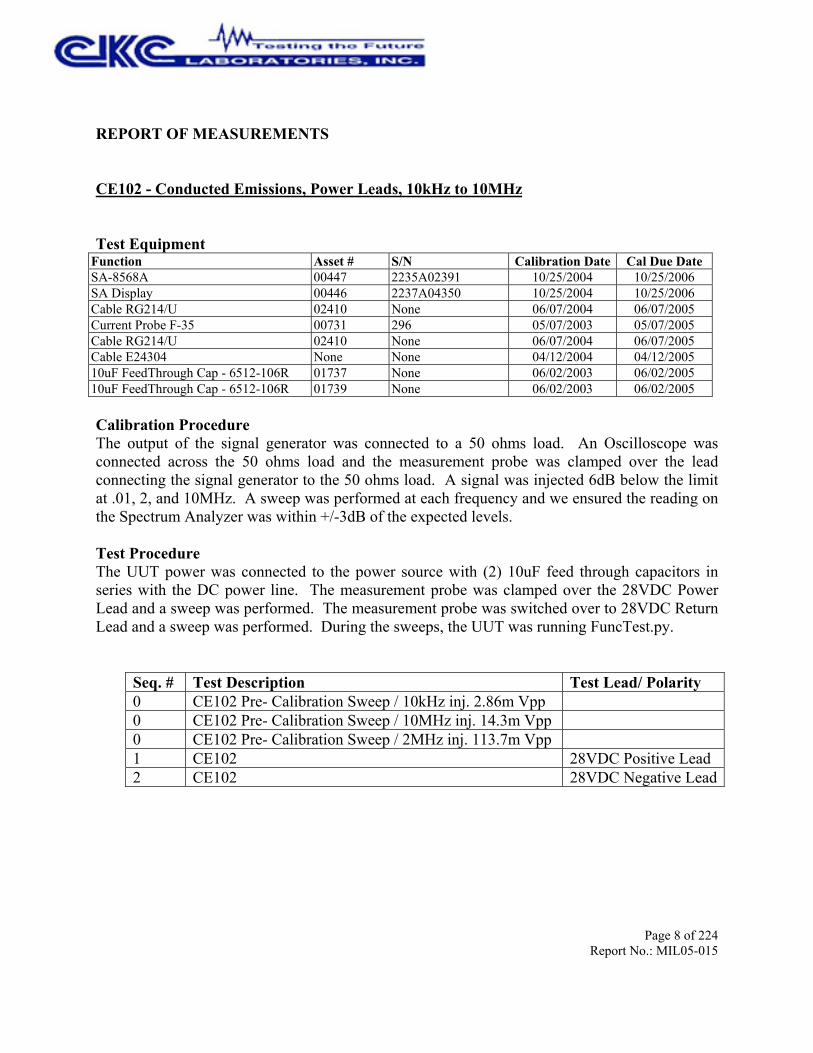
CE102 - Conducted Emissions, Power Leads, 10kHz to 10MHz
Test EquipmentFunction Asset # S/N Calibration Date Cal Due DateSA-8568A 00447 2235A02391 10/25/2004 10/25/2006SA Display 00446 2237A04350 10/25/2004 10/25/2006Cable RG214/U 02410 None 06/07/2004 06/07/2005Current Probe F-35 00731 296 05/07/2003 05/07/2005Cable RG214/U 02410 None 06/07/2004 06/07/2005Cable E24304 None None 04/12/2004 04/12/200510uF FeedThrough Cap - 6512-106R 01737 None 06/02/2003 06/02/200510uF FeedThrough Cap - 6512-106R 01739 None 06/02/2003 06/02/2005
Calibration ProcedureThe output of the signal generator was connected to a 50 ohms load. An Oscilloscope wasconnected across the 50 ohms load and the measurement probe was clamped over the leadconnecting the signal generator to the 50 ohms load. A signal was injected 6dB below the limitat .01, 2, and 10MHz. A sweep was performed at each frequency and we ensured the reading onthe Spectrum Analyzer was within +/-3dB of the expected levels.
Test ProcedureThe UUT power was connected to the power source with (2) 10uF feed through capacitors inseries with the DC power line. The measurement probe was clamped over the 28VDC PowerLead and a sweep was performed. The measurement probe was switched over to 28VDC ReturnLead and a sweep was performed. During the sweeps, the UUT was running FuncTest.py.
Seq. # Test Description Test Lead/ Polarity0 CE102 Pre- Calibration Sweep / 10kHz inj. 2.86m Vpp0 CE102 Pre- Calibration Sweep / 10MHz inj. 14.3m Vpp0 CE102 Pre- Calibration Sweep / 2MHz inj. 113.7m Vpp1 CE102 28VDC Positive Lead2 CE102 28VDC Negative Lead

Page 9 of 224Report No.: MIL05-015
CE102 Pre-cal
CE102 Close-up

Page 10 of 224Report No.: MIL05-015
Test Location: CKC Laboratories, Inc. •1120 Fulton Place • Fremont, CA 94539 • (510) 249 - 1170
Customer: Stanford Linear Accelerator CenterSpecification: CE102 MIL-STD-462Work Order #: 82840 Date: 2/22/2005Test Type: Conducted Emissions Time: 1:12:18 PMEquipment: Sequence#: 0Manufacturer: Tested By: A. BrarModel: 28V DCS/N:Equipment Under Test (* = UUT):
Function Manufacturer Model # S/N
Support Devices:Function Manufacturer Model # S/N
Test Conditions / Notes:Pre-Cal Sweep. Signal at 10KHz. Injecting 2.86mVpp and expecting 17.1dBuV +/-3dB as meter reading.
Transducer Legend:
Measurement Data: Reading listed by margin. Test Lead: None# Freq Rdng Dist Corr Spec Margin Polar
MHz dBµV dB dB dB dB Table dBµV dBµV dB Ant 1 40.060k 19.0 +0.0 19.0 66.0 -47.0 None
2 10.090k 18.3 +0.0 18.3 66.0 -47.7 None
3 12.880k 15.7 +0.0 15.7 66.0 -50.3 None
4 31.330k 15.1 +0.0 15.1 66.0 -50.9 None
5 53.380k 14.8 +0.0 14.8 66.0 -51.2 None
6 29.080k 14.3 +0.0 14.3 66.0 -51.7 None
7 59.500k 14.0 +0.0 14.0 66.0 -52.0 None
8 19.090k 14.0 +0.0 14.0 66.0 -52.0 None
9 68.320k 13.9 +0.0 13.9 66.0 -52.1 None
10 19.900k 13.9 +0.0 13.9 66.0 -52.1 None
11 97.570k 13.7 +0.0 13.7 66.0 -52.3 None

Page 11 of 224Report No.: MIL05-015
12 69.310k 13.7 +0.0 13.7 66.0 -52.3 None
13 25.030k 13.7 +0.0 13.7 66.0 -52.3 None
14 23.410k 13.7 +0.0 13.7 66.0 -52.3 None
15 62.650k 13.2 +0.0 13.2 66.0 -52.8 None
16 35.740k 13.2 +0.0 13.2 66.0 -52.8 None
17 78.850k 13.1 +0.0 13.1 66.0 -52.9 None
18 60.310k 13.1 +0.0 13.1 66.0 -52.9 None
19 44.020k 13.0 +0.0 13.0 66.0 -53.0 None
20 18.370k 13.0 +0.0 13.0 66.0 -53.0 None
21 16.120k 13.0 +0.0 13.0 66.0 -53.0 None
22 49.600k 12.8 +0.0 12.8 66.0 -53.2 None
23 47.080k 12.5 +0.0 12.5 66.0 -53.5 None
24 64.990k 12.4 +0.0 12.4 66.0 -53.6 None
25 66.070k 12.4 +0.0 12.4 66.0 -53.6 None
26 73.540k 12.3 +0.0 12.3 66.0 -53.7 None
27 66.520k 12.3 +0.0 12.3 66.0 -53.7 None
28 45.820k 12.3 +0.0 12.3 66.0 -53.7 None
29 77.050k 12.2 +0.0 12.2 66.0 -53.8 None
30 89.200k 12.1 +0.0 12.1 66.0 -53.9 None

Page 12 of 224Report No.: MIL05-015
Test Location: CKC Laboratories, Inc. •1120 Fulton Place • Fremont, CA 94539 • (510) 249 - 1170
Customer: Stanford Linear Accelerator CenterSpecification: CE102 MIL-STD-462Work Order #: 82840 Date: 2/22/2005Test Type: Conducted Emissions Time: 1:41:56 PMEquipment: Sequence#: 0Manufacturer: Tested By: A. BrarModel: 28V DCS/N:Equipment Under Test (* = UUT):
Function Manufacturer Model # S/N
Support Devices:Function Manufacturer Model # S/N
Test Conditions / Notes:Pre-Cal Sweep. Signal at 10MHz. Injecting 14.3mVpp and expecting 40.3dBuV +/-3dB as meter reading.
Transducer Legend:
Measurement Data: Reading listed by margin. Test Lead: None# Freq Rdng Dist Corr Spec Margin Polar
MHz dBµV dB dB dB dB Table dBµV dBµV dB Ant 1 9.993M 39.5 +0.0 39.5 80.0 -40.5 None
2 40.420k 17.7 +0.0 17.7 66.0 -48.3 None
3 15.940k 14.9 +0.0 14.9 66.0 -51.1 None
4 54.100k 14.8 +0.0 14.8 66.0 -51.2 None
5 25.030k 14.6 +0.0 14.6 66.0 -51.4 None
6 33.490k 14.6 +0.0 14.6 66.0 -51.4 None
7 38.710k 14.6 +0.0 14.6 66.0 -51.4 None
8 48.700k 14.5 +0.0 14.5 66.0 -51.5 None
9 36.370k 13.7 +0.0 13.7 66.0 -52.3 None
10 71.830k 13.7 +0.0 13.7 66.0 -52.3 None
11 28.000k 13.3 +0.0 13.3 66.0 -52.7 None

Page 13 of 224Report No.: MIL05-015
12 32.320k 13.3 +0.0 13.3 66.0 -52.7 None
13 11.260k 13.2 +0.0 13.2 66.0 -52.8 None
14 57.430k 13.2 +0.0 13.2 66.0 -52.8 None
15 65.170k 13.2 +0.0 13.2 66.0 -52.8 None
16 60.580k 13.1 +0.0 13.1 66.0 -52.9 None
17 29.080k 13.0 +0.0 13.0 66.0 -53.0 None
18 31.150k 13.0 +0.0 13.0 66.0 -53.0 None
19 34.750k 13.0 +0.0 13.0 66.0 -53.0 None
20 77.860k 12.9 +0.0 12.9 66.0 -53.1 None
21 56.080k 12.7 +0.0 12.7 66.0 -53.3 None
22 79.570k 12.7 +0.0 12.7 66.0 -53.3 None
23 30.250k 12.5 +0.0 12.5 66.0 -53.5 None
24 58.510k 12.5 +0.0 12.5 66.0 -53.5 None
25 66.700k 12.5 +0.0 12.5 66.0 -53.5 None
26 61.300k 12.3 +0.0 12.3 66.0 -53.7 None
27 59.140k 12.2 +0.0 12.2 66.0 -53.8 None
28 94.960k 12.2 +0.0 12.2 66.0 -53.8 None
29 31.690k 12.1 +0.0 12.1 66.0 -53.9 None
30 75.430k 12.1 +0.0 12.1 66.0 -53.9 None
31 62.470k 12.0 +0.0 12.0 66.0 -54.0 None
32 98.650k 12.0 +0.0 12.0 66.0 -54.0 None
33 69.220k 11.9 +0.0 11.9 66.0 -54.1 None
Page 14 of 224Report No.: MIL05-015
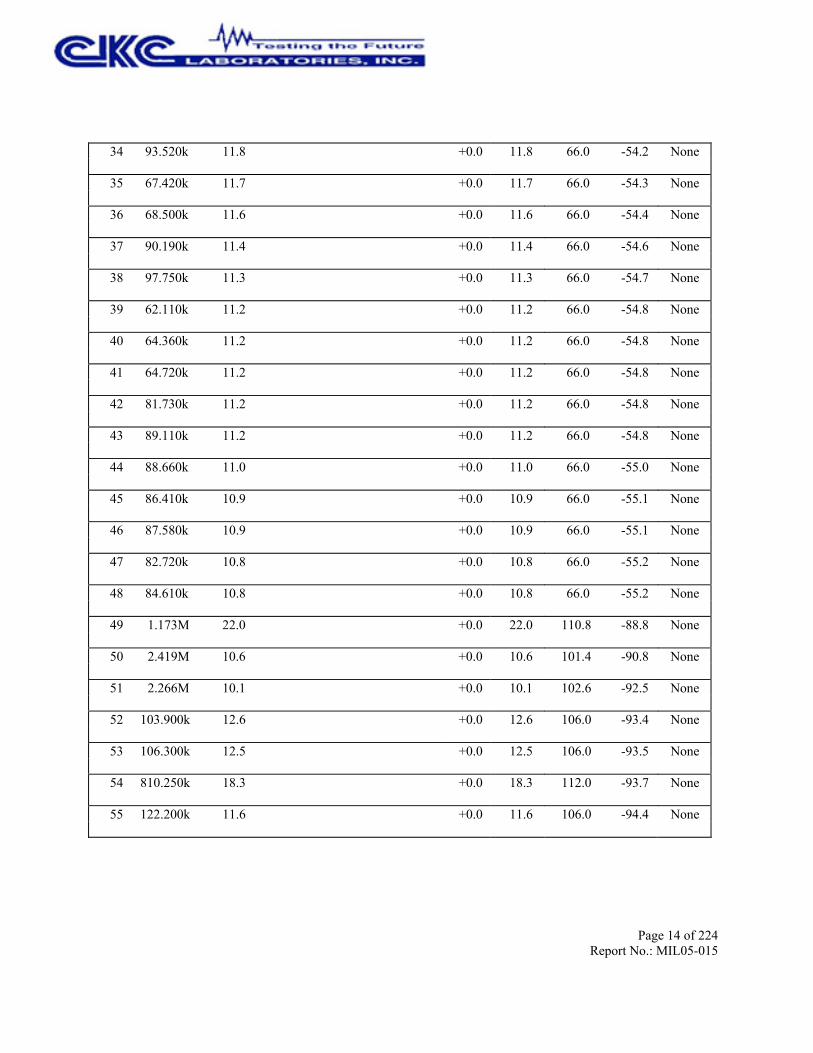
34 93.520k 11.8 +0.0 11.8 66.0 -54.2 None
35 67.420k 11.7 +0.0 11.7 66.0 -54.3 None
36 68.500k 11.6 +0.0 11.6 66.0 -54.4 None
37 90.190k 11.4 +0.0 11.4 66.0 -54.6 None
38 97.750k 11.3 +0.0 11.3 66.0 -54.7 None
39 62.110k 11.2 +0.0 11.2 66.0 -54.8 None
40 64.360k 11.2 +0.0 11.2 66.0 -54.8 None
41 64.720k 11.2 +0.0 11.2 66.0 -54.8 None
42 81.730k 11.2 +0.0 11.2 66.0 -54.8 None
43 89.110k 11.2 +0.0 11.2 66.0 -54.8 None
44 88.660k 11.0 +0.0 11.0 66.0 -55.0 None
45 86.410k 10.9 +0.0 10.9 66.0 -55.1 None
46 87.580k 10.9 +0.0 10.9 66.0 -55.1 None
47 82.720k 10.8 +0.0 10.8 66.0 -55.2 None
48 84.610k 10.8 +0.0 10.8 66.0 -55.2 None
49 1.173M 22.0 +0.0 22.0 110.8 -88.8 None
50 2.419M 10.6 +0.0 10.6 101.4 -90.8 None
51 2.266M 10.1 +0.0 10.1 102.6 -92.5 None
52 103.900k 12.6 +0.0 12.6 106.0 -93.4 None
53 106.300k 12.5 +0.0 12.5 106.0 -93.5 None
54 810.250k 18.3 +0.0 18.3 112.0 -93.7 None
55 122.200k 11.6 +0.0 11.6 106.0 -94.4 None

Page 15 of 224Report No.: MIL05-015
56 118.150k 11.4 +0.0 11.4 106.0 -94.6 None
57 115.150k 11.2 +0.0 11.2 106.0 -94.8 None
58 201.850k 11.1 +0.0 11.1 106.0 -94.9 None
59 673.000k 16.8 +0.0 16.8 112.0 -95.2 None
60 123.550k 10.7 +0.0 10.7 106.0 -95.3 None
61 1.049M 16.3 +0.0 16.3 111.6 -95.3 None
62 126.100k 10.6 +0.0 10.6 106.0 -95.4 None
63 161.200k 10.5 +0.0 10.5 106.0 -95.5 None
64 167.500k 10.2 +0.0 10.2 106.0 -95.8 None
65 215.650k 10.2 +0.0 10.2 106.0 -95.8 None
66 249.700k 10.1 +0.0 10.1 106.0 -95.9 None
67 176.800k 10.0 +0.0 10.0 106.0 -96.0 None
68 130.900k 9.9 +0.0 9.9 106.0 -96.1 None
69 137.650k 9.9 +0.0 9.9 106.0 -96.1 None
70 146.350k 9.9 +0.0 9.9 106.0 -96.1 None
71 174.100k 9.8 +0.0 9.8 106.0 -96.2 None
72 179.650k 9.8 +0.0 9.8 106.0 -96.2 None
73 223.150k 9.8 +0.0 9.8 106.0 -96.2 None
74 132.400k 9.7 +0.0 9.7 106.0 -96.3 None
75 246.100k 9.7 +0.0 9.7 106.0 -96.3 None
76 230.050k 9.6 +0.0 9.6 106.0 -96.4 None
77 195.100k 9.5 +0.0 9.5 106.0 -96.5 None
Page 16 of 224Report No.: MIL05-015
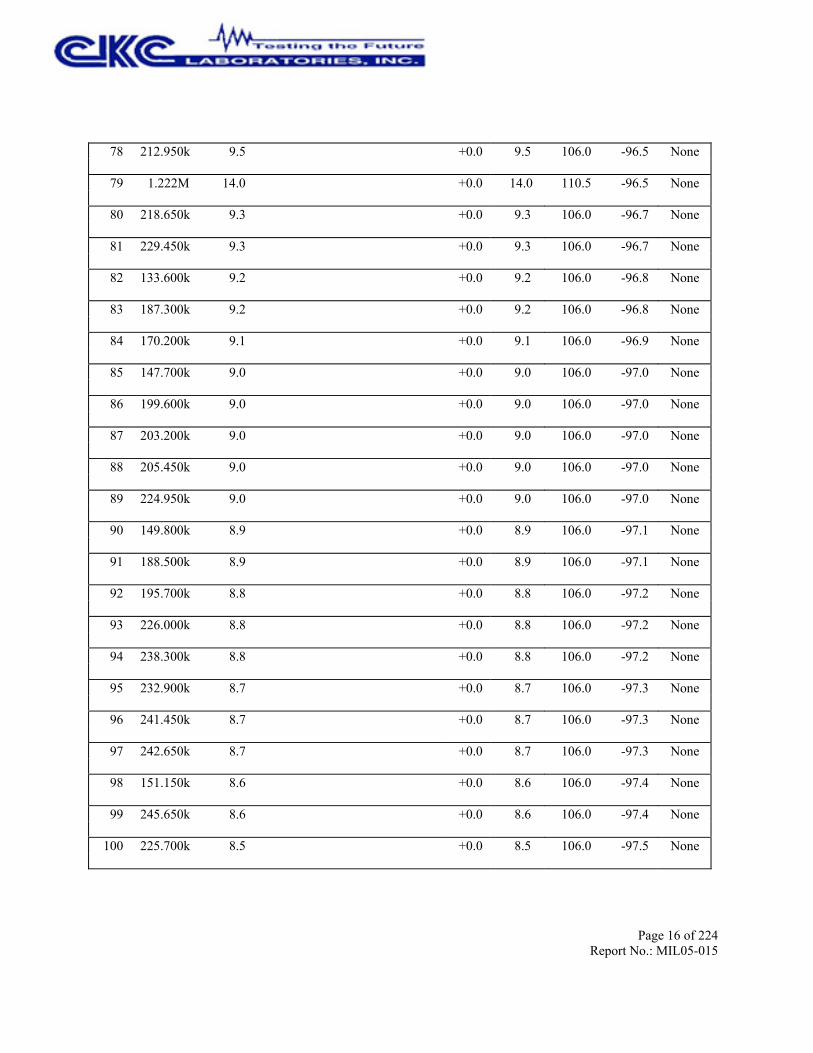
78 212.950k 9.5 +0.0 9.5 106.0 -96.5 None
79 1.222M 14.0 +0.0 14.0 110.5 -96.5 None
80 218.650k 9.3 +0.0 9.3 106.0 -96.7 None
81 229.450k 9.3 +0.0 9.3 106.0 -96.7 None
82 133.600k 9.2 +0.0 9.2 106.0 -96.8 None
83 187.300k 9.2 +0.0 9.2 106.0 -96.8 None
84 170.200k 9.1 +0.0 9.1 106.0 -96.9 None
85 147.700k 9.0 +0.0 9.0 106.0 -97.0 None
86 199.600k 9.0 +0.0 9.0 106.0 -97.0 None
87 203.200k 9.0 +0.0 9.0 106.0 -97.0 None
88 205.450k 9.0 +0.0 9.0 106.0 -97.0 None
89 224.950k 9.0 +0.0 9.0 106.0 -97.0 None
90 149.800k 8.9 +0.0 8.9 106.0 -97.1 None
91 188.500k 8.9 +0.0 8.9 106.0 -97.1 None
92 195.700k 8.8 +0.0 8.8 106.0 -97.2 None
93 226.000k 8.8 +0.0 8.8 106.0 -97.2 None
94 238.300k 8.8 +0.0 8.8 106.0 -97.2 None
95 232.900k 8.7 +0.0 8.7 106.0 -97.3 None
96 241.450k 8.7 +0.0 8.7 106.0 -97.3 None
97 242.650k 8.7 +0.0 8.7 106.0 -97.3 None
98 151.150k 8.6 +0.0 8.6 106.0 -97.4 None
99 245.650k 8.6 +0.0 8.6 106.0 -97.4 None
100 225.700k 8.5 +0.0 8.5 106.0 -97.5 None

Page 17 of 224Report No.: MIL05-015
Test Location: CKC Laboratories, Inc. •1120 Fulton Place • Fremont, CA 94539 • (510) 249 - 1170
Customer: Stanford Linear Accelerator CenterSpecification: CE102 MIL-STD-462Work Order #: 82840 Date: 2/22/2005Test Type: Conducted Emissions Time: 1:20:36 PMEquipment: Sequence#: 0Manufacturer: Tested By: A. BrarModel: 28V DCS/N:Equipment Under Test (* = UUT):
Function Manufacturer Model # S/N
Support Devices:Function Manufacturer Model # S/N
Test Conditions / Notes:Pre-Cal Sweep. Signal at 2MHz. Injecting 113.7mVpp and expecting 58.3dBuV +/-3dB as meter reading.
Transducer Legend:
Measurement Data: Reading listed by margin. Test Lead: None# Freq Rdng Dist Corr Spec Margin Polar
MHz dBµV dB dB dB dB Table dBµV dBµV dB Ant 1 2.003M 58.1 +0.0 58.1 104.9 -46.8 None
2 40.510k 18.6 +0.0 18.6 66.0 -47.4 None
3 38.800k 15.3 +0.0 15.3 66.0 -50.7 None
4 28.720k 15.1 +0.0 15.1 66.0 -50.9 None
5 10.810k 15.0 +0.0 15.0 66.0 -51.0 None
6 33.220k 14.9 +0.0 14.9 66.0 -51.1 None
7 37.180k 14.7 +0.0 14.7 66.0 -51.3 None
8 12.070k 14.3 +0.0 14.3 66.0 -51.7 None
9 53.650k 14.3 +0.0 14.3 66.0 -51.7 None
10 19.450k 14.2 +0.0 14.2 66.0 -51.8 None
11 16.570k 13.9 +0.0 13.9 66.0 -52.1 None

Page 18 of 224Report No.: MIL05-015
12 47.440k 13.9 +0.0 13.9 66.0 -52.1 None
13 58.690k 13.5 +0.0 13.5 66.0 -52.5 None
14 76.150k 13.3 +0.0 13.3 66.0 -52.7 None
15 26.470k 13.1 +0.0 13.1 66.0 -52.9 None
16 50.590k 13.1 +0.0 13.1 66.0 -52.9 None
17 50.050k 13.0 +0.0 13.0 66.0 -53.0 None
18 72.370k 13.0 +0.0 13.0 66.0 -53.0 None
19 78.400k 13.0 +0.0 13.0 66.0 -53.0 None
20 66.430k 12.9 +0.0 12.9 66.0 -53.1 None
21 74.530k 12.9 +0.0 12.9 66.0 -53.1 None
22 24.760k 12.8 +0.0 12.8 66.0 -53.2 None
23 73.180k 12.8 +0.0 12.8 66.0 -53.2 None
24 46.360k 12.7 +0.0 12.7 66.0 -53.3 None
25 22.420k 12.6 +0.0 12.6 66.0 -53.4 None
26 68.320k 12.6 +0.0 12.6 66.0 -53.4 None
27 22.780k 12.5 +0.0 12.5 66.0 -53.5 None
28 64.990k 12.5 +0.0 12.5 66.0 -53.5 None
29 71.560k 12.4 +0.0 12.4 66.0 -53.6 None
30 87.580k 12.4 +0.0 12.4 66.0 -53.6 None
Page 19 of 224Report No.: MIL05-015
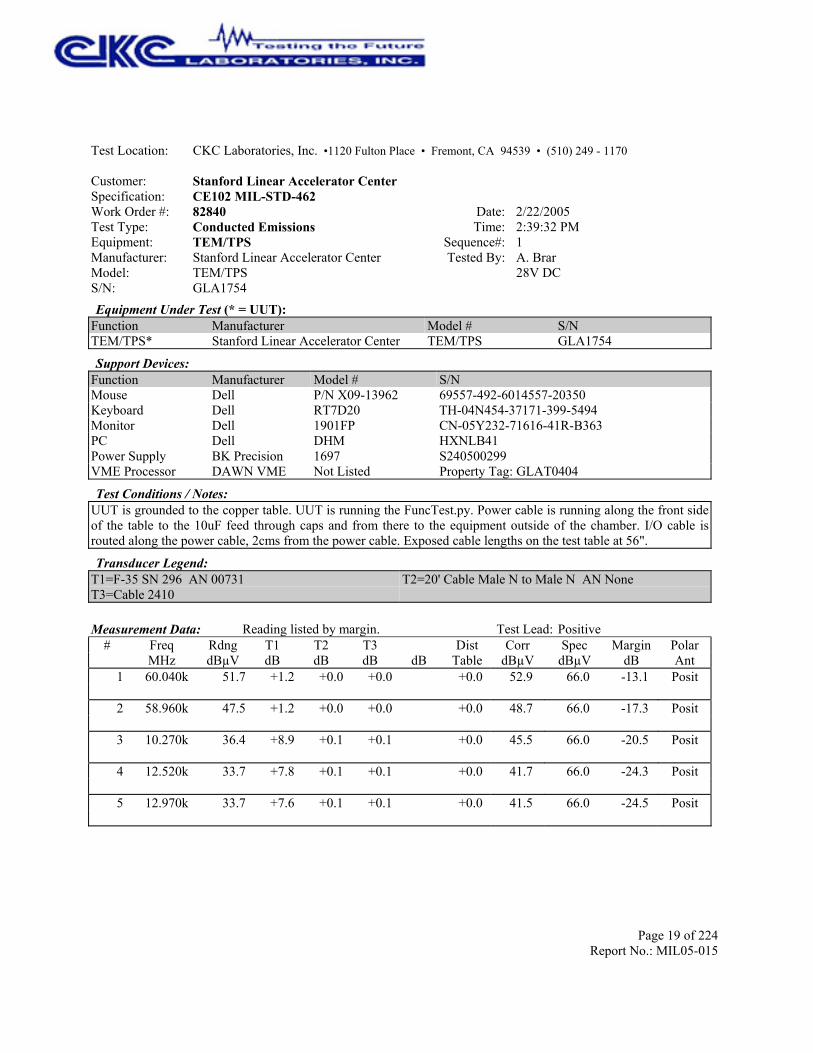
Test Location: CKC Laboratories, Inc. •1120 Fulton Place • Fremont, CA 94539 • (510) 249 - 1170
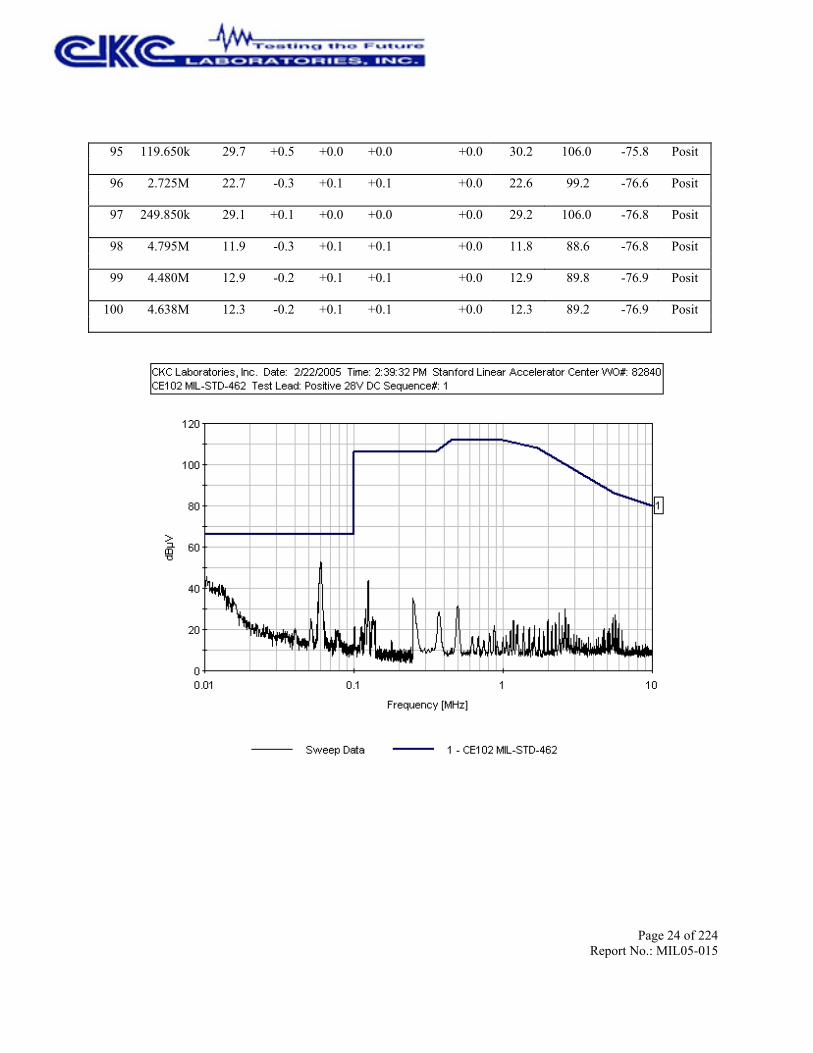
Customer: Stanford Linear Accelerator CenterSpecification: CE102 MIL-STD-462Work Order #: 82840 Date: 2/22/2005Test Type: Conducted Emissions Time: 2:39:32 PMEquipment: TEM/TPS Sequence#: 1Manufacturer: Stanford Linear Accelerator Center Tested By: A. BrarModel: TEM/TPS 28V DCS/N: GLA1754Equipment Under Test (* = UUT):
Function Manufacturer Model # S/NTEM/TPS* Stanford Linear Accelerator Center TEM/TPS GLA1754
Support Devices:Function Manufacturer Model # S/NMouse Dell P/N X09-13962 69557-492-6014557-20350Keyboard Dell RT7D20 TH-04N454-37171-399-5494Monitor Dell 1901FP CN-05Y232-71616-41R-B363PC Dell DHM HXNLB41Power Supply BK Precision 1697 S240500299VME Processor DAWN VME Not Listed Property Tag: GLAT0404
Test Conditions / Notes:UUT is grounded to the copper table. UUT is running the FuncTest.py. Power cable is running along the front sideof the table to the 10uF feed through caps and from there to the equipment outside of the chamber. I/O cable isrouted along the power cable, 2cms from the power cable. Exposed cable lengths on the test table at 56".
Transducer Legend:T1=F-35 SN 296 AN 00731T3=Cable 2410
T2=20' Cable Male N to Male N AN None
Measurement Data: Reading listed by margin. Test Lead: Positive# Freq Rdng T1 T2 T3 Dist Corr Spec Margin Polar
MHz dBµV dB dB dB dB Table dBµV dBµV dB Ant 1 60.040k 51.7 +0.0 52.9 66.0 -13.1 Posit +1.2 +0.0 +0.0
2 58.960k 47.5 +0.0 48.7 66.0 -17.3 Posit +1.2 +0.0 +0.0
3 10.270k 36.4 +0.0 45.5 66.0 -20.5 Posit +8.9 +0.1 +0.1
4 12.520k 33.7 +0.0 41.7 66.0 -24.3 Posit +7.8 +0.1 +0.1
5 12.970k 33.7 +0.0 41.5 66.0 -24.5 Posit +7.6 +0.1 +0.1

Page 20 of 224Report No.: MIL05-015
6 12.340k 32.9 +0.0 41.0 66.0 -25.0 Posit +7.9 +0.1 +0.1
7 13.330k 32.7 +0.0 40.3 66.0 -25.7 Posit +7.4 +0.1 +0.1
8 13.690k 32.5 +0.0 39.9 66.0 -26.1 Posit +7.2 +0.1 +0.1
9 58.060k 38.2 +0.0 39.4 66.0 -26.6 Posit +1.2 +0.0 +0.0
10 57.880k 36.1 +0.0 37.3 66.0 -28.7 Posit +1.2 +0.0 +0.0
11 14.230k 29.3 +0.0 36.4 66.0 -29.6 Posit +7.0 +0.0 +0.1
12 13.960k 28.3 +0.0 35.6 66.0 -30.4 Posit +7.1 +0.1 +0.1
13 14.680k 28.2 +0.0 35.1 66.0 -30.9 Posit +6.8 +0.0 +0.1
14 15.310k 28.4 +0.0 35.1 66.0 -30.9 Posit +6.6 +0.0 +0.1
15 17.200k 22.7 +0.0 28.7 66.0 -37.3 Posit +5.9 +0.0 +0.1
16 56.980k 26.4 +0.0 27.7 66.0 -38.3 Posit +1.3 +0.0 +0.0
17 62.380k 26.1 +0.0 27.3 66.0 -38.7 Posit +1.2 +0.0 +0.0
18 62.740k 24.8 +0.0 25.9 66.0 -40.1 Posit +1.1 +0.0 +0.0
19 18.640k 20.2 +0.0 25.7 66.0 -40.3 Posit +5.4 +0.0 +0.1
20 56.800k 24.2 +0.0 25.5 66.0 -40.5 Posit +1.3 +0.0 +0.0
21 51.580k 23.6 +0.0 25.1 66.0 -40.9 Posit +1.4 +0.0 +0.1
22 21.970k 18.2 +0.0 22.8 66.0 -43.2 Posit +4.5 +0.0 +0.1
23 21.070k 17.7 +0.0 22.5 66.0 -43.5 Posit +4.7 +0.0 +0.1
24 24.760k 18.3 +0.0 22.3 66.0 -43.7 Posit +3.9 +0.0 +0.1
25 22.510k 17.3 +0.0 21.8 66.0 -44.2 Posit +4.4 +0.0 +0.1
26 26.560k 17.8 +0.0 21.5 66.0 -44.5 Posit +3.6 +0.0 +0.1
27 25.750k 17.2 +0.0 21.1 66.0 -44.9 Posit +3.8 +0.0 +0.1

Page 21 of 224Report No.: MIL05-015
28 40.060k 18.3 +0.0 20.5 66.0 -45.5 Posit +2.1 +0.0 +0.1
29 27.190k 16.6 +0.0 20.2 66.0 -45.8 Posit +3.5 +0.0 +0.1
30 33.670k 17.2 +0.0 19.9 66.0 -46.1 Posit +2.6 +0.0 +0.1
31 74.710k 18.9 +0.0 19.9 66.0 -46.1 Posit +0.9 +0.0 +0.1
32 78.310k 18.9 +0.0 19.7 66.0 -46.3 Posit +0.8 +0.0 +0.0
33 77.680k 18.7 +0.0 19.5 66.0 -46.5 Posit +0.8 +0.0 +0.0
34 27.640k 15.7 +0.0 19.2 66.0 -46.8 Posit +3.4 +0.0 +0.1
35 28.720k 15.9 +0.0 19.2 66.0 -46.8 Posit +3.2 +0.0 +0.1
36 63.910k 18.1 +0.0 19.2 66.0 -46.8 Posit +1.1 +0.0 +0.0
37 76.330k 18.1 +0.0 19.0 66.0 -47.0 Posit +0.9 +0.0 +0.0
38 63.640k 17.8 +0.0 18.9 66.0 -47.1 Posit +1.1 +0.0 +0.0
39 30.700k 15.8 +0.0 18.8 66.0 -47.2 Posit +2.9 +0.0 +0.1
40 31.780k 15.8 +0.0 18.7 66.0 -47.3 Posit +2.8 +0.0 +0.1
41 79.840k 17.3 +0.0 18.1 66.0 -47.9 Posit +0.8 +0.0 +0.0
42 80.650k 17.3 +0.0 18.1 66.0 -47.9 Posit +0.8 +0.0 +0.0
43 38.260k 15.7 +0.0 18.0 66.0 -48.0 Posit +2.2 +0.0 +0.1
44 36.910k 15.3 +0.0 17.8 66.0 -48.2 Posit +2.4 +0.0 +0.1
45 79.300k 16.9 +0.0 17.7 66.0 -48.3 Posit +0.8 +0.0 +0.0
46 38.440k 14.8 +0.0 17.1 66.0 -48.9 Posit +2.2 +0.0 +0.1
47 38.890k 14.3 +0.0 16.6 66.0 -49.4 Posit +2.2 +0.0 +0.1
48 42.310k 14.6 +0.0 16.6 66.0 -49.4 Posit +1.9 +0.0 +0.1
49 64.990k 15.1 +0.0 16.3 66.0 -49.7 Posit +1.1 +0.0 +0.1

Page 22 of 224Report No.: MIL05-015
50 70.120k 15.2 +0.0 16.3 66.0 -49.7 Posit +1.0 +0.0 +0.1
51 45.820k 13.9 +0.0 15.7 66.0 -50.3 Posit +1.7 +0.0 +0.1
52 81.190k 14.5 +0.0 15.3 66.0 -50.7 Posit +0.8 +0.0 +0.0
53 71.650k 13.9 +0.0 15.0 66.0 -51.0 Posit +1.0 +0.0 +0.1
54 74.260k 13.8 +0.0 14.8 66.0 -51.2 Posit +0.9 +0.0 +0.1
55 70.390k 13.6 +0.0 14.7 66.0 -51.3 Posit +1.0 +0.0 +0.1
56 85.960k 13.3 +0.0 14.1 66.0 -51.9 Posit +0.7 +0.0 +0.1
57 67.780k 12.6 +0.0 13.7 66.0 -52.3 Posit +1.0 +0.0 +0.1
58 72.640k 12.4 +0.0 13.4 66.0 -52.6 Posit +0.9 +0.0 +0.1
59 84.880k 12.6 +0.0 13.4 66.0 -52.6 Posit +0.7 +0.0 +0.1
60 83.350k 12.5 +0.0 13.2 66.0 -52.8 Posit +0.7 +0.0 +0.0
61 89.920k 12.1 +0.0 12.9 66.0 -53.1 Posit +0.7 +0.0 +0.1
62 98.110k 12.1 +0.0 12.7 66.0 -53.3 Posit +0.6 +0.0 +0.0
63 92.350k 11.2 +0.0 12.0 66.0 -54.0 Posit +0.7 +0.0 +0.1
64 5.605M 27.2 +0.0 27.2 85.8 -58.6 Posit -0.2 +0.1 +0.1
65 5.478M 25.8 +0.0 25.8 86.1 -60.3 Posit -0.2 +0.1 +0.1
66 5.725M 24.2 +0.0 24.2 85.6 -61.4 Posit -0.2 +0.1 +0.1
67 124.600k 43.1 +0.0 43.6 106.0 -62.4 Posit +0.5 +0.0 +0.0
68 5.980M 22.7 +0.0 22.7 85.2 -62.5 Posit -0.2 +0.1 +0.1
69 5.350M 23.0 +0.0 22.9 86.5 -63.6 Posit -0.3 +0.1 +0.1
70 5.853M 20.6 +0.0 20.6 85.4 -64.8 Posit -0.2 +0.1 +0.1
71 6.228M 19.6 +0.0 19.6 84.8 -65.2 Posit -0.2 +0.1 +0.1
Page 23 of 224Report No.: MIL05-015
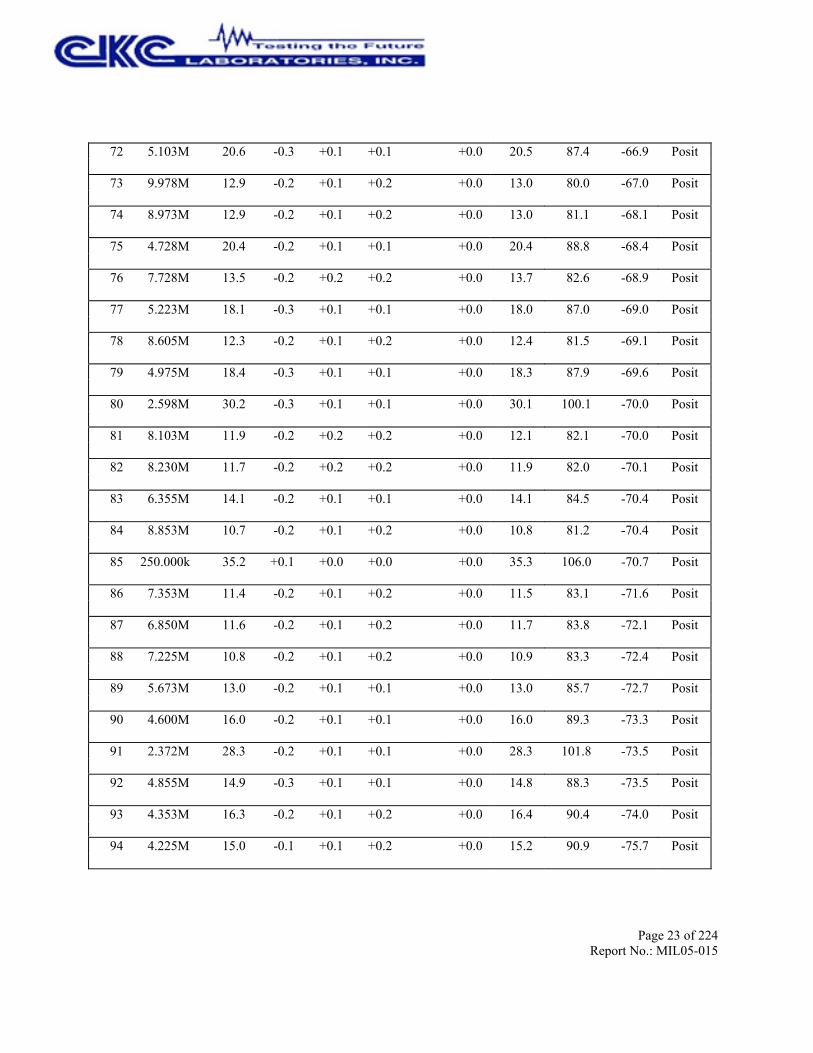
72 5.103M 20.6 +0.0 20.5 87.4 -66.9 Posit -0.3 +0.1 +0.1
73 9.978M 12.9 +0.0 13.0 80.0 -67.0 Posit -0.2 +0.1 +0.2
74 8.973M 12.9 +0.0 13.0 81.1 -68.1 Posit -0.2 +0.1 +0.2
75 4.728M 20.4 +0.0 20.4 88.8 -68.4 Posit -0.2 +0.1 +0.1
76 7.728M 13.5 +0.0 13.7 82.6 -68.9 Posit -0.2 +0.2 +0.2
77 5.223M 18.1 +0.0 18.0 87.0 -69.0 Posit -0.3 +0.1 +0.1
78 8.605M 12.3 +0.0 12.4 81.5 -69.1 Posit -0.2 +0.1 +0.2
79 4.975M 18.4 +0.0 18.3 87.9 -69.6 Posit -0.3 +0.1 +0.1
80 2.598M 30.2 +0.0 30.1 100.1 -70.0 Posit -0.3 +0.1 +0.1
81 8.103M 11.9 +0.0 12.1 82.1 -70.0 Posit -0.2 +0.2 +0.2
82 8.230M 11.7 +0.0 11.9 82.0 -70.1 Posit -0.2 +0.2 +0.2
83 6.355M 14.1 +0.0 14.1 84.5 -70.4 Posit -0.2 +0.1 +0.1
84 8.853M 10.7 +0.0 10.8 81.2 -70.4 Posit -0.2 +0.1 +0.2
85 250.000k 35.2 +0.0 35.3 106.0 -70.7 Posit +0.1 +0.0 +0.0
86 7.353M 11.4 +0.0 11.5 83.1 -71.6 Posit -0.2 +0.1 +0.2
87 6.850M 11.6 +0.0 11.7 83.8 -72.1 Posit -0.2 +0.1 +0.2
88 7.225M 10.8 +0.0 10.9 83.3 -72.4 Posit -0.2 +0.1 +0.2
89 5.673M 13.0 +0.0 13.0 85.7 -72.7 Posit -0.2 +0.1 +0.1
90 4.600M 16.0 +0.0 16.0 89.3 -73.3 Posit -0.2 +0.1 +0.1
91 2.372M 28.3 +0.0 28.3 101.8 -73.5 Posit -0.2 +0.1 +0.1
92 4.855M 14.9 +0.0 14.8 88.3 -73.5 Posit -0.3 +0.1 +0.1
93 4.353M 16.3 +0.0 16.4 90.4 -74.0 Posit -0.2 +0.1 +0.2
94 4.225M 15.0 +0.0 15.2 90.9 -75.7 Posit -0.1 +0.1 +0.2
Page 24 of 224Report No.: MIL05-015
95 119.650k 29.7 +0.0 30.2 106.0 -75.8 Posit +0.5 +0.0 +0.0
96 2.725M 22.7 +0.0 22.6 99.2 -76.6 Posit -0.3 +0.1 +0.1
97 249.850k 29.1 +0.0 29.2 106.0 -76.8 Posit +0.1 +0.0 +0.0
98 4.795M 11.9 +0.0 11.8 88.6 -76.8 Posit -0.3 +0.1 +0.1
99 4.480M 12.9 +0.0 12.9 89.8 -76.9 Posit -0.2 +0.1 +0.1
100 4.638M 12.3 +0.0 12.3 89.2 -76.9 Posit -0.2 +0.1 +0.1
Page 25 of 224Report No.: MIL05-015
Test Location: CKC Laboratories, Inc. •1120 Fulton Place • Fremont, CA 94539 • (510) 249 - 1170
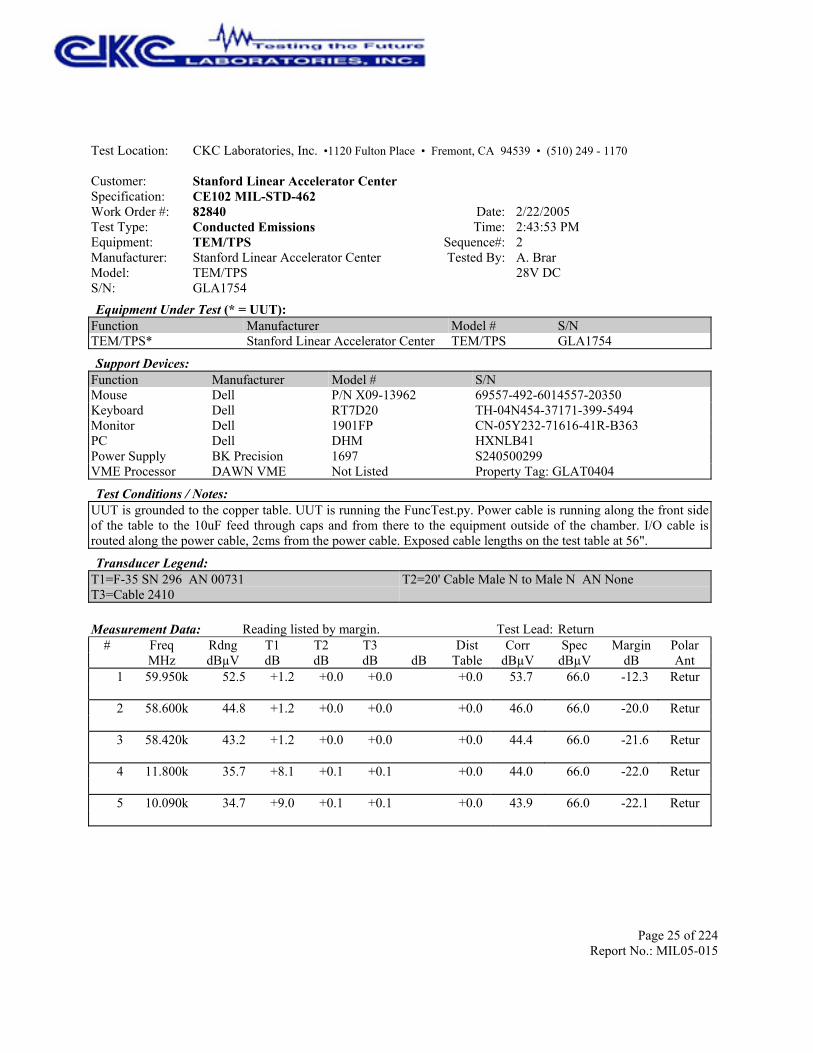
Customer: Stanford Linear Accelerator CenterSpecification: CE102 MIL-STD-462Work Order #: 82840 Date: 2/22/2005Test Type: Conducted Emissions Time: 2:43:53 PMEquipment: TEM/TPS Sequence#: 2Manufacturer: Stanford Linear Accelerator Center Tested By: A. BrarModel: TEM/TPS 28V DCS/N: GLA1754Equipment Under Test (* = UUT):
Function Manufacturer Model # S/NTEM/TPS* Stanford Linear Accelerator Center TEM/TPS GLA1754
Support Devices:Function Manufacturer Model # S/NMouse Dell P/N X09-13962 69557-492-6014557-20350Keyboard Dell RT7D20 TH-04N454-37171-399-5494Monitor Dell 1901FP CN-05Y232-71616-41R-B363PC Dell DHM HXNLB41Power Supply BK Precision 1697 S240500299VME Processor DAWN VME Not Listed Property Tag: GLAT0404
Test Conditions / Notes:UUT is grounded to the copper table. UUT is running the FuncTest.py. Power cable is running along the front sideof the table to the 10uF feed through caps and from there to the equipment outside of the chamber. I/O cable isrouted along the power cable, 2cms from the power cable. Exposed cable lengths on the test table at 56".
Transducer Legend:T1=F-35 SN 296 AN 00731T3=Cable 2410
T2=20' Cable Male N to Male N AN None
Measurement Data: Reading listed by margin. Test Lead: Return# Freq Rdng T1 T2 T3 Dist Corr Spec Margin Polar
MHz dBµV dB dB dB dB Table dBµV dBµV dB Ant 1 59.950k 52.5 +0.0 53.7 66.0 -12.3 Retur +1.2 +0.0 +0.0
2 58.600k 44.8 +0.0 46.0 66.0 -20.0 Retur +1.2 +0.0 +0.0
3 58.420k 43.2 +0.0 44.4 66.0 -21.6 Retur +1.2 +0.0 +0.0
4 11.800k 35.7 +0.0 44.0 66.0 -22.0 Retur +8.1 +0.1 +0.1
5 10.090k 34.7 +0.0 43.9 66.0 -22.1 Retur +9.0 +0.1 +0.1

Page 26 of 224Report No.: MIL05-015
6 10.360k 33.6 +0.0 42.7 66.0 -23.3 Retur +8.9 +0.1 +0.1
7 58.240k 41.3 +0.0 42.5 66.0 -23.5 Retur +1.2 +0.0 +0.0
8 12.970k 33.4 +0.0 41.2 66.0 -24.8 Retur +7.6 +0.1 +0.1
9 13.510k 30.4 +0.0 37.9 66.0 -28.1 Retur +7.3 +0.1 +0.1
10 13.960k 30.2 +0.0 37.5 66.0 -28.5 Retur +7.1 +0.1 +0.1
11 15.130k 27.7 +0.0 34.5 66.0 -31.5 Retur +6.7 +0.0 +0.1
12 57.520k 32.7 +0.0 33.9 66.0 -32.1 Retur +1.2 +0.0 +0.0
13 14.680k 26.4 +0.0 33.3 66.0 -32.7 Retur +6.8 +0.0 +0.1
14 57.340k 30.9 +0.0 32.2 66.0 -33.8 Retur +1.3 +0.0 +0.0
15 57.160k 29.3 +0.0 30.6 66.0 -35.4 Retur +1.3 +0.0 +0.0
16 15.580k 23.7 +0.0 30.3 66.0 -35.7 Retur +6.5 +0.0 +0.1
17 18.550k 19.4 +0.0 24.9 66.0 -41.1 Retur +5.4 +0.0 +0.1
18 23.590k 20.4 +0.0 24.7 66.0 -41.3 Retur +4.2 +0.0 +0.1
19 21.430k 19.4 +0.0 24.2 66.0 -41.8 Retur +4.7 +0.0 +0.1
20 19.990k 18.7 +0.0 23.8 66.0 -42.2 Retur +5.0 +0.0 +0.1
21 22.870k 18.5 +0.0 22.9 66.0 -43.1 Retur +4.3 +0.0 +0.1
22 22.420k 18.2 +0.0 22.7 66.0 -43.3 Retur +4.4 +0.0 +0.1
23 63.280k 21.6 +0.0 22.7 66.0 -43.3 Retur +1.1 +0.0 +0.0
24 24.940k 18.3 +0.0 22.3 66.0 -43.7 Retur +3.9 +0.0 +0.1
25 62.920k 21.2 +0.0 22.3 66.0 -43.7 Retur +1.1 +0.0 +0.0
26 56.440k 19.4 +0.0 20.7 66.0 -45.3 Retur +1.3 +0.0 +0.0
27 26.830k 16.8 +0.0 20.5 66.0 -45.5 Retur +3.6 +0.0 +0.1

Page 27 of 224Report No.: MIL05-015
28 74.620k 19.5 +0.0 20.5 66.0 -45.5 Retur +0.9 +0.0 +0.1
29 36.370k 17.7 +0.0 20.2 66.0 -45.8 Retur +2.4 +0.0 +0.1
30 27.910k 16.5 +0.0 20.0 66.0 -46.0 Retur +3.4 +0.0 +0.1
31 33.130k 17.2 +0.0 20.0 66.0 -46.0 Retur +2.7 +0.0 +0.1
32 56.260k 18.7 +0.0 20.0 66.0 -46.0 Retur +1.3 +0.0 +0.0
33 40.510k 17.6 +0.0 19.8 66.0 -46.2 Retur +2.1 +0.0 +0.1
34 28.450k 16.3 +0.0 19.7 66.0 -46.3 Retur +3.3 +0.0 +0.1
35 74.980k 18.8 +0.0 19.7 66.0 -46.3 Retur +0.9 +0.0 +0.0
36 76.690k 18.7 +0.0 19.6 66.0 -46.4 Retur +0.9 +0.0 +0.0
37 52.210k 18.0 +0.0 19.5 66.0 -46.5 Retur +1.4 +0.0 +0.1
38 28.900k 16.0 +0.0 19.3 66.0 -46.7 Retur +3.2 +0.0 +0.1
39 78.400k 17.8 +0.0 18.6 66.0 -47.4 Retur +0.8 +0.0 +0.0
40 46.000k 16.5 +0.0 18.3 66.0 -47.7 Retur +1.7 +0.0 +0.1
41 35.380k 15.6 +0.0 18.2 66.0 -47.8 Retur +2.5 +0.0 +0.1
42 55.990k 16.8 +0.0 18.1 66.0 -47.9 Retur +1.3 +0.0 +0.0
43 29.260k 14.7 +0.0 17.9 66.0 -48.1 Retur +3.1 +0.0 +0.1
44 43.120k 15.9 +0.0 17.9 66.0 -48.1 Retur +1.9 +0.0 +0.1
45 38.620k 15.5 +0.0 17.8 66.0 -48.2 Retur +2.2 +0.0 +0.1
46 37.180k 15.3 +0.0 17.7 66.0 -48.3 Retur +2.3 +0.0 +0.1
47 36.640k 14.9 +0.0 17.4 66.0 -48.6 Retur +2.4 +0.0 +0.1
48 44.740k 15.3 +0.0 17.2 66.0 -48.8 Retur +1.8 +0.0 +0.1
49 37.990k 14.5 +0.0 16.9 66.0 -49.1 Retur +2.3 +0.0 +0.1

Page 28 of 224Report No.: MIL05-015
50 64.900k 15.2 +0.0 16.4 66.0 -49.6 Retur +1.1 +0.0 +0.1
51 47.890k 14.4 +0.0 16.1 66.0 -49.9 Retur +1.6 +0.0 +0.1
52 45.370k 13.9 +0.0 15.8 66.0 -50.2 Retur +1.8 +0.0 +0.1
53 46.720k 14.0 +0.0 15.8 66.0 -50.2 Retur +1.7 +0.0 +0.1
54 64.360k 14.6 +0.0 15.7 66.0 -50.3 Retur +1.1 +0.0 +0.0
55 80.560k 14.8 +0.0 15.6 66.0 -50.4 Retur +0.8 +0.0 +0.0
56 81.190k 14.8 +0.0 15.6 66.0 -50.4 Retur +0.8 +0.0 +0.0
57 81.910k 14.5 +0.0 15.3 66.0 -50.7 Retur +0.8 +0.0 +0.0
58 46.360k 13.1 +0.0 14.9 66.0 -51.1 Retur +1.7 +0.0 +0.1
59 86.050k 13.9 +0.0 14.7 66.0 -51.3 Retur +0.7 +0.0 +0.1
60 66.340k 13.3 +0.0 14.5 66.0 -51.5 Retur +1.1 +0.0 +0.1
61 70.930k 13.2 +0.0 14.3 66.0 -51.7 Retur +1.0 +0.0 +0.1
62 73.630k 13.0 +0.0 14.0 66.0 -52.0 Retur +0.9 +0.0 +0.1
63 73.270k 12.9 +0.0 13.9 66.0 -52.1 Retur +0.9 +0.0 +0.1
64 68.590k 12.7 +0.0 13.8 66.0 -52.2 Retur +1.0 +0.0 +0.1
65 85.240k 13.0 +0.0 13.8 66.0 -52.2 Retur +0.7 +0.0 +0.1
66 89.560k 12.6 +0.0 13.4 66.0 -52.6 Retur +0.7 +0.0 +0.1
67 72.460k 12.3 +0.0 13.3 66.0 -52.7 Retur +0.9 +0.0 +0.1
68 88.210k 12.5 +0.0 13.3 66.0 -52.7 Retur +0.7 +0.0 +0.1
69 70.480k 12.1 +0.0 13.2 66.0 -52.8 Retur +1.0 +0.0 +0.1
70 71.380k 11.9 +0.0 13.0 66.0 -53.0 Retur +1.0 +0.0 +0.1
71 87.040k 12.2 +0.0 13.0 66.0 -53.0 Retur +0.7 +0.0 +0.1
Page 29 of 224Report No.: MIL05-015
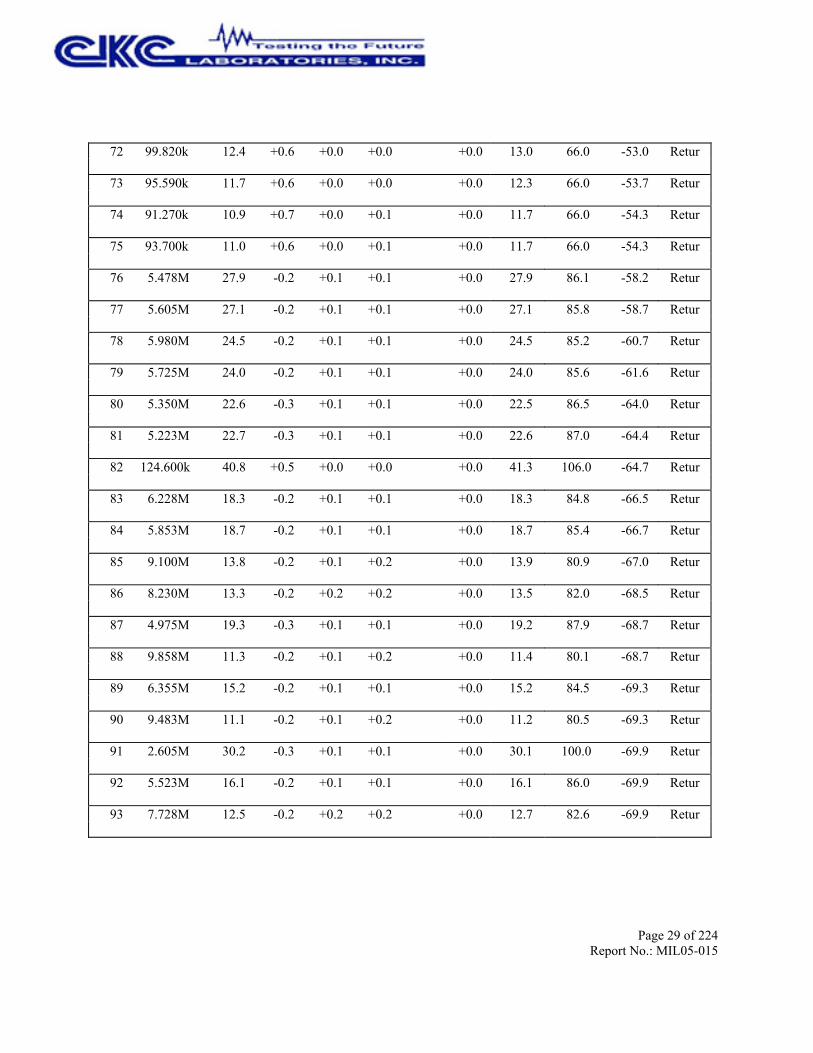
72 99.820k 12.4 +0.0 13.0 66.0 -53.0 Retur +0.6 +0.0 +0.0
73 95.590k 11.7 +0.0 12.3 66.0 -53.7 Retur +0.6 +0.0 +0.0
74 91.270k 10.9 +0.0 11.7 66.0 -54.3 Retur +0.7 +0.0 +0.1
75 93.700k 11.0 +0.0 11.7 66.0 -54.3 Retur +0.6 +0.0 +0.1
76 5.478M 27.9 +0.0 27.9 86.1 -58.2 Retur -0.2 +0.1 +0.1
77 5.605M 27.1 +0.0 27.1 85.8 -58.7 Retur -0.2 +0.1 +0.1
78 5.980M 24.5 +0.0 24.5 85.2 -60.7 Retur -0.2 +0.1 +0.1
79 5.725M 24.0 +0.0 24.0 85.6 -61.6 Retur -0.2 +0.1 +0.1
80 5.350M 22.6 +0.0 22.5 86.5 -64.0 Retur -0.3 +0.1 +0.1
81 5.223M 22.7 +0.0 22.6 87.0 -64.4 Retur -0.3 +0.1 +0.1
82 124.600k 40.8 +0.0 41.3 106.0 -64.7 Retur +0.5 +0.0 +0.0
83 6.228M 18.3 +0.0 18.3 84.8 -66.5 Retur -0.2 +0.1 +0.1
84 5.853M 18.7 +0.0 18.7 85.4 -66.7 Retur -0.2 +0.1 +0.1
85 9.100M 13.8 +0.0 13.9 80.9 -67.0 Retur -0.2 +0.1 +0.2
86 8.230M 13.3 +0.0 13.5 82.0 -68.5 Retur -0.2 +0.2 +0.2
87 4.975M 19.3 +0.0 19.2 87.9 -68.7 Retur -0.3 +0.1 +0.1
88 9.858M 11.3 +0.0 11.4 80.1 -68.7 Retur -0.2 +0.1 +0.2
89 6.355M 15.2 +0.0 15.2 84.5 -69.3 Retur -0.2 +0.1 +0.1
90 9.483M 11.1 +0.0 11.2 80.5 -69.3 Retur -0.2 +0.1 +0.2
91 2.605M 30.2 +0.0 30.1 100.0 -69.9 Retur -0.3 +0.1 +0.1
92 5.523M 16.1 +0.0 16.1 86.0 -69.9 Retur -0.2 +0.1 +0.1
93 7.728M 12.5 +0.0 12.7 82.6 -69.9 Retur -0.2 +0.2 +0.2

Page 30 of 224Report No.: MIL05-015
94 8.103M 11.9 +0.0 12.1 82.1 -70.0 Retur -0.2 +0.2 +0.2
95 5.425M 16.2 +0.0 16.1 86.3 -70.2 Retur -0.3 +0.1 +0.1
96 6.978M 12.7 +0.0 12.8 83.6 -70.8 Retur -0.2 +0.1 +0.2
97 4.855M 17.5 +0.0 17.4 88.3 -70.9 Retur -0.3 +0.1 +0.1
98 6.603M 12.6 +0.0 12.7 84.2 -71.5 Retur -0.2 +0.1 +0.2
99 4.600M 17.6 +0.0 17.6 89.3 -71.7 Retur -0.2 +0.1 +0.1
100 5.103M 15.3 +0.0 15.2 87.4 -72.2 Retur -0.3 +0.1 +0.1
Page 31 of 224Report No.: MIL05-015
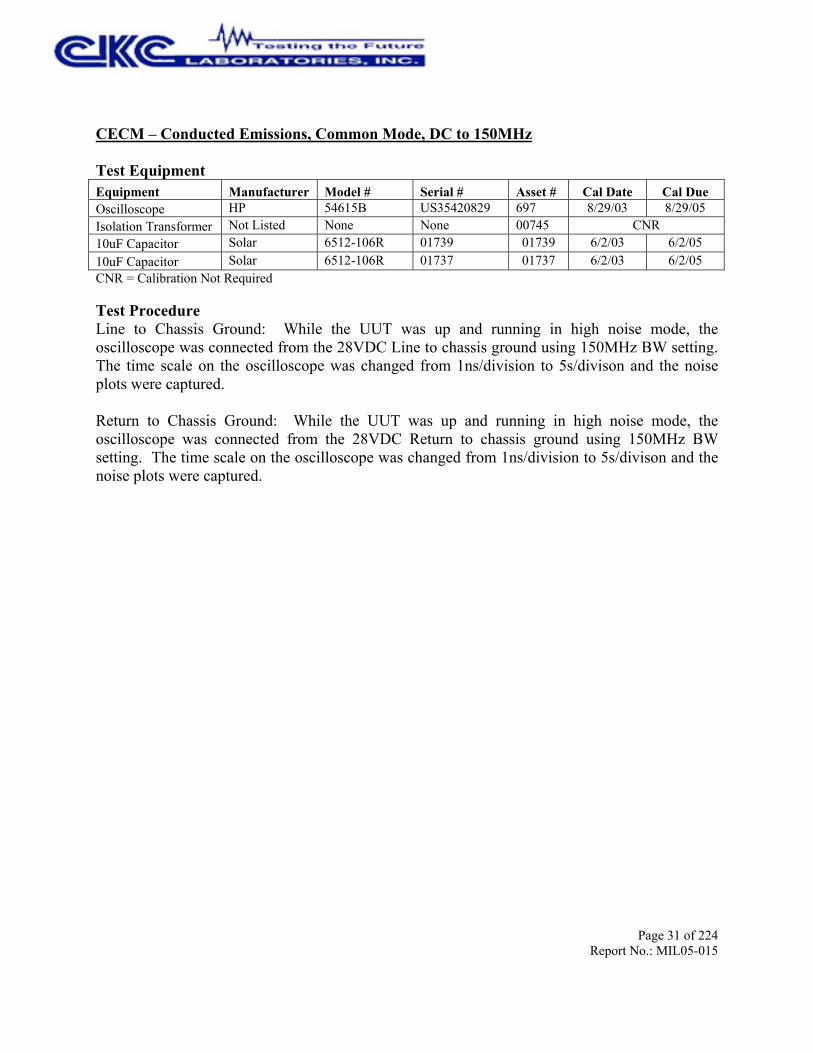
CECM – Conducted Emissions, Common Mode, DC to 150MHz
Test EquipmentEquipment Manufacturer Model # Serial # Asset # Cal Date Cal DueOscilloscope HP 54615B US35420829 697 8/29/03 8/29/05Isolation Transformer Not Listed None None 00745 CNR10uF Capacitor Solar 6512-106R 01739 01739 6/2/03 6/2/0510uF Capacitor Solar 6512-106R 01737 01737 6/2/03 6/2/05CNR = Calibration Not Required
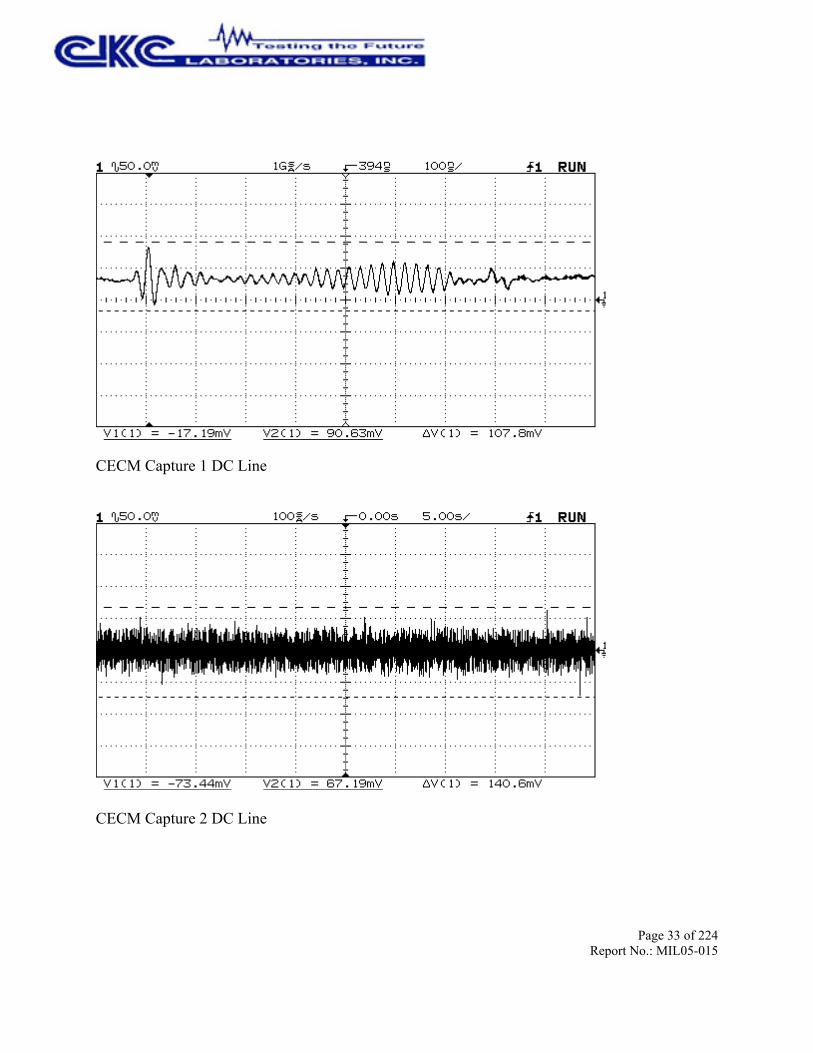
Test ProcedureLine to Chassis Ground: While the UUT was up and running in high noise mode, theoscilloscope was connected from the 28VDC Line to chassis ground using 150MHz BW setting.The time scale on the oscilloscope was changed from 1ns/division to 5s/divison and the noiseplots were captured.
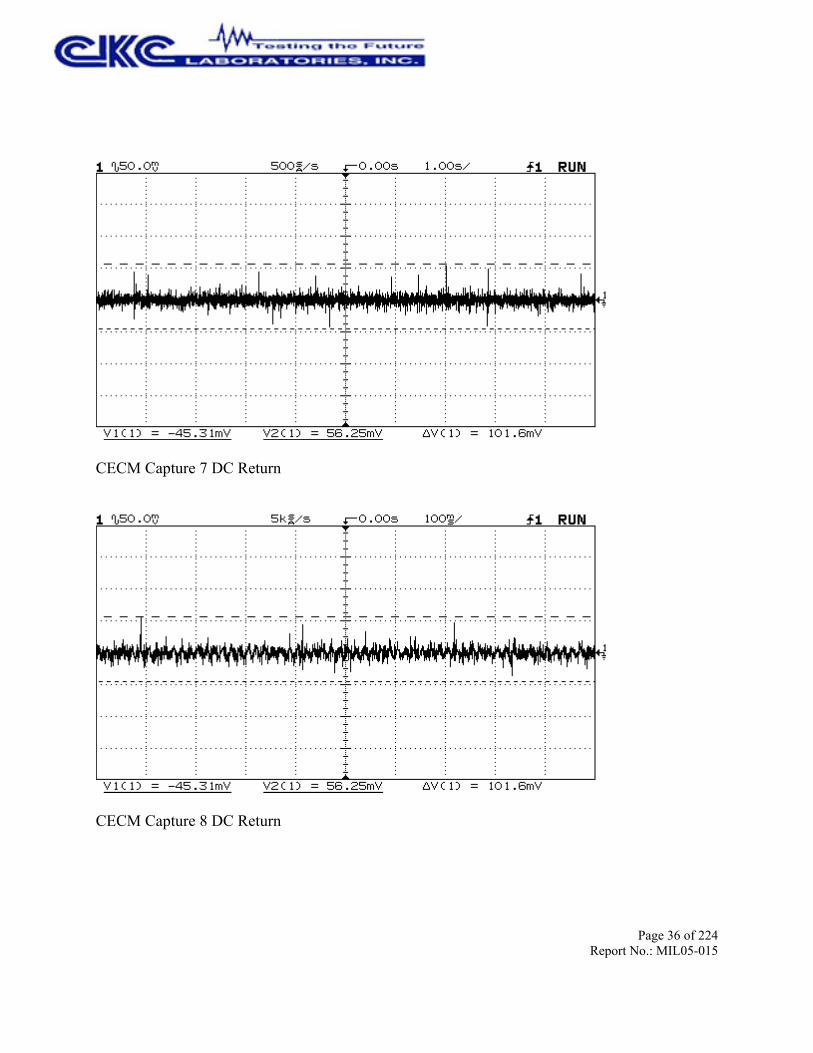
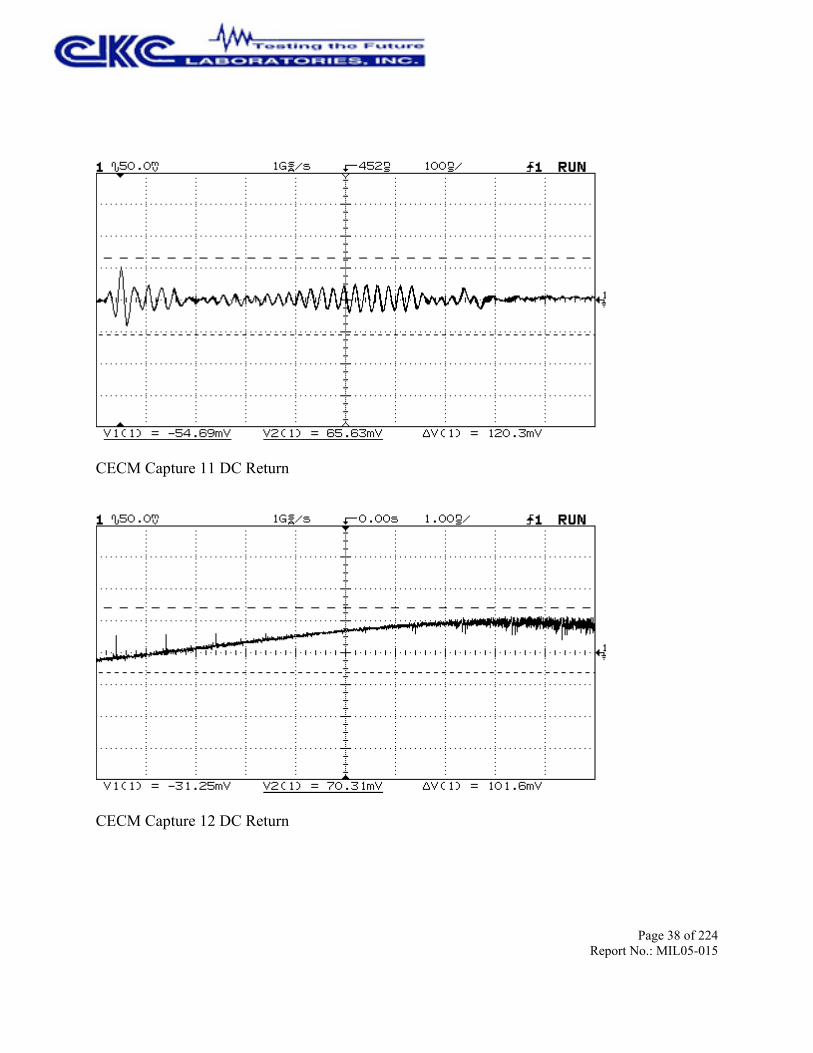
Return to Chassis Ground: While the UUT was up and running in high noise mode, theoscilloscope was connected from the 28VDC Return to chassis ground using 150MHz BWsetting. The time scale on the oscilloscope was changed from 1ns/division to 5s/divison and thenoise plots were captured.

Page 32 of 224Report No.: MIL05-015
Conducted Emissions Common Mode Test Setup
Conducted Emissions Common Mode Closeup
Page 33 of 224Report No.: MIL05-015
CECM Capture 1 DC Line
CECM Capture 2 DC Line

Page 34 of 224Report No.: MIL05-015
CECM Capture 3 DC Line
CECM Capture 4 DC Line

Page 35 of 224Report No.: MIL05-015
CECM Capture 5 DC Line
CECM Capture 6 DC Return
Page 36 of 224Report No.: MIL05-015
CECM Capture 7 DC Return
CECM Capture 8 DC Return

Page 37 of 224Report No.: MIL05-015
CECM Capture 9 DC Return
CECM Capture 10 DC Return
Page 38 of 224Report No.: MIL05-015
CECM Capture 11 DC Return
CECM Capture 12 DC Return

Page 39 of 224Report No.: MIL05-015
RE101 - Radiated Emissions, Magnetic Field, 30Hz to 100kHz
Test EquipmentFunction Asset # S/N Calibration Date Cal Due DateCable RG214/U 02410 None 06/07/2004 06/07/2005Cable RG58 C/U None None 04/12/2004 04/12/2005RF Probe F-303 01485 21 08/20/2003 08/20/2005SA - E4446A 02668 US44300408 01/13/2005 01/13/2007
Test ProcedureA signal generator was connected into the measurement system. The test engineer performed apath loss check by injecting a signal at 50kHz that was 6dB below the limit line and measuringthe resulting emission on the spectrum analyzer. Then, the signal generator was removed and thetest cable was connected from the loop sensor to the spectrum analyzer.
The UUT was powered up in standard operating mode. The loop was placed 7cm from the frontside of the UUT chassis and a scan was performed. Then, the loop was placed 7cm from thebackside of the UUT and the scan was repeated. Full scans were also performed on the top,bottom left and right sides of the UUT.
Seq. # Test Description Test Lead/ Polarity3 CE102 JT1, JT2 and JC1 Side4 CE102 JT3, JS1, JT4, J2 & JC2 Side5 CE102 JS1 & J2 parallel to cables JT7, JC4 & JT86 CE102 JT7, JC4 & JT87 CE102 JT5, JC3 & JT6 side8 CE102 Top Side

Page 40 of 224Report No.: MIL05-015
Radiated Emissions Path Check
Radiated Emissions Test Setup

Page 41 of 224Report No.: MIL05-015
Radiated Emissions Closeup

Page 42 of 224Report No.: MIL05-015
Test Location: CKC Laboratories, Inc. •1120 Fulton Place • Fremont, CA 94539 • (510) 249 - 1170
Customer: Stanford Linear Accelerator CenterSpecification: RE101 Test LimitWork Order #: 82840 Date: 2/23/2005Test Type: Radiated Scan Time: 9:58:38 AMEquipment: TEM/TPS Sequence#: 3Manufacturer: Stanford Linear Accelerator Center Tested By: A. BrarModel: TEM/TPSS/N: GLA1754Equipment Under Test (* = UUT):
Function Manufacturer Model # S/NTEM/TPS* Stanford Linear Accelerator Center TEM/TPS GLA1754
Support Devices:Function Manufacturer Model # S/NVME Processor DAWN VME Not Listed Property Tag: GLAT0404Mouse Dell P/N X09-13962 69557-492-6014557-20350Keyboard Dell RT7D20 TH-04N454-37171-399-5494Monitor Dell 1901FP CN-05Y232-71616-41R-B363PC Dell DHM HXNLB41Power Supply BK Precision 1697 S240500299
Test Conditions / Notes:UUT is grounded to the copper table. UUT is running the FuncTest.py. Power cable is running along the front sideof the table to the 10uF feed through caps and from there to the equipment outside of the chamber. I/O cable isrouted along the power cable, 2cms from the power cable. Exposed cable lengths on the test table at 56". JT1, JT2& JC1 Side.
Transducer Legend:T1=F-303 Loop SensorT3=Cable 2410
T2=20' Cable Male N to Male N AN None
Measurement Data: Reading listed by margin. Test Distance: 1 Meter# Freq Rdng T1 T2 T3 Dist Corr Spec Margin Polar
MHz dBµV dB dB dB dB Table dBpt dBpt dB Ant 1 40.560k 11.0 +0.0 35.8 53.8 -18.0 Magne +24.7 +0.0 +0.1
2 .053k 14.8 +0.0 90.0 111.5 -21.5 Magne +75.2 +0.0 +0.0
3 17.120k 7.5 +0.0 35.6 61.3 -25.7 Magne +28.0 +0.0 +0.1
4 20.840k 6.5 +0.0 33.8 59.6 -25.8 Magne +27.2 +0.0 +0.1
5 12.560k 8.8 +0.0 38.1 64.0 -25.9 Magne +29.1 +0.1 +0.1

Page 43 of 224Report No.: MIL05-015
6 15.080k 7.8 +0.0 36.3 62.4 -26.1 Magne +28.4 +0.0 +0.1
7 29.120k 4.4 +0.0 30.4 56.7 -26.3 Magne +25.9 +0.0 +0.1
8 10.600k 9.0 +0.0 39.0 65.5 -26.5 Magne +29.8 +0.1 +0.1
9 19.840k 6.0 +0.0 33.5 60.0 -26.5 Magne +27.4 +0.0 +0.1
10 20.920k 5.7 +0.0 33.0 59.6 -26.6 Magne +27.2 +0.0 +0.1
11 48.920k 1.5 +0.0 25.6 52.2 -26.6 Magne +24.0 +0.0 +0.1
12 47.160k 1.6 +0.0 25.8 52.5 -26.7 Magne +24.1 +0.0 +0.1
13 20.160k 5.7 +0.0 33.1 59.9 -26.8 Magne +27.3 +0.0 +0.1
14 25.760k 4.4 +0.0 30.9 57.8 -26.9 Magne +26.4 +0.0 +0.1
15 33.080k 3.0 +0.0 28.6 55.6 -27.0 Magne +25.5 +0.0 +0.1
16 48.200k 1.2 +0.0 25.3 52.3 -27.0 Magne +24.0 +0.0 +0.1
17 49.480k 1.1 +0.0 25.1 52.1 -27.0 Magne +23.9 +0.0 +0.1
18 11.520k 7.9 +0.0 37.6 64.8 -27.2 Magne +29.5 +0.1 +0.1
19 11.200k 7.9 +0.0 37.7 65.0 -27.3 Magne +29.6 +0.1 +0.1
20 16.000k 6.3 +0.0 34.6 61.9 -27.3 Magne +28.2 +0.0 +0.1
21 20.600k 5.0 +0.0 32.4 59.7 -27.3 Magne +27.3 +0.0 +0.1
22 25.640k 4.0 +0.0 30.5 57.8 -27.3 Magne +26.4 +0.0 +0.1
23 34.240k 2.5 +0.0 27.9 55.3 -27.4 Magne +25.3 +0.0 +0.1
24 45.040k 1.1 +0.0 25.5 52.9 -27.4 Magne +24.3 +0.0 +0.1
25 14.040k 6.6 +0.0 35.5 63.0 -27.5 Magne +28.7 +0.1 +0.1
26 25.280k 3.8 +0.0 30.4 57.9 -27.5 Magne +26.5 +0.0 +0.1
27 36.520k 2.0 +0.0 27.2 54.7 -27.5 Magne +25.1 +0.0 +0.1

Page 44 of 224Report No.: MIL05-015
28 37.320k 1.9 +0.0 27.0 54.5 -27.5 Magne +25.0 +0.0 +0.1
29 24.400k 3.9 +0.0 30.6 58.2 -27.6 Magne +26.6 +0.0 +0.1
30 35.920k 2.0 +0.0 27.3 54.9 -27.6 Magne +25.2 +0.0 +0.1

Page 45 of 224Report No.: MIL05-015
Test Location: CKC Laboratories, Inc. •1120 Fulton Place • Fremont, CA 94539 • (510) 249 - 1170
Customer: Stanford Linear Accelerator CenterSpecification: RE101 Test LimitWork Order #: 82840 Date: 2/23/2005Test Type: Radiated Scan Time: 10:33:12 AMEquipment: TEM/TPS Sequence#: 4Manufacturer: Stanford Linear Accelerator Center Tested By: A. BrarModel: TEM/TPSS/N: GLA1754Equipment Under Test (* = UUT):
Function Manufacturer Model # S/NTEM/TPS* Stanford Linear Accelerator Center TEM/TPS GLA1754
Support Devices:Function Manufacturer Model # S/NVME Processor DAWN VME Not Listed Property Tag: GLAT0404Mouse Dell P/N X09-13962 69557-492-6014557-20350Keyboard Dell RT7D20 TH-04N454-37171-399-5494Monitor Dell 1901FP CN-05Y232-71616-41R-B363PC Dell DHM HXNLB41Power Supply BK Precision 1697 S240500299
Test Conditions / Notes:UUT is grounded to the copper table. UUT is running the FuncTest.py. Power cable is running along the front sideof the table to the 10uF feed through caps and from there to the equipment outside of the chamber. I/O cable isrouted along the power cable, 2cms from the power cable. Exposed cable lengths on the test table at 56". JT3, JS1,JT4, J2 & JC2 Side.
Transducer Legend:T1=F-303 Loop SensorT3=Cable 2410
T2=20' Cable Male N to Male N AN None
Measurement Data: Reading listed by margin. Test Distance: 1 Meter# Freq Rdng T1 T2 T3 Dist Corr Spec Margin Polar
MHz dBµV dB dB dB dB Table dBpt dBpt dB Ant 1 .055k 18.7 +0.0 93.6 111.2 -17.6 Magne +74.9 +0.0 +0.0
2 40.880k 10.7 +0.0 35.5 53.8 -18.3 Magne +24.7 +0.0 +0.1
3 39.440k 4.3 +0.0 29.2 54.1 -24.9 Magne +24.8 +0.0 +0.1
4 30.320k 5.3 +0.0 31.2 56.3 -25.1 Magne +25.8 +0.0 +0.1
5 13.000k 8.7 +0.0 37.9 63.7 -25.8 Magne +29.0 +0.1 +0.1

Page 46 of 224Report No.: MIL05-015
6 32.600k 4.1 +0.0 29.7 55.7 -26.0 Magne +25.5 +0.0 +0.1
7 12.240k 8.5 +0.0 37.9 64.2 -26.3 Magne +29.2 +0.1 +0.1
8 43.240k 2.4 +0.0 27.0 53.3 -26.3 Magne +24.5 +0.0 +0.1
9 13.480k 7.9 +0.0 37.0 63.4 -26.4 Magne +28.9 +0.1 +0.1
10 10.360k 9.0 +0.0 39.1 65.7 -26.6 Magne +29.9 +0.1 +0.1
11 25.800k 4.7 +0.0 31.2 57.8 -26.6 Magne +26.4 +0.0 +0.1
12 24.360k 4.7 +0.0 31.4 58.2 -26.8 Magne +26.6 +0.0 +0.1
13 11.120k 8.3 +0.0 38.1 65.1 -27.0 Magne +29.6 +0.1 +0.1
14 24.560k 4.4 +0.0 31.1 58.2 -27.1 Magne +26.6 +0.0 +0.1
15 33.000k 2.9 +0.0 28.5 55.6 -27.1 Magne +25.5 +0.0 +0.1
16 44.640k 1.5 +0.0 25.9 53.0 -27.1 Magne +24.3 +0.0 +0.1
17 48.200k 1.1 +0.0 25.2 52.3 -27.1 Magne +24.0 +0.0 +0.1
18 46.560k 1.1 +0.0 25.4 52.6 -27.2 Magne +24.2 +0.0 +0.1
19 16.880k 6.0 +0.0 34.1 61.4 -27.3 Magne +28.0 +0.0 +0.1
20 23.600k 4.4 +0.0 31.2 58.5 -27.3 Magne +26.7 +0.0 +0.1
21 30.920k 3.1 +0.0 28.9 56.2 -27.3 Magne +25.7 +0.0 +0.1
22 31.080k 3.0 +0.0 28.8 56.1 -27.3 Magne +25.7 +0.0 +0.1
23 28.840k 3.2 +0.0 29.3 56.8 -27.5 Magne +26.0 +0.0 +0.1
24 49.640k 0.6 +0.0 24.6 52.1 -27.5 Magne +23.9 +0.0 +0.1
25 27.440k 3.3 +0.0 29.6 57.2 -27.6 Magne +26.2 +0.0 +0.1
26 27.840k 3.2 +0.0 29.4 57.1 -27.7 Magne +26.1 +0.0 +0.1
27 47.160k 0.6 +0.0 24.8 52.5 -27.7 Magne +24.1 +0.0 +0.1

Page 47 of 224Report No.: MIL05-015
28 47.680k 0.5 +0.0 24.7 52.4 -27.7 Magne +24.1 +0.0 +0.1
29 42.280k 1.1 +0.0 25.7 53.5 -27.8 Magne +24.5 +0.0 +0.1
30 23.840k 3.6 +0.0 30.4 58.4 -28.0 Magne +26.7 +0.0 +0.1
31 32.080k 2.2 +0.0 27.9 55.9 -28.0 Magne +25.6 +0.0 +0.1
32 24.120k 3.3 +0.0 30.1 58.3 -28.2 Magne +26.7 +0.0 +0.1
33 26.000k 3.0 +0.0 29.5 57.7 -28.2 Magne +26.4 +0.0 +0.1

Page 48 of 224Report No.: MIL05-015
Test Location: CKC Laboratories, Inc. •1120 Fulton Place • Fremont, CA 94539 • (510) 249 - 1170
Customer: Stanford Linear Accelerator CenterSpecification: RE101 Test LimitWork Order #: 82840 Date: 2/23/2005Test Type: Radiated Scan Time: 10:41:20 AMEquipment: TEM/TPS Sequence#: 5Manufacturer: Stanford Linear Accelerator Center Tested By: A. BrarModel: TEM/TPSS/N: GLA1754Equipment Under Test (* = UUT):
Function Manufacturer Model # S/NTEM/TPS* Stanford Linear Accelerator Center TEM/TPS GLA1754
Support Devices:Function Manufacturer Model # S/NVME Processor DAWN VME Not Listed Property Tag: GLAT0404Mouse Dell P/N X09-13962 69557-492-6014557-20350Keyboard Dell RT7D20 TH-04N454-37171-399-5494Monitor Dell 1901FP CN-05Y232-71616-41R-B363PC Dell DHM HXNLB41Power Supply BK Precision 1697 S240500299
Test Conditions / Notes:UUT is grounded to the copper table. UUT is running the FuncTest.py. Power cable is running along the front sideof the table to the 10uF feed through caps and from there to the equipment outside of the chamber. I/O cable isrouted along the power cable, 2cms from the power cable. Exposed cable lengths on the test table at 56". JS1 & J2,parallel to cables
Transducer Legend:T1=F-303 Loop SensorT3=Cable 2410
T2=20' Cable Male N to Male N AN None
Measurement Data: Reading listed by margin. Test Distance: 1 Meter# Freq Rdng T1 T2 T3 Dist Corr Spec Margin Polar
MHz dBµV dB dB dB dB Table dBpt dBpt dB Ant 1 .055k 19.1 +0.0 94.0 111.2 -17.2 Magne +74.9 +0.0 +0.0
2 40.680k 10.0 +0.0 34.8 53.8 -19.0 Magne +24.7 +0.0 +0.1
3 20.880k 6.6 +0.0 33.9 59.6 -25.7 Magne +27.2 +0.0 +0.1
4 27.400k 5.2 +0.0 31.5 57.2 -25.7 Magne +26.2 +0.0 +0.1
5 28.040k 4.7 +0.0 30.9 57.0 -26.1 Magne +26.1 +0.0 +0.1
Page 49 of 224Report No.: MIL05-015
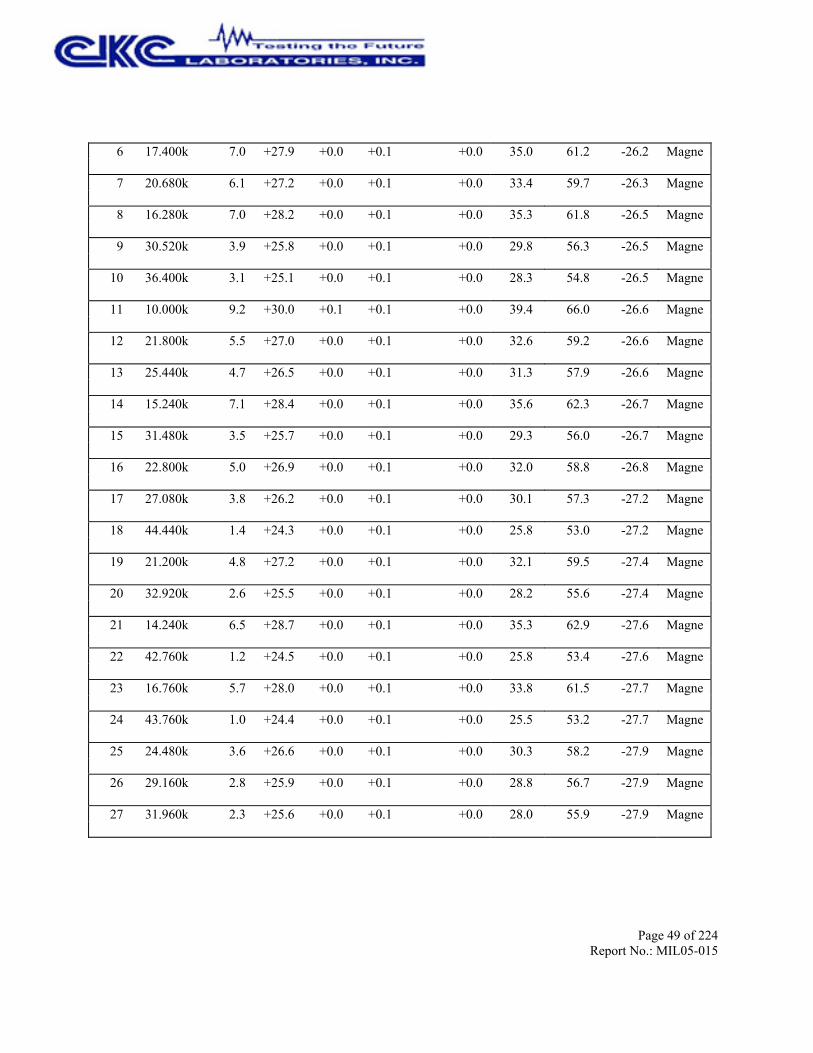
6 17.400k 7.0 +0.0 35.0 61.2 -26.2 Magne +27.9 +0.0 +0.1
7 20.680k 6.1 +0.0 33.4 59.7 -26.3 Magne +27.2 +0.0 +0.1
8 16.280k 7.0 +0.0 35.3 61.8 -26.5 Magne +28.2 +0.0 +0.1
9 30.520k 3.9 +0.0 29.8 56.3 -26.5 Magne +25.8 +0.0 +0.1
10 36.400k 3.1 +0.0 28.3 54.8 -26.5 Magne +25.1 +0.0 +0.1
11 10.000k 9.2 +0.0 39.4 66.0 -26.6 Magne +30.0 +0.1 +0.1
12 21.800k 5.5 +0.0 32.6 59.2 -26.6 Magne +27.0 +0.0 +0.1
13 25.440k 4.7 +0.0 31.3 57.9 -26.6 Magne +26.5 +0.0 +0.1
14 15.240k 7.1 +0.0 35.6 62.3 -26.7 Magne +28.4 +0.0 +0.1
15 31.480k 3.5 +0.0 29.3 56.0 -26.7 Magne +25.7 +0.0 +0.1
16 22.800k 5.0 +0.0 32.0 58.8 -26.8 Magne +26.9 +0.0 +0.1
17 27.080k 3.8 +0.0 30.1 57.3 -27.2 Magne +26.2 +0.0 +0.1
18 44.440k 1.4 +0.0 25.8 53.0 -27.2 Magne +24.3 +0.0 +0.1
19 21.200k 4.8 +0.0 32.1 59.5 -27.4 Magne +27.2 +0.0 +0.1
20 32.920k 2.6 +0.0 28.2 55.6 -27.4 Magne +25.5 +0.0 +0.1
21 14.240k 6.5 +0.0 35.3 62.9 -27.6 Magne +28.7 +0.0 +0.1
22 42.760k 1.2 +0.0 25.8 53.4 -27.6 Magne +24.5 +0.0 +0.1
23 16.760k 5.7 +0.0 33.8 61.5 -27.7 Magne +28.0 +0.0 +0.1
24 43.760k 1.0 +0.0 25.5 53.2 -27.7 Magne +24.4 +0.0 +0.1
25 24.480k 3.6 +0.0 30.3 58.2 -27.9 Magne +26.6 +0.0 +0.1
26 29.160k 2.8 +0.0 28.8 56.7 -27.9 Magne +25.9 +0.0 +0.1
27 31.960k 2.3 +0.0 28.0 55.9 -27.9 Magne +25.6 +0.0 +0.1

Page 50 of 224Report No.: MIL05-015
28 43.160k 0.8 +0.0 25.4 53.3 -27.9 Magne +24.5 +0.0 +0.1
29 44.160k 0.5 +0.0 25.0 53.1 -28.1 Magne +24.4 +0.0 +0.1

Page 51 of 224Report No.: MIL05-015
Test Location: CKC Laboratories, Inc. •1120 Fulton Place • Fremont, CA 94539 • (510) 249 - 1170
Customer: Stanford Linear Accelerator CenterSpecification: RE101 Test LimitWork Order #: 82840 Date: 2/23/2005Test Type: Radiated Scan Time: 10:51:00 AMEquipment: TEM/TPS Sequence#: 6Manufacturer: Stanford Linear Accelerator Center Tested By: A. BrarModel: TEM/TPSS/N: GLA1754Equipment Under Test (* = UUT):
Function Manufacturer Model # S/NTEM/TPS* Stanford Linear Accelerator Center TEM/TPS GLA1754
Support Devices:Function Manufacturer Model # S/NVME Processor DAWN VME Not Listed Property Tag: GLAT0404Mouse Dell P/N X09-13962 69557-492-6014557-20350Keyboard Dell RT7D20 TH-04N454-37171-399-5494Monitor Dell 1901FP CN-05Y232-71616-41R-B363PC Dell DHM HXNLB41Power Supply BK Precision 1697 S240500299
Test Conditions / Notes:UUT is grounded to the copper table. UUT is running the FuncTest.py. Power cable is running along the front sideof the table to the 10uF feed through caps and from there to the equipment outside of the chamber. I/O cable isrouted along the power cable, 2cms from the power cable. Exposed cable lengths on the test table at 56". JT7, JC4& JT8 side
Transducer Legend:T1=F-303 Loop SensorT3=Cable 2410
T2=20' Cable Male N to Male N AN None
Measurement Data: Reading listed by margin. Test Distance: 1 Meter# Freq Rdng T1 T2 T3 Dist Corr Spec Margin Polar
MHz dBµV dB dB dB dB Table dBpt dBpt dB Ant 1 .055k 17.9 +0.0 92.8 111.2 -18.4 Magne +74.9 +0.0 +0.0
2 40.600k 9.8 +0.0 34.6 53.8 -19.2 Magne +24.7 +0.0 +0.1
3 22.360k 6.7 +0.0 33.8 59.0 -25.2 Magne +27.0 +0.0 +0.1
4 14.440k 8.5 +0.0 37.2 62.8 -25.6 Magne +28.6 +0.0 +0.1
5 22.760k 6.0 +0.0 33.0 58.8 -25.8 Magne +26.9 +0.0 +0.1
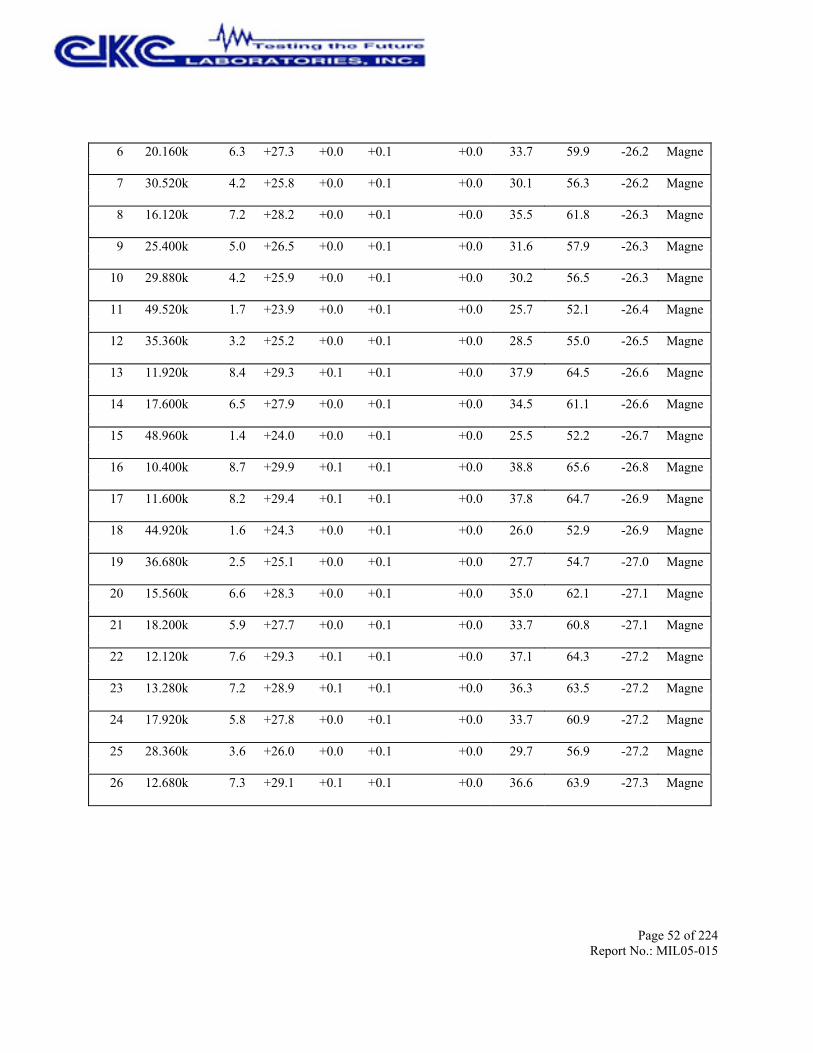
Page 52 of 224Report No.: MIL05-015
6 20.160k 6.3 +0.0 33.7 59.9 -26.2 Magne +27.3 +0.0 +0.1
7 30.520k 4.2 +0.0 30.1 56.3 -26.2 Magne +25.8 +0.0 +0.1
8 16.120k 7.2 +0.0 35.5 61.8 -26.3 Magne +28.2 +0.0 +0.1
9 25.400k 5.0 +0.0 31.6 57.9 -26.3 Magne +26.5 +0.0 +0.1
10 29.880k 4.2 +0.0 30.2 56.5 -26.3 Magne +25.9 +0.0 +0.1
11 49.520k 1.7 +0.0 25.7 52.1 -26.4 Magne +23.9 +0.0 +0.1
12 35.360k 3.2 +0.0 28.5 55.0 -26.5 Magne +25.2 +0.0 +0.1
13 11.920k 8.4 +0.0 37.9 64.5 -26.6 Magne +29.3 +0.1 +0.1
14 17.600k 6.5 +0.0 34.5 61.1 -26.6 Magne +27.9 +0.0 +0.1
15 48.960k 1.4 +0.0 25.5 52.2 -26.7 Magne +24.0 +0.0 +0.1
16 10.400k 8.7 +0.0 38.8 65.6 -26.8 Magne +29.9 +0.1 +0.1
17 11.600k 8.2 +0.0 37.8 64.7 -26.9 Magne +29.4 +0.1 +0.1
18 44.920k 1.6 +0.0 26.0 52.9 -26.9 Magne +24.3 +0.0 +0.1
19 36.680k 2.5 +0.0 27.7 54.7 -27.0 Magne +25.1 +0.0 +0.1
20 15.560k 6.6 +0.0 35.0 62.1 -27.1 Magne +28.3 +0.0 +0.1
21 18.200k 5.9 +0.0 33.7 60.8 -27.1 Magne +27.7 +0.0 +0.1
22 12.120k 7.6 +0.0 37.1 64.3 -27.2 Magne +29.3 +0.1 +0.1
23 13.280k 7.2 +0.0 36.3 63.5 -27.2 Magne +28.9 +0.1 +0.1
24 17.920k 5.8 +0.0 33.7 60.9 -27.2 Magne +27.8 +0.0 +0.1
25 28.360k 3.6 +0.0 29.7 56.9 -27.2 Magne +26.0 +0.0 +0.1
26 12.680k 7.3 +0.0 36.6 63.9 -27.3 Magne +29.1 +0.1 +0.1

Page 53 of 224Report No.: MIL05-015
27 19.800k 5.3 +0.0 32.8 60.1 -27.3 Magne +27.4 +0.0 +0.1
28 45.560k 1.1 +0.0 25.5 52.8 -27.3 Magne +24.3 +0.0 +0.1

Page 54 of 224Report No.: MIL05-015
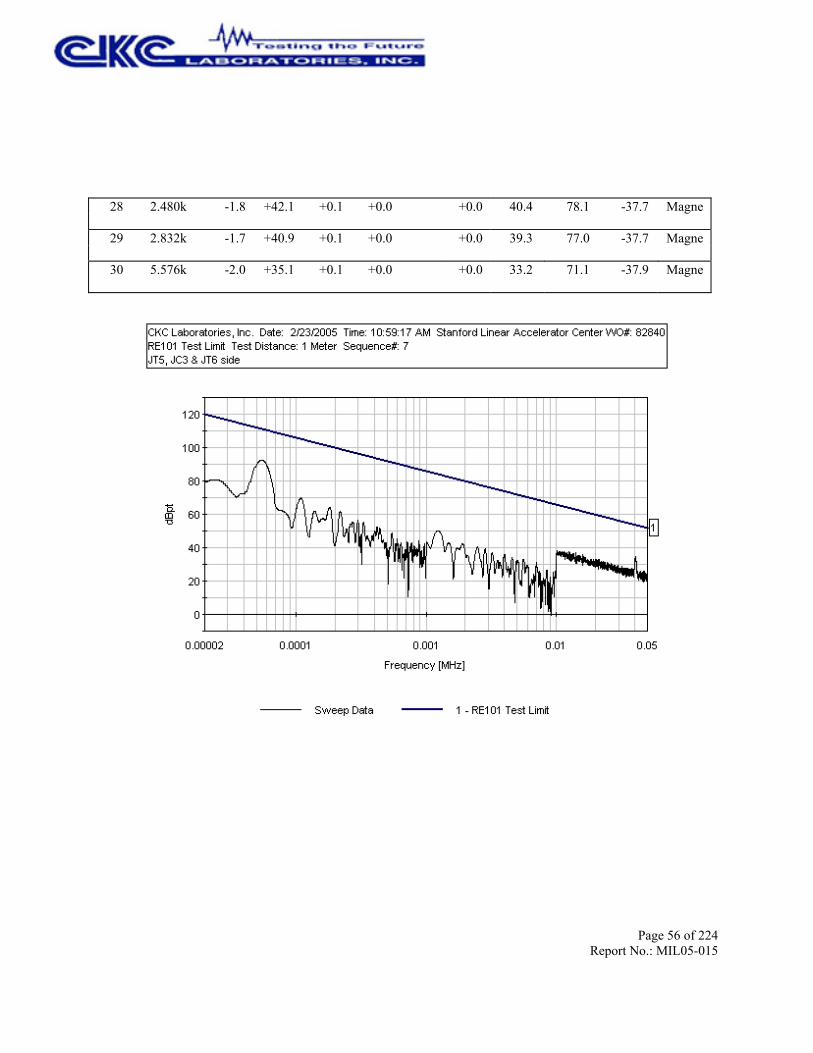
Test Location: CKC Laboratories, Inc. •1120 Fulton Place • Fremont, CA 94539 • (510) 249 - 1170
Customer: Stanford Linear Accelerator CenterSpecification: RE101 Test LimitWork Order #: 82840 Date: 2/23/2005Test Type: Radiated Scan Time: 10:59:17 AMEquipment: TEM/TPS Sequence#: 7Manufacturer: Stanford Linear Accelerator Center Tested By: A. BrarModel: TEM/TPSS/N: GLA1754Equipment Under Test (* = UUT):
Function Manufacturer Model # S/NTEM/TPS* Stanford Linear Accelerator Center TEM/TPS GLA1754
Support Devices:Function Manufacturer Model # S/NVME Processor DAWN VME Not Listed Property Tag: GLAT0404Mouse Dell P/N X09-13962 69557-492-6014557-20350Keyboard Dell RT7D20 TH-04N454-37171-399-5494Monitor Dell 1901FP CN-05Y232-71616-41R-B363PC Dell DHM HXNLB41Power Supply BK Precision 1697 S240500299
Test Conditions / Notes:UUT is grounded to the copper table. UUT is running the FuncTest.py. Power cable is running along the front sideof the table to the 10uF feed through caps and from there to the equipment outside of the chamber. I/O cable isrouted along the power cable, 2cms from the power cable. Exposed cable lengths on the test table at 56". JT5, JC3& JT6 side
Transducer Legend:T1=F-303 Loop SensorT3=Cable 2410
T2=20' Cable Male N to Male N AN None
Measurement Data: Reading listed by margin. Test Distance: 1 Meter# Freq Rdng T1 T2 T3 Dist Corr Spec Margin Polar
MHz dBµV dB dB dB dB Table dBpt dBpt dB Ant 1 .054k 17.5 +0.0 92.5 111.3 -18.8 Magne +75.0 +0.0 +0.0
2 40.640k 9.8 +0.0 34.6 53.8 -19.2 Magne +24.7 +0.0 +0.1
3 14.040k 8.0 +0.0 36.9 63.0 -26.1 Magne +28.7 +0.1 +0.1
4 15.840k 7.5 +0.0 35.9 62.0 -26.1 Magne +28.3 +0.0 +0.1
5 14.200k 7.9 +0.0 36.7 62.9 -26.2 Magne +28.7 +0.0 +0.1
Page 55 of 224Report No.: MIL05-015
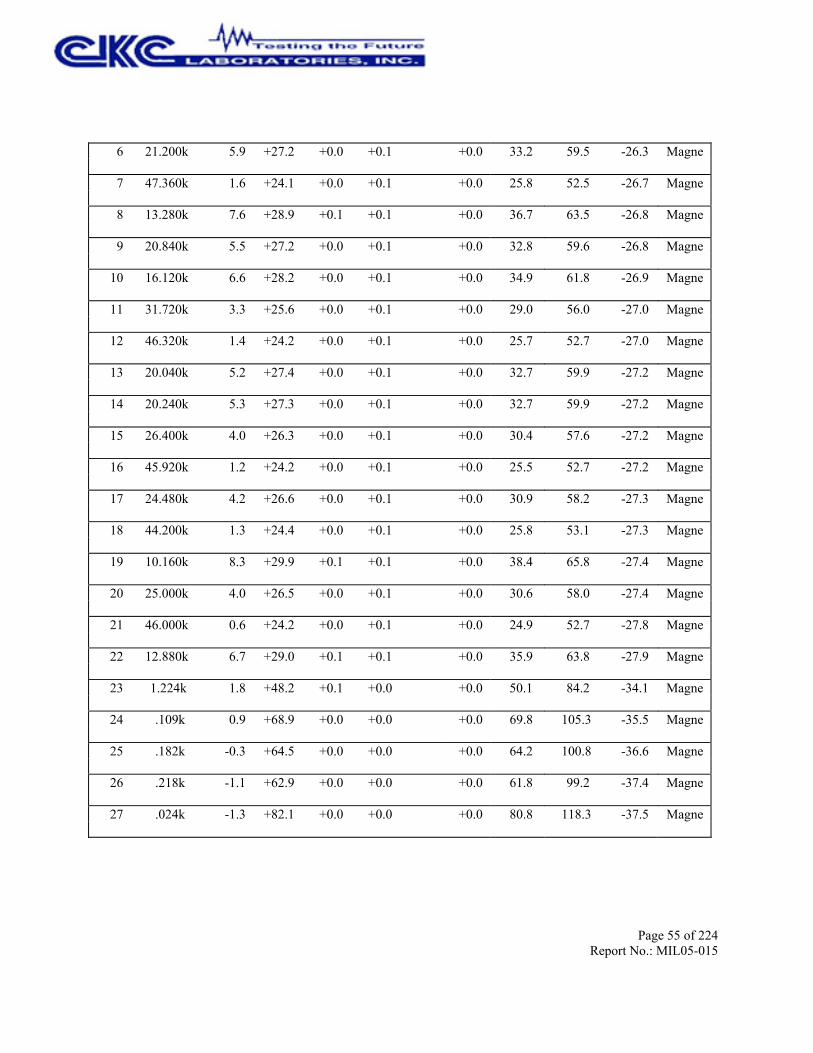
6 21.200k 5.9 +0.0 33.2 59.5 -26.3 Magne +27.2 +0.0 +0.1
7 47.360k 1.6 +0.0 25.8 52.5 -26.7 Magne +24.1 +0.0 +0.1
8 13.280k 7.6 +0.0 36.7 63.5 -26.8 Magne +28.9 +0.1 +0.1
9 20.840k 5.5 +0.0 32.8 59.6 -26.8 Magne +27.2 +0.0 +0.1
10 16.120k 6.6 +0.0 34.9 61.8 -26.9 Magne +28.2 +0.0 +0.1
11 31.720k 3.3 +0.0 29.0 56.0 -27.0 Magne +25.6 +0.0 +0.1
12 46.320k 1.4 +0.0 25.7 52.7 -27.0 Magne +24.2 +0.0 +0.1
13 20.040k 5.2 +0.0 32.7 59.9 -27.2 Magne +27.4 +0.0 +0.1
14 20.240k 5.3 +0.0 32.7 59.9 -27.2 Magne +27.3 +0.0 +0.1
15 26.400k 4.0 +0.0 30.4 57.6 -27.2 Magne +26.3 +0.0 +0.1
16 45.920k 1.2 +0.0 25.5 52.7 -27.2 Magne +24.2 +0.0 +0.1
17 24.480k 4.2 +0.0 30.9 58.2 -27.3 Magne +26.6 +0.0 +0.1
18 44.200k 1.3 +0.0 25.8 53.1 -27.3 Magne +24.4 +0.0 +0.1
19 10.160k 8.3 +0.0 38.4 65.8 -27.4 Magne +29.9 +0.1 +0.1
20 25.000k 4.0 +0.0 30.6 58.0 -27.4 Magne +26.5 +0.0 +0.1
21 46.000k 0.6 +0.0 24.9 52.7 -27.8 Magne +24.2 +0.0 +0.1
22 12.880k 6.7 +0.0 35.9 63.8 -27.9 Magne +29.0 +0.1 +0.1
23 1.224k 1.8 +0.0 50.1 84.2 -34.1 Magne +48.2 +0.1 +0.0
24 .109k 0.9 +0.0 69.8 105.3 -35.5 Magne +68.9 +0.0 +0.0
25 .182k -0.3 +0.0 64.2 100.8 -36.6 Magne +64.5 +0.0 +0.0
26 .218k -1.1 +0.0 61.8 99.2 -37.4 Magne +62.9 +0.0 +0.0
27 .024k -1.3 +0.0 80.8 118.3 -37.5 Magne +82.1 +0.0 +0.0
Page 56 of 224Report No.: MIL05-015
28 2.480k -1.8 +0.0 40.4 78.1 -37.7 Magne +42.1 +0.1 +0.0
29 2.832k -1.7 +0.0 39.3 77.0 -37.7 Magne +40.9 +0.1 +0.0
30 5.576k -2.0 +0.0 33.2 71.1 -37.9 Magne +35.1 +0.1 +0.0
Page 57 of 224Report No.: MIL05-015
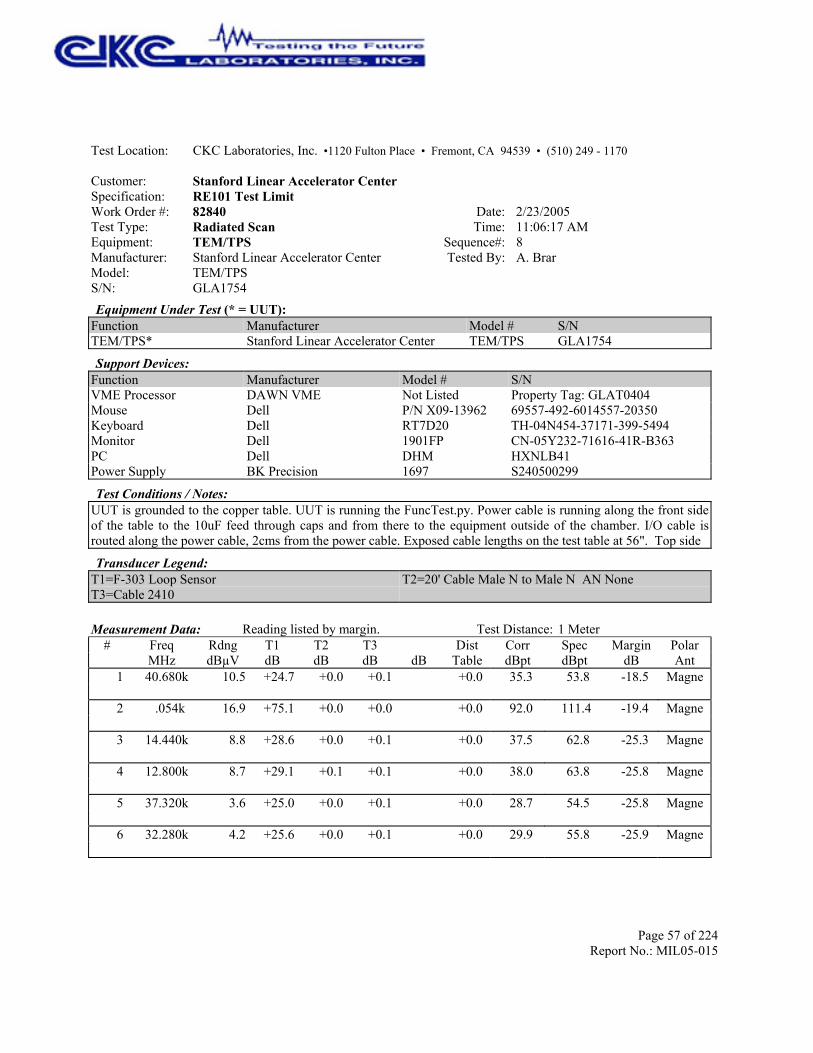
Test Location: CKC Laboratories, Inc. •1120 Fulton Place • Fremont, CA 94539 • (510) 249 - 1170
Customer: Stanford Linear Accelerator CenterSpecification: RE101 Test LimitWork Order #: 82840 Date: 2/23/2005Test Type: Radiated Scan Time: 11:06:17 AMEquipment: TEM/TPS Sequence#: 8Manufacturer: Stanford Linear Accelerator Center Tested By: A. BrarModel: TEM/TPSS/N: GLA1754Equipment Under Test (* = UUT):
Function Manufacturer Model # S/NTEM/TPS* Stanford Linear Accelerator Center TEM/TPS GLA1754
Support Devices:Function Manufacturer Model # S/NVME Processor DAWN VME Not Listed Property Tag: GLAT0404Mouse Dell P/N X09-13962 69557-492-6014557-20350Keyboard Dell RT7D20 TH-04N454-37171-399-5494Monitor Dell 1901FP CN-05Y232-71616-41R-B363PC Dell DHM HXNLB41Power Supply BK Precision 1697 S240500299
Test Conditions / Notes:UUT is grounded to the copper table. UUT is running the FuncTest.py. Power cable is running along the front sideof the table to the 10uF feed through caps and from there to the equipment outside of the chamber. I/O cable isrouted along the power cable, 2cms from the power cable. Exposed cable lengths on the test table at 56". Top side
Transducer Legend:T1=F-303 Loop SensorT3=Cable 2410
T2=20' Cable Male N to Male N AN None
Measurement Data: Reading listed by margin. Test Distance: 1 Meter# Freq Rdng T1 T2 T3 Dist Corr Spec Margin Polar
MHz dBµV dB dB dB dB Table dBpt dBpt dB Ant 1 40.680k 10.5 +0.0 35.3 53.8 -18.5 Magne +24.7 +0.0 +0.1
2 .054k 16.9 +0.0 92.0 111.4 -19.4 Magne +75.1 +0.0 +0.0
3 14.440k 8.8 +0.0 37.5 62.8 -25.3 Magne +28.6 +0.0 +0.1
4 12.800k 8.7 +0.0 38.0 63.8 -25.8 Magne +29.1 +0.1 +0.1
5 37.320k 3.6 +0.0 28.7 54.5 -25.8 Magne +25.0 +0.0 +0.1
6 32.280k 4.2 +0.0 29.9 55.8 -25.9 Magne +25.6 +0.0 +0.1

Page 58 of 224Report No.: MIL05-015
7 12.040k 8.3 +0.0 37.8 64.4 -26.6 Magne +29.3 +0.1 +0.1
8 13.360k 7.8 +0.0 36.9 63.5 -26.6 Magne +28.9 +0.1 +0.1
9 18.560k 6.1 +0.0 33.9 60.6 -26.7 Magne +27.7 +0.0 +0.1
10 11.520k 8.3 +0.0 38.0 64.8 -26.8 Magne +29.5 +0.1 +0.1
11 37.760k 2.4 +0.0 27.5 54.4 -26.9 Magne +25.0 +0.0 +0.1
12 38.320k 2.4 +0.0 27.4 54.3 -26.9 Magne +24.9 +0.0 +0.1
13 43.920k 1.7 +0.0 26.2 53.1 -26.9 Magne +24.4 +0.0 +0.1
14 43.280k 1.7 +0.0 26.2 53.3 -27.1 Magne +24.4 +0.0 +0.1
15 17.720k 5.9 +0.0 33.8 61.0 -27.2 Magne +27.8 +0.0 +0.1
16 43.600k 1.5 +0.0 26.0 53.2 -27.2 Magne +24.4 +0.0 +0.1
17 47.520k 1.0 +0.0 25.2 52.4 -27.2 Magne +24.1 +0.0 +0.1
18 11.800k 7.6 +0.0 37.2 64.5 -27.3 Magne +29.4 +0.1 +0.1
19 43.440k 1.4 +0.0 25.9 53.2 -27.3 Magne +24.4 +0.0 +0.1
20 27.480k 3.5 +0.0 29.8 57.2 -27.4 Magne +26.2 +0.0 +0.1
21 32.720k 2.7 +0.0 28.3 55.7 -27.4 Magne +25.5 +0.0 +0.1
22 10.240k 8.2 +0.0 38.3 65.8 -27.5 Magne +29.9 +0.1 +0.1
23 19.280k 5.2 +0.0 32.8 60.3 -27.5 Magne +27.5 +0.0 +0.1
24 27.040k 3.4 +0.0 29.7 57.3 -27.6 Magne +26.2 +0.0 +0.1
25 41.840k 1.2 +0.0 25.9 53.5 -27.6 Magne +24.6 +0.0 +0.1
26 19.120k 5.1 +0.0 32.7 60.4 -27.7 Magne +27.5 +0.0 +0.1
27 42.600k 1.1 +0.0 25.7 53.4 -27.7 Magne +24.5 +0.0 +0.1

Page 59 of 224Report No.: MIL05-015
28 16.560k 5.5 +0.0 33.7 61.6 -27.9 Magne +28.1 +0.0 +0.1
29 43.800k 0.8 +0.0 25.3 53.2 -27.9 Magne +24.4 +0.0 +0.1
30 41.960k 0.8 +0.0 25.5 53.5 -28.0 Magne +24.6 +0.0 +0.1
Page 60 of 224Report No.: MIL05-015
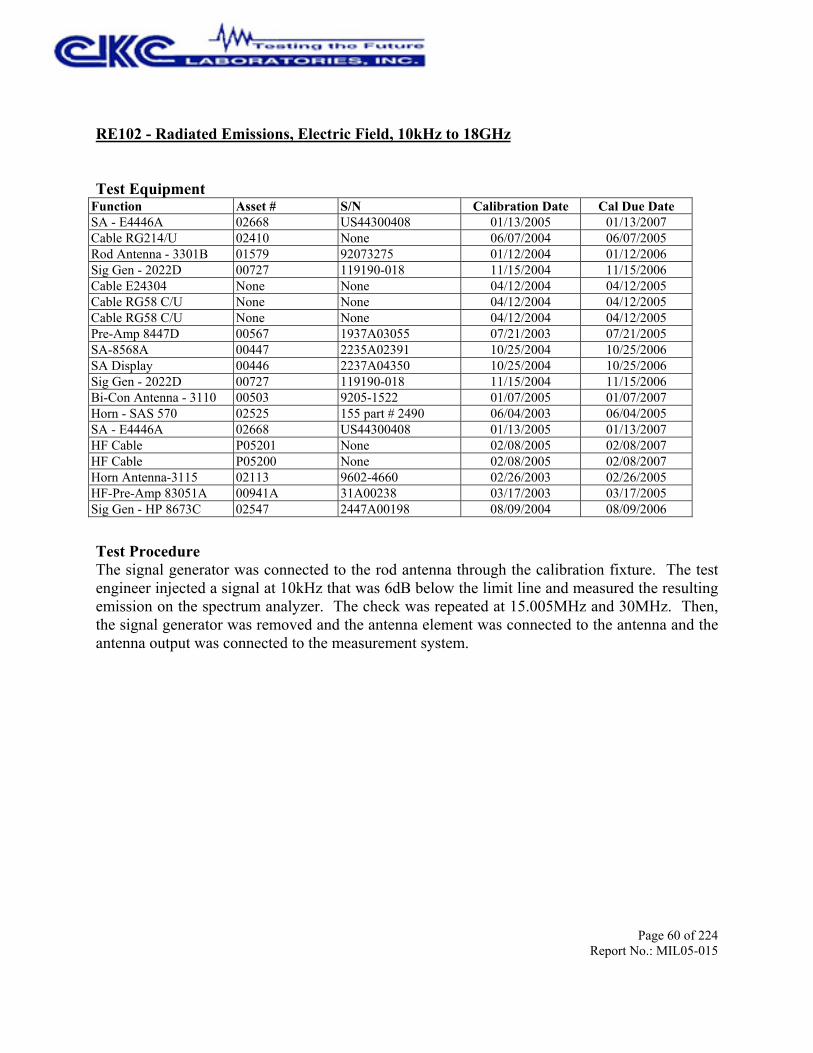
RE102 - Radiated Emissions, Electric Field, 10kHz to 18GHz
Test EquipmentFunction Asset # S/N Calibration Date Cal Due DateSA - E4446A 02668 US44300408 01/13/2005 01/13/2007Cable RG214/U 02410 None 06/07/2004 06/07/2005Rod Antenna - 3301B 01579 92073275 01/12/2004 01/12/2006Sig Gen - 2022D 00727 119190-018 11/15/2004 11/15/2006Cable E24304 None None 04/12/2004 04/12/2005Cable RG58 C/U None None 04/12/2004 04/12/2005Cable RG58 C/U None None 04/12/2004 04/12/2005Pre-Amp 8447D 00567 1937A03055 07/21/2003 07/21/2005SA-8568A 00447 2235A02391 10/25/2004 10/25/2006SA Display 00446 2237A04350 10/25/2004 10/25/2006Sig Gen - 2022D 00727 119190-018 11/15/2004 11/15/2006Bi-Con Antenna - 3110 00503 9205-1522 01/07/2005 01/07/2007Horn - SAS 570 02525 155 part # 2490 06/04/2003 06/04/2005SA - E4446A 02668 US44300408 01/13/2005 01/13/2007HF Cable P05201 None 02/08/2005 02/08/2007HF Cable P05200 None 02/08/2005 02/08/2007Horn Antenna-3115 02113 9602-4660 02/26/2003 02/26/2005HF-Pre-Amp 83051A 00941A 31A00238 03/17/2003 03/17/2005Sig Gen - HP 8673C 02547 2447A00198 08/09/2004 08/09/2006
Test ProcedureThe signal generator was connected to the rod antenna through the calibration fixture. The testengineer injected a signal at 10kHz that was 6dB below the limit line and measured the resultingemission on the spectrum analyzer. The check was repeated at 15.005MHz and 30MHz. Then,the signal generator was removed and the antenna element was connected to the antenna and theantenna output was connected to the measurement system.
Page 61 of 224Report No.: MIL05-015
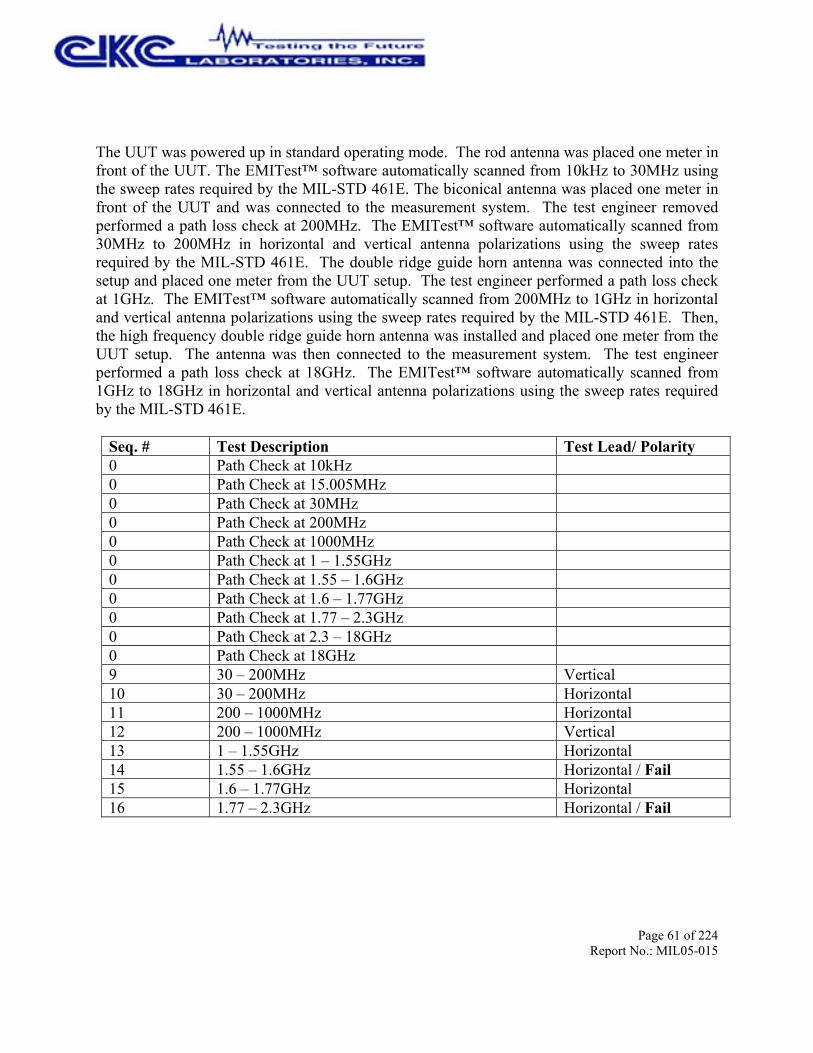
The UUT was powered up in standard operating mode. The rod antenna was placed one meter infront of the UUT. The EMITest™ software automatically scanned from 10kHz to 30MHz usingthe sweep rates required by the MIL-STD 461E. The biconical antenna was placed one meter infront of the UUT and was connected to the measurement system. The test engineer removedperformed a path loss check at 200MHz. The EMITest™ software automatically scanned from30MHz to 200MHz in horizontal and vertical antenna polarizations using the sweep ratesrequired by the MIL-STD 461E. The double ridge guide horn antenna was connected into thesetup and placed one meter from the UUT setup. The test engineer performed a path loss checkat 1GHz. The EMITest™ software automatically scanned from 200MHz to 1GHz in horizontaland vertical antenna polarizations using the sweep rates required by the MIL-STD 461E. Then,the high frequency double ridge guide horn antenna was installed and placed one meter from theUUT setup. The antenna was then connected to the measurement system. The test engineerperformed a path loss check at 18GHz. The EMITest™ software automatically scanned from1GHz to 18GHz in horizontal and vertical antenna polarizations using the sweep rates requiredby the MIL-STD 461E.
Seq. # Test Description Test Lead/ Polarity0 Path Check at 10kHz0 Path Check at 15.005MHz0 Path Check at 30MHz0 Path Check at 200MHz0 Path Check at 1000MHz0 Path Check at 1 – 1.55GHz0 Path Check at 1.55 – 1.6GHz0 Path Check at 1.6 – 1.77GHz0 Path Check at 1.77 – 2.3GHz0 Path Check at 2.3 – 18GHz0 Path Check at 18GHz9 30 – 200MHz Vertical10 30 – 200MHz Horizontal11 200 – 1000MHz Horizontal12 200 – 1000MHz Vertical13 1 – 1.55GHz Horizontal14 1.55 – 1.6GHz Horizontal / Fail15 1.6 – 1.77GHz Horizontal16 1.77 – 2.3GHz Horizontal / Fail
Page 62 of 224Report No.: MIL05-015
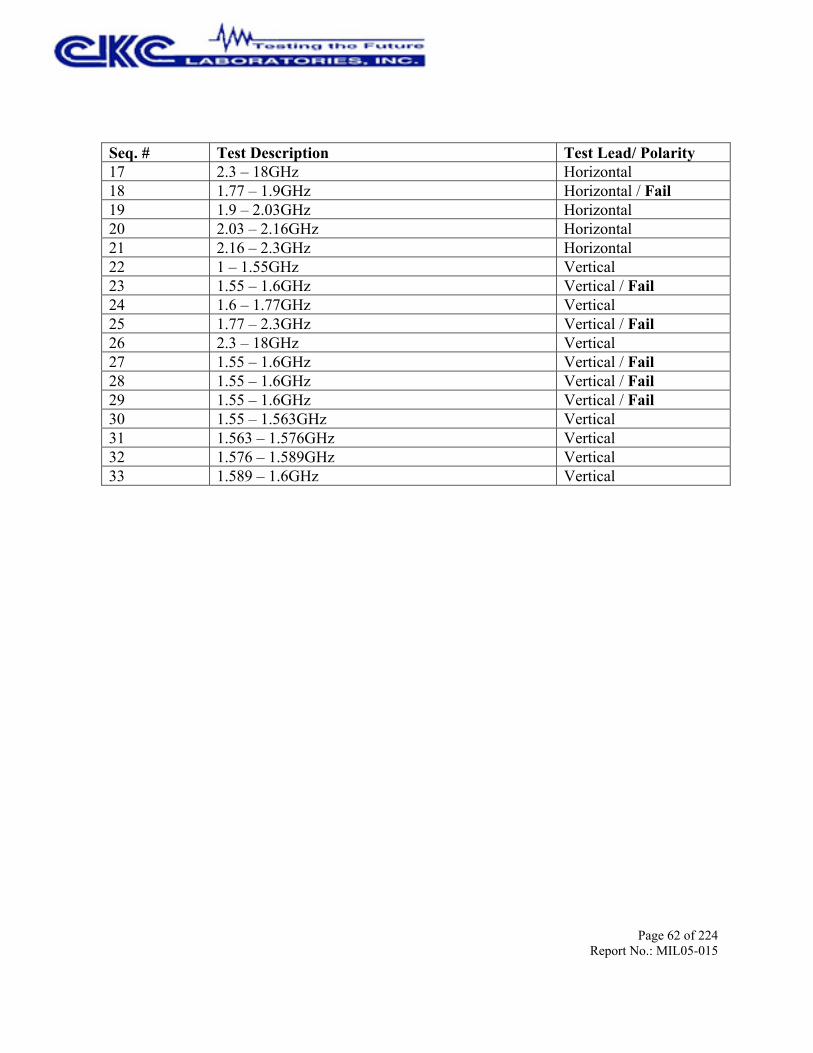
Seq. # Test Description Test Lead/ Polarity17 2.3 – 18GHz Horizontal18 1.77 – 1.9GHz Horizontal / Fail19 1.9 – 2.03GHz Horizontal20 2.03 – 2.16GHz Horizontal21 2.16 – 2.3GHz Horizontal22 1 – 1.55GHz Vertical23 1.55 – 1.6GHz Vertical / Fail24 1.6 – 1.77GHz Vertical25 1.77 – 2.3GHz Vertical / Fail26 2.3 – 18GHz Vertical27 1.55 – 1.6GHz Vertical / Fail28 1.55 – 1.6GHz Vertical / Fail29 1.55 – 1.6GHz Vertical / Fail30 1.55 – 1.563GHz Vertical31 1.563 – 1.576GHz Vertical32 1.576 – 1.589GHz Vertical33 1.589 – 1.6GHz Vertical

Page 63 of 224Report No.: MIL05-015
RE102 Path Check
Rod Antenna, 10kHz - 30MHz Pre-Cal

Page 64 of 224Report No.: MIL05-015
Rod Antenna, 10kHz - 30MHz Test Setup
Bicon Antenna, 30 - 200 MHz Vertical Polarization Test Setup

Page 65 of 224Report No.: MIL05-015
Horn Antenna, 200 - 1000MHz Horizontal Polarization Test Setup
Horn Antenna, 200-1000MHz Horizontal Polarization Closeup

Page 66 of 224Report No.: MIL05-015
18GHz Path Check
Horn Antenna, 1 - 18GHz Horizontal Polarization Test Setup
Page 67 of 224Report No.: MIL05-015
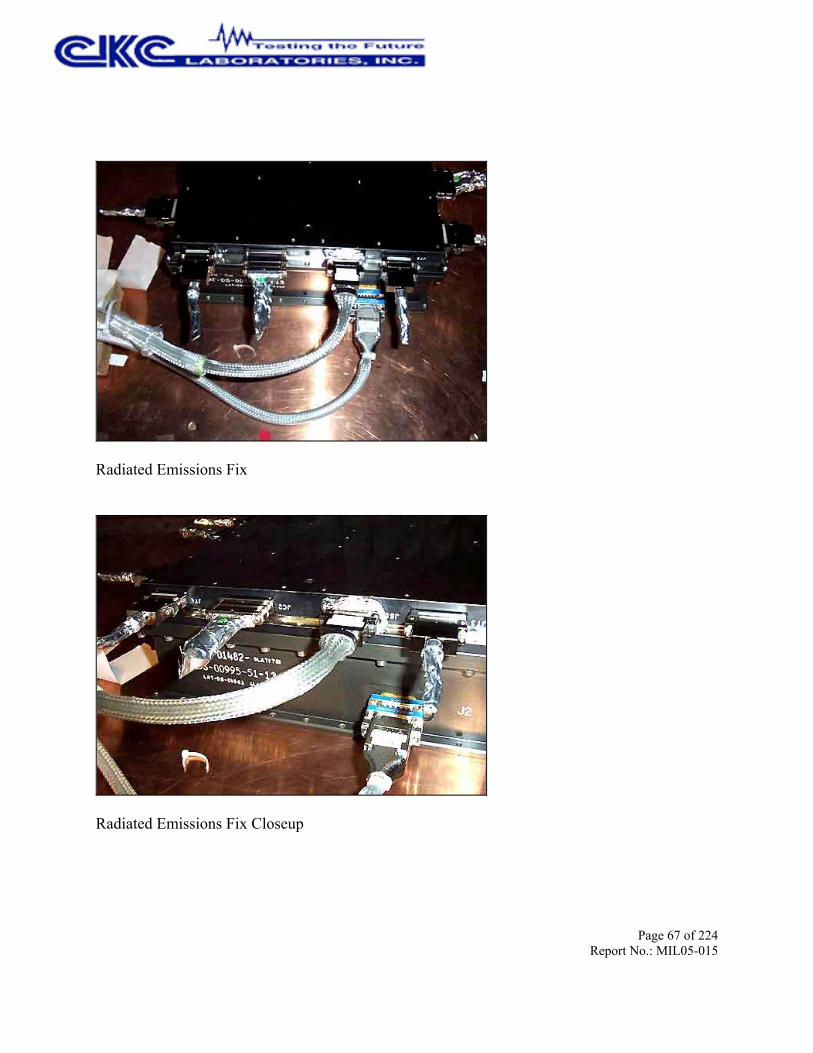
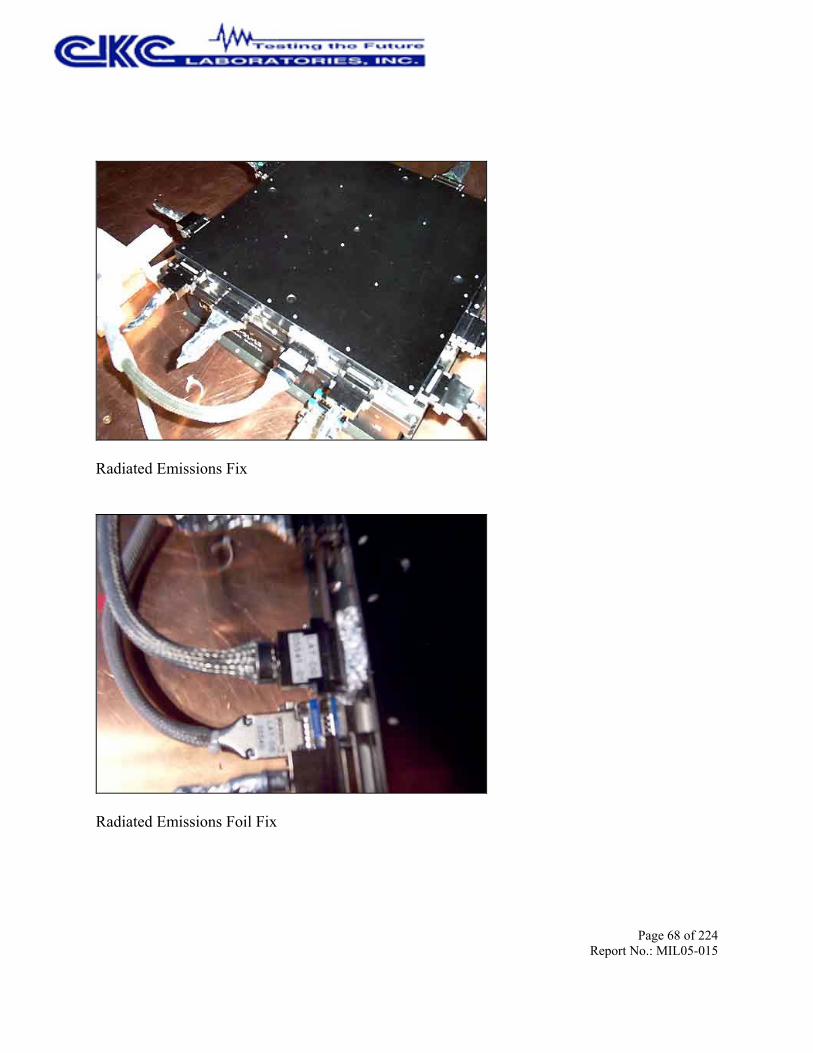
Radiated Emissions Fix
Radiated Emissions Fix Closeup
Page 68 of 224Report No.: MIL05-015
Radiated Emissions Fix
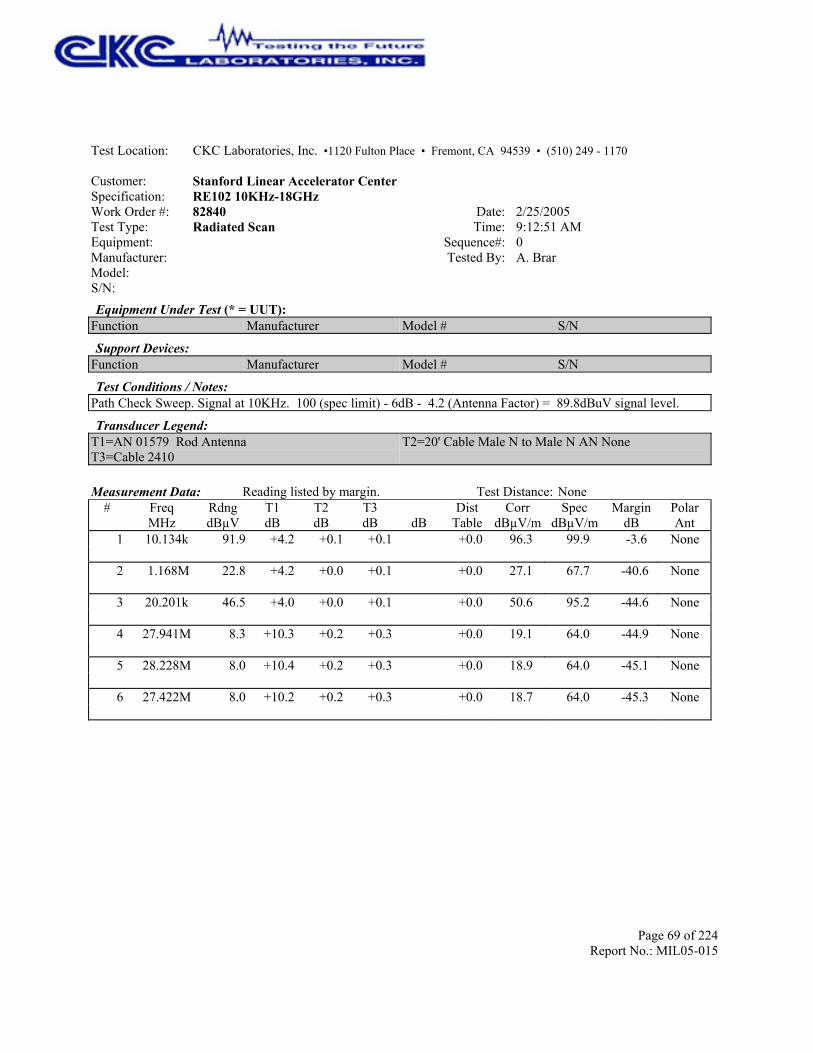
Radiated Emissions Foil Fix
Page 69 of 224Report No.: MIL05-015
Test Location: CKC Laboratories, Inc. •1120 Fulton Place • Fremont, CA 94539 • (510) 249 - 1170
Customer: Stanford Linear Accelerator CenterSpecification: RE102 10KHz-18GHzWork Order #: 82840 Date: 2/25/2005Test Type: Radiated Scan Time: 9:12:51 AMEquipment: Sequence#: 0Manufacturer: Tested By: A. BrarModel:S/N:Equipment Under Test (* = UUT):
Function Manufacturer Model # S/N
Support Devices:Function Manufacturer Model # S/N
Test Conditions / Notes:Path Check Sweep. Signal at 10KHz. 100 (spec limit) - 6dB - 4.2 (Antenna Factor) = 89.8dBuV signal level.
Transducer Legend:T1=AN 01579 Rod AntennaT3=Cable 2410
T2=20' Cable Male N to Male N AN None
Measurement Data: Reading listed by margin. Test Distance: None# Freq Rdng T1 T2 T3 Dist Corr Spec Margin Polar
MHz dBµV dB dB dB dB Table dBµV/m dBµV/m dB Ant 1 10.134k 91.9 +0.0 96.3 99.9 -3.6 None +4.2 +0.1 +0.1
2 1.168M 22.8 +0.0 27.1 67.7 -40.6 None +4.2 +0.0 +0.1
3 20.201k 46.5 +0.0 50.6 95.2 -44.6 None +4.0 +0.0 +0.1
4 27.941M 8.3 +0.0 19.1 64.0 -44.9 None +10.3 +0.2 +0.3
5 28.228M 8.0 +0.0 18.9 64.0 -45.1 None +10.4 +0.2 +0.3
6 27.422M 8.0 +0.0 18.7 64.0 -45.3 None +10.2 +0.2 +0.3
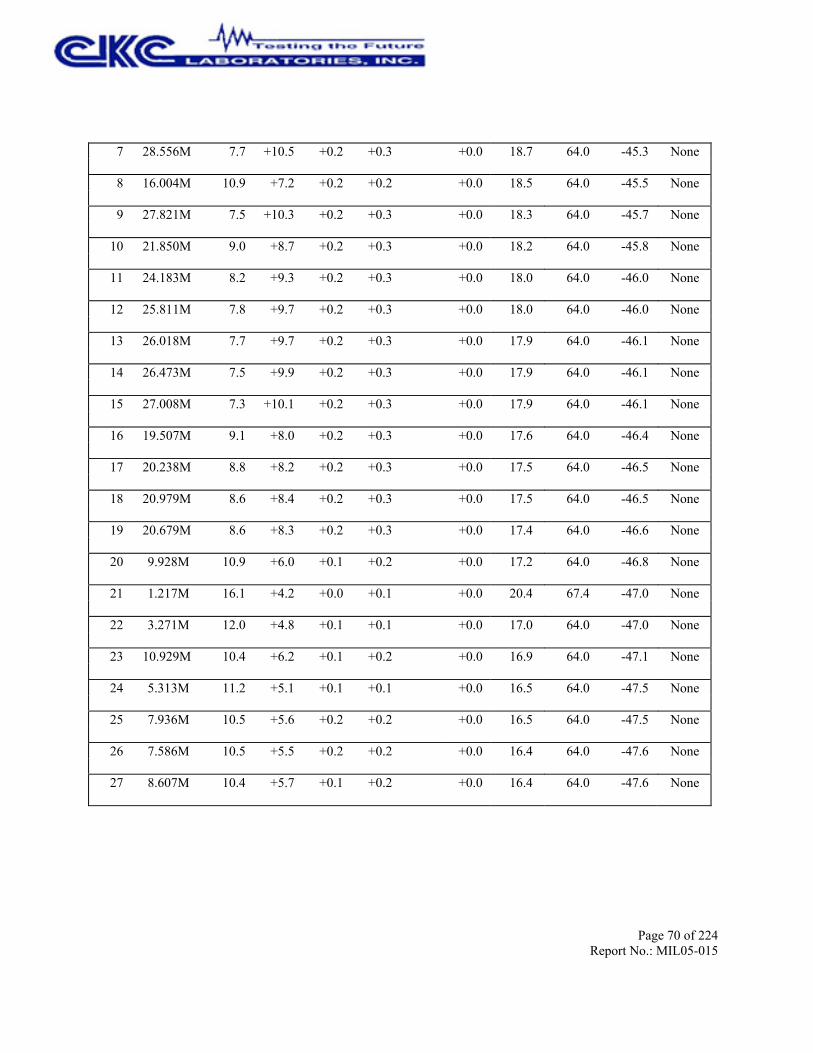
Page 70 of 224Report No.: MIL05-015
7 28.556M 7.7 +0.0 18.7 64.0 -45.3 None +10.5 +0.2 +0.3
8 16.004M 10.9 +0.0 18.5 64.0 -45.5 None +7.2 +0.2 +0.2
9 27.821M 7.5 +0.0 18.3 64.0 -45.7 None +10.3 +0.2 +0.3
10 21.850M 9.0 +0.0 18.2 64.0 -45.8 None +8.7 +0.2 +0.3
11 24.183M 8.2 +0.0 18.0 64.0 -46.0 None +9.3 +0.2 +0.3
12 25.811M 7.8 +0.0 18.0 64.0 -46.0 None +9.7 +0.2 +0.3
13 26.018M 7.7 +0.0 17.9 64.0 -46.1 None +9.7 +0.2 +0.3
14 26.473M 7.5 +0.0 17.9 64.0 -46.1 None +9.9 +0.2 +0.3
15 27.008M 7.3 +0.0 17.9 64.0 -46.1 None +10.1 +0.2 +0.3
16 19.507M 9.1 +0.0 17.6 64.0 -46.4 None +8.0 +0.2 +0.3
17 20.238M 8.8 +0.0 17.5 64.0 -46.5 None +8.2 +0.2 +0.3
18 20.979M 8.6 +0.0 17.5 64.0 -46.5 None +8.4 +0.2 +0.3
19 20.679M 8.6 +0.0 17.4 64.0 -46.6 None +8.3 +0.2 +0.3
20 9.928M 10.9 +0.0 17.2 64.0 -46.8 None +6.0 +0.1 +0.2
21 1.217M 16.1 +0.0 20.4 67.4 -47.0 None +4.2 +0.0 +0.1
22 3.271M 12.0 +0.0 17.0 64.0 -47.0 None +4.8 +0.1 +0.1
23 10.929M 10.4 +0.0 16.9 64.0 -47.1 None +6.2 +0.1 +0.2
24 5.313M 11.2 +0.0 16.5 64.0 -47.5 None +5.1 +0.1 +0.1
25 7.936M 10.5 +0.0 16.5 64.0 -47.5 None +5.6 +0.2 +0.2
26 7.586M 10.5 +0.0 16.4 64.0 -47.6 None +5.5 +0.2 +0.2
27 8.607M 10.4 +0.0 16.4 64.0 -47.6 None +5.7 +0.1 +0.2

Page 71 of 224Report No.: MIL05-015
28 4.462M 11.1 +0.0 16.3 64.0 -47.7 None +4.9 +0.1 +0.2
29 6.124M 10.9 +0.0 16.3 64.0 -47.7 None +5.2 +0.1 +0.1
30 1.920M 11.8 +0.0 16.4 64.3 -47.9 None +4.4 +0.1 +0.1

Page 72 of 224Report No.: MIL05-015
Test Location: CKC Laboratories, Inc. •1120 Fulton Place • Fremont, CA 94539 • (510) 249 - 1170
Customer: Stanford Linear Accelerator CenterSpecification: RE102 10KHz-18GHzWork Order #: 82840 Date: 2/25/2005Test Type: Radiated Scan Time: 9:17:29 AMEquipment: Sequence#: 0Manufacturer: Tested By: A. BrarModel:S/N:Equipment Under Test (* = UUT):
Function Manufacturer Model # S/N
Support Devices:Function Manufacturer Model # S/N
Test Conditions / Notes:Path Check Sweep. Signal at 15.005MHz. 64 (spec limit) - 6dB - 6.9 (Antenna Factor) = 51.1dBuV signal level.
Transducer Legend:T1=AN 01579 Rod AntennaT3=Cable 2410
T2=20' Cable Male N to Male N AN None
Measurement Data: Reading listed by margin. Test Distance: None# Freq Rdng T1 T2 T3 Dist Corr Spec Margin Polar
MHz dBµV dB dB dB dB Table dBµV/m dBµV/m dB Ant 1 15.003M 51.9 +0.0 59.2 64.0 -4.8 None +6.9 +0.2 +0.2
2 1.169M 21.4 +0.0 25.7 67.6 -41.9 None +4.2 +0.0 +0.1
3 27.279M 7.8 +0.0 18.5 64.0 -45.5 None +10.2 +0.2 +0.3
4 20.859M 9.0 +0.0 17.9 64.0 -46.1 None +8.4 +0.2 +0.3
5 1.216M 16.2 +0.0 20.5 67.4 -46.9 None +4.2 +0.0 +0.1
6 13.121M 10.2 +0.0 17.0 64.0 -47.0 None +6.4 +0.2 +0.2

Page 73 of 224Report No.: MIL05-015
7 10.478M 10.4 +0.0 16.8 64.0 -47.2 None +6.1 +0.1 +0.2
8 20.088M 8.2 +0.0 16.8 64.0 -47.2 None +8.1 +0.2 +0.3
9 18.557M 8.0 +0.0 16.3 64.0 -47.7 None +7.8 +0.2 +0.3
10 18.707M 7.8 +0.0 16.1 64.0 -47.9 None +7.8 +0.2 +0.3
11 19.277M 7.5 +0.0 16.0 64.0 -48.0 None +8.0 +0.2 +0.3
12 1.850M 10.9 +0.0 15.5 64.5 -49.0 None +4.4 +0.1 +0.1
13 1.837M 10.8 +0.0 15.4 64.6 -49.2 None +4.4 +0.1 +0.1
14 1.739M 10.8 +0.0 15.3 64.9 -49.6 None +4.3 +0.1 +0.1
15 1.051M 14.4 +0.0 18.6 68.4 -49.8 None +4.1 +0.0 +0.1
16 1.689M 10.3 +0.0 14.8 65.1 -50.3 None +4.3 +0.1 +0.1
17 1.097M 13.4 +0.0 17.6 68.1 -50.5 None +4.1 +0.0 +0.1
18 1.580M 10.5 +0.0 15.0 65.6 -50.6 None +4.3 +0.1 +0.1
19 1.617M 10.3 +0.0 14.8 65.4 -50.6 None +4.3 +0.1 +0.1
20 1.643M 9.9 +0.0 14.4 65.3 -50.9 None +4.3 +0.1 +0.1
21 1.447M 10.4 +0.0 14.9 66.2 -51.3 None +4.3 +0.1 +0.1
22 1.417M 9.9 +0.0 14.4 66.3 -51.9 None +4.3 +0.1 +0.1
23 819.700k 13.6 +0.0 17.6 70.1 -52.5 None +4.0 +0.0 +0.0
24 692.050k 14.3 +0.0 18.5 71.2 -52.7 None +4.0 +0.1 +0.1
25 618.050k 12.2 +0.0 16.4 72.0 -55.6 None +4.1 +0.1 +0.0
26 288.750k 14.4 +0.0 18.3 77.1 -58.8 None +3.9 +0.0 +0.0
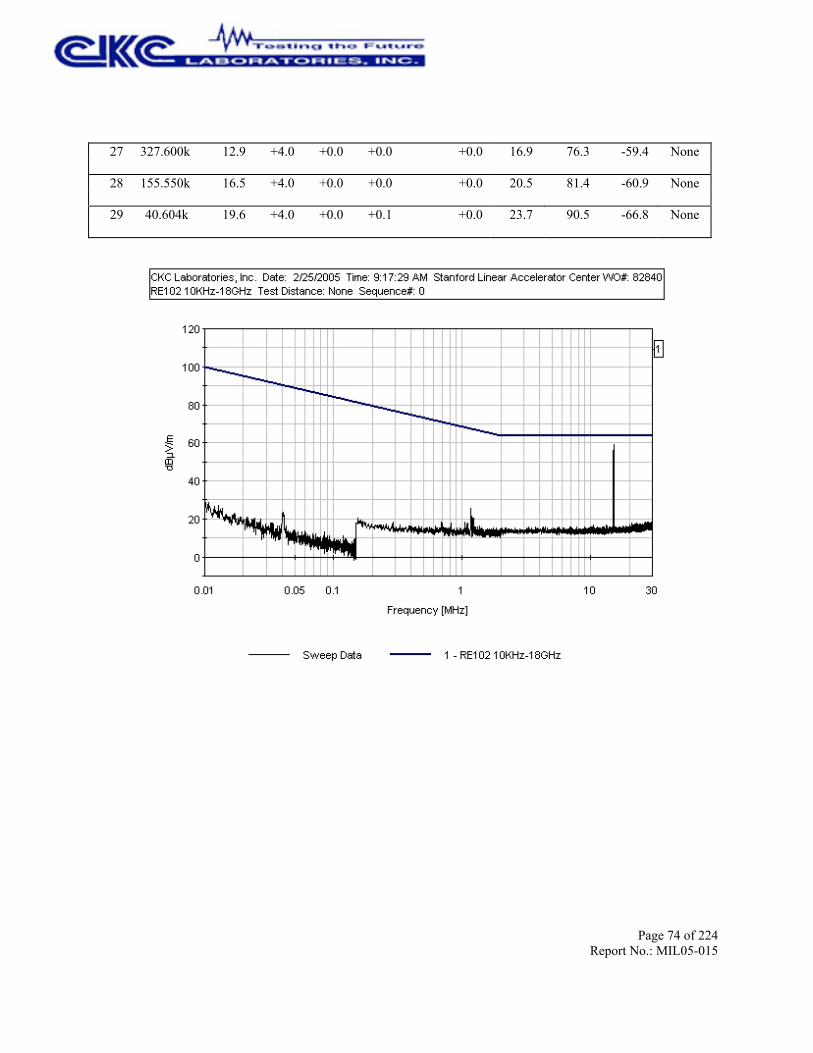
Page 74 of 224Report No.: MIL05-015
27 327.600k 12.9 +0.0 16.9 76.3 -59.4 None +4.0 +0.0 +0.0
28 155.550k 16.5 +0.0 20.5 81.4 -60.9 None +4.0 +0.0 +0.0
29 40.604k 19.6 +0.0 23.7 90.5 -66.8 None +4.0 +0.0 +0.1

Page 75 of 224Report No.: MIL05-015
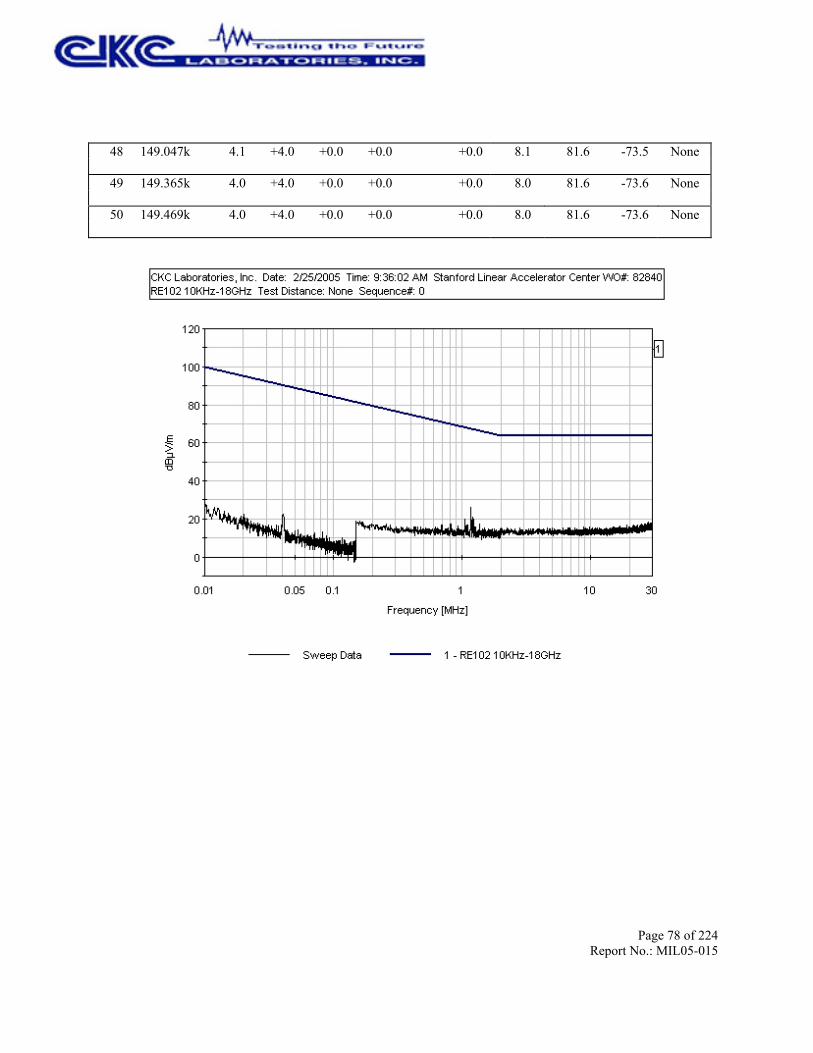
Test Location: CKC Laboratories, Inc. •1120 Fulton Place • Fremont, CA 94539 • (510) 249 - 1170
Customer: Stanford Linear Accelerator CenterSpecification: RE102 10KHz-18GHzWork Order #: 82840 Date: 2/25/2005Test Type: Radiated Scan Time: 9:36:02 AMEquipment: Sequence#: 0Manufacturer: Tested By: A. BrarModel:S/N:Equipment Under Test (* = UUT):
Function Manufacturer Model # S/N
Support Devices:Function Manufacturer Model # S/N
Test Conditions / Notes:Path Check Sweep. Signal at 15.005MHz. 64 (spec limit) - 6dB - 10.9 (Antenna Factor) = 47.1dBuV signal level.
Transducer Legend:T1=AN 01579 Rod AntennaT3=Cable 2410
T2=20' Cable Male N to Male N AN None
Measurement Data: Reading listed by margin. Test Distance: None# Freq Rdng T1 T2 T3 Dist Corr Spec Margin Polar
MHz dBµV dB dB dB dB Table dBµV/m dBµV/m dB Ant 1 29.992M 44.5 +0.0 55.9 64.0 -8.1 None +10.9 +0.2 +0.3
2 1.166M 21.8 +0.0 26.1 67.7 -41.6 None +4.2 +0.0 +0.1
3 28.109M 7.7 +0.0 18.5 64.0 -45.5 None +10.3 +0.2 +0.3
4 27.534M 7.2 +0.0 17.9 64.0 -46.1 None +10.2 +0.2 +0.3
5 26.273M 7.1 +0.0 17.4 64.0 -46.6 None +9.8 +0.2 +0.3
6 1.216M 16.4 +0.0 20.7 67.4 -46.7 None +4.2 +0.0 +0.1

Page 76 of 224Report No.: MIL05-015
7 26.521M 6.9 +0.0 17.3 64.0 -46.7 None +9.9 +0.2 +0.3
8 26.640M 6.8 +0.0 17.3 64.0 -46.7 None +10.0 +0.2 +0.3
9 26.058M 7.0 +0.0 17.2 64.0 -46.8 None +9.7 +0.2 +0.3
10 24.590M 7.2 +0.0 17.1 64.0 -46.9 None +9.4 +0.2 +0.3
11 21.479M 7.9 +0.0 16.9 64.0 -47.1 None +8.5 +0.2 +0.3
12 21.650M 7.8 +0.0 16.9 64.0 -47.1 None +8.6 +0.2 +0.3
13 19.087M 8.3 +0.0 16.7 64.0 -47.3 None +7.9 +0.2 +0.3
14 16.935M 8.6 +0.0 16.4 64.0 -47.6 None +7.4 +0.2 +0.2
15 8.767M 9.7 +0.0 15.7 64.0 -48.3 None +5.7 +0.1 +0.2
16 1.053M 15.5 +0.0 19.7 68.4 -48.7 None +4.1 +0.0 +0.1
17 1.364M 12.8 +0.0 17.1 66.6 -49.5 None +4.2 +0.0 +0.1
18 1.983M 10.0 +0.0 14.6 64.1 -49.5 None +4.4 +0.1 +0.1
19 1.789M 10.1 +0.0 14.7 64.8 -50.1 None +4.4 +0.1 +0.1
20 1.710M 10.4 +0.0 14.9 65.1 -50.2 None +4.3 +0.1 +0.1
21 1.957M 9.3 +0.0 13.9 64.1 -50.2 None +4.4 +0.1 +0.1
22 1.482M 10.6 +0.0 15.1 66.0 -50.9 None +4.3 +0.1 +0.1
23 1.502M 10.5 +0.0 15.0 65.9 -50.9 None +4.3 +0.1 +0.1
24 1.094M 12.8 +0.0 17.0 68.1 -51.1 None +4.1 +0.0 +0.1
25 1.926M 8.5 +0.0 13.1 64.3 -51.2 None +4.4 +0.1 +0.1
26 1.432M 10.2 +0.0 14.7 66.3 -51.6 None +4.3 +0.1 +0.1
27 1.414M 9.6 +0.0 13.9 66.4 -52.5 None +4.2 +0.0 +0.1
28 816.000k 13.5 +0.0 17.5 70.1 -52.6 None +4.0 +0.0 +0.0

Page 77 of 224Report No.: MIL05-015
29 1.032M 10.1 +0.0 14.3 68.5 -54.2 None +4.1 +0.0 +0.1
30 692.050k 12.7 +0.0 16.9 71.2 -54.3 None +4.0 +0.1 +0.1
31 779.000k 11.2 +0.0 15.2 70.4 -55.2 None +4.0 +0.0 +0.0
32 745.700k 10.7 +0.0 14.9 70.7 -55.8 None +4.0 +0.1 +0.1
33 614.350k 11.6 +0.0 15.8 72.0 -56.2 None +4.1 +0.1 +0.0
34 638.400k 10.9 +0.0 15.1 71.8 -56.7 None +4.1 +0.1 +0.0
35 473.750k 11.5 +0.0 15.7 73.8 -58.1 None +4.1 +0.1 +0.0
36 431.200k 11.8 +0.0 16.0 74.4 -58.4 None +4.1 +0.1 +0.0
37 150.000k 14.9 +0.0 18.9 81.6 -62.7 None +4.0 +0.0 +0.0
38 40.738k 18.3 +0.0 22.4 90.5 -68.1 None +4.0 +0.0 +0.1
39 10.134k 23.3 +0.0 27.7 99.9 -72.2 None +4.2 +0.1 +0.1
40 82.750k 9.1 +0.0 13.2 85.6 -72.4 None +4.1 +0.0 +0.0
41 11.879k 21.9 +0.0 26.3 98.8 -72.5 None +4.2 +0.1 +0.1
42 12.550k 21.5 +0.0 25.8 98.5 -72.7 None +4.1 +0.1 +0.1
43 20.201k 18.2 +0.0 22.3 95.2 -72.9 None +4.0 +0.0 +0.1
44 149.965k 4.5 +0.0 8.5 81.6 -73.1 None +4.0 +0.0 +0.0
45 117.784k 6.0 +0.0 10.0 83.2 -73.2 None +4.0 +0.0 +0.0
46 146.904k 4.4 +0.0 8.4 81.7 -73.3 None +4.0 +0.0 +0.0
47 144.611k 4.3 +0.0 8.3 81.8 -73.5 None +4.0 +0.0 +0.0
Page 78 of 224Report No.: MIL05-015
48 149.047k 4.1 +0.0 8.1 81.6 -73.5 None +4.0 +0.0 +0.0
49 149.365k 4.0 +0.0 8.0 81.6 -73.6 None +4.0 +0.0 +0.0
50 149.469k 4.0 +0.0 8.0 81.6 -73.6 None +4.0 +0.0 +0.0

Page 79 of 224Report No.: MIL05-015
Test Location: CKC Laboratories, Inc. •1120 Fulton Place • Fremont, CA 94539 • (510) 249 - 1170
Customer: Stanford Linear Accelerator CenterSpecification: RE102 10KHz-18GHzWork Order #: 82840 Date: 2/23/2005Test Type: Radiated Scan Time: 12:41:53 PMEquipment: Sequence#: 0Manufacturer: Tested By: A. BrarModel:S/N:Equipment Under Test (* = UUT):
Function Manufacturer Model # S/N
Support Devices:Function Manufacturer Model # S/N
Test Conditions / Notes:Path Check Sweep. Signal at 200MHz. 70(spec limit) - 6dB - 16.9 (Antenna Factor) = 47.1dBuV signal level.
Transducer Legend:T1=20' Cable Male N to Male N AN NoneT3=Bicon503T5=AN 0567 SN 1937A03055
T2=Cable 2410T4=2' Cable Male BNC to Male N AN None
Measurement Data: Reading listed by margin. Test Distance: Path Check# Freq Rdng T1
T5T2 T3 T4 Dist Corr Spec Margin Polar
MHz dBµV dB dB dB dB Table dBµV/m dBµV/m dB Ant 1 199.918M 73.4 +0.0 64.4 70.1 -5.7 None +0.6
-27.6 +1.0 +16.9 +0.1
2 30.370M 29.3 +0.0 18.3 64.0 -45.7 None +0.2 -27.5
+0.3 +16.0 +0.0
3 152.926M 30.7 +0.0 20.0 67.7 -47.7 None +0.5 -27.4
+0.8 +15.3 +0.1
4 188.208M 29.5 +0.0 20.3 69.5 -49.2 None +0.6 -27.5
+1.1 +16.5 +0.1
5 99.739M 29.4 +0.0 13.4 64.0 -50.6 None +0.4 -27.3
+0.8 +10.0 +0.1
6 97.692M 29.8 +0.0 13.3 64.0 -50.7 None +0.4 -27.4
+0.8 +9.6 +0.1
7 96.691M 30.0 +0.0 13.2 64.0 -50.8 None +0.4 -27.4
+0.7 +9.4 +0.1
8 57.810M 28.9 +0.0 11.6 64.0 -52.4 None +0.3 -27.4
+0.5 +9.2 +0.1
9 86.982M 29.6 +0.0 10.7 64.0 -53.3 None +0.4 -27.5
+0.6 +7.5 +0.1

Page 80 of 224Report No.: MIL05-015
Test Location: CKC Laboratories, Inc. •1120 Fulton Place • Fremont, CA 94539 • (510) 249 - 1170
Customer: Stanford Linear Accelerator CenterSpecification: RE102 10KHz-18GHzWork Order #: 82840 Date: 2/23/2005Test Type: Radiated Scan Time: 1:32:11 PMEquipment: Sequence#: 0Manufacturer: Tested By: A. BrarModel:S/N:Equipment Under Test (* = UUT):
Function Manufacturer Model # S/N
Support Devices:Function Manufacturer Model # S/N
Test Conditions / Notes:Path Check Sweep. Signal at 1000MHz. 84(spec limit) - 6dB - 22.7 (Antenna Factor) = 55.3dBuV signal level.
Transducer Legend:T1=20' Cable Male N to Male N AN NoneT3=2' Cable Male BNC to Male N AN NoneT5=SAS-570 Horn Antenna - 2525
T2=Cable 2410T4=AN 0567 SN 1937A03055
Measurement Data: Reading listed by margin. Test Distance: None# Freq Rdng T1
T5T2 T3 T4 Dist Corr Spec Margin Polar
MHz dBµV dB dB dB dB Table dBµV/m dBµV/m dB Ant 1 999.901M 77.6 +0.0 78.1 84.2 -6.1 None +1.7
+22.7 +2.9 +0.6 -27.4
2 500.000M 47.0 +0.0 39.4 78.1 -38.7 None +1.1 +16.9
+1.8 +0.3 -27.7
3 603.303M 44.8 +0.0 38.8 79.7 -40.9 None +1.2 +17.8
+2.2 +0.3 -27.5
4 675.275M 36.1 +0.0 30.9 80.7 -49.8 None +1.3 +18.1
+2.3 +0.5 -27.4
5 891.791M 35.6 +0.0 33.3 83.2 -49.9 None +1.6 +20.2
+2.7 +0.5 -27.3
6 679.779M 32.8 +0.0 27.6 80.8 -53.2 None +1.3 +18.1
+2.3 +0.5 -27.4
7 698.298M 31.5 +0.0 26.4 81.0 -54.6 None +1.4 +18.1
+2.3 +0.4 -27.3
8 475.776M 31.0 +0.0 22.9 77.7 -54.8 None +1.0 +16.7
+1.8 +0.3 -27.9
9 607.807M 30.4 +0.0 24.3 79.8 -55.5 None +1.2 +17.7
+2.2 +0.3 -27.5

Page 81 of 224Report No.: MIL05-015
10 828.928M 29.5 +0.0 26.5 82.5 -56.0 None +1.4 +19.6
+2.7 +0.5 -27.2
11 701.601M 30.1 +0.0 25.0 81.1 -56.1 None +1.4 +18.1
+2.3 +0.4 -27.3
12 833.533M 29.0 +0.0 26.0 82.6 -56.6 None +1.5 +19.6
+2.7 +0.5 -27.3
13 300.000M 28.4 +0.0 16.3 73.6 -57.3 None +0.8 +12.8
+1.7 +0.3 -27.7
14 358.659M 29.2 +0.0 17.9 75.2 -57.3 None +0.8 +13.5
+1.6 +0.2 -27.4
15 600.400M 28.4 +0.0 22.4 79.7 -57.3 None +1.2 +17.8
+2.2 +0.3 -27.5
16 628.128M 28.9 +0.0 22.7 80.1 -57.4 None +1.2 +17.6
+2.2 +0.4 -27.6
17 593.093M 28.2 +0.0 21.9 79.6 -57.7 None +1.2 +17.7
+2.1 +0.3 -27.6
18 784.984M 28.2 +0.0 24.2 82.0 -57.8 None +1.5 +18.8
+2.5 +0.5 -27.3
19 823.022M 27.5 +0.0 24.5 82.5 -58.0 None +1.4 +19.5
+2.7 +0.5 -27.1
20 900.700M 27.5 +0.0 25.1 83.2 -58.1 None +1.6 +20.2
+2.7 +0.5 -27.4
Page 82 of 224Report No.: MIL05-015
Test Location: CKC Laboratories, Inc. •1120 Fulton Place • Fremont, CA 94539 • (510) 249 - 1170
Customer: Stanford Linear Accelerator CenterSpecification: RE102 10KHz-18GHzWork Order #: 82840 Date: 2/23/2005Test Type: Radiated Scan Time: 4:38:28 PMEquipment: Sequence#: 0Manufacturer: Tested By: A. BrarModel:S/N:Equipment Under Test (* = UUT):
Function Manufacturer Model # S/N
Support Devices:Function Manufacturer Model # S/N
Test Conditions / Notes:Path Check Sweep. Signal at 1000MHz. 109(spec limit) - 6dB - 45.2 (Antenna Factor) = -49.2dBm signal level.
Transducer Legend:
Measurement Data: Reading listed by margin. Test Distance: None# Freq Rdng Dist Corr Spec Margin Polar
MHz dBµV dB dB dB dB Table dBµV/m dBµV/m dB Ant

Page 83 of 224Report No.: MIL05-015

Page 84 of 224Report No.: MIL05-015
Test Location: CKC Laboratories, Inc. •1120 Fulton Place • Fremont, CA 94539 • (510) 249 - 1170
Customer: Stanford Linear Accelerator CenterSpecification: RE102 10KHz-18GHzWork Order #: 82840 Date: 2/23/2005Test Type: Radiated Scan Time: 4:39:45 PMEquipment: Sequence#: 0Manufacturer: Tested By: A. BrarModel:S/N:Equipment Under Test (* = UUT):
Function Manufacturer Model # S/N
Support Devices:Function Manufacturer Model # S/N
Test Conditions / Notes:Path Check Sweep. Signal at 1000MHz. 109(spec limit) - 6dB - 45.2 (Antenna Factor) = -49.2dBm signal level.
Transducer Legend:T1=AMP AN00941A 50GHzT3=ANP05200 1-40GHz
T2=Horn Antenna 4660 (Fremont)T4=ANP5201 1-40GHz
Measurement Data: Reading listed by margin. Test Distance: None# Freq Rdng T1 T2 T3 T4 Dist Corr Spec Margin Polar
MHz dBµV dB dB dB dB Table dBµV/m dBµV/m dB Ant 1 1551.793M 15.6 +0.0 12.7 14.0 -1.3 None -30.3 +25.4 +1.0 +1.0
2 1583.352M 15.4 +0.0 12.6 14.0 -1.4 None -30.3 +25.5 +1.0 +1.0
3 1562.541M 15.1 +0.0 12.2 14.0 -1.8 None -30.3 +25.4 +1.0 +1.0
4 1591.490M 15.0 +0.0 12.2 14.0 -1.8 None -30.3 +25.5 +1.0 +1.0
5 1598.763M 14.9 +0.0 12.2 14.0 -1.8 None -30.3 +25.6 +1.0 +1.0
6 1595.265M 14.8 +0.0 12.1 14.0 -1.9 None -30.3 +25.6 +1.0 +1.0
7 1595.436M 14.8 +0.0 12.1 14.0 -1.9 None -30.3 +25.6 +1.0 +1.0
8 1599.817M 14.8 +0.0 12.1 14.0 -1.9 None -30.3 +25.6 +1.0 +1.0
9 1551.297M 14.9 +0.0 12.0 14.0 -2.0 None -30.3 +25.4 +1.0 +1.0
10 1558.625M 14.9 +0.0 12.0 14.0 -2.0 None -30.3 +25.4 +1.0 +1.0

Page 85 of 224Report No.: MIL05-015
11 1561.616M 14.9 +0.0 12.0 14.0 -2.0 None -30.3 +25.4 +1.0 +1.0
12 1585.968M 14.8 +0.0 12.0 14.0 -2.0 None -30.3 +25.5 +1.0 +1.0
13 1592.670M 14.7 +0.0 12.0 14.0 -2.0 None -30.3 +25.6 +1.0 +1.0
14 1595.749M 14.7 +0.0 12.0 14.0 -2.0 None -30.3 +25.6 +1.0 +1.0
15 1552.126M 14.8 +0.0 11.9 14.0 -2.1 None -30.3 +25.4 +1.0 +1.0
16 1556.817M 14.8 +0.0 11.9 14.0 -2.1 None -30.3 +25.4 +1.0 +1.0
17 1576.565M 14.7 +0.0 11.9 14.0 -2.1 None -30.3 +25.5 +1.0 +1.0
18 1584.532M 14.7 +0.0 11.9 14.0 -2.1 None -30.3 +25.5 +1.0 +1.0
19 1599.229M 14.6 +0.0 11.9 14.0 -2.1 None -30.3 +25.6 +1.0 +1.0
20 1555.925M 14.7 +0.0 11.8 14.0 -2.2 None -30.3 +25.4 +1.0 +1.0
21 1598.353M 14.5 +0.0 11.8 14.0 -2.2 None -30.3 +25.6 +1.0 +1.0
22 1559.345M 14.6 +0.0 11.7 14.0 -2.3 None -30.3 +25.4 +1.0 +1.0
23 1569.069M 14.5 +0.0 11.7 14.0 -2.3 None -30.3 +25.5 +1.0 +1.0
24 1580.529M 14.5 +0.0 11.7 14.0 -2.3 None -30.3 +25.5 +1.0 +1.0
25 1582.334M 14.5 +0.0 11.7 14.0 -2.3 None -30.3 +25.5 +1.0 +1.0
26 1586.385M 14.5 +0.0 11.7 14.0 -2.3 None -30.3 +25.5 +1.0 +1.0
27 1586.466M 14.5 +0.0 11.7 14.0 -2.3 None -30.3 +25.5 +1.0 +1.0
28 1590.184M 14.5 +0.0 11.7 14.0 -2.3 None -30.3 +25.5 +1.0 +1.0
29 1556.916M 14.5 +0.0 11.6 14.0 -2.4 None -30.3 +25.4 +1.0 +1.0
30 1574.778M 14.4 +0.0 11.6 14.0 -2.4 None -30.3 +25.5 +1.0 +1.0
31 1575.652M 14.4 +0.0 11.6 14.0 -2.4 None -30.3 +25.5 +1.0 +1.0
32 1578.307M 14.4 +0.0 11.6 14.0 -2.4 None -30.3 +25.5 +1.0 +1.0

Page 86 of 224Report No.: MIL05-015
33 1585.166M 14.4 +0.0 11.6 14.0 -2.4 None -30.3 +25.5 +1.0 +1.0
34 1598.488M 14.3 +0.0 11.6 14.0 -2.4 None -30.3 +25.6 +1.0 +1.0
35 1560.748M 14.4 +0.0 11.5 14.0 -2.5 None -30.3 +25.4 +1.0 +1.0
36 1560.940M 14.4 +0.0 11.5 14.0 -2.5 None -30.3 +25.4 +1.0 +1.0
37 1574.523M 14.3 +0.0 11.5 14.0 -2.5 None -30.3 +25.5 +1.0 +1.0
38 1585.845M 14.3 +0.0 11.5 14.0 -2.5 None -30.3 +25.5 +1.0 +1.0
39 1586.115M 14.3 +0.0 11.5 14.0 -2.5 None -30.3 +25.5 +1.0 +1.0
40 1595.734M 14.2 +0.0 11.5 14.0 -2.5 None -30.3 +25.6 +1.0 +1.0
41 1596.794M 14.2 +0.0 11.5 14.0 -2.5 None -30.3 +25.6 +1.0 +1.0
42 1558.940M 14.3 +0.0 11.4 14.0 -2.6 None -30.3 +25.4 +1.0 +1.0
43 1560.817M 14.3 +0.0 11.4 14.0 -2.6 None -30.3 +25.4 +1.0 +1.0
44 1560.967M 14.3 +0.0 11.4 14.0 -2.6 None -30.3 +25.4 +1.0 +1.0
45 1566.096M 14.2 +0.0 11.4 14.0 -2.6 None -30.3 +25.5 +1.0 +1.0
46 1584.493M 14.2 +0.0 11.4 14.0 -2.6 None -30.3 +25.5 +1.0 +1.0
47 1585.082M 14.2 +0.0 11.4 14.0 -2.6 None -30.3 +25.5 +1.0 +1.0
48 1586.082M 14.2 +0.0 11.4 14.0 -2.6 None -30.3 +25.5 +1.0 +1.0
49 1586.568M 14.2 +0.0 11.4 14.0 -2.6 None -30.3 +25.5 +1.0 +1.0
50 1597.451M 14.1 +0.0 11.4 14.0 -2.6 None -30.3 +25.6 +1.0 +1.0
51 1598.726M 14.1 +0.0 11.4 14.0 -2.6 None -30.3 +25.6 +1.0 +1.0
52 1599.871M 14.1 +0.0 11.4 14.0 -2.6 None -30.3 +25.6 +1.0 +1.0
53 1599.949M 14.1 +0.0 11.4 14.0 -2.6 None -30.3 +25.6 +1.0 +1.0
54 1551.405M 14.2 +0.0 11.3 14.0 -2.7 None -30.3 +25.4 +1.0 +1.0

Page 87 of 224Report No.: MIL05-015
55 1558.811M 14.2 +0.0 11.3 14.0 -2.7 None -30.3 +25.4 +1.0 +1.0
56 1559.135M 14.2 +0.0 11.3 14.0 -2.7 None -30.3 +25.4 +1.0 +1.0
57 1562.090M 14.2 +0.0 11.3 14.0 -2.7 None -30.3 +25.4 +1.0 +1.0
58 1562.955M 14.2 +0.0 11.3 14.0 -2.7 None -30.3 +25.4 +1.0 +1.0
59 1564.703M 14.2 +0.0 11.3 14.0 -2.7 None -30.3 +25.4 +1.0 +1.0
60 1565.057M 14.1 +0.0 11.3 14.0 -2.7 None -30.3 +25.5 +1.0 +1.0
61 1578.935M 14.1 +0.0 11.3 14.0 -2.7 None -30.3 +25.5 +1.0 +1.0
62 1584.166M 14.1 +0.0 11.3 14.0 -2.7 None -30.3 +25.5 +1.0 +1.0
63 1587.247M 14.1 +0.0 11.3 14.0 -2.7 None -30.3 +25.5 +1.0 +1.0
64 1590.241M 14.1 +0.0 11.3 14.0 -2.7 None -30.3 +25.5 +1.0 +1.0
65 1560.634M 14.1 +0.0 11.2 14.0 -2.8 None -30.3 +25.4 +1.0 +1.0
66 1563.427M 14.1 +0.0 11.2 14.0 -2.8 None -30.3 +25.4 +1.0 +1.0
67 1565.147M 14.0 +0.0 11.2 14.0 -2.8 None -30.3 +25.5 +1.0 +1.0
68 1565.439M 14.0 +0.0 11.2 14.0 -2.8 None -30.3 +25.5 +1.0 +1.0
69 1566.381M 14.0 +0.0 11.2 14.0 -2.8 None -30.3 +25.5 +1.0 +1.0
70 1567.613M 14.0 +0.0 11.2 14.0 -2.8 None -30.3 +25.5 +1.0 +1.0
71 1571.021M 14.0 +0.0 11.2 14.0 -2.8 None -30.3 +25.5 +1.0 +1.0
72 1572.364M 14.0 +0.0 11.2 14.0 -2.8 None -30.3 +25.5 +1.0 +1.0
73 1572.808M 14.0 +0.0 11.2 14.0 -2.8 None -30.3 +25.5 +1.0 +1.0
74 1572.838M 14.0 +0.0 11.2 14.0 -2.8 None -30.3 +25.5 +1.0 +1.0
75 1573.973M 14.0 +0.0 11.2 14.0 -2.8 None -30.3 +25.5 +1.0 +1.0
76 1575.679M 14.0 +0.0 11.2 14.0 -2.8 None -30.3 +25.5 +1.0 +1.0

Page 88 of 224Report No.: MIL05-015
77 1577.484M 14.0 +0.0 11.2 14.0 -2.8 None -30.3 +25.5 +1.0 +1.0
78 1578.004M 14.0 +0.0 11.2 14.0 -2.8 None -30.3 +25.5 +1.0 +1.0
79 1578.094M 14.0 +0.0 11.2 14.0 -2.8 None -30.3 +25.5 +1.0 +1.0
80 1584.049M 14.0 +0.0 11.2 14.0 -2.8 None -30.3 +25.5 +1.0 +1.0
81 1590.637M 14.0 +0.0 11.2 14.0 -2.8 None -30.3 +25.5 +1.0 +1.0
82 1592.238M 13.9 +0.0 11.2 14.0 -2.8 None -30.3 +25.6 +1.0 +1.0
83 1597.659M 13.9 +0.0 11.2 14.0 -2.8 None -30.3 +25.6 +1.0 +1.0
84 1551.495M 14.0 +0.0 11.1 14.0 -2.9 None -30.3 +25.4 +1.0 +1.0
85 1559.276M 14.0 +0.0 11.1 14.0 -2.9 None -30.3 +25.4 +1.0 +1.0
86 1564.066M 14.0 +0.0 11.1 14.0 -2.9 None -30.3 +25.4 +1.0 +1.0
87 1566.958M 13.9 +0.0 11.1 14.0 -2.9 None -30.3 +25.5 +1.0 +1.0
88 1567.892M 13.9 +0.0 11.1 14.0 -2.9 None -30.3 +25.5 +1.0 +1.0
89 1575.138M 13.9 +0.0 11.1 14.0 -2.9 None -30.3 +25.5 +1.0 +1.0
90 1576.631M 13.9 +0.0 11.1 14.0 -2.9 None -30.3 +25.5 +1.0 +1.0
91 1584.124M 13.9 +0.0 11.1 14.0 -2.9 None -30.3 +25.5 +1.0 +1.0
92 1590.292M 13.9 +0.0 11.1 14.0 -2.9 None -30.3 +25.5 +1.0 +1.0
93 1590.448M 13.9 +0.0 11.1 14.0 -2.9 None -30.3 +25.5 +1.0 +1.0
94 1590.881M 13.9 +0.0 11.1 14.0 -2.9 None -30.3 +25.5 +1.0 +1.0
95 1595.764M 13.8 +0.0 11.1 14.0 -2.9 None -30.3 +25.6 +1.0 +1.0
96 1596.755M 13.8 +0.0 11.1 14.0 -2.9 None -30.3 +25.6 +1.0 +1.0
97 1555.982M 13.9 +0.0 11.0 14.0 -3.0 None -30.3 +25.4 +1.0 +1.0
98 1559.631M 13.9 +0.0 11.0 14.0 -3.0 None -30.3 +25.4 +1.0 +1.0

Page 89 of 224Report No.: MIL05-015
99 1560.910M 13.9 +0.0 11.0 14.0 -3.0 None -30.3 +25.4 +1.0 +1.0
100 1561.778M 13.9 +0.0 11.0 14.0 -3.0 None -30.3 +25.4 +1.0 +1.0
101 1566.054M 13.8 +0.0 11.0 14.0 -3.0 None -30.3 +25.5 +1.0 +1.0
102 1566.922M 13.8 +0.0 11.0 14.0 -3.0 None -30.3 +25.5 +1.0 +1.0
103 1567.501M 13.8 +0.0 11.0 14.0 -3.0 None -30.3 +25.5 +1.0 +1.0
104 1579.541M 13.8 +0.0 11.0 14.0 -3.0 None -30.3 +25.5 +1.0 +1.0
105 1579.842M 13.8 +0.0 11.0 14.0 -3.0 None -30.3 +25.5 +1.0 +1.0
106 1583.535M 13.8 +0.0 11.0 14.0 -3.0 None -30.3 +25.5 +1.0 +1.0
107 1583.709M 13.8 +0.0 11.0 14.0 -3.0 None -30.3 +25.5 +1.0 +1.0
108 1587.415M 13.8 +0.0 11.0 14.0 -3.0 None -30.3 +25.5 +1.0 +1.0
109 1597.376M 13.7 +0.0 11.0 14.0 -3.0 None -30.3 +25.6 +1.0 +1.0
110 1597.529M 13.7 +0.0 11.0 14.0 -3.0 None -30.3 +25.6 +1.0 +1.0
111 1598.554M 13.7 +0.0 11.0 14.0 -3.0 None -30.3 +25.6 +1.0 +1.0
112 1598.829M 13.7 +0.0 11.0 14.0 -3.0 None -30.3 +25.6 +1.0 +1.0
113 1552.048M 13.8 +0.0 10.9 14.0 -3.1 None -30.3 +25.4 +1.0 +1.0
114 1559.207M 13.8 +0.0 10.9 14.0 -3.1 None -30.3 +25.4 +1.0 +1.0
115 1567.306M 13.7 +0.0 10.9 14.0 -3.1 None -30.3 +25.5 +1.0 +1.0
116 1572.222M 13.7 +0.0 10.9 14.0 -3.1 None -30.3 +25.5 +1.0 +1.0
117 1572.691M 13.7 +0.0 10.9 14.0 -3.1 None -30.3 +25.5 +1.0 +1.0
118 1585.148M 13.7 +0.0 10.9 14.0 -3.1 None -30.3 +25.5 +1.0 +1.0
119 1587.851M 13.7 +0.0 10.9 14.0 -3.1 None -30.3 +25.5 +1.0 +1.0
120 1588.205M 13.7 +0.0 10.9 14.0 -3.1 None -30.3 +25.5 +1.0 +1.0

Page 90 of 224Report No.: MIL05-015
121 1588.638M 13.7 +0.0 10.9 14.0 -3.1 None -30.3 +25.5 +1.0 +1.0
122 1597.397M 13.6 +0.0 10.9 14.0 -3.1 None -30.3 +25.6 +1.0 +1.0
123 1599.824M 13.6 +0.0 10.9 14.0 -3.1 None -30.3 +25.6 +1.0 +1.0
124 1559.586M 13.7 +0.0 10.8 14.0 -3.2 None -30.3 +25.4 +1.0 +1.0
125 1562.436M 13.7 +0.0 10.8 14.0 -3.2 None -30.3 +25.4 +1.0 +1.0
126 1571.226M 13.6 +0.0 10.8 14.0 -3.2 None -30.3 +25.5 +1.0 +1.0
127 1571.475M 13.6 +0.0 10.8 14.0 -3.2 None -30.3 +25.5 +1.0 +1.0
128 1572.147M 13.6 +0.0 10.8 14.0 -3.2 None -30.3 +25.5 +1.0 +1.0
129 1578.667M 13.6 +0.0 10.8 14.0 -3.2 None -30.3 +25.5 +1.0 +1.0
130 1578.812M 13.6 +0.0 10.8 14.0 -3.2 None -30.3 +25.5 +1.0 +1.0
131 1583.818M 13.6 +0.0 10.8 14.0 -3.2 None -30.3 +25.5 +1.0 +1.0
132 1592.100M 13.5 +0.0 10.8 14.0 -3.2 None -30.3 +25.6 +1.0 +1.0
133 1597.758M 13.5 +0.0 10.8 14.0 -3.2 None -30.3 +25.6 +1.0 +1.0
134 1597.866M 13.5 +0.0 10.8 14.0 -3.2 None -30.3 +25.6 +1.0 +1.0
135 1598.535M 13.5 +0.0 10.8 14.0 -3.2 None -30.3 +25.6 +1.0 +1.0
136 1598.638M 13.5 +0.0 10.8 14.0 -3.2 None -30.3 +25.6 +1.0 +1.0
137 1599.854M 13.5 +0.0 10.8 14.0 -3.2 None -30.3 +25.6 +1.0 +1.0
138 1562.835M 13.6 +0.0 10.7 14.0 -3.3 None -30.3 +25.4 +1.0 +1.0
139 1563.649M 13.6 +0.0 10.7 14.0 -3.3 None -30.3 +25.4 +1.0 +1.0
140 1571.565M 13.5 +0.0 10.7 14.0 -3.3 None -30.3 +25.5 +1.0 +1.0
141 1575.793M 13.5 +0.0 10.7 14.0 -3.3 None -30.3 +25.5 +1.0 +1.0
142 1576.024M 13.5 +0.0 10.7 14.0 -3.3 None -30.3 +25.5 +1.0 +1.0

Page 91 of 224Report No.: MIL05-015
143 1576.054M 13.5 +0.0 10.7 14.0 -3.3 None -30.3 +25.5 +1.0 +1.0
144 1576.186M 13.5 +0.0 10.7 14.0 -3.3 None -30.3 +25.5 +1.0 +1.0
145 1578.544M 13.5 +0.0 10.7 14.0 -3.3 None -30.3 +25.5 +1.0 +1.0
146 1587.938M 13.5 +0.0 10.7 14.0 -3.3 None -30.3 +25.5 +1.0 +1.0
147 1587.974M 13.5 +0.0 10.7 14.0 -3.3 None -30.3 +25.5 +1.0 +1.0
148 1588.163M 13.5 +0.0 10.7 14.0 -3.3 None -30.3 +25.5 +1.0 +1.0
149 1590.397M 13.5 +0.0 10.7 14.0 -3.3 None -30.3 +25.5 +1.0 +1.0
150 1596.391M 13.4 +0.0 10.7 14.0 -3.3 None -30.3 +25.6 +1.0 +1.0
151 1597.571M 13.4 +0.0 10.7 14.0 -3.3 None -30.3 +25.6 +1.0 +1.0
152 1598.501M 13.4 +0.0 10.7 14.0 -3.3 None -30.3 +25.6 +1.0 +1.0
153 1552.105M 13.5 +0.0 10.6 14.0 -3.4 None -30.3 +25.4 +1.0 +1.0
154 1561.204M 13.5 +0.0 10.6 14.0 -3.4 None -30.3 +25.4 +1.0 +1.0
155 1567.234M 13.4 +0.0 10.6 14.0 -3.4 None -30.3 +25.5 +1.0 +1.0
156 1567.384M 13.4 +0.0 10.6 14.0 -3.4 None -30.3 +25.5 +1.0 +1.0
157 1572.481M 13.4 +0.0 10.6 14.0 -3.4 None -30.3 +25.5 +1.0 +1.0
158 1576.345M 13.4 +0.0 10.6 14.0 -3.4 None -30.3 +25.5 +1.0 +1.0
159 1577.184M 13.4 +0.0 10.6 14.0 -3.4 None -30.3 +25.5 +1.0 +1.0
160 1579.103M 13.4 +0.0 10.6 14.0 -3.4 None -30.3 +25.5 +1.0 +1.0
161 1588.307M 13.4 +0.0 10.6 14.0 -3.4 None -30.3 +25.5 +1.0 +1.0
162 1596.193M 13.3 +0.0 10.6 14.0 -3.4 None -30.3 +25.6 +1.0 +1.0
163 1597.286M 13.3 +0.0 10.6 14.0 -3.4 None -30.3 +25.6 +1.0 +1.0
164 1597.713M 13.3 +0.0 10.6 14.0 -3.4 None -30.3 +25.6 +1.0 +1.0

Page 92 of 224Report No.: MIL05-015
165 1598.800M 13.3 +0.0 10.6 14.0 -3.4 None -30.3 +25.6 +1.0 +1.0
166 1551.943M 13.4 +0.0 10.5 14.0 -3.5 None -30.3 +25.4 +1.0 +1.0
167 1563.478M 13.4 +0.0 10.5 14.0 -3.5 None -30.3 +25.4 +1.0 +1.0
168 1564.550M 13.4 +0.0 10.5 14.0 -3.5 None -30.3 +25.4 +1.0 +1.0
169 1565.841M 13.3 +0.0 10.5 14.0 -3.5 None -30.3 +25.5 +1.0 +1.0
170 1566.682M 13.3 +0.0 10.5 14.0 -3.5 None -30.3 +25.5 +1.0 +1.0
171 1573.315M 13.3 +0.0 10.5 14.0 -3.5 None -30.3 +25.5 +1.0 +1.0
172 1573.685M 13.3 +0.0 10.5 14.0 -3.5 None -30.3 +25.5 +1.0 +1.0
173 1577.478M 13.3 +0.0 10.5 14.0 -3.5 None -30.3 +25.5 +1.0 +1.0
174 1583.757M 13.3 +0.0 10.5 14.0 -3.5 None -30.3 +25.5 +1.0 +1.0
175 1585.941M 13.3 +0.0 10.5 14.0 -3.5 None -30.3 +25.5 +1.0 +1.0
176 1586.499M 13.3 +0.0 10.5 14.0 -3.5 None -30.3 +25.5 +1.0 +1.0
177 1592.190M 13.2 +0.0 10.5 14.0 -3.5 None -30.3 +25.6 +1.0 +1.0
178 1596.538M 13.2 +0.0 10.5 14.0 -3.5 None -30.3 +25.6 +1.0 +1.0
179 1597.635M 13.2 +0.0 10.5 14.0 -3.5 None -30.3 +25.6 +1.0 +1.0
180 1597.743M 13.2 +0.0 10.5 14.0 -3.5 None -30.3 +25.6 +1.0 +1.0
181 1551.559M 13.3 +0.0 10.4 14.0 -3.6 None -30.3 +25.4 +1.0 +1.0
182 1552.006M 13.3 +0.0 10.4 14.0 -3.6 None -30.3 +25.4 +1.0 +1.0
183 1567.144M 13.2 +0.0 10.4 14.0 -3.6 None -30.3 +25.5 +1.0 +1.0
184 1575.261M 13.2 +0.0 10.4 14.0 -3.6 None -30.3 +25.5 +1.0 +1.0
185 1576.066M 13.2 +0.0 10.4 14.0 -3.6 None -30.3 +25.5 +1.0 +1.0
186 1576.796M 13.2 +0.0 10.4 14.0 -3.6 None -30.3 +25.5 +1.0 +1.0

Page 93 of 224Report No.: MIL05-015
187 1579.391M 13.2 +0.0 10.4 14.0 -3.6 None -30.3 +25.5 +1.0 +1.0
188 1584.025M 13.2 +0.0 10.4 14.0 -3.6 None -30.3 +25.5 +1.0 +1.0
189 1584.232M 13.2 +0.0 10.4 14.0 -3.6 None -30.3 +25.5 +1.0 +1.0
190 1584.313M 13.2 +0.0 10.4 14.0 -3.6 None -30.3 +25.5 +1.0 +1.0
191 1596.259M 13.1 +0.0 10.4 14.0 -3.6 None -30.3 +25.6 +1.0 +1.0
192 1564.414M 13.2 +0.0 10.3 14.0 -3.7 None -30.3 +25.4 +1.0 +1.0
193 1566.156M 13.1 +0.0 10.3 14.0 -3.7 None -30.3 +25.5 +1.0 +1.0
194 1572.679M 13.1 +0.0 10.3 14.0 -3.7 None -30.3 +25.5 +1.0 +1.0
195 1572.997M 13.1 +0.0 10.3 14.0 -3.7 None -30.3 +25.5 +1.0 +1.0
196 1573.856M 13.1 +0.0 10.3 14.0 -3.7 None -30.3 +25.5 +1.0 +1.0
197 1574.018M 13.1 +0.0 10.3 14.0 -3.7 None -30.3 +25.5 +1.0 +1.0
198 1575.541M 13.1 +0.0 10.3 14.0 -3.7 None -30.3 +25.5 +1.0 +1.0
199 1578.319M 13.1 +0.0 10.3 14.0 -3.7 None -30.3 +25.5 +1.0 +1.0
200 1584.385M 13.1 +0.0 10.3 14.0 -3.7 None -30.3 +25.5 +1.0 +1.0
201 1597.307M 13.0 +0.0 10.3 14.0 -3.7 None -30.3 +25.6 +1.0 +1.0
202 1560.682M 13.1 +0.0 10.2 14.0 -3.8 None -30.3 +25.4 +1.0 +1.0
203 1561.946M 13.1 +0.0 10.2 14.0 -3.8 None -30.3 +25.4 +1.0 +1.0
204 1564.120M 13.1 +0.0 10.2 14.0 -3.8 None -30.3 +25.4 +1.0 +1.0
205 1564.324M 13.1 +0.0 10.2 14.0 -3.8 None -30.3 +25.4 +1.0 +1.0
206 1566.015M 13.0 +0.0 10.2 14.0 -3.8 None -30.3 +25.5 +1.0 +1.0
207 1566.141M 13.0 +0.0 10.2 14.0 -3.8 None -30.3 +25.5 +1.0 +1.0
208 1566.273M 13.0 +0.0 10.2 14.0 -3.8 None -30.3 +25.5 +1.0 +1.0

Page 94 of 224Report No.: MIL05-015
209 1567.408M 13.0 +0.0 10.2 14.0 -3.8 None -30.3 +25.5 +1.0 +1.0
210 1572.391M 13.0 +0.0 10.2 14.0 -3.8 None -30.3 +25.5 +1.0 +1.0
211 1573.141M 13.0 +0.0 10.2 14.0 -3.8 None -30.3 +25.5 +1.0 +1.0
212 1573.180M 13.0 +0.0 10.2 14.0 -3.8 None -30.3 +25.5 +1.0 +1.0
213 1579.346M 13.0 +0.0 10.2 14.0 -3.8 None -30.3 +25.5 +1.0 +1.0
214 1551.691M 13.0 +0.0 10.1 14.0 -3.9 None -30.3 +25.4 +1.0 +1.0
215 1567.024M 12.9 +0.0 10.1 14.0 -3.9 None -30.3 +25.5 +1.0 +1.0
216 1572.069M 12.9 +0.0 10.1 14.0 -3.9 None -30.3 +25.5 +1.0 +1.0
217 1572.243M 12.9 +0.0 10.1 14.0 -3.9 None -30.3 +25.5 +1.0 +1.0
218 1573.069M 12.9 +0.0 10.1 14.0 -3.9 None -30.3 +25.5 +1.0 +1.0
219 1576.529M 12.9 +0.0 10.1 14.0 -3.9 None -30.3 +25.5 +1.0 +1.0
220 1576.541M 12.9 +0.0 10.1 14.0 -3.9 None -30.3 +25.5 +1.0 +1.0
221 1576.874M 12.9 +0.0 10.1 14.0 -3.9 None -30.3 +25.5 +1.0 +1.0
222 1578.388M 12.9 +0.0 10.1 14.0 -3.9 None -30.3 +25.5 +1.0 +1.0
223 1551.850M 12.9 +0.0 10.0 14.0 -4.0 None -30.3 +25.4 +1.0 +1.0
224 1551.901M 12.9 +0.0 10.0 14.0 -4.0 None -30.3 +25.4 +1.0 +1.0
225 1567.453M 12.8 +0.0 10.0 14.0 -4.0 None -30.3 +25.5 +1.0 +1.0
226 1571.724M 12.8 +0.0 10.0 14.0 -4.0 None -30.3 +25.5 +1.0 +1.0
227 1571.934M 12.8 +0.0 10.0 14.0 -4.0 None -30.3 +25.5 +1.0 +1.0
228 1577.000M 12.8 +0.0 10.0 14.0 -4.0 None -30.3 +25.5 +1.0 +1.0
229 1578.475M 12.8 +0.0 10.0 14.0 -4.0 None -30.3 +25.5 +1.0 +1.0
230 1579.316M 12.8 +0.0 10.0 14.0 -4.0 None -30.3 +25.5 +1.0 +1.0
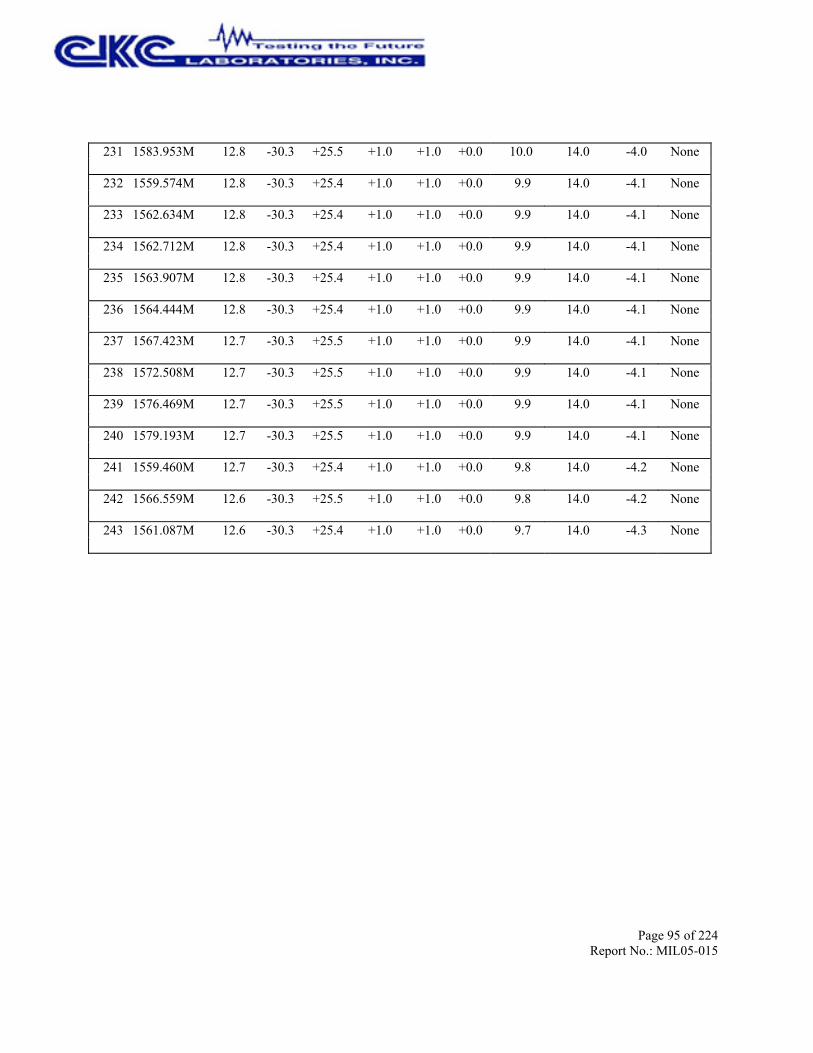
Page 95 of 224Report No.: MIL05-015
231 1583.953M 12.8 +0.0 10.0 14.0 -4.0 None -30.3 +25.5 +1.0 +1.0
232 1559.574M 12.8 +0.0 9.9 14.0 -4.1 None -30.3 +25.4 +1.0 +1.0
233 1562.634M 12.8 +0.0 9.9 14.0 -4.1 None -30.3 +25.4 +1.0 +1.0
234 1562.712M 12.8 +0.0 9.9 14.0 -4.1 None -30.3 +25.4 +1.0 +1.0
235 1563.907M 12.8 +0.0 9.9 14.0 -4.1 None -30.3 +25.4 +1.0 +1.0
236 1564.444M 12.8 +0.0 9.9 14.0 -4.1 None -30.3 +25.4 +1.0 +1.0
237 1567.423M 12.7 +0.0 9.9 14.0 -4.1 None -30.3 +25.5 +1.0 +1.0
238 1572.508M 12.7 +0.0 9.9 14.0 -4.1 None -30.3 +25.5 +1.0 +1.0
239 1576.469M 12.7 +0.0 9.9 14.0 -4.1 None -30.3 +25.5 +1.0 +1.0
240 1579.193M 12.7 +0.0 9.9 14.0 -4.1 None -30.3 +25.5 +1.0 +1.0
241 1559.460M 12.7 +0.0 9.8 14.0 -4.2 None -30.3 +25.4 +1.0 +1.0
242 1566.559M 12.6 +0.0 9.8 14.0 -4.2 None -30.3 +25.5 +1.0 +1.0
243 1561.087M 12.6 +0.0 9.7 14.0 -4.3 None -30.3 +25.4 +1.0 +1.0
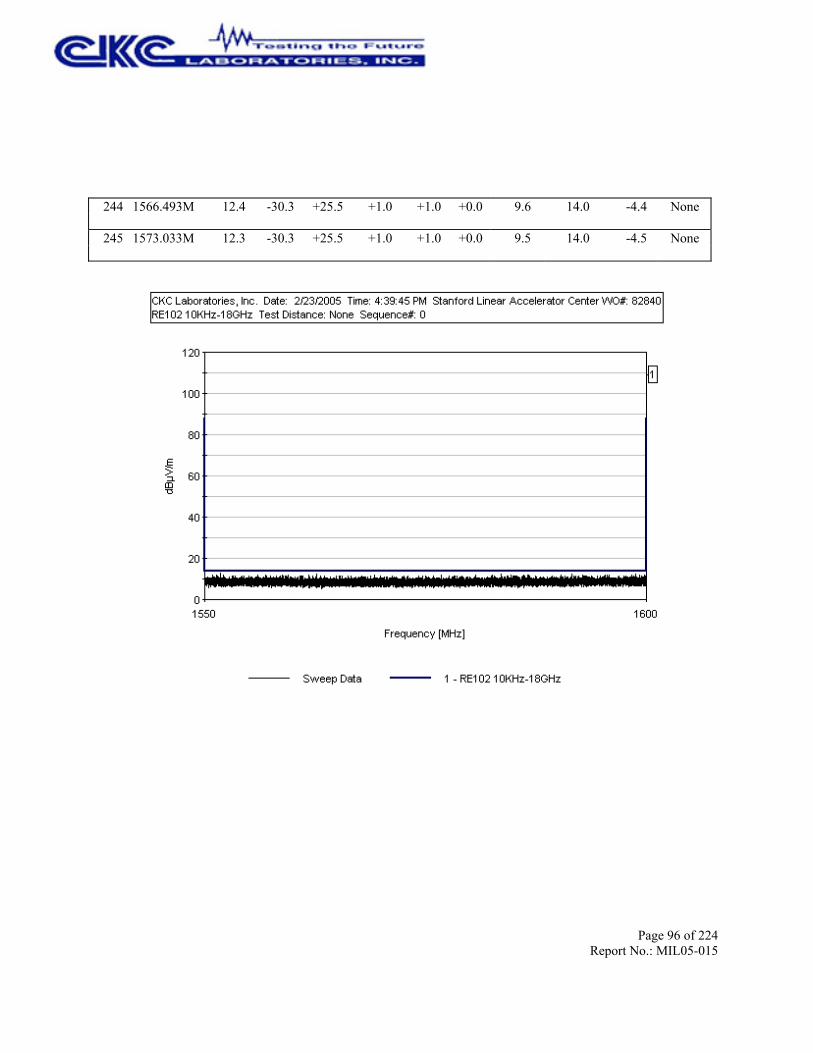
Page 96 of 224Report No.: MIL05-015
244 1566.493M 12.4 +0.0 9.6 14.0 -4.4 None -30.3 +25.5 +1.0 +1.0
245 1573.033M 12.3 +0.0 9.5 14.0 -4.5 None -30.3 +25.5 +1.0 +1.0

Page 97 of 224Report No.: MIL05-015
Test Location: CKC Laboratories, Inc. •1120 Fulton Place • Fremont, CA 94539 • (510) 249 - 1170
Customer: Stanford Linear Accelerator CenterSpecification: RE102 10KHz-18GHzWork Order #: 82840 Date: 2/23/2005Test Type: Radiated Scan Time: 4:47:34 PMEquipment: Sequence#: 0Manufacturer: Tested By: A. BrarModel:S/N:Equipment Under Test (* = UUT):
Function Manufacturer Model # S/N
Support Devices:Function Manufacturer Model # S/N
Test Conditions / Notes:Path Check Sweep. Signal at 1000MHz. 109(spec limit) - 6dB - 45.2 (Antenna Factor) = -49.2dBm signal level.
Transducer Legend:T1=AMP AN00941A 50GHzT3=ANP05200 1-40GHz
T2=Horn Antenna 4660 (Fremont)T4=ANP5201 1-40GHz
Measurement Data: Reading listed by margin. Test Distance: None# Freq Rdng T1 T2 T3 T4 Dist Corr Spec Margin Polar
MHz dBµV dB dB dB dB Table dBµV/m dBµV/m dB Ant 1 1769.063M 42.2 +0.0 40.5 89.0 -48.5 None -30.1 +26.2 +1.1 +1.1
2 1669.385M 41.8 +0.0 39.4 88.4 -49.0 None -30.2 +25.8 +1.0 +1.0
3 1607.942M 41.5 +0.0 38.8 88.0 -49.2 None -30.3 +25.6 +1.0 +1.0
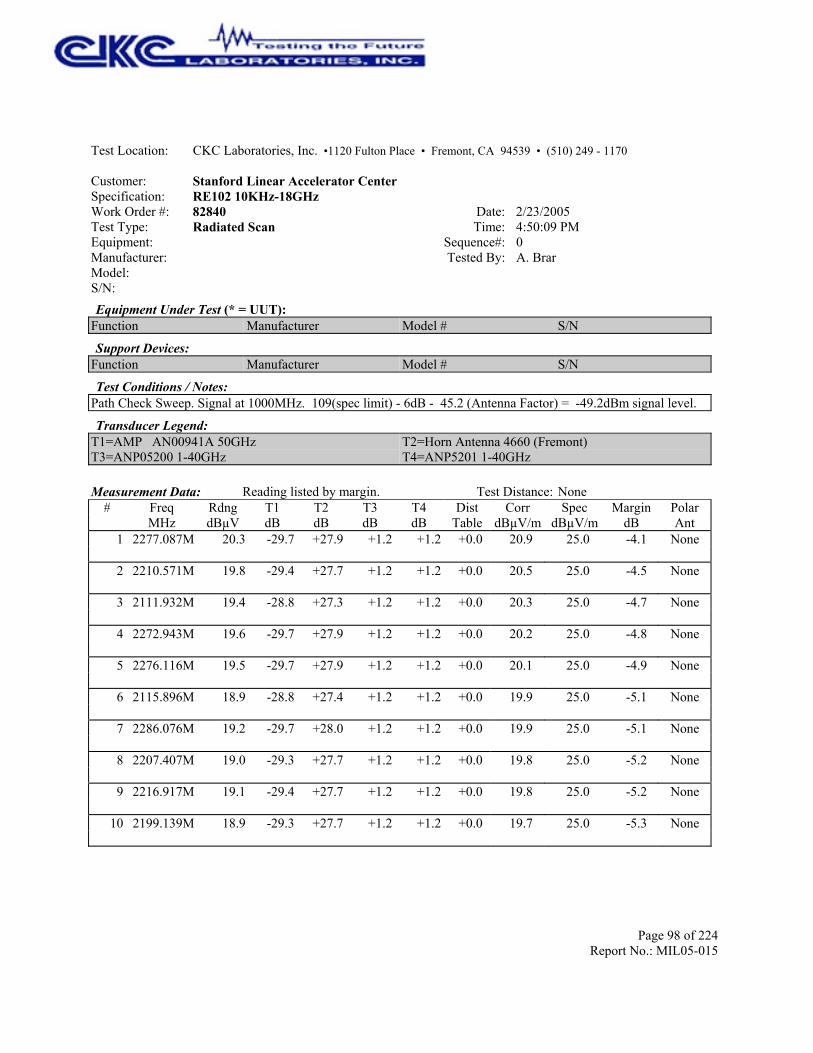
Page 98 of 224Report No.: MIL05-015
Test Location: CKC Laboratories, Inc. •1120 Fulton Place • Fremont, CA 94539 • (510) 249 - 1170
Customer: Stanford Linear Accelerator CenterSpecification: RE102 10KHz-18GHzWork Order #: 82840 Date: 2/23/2005Test Type: Radiated Scan Time: 4:50:09 PMEquipment: Sequence#: 0Manufacturer: Tested By: A. BrarModel:S/N:Equipment Under Test (* = UUT):
Function Manufacturer Model # S/N
Support Devices:Function Manufacturer Model # S/N
Test Conditions / Notes:Path Check Sweep. Signal at 1000MHz. 109(spec limit) - 6dB - 45.2 (Antenna Factor) = -49.2dBm signal level.
Transducer Legend:T1=AMP AN00941A 50GHzT3=ANP05200 1-40GHz
T2=Horn Antenna 4660 (Fremont)T4=ANP5201 1-40GHz
Measurement Data: Reading listed by margin. Test Distance: None# Freq Rdng T1 T2 T3 T4 Dist Corr Spec Margin Polar
MHz dBµV dB dB dB dB Table dBµV/m dBµV/m dB Ant 1 2277.087M 20.3 +0.0 20.9 25.0 -4.1 None -29.7 +27.9 +1.2 +1.2
2 2210.571M 19.8 +0.0 20.5 25.0 -4.5 None -29.4 +27.7 +1.2 +1.2
3 2111.932M 19.4 +0.0 20.3 25.0 -4.7 None -28.8 +27.3 +1.2 +1.2
4 2272.943M 19.6 +0.0 20.2 25.0 -4.8 None -29.7 +27.9 +1.2 +1.2
5 2276.116M 19.5 +0.0 20.1 25.0 -4.9 None -29.7 +27.9 +1.2 +1.2
6 2115.896M 18.9 +0.0 19.9 25.0 -5.1 None -28.8 +27.4 +1.2 +1.2
7 2286.076M 19.2 +0.0 19.9 25.0 -5.1 None -29.7 +28.0 +1.2 +1.2
8 2207.407M 19.0 +0.0 19.8 25.0 -5.2 None -29.3 +27.7 +1.2 +1.2
9 2216.917M 19.1 +0.0 19.8 25.0 -5.2 None -29.4 +27.7 +1.2 +1.2
10 2199.139M 18.9 +0.0 19.7 25.0 -5.3 None -29.3 +27.7 +1.2 +1.2

Page 99 of 224Report No.: MIL05-015
11 2293.952M 19.1 +0.0 19.7 25.0 -5.3 None -29.8 +28.0 +1.2 +1.2
12 2177.978M 18.8 +0.0 19.6 25.0 -5.4 None -29.2 +27.6 +1.2 +1.2
13 2187.457M 18.8 +0.0 19.6 25.0 -5.4 None -29.2 +27.6 +1.2 +1.2
14 2193.934M 18.9 +0.0 19.6 25.0 -5.4 None -29.3 +27.6 +1.2 +1.2
15 2277.917M 19.0 +0.0 19.6 25.0 -5.4 None -29.7 +27.9 +1.2 +1.2
16 2284.565M 18.9 +0.0 19.6 25.0 -5.4 None -29.7 +28.0 +1.2 +1.2
17 2173.784M 18.6 +0.0 19.5 25.0 -5.5 None -29.1 +27.6 +1.2 +1.2
18 2199.329M 18.7 +0.0 19.5 25.0 -5.5 None -29.3 +27.7 +1.2 +1.2
19 2201.191M 18.7 +0.0 19.5 25.0 -5.5 None -29.3 +27.7 +1.2 +1.2
20 2281.341M 18.8 +0.0 19.5 25.0 -5.5 None -29.7 +28.0 +1.2 +1.2
21 2289.740M 18.8 +0.0 19.5 25.0 -5.5 None -29.7 +28.0 +1.2 +1.2
22 2044.855M 18.9 +0.0 19.4 25.0 -5.6 None -28.9 +27.1 +1.1 +1.2
23 2128.628M 18.5 +0.0 19.4 25.0 -5.6 None -28.9 +27.4 +1.2 +1.2
24 2211.491M 18.7 +0.0 19.4 25.0 -5.6 None -29.4 +27.7 +1.2 +1.2
25 2226.236M 18.6 +0.0 19.4 25.0 -5.6 None -29.4 +27.8 +1.2 +1.2
26 2287.137M 18.7 +0.0 19.4 25.0 -5.6 None -29.7 +28.0 +1.2 +1.2
27 2299.782M 18.8 +0.0 19.4 25.0 -5.6 None -29.8 +28.0 +1.2 +1.2
28 2279.859M 18.6 +0.0 19.3 25.0 -5.7 None -29.7 +28.0 +1.2 +1.2

Page 100 of 224Report No.: MIL05-015
29 2293.004M 18.7 +0.0 19.3 25.0 -5.7 None -29.8 +28.0 +1.2 +1.2
30 2294.189M 18.7 +0.0 19.3 25.0 -5.7 None -29.8 +28.0 +1.2 +1.2

Page 101 of 224Report No.: MIL05-015
Test Location: CKC Laboratories, Inc. •1120 Fulton Place • Fremont, CA 94539 • (510) 249 - 1170
Customer: Stanford Linear Accelerator CenterSpecification: RE102 10KHz-18GHzWork Order #: 82840 Date: 2/23/2005Test Type: Radiated Scan Time: 4:54:25 PMEquipment: Sequence#: 0Manufacturer: Tested By: A. BrarModel:S/N:Equipment Under Test (* = UUT):
Function Manufacturer Model # S/N
Support Devices:Function Manufacturer Model # S/N
Test Conditions / Notes:Path Check Sweep. Signal at 1000MHz. 109(spec limit) - 6dB - 45.2 (Antenna Factor) = -49.2dBm signal level.
Transducer Legend:T1=AMP AN00941A 50GHzT3=ANP05200 1-40GHz
T2=Horn Antenna 4660 (Fremont)T4=ANP5201 1-40GHz
Measurement Data: Reading listed by margin. Test Distance: None# Freq Rdng T1 T2 T3 T4 Dist Corr Spec Margin Polar
MHz dBµV dB dB dB dB Table dBµV/m dBµV/m dB Ant 1 17999.310M 78.9 +0.0 102.3 109.0 -6.7 None -29.6 +45.2 +3.6 +4.2
2 10295.990M 40.3 +0.0 58.0 103.8 -45.8 None -27.3 +39.4 +2.6 +3.0
3 13392.080M 40.4 +0.0 59.5 106.3 -46.8 None -30.2 +42.9 +3.0 +3.4
4 10317.010M 39.0 +0.0 56.7 103.9 -47.2 None -27.3 +39.4 +2.6 +3.0
5 13838.530M 40.0 +0.0 59.3 106.6 -47.3 None -30.6 +43.4 +3.1 +3.4
6 12777.470M 40.0 +0.0 58.2 105.8 -47.6 None -29.2 +41.3 +2.9 +3.2
7 14454.140M 40.1 +0.0 59.4 107.0 -47.6 None -30.8 +43.4 +3.2 +3.5
8 3240.940M 40.7 +0.0 45.2 93.2 -48.0 None -29.1 +30.7 +1.4 +1.5
9 3902.601M 41.0 +0.0 46.9 94.9 -48.0 None -29.5 +32.3 +1.5 +1.6
10 5480.177M 39.5 +0.0 50.0 98.0 -48.0 None -28.3 +35.0 +1.8 +2.0
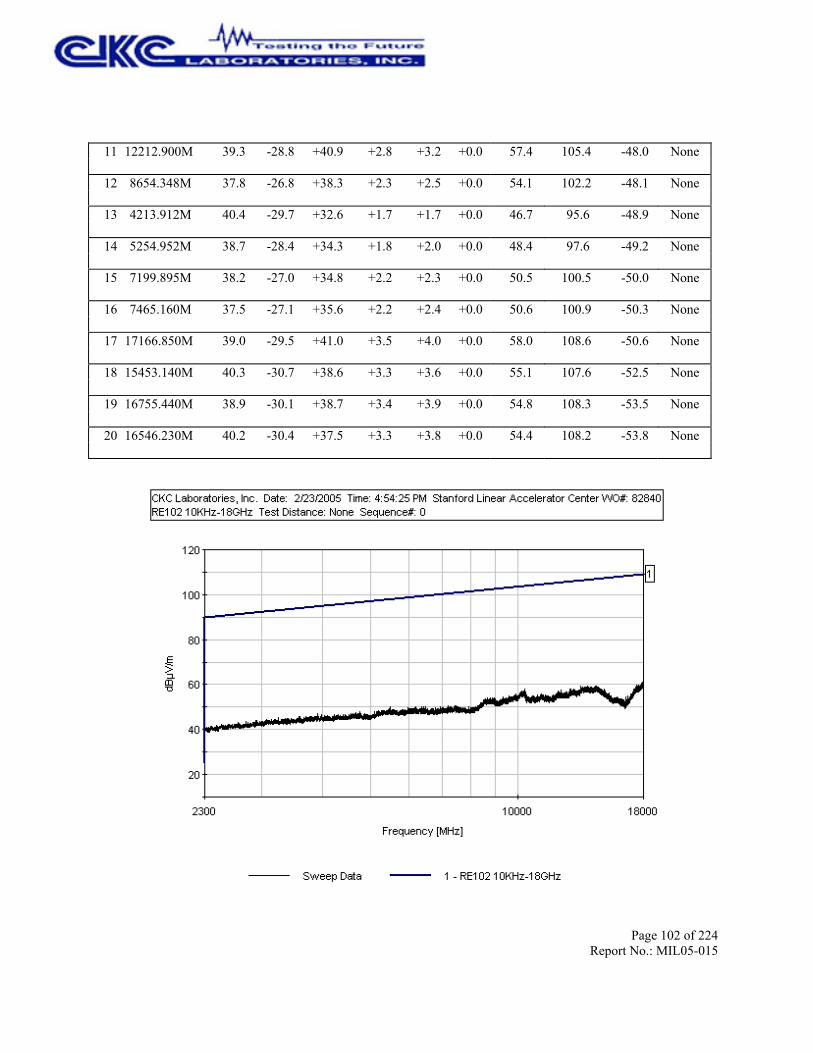
Page 102 of 224Report No.: MIL05-015
11 12212.900M 39.3 +0.0 57.4 105.4 -48.0 None -28.8 +40.9 +2.8 +3.2
12 8654.348M 37.8 +0.0 54.1 102.2 -48.1 None -26.8 +38.3 +2.3 +2.5
13 4213.912M 40.4 +0.0 46.7 95.6 -48.9 None -29.7 +32.6 +1.7 +1.7
14 5254.952M 38.7 +0.0 48.4 97.6 -49.2 None -28.4 +34.3 +1.8 +2.0
15 7199.895M 38.2 +0.0 50.5 100.5 -50.0 None -27.0 +34.8 +2.2 +2.3
16 7465.160M 37.5 +0.0 50.6 100.9 -50.3 None -27.1 +35.6 +2.2 +2.4
17 17166.850M 39.0 +0.0 58.0 108.6 -50.6 None -29.5 +41.0 +3.5 +4.0
18 15453.140M 40.3 +0.0 55.1 107.6 -52.5 None -30.7 +38.6 +3.3 +3.6
19 16755.440M 38.9 +0.0 54.8 108.3 -53.5 None -30.1 +38.7 +3.4 +3.9
20 16546.230M 40.2 +0.0 54.4 108.2 -53.8 None -30.4 +37.5 +3.3 +3.8

Page 103 of 224Report No.: MIL05-015
Test Location: CKC Laboratories, Inc. •1120 Fulton Place • Fremont, CA 94539 • (510) 249 - 1170
Customer: Stanford Linear Accelerator CenterSpecification: RE102 10KHz-18GHzWork Order #: 82840 Date: 2/23/2005Test Type: Radiated Scan Time: 4:12:55 PMEquipment: Sequence#: 0Manufacturer: Tested By: A. BrarModel:S/N:Equipment Under Test (* = UUT):
Function Manufacturer Model # S/N
Support Devices:Function Manufacturer Model # S/N
Test Conditions / Notes:Path Check Sweep. Signal at 1000MHz. 109(spec limit) - 6dB - 45.2 (Antenna Factor) = -49.2dBm signal level.
Transducer Legend:T1=AMP AN00941A 50GHzT3=ANP05200 1-40GHz
T2=Horn Antenna 4660 (Fremont)T4=ANP5201 1-40GHz
Measurement Data: Reading listed by margin. Test Distance: None# Freq Rdng T1 T2 T3 T4 Dist Corr Spec Margin Polar
MHz dBµV dB dB dB dB Table dBµV/m dBµV/m dB Ant 1 1587.698M 20.8 +0.0 18.0 14.0 +4.0 None -30.3 +25.5 +1.0 +1.0
2 1552.753M 20.7 +0.0 17.8 14.0 +3.8 None -30.3 +25.4 +1.0 +1.0
3 1554.354M 20.5 +0.0 17.6 14.0 +3.6 None -30.3 +25.4 +1.0 +1.0
4 1597.102M 20.3 +0.0 17.6 14.0 +3.6 None -30.3 +25.6 +1.0 +1.0
5 1577.528M 20.3 +0.0 17.5 14.0 +3.5 None -30.3 +25.5 +1.0 +1.0
6 1550.080M 20.1 +0.0 17.2 14.0 +3.2 None -30.3 +25.4 +1.0 +1.0
7 1556.657M 19.9 +0.0 17.0 14.0 +3.0 None -30.3 +25.4 +1.0 +1.0
8 1562.653M 19.9 +0.0 17.0 14.0 +3.0 None -30.3 +25.4 +1.0 +1.0
9 1557.007M 19.8 +0.0 16.9 14.0 +2.9 None -30.3 +25.4 +1.0 +1.0
10 1568.899M 19.7 +0.0 16.9 14.0 +2.9 None -30.3 +25.5 +1.0 +1.0

Page 104 of 224Report No.: MIL05-015
11 1553.724M 19.7 +0.0 16.8 14.0 +2.8 None -30.3 +25.4 +1.0 +1.0
12 1564.464M 19.7 +0.0 16.8 14.0 +2.8 None -30.3 +25.4 +1.0 +1.0
13 1569.369M 19.6 +0.0 16.8 14.0 +2.8 None -30.3 +25.5 +1.0 +1.0
14 1562.022M 19.6 +0.0 16.7 14.0 +2.7 None -30.3 +25.4 +1.0 +1.0
15 1562.112M 19.4 +0.0 16.5 14.0 +2.5 None -30.3 +25.4 +1.0 +1.0
16 2280.390M 25.3 +0.0 26.0 25.0 +1.0 None -29.7 +28.0 +1.2 +1.2
17 2188.198M 24.9 +0.0 25.7 25.0 +0.7 None -29.2 +27.6 +1.2 +1.2
18 2296.395M 24.9 +0.0 25.5 25.0 +0.5 None -29.8 +28.0 +1.2 +1.2
19 2297.661M 24.6 +0.0 25.2 25.0 +0.2 None -29.8 +28.0 +1.2 +1.2
20 2281.232M 24.0 +0.0 24.7 25.0 -0.3 None -29.7 +28.0 +1.2 +1.2
21 2288.170M 24.0 +0.0 24.7 25.0 -0.3 None -29.7 +28.0 +1.2 +1.2
22 2291.678M 24.1 +0.0 24.7 25.0 -0.3 None -29.8 +28.0 +1.2 +1.2
23 2016.366M 24.1 +0.0 24.5 25.0 -0.5 None -28.9 +27.0 +1.1 +1.2
24 2188.018M 23.7 +0.0 24.5 25.0 -0.5 None -29.2 +27.6 +1.2 +1.2
25 2224.865M 23.7 +0.0 24.5 25.0 -0.5 None -29.4 +27.8 +1.2 +1.2
26 2232.612M 23.8 +0.0 24.5 25.0 -0.5 None -29.5 +27.8 +1.2 +1.2
27 2290.606M 23.9 +0.0 24.5 25.0 -0.5 None -29.8 +28.0 +1.2 +1.2
28 2293.549M 23.9 +0.0 24.5 25.0 -0.5 None -29.8 +28.0 +1.2 +1.2

Page 105 of 224Report No.: MIL05-015
29 2269.820M 23.8 +0.0 24.4 25.0 -0.6 None -29.7 +27.9 +1.2 +1.2
30 2297.252M 23.8 +0.0 24.4 25.0 -0.6 None -29.8 +28.0 +1.2 +1.2
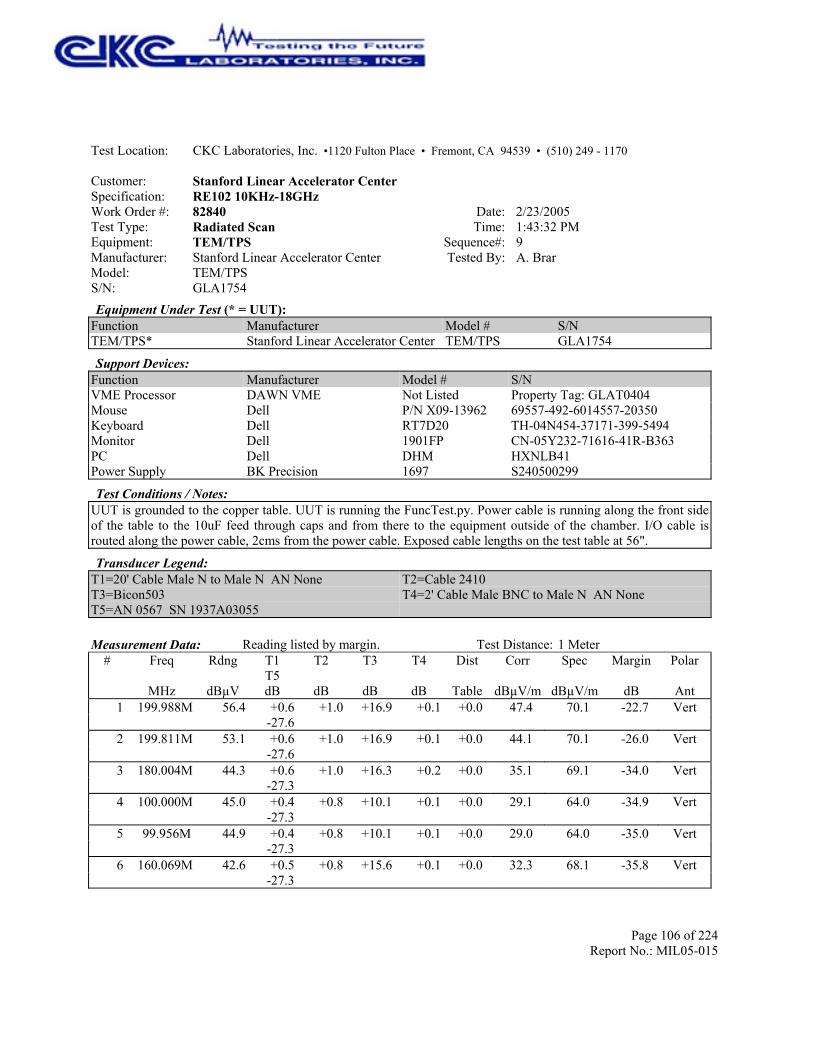
Page 106 of 224Report No.: MIL05-015
Test Location: CKC Laboratories, Inc. •1120 Fulton Place • Fremont, CA 94539 • (510) 249 - 1170
Customer: Stanford Linear Accelerator CenterSpecification: RE102 10KHz-18GHzWork Order #: 82840 Date: 2/23/2005Test Type: Radiated Scan Time: 1:43:32 PMEquipment: TEM/TPS Sequence#: 9Manufacturer: Stanford Linear Accelerator Center Tested By: A. BrarModel: TEM/TPSS/N: GLA1754Equipment Under Test (* = UUT):
Function Manufacturer Model # S/NTEM/TPS* Stanford Linear Accelerator Center TEM/TPS GLA1754
Support Devices:Function Manufacturer Model # S/NVME Processor DAWN VME Not Listed Property Tag: GLAT0404Mouse Dell P/N X09-13962 69557-492-6014557-20350Keyboard Dell RT7D20 TH-04N454-37171-399-5494Monitor Dell 1901FP CN-05Y232-71616-41R-B363PC Dell DHM HXNLB41Power Supply BK Precision 1697 S240500299
Test Conditions / Notes:UUT is grounded to the copper table. UUT is running the FuncTest.py. Power cable is running along the front sideof the table to the 10uF feed through caps and from there to the equipment outside of the chamber. I/O cable isrouted along the power cable, 2cms from the power cable. Exposed cable lengths on the test table at 56".
Transducer Legend:T1=20' Cable Male N to Male N AN NoneT3=Bicon503T5=AN 0567 SN 1937A03055
T2=Cable 2410T4=2' Cable Male BNC to Male N AN None
Measurement Data: Reading listed by margin. Test Distance: 1 Meter# Freq Rdng T1
T5T2 T3 T4 Dist Corr Spec Margin Polar
MHz dBµV dB dB dB dB Table dBµV/m dBµV/m dB Ant 1 199.988M 56.4 +0.0 47.4 70.1 -22.7 Vert +0.6
-27.6 +1.0 +16.9 +0.1
2 199.811M 53.1 +0.0 44.1 70.1 -26.0 Vert +0.6 -27.6
+1.0 +16.9 +0.1
3 180.004M 44.3 +0.0 35.1 69.1 -34.0 Vert +0.6 -27.3
+1.0 +16.3 +0.2
4 100.000M 45.0 +0.0 29.1 64.0 -34.9 Vert +0.4 -27.3
+0.8 +10.1 +0.1
5 99.956M 44.9 +0.0 29.0 64.0 -35.0 Vert +0.4 -27.3
+0.8 +10.1 +0.1
6 160.069M 42.6 +0.0 32.3 68.1 -35.8 Vert +0.5 -27.3
+0.8 +15.6 +0.1
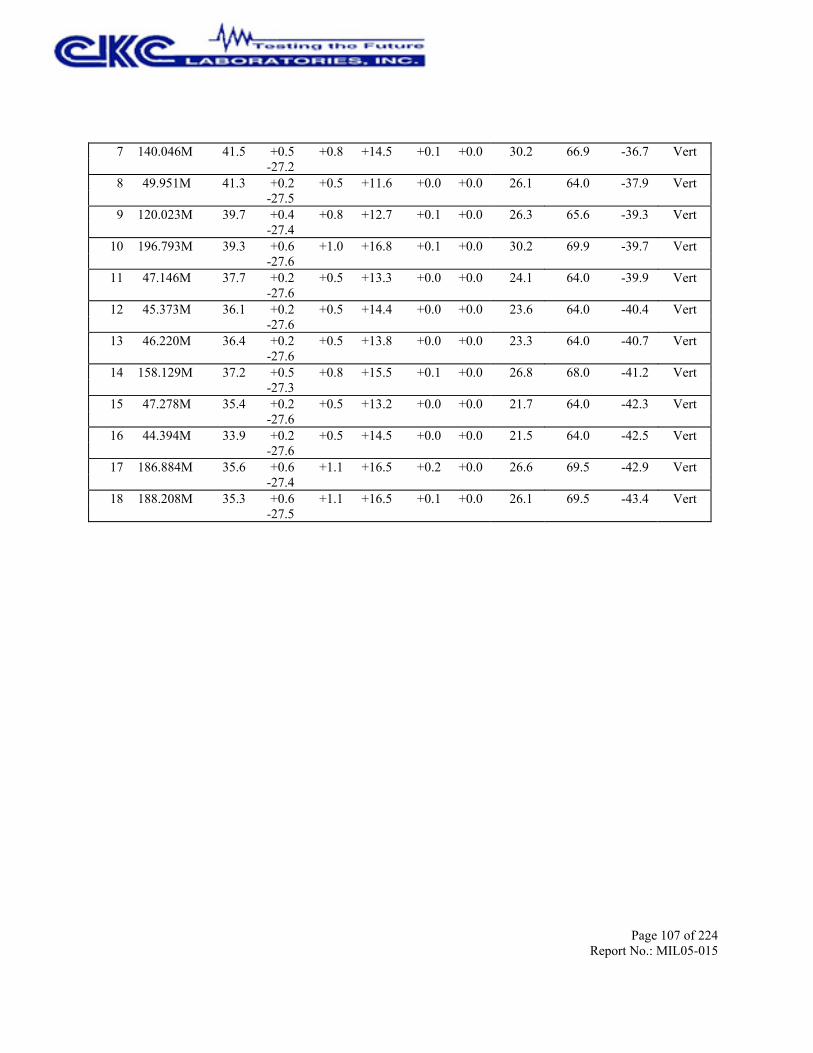
Page 107 of 224Report No.: MIL05-015
7 140.046M 41.5 +0.0 30.2 66.9 -36.7 Vert +0.5 -27.2
+0.8 +14.5 +0.1
8 49.951M 41.3 +0.0 26.1 64.0 -37.9 Vert +0.2 -27.5
+0.5 +11.6 +0.0
9 120.023M 39.7 +0.0 26.3 65.6 -39.3 Vert +0.4 -27.4
+0.8 +12.7 +0.1
10 196.793M 39.3 +0.0 30.2 69.9 -39.7 Vert +0.6 -27.6
+1.0 +16.8 +0.1
11 47.146M 37.7 +0.0 24.1 64.0 -39.9 Vert +0.2 -27.6
+0.5 +13.3 +0.0
12 45.373M 36.1 +0.0 23.6 64.0 -40.4 Vert +0.2 -27.6
+0.5 +14.4 +0.0
13 46.220M 36.4 +0.0 23.3 64.0 -40.7 Vert +0.2 -27.6
+0.5 +13.8 +0.0
14 158.129M 37.2 +0.0 26.8 68.0 -41.2 Vert +0.5 -27.3
+0.8 +15.5 +0.1
15 47.278M 35.4 +0.0 21.7 64.0 -42.3 Vert +0.2 -27.6
+0.5 +13.2 +0.0
16 44.394M 33.9 +0.0 21.5 64.0 -42.5 Vert +0.2 -27.6
+0.5 +14.5 +0.0
17 186.884M 35.6 +0.0 26.6 69.5 -42.9 Vert +0.6 -27.4
+1.1 +16.5 +0.2
18 188.208M 35.3 +0.0 26.1 69.5 -43.4 Vert +0.6 -27.5
+1.1 +16.5 +0.1
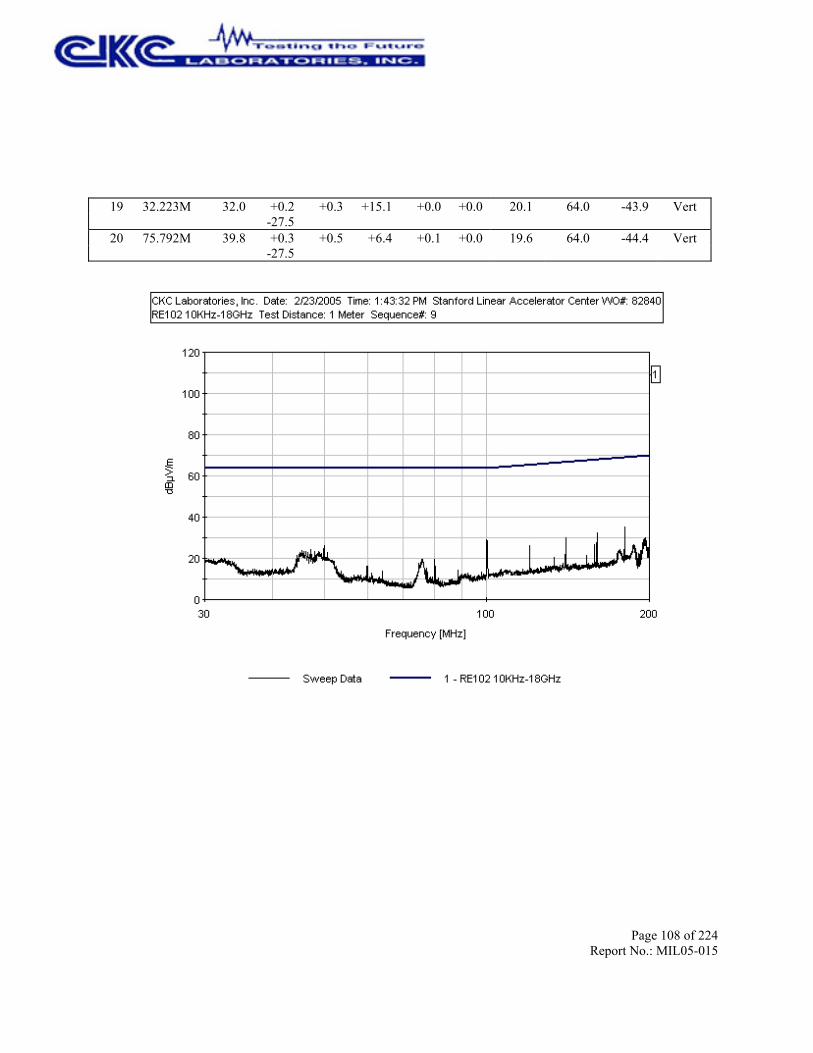
Page 108 of 224Report No.: MIL05-015
19 32.223M 32.0 +0.0 20.1 64.0 -43.9 Vert +0.2 -27.5
+0.3 +15.1 +0.0
20 75.792M 39.8 +0.0 19.6 64.0 -44.4 Vert +0.3 -27.5
+0.5 +6.4 +0.1

Page 109 of 224Report No.: MIL05-015
Test Location: CKC Laboratories, Inc. •1120 Fulton Place • Fremont, CA 94539 • (510) 249 - 1170
Customer: Stanford Linear Accelerator CenterSpecification: RE102 10KHz-18GHzWork Order #: 82840 Date: 2/23/2005Test Type: Radiated Scan Time: 1:47:45 PMEquipment: TEM/TPS Sequence#: 10Manufacturer: Stanford Linear Accelerator Center Tested By: A. BrarModel: TEM/TPSS/N: GLA1754Equipment Under Test (* = UUT):
Function Manufacturer Model # S/NTEM/TPS* Stanford Linear Accelerator Center TEM/TPS GLA1754
Support Devices:Function Manufacturer Model # S/NVME Processor DAWN VME Not Listed Property Tag: GLAT0404Mouse Dell P/N X09-13962 69557-492-6014557-20350Keyboard Dell RT7D20 TH-04N454-37171-399-5494Monitor Dell 1901FP CN-05Y232-71616-41R-B363PC Dell DHM HXNLB41Power Supply BK Precision 1697 S240500299
Test Conditions / Notes:UUT is grounded to the copper table. UUT is running the FuncTest.py. Power cable is running along the front sideof the table to the 10uF feed through caps and from there to the equipment outside of the chamber. I/O cable isrouted along the power cable, 2cms from the power cable. Exposed cable lengths on the test table at 56".
Transducer Legend:T1=20' Cable Male N to Male N AN NoneT3=Bicon503T5=AN 0567 SN 1937A03055
T2=Cable 2410T4=2' Cable Male BNC to Male N AN None
Measurement Data: Reading listed by margin. Test Distance: 1 Meter# Freq Rdng T1
T5T2 T3 T4 Dist Corr Spec Margin Polar
MHz dBµV dB dB dB dB Table dBµV/m dBµV/m dB Ant 1 199.953M 54.5 +0.0 45.5 70.1 -24.6 Horiz +0.6
-27.6 +1.0 +16.9 +0.1
2 80.015M 56.4 +0.0 36.2 64.0 -27.8 Horiz +0.3 -27.5
+0.6 +6.3 +0.1
3 120.023M 48.6 +0.0 35.2 65.6 -30.4 Horiz +0.4 -27.4
+0.8 +12.7 +0.1
4 45.558M 44.1 +0.0 31.4 64.0 -32.6 Horiz +0.2 -27.6
+0.5 +14.2 +0.0
5 180.004M 45.7 +0.0 36.5 69.1 -32.6 Horiz +0.6 -27.3
+1.0 +16.3 +0.2
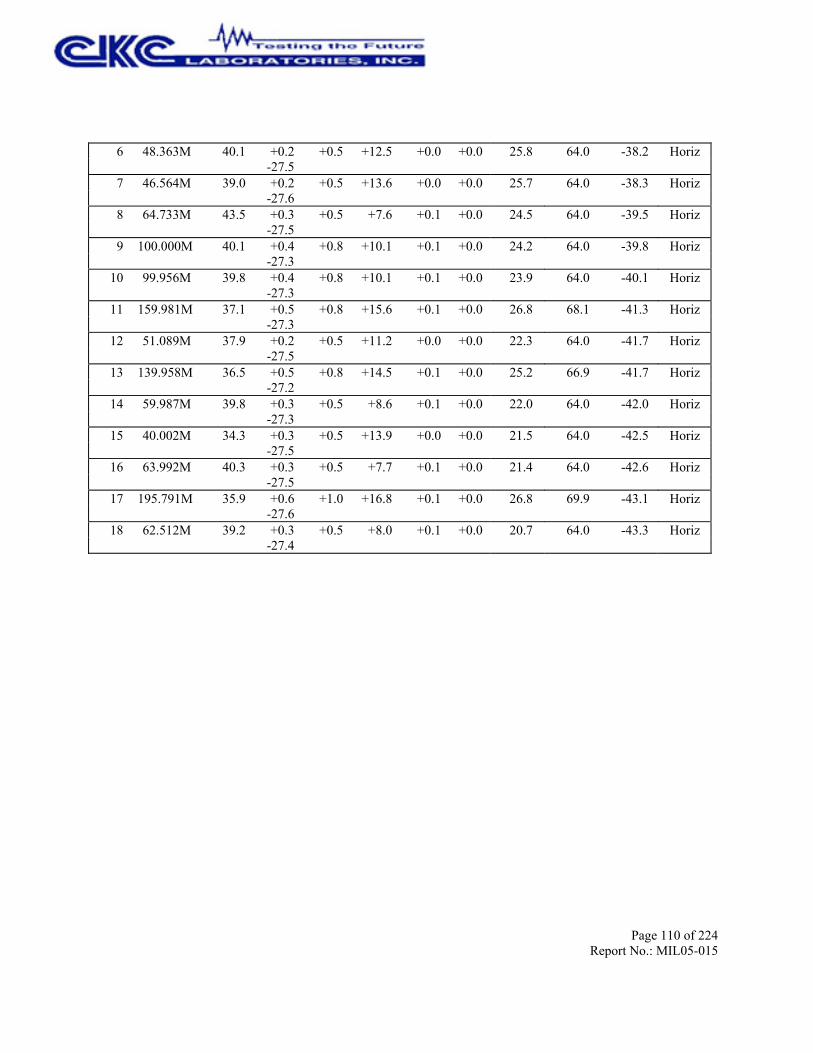
Page 110 of 224Report No.: MIL05-015
6 48.363M 40.1 +0.0 25.8 64.0 -38.2 Horiz +0.2 -27.5
+0.5 +12.5 +0.0
7 46.564M 39.0 +0.0 25.7 64.0 -38.3 Horiz +0.2 -27.6
+0.5 +13.6 +0.0
8 64.733M 43.5 +0.0 24.5 64.0 -39.5 Horiz +0.3 -27.5
+0.5 +7.6 +0.1
9 100.000M 40.1 +0.0 24.2 64.0 -39.8 Horiz +0.4 -27.3
+0.8 +10.1 +0.1
10 99.956M 39.8 +0.0 23.9 64.0 -40.1 Horiz +0.4 -27.3
+0.8 +10.1 +0.1
11 159.981M 37.1 +0.0 26.8 68.1 -41.3 Horiz +0.5 -27.3
+0.8 +15.6 +0.1
12 51.089M 37.9 +0.0 22.3 64.0 -41.7 Horiz +0.2 -27.5
+0.5 +11.2 +0.0
13 139.958M 36.5 +0.0 25.2 66.9 -41.7 Horiz +0.5 -27.2
+0.8 +14.5 +0.1
14 59.987M 39.8 +0.0 22.0 64.0 -42.0 Horiz +0.3 -27.3
+0.5 +8.6 +0.1
15 40.002M 34.3 +0.0 21.5 64.0 -42.5 Horiz +0.3 -27.5
+0.5 +13.9 +0.0
16 63.992M 40.3 +0.0 21.4 64.0 -42.6 Horiz +0.3 -27.5
+0.5 +7.7 +0.1
17 195.791M 35.9 +0.0 26.8 69.9 -43.1 Horiz +0.6 -27.6
+1.0 +16.8 +0.1
18 62.512M 39.2 +0.0 20.7 64.0 -43.3 Horiz +0.3 -27.4
+0.5 +8.0 +0.1
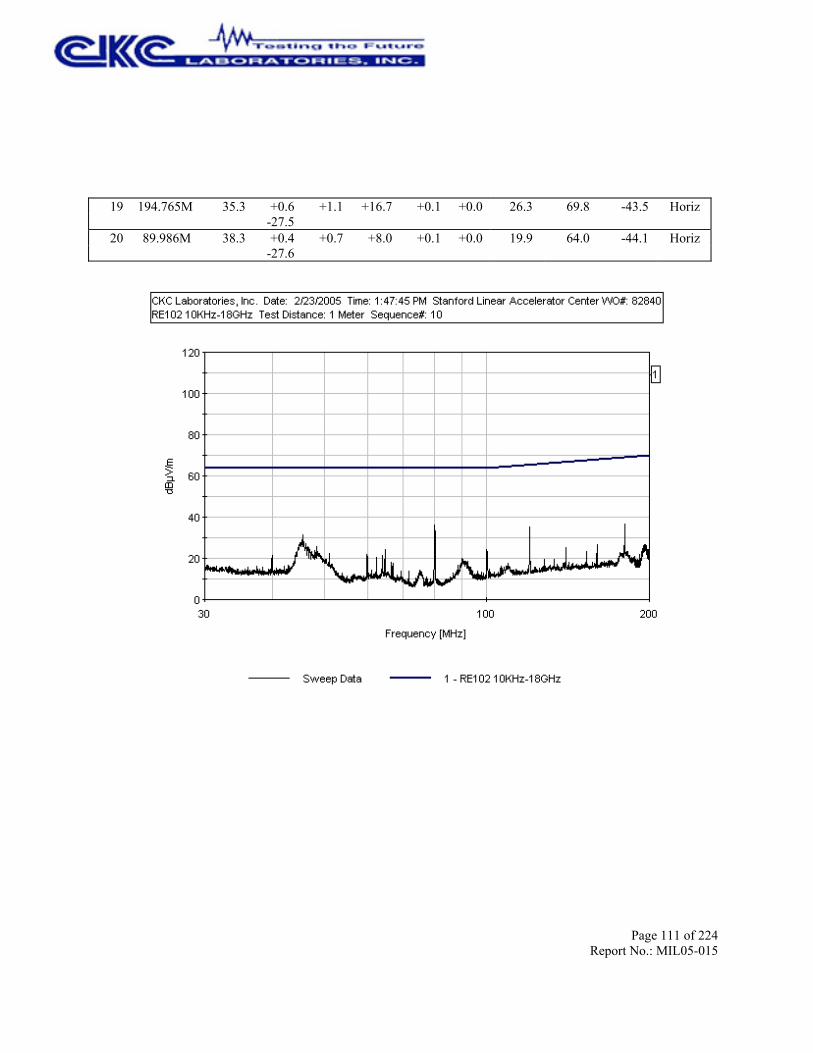
Page 111 of 224Report No.: MIL05-015
19 194.765M 35.3 +0.0 26.3 69.8 -43.5 Horiz +0.6 -27.5
+1.1 +16.7 +0.1
20 89.986M 38.3 +0.0 19.9 64.0 -44.1 Horiz +0.4 -27.6
+0.7 +8.0 +0.1

Page 112 of 224Report No.: MIL05-015
Test Location: CKC Laboratories, Inc. •1120 Fulton Place • Fremont, CA 94539 • (510) 249 - 1170
Customer: Stanford Linear Accelerator CenterSpecification: RE102 10KHz-18GHzWork Order #: 82840 Date: 2/23/2005Test Type: Radiated Scan Time: 1:58:33 PMEquipment: TEM/TPS Sequence#: 11Manufacturer: Stanford Linear Accelerator Center Tested By: A. BrarModel: TEM/TPSS/N: GLA1754Equipment Under Test (* = UUT):
Function Manufacturer Model # S/NTEM/TPS* Stanford Linear Accelerator Center TEM/TPS GLA1754
Support Devices:Function Manufacturer Model # S/NVME Processor DAWN VME Not Listed Property Tag: GLAT0404Mouse Dell P/N X09-13962 69557-492-6014557-20350Keyboard Dell RT7D20 TH-04N454-37171-399-5494Monitor Dell 1901FP CN-05Y232-71616-41R-B363PC Dell DHM HXNLB41Power Supply BK Precision 1697 S240500299
Test Conditions / Notes:UUT is grounded to the copper table. UUT is running the FuncTest.py. Power cable is running along the front sideof the table to the 10uF feed through caps and from there to the equipment outside of the chamber. I/O cable isrouted along the power cable, 2cms from the power cable. Exposed cable lengths on the test table at 56".
Transducer Legend:T1=20' Cable Male N to Male N AN NoneT3=2' Cable Male BNC to Male N AN NoneT5=SAS-570 Horn Antenna - 2525
T2=Cable 2410T4=AN 0567 SN 1937A03055
Measurement Data: Reading listed by margin. Test Distance: 1 Meter# Freq Rdng T1
T5T2 T3 T4 Dist Corr Spec Margin Polar
MHz dBµV dB dB dB dB Table dBµV/m dBµV/m dB Ant 1 739.839M 61.1 +0.0 56.9 81.5 -24.6 Horiz +1.4
+18.7 +2.5 +0.4 -27.2
2 699.899M 60.8 +0.0 55.7 81.0 -25.3 Horiz +1.4 +18.1
+2.3 +0.4 -27.3
3 200.000M 59.6 +0.0 44.0 70.1 -26.1 Horiz +0.6 +10.3
+1.0 +0.1 -27.6
4 400.000M 61.2 +0.0 49.9 76.1 -26.2 Horiz +1.0 +13.3
+1.7 +0.3 -27.6
5 520.020M 59.5 +0.0 51.9 78.4 -26.5 Horiz +1.1 +16.9
+1.9 +0.3 -27.8
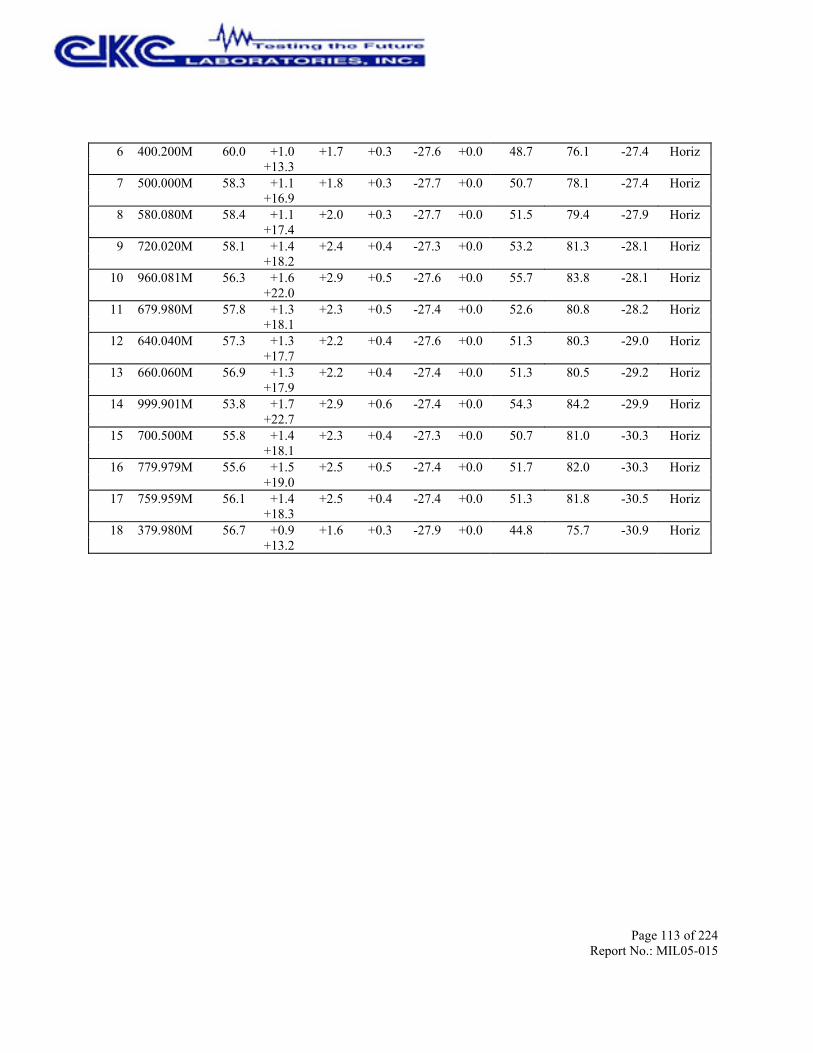
Page 113 of 224Report No.: MIL05-015
6 400.200M 60.0 +0.0 48.7 76.1 -27.4 Horiz +1.0 +13.3
+1.7 +0.3 -27.6
7 500.000M 58.3 +0.0 50.7 78.1 -27.4 Horiz +1.1 +16.9
+1.8 +0.3 -27.7
8 580.080M 58.4 +0.0 51.5 79.4 -27.9 Horiz +1.1 +17.4
+2.0 +0.3 -27.7
9 720.020M 58.1 +0.0 53.2 81.3 -28.1 Horiz +1.4 +18.2
+2.4 +0.4 -27.3
10 960.081M 56.3 +0.0 55.7 83.8 -28.1 Horiz +1.6 +22.0
+2.9 +0.5 -27.6
11 679.980M 57.8 +0.0 52.6 80.8 -28.2 Horiz +1.3 +18.1
+2.3 +0.5 -27.4
12 640.040M 57.3 +0.0 51.3 80.3 -29.0 Horiz +1.3 +17.7
+2.2 +0.4 -27.6
13 660.060M 56.9 +0.0 51.3 80.5 -29.2 Horiz +1.3 +17.9
+2.2 +0.4 -27.4
14 999.901M 53.8 +0.0 54.3 84.2 -29.9 Horiz +1.7 +22.7
+2.9 +0.6 -27.4
15 700.500M 55.8 +0.0 50.7 81.0 -30.3 Horiz +1.4 +18.1
+2.3 +0.4 -27.3
16 779.979M 55.6 +0.0 51.7 82.0 -30.3 Horiz +1.5 +19.0
+2.5 +0.5 -27.4
17 759.959M 56.1 +0.0 51.3 81.8 -30.5 Horiz +1.4 +18.3
+2.5 +0.4 -27.4
18 379.980M 56.7 +0.0 44.8 75.7 -30.9 Horiz +0.9 +13.2
+1.6 +0.3 -27.9

Page 114 of 224Report No.: MIL05-015
19 500.300M 54.2 +0.0 46.6 78.1 -31.5 Horiz +1.1 +16.9
+1.8 +0.3 -27.7
20 839.939M 53.9 +0.0 50.9 82.6 -31.7 Horiz +1.5 +19.7
+2.6 +0.6 -27.4
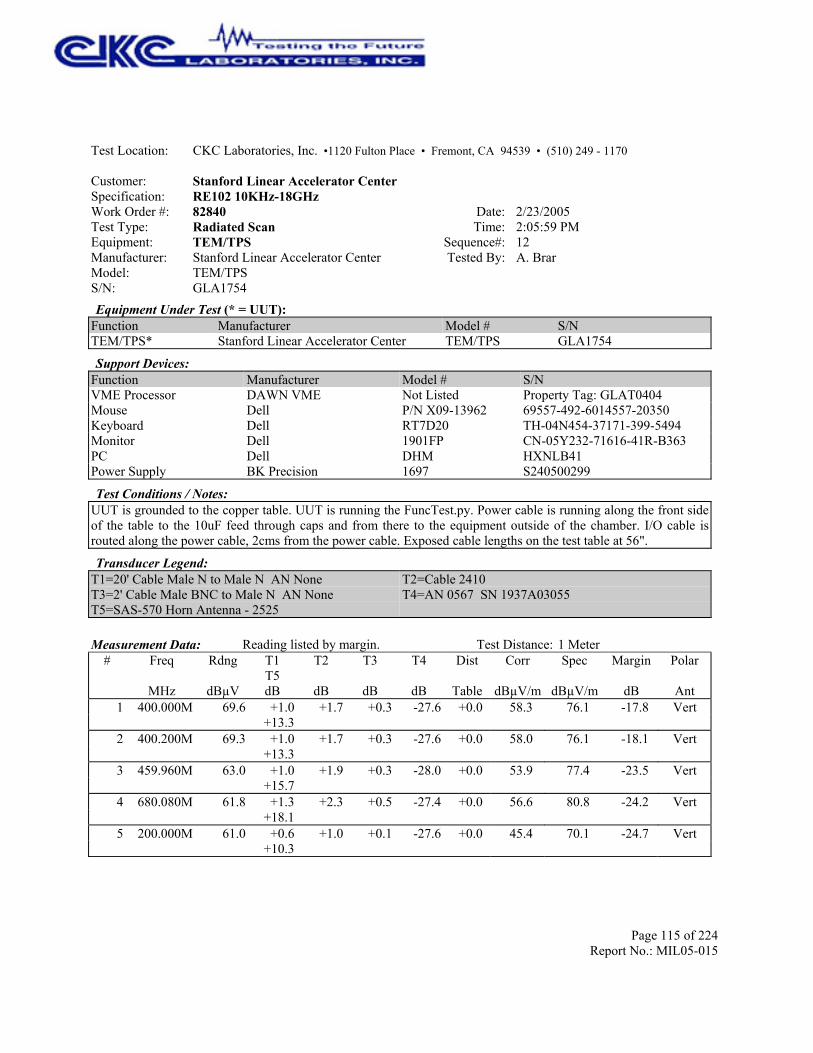
Page 115 of 224Report No.: MIL05-015
Test Location: CKC Laboratories, Inc. •1120 Fulton Place • Fremont, CA 94539 • (510) 249 - 1170
Customer: Stanford Linear Accelerator CenterSpecification: RE102 10KHz-18GHzWork Order #: 82840 Date: 2/23/2005Test Type: Radiated Scan Time: 2:05:59 PMEquipment: TEM/TPS Sequence#: 12Manufacturer: Stanford Linear Accelerator Center Tested By: A. BrarModel: TEM/TPSS/N: GLA1754Equipment Under Test (* = UUT):
Function Manufacturer Model # S/NTEM/TPS* Stanford Linear Accelerator Center TEM/TPS GLA1754
Support Devices:Function Manufacturer Model # S/NVME Processor DAWN VME Not Listed Property Tag: GLAT0404Mouse Dell P/N X09-13962 69557-492-6014557-20350Keyboard Dell RT7D20 TH-04N454-37171-399-5494Monitor Dell 1901FP CN-05Y232-71616-41R-B363PC Dell DHM HXNLB41Power Supply BK Precision 1697 S240500299
Test Conditions / Notes:UUT is grounded to the copper table. UUT is running the FuncTest.py. Power cable is running along the front sideof the table to the 10uF feed through caps and from there to the equipment outside of the chamber. I/O cable isrouted along the power cable, 2cms from the power cable. Exposed cable lengths on the test table at 56".
Transducer Legend:T1=20' Cable Male N to Male N AN NoneT3=2' Cable Male BNC to Male N AN NoneT5=SAS-570 Horn Antenna - 2525
T2=Cable 2410T4=AN 0567 SN 1937A03055
Measurement Data: Reading listed by margin. Test Distance: 1 Meter# Freq Rdng T1
T5T2 T3 T4 Dist Corr Spec Margin Polar
MHz dBµV dB dB dB dB Table dBµV/m dBµV/m dB Ant 1 400.000M 69.6 +0.0 58.3 76.1 -17.8 Vert +1.0
+13.3 +1.7 +0.3 -27.6
2 400.200M 69.3 +0.0 58.0 76.1 -18.1 Vert +1.0 +13.3
+1.7 +0.3 -27.6
3 459.960M 63.0 +0.0 53.9 77.4 -23.5 Vert +1.0 +15.7
+1.9 +0.3 -28.0
4 680.080M 61.8 +0.0 56.6 80.8 -24.2 Vert +1.3 +18.1
+2.3 +0.5 -27.4
5 200.000M 61.0 +0.0 45.4 70.1 -24.7 Vert +0.6 +10.3
+1.0 +0.1 -27.6
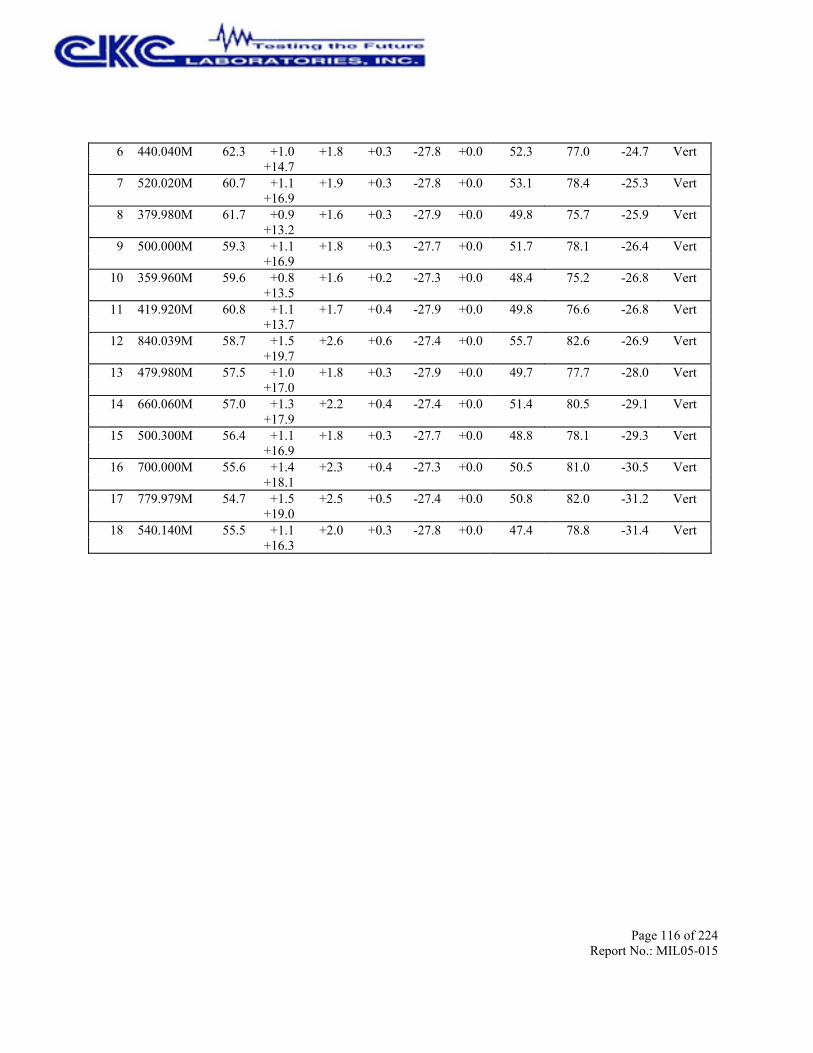
Page 116 of 224Report No.: MIL05-015
6 440.040M 62.3 +0.0 52.3 77.0 -24.7 Vert +1.0 +14.7
+1.8 +0.3 -27.8
7 520.020M 60.7 +0.0 53.1 78.4 -25.3 Vert +1.1 +16.9
+1.9 +0.3 -27.8
8 379.980M 61.7 +0.0 49.8 75.7 -25.9 Vert +0.9 +13.2
+1.6 +0.3 -27.9
9 500.000M 59.3 +0.0 51.7 78.1 -26.4 Vert +1.1 +16.9
+1.8 +0.3 -27.7
10 359.960M 59.6 +0.0 48.4 75.2 -26.8 Vert +0.8 +13.5
+1.6 +0.2 -27.3
11 419.920M 60.8 +0.0 49.8 76.6 -26.8 Vert +1.1 +13.7
+1.7 +0.4 -27.9
12 840.039M 58.7 +0.0 55.7 82.6 -26.9 Vert +1.5 +19.7
+2.6 +0.6 -27.4
13 479.980M 57.5 +0.0 49.7 77.7 -28.0 Vert +1.0 +17.0
+1.8 +0.3 -27.9
14 660.060M 57.0 +0.0 51.4 80.5 -29.1 Vert +1.3 +17.9
+2.2 +0.4 -27.4
15 500.300M 56.4 +0.0 48.8 78.1 -29.3 Vert +1.1 +16.9
+1.8 +0.3 -27.7
16 700.000M 55.6 +0.0 50.5 81.0 -30.5 Vert +1.4 +18.1
+2.3 +0.4 -27.3
17 779.979M 54.7 +0.0 50.8 82.0 -31.2 Vert +1.5 +19.0
+2.5 +0.5 -27.4
18 540.140M 55.5 +0.0 47.4 78.8 -31.4 Vert +1.1 +16.3
+2.0 +0.3 -27.8
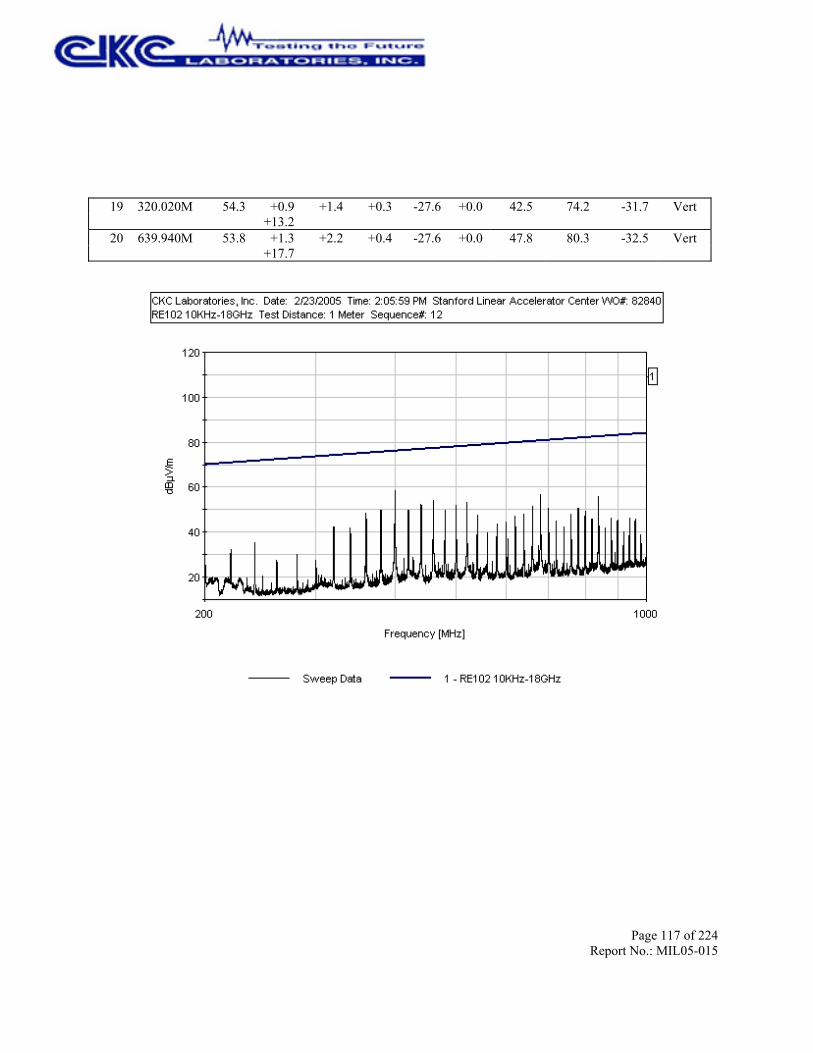
Page 117 of 224Report No.: MIL05-015
19 320.020M 54.3 +0.0 42.5 74.2 -31.7 Vert +0.9 +13.2
+1.4 +0.3 -27.6
20 639.940M 53.8 +0.0 47.8 80.3 -32.5 Vert +1.3 +17.7
+2.2 +0.4 -27.6

Page 118 of 224Report No.: MIL05-015
Test Location: CKC Laboratories, Inc. •1120 Fulton Place • Fremont, CA 94539 • (510) 249 - 1170
Customer: Stanford Linear Accelerator CenterSpecification: RE102 10KHz-18GHzWork Order #: 82840 Date: 2/23/2005Test Type: Radiated Scan Time: 5:03:38 PMEquipment: TEM/TPS Sequence#: 13Manufacturer: Stanford Linear Accelerator Center Tested By: A. BrarModel: TEM/TPSS/N: GLA1754Equipment Under Test (* = UUT):
Function Manufacturer Model # S/NTEM/TPS* Stanford Linear Accelerator Center TEM/TPS GLA1754
Support Devices:Function Manufacturer Model # S/NVME Processor DAWN VME Not Listed Property Tag: GLAT0404Mouse Dell P/N X09-13962 69557-492-6014557-20350Keyboard Dell RT7D20 TH-04N454-37171-399-5494Monitor Dell 1901FP CN-05Y232-71616-41R-B363PC Dell DHM HXNLB41Power Supply BK Precision 1697 S240500299
Test Conditions / Notes:UUT is grounded to the copper table. UUT is running the FuncTest.py. Power cable is running along the front sideof the table to the 10uF feed through caps and from there to the equipment outside of the chamber. I/O cable isrouted along the power cable, 2cms from the power cable. Exposed cable lengths on the test table at 56".
Transducer Legend:T1=AMP AN00941A 50GHzT3=ANP05200 1-40GHz
T2=Horn Antenna 4660 (Fremont)T4=ANP5201 1-40GHz
Measurement Data: Reading listed by margin. Test Distance: 1 Meter# Freq Rdng T1 T2 T3 T4 Dist Corr Spec Margin Polar
MHz dBµV dB dB dB dB Table dBµV/m dBµV/m dB Ant 1 1179.867M 56.9 +0.0 53.4 85.6 -32.2 Horiz -29.7 +24.4 +0.9 +0.9
2 1000.000M 55.8 +0.0 51.5 84.2 -32.7 Horiz -29.7 +23.8 +0.8 +0.8
3 1119.859M 53.4 +0.0 49.6 85.2 -35.6 Horiz -29.7 +24.2 +0.9 +0.8
4 1300.375M 53.9 +0.0 50.8 86.5 -35.7 Horiz -29.7 +24.7 +1.0 +0.9
5 1159.661M 53.2 +0.0 49.6 85.5 -35.9 Horiz -29.7 +24.3 +0.9 +0.9
6 1339.963M 53.7 +0.0 50.7 86.7 -36.0 Horiz -29.7 +24.8 +1.0 +0.9

Page 119 of 224Report No.: MIL05-015
7 1339.149M 53.4 +0.0 50.4 86.7 -36.3 Horiz -29.7 +24.8 +1.0 +0.9
8 1080.063M 51.3 +0.0 47.4 84.8 -37.4 Horiz -29.7 +24.1 +0.9 +0.8
9 1199.527M 51.9 +0.0 48.4 85.8 -37.4 Horiz -29.7 +24.4 +0.9 +0.9
10 1020.291M 50.7 +0.0 46.5 84.3 -37.8 Horiz -29.7 +23.9 +0.8 +0.8
11 1320.035M 51.0 +0.0 48.0 86.6 -38.6 Horiz -29.7 +24.8 +1.0 +0.9
12 1039.796M 48.5 +0.0 44.5 84.5 -40.0 Horiz -29.7 +23.9 +0.9 +0.9
13 1219.551M 48.6 +0.0 45.2 85.9 -40.7 Horiz -29.7 +24.5 +0.9 +0.9
14 1500.071M 49.8 +0.0 46.7 87.7 -41.0 Horiz -30.3 +25.2 +1.0 +1.0
15 1520.296M 49.8 +0.0 46.8 87.8 -41.0 Horiz -30.3 +25.3 +1.0 +1.0
16 1359.766M 48.7 +0.0 45.8 86.9 -41.1 Horiz -29.7 +24.9 +1.0 +0.9
17 1420.017M 48.9 +0.0 45.9 87.2 -41.3 Horiz -30.0 +25.0 +1.0 +1.0
18 1100.511M 47.3 +0.0 43.4 85.0 -41.6 Horiz -29.7 +24.1 +0.9 +0.8
19 1259.599M 47.9 +0.0 44.6 86.2 -41.6 Horiz -29.7 +24.6 +0.9 +0.9
20 1480.268M 48.8 +0.0 45.7 87.6 -41.9 Horiz -30.3 +25.2 +1.0 +1.0
21 1140.150M 46.8 +0.0 43.2 85.3 -42.1 Horiz -29.7 +24.3 +0.9 +0.9
22 1379.990M 46.3 +0.0 43.4 87.0 -43.6 Horiz -29.8 +24.9 +1.0 +1.0
23 1459.623M 47.0 +0.0 43.9 87.5 -43.6 Horiz -30.2 +25.1 +1.0 +1.0
24 1399.793M 46.2 +0.0 43.4 87.1 -43.7 Horiz -29.8 +25.0 +1.0 +1.0
25 1240.485M 45.4 +0.0 42.0 86.0 -44.0 Horiz -29.7 +24.5 +0.9 +0.9

Page 120 of 224Report No.: MIL05-015
26 1533.146M 43.5 +0.0 40.5 87.9 -47.4 Horiz -30.3 +25.3 +1.0 +1.0
27 1539.677M 43.2 +0.0 40.3 87.9 -47.6 Horiz -30.3 +25.4 +1.0 +1.0

Page 121 of 224Report No.: MIL05-015
Test Location: CKC Laboratories, Inc. •1120 Fulton Place • Fremont, CA 94539 • (510) 249 - 1170
Customer: Stanford Linear Accelerator CenterSpecification: RE102 10KHz-18GHzWork Order #: 82840 Date: 2/23/2005Test Type: Radiated Scan Time: 5:05:29 PMEquipment: TEM/TPS Sequence#: 14Manufacturer: Stanford Linear Accelerator Center Tested By: A. BrarModel: TEM/TPSS/N: GLA1754Equipment Under Test (* = UUT):
Function Manufacturer Model # S/NTEM/TPS* Stanford Linear Accelerator Center TEM/TPS GLA1754
Support Devices:Function Manufacturer Model # S/NVME Processor DAWN VME Not Listed Property Tag: GLAT0404Mouse Dell P/N X09-13962 69557-492-6014557-20350Keyboard Dell RT7D20 TH-04N454-37171-399-5494Monitor Dell 1901FP CN-05Y232-71616-41R-B363PC Dell DHM HXNLB41Power Supply BK Precision 1697 S240500299
Test Conditions / Notes:UUT is grounded to the copper table. UUT is running the FuncTest.py. Power cable is running along the front sideof the table to the 10uF feed through caps and from there to the equipment outside of the chamber. I/O cable isrouted along the power cable, 2cms from the power cable. Exposed cable lengths on the test table at 56".
Transducer Legend:T1=AMP AN00941A 50GHzT3=ANP05200 1-40GHz
T2=Horn Antenna 4660 (Fremont)T4=ANP5201 1-40GHz
Measurement Data: Reading listed by margin. Test Distance: 1 Meter# Freq Rdng T1 T2 T3 T4 Dist Corr Spec Margin Polar
MHz dBµV dB dB dB dB Table dBµV/m dBµV/m dB Ant 1 1599.930M 31.6 +0.0 28.9 14.0 +14.9 Horiz -30.3 +25.6 +1.0 +1.0
2 1559.874M 30.7 +0.0 27.8 14.0 +13.8 Horiz -30.3 +25.4 +1.0 +1.0
3 1559.913M 30.5 +0.0 27.6 14.0 +13.6 Horiz -30.3 +25.4 +1.0 +1.0
4 1559.964M 30.4 +0.0 27.5 14.0 +13.5 Horiz -30.3 +25.4 +1.0 +1.0
5 1559.997M 30.4 +0.0 27.5 14.0 +13.5 Horiz -30.3 +25.4 +1.0 +1.0
6 1560.078M 30.3 +0.0 27.4 14.0 +13.4 Horiz -30.3 +25.4 +1.0 +1.0

Page 122 of 224Report No.: MIL05-015
7 1560.132M 30.2 +0.0 27.3 14.0 +13.3 Horiz -30.3 +25.4 +1.0 +1.0
8 1560.072M 30.1 +0.0 27.2 14.0 +13.2 Horiz -30.3 +25.4 +1.0 +1.0
9 1560.219M 29.3 +0.0 26.4 14.0 +12.4 Horiz -30.3 +25.4 +1.0 +1.0
10 1599.600M 28.9 +0.0 26.2 14.0 +12.2 Horiz -30.3 +25.6 +1.0 +1.0
11 1599.664M 28.7 +0.0 26.0 14.0 +12.0 Horiz -30.3 +25.6 +1.0 +1.0
12 1599.627M 28.3 +0.0 25.6 14.0 +11.6 Horiz -30.3 +25.6 +1.0 +1.0
13 1599.530M 28.0 +0.0 25.3 14.0 +11.3 Horiz -30.3 +25.6 +1.0 +1.0
14 1599.493M 26.1 +0.0 23.4 14.0 +9.4 Horiz -30.3 +25.6 +1.0 +1.0
15 1599.477M 25.3 +0.0 22.6 14.0 +8.6 Horiz -30.3 +25.6 +1.0 +1.0
16 1559.354M 23.7 +0.0 20.8 14.0 +6.8 Horiz -30.3 +25.4 +1.0 +1.0
17 1559.415M 23.4 +0.0 20.5 14.0 +6.5 Horiz -30.3 +25.4 +1.0 +1.0
18 1560.733M 23.2 +0.0 20.3 14.0 +6.3 Horiz -30.3 +25.4 +1.0 +1.0
19 1560.655M 22.0 +0.0 19.1 14.0 +5.1 Horiz -30.3 +25.4 +1.0 +1.0
20 1560.682M 21.9 +0.0 19.0 14.0 +5.0 Horiz -30.3 +25.4 +1.0 +1.0
21 1579.893M 21.7 +0.0 18.9 14.0 +4.9 Horiz -30.3 +25.5 +1.0 +1.0
22 1559.105M 20.6 +0.0 17.7 14.0 +3.7 Horiz -30.3 +25.4 +1.0 +1.0
23 1559.147M 20.4 +0.0 17.5 14.0 +3.5 Horiz -30.3 +25.4 +1.0 +1.0
24 1598.970M 20.0 +0.0 17.3 14.0 +3.3 Horiz -30.3 +25.6 +1.0 +1.0
25 1580.118M 19.8 +0.0 17.0 14.0 +3.0 Horiz -30.3 +25.5 +1.0 +1.0
26 1560.946M 19.8 +0.0 16.9 14.0 +2.9 Horiz -30.3 +25.4 +1.0 +1.0
27 1579.623M 19.7 +0.0 16.9 14.0 +2.9 Horiz -30.3 +25.5 +1.0 +1.0
28 1579.779M 19.3 +0.0 16.5 14.0 +2.5 Horiz -30.3 +25.5 +1.0 +1.0

Page 123 of 224Report No.: MIL05-015
29 1579.833M 19.2 +0.0 16.4 14.0 +2.4 Horiz -30.3 +25.5 +1.0 +1.0
30 1597.442M 18.8 +0.0 16.1 14.0 +2.1 Horiz -30.3 +25.6 +1.0 +1.0
31 1598.880M 18.8 +0.0 16.1 14.0 +2.1 Horiz -30.3 +25.6 +1.0 +1.0
32 1598.823M 18.7 +0.0 16.0 14.0 +2.0 Horiz -30.3 +25.6 +1.0 +1.0
33 1580.382M 18.6 +0.0 15.8 14.0 +1.8 Horiz -30.3 +25.5 +1.0 +1.0
34 1558.994M 18.6 +0.0 15.7 14.0 +1.7 Horiz -30.3 +25.4 +1.0 +1.0
35 1580.421M 18.0 +0.0 15.2 14.0 +1.2 Horiz -30.3 +25.5 +1.0 +1.0
36 1580.571M 17.7 +0.0 14.9 14.0 +0.9 Horiz -30.3 +25.5 +1.0 +1.0
37 1558.568M 17.1 +0.0 14.2 14.0 +0.2 Horiz -30.3 +25.4 +1.0 +1.0
38 1558.541M 16.9 +0.0 14.0 14.0 +0.0 Horiz -30.3 +25.4 +1.0 +1.0
39 1581.043M 16.8 +0.0 14.0 14.0 +0.0 Horiz -30.3 +25.5 +1.0 +1.0
40 1597.391M 16.6 +0.0 13.9 14.0 -0.1 Horiz -30.3 +25.6 +1.0 +1.0
41 1558.670M 16.6 +0.0 13.7 14.0 -0.3 Horiz -30.3 +25.4 +1.0 +1.0
42 1558.610M 16.5 +0.0 13.6 14.0 -0.4 Horiz -30.3 +25.4 +1.0 +1.0
43 1598.232M 16.3 +0.0 13.6 14.0 -0.4 Horiz -30.3 +25.6 +1.0 +1.0
44 1598.267M 16.3 +0.0 13.6 14.0 -0.4 Horiz -30.3 +25.6 +1.0 +1.0
45 1558.408M 16.4 +0.0 13.5 14.0 -0.5 Horiz -30.3 +25.4 +1.0 +1.0
46 1561.574M 16.3 +0.0 13.4 14.0 -0.6 Horiz -30.3 +25.4 +1.0 +1.0
47 1558.360M 16.2 +0.0 13.3 14.0 -0.7 Horiz -30.3 +25.4 +1.0 +1.0
48 1596.598M 16.0 +0.0 13.3 14.0 -0.7 Horiz -30.3 +25.6 +1.0 +1.0
49 1558.580M 16.1 +0.0 13.2 14.0 -0.8 Horiz -30.3 +25.4 +1.0 +1.0
50 1561.865M 16.1 +0.0 13.2 14.0 -0.8 Horiz -30.3 +25.4 +1.0 +1.0

Page 124 of 224Report No.: MIL05-015
51 1579.403M 16.0 +0.0 13.2 14.0 -0.8 Horiz -30.3 +25.5 +1.0 +1.0
52 1551.835M 16.0 +0.0 13.1 14.0 -0.9 Horiz -30.3 +25.4 +1.0 +1.0
53 1561.429M 15.9 +0.0 13.0 14.0 -1.0 Horiz -30.3 +25.4 +1.0 +1.0
54 1598.010M 15.7 +0.0 13.0 14.0 -1.0 Horiz -30.3 +25.6 +1.0 +1.0
55 1562.072M 15.8 +0.0 12.9 14.0 -1.1 Horiz -30.3 +25.4 +1.0 +1.0
56 1598.137M 15.6 +0.0 12.9 14.0 -1.1 Horiz -30.3 +25.6 +1.0 +1.0
57 1557.670M 15.7 +0.0 12.8 14.0 -1.2 Horiz -30.3 +25.4 +1.0 +1.0
58 1575.060M 15.6 +0.0 12.8 14.0 -1.2 Horiz -30.3 +25.5 +1.0 +1.0
59 1558.192M 15.6 +0.0 12.7 14.0 -1.3 Horiz -30.3 +25.4 +1.0 +1.0
60 1557.505M 15.5 +0.0 12.6 14.0 -1.4 Horiz -30.3 +25.4 +1.0 +1.0
61 1557.868M 15.5 +0.0 12.6 14.0 -1.4 Horiz -30.3 +25.4 +1.0 +1.0
62 1594.523M 15.3 +0.0 12.6 14.0 -1.4 Horiz -30.3 +25.6 +1.0 +1.0
63 1565.610M 15.3 +0.0 12.5 14.0 -1.5 Horiz -30.3 +25.5 +1.0 +1.0
64 1579.328M 15.3 +0.0 12.5 14.0 -1.5 Horiz -30.3 +25.5 +1.0 +1.0
65 1591.157M 15.3 +0.0 12.5 14.0 -1.5 Horiz -30.3 +25.5 +1.0 +1.0
66 1597.629M 15.2 +0.0 12.5 14.0 -1.5 Horiz -30.3 +25.6 +1.0 +1.0
67 1597.767M 15.2 +0.0 12.5 14.0 -1.5 Horiz -30.3 +25.6 +1.0 +1.0
68 1555.246M 15.3 +0.0 12.4 14.0 -1.6 Horiz -30.3 +25.4 +1.0 +1.0
69 1558.063M 15.3 +0.0 12.4 14.0 -1.6 Horiz -30.3 +25.4 +1.0 +1.0
70 1579.157M 15.2 +0.0 12.4 14.0 -1.6 Horiz -30.3 +25.5 +1.0 +1.0
71 1591.547M 15.1 +0.0 12.4 14.0 -1.6 Horiz -30.3 +25.6 +1.0 +1.0
72 1597.571M 15.1 +0.0 12.4 14.0 -1.6 Horiz -30.3 +25.6 +1.0 +1.0

Page 125 of 224Report No.: MIL05-015
73 1597.785M 15.1 +0.0 12.4 14.0 -1.6 Horiz -30.3 +25.6 +1.0 +1.0
74 1555.279M 15.2 +0.0 12.3 14.0 -1.7 Horiz -30.3 +25.4 +1.0 +1.0
75 1557.469M 15.2 +0.0 12.3 14.0 -1.7 Horiz -30.3 +25.4 +1.0 +1.0
76 1557.973M 15.2 +0.0 12.3 14.0 -1.7 Horiz -30.3 +25.4 +1.0 +1.0
77 1574.535M 15.1 +0.0 12.3 14.0 -1.7 Horiz -30.3 +25.5 +1.0 +1.0
78 1595.178M 15.0 +0.0 12.3 14.0 -1.7 Horiz -30.3 +25.6 +1.0 +1.0
79 1597.514M 15.0 +0.0 12.3 14.0 -1.7 Horiz -30.3 +25.6 +1.0 +1.0
80 1563.835M 15.1 +0.0 12.2 14.0 -1.8 Horiz -30.3 +25.4 +1.0 +1.0
81 1595.565M 14.9 +0.0 12.2 14.0 -1.8 Horiz -30.3 +25.6 +1.0 +1.0
82 1550.024M 15.0 +0.0 12.1 14.0 -1.9 Horiz -30.3 +25.4 +1.0 +1.0
83 1566.739M 14.9 +0.0 12.1 14.0 -1.9 Horiz -30.3 +25.5 +1.0 +1.0
84 1595.103M 14.8 +0.0 12.1 14.0 -1.9 Horiz -30.3 +25.6 +1.0 +1.0
85 1555.129M 14.9 +0.0 12.0 14.0 -2.0 Horiz -30.3 +25.4 +1.0 +1.0
86 1562.787M 14.9 +0.0 12.0 14.0 -2.0 Horiz -30.3 +25.4 +1.0 +1.0
87 1582.581M 14.8 +0.0 12.0 14.0 -2.0 Horiz -30.3 +25.5 +1.0 +1.0
88 1553.021M 14.8 +0.0 11.9 14.0 -2.1 Horiz -30.3 +25.4 +1.0 +1.0
89 1562.664M 14.8 +0.0 11.9 14.0 -2.1 Horiz -30.3 +25.4 +1.0 +1.0
90 1579.082M 14.7 +0.0 11.9 14.0 -2.1 Horiz -30.3 +25.5 +1.0 +1.0
91 1583.202M 14.7 +0.0 11.9 14.0 -2.1 Horiz -30.3 +25.5 +1.0 +1.0
92 1583.932M 14.7 +0.0 11.9 14.0 -2.1 Horiz -30.3 +25.5 +1.0 +1.0
93 1551.964M 14.7 +0.0 11.8 14.0 -2.2 Horiz -30.3 +25.4 +1.0 +1.0
94 1552.799M 14.7 +0.0 11.8 14.0 -2.2 Horiz -30.3 +25.4 +1.0 +1.0
95 1553.835M 14.7 +0.0 11.8 14.0 -2.2 Horiz -30.3 +25.4 +1.0 +1.0
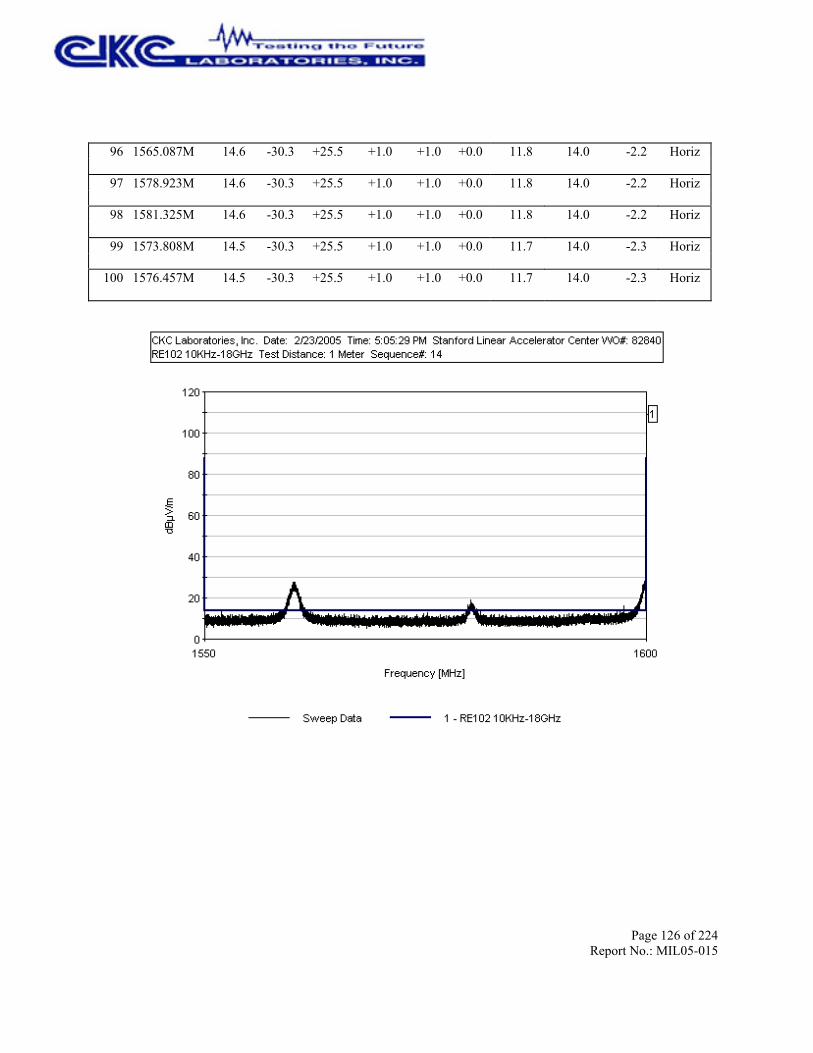
Page 126 of 224Report No.: MIL05-015
96 1565.087M 14.6 +0.0 11.8 14.0 -2.2 Horiz -30.3 +25.5 +1.0 +1.0
97 1578.923M 14.6 +0.0 11.8 14.0 -2.2 Horiz -30.3 +25.5 +1.0 +1.0
98 1581.325M 14.6 +0.0 11.8 14.0 -2.2 Horiz -30.3 +25.5 +1.0 +1.0
99 1573.808M 14.5 +0.0 11.7 14.0 -2.3 Horiz -30.3 +25.5 +1.0 +1.0
100 1576.457M 14.5 +0.0 11.7 14.0 -2.3 Horiz -30.3 +25.5 +1.0 +1.0

Page 127 of 224Report No.: MIL05-015
Test Location: CKC Laboratories, Inc. •1120 Fulton Place • Fremont, CA 94539 • (510) 249 - 1170
Customer: Stanford Linear Accelerator CenterSpecification: RE102 10KHz-18GHzWork Order #: 82840 Date: 2/23/2005Test Type: Radiated Scan Time: 5:12:48 PMEquipment: TEM/TPS Sequence#: 15Manufacturer: Stanford Linear Accelerator Center Tested By: A. BrarModel: TEM/TPSS/N: GLA1754Equipment Under Test (* = UUT):
Function Manufacturer Model # S/NTEM/TPS* Stanford Linear Accelerator Center TEM/TPS GLA1754
Support Devices:Function Manufacturer Model # S/NVME Processor DAWN VME Not Listed Property Tag: GLAT0404Mouse Dell P/N X09-13962 69557-492-6014557-20350Keyboard Dell RT7D20 TH-04N454-37171-399-5494Monitor Dell 1901FP CN-05Y232-71616-41R-B363PC Dell DHM HXNLB41Power Supply BK Precision 1697 S240500299
Test Conditions / Notes:UUT is grounded to the copper table. UUT is running the FuncTest.py. Power cable is running along the front sideof the table to the 10uF feed through caps and from there to the equipment outside of the chamber. I/O cable isrouted along the power cable, 2cms from the power cable. Exposed cable lengths on the test table at 56".
Transducer Legend:T1=AMP AN00941A 50GHzT3=ANP05200 1-40GHz
T2=Horn Antenna 4660 (Fremont)T4=ANP5201 1-40GHz
Measurement Data: Reading listed by margin. Test Distance: 1 Meter# Freq Rdng T1 T2 T3 T4 Dist Corr Spec Margin Polar
MHz dBµV dB dB dB dB Table dBµV/m dBµV/m dB Ant 1 1600.383M 50.1 +0.0 47.4 88.0 -40.6 Horiz -30.3 +25.6 +1.0 +1.0
2 1619.991M 45.3 +0.0 42.7 88.1 -45.4 Horiz -30.3 +25.7 +1.0 +1.0
3 1654.827M 44.2 +0.0 41.7 88.3 -46.6 Horiz -30.3 +25.8 +1.0 +1.0
4 1616.431M 43.8 +0.0 41.1 88.1 -47.0 Horiz -30.3 +25.6 +1.0 +1.0
5 1640.475M 43.6 +0.0 41.0 88.2 -47.2 Horiz -30.3 +25.7 +1.0 +1.0
6 1739.653M 43.1 +0.0 41.4 88.8 -47.4 Horiz -30.0 +26.1 +1.1 +1.1
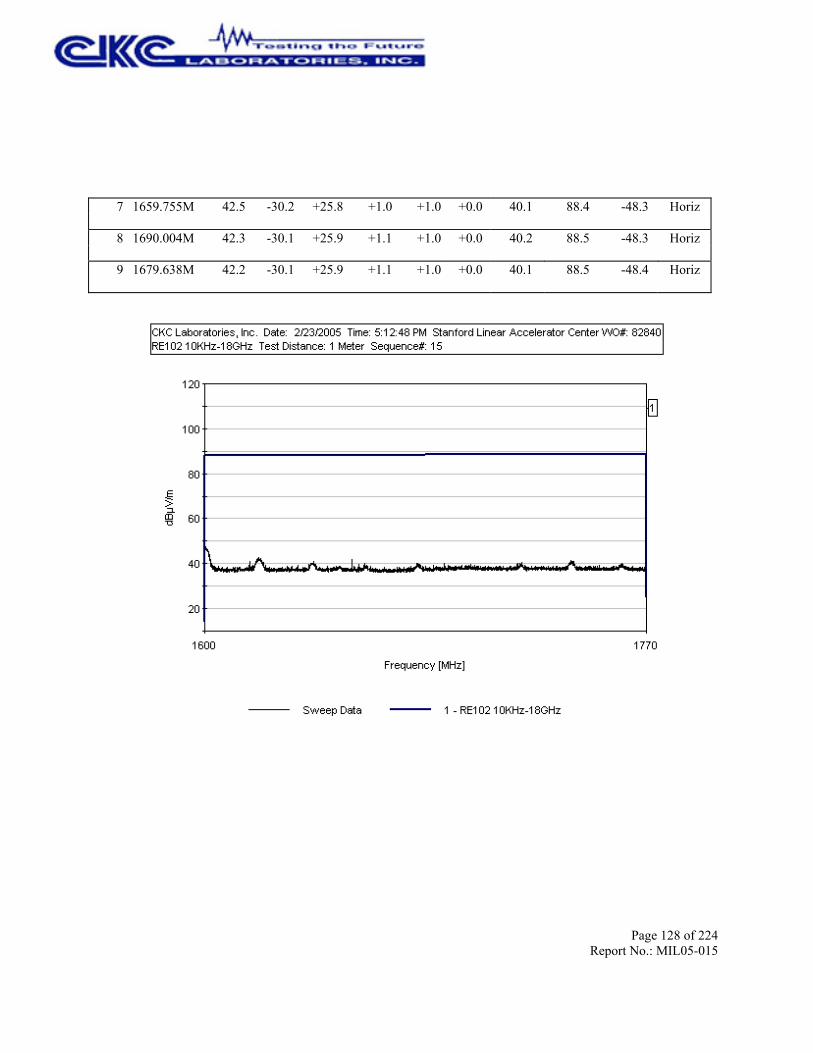
Page 128 of 224Report No.: MIL05-015
7 1659.755M 42.5 +0.0 40.1 88.4 -48.3 Horiz -30.2 +25.8 +1.0 +1.0
8 1690.004M 42.3 +0.0 40.2 88.5 -48.3 Horiz -30.1 +25.9 +1.1 +1.0
9 1679.638M 42.2 +0.0 40.1 88.5 -48.4 Horiz -30.1 +25.9 +1.1 +1.0

Page 129 of 224Report No.: MIL05-015
Test Location: CKC Laboratories, Inc. •1120 Fulton Place • Fremont, CA 94539 • (510) 249 - 1170
Customer: Stanford Linear Accelerator CenterSpecification: RE102 10KHz-18GHzWork Order #: 82840 Date: 2/23/2005Test Type: Radiated Scan Time: 5:14:57 PMEquipment: TEM/TPS Sequence#: 16Manufacturer: Stanford Linear Accelerator Center Tested By: A. BrarModel: TEM/TPSS/N: GLA1754Equipment Under Test (* = UUT):
Function Manufacturer Model # S/NTEM/TPS* Stanford Linear Accelerator Center TEM/TPS GLA1754
Support Devices:Function Manufacturer Model # S/NVME Processor DAWN VME Not Listed Property Tag: GLAT0404Mouse Dell P/N X09-13962 69557-492-6014557-20350Keyboard Dell RT7D20 TH-04N454-37171-399-5494Monitor Dell 1901FP CN-05Y232-71616-41R-B363PC Dell DHM HXNLB41Power Supply BK Precision 1697 S240500299
Test Conditions / Notes:UUT is grounded to the copper table. UUT is running the FuncTest.py. Power cable is running along the front sideof the table to the 10uF feed through caps and from there to the equipment outside of the chamber. I/O cable isrouted along the power cable, 2cms from the power cable. Exposed cable lengths on the test table at 56".
Transducer Legend:T1=AMP AN00941A 50GHzT3=ANP05200 1-40GHz
T2=Horn Antenna 4660 (Fremont)T4=ANP5201 1-40GHz
Measurement Data: Reading listed by margin. Test Distance: 1 Meter# Freq Rdng T1 T2 T3 T4 Dist Corr Spec Margin Polar
MHz dBµV dB dB dB dB Table dBµV/m dBµV/m dB Ant 1 1797.117M 28.3 +0.0 26.6 25.0 +1.6 Horiz -30.2 +26.3 +1.1 +1.1
2 2100.000M 25.1 +0.0 26.1 25.0 +1.1 Horiz -28.7 +27.3 +1.2 +1.2
3 2196.486M 25.2 +0.0 26.0 25.0 +1.0 Horiz -29.3 +27.7 +1.2 +1.2
4 2019.880M 25.1 +0.0 25.5 25.0 +0.5 Horiz -28.9 +27.0 +1.1 +1.2
5 2239.749M 24.3 +0.0 25.0 25.0 +0.0 Horiz -29.5 +27.8 +1.2 +1.2
6 2239.769M 24.3 +0.0 25.0 25.0 +0.0 Horiz -29.5 +27.8 +1.2 +1.2
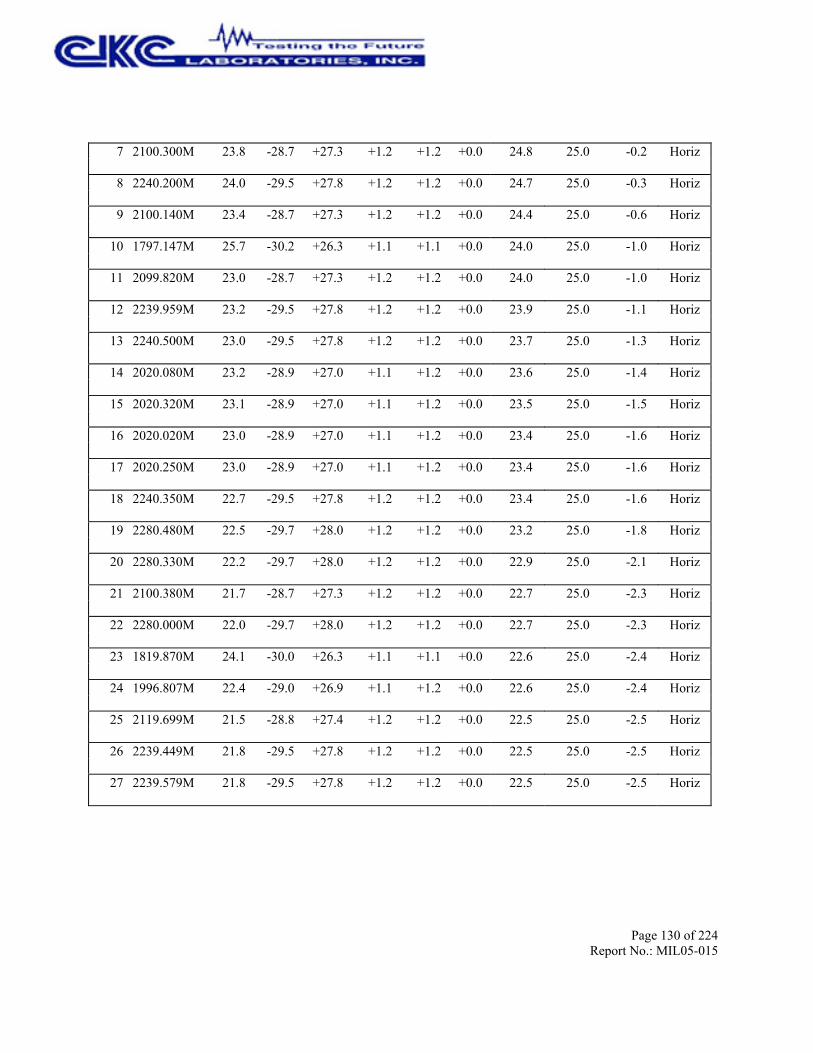
Page 130 of 224Report No.: MIL05-015
7 2100.300M 23.8 +0.0 24.8 25.0 -0.2 Horiz -28.7 +27.3 +1.2 +1.2
8 2240.200M 24.0 +0.0 24.7 25.0 -0.3 Horiz -29.5 +27.8 +1.2 +1.2
9 2100.140M 23.4 +0.0 24.4 25.0 -0.6 Horiz -28.7 +27.3 +1.2 +1.2
10 1797.147M 25.7 +0.0 24.0 25.0 -1.0 Horiz -30.2 +26.3 +1.1 +1.1
11 2099.820M 23.0 +0.0 24.0 25.0 -1.0 Horiz -28.7 +27.3 +1.2 +1.2
12 2239.959M 23.2 +0.0 23.9 25.0 -1.1 Horiz -29.5 +27.8 +1.2 +1.2
13 2240.500M 23.0 +0.0 23.7 25.0 -1.3 Horiz -29.5 +27.8 +1.2 +1.2
14 2020.080M 23.2 +0.0 23.6 25.0 -1.4 Horiz -28.9 +27.0 +1.1 +1.2
15 2020.320M 23.1 +0.0 23.5 25.0 -1.5 Horiz -28.9 +27.0 +1.1 +1.2
16 2020.020M 23.0 +0.0 23.4 25.0 -1.6 Horiz -28.9 +27.0 +1.1 +1.2
17 2020.250M 23.0 +0.0 23.4 25.0 -1.6 Horiz -28.9 +27.0 +1.1 +1.2
18 2240.350M 22.7 +0.0 23.4 25.0 -1.6 Horiz -29.5 +27.8 +1.2 +1.2
19 2280.480M 22.5 +0.0 23.2 25.0 -1.8 Horiz -29.7 +28.0 +1.2 +1.2
20 2280.330M 22.2 +0.0 22.9 25.0 -2.1 Horiz -29.7 +28.0 +1.2 +1.2
21 2100.380M 21.7 +0.0 22.7 25.0 -2.3 Horiz -28.7 +27.3 +1.2 +1.2
22 2280.000M 22.0 +0.0 22.7 25.0 -2.3 Horiz -29.7 +28.0 +1.2 +1.2
23 1819.870M 24.1 +0.0 22.6 25.0 -2.4 Horiz -30.0 +26.3 +1.1 +1.1
24 1996.807M 22.4 +0.0 22.6 25.0 -2.4 Horiz -29.0 +26.9 +1.1 +1.2
25 2119.699M 21.5 +0.0 22.5 25.0 -2.5 Horiz -28.8 +27.4 +1.2 +1.2
26 2239.449M 21.8 +0.0 22.5 25.0 -2.5 Horiz -29.5 +27.8 +1.2 +1.2
27 2239.579M 21.8 +0.0 22.5 25.0 -2.5 Horiz -29.5 +27.8 +1.2 +1.2

Page 131 of 224Report No.: MIL05-015
28 2239.419M 21.7 +0.0 22.4 25.0 -2.6 Horiz -29.5 +27.8 +1.2 +1.2
29 2259.990M 21.6 +0.0 22.3 25.0 -2.7 Horiz -29.6 +27.9 +1.2 +1.2
30 2280.220M 21.6 +0.0 22.3 25.0 -2.7 Horiz -29.7 +28.0 +1.2 +1.2

Page 132 of 224Report No.: MIL05-015
Test Location: CKC Laboratories, Inc. •1120 Fulton Place • Fremont, CA 94539 • (510) 249 - 1170
Customer: Stanford Linear Accelerator CenterSpecification: RE102 10KHz-18GHzWork Order #: 82840 Date: 2/23/2005Test Type: Radiated Scan Time: 5:18:02 PMEquipment: TEM/TPS Sequence#: 17Manufacturer: Stanford Linear Accelerator Center Tested By: A. BrarModel: TEM/TPSS/N: GLA1754Equipment Under Test (* = UUT):
Function Manufacturer Model # S/NTEM/TPS* Stanford Linear Accelerator Center TEM/TPS GLA1754
Support Devices:Function Manufacturer Model # S/NVME Processor DAWN VME Not Listed Property Tag: GLAT0404Mouse Dell P/N X09-13962 69557-492-6014557-20350Keyboard Dell RT7D20 TH-04N454-37171-399-5494Monitor Dell 1901FP CN-05Y232-71616-41R-B363PC Dell DHM HXNLB41Power Supply BK Precision 1697 S240500299
Test Conditions / Notes:UUT is grounded to the copper table. UUT is running the FuncTest.py. Power cable is running along the front sideof the table to the 10uF feed through caps and from there to the equipment outside of the chamber. I/O cable isrouted along the power cable, 2cms from the power cable. Exposed cable lengths on the test table at 56".
Transducer Legend:T1=AMP AN00941A 50GHzT3=ANP05200 1-40GHz
T2=Horn Antenna 4660 (Fremont)T4=ANP5201 1-40GHz
Measurement Data: Reading listed by margin. Test Distance: 1 Meter# Freq Rdng T1 T2 T3 T4 Dist Corr Spec Margin Polar
MHz dBµV dB dB dB dB Table dBµV/m dBµV/m dB Ant 1 2600.300M 42.8 +0.0 45.1 91.1 -46.0 Horiz -29.3 +29.0 +1.3 +1.3
2 10127.820M 39.0 +0.0 57.1 103.7 -46.6 Horiz -27.2 +39.7 +2.6 +3.0
3 10317.010M 39.2 +0.0 56.9 103.9 -47.0 Horiz -27.3 +39.4 +2.6 +3.0
4 13939.630M 40.4 +0.0 59.6 106.6 -47.0 Horiz -30.7 +43.4 +3.1 +3.4
5 14393.080M 40.6 +0.0 59.9 106.9 -47.0 Horiz -30.8 +43.4 +3.2 +3.5
6 5269.967M 40.1 +0.0 49.9 97.7 -47.8 Horiz -28.4 +34.4 +1.8 +2.0

Page 133 of 224Report No.: MIL05-015
7 13297.990M 39.7 +0.0 58.4 106.2 -47.8 Horiz -30.1 +42.5 +3.0 +3.3
8 3720.419M 41.1 +0.0 46.5 94.4 -47.9 Horiz -29.5 +31.8 +1.5 +1.6
9 9656.349M 37.5 +0.0 55.2 103.2 -48.0 Horiz -26.8 +39.2 +2.5 +2.8
10 17905.470M 38.0 +0.0 61.0 109.0 -48.0 Horiz -29.5 +44.7 +3.6 +4.2
11 3248.948M 40.3 +0.0 44.8 93.2 -48.4 Horiz -29.1 +30.7 +1.4 +1.5
12 12042.730M 39.0 +0.0 56.9 105.3 -48.4 Horiz -28.7 +40.6 +2.8 +3.2
13 8760.454M 37.1 +0.0 53.8 102.3 -48.5 Horiz -26.7 +38.4 +2.4 +2.6
14 10685.380M 37.5 +0.0 55.2 104.2 -49.0 Horiz -27.3 +39.2 +2.7 +3.1
15 11132.820M 38.3 +0.0 55.6 104.6 -49.0 Horiz -28.0 +39.5 +2.7 +3.1
16 6194.891M 38.7 +0.0 49.8 99.1 -49.3 Horiz -27.8 +34.9 +1.9 +2.1
17 17276.960M 38.6 +0.0 58.3 108.6 -50.3 Horiz -29.4 +41.6 +3.5 +4.0
18 7187.883M 37.7 +0.0 49.9 100.5 -50.6 Horiz -27.0 +34.7 +2.2 +2.3
19 8228.923M 36.5 +0.0 50.6 101.8 -51.2 Horiz -26.7 +36.0 +2.3 +2.5
20 15368.050M 40.3 +0.0 55.7 107.5 -51.8 Horiz -30.8 +39.3 +3.3 +3.6

Page 134 of 224Report No.: MIL05-015
21 16952.640M 39.1 +0.0 56.6 108.4 -51.8 Horiz -29.8 +39.9 +3.4 +4.0
22 16171.860M 39.4 +0.0 54.0 108.0 -54.0 Horiz -30.3 +37.9 +3.3 +3.7
23 16322.010M 38.5 +0.0 52.8 108.1 -55.3 Horiz -30.4 +37.6 +3.3 +3.8

Page 135 of 224Report No.: MIL05-015
Test Location: CKC Laboratories, Inc. •1120 Fulton Place • Fremont, CA 94539 • (510) 249 - 1170
Customer: Stanford Linear Accelerator CenterSpecification: RE102 10KHz-18GHzWork Order #: 82840 Date: 2/24/2005Test Type: Radiated Scan Time: 9:50:47 AMEquipment: TEM/TPS Sequence#: 18Manufacturer: Stanford Linear Accelerator Center Tested By: A. BrarModel: TEM/TPSS/N: GLA1754Equipment Under Test (* = UUT):
Function Manufacturer Model # S/NTEM/TPS* Stanford Linear Accelerator Center TEM/TPS GLA1754
Support Devices:Function Manufacturer Model # S/NVME Processor DAWN VME Not Listed Property Tag: GLAT0404Mouse Dell P/N X09-13962 69557-492-6014557-20350Keyboard Dell RT7D20 TH-04N454-37171-399-5494Monitor Dell 1901FP CN-05Y232-71616-41R-B363PC Dell DHM HXNLB41Power Supply BK Precision 1697 S240500299
Test Conditions / Notes:UUT is grounded to the copper table. UUT is running the FuncTest.py. Power cable is running along the front sideof the table to the 10uF feed through caps and from there to the equipment outside of the chamber. I/O cable isrouted along the power cable, 2cms from the power cable. Exposed cable lengths on the test table at 56".
Transducer Legend:T1=AMP AN00941A 50GHzT3=ANP05200 1-40GHz
T2=Horn Antenna 4660 (Fremont)T4=ANP5201 1-40GHz
Measurement Data: Reading listed by margin. Test Distance: 1 Meter# Freq Rdng T1 T2 T3 T4 Dist Corr Spec Margin Polar
MHz dBµV dB dB dB dB Table dBµV/m dBµV/m dB Ant 1 1797.121M 27.1 +0.0 25.4 25.0 +0.4 Horiz -30.2 +26.3 +1.1 +1.1
2 1825.761M 20.7 +0.0 19.3 25.0 -5.7 Horiz -30.0 +26.4 +1.1 +1.1
3 1803.280M 20.8 +0.0 19.1 25.0 -5.9 Horiz -30.2 +26.3 +1.1 +1.1
4 1819.998M 19.4 +0.0 17.9 25.0 -7.1 Horiz -30.0 +26.3 +1.1 +1.1
5 1819.794M 18.8 +0.0 17.3 25.0 -7.7 Horiz -30.0 +26.3 +1.1 +1.1
6 1819.968M 18.4 +0.0 16.9 25.0 -8.1 Horiz -30.0 +26.3 +1.1 +1.1

Page 136 of 224Report No.: MIL05-015
7 1899.931M 17.2 +0.0 16.7 25.0 -8.3 Horiz -29.3 +26.6 +1.1 +1.1
8 1819.637M 17.9 +0.0 16.4 25.0 -8.6 Horiz -30.0 +26.3 +1.1 +1.1
9 1899.986M 16.8 +0.0 16.3 25.0 -8.7 Horiz -29.3 +26.6 +1.1 +1.1
10 1819.686M 17.7 +0.0 16.2 25.0 -8.8 Horiz -30.0 +26.3 +1.1 +1.1
11 1819.665M 17.6 +0.0 16.1 25.0 -8.9 Horiz -30.0 +26.3 +1.1 +1.1
12 1899.968M 16.6 +0.0 16.1 25.0 -8.9 Horiz -29.3 +26.6 +1.1 +1.1
13 1819.589M 17.5 +0.0 16.0 25.0 -9.0 Horiz -30.0 +26.3 +1.1 +1.1
14 1825.782M 17.2 +0.0 15.8 25.0 -9.2 Horiz -30.0 +26.4 +1.1 +1.1
15 1899.859M 16.2 +0.0 15.7 25.0 -9.3 Horiz -29.3 +26.6 +1.1 +1.1
16 1899.739M 16.0 +0.0 15.5 25.0 -9.5 Horiz -29.3 +26.6 +1.1 +1.1
17 1899.806M 16.0 +0.0 15.5 25.0 -9.5 Horiz -29.3 +26.6 +1.1 +1.1
18 1797.003M 17.1 +0.0 15.4 25.0 -9.6 Horiz -30.2 +26.3 +1.1 +1.1
19 1899.706M 15.9 +0.0 15.4 25.0 -9.6 Horiz -29.3 +26.6 +1.1 +1.1
20 1899.956M 15.8 +0.0 15.3 25.0 -9.7 Horiz -29.3 +26.6 +1.1 +1.1
21 1899.888M 15.7 +0.0 15.2 25.0 -9.8 Horiz -29.3 +26.6 +1.1 +1.1
22 1820.557M 16.6 +0.0 15.1 25.0 -9.9 Horiz -30.0 +26.3 +1.1 +1.1
23 1899.913M 15.6 +0.0 15.1 25.0 -9.9 Horiz -29.3 +26.6 +1.1 +1.1
24 1899.905M 15.5 +0.0 15.0 25.0 -10.0 Horiz -29.3 +26.6 +1.1 +1.1
25 1859.948M 15.9 +0.0 14.9 25.0 -10.1 Horiz -29.7 +26.5 +1.1 +1.1
26 1899.678M 15.4 +0.0 14.9 25.0 -10.1 Horiz -29.3 +26.6 +1.1 +1.1
27 1899.622M 15.2 +0.0 14.7 25.0 -10.3 Horiz -29.3 +26.6 +1.1 +1.1

Page 137 of 224Report No.: MIL05-015
28 1819.442M 16.1 +0.0 14.6 25.0 -10.4 Horiz -30.0 +26.3 +1.1 +1.1
29 1889.647M 15.1 +0.0 14.5 25.0 -10.5 Horiz -29.4 +26.6 +1.1 +1.1
30 1899.462M 15.0 +0.0 14.5 25.0 -10.5 Horiz -29.3 +26.6 +1.1 +1.1

Page 138 of 224Report No.: MIL05-015
Test Location: CKC Laboratories, Inc. •1120 Fulton Place • Fremont, CA 94539 • (510) 249 - 1170
Customer: Stanford Linear Accelerator CenterSpecification: RE102 10KHz-18GHzWork Order #: 82840 Date: 2/24/2005Test Type: Radiated Scan Time: 10:10:15 AMEquipment: TEM/TPS Sequence#: 19Manufacturer: Stanford Linear Accelerator Center Tested By: A. BrarModel: TEM/TPSS/N: GLA1754Equipment Under Test (* = UUT):
Function Manufacturer Model # S/NTEM/TPS* Stanford Linear Accelerator Center TEM/TPS GLA1754
Support Devices:Function Manufacturer Model # S/NVME Processor DAWN VME Not Listed Property Tag: GLAT0404Mouse Dell P/N X09-13962 69557-492-6014557-20350Keyboard Dell RT7D20 TH-04N454-37171-399-5494Monitor Dell 1901FP CN-05Y232-71616-41R-B363PC Dell DHM HXNLB41Power Supply BK Precision 1697 S240500299
Test Conditions / Notes:UUT is grounded to the copper table. UUT is running the FuncTest.py. Power cable is running along the front sideof the table to the 10uF feed through caps and from there to the equipment outside of the chamber. I/O cable isrouted along the power cable, 2cms from the power cable. Exposed cable lengths on the test table at 56".
Transducer Legend:T1=AMP AN00941A 50GHzT3=ANP05200 1-40GHz
T2=Horn Antenna 4660 (Fremont)T4=ANP5201 1-40GHz
Measurement Data: Reading listed by margin. Test Distance: 1 Meter# Freq Rdng T1 T2 T3 T4 Dist Corr Spec Margin Polar
MHz dBµV dB dB dB dB Table dBµV/m dBµV/m dB Ant 1 2020.173M 22.0 +0.0 22.4 25.0 -2.6 Horiz -28.9 +27.0 +1.1 +1.2
2 2020.011M 20.8 +0.0 21.2 25.0 -3.8 Horiz -28.9 +27.0 +1.1 +1.2
3 1996.800M 18.9 +0.0 19.1 25.0 -5.9 Horiz -29.0 +26.9 +1.1 +1.2
4 2020.654M 17.7 +0.0 18.1 25.0 -6.9 Horiz -28.9 +27.0 +1.1 +1.2
5 1991.740M 17.0 +0.0 17.2 25.0 -7.8 Horiz -29.0 +26.9 +1.1 +1.2
6 2019.104M 16.8 +0.0 17.2 25.0 -7.8 Horiz -28.9 +27.0 +1.1 +1.2

Page 139 of 224Report No.: MIL05-015
7 2000.257M 16.0 +0.0 16.2 25.0 -8.8 Horiz -29.0 +26.9 +1.1 +1.2
8 1999.882M 15.9 +0.0 16.1 25.0 -8.9 Horiz -29.0 +26.9 +1.1 +1.2
9 2000.464M 15.9 +0.0 16.1 25.0 -8.9 Horiz -29.0 +26.9 +1.1 +1.2
10 2000.065M 15.8 +0.0 16.0 25.0 -9.0 Horiz -29.0 +26.9 +1.1 +1.2
11 2019.026M 15.6 +0.0 16.0 25.0 -9.0 Horiz -28.9 +27.0 +1.1 +1.2
12 2000.152M 15.5 +0.0 15.7 25.0 -9.3 Horiz -29.0 +26.9 +1.1 +1.2
13 2000.587M 15.4 +0.0 15.6 25.0 -9.4 Horiz -29.0 +26.9 +1.1 +1.2
14 2000.395M 15.3 +0.0 15.5 25.0 -9.5 Horiz -29.0 +26.9 +1.1 +1.2
15 1900.033M 15.8 +0.0 15.3 25.0 -9.7 Horiz -29.3 +26.6 +1.1 +1.1
16 2000.188M 15.1 +0.0 15.3 25.0 -9.7 Horiz -29.0 +26.9 +1.1 +1.2
17 1990.392M 15.0 +0.0 15.2 25.0 -9.8 Horiz -29.0 +26.9 +1.1 +1.2
18 1900.000M 15.6 +0.0 15.1 25.0 -9.9 Horiz -29.3 +26.6 +1.1 +1.1
19 1980.286M 15.1 +0.0 15.1 25.0 -9.9 Horiz -29.1 +26.8 +1.1 +1.2
20 1980.500M 15.1 +0.0 15.1 25.0 -9.9 Horiz -29.1 +26.8 +1.1 +1.2
21 2018.873M 14.7 +0.0 15.1 25.0 -9.9 Horiz -28.9 +27.0 +1.1 +1.2
22 2021.200M 14.7 +0.0 15.1 25.0 -9.9 Horiz -28.9 +27.0 +1.1 +1.2
23 1995.939M 14.8 +0.0 15.0 25.0 -10.0 Horiz -29.0 +26.9 +1.1 +1.2
24 2014.717M 14.7 +0.0 15.0 25.0 -10.0 Horiz -29.0 +27.0 +1.1 +1.2
25 1980.656M 14.7 +0.0 14.7 25.0 -10.3 Horiz -29.1 +26.8 +1.1 +1.2
26 1982.575M 14.7 +0.0 14.7 25.0 -10.3 Horiz -29.1 +26.8 +1.1 +1.2
27 1996.719M 14.5 +0.0 14.7 25.0 -10.3 Horiz -29.0 +26.9 +1.1 +1.2

Page 140 of 224Report No.: MIL05-015
28 1998.182M 14.5 +0.0 14.7 25.0 -10.3 Horiz -29.0 +26.9 +1.1 +1.2
29 1998.329M 14.3 +0.0 14.5 25.0 -10.5 Horiz -29.0 +26.9 +1.1 +1.2
30 2028.834M 14.1 +0.0 14.5 25.0 -10.5 Horiz -28.9 +27.0 +1.1 +1.2

Page 141 of 224Report No.: MIL05-015
Test Location: CKC Laboratories, Inc. •1120 Fulton Place • Fremont, CA 94539 • (510) 249 - 1170
Customer: Stanford Linear Accelerator CenterSpecification: RE102 10KHz-18GHzWork Order #: 82840 Date: 2/24/2005Test Type: Radiated Scan Time: 10:29:00 AMEquipment: TEM/TPS Sequence#: 20Manufacturer: Stanford Linear Accelerator Center Tested By: A. BrarModel: TEM/TPSS/N: GLA1754Equipment Under Test (* = UUT):
Function Manufacturer Model # S/NTEM/TPS* Stanford Linear Accelerator Center TEM/TPS GLA1754
Support Devices:Function Manufacturer Model # S/NVME Processor DAWN VME Not Listed Property Tag: GLAT0404Mouse Dell P/N X09-13962 69557-492-6014557-20350Keyboard Dell RT7D20 TH-04N454-37171-399-5494Monitor Dell 1901FP CN-05Y232-71616-41R-B363PC Dell DHM HXNLB41Power Supply BK Precision 1697 S240500299
Test Conditions / Notes:UUT is grounded to the copper table. UUT is running the FuncTest.py. Power cable is running along the front sideof the table to the 10uF feed through caps and from there to the equipment outside of the chamber. I/O cable isrouted along the power cable, 2cms from the power cable. Exposed cable lengths on the test table at 56".
Transducer Legend:T1=AMP AN00941A 50GHzT3=ANP05200 1-40GHz
T2=Horn Antenna 4660 (Fremont)T4=ANP5201 1-40GHz
Measurement Data: Reading listed by margin. Test Distance: 1 Meter# Freq Rdng T1 T2 T3 T4 Dist Corr Spec Margin Polar
MHz dBµV dB dB dB dB Table dBµV/m dBµV/m dB Ant 1 2100.002M 19.7 +0.0 20.7 25.0 -4.3 Horiz -28.7 +27.3 +1.2 +1.2
2 2100.047M 19.7 +0.0 20.7 25.0 -4.3 Horiz -28.7 +27.3 +1.2 +1.2
3 2099.846M 19.6 +0.0 20.6 25.0 -4.4 Horiz -28.7 +27.3 +1.2 +1.2
4 2099.903M 19.2 +0.0 20.2 25.0 -4.8 Horiz -28.7 +27.3 +1.2 +1.2
5 2099.771M 19.1 +0.0 20.1 25.0 -4.9 Horiz -28.7 +27.3 +1.2 +1.2
6 2103.840M 19.1 +0.0 20.1 25.0 -4.9 Horiz -28.7 +27.3 +1.2 +1.2

Page 142 of 224Report No.: MIL05-015
7 2099.924M 18.9 +0.0 19.9 25.0 -5.1 Horiz -28.7 +27.3 +1.2 +1.2
8 2099.963M 18.8 +0.0 19.8 25.0 -5.2 Horiz -28.7 +27.3 +1.2 +1.2
9 2100.675M 17.4 +0.0 18.4 25.0 -6.6 Horiz -28.7 +27.3 +1.2 +1.2
10 2119.912M 16.9 +0.0 17.9 25.0 -7.1 Horiz -28.8 +27.4 +1.2 +1.2
11 2120.092M 16.9 +0.0 17.9 25.0 -7.1 Horiz -28.8 +27.4 +1.2 +1.2
12 2100.648M 16.7 +0.0 17.7 25.0 -7.3 Horiz -28.7 +27.3 +1.2 +1.2
13 2099.323M 16.6 +0.0 17.6 25.0 -7.4 Horiz -28.7 +27.3 +1.2 +1.2
14 2039.970M 17.0 +0.0 17.5 25.0 -7.5 Horiz -28.9 +27.1 +1.1 +1.2
15 2060.556M 16.8 +0.0 17.5 25.0 -7.5 Horiz -28.8 +27.1 +1.2 +1.2
16 2060.096M 16.7 +0.0 17.4 25.0 -7.6 Horiz -28.8 +27.1 +1.2 +1.2
17 2120.674M 16.3 +0.0 17.3 25.0 -7.7 Horiz -28.8 +27.4 +1.2 +1.2
18 2099.375M 16.1 +0.0 17.1 25.0 -7.9 Horiz -28.7 +27.3 +1.2 +1.2
19 2159.508M 16.3 +0.0 17.1 25.0 -7.9 Horiz -29.1 +27.5 +1.2 +1.2
20 2039.898M 16.5 +0.0 17.0 25.0 -8.0 Horiz -28.9 +27.1 +1.1 +1.2
21 2040.216M 16.4 +0.0 16.9 25.0 -8.1 Horiz -28.9 +27.1 +1.1 +1.2
22 2159.999M 16.1 +0.0 16.9 25.0 -8.1 Horiz -29.1 +27.5 +1.2 +1.2
23 2059.937M 16.1 +0.0 16.8 25.0 -8.2 Horiz -28.8 +27.1 +1.2 +1.2
24 2099.401M 15.8 +0.0 16.8 25.0 -8.2 Horiz -28.7 +27.3 +1.2 +1.2
25 2159.992M 16.0 +0.0 16.8 25.0 -8.2 Horiz -29.1 +27.5 +1.2 +1.2
26 2040.333M 16.2 +0.0 16.7 25.0 -8.3 Horiz -28.9 +27.1 +1.1 +1.2
27 2099.245M 15.6 +0.0 16.6 25.0 -8.4 Horiz -28.7 +27.3 +1.2 +1.2

Page 143 of 224Report No.: MIL05-015
28 2159.803M 15.8 +0.0 16.6 25.0 -8.4 Horiz -29.1 +27.5 +1.2 +1.2
29 2159.929M 15.7 +0.0 16.5 25.0 -8.5 Horiz -29.1 +27.5 +1.2 +1.2
30 2100.867M 15.4 +0.0 16.4 25.0 -8.6 Horiz -28.7 +27.3 +1.2 +1.2

Page 144 of 224Report No.: MIL05-015
Test Location: CKC Laboratories, Inc. •1120 Fulton Place • Fremont, CA 94539 • (510) 249 - 1170
Customer: Stanford Linear Accelerator CenterSpecification: RE102 10KHz-18GHzWork Order #: 82840 Date: 2/24/2005Test Type: Radiated Scan Time: 10:46:00 AMEquipment: TEM/TPS Sequence#: 21Manufacturer: Stanford Linear Accelerator Center Tested By: A. BrarModel: TEM/TPSS/N: GLA1754Equipment Under Test (* = UUT):
Function Manufacturer Model # S/NTEM/TPS* Stanford Linear Accelerator Center TEM/TPS GLA1754
Support Devices:Function Manufacturer Model # S/NVME Processor DAWN VME Not Listed Property Tag: GLAT0404Mouse Dell P/N X09-13962 69557-492-6014557-20350Keyboard Dell RT7D20 TH-04N454-37171-399-5494Monitor Dell 1901FP CN-05Y232-71616-41R-B363PC Dell DHM HXNLB41Power Supply BK Precision 1697 S240500299
Test Conditions / Notes:UUT is grounded to the copper table. UUT is running the FuncTest.py. Power cable is running along the front sideof the table to the 10uF feed through caps and from there to the equipment outside of the chamber. I/O cable isrouted along the power cable, 2cms from the power cable. Exposed cable lengths on the test table at 56".
Transducer Legend:T1=AMP AN00941A 50GHzT3=ANP05200 1-40GHz
T2=Horn Antenna 4660 (Fremont)T4=ANP5201 1-40GHz
Measurement Data: Reading listed by margin. Test Distance: 1 Meter# Freq Rdng T1 T2 T3 T4 Dist Corr Spec Margin Polar
MHz dBµV dB dB dB dB Table dBµV/m dBµV/m dB Ant 1 2239.995M 19.8 +0.0 20.5 25.0 -4.5 Horiz -29.5 +27.8 +1.2 +1.2
2 2239.878M 19.6 +0.0 20.3 25.0 -4.7 Horiz -29.5 +27.8 +1.2 +1.2
3 2196.483M 19.2 +0.0 20.0 25.0 -5.0 Horiz -29.3 +27.7 +1.2 +1.2
4 2280.156M 19.2 +0.0 19.9 25.0 -5.1 Horiz -29.7 +28.0 +1.2 +1.2
5 2239.812M 19.0 +0.0 19.7 25.0 -5.3 Horiz -29.5 +27.8 +1.2 +1.2
6 2279.817M 18.7 +0.0 19.4 25.0 -5.6 Horiz -29.7 +28.0 +1.2 +1.2

Page 145 of 224Report No.: MIL05-015
7 2260.007M 18.1 +0.0 18.8 25.0 -6.2 Horiz -29.6 +27.9 +1.2 +1.2
8 2259.926M 17.1 +0.0 17.8 25.0 -7.2 Horiz -29.6 +27.9 +1.2 +1.2
9 2260.400M 17.1 +0.0 17.8 25.0 -7.2 Horiz -29.6 +27.9 +1.2 +1.2
10 2208.290M 16.9 +0.0 17.7 25.0 -7.3 Horiz -29.3 +27.7 +1.2 +1.2
11 2260.121M 17.0 +0.0 17.7 25.0 -7.3 Horiz -29.6 +27.9 +1.2 +1.2
12 2279.462M 17.0 +0.0 17.7 25.0 -7.3 Horiz -29.7 +28.0 +1.2 +1.2
13 2199.630M 16.8 +0.0 17.6 25.0 -7.4 Horiz -29.3 +27.7 +1.2 +1.2
14 2200.098M 16.8 +0.0 17.6 25.0 -7.4 Horiz -29.3 +27.7 +1.2 +1.2
15 2259.802M 16.9 +0.0 17.6 25.0 -7.4 Horiz -29.6 +27.9 +1.2 +1.2
16 2280.529M 16.9 +0.0 17.6 25.0 -7.4 Horiz -29.7 +28.0 +1.2 +1.2
17 2160.000M 16.7 +0.0 17.5 25.0 -7.5 Horiz -29.1 +27.5 +1.2 +1.2
18 2259.727M 16.7 +0.0 17.4 25.0 -7.6 Horiz -29.6 +27.9 +1.2 +1.2
19 2199.870M 16.5 +0.0 17.3 25.0 -7.7 Horiz -29.3 +27.7 +1.2 +1.2
20 2279.420M 16.6 +0.0 17.3 25.0 -7.7 Horiz -29.7 +28.0 +1.2 +1.2
21 2260.139M 16.5 +0.0 17.2 25.0 -7.8 Horiz -29.6 +27.9 +1.2 +1.2
22 2299.922M 16.5 +0.0 17.1 25.0 -7.9 Horiz -29.8 +28.0 +1.2 +1.2
23 2239.241M 16.2 +0.0 16.9 25.0 -8.1 Horiz -29.5 +27.8 +1.2 +1.2
24 2280.616M 16.2 +0.0 16.9 25.0 -8.1 Horiz -29.7 +28.0 +1.2 +1.2
25 2199.708M 16.0 +0.0 16.8 25.0 -8.2 Horiz -29.3 +27.7 +1.2 +1.2
26 2260.421M 16.1 +0.0 16.8 25.0 -8.2 Horiz -29.6 +27.9 +1.2 +1.2
27 2260.577M 16.0 +0.0 16.7 25.0 -8.3 Horiz -29.6 +27.9 +1.2 +1.2
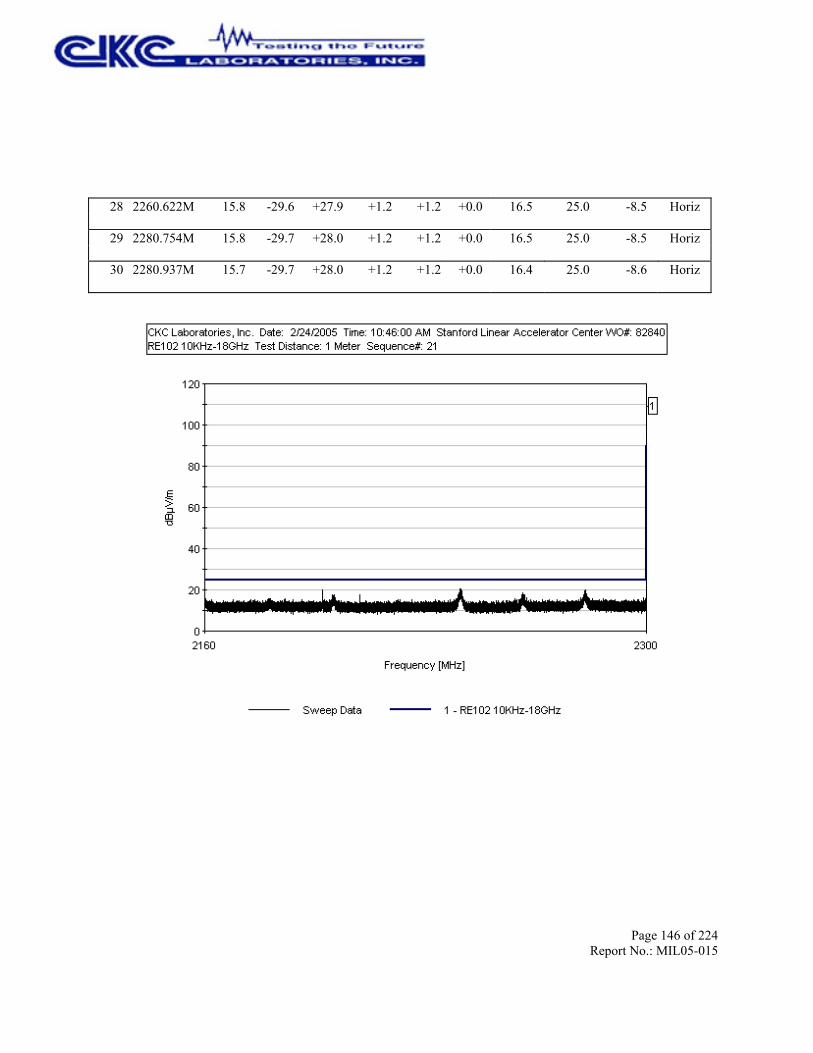
Page 146 of 224Report No.: MIL05-015
28 2260.622M 15.8 +0.0 16.5 25.0 -8.5 Horiz -29.6 +27.9 +1.2 +1.2
29 2280.754M 15.8 +0.0 16.5 25.0 -8.5 Horiz -29.7 +28.0 +1.2 +1.2
30 2280.937M 15.7 +0.0 16.4 25.0 -8.6 Horiz -29.7 +28.0 +1.2 +1.2
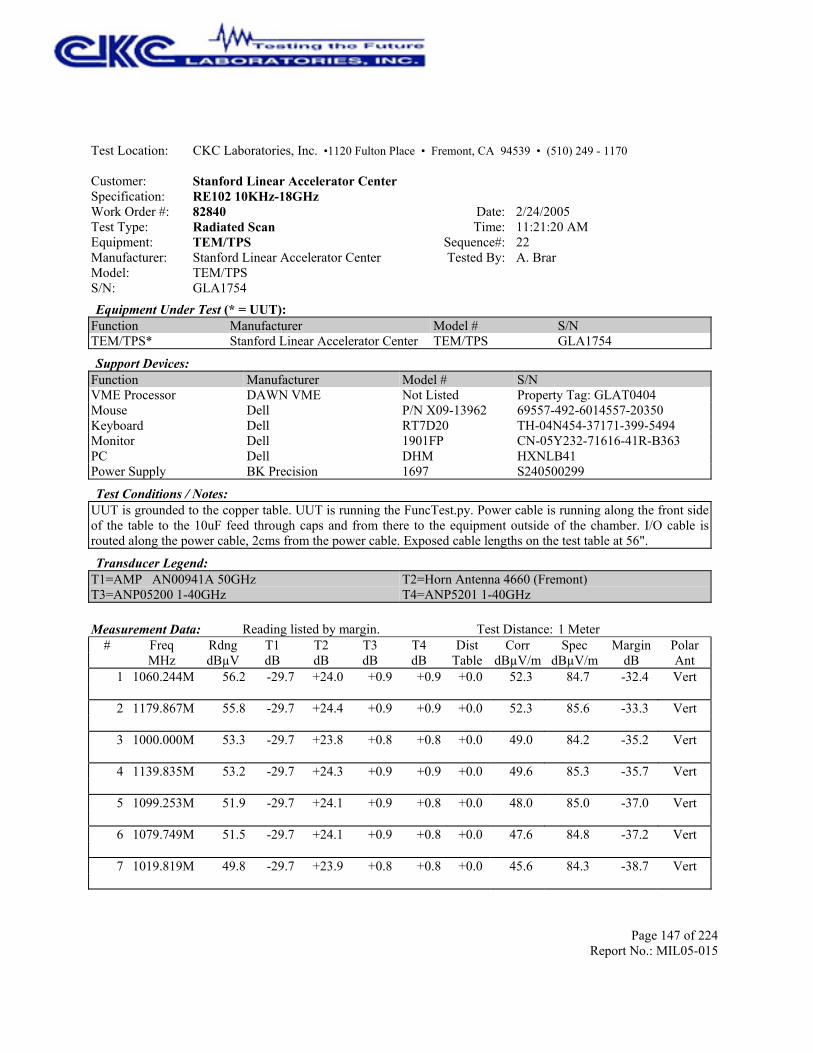
Page 147 of 224Report No.: MIL05-015
Test Location: CKC Laboratories, Inc. •1120 Fulton Place • Fremont, CA 94539 • (510) 249 - 1170
Customer: Stanford Linear Accelerator CenterSpecification: RE102 10KHz-18GHzWork Order #: 82840 Date: 2/24/2005Test Type: Radiated Scan Time: 11:21:20 AMEquipment: TEM/TPS Sequence#: 22Manufacturer: Stanford Linear Accelerator Center Tested By: A. BrarModel: TEM/TPSS/N: GLA1754Equipment Under Test (* = UUT):
Function Manufacturer Model # S/NTEM/TPS* Stanford Linear Accelerator Center TEM/TPS GLA1754
Support Devices:Function Manufacturer Model # S/NVME Processor DAWN VME Not Listed Property Tag: GLAT0404Mouse Dell P/N X09-13962 69557-492-6014557-20350Keyboard Dell RT7D20 TH-04N454-37171-399-5494Monitor Dell 1901FP CN-05Y232-71616-41R-B363PC Dell DHM HXNLB41Power Supply BK Precision 1697 S240500299
Test Conditions / Notes:UUT is grounded to the copper table. UUT is running the FuncTest.py. Power cable is running along the front sideof the table to the 10uF feed through caps and from there to the equipment outside of the chamber. I/O cable isrouted along the power cable, 2cms from the power cable. Exposed cable lengths on the test table at 56".
Transducer Legend:T1=AMP AN00941A 50GHzT3=ANP05200 1-40GHz
T2=Horn Antenna 4660 (Fremont)T4=ANP5201 1-40GHz
Measurement Data: Reading listed by margin. Test Distance: 1 Meter# Freq Rdng T1 T2 T3 T4 Dist Corr Spec Margin Polar
MHz dBµV dB dB dB dB Table dBµV/m dBµV/m dB Ant 1 1060.244M 56.2 +0.0 52.3 84.7 -32.4 Vert -29.7 +24.0 +0.9 +0.9
2 1179.867M 55.8 +0.0 52.3 85.6 -33.3 Vert -29.7 +24.4 +0.9 +0.9
3 1000.000M 53.3 +0.0 49.0 84.2 -35.2 Vert -29.7 +23.8 +0.8 +0.8
4 1139.835M 53.2 +0.0 49.6 85.3 -35.7 Vert -29.7 +24.3 +0.9 +0.9
5 1099.253M 51.9 +0.0 48.0 85.0 -37.0 Vert -29.7 +24.1 +0.9 +0.8
6 1079.749M 51.5 +0.0 47.6 84.8 -37.2 Vert -29.7 +24.1 +0.9 +0.8
7 1019.819M 49.8 +0.0 45.6 84.3 -38.7 Vert -29.7 +23.9 +0.8 +0.8
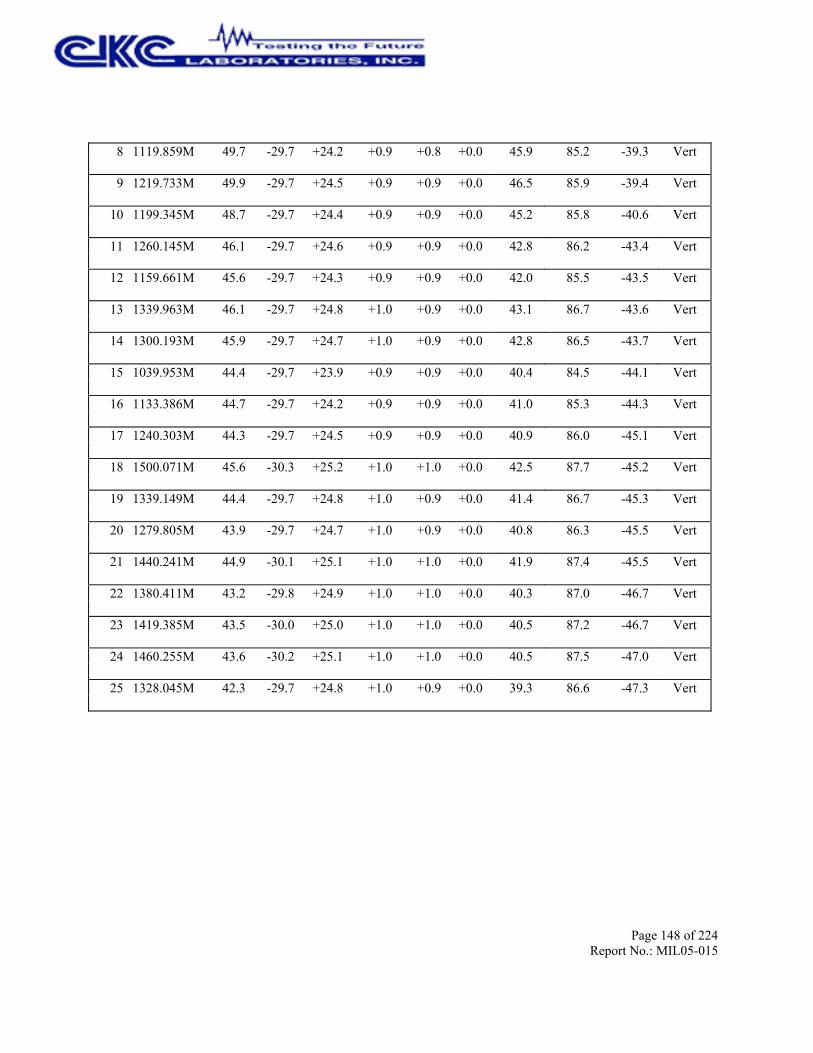
Page 148 of 224Report No.: MIL05-015
8 1119.859M 49.7 +0.0 45.9 85.2 -39.3 Vert -29.7 +24.2 +0.9 +0.8
9 1219.733M 49.9 +0.0 46.5 85.9 -39.4 Vert -29.7 +24.5 +0.9 +0.9
10 1199.345M 48.7 +0.0 45.2 85.8 -40.6 Vert -29.7 +24.4 +0.9 +0.9
11 1260.145M 46.1 +0.0 42.8 86.2 -43.4 Vert -29.7 +24.6 +0.9 +0.9
12 1159.661M 45.6 +0.0 42.0 85.5 -43.5 Vert -29.7 +24.3 +0.9 +0.9
13 1339.963M 46.1 +0.0 43.1 86.7 -43.6 Vert -29.7 +24.8 +1.0 +0.9
14 1300.193M 45.9 +0.0 42.8 86.5 -43.7 Vert -29.7 +24.7 +1.0 +0.9
15 1039.953M 44.4 +0.0 40.4 84.5 -44.1 Vert -29.7 +23.9 +0.9 +0.9
16 1133.386M 44.7 +0.0 41.0 85.3 -44.3 Vert -29.7 +24.2 +0.9 +0.9
17 1240.303M 44.3 +0.0 40.9 86.0 -45.1 Vert -29.7 +24.5 +0.9 +0.9
18 1500.071M 45.6 +0.0 42.5 87.7 -45.2 Vert -30.3 +25.2 +1.0 +1.0
19 1339.149M 44.4 +0.0 41.4 86.7 -45.3 Vert -29.7 +24.8 +1.0 +0.9
20 1279.805M 43.9 +0.0 40.8 86.3 -45.5 Vert -29.7 +24.7 +1.0 +0.9
21 1440.241M 44.9 +0.0 41.9 87.4 -45.5 Vert -30.1 +25.1 +1.0 +1.0
22 1380.411M 43.2 +0.0 40.3 87.0 -46.7 Vert -29.8 +24.9 +1.0 +1.0
23 1419.385M 43.5 +0.0 40.5 87.2 -46.7 Vert -30.0 +25.0 +1.0 +1.0
24 1460.255M 43.6 +0.0 40.5 87.5 -47.0 Vert -30.2 +25.1 +1.0 +1.0
25 1328.045M 42.3 +0.0 39.3 86.6 -47.3 Vert -29.7 +24.8 +1.0 +0.9
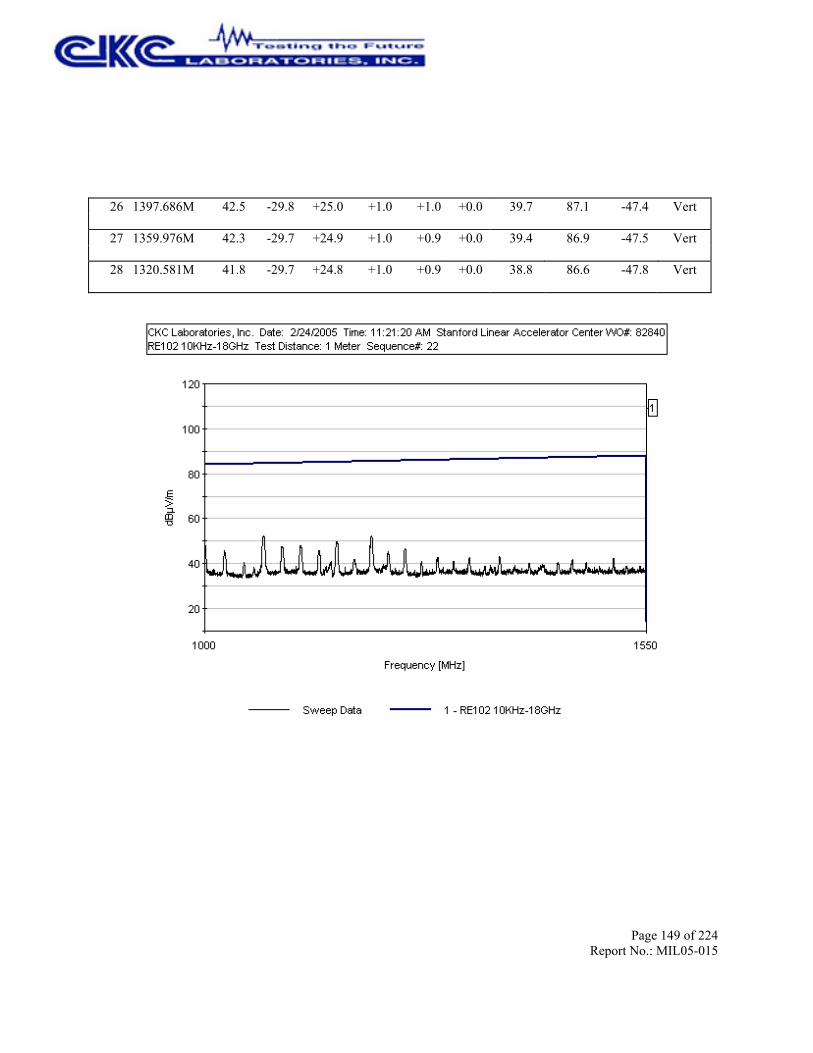
Page 149 of 224Report No.: MIL05-015
26 1397.686M 42.5 +0.0 39.7 87.1 -47.4 Vert -29.8 +25.0 +1.0 +1.0
27 1359.976M 42.3 +0.0 39.4 86.9 -47.5 Vert -29.7 +24.9 +1.0 +0.9
28 1320.581M 41.8 +0.0 38.8 86.6 -47.8 Vert -29.7 +24.8 +1.0 +0.9

Page 150 of 224Report No.: MIL05-015
Test Location: CKC Laboratories, Inc. •1120 Fulton Place • Fremont, CA 94539 • (510) 249 - 1170
Customer: Stanford Linear Accelerator CenterSpecification: RE102 10KHz-18GHzWork Order #: 82840 Date: 2/24/2005Test Type: Radiated Scan Time: 11:23:25 AMEquipment: TEM/TPS Sequence#: 23Manufacturer: Stanford Linear Accelerator Center Tested By: A. BrarModel: TEM/TPSS/N: GLA1754Equipment Under Test (* = UUT):
Function Manufacturer Model # S/NTEM/TPS* Stanford Linear Accelerator Center TEM/TPS GLA1754
Support Devices:Function Manufacturer Model # S/NVME Processor DAWN VME Not Listed Property Tag: GLAT0404Mouse Dell P/N X09-13962 69557-492-6014557-20350Keyboard Dell RT7D20 TH-04N454-37171-399-5494Monitor Dell 1901FP CN-05Y232-71616-41R-B363PC Dell DHM HXNLB41Power Supply BK Precision 1697 S240500299
Test Conditions / Notes:UUT is grounded to the copper table. UUT is running the FuncTest.py. Power cable is running along the front sideof the table to the 10uF feed through caps and from there to the equipment outside of the chamber. I/O cable isrouted along the power cable, 2cms from the power cable. Exposed cable lengths on the test table at 56".
Transducer Legend:T1=AMP AN00941A 50GHzT3=ANP05200 1-40GHz
T2=Horn Antenna 4660 (Fremont)T4=ANP5201 1-40GHz
Measurement Data: Reading listed by margin. Test Distance: 1 Meter# Freq Rdng T1 T2 T3 T4 Dist Corr Spec Margin Polar
MHz dBµV dB dB dB dB Table dBµV/m dBµV/m dB Ant 1 1599.990M 26.8 +0.0 24.1 14.0 +10.1 Vert -30.3 +25.6 +1.0 +1.0
2 1599.703M 24.7 +0.0 22.0 14.0 +8.0 Vert -30.3 +25.6 +1.0 +1.0
3 1560.000M 22.3 +0.0 19.4 14.0 +5.4 Vert -30.3 +25.4 +1.0 +1.0
4 1599.461M 22.1 +0.0 19.4 14.0 +5.4 Vert -30.3 +25.6 +1.0 +1.0
5 1599.409M 20.7 +0.0 18.0 14.0 +4.0 Vert -30.3 +25.6 +1.0 +1.0
6 1580.025M 19.3 +0.0 16.5 14.0 +2.5 Vert -30.3 +25.5 +1.0 +1.0

Page 151 of 224Report No.: MIL05-015
7 1579.842M 18.9 +0.0 16.1 14.0 +2.1 Vert -30.3 +25.5 +1.0 +1.0
8 1579.932M 18.9 +0.0 16.1 14.0 +2.1 Vert -30.3 +25.5 +1.0 +1.0
9 1580.223M 18.4 +0.0 15.6 14.0 +1.6 Vert -30.3 +25.5 +1.0 +1.0
10 1580.036M 18.3 +0.0 15.5 14.0 +1.5 Vert -30.3 +25.5 +1.0 +1.0
11 1580.082M 17.8 +0.0 15.0 14.0 +1.0 Vert -30.3 +25.5 +1.0 +1.0
12 1580.118M 17.8 +0.0 15.0 14.0 +1.0 Vert -30.3 +25.5 +1.0 +1.0
13 1597.439M 17.2 +0.0 14.5 14.0 +0.5 Vert -30.3 +25.6 +1.0 +1.0
14 1579.493M 17.2 +0.0 14.4 14.0 +0.4 Vert -30.3 +25.5 +1.0 +1.0
15 1598.857M 16.8 +0.0 14.1 14.0 +0.1 Vert -30.3 +25.6 +1.0 +1.0
16 1598.937M 16.8 +0.0 14.1 14.0 +0.1 Vert -30.3 +25.6 +1.0 +1.0
17 1599.063M 16.6 +0.0 13.9 14.0 -0.1 Vert -30.3 +25.6 +1.0 +1.0
18 1598.997M 16.4 +0.0 13.7 14.0 -0.3 Vert -30.3 +25.6 +1.0 +1.0
19 1598.979M 16.3 +0.0 13.6 14.0 -0.4 Vert -30.3 +25.6 +1.0 +1.0
20 1598.866M 16.2 +0.0 13.5 14.0 -0.5 Vert -30.3 +25.6 +1.0 +1.0
21 1579.418M 16.1 +0.0 13.3 14.0 -0.7 Vert -30.3 +25.5 +1.0 +1.0
22 1596.848M 16.0 +0.0 13.3 14.0 -0.7 Vert -30.3 +25.6 +1.0 +1.0
23 1598.976M 16.0 +0.0 13.3 14.0 -0.7 Vert -30.3 +25.6 +1.0 +1.0
24 1579.517M 15.8 +0.0 13.0 14.0 -1.0 Vert -30.3 +25.5 +1.0 +1.0
25 1597.893M 15.7 +0.0 13.0 14.0 -1.0 Vert -30.3 +25.6 +1.0 +1.0
26 1561.697M 15.8 +0.0 12.9 14.0 -1.1 Vert -30.3 +25.4 +1.0 +1.0
27 1594.061M 15.6 +0.0 12.9 14.0 -1.1 Vert -30.3 +25.6 +1.0 +1.0

Page 152 of 224Report No.: MIL05-015
28 1579.199M 15.6 +0.0 12.8 14.0 -1.2 Vert -30.3 +25.5 +1.0 +1.0
29 1587.854M 15.5 +0.0 12.7 14.0 -1.3 Vert -30.3 +25.5 +1.0 +1.0
30 1595.478M 15.4 +0.0 12.7 14.0 -1.3 Vert -30.3 +25.6 +1.0 +1.0

Page 153 of 224Report No.: MIL05-015
Test Location: CKC Laboratories, Inc. •1120 Fulton Place • Fremont, CA 94539 • (510) 249 - 1170
Customer: Stanford Linear Accelerator CenterSpecification: RE102 10KHz-18GHzWork Order #: 82840 Date: 2/24/2005Test Type: Radiated Scan Time: 11:30:49 AMEquipment: TEM/TPS Sequence#: 24Manufacturer: Stanford Linear Accelerator Center Tested By: A. BrarModel: TEM/TPSS/N: GLA1754Equipment Under Test (* = UUT):
Function Manufacturer Model # S/NTEM/TPS* Stanford Linear Accelerator Center TEM/TPS GLA1754
Support Devices:Function Manufacturer Model # S/NVME Processor DAWN VME Not Listed Property Tag: GLAT0404Mouse Dell P/N X09-13962 69557-492-6014557-20350Keyboard Dell RT7D20 TH-04N454-37171-399-5494Monitor Dell 1901FP CN-05Y232-71616-41R-B363PC Dell DHM HXNLB41Power Supply BK Precision 1697 S240500299
Test Conditions / Notes:UUT is grounded to the copper table. UUT is running the FuncTest.py. Power cable is running along the front sideof the table to the 10uF feed through caps and from there to the equipment outside of the chamber. I/O cable isrouted along the power cable, 2cms from the power cable. Exposed cable lengths on the test table at 56".
Transducer Legend:T1=AMP AN00941A 50GHzT3=ANP05200 1-40GHz
T2=Horn Antenna 4660 (Fremont)T4=ANP5201 1-40GHz
Measurement Data: Reading listed by margin. Test Distance: 1 Meter# Freq Rdng T1 T2 T3 T4 Dist Corr Spec Margin Polar
MHz dBµV dB dB dB dB Table dBµV/m dBµV/m dB Ant 1 1639.982M 48.5 +0.0 45.9 88.2 -42.3 Vert -30.3 +25.7 +1.0 +1.0
2 1679.808M 46.3 +0.0 44.2 88.5 -44.3 Vert -30.1 +25.9 +1.1 +1.0
3 1600.219M 45.6 +0.0 42.9 88.0 -45.1 Vert -30.3 +25.6 +1.0 +1.0
4 1699.747M 44.9 +0.0 42.9 88.6 -45.7 Vert -30.0 +25.9 +1.1 +1.0
5 1660.095M 45.0 +0.0 42.6 88.4 -45.8 Vert -30.2 +25.8 +1.0 +1.0

Page 154 of 224Report No.: MIL05-015
6 1740.063M 42.7 +0.0 41.0 88.8 -47.8 Vert -30.0 +26.1 +1.1 +1.1
7 1758.693M 42.2 +0.0 40.5 88.9 -48.4 Vert -30.0 +26.1 +1.1 +1.1
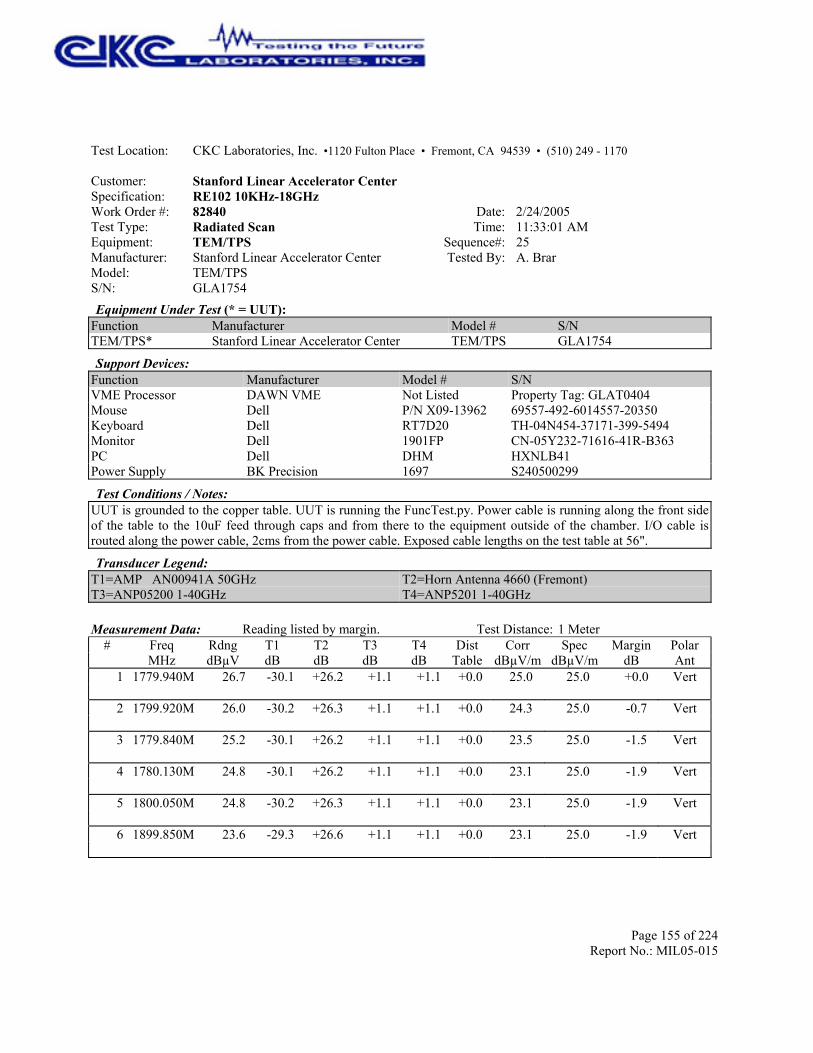
Page 155 of 224Report No.: MIL05-015
Test Location: CKC Laboratories, Inc. •1120 Fulton Place • Fremont, CA 94539 • (510) 249 - 1170
Customer: Stanford Linear Accelerator CenterSpecification: RE102 10KHz-18GHzWork Order #: 82840 Date: 2/24/2005Test Type: Radiated Scan Time: 11:33:01 AMEquipment: TEM/TPS Sequence#: 25Manufacturer: Stanford Linear Accelerator Center Tested By: A. BrarModel: TEM/TPSS/N: GLA1754Equipment Under Test (* = UUT):
Function Manufacturer Model # S/NTEM/TPS* Stanford Linear Accelerator Center TEM/TPS GLA1754
Support Devices:Function Manufacturer Model # S/NVME Processor DAWN VME Not Listed Property Tag: GLAT0404Mouse Dell P/N X09-13962 69557-492-6014557-20350Keyboard Dell RT7D20 TH-04N454-37171-399-5494Monitor Dell 1901FP CN-05Y232-71616-41R-B363PC Dell DHM HXNLB41Power Supply BK Precision 1697 S240500299
Test Conditions / Notes:UUT is grounded to the copper table. UUT is running the FuncTest.py. Power cable is running along the front sideof the table to the 10uF feed through caps and from there to the equipment outside of the chamber. I/O cable isrouted along the power cable, 2cms from the power cable. Exposed cable lengths on the test table at 56".
Transducer Legend:T1=AMP AN00941A 50GHzT3=ANP05200 1-40GHz
T2=Horn Antenna 4660 (Fremont)T4=ANP5201 1-40GHz
Measurement Data: Reading listed by margin. Test Distance: 1 Meter# Freq Rdng T1 T2 T3 T4 Dist Corr Spec Margin Polar
MHz dBµV dB dB dB dB Table dBµV/m dBµV/m dB Ant 1 1779.940M 26.7 +0.0 25.0 25.0 +0.0 Vert -30.1 +26.2 +1.1 +1.1
2 1799.920M 26.0 +0.0 24.3 25.0 -0.7 Vert -30.2 +26.3 +1.1 +1.1
3 1779.840M 25.2 +0.0 23.5 25.0 -1.5 Vert -30.1 +26.2 +1.1 +1.1
4 1780.130M 24.8 +0.0 23.1 25.0 -1.9 Vert -30.1 +26.2 +1.1 +1.1
5 1800.050M 24.8 +0.0 23.1 25.0 -1.9 Vert -30.2 +26.3 +1.1 +1.1
6 1899.850M 23.6 +0.0 23.1 25.0 -1.9 Vert -29.3 +26.6 +1.1 +1.1

Page 156 of 224Report No.: MIL05-015
7 1799.970M 24.7 +0.0 23.0 25.0 -2.0 Vert -30.2 +26.3 +1.1 +1.1
8 1800.020M 24.7 +0.0 23.0 25.0 -2.0 Vert -30.2 +26.3 +1.1 +1.1
9 1825.756M 24.4 +0.0 23.0 25.0 -2.0 Vert -30.0 +26.4 +1.1 +1.1
10 1780.030M 24.3 +0.0 22.6 25.0 -2.4 Vert -30.1 +26.2 +1.1 +1.1
11 1900.270M 23.0 +0.0 22.5 25.0 -2.5 Vert -29.3 +26.6 +1.1 +1.1
12 1779.710M 23.9 +0.0 22.2 25.0 -2.8 Vert -30.1 +26.2 +1.1 +1.1
13 2179.729M 21.4 +0.0 22.2 25.0 -2.8 Vert -29.2 +27.6 +1.2 +1.2
14 2180.531M 21.4 +0.0 22.2 25.0 -2.8 Vert -29.2 +27.6 +1.2 +1.2
15 1899.419M 22.5 +0.0 22.0 25.0 -3.0 Vert -29.3 +26.6 +1.1 +1.1
16 1940.130M 22.3 +0.0 22.0 25.0 -3.0 Vert -29.2 +26.7 +1.1 +1.1
17 2179.829M 21.2 +0.0 22.0 25.0 -3.0 Vert -29.2 +27.6 +1.2 +1.2
18 2299.517M 21.4 +0.0 22.0 25.0 -3.0 Vert -29.8 +28.0 +1.2 +1.2
19 1797.127M 23.6 +0.0 21.9 25.0 -3.1 Vert -30.2 +26.3 +1.1 +1.1
20 2260.581M 21.2 +0.0 21.9 25.0 -3.1 Vert -29.6 +27.9 +1.2 +1.2
21 2180.040M 21.0 +0.0 21.8 25.0 -3.2 Vert -29.2 +27.6 +1.2 +1.2
22 1799.530M 23.4 +0.0 21.7 25.0 -3.3 Vert -30.2 +26.3 +1.1 +1.1
23 2299.697M 21.0 +0.0 21.6 25.0 -3.4 Vert -29.8 +28.0 +1.2 +1.2
24 1799.620M 23.1 +0.0 21.4 25.0 -3.6 Vert -30.2 +26.3 +1.1 +1.1
25 2180.090M 20.6 +0.0 21.4 25.0 -3.6 Vert -29.2 +27.6 +1.2 +1.2
26 1840.010M 22.5 +0.0 21.2 25.0 -3.8 Vert -29.9 +26.4 +1.1 +1.1
27 2179.589M 20.4 +0.0 21.2 25.0 -3.8 Vert -29.2 +27.6 +1.2 +1.2

Page 157 of 224Report No.: MIL05-015
28 2099.719M 20.1 +0.0 21.1 25.0 -3.9 Vert -28.7 +27.3 +1.2 +1.2
29 2100.110M 20.1 +0.0 21.1 25.0 -3.9 Vert -28.7 +27.3 +1.2 +1.2
30 2180.460M 20.3 +0.0 21.1 25.0 -3.9 Vert -29.2 +27.6 +1.2 +1.2

Page 158 of 224Report No.: MIL05-015
Test Location: CKC Laboratories, Inc. •1120 Fulton Place • Fremont, CA 94539 • (510) 249 - 1170
Customer: Stanford Linear Accelerator CenterSpecification: RE102 10KHz-18GHzWork Order #: 82840 Date: 2/24/2005Test Type: Radiated Scan Time: 11:36:14 AMEquipment: TEM/TPS Sequence#: 26Manufacturer: Stanford Linear Accelerator Center Tested By: A. BrarModel: TEM/TPSS/N: GLA1754Equipment Under Test (* = UUT):
Function Manufacturer Model # S/NTEM/TPS* Stanford Linear Accelerator Center TEM/TPS GLA1754
Support Devices:Function Manufacturer Model # S/NVME Processor DAWN VME Not Listed Property Tag: GLAT0404Mouse Dell P/N X09-13962 69557-492-6014557-20350Keyboard Dell RT7D20 TH-04N454-37171-399-5494Monitor Dell 1901FP CN-05Y232-71616-41R-B363PC Dell DHM HXNLB41Power Supply BK Precision 1697 S240500299
Test Conditions / Notes:UUT is grounded to the copper table. UUT is running the FuncTest.py. Power cable is running along the front sideof the table to the 10uF feed through caps and from there to the equipment outside of the chamber. I/O cable isrouted along the power cable, 2cms from the power cable. Exposed cable lengths on the test table at 56".
Transducer Legend:T1=AMP AN00941A 50GHzT3=ANP05200 1-40GHz
T2=Horn Antenna 4660 (Fremont)T4=ANP5201 1-40GHz
Measurement Data: Reading listed by margin. Test Distance: 1 Meter# Freq Rdng T1 T2 T3 T4 Dist Corr Spec Margin Polar
MHz dBµV dB dB dB dB Table dBµV/m dBµV/m dB Ant 1 14070.760M 41.0 +0.0 60.2 106.7 -46.5 Vert -30.7 +43.4 +3.1 +3.4
2 13563.250M 40.3 +0.0 59.7 106.4 -46.7 Vert -30.4 +43.4 +3.0 +3.4
3 8736.430M 38.9 +0.0 55.5 102.3 -46.8 Vert -26.7 +38.3 +2.4 +2.6
4 10270.960M 39.2 +0.0 57.0 103.8 -46.8 Vert -27.3 +39.5 +2.6 +3.0
5 14562.250M 40.6 +0.0 59.7 107.0 -47.3 Vert -30.8 +43.2 +3.2 +3.5
6 10320.010M 38.8 +0.0 56.5 103.9 -47.4 Vert -27.3 +39.4 +2.6 +3.0
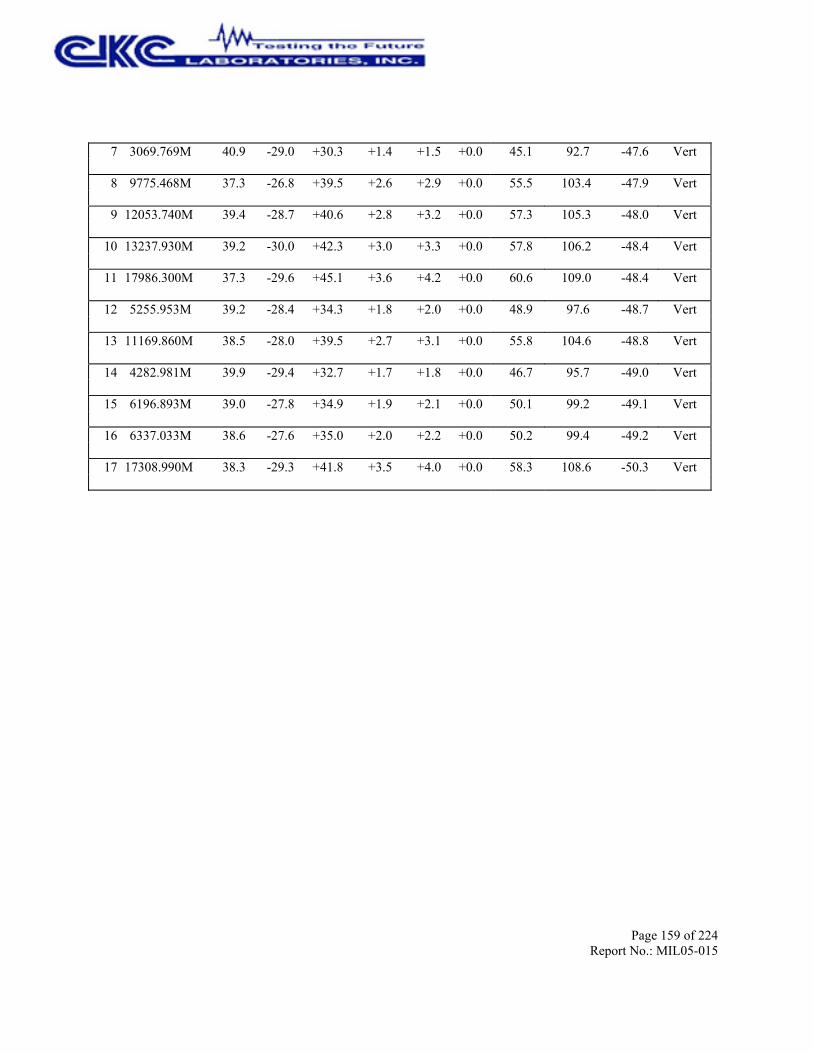
Page 159 of 224Report No.: MIL05-015
7 3069.769M 40.9 +0.0 45.1 92.7 -47.6 Vert -29.0 +30.3 +1.4 +1.5
8 9775.468M 37.3 +0.0 55.5 103.4 -47.9 Vert -26.8 +39.5 +2.6 +2.9
9 12053.740M 39.4 +0.0 57.3 105.3 -48.0 Vert -28.7 +40.6 +2.8 +3.2
10 13237.930M 39.2 +0.0 57.8 106.2 -48.4 Vert -30.0 +42.3 +3.0 +3.3
11 17986.300M 37.3 +0.0 60.6 109.0 -48.4 Vert -29.6 +45.1 +3.6 +4.2
12 5255.953M 39.2 +0.0 48.9 97.6 -48.7 Vert -28.4 +34.3 +1.8 +2.0
13 11169.860M 38.5 +0.0 55.8 104.6 -48.8 Vert -28.0 +39.5 +2.7 +3.1
14 4282.981M 39.9 +0.0 46.7 95.7 -49.0 Vert -29.4 +32.7 +1.7 +1.8
15 6196.893M 39.0 +0.0 50.1 99.2 -49.1 Vert -27.8 +34.9 +1.9 +2.1
16 6337.033M 38.6 +0.0 50.2 99.4 -49.2 Vert -27.6 +35.0 +2.0 +2.2
17 17308.990M 38.3 +0.0 58.3 108.6 -50.3 Vert -29.3 +41.8 +3.5 +4.0
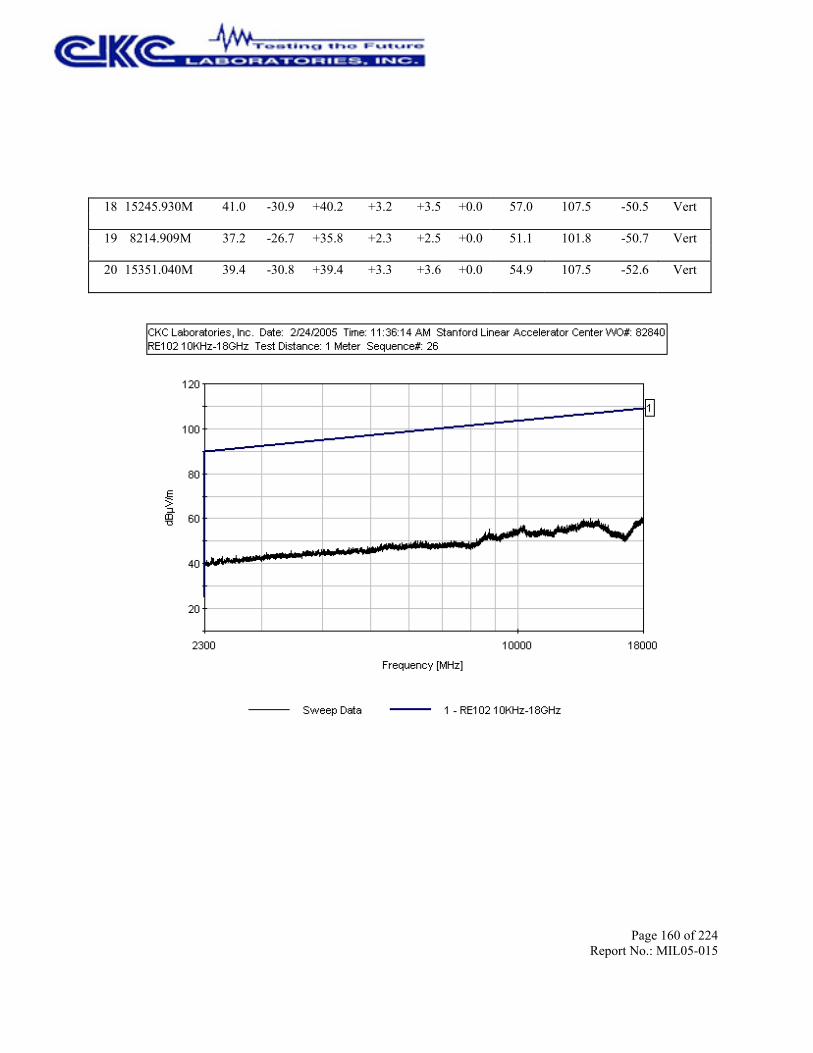
Page 160 of 224Report No.: MIL05-015
18 15245.930M 41.0 +0.0 57.0 107.5 -50.5 Vert -30.9 +40.2 +3.2 +3.5
19 8214.909M 37.2 +0.0 51.1 101.8 -50.7 Vert -26.7 +35.8 +2.3 +2.5
20 15351.040M 39.4 +0.0 54.9 107.5 -52.6 Vert -30.8 +39.4 +3.3 +3.6

Page 161 of 224Report No.: MIL05-015
Test Location: CKC Laboratories, Inc. •1120 Fulton Place • Fremont, CA 94539 • (510) 249 - 1170
Customer: Stanford Linear Accelerator CenterSpecification: RE102 10KHz-18GHzWork Order #: 82840 Date: 2/24/2005Test Type: Radiated Scan Time: 1:11:08 PMEquipment: TEM/TPS Sequence#: 27Manufacturer: Stanford Linear Accelerator Center Tested By: A. BrarModel: TEM/TPSS/N: GLA1754Equipment Under Test (* = UUT):
Function Manufacturer Model # S/NTEM/TPS* Stanford Linear Accelerator Center TEM/TPS GLA1754
Support Devices:Function Manufacturer Model # S/NVME Processor DAWN VME Not Listed Property Tag: GLAT0404Mouse Dell P/N X09-13962 69557-492-6014557-20350Keyboard Dell RT7D20 TH-04N454-37171-399-5494Monitor Dell 1901FP CN-05Y232-71616-41R-B363PC Dell DHM HXNLB41Power Supply BK Precision 1697 S240500299
Test Conditions / Notes:UUT is grounded to the copper table. UUT is running the FuncTest.py. Power cable is running along the front sideof the table to the 10uF feed through caps and from there to the equipment outside of the chamber. I/O cable isrouted along the power cable, 2cms from the power cable. Exposed cable lengths on the test table at 56". Placedfoil around JS1 connector slot. Refer to photos.
Transducer Legend:T1=AMP AN00941A 50GHzT3=ANP05200 1-40GHz
T2=Horn Antenna 4660 (Fremont)T4=ANP5201 1-40GHz
Measurement Data: Reading listed by margin. Test Distance: 1 Meter# Freq Rdng T1 T2 T3 T4 Dist Corr Spec Margin Polar
MHz dBµV dB dB dB dB Table dBµV/m dBµV/m dB Ant 1 1559.928M 26.0 +0.0 23.1 14.0 +9.1 Vert -30.3 +25.4 +1.0 +1.0
2 1560.234M 23.0 +0.0 20.1 14.0 +6.1 Vert -30.3 +25.4 +1.0 +1.0
3 1559.544M 21.9 +0.0 19.0 14.0 +5.0 Vert -30.3 +25.4 +1.0 +1.0
4 1559.523M 21.0 +0.0 18.1 14.0 +4.1 Vert -30.3 +25.4 +1.0 +1.0
5 1579.941M 19.3 +0.0 16.5 14.0 +2.5 Vert -30.3 +25.5 +1.0 +1.0
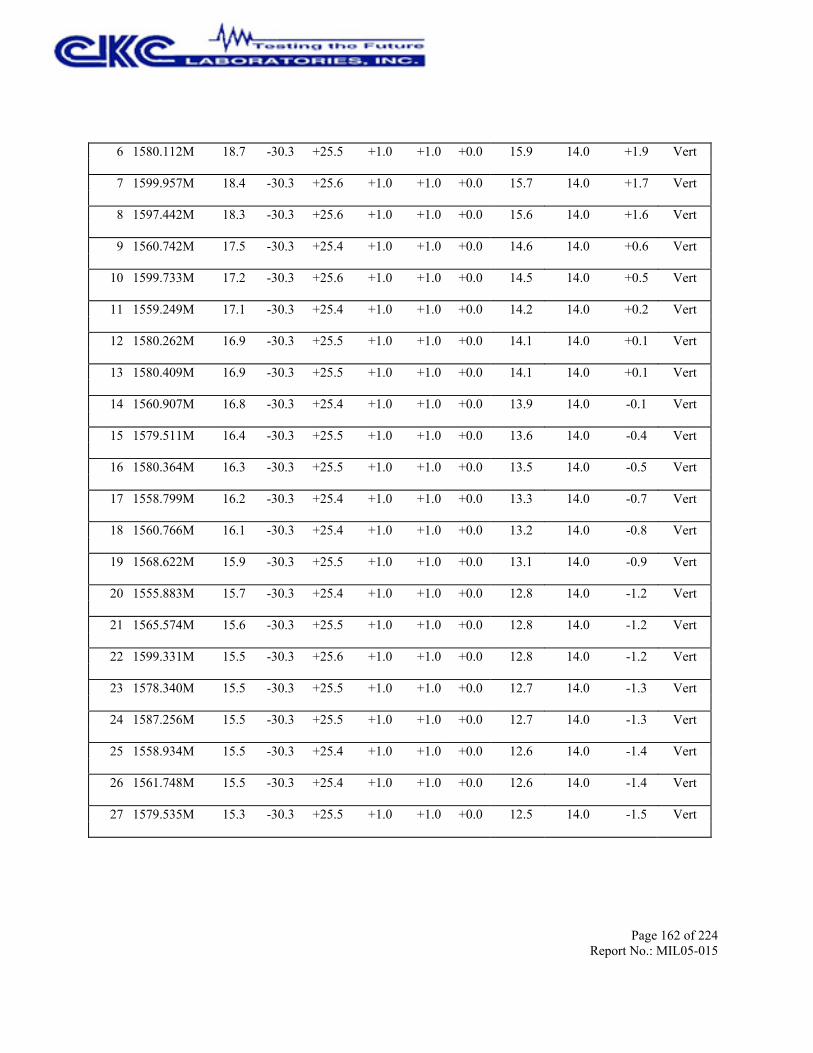
Page 162 of 224Report No.: MIL05-015
6 1580.112M 18.7 +0.0 15.9 14.0 +1.9 Vert -30.3 +25.5 +1.0 +1.0
7 1599.957M 18.4 +0.0 15.7 14.0 +1.7 Vert -30.3 +25.6 +1.0 +1.0
8 1597.442M 18.3 +0.0 15.6 14.0 +1.6 Vert -30.3 +25.6 +1.0 +1.0
9 1560.742M 17.5 +0.0 14.6 14.0 +0.6 Vert -30.3 +25.4 +1.0 +1.0
10 1599.733M 17.2 +0.0 14.5 14.0 +0.5 Vert -30.3 +25.6 +1.0 +1.0
11 1559.249M 17.1 +0.0 14.2 14.0 +0.2 Vert -30.3 +25.4 +1.0 +1.0
12 1580.262M 16.9 +0.0 14.1 14.0 +0.1 Vert -30.3 +25.5 +1.0 +1.0
13 1580.409M 16.9 +0.0 14.1 14.0 +0.1 Vert -30.3 +25.5 +1.0 +1.0
14 1560.907M 16.8 +0.0 13.9 14.0 -0.1 Vert -30.3 +25.4 +1.0 +1.0
15 1579.511M 16.4 +0.0 13.6 14.0 -0.4 Vert -30.3 +25.5 +1.0 +1.0
16 1580.364M 16.3 +0.0 13.5 14.0 -0.5 Vert -30.3 +25.5 +1.0 +1.0
17 1558.799M 16.2 +0.0 13.3 14.0 -0.7 Vert -30.3 +25.4 +1.0 +1.0
18 1560.766M 16.1 +0.0 13.2 14.0 -0.8 Vert -30.3 +25.4 +1.0 +1.0
19 1568.622M 15.9 +0.0 13.1 14.0 -0.9 Vert -30.3 +25.5 +1.0 +1.0
20 1555.883M 15.7 +0.0 12.8 14.0 -1.2 Vert -30.3 +25.4 +1.0 +1.0
21 1565.574M 15.6 +0.0 12.8 14.0 -1.2 Vert -30.3 +25.5 +1.0 +1.0
22 1599.331M 15.5 +0.0 12.8 14.0 -1.2 Vert -30.3 +25.6 +1.0 +1.0
23 1578.340M 15.5 +0.0 12.7 14.0 -1.3 Vert -30.3 +25.5 +1.0 +1.0
24 1587.256M 15.5 +0.0 12.7 14.0 -1.3 Vert -30.3 +25.5 +1.0 +1.0
25 1558.934M 15.5 +0.0 12.6 14.0 -1.4 Vert -30.3 +25.4 +1.0 +1.0
26 1561.748M 15.5 +0.0 12.6 14.0 -1.4 Vert -30.3 +25.4 +1.0 +1.0
27 1579.535M 15.3 +0.0 12.5 14.0 -1.5 Vert -30.3 +25.5 +1.0 +1.0

Page 163 of 224Report No.: MIL05-015
28 1585.067M 15.2 +0.0 12.4 14.0 -1.6 Vert -30.3 +25.5 +1.0 +1.0
29 1592.124M 15.1 +0.0 12.4 14.0 -1.6 Vert -30.3 +25.6 +1.0 +1.0
30 1594.686M 15.1 +0.0 12.4 14.0 -1.6 Vert -30.3 +25.6 +1.0 +1.0
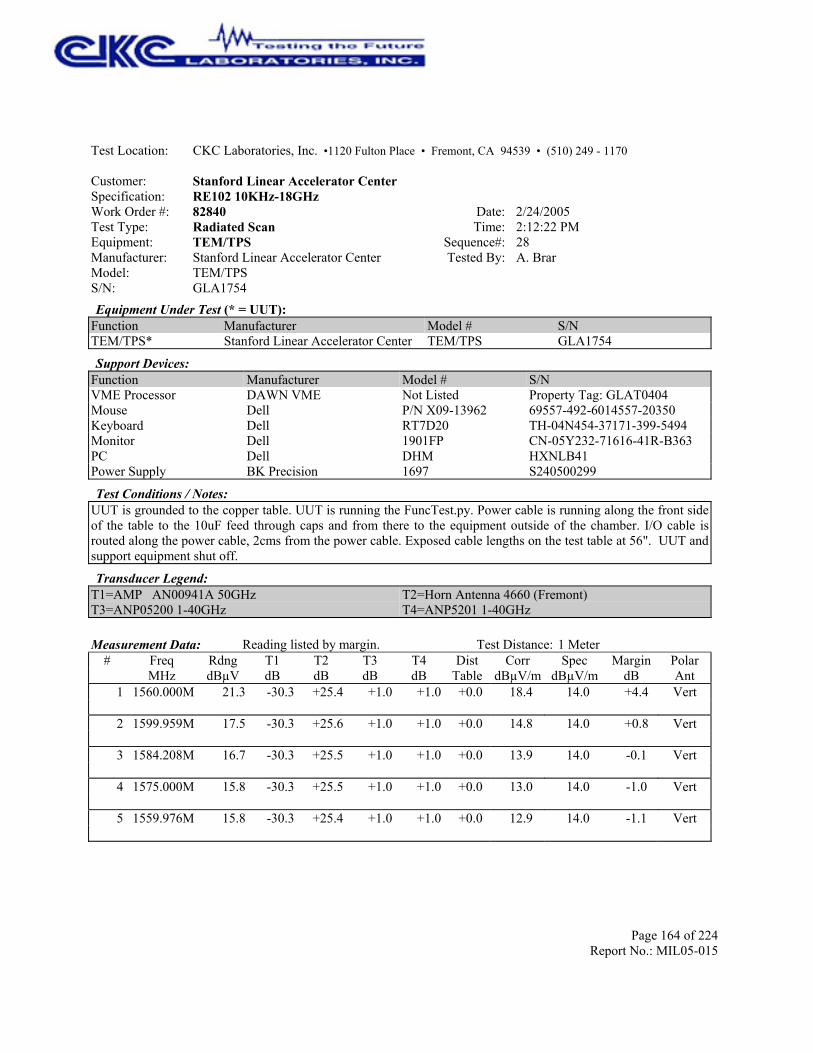
Page 164 of 224Report No.: MIL05-015
Test Location: CKC Laboratories, Inc. •1120 Fulton Place • Fremont, CA 94539 • (510) 249 - 1170
Customer: Stanford Linear Accelerator CenterSpecification: RE102 10KHz-18GHzWork Order #: 82840 Date: 2/24/2005Test Type: Radiated Scan Time: 2:12:22 PMEquipment: TEM/TPS Sequence#: 28Manufacturer: Stanford Linear Accelerator Center Tested By: A. BrarModel: TEM/TPSS/N: GLA1754Equipment Under Test (* = UUT):
Function Manufacturer Model # S/NTEM/TPS* Stanford Linear Accelerator Center TEM/TPS GLA1754
Support Devices:Function Manufacturer Model # S/NVME Processor DAWN VME Not Listed Property Tag: GLAT0404Mouse Dell P/N X09-13962 69557-492-6014557-20350Keyboard Dell RT7D20 TH-04N454-37171-399-5494Monitor Dell 1901FP CN-05Y232-71616-41R-B363PC Dell DHM HXNLB41Power Supply BK Precision 1697 S240500299
Test Conditions / Notes:UUT is grounded to the copper table. UUT is running the FuncTest.py. Power cable is running along the front sideof the table to the 10uF feed through caps and from there to the equipment outside of the chamber. I/O cable isrouted along the power cable, 2cms from the power cable. Exposed cable lengths on the test table at 56". UUT andsupport equipment shut off.
Transducer Legend:T1=AMP AN00941A 50GHzT3=ANP05200 1-40GHz
T2=Horn Antenna 4660 (Fremont)T4=ANP5201 1-40GHz
Measurement Data: Reading listed by margin. Test Distance: 1 Meter# Freq Rdng T1 T2 T3 T4 Dist Corr Spec Margin Polar
MHz dBµV dB dB dB dB Table dBµV/m dBµV/m dB Ant 1 1560.000M 21.3 +0.0 18.4 14.0 +4.4 Vert -30.3 +25.4 +1.0 +1.0
2 1599.959M 17.5 +0.0 14.8 14.0 +0.8 Vert -30.3 +25.6 +1.0 +1.0
3 1584.208M 16.7 +0.0 13.9 14.0 -0.1 Vert -30.3 +25.5 +1.0 +1.0
4 1575.000M 15.8 +0.0 13.0 14.0 -1.0 Vert -30.3 +25.5 +1.0 +1.0
5 1559.976M 15.8 +0.0 12.9 14.0 -1.1 Vert -30.3 +25.4 +1.0 +1.0

Page 165 of 224Report No.: MIL05-015
6 1592.676M 15.6 +0.0 12.9 14.0 -1.1 Vert -30.3 +25.6 +1.0 +1.0
7 1570.664M 15.6 +0.0 12.8 14.0 -1.2 Vert -30.3 +25.5 +1.0 +1.0
8 1591.704M 15.4 +0.0 12.7 14.0 -1.3 Vert -30.3 +25.6 +1.0 +1.0
9 1566.084M 15.4 +0.0 12.6 14.0 -1.4 Vert -30.3 +25.5 +1.0 +1.0
10 1591.845M 15.3 +0.0 12.6 14.0 -1.4 Vert -30.3 +25.6 +1.0 +1.0
11 1597.442M 15.3 +0.0 12.6 14.0 -1.4 Vert -30.3 +25.6 +1.0 +1.0
12 1591.406M 15.2 +0.0 12.4 14.0 -1.6 Vert -30.3 +25.5 +1.0 +1.0
13 1593.665M 15.1 +0.0 12.4 14.0 -1.6 Vert -30.3 +25.6 +1.0 +1.0
14 1562.886M 15.2 +0.0 12.3 14.0 -1.7 Vert -30.3 +25.4 +1.0 +1.0
15 1589.253M 15.1 +0.0 12.3 14.0 -1.7 Vert -30.3 +25.5 +1.0 +1.0
16 1596.403M 15.0 +0.0 12.3 14.0 -1.7 Vert -30.3 +25.6 +1.0 +1.0
17 1554.384M 15.0 +0.0 12.1 14.0 -1.9 Vert -30.3 +25.4 +1.0 +1.0
18 1555.501M 15.0 +0.0 12.1 14.0 -1.9 Vert -30.3 +25.4 +1.0 +1.0
19 1564.640M 15.0 +0.0 12.1 14.0 -1.9 Vert -30.3 +25.4 +1.0 +1.0
20 1592.064M 14.8 +0.0 12.1 14.0 -1.9 Vert -30.3 +25.6 +1.0 +1.0
21 1594.136M 14.8 +0.0 12.1 14.0 -1.9 Vert -30.3 +25.6 +1.0 +1.0
22 1596.040M 14.8 +0.0 12.1 14.0 -1.9 Vert -30.3 +25.6 +1.0 +1.0
23 1599.684M 14.8 +0.0 12.1 14.0 -1.9 Vert -30.3 +25.6 +1.0 +1.0
24 1550.874M 14.9 +0.0 12.0 14.0 -2.0 Vert -30.3 +25.4 +1.0 +1.0
25 1554.700M 14.9 +0.0 12.0 14.0 -2.0 Vert -30.3 +25.4 +1.0 +1.0
26 1573.150M 14.8 +0.0 12.0 14.0 -2.0 Vert -30.3 +25.5 +1.0 +1.0
27 1598.537M 14.7 +0.0 12.0 14.0 -2.0 Vert -30.3 +25.6 +1.0 +1.0

Page 166 of 224Report No.: MIL05-015
28 1592.034M 14.6 +0.0 11.9 14.0 -2.1 Vert -30.3 +25.6 +1.0 +1.0
29 1598.781M 14.6 +0.0 11.9 14.0 -2.1 Vert -30.3 +25.6 +1.0 +1.0
30 1599.938M 14.6 +0.0 11.9 14.0 -2.1 Vert -30.3 +25.6 +1.0 +1.0

Page 167 of 224Report No.: MIL05-015
Test Location: CKC Laboratories, Inc. •1120 Fulton Place • Fremont, CA 94539 • (510) 249 - 1170
Customer: Stanford Linear Accelerator CenterSpecification: RE102 10KHz-18GHzWork Order #: 82840 Date: 2/24/2005Test Type: Radiated Scan Time: 2:44:33 PMEquipment: TEM/TPS Sequence#: 29Manufacturer: Stanford Linear Accelerator Center Tested By: A. BrarModel: TEM/TPSS/N: GLA1754Equipment Under Test (* = UUT):
Function Manufacturer Model # S/NTEM/TPS* Stanford Linear Accelerator Center TEM/TPS GLA1754
Support Devices:Function Manufacturer Model # S/NVME Processor DAWN VME Not Listed Property Tag: GLAT0404Mouse Dell P/N X09-13962 69557-492-6014557-20350Keyboard Dell RT7D20 TH-04N454-37171-399-5494Monitor Dell 1901FP CN-05Y232-71616-41R-B363PC Dell DHM HXNLB41Power Supply BK Precision 1697 S240500299
Test Conditions / Notes:UUT is grounded to the copper table. UUT is running the FuncTest.py. Power cable is running along the front sideof the table to the 10uF feed through caps and from there to the equipment outside of the chamber. I/O cable isrouted along the power cable, 2cms from the power cable. Exposed cable lengths on the test table at 56". Coppertape on top, right and left side of the JS1 connector.
Transducer Legend:T1=AMP AN00941A 50GHzT3=ANP05200 1-40GHz
T2=Horn Antenna 4660 (Fremont)T4=ANP5201 1-40GHz
Measurement Data: Reading listed by margin. Test Distance: 1 Meter# Freq Rdng T1 T2 T3 T4 Dist Corr Spec Margin Polar
MHz dBµV dB dB dB dB Table dBµV/m dBµV/m dB Ant 1 1559.955M 27.4 +0.0 24.5 14.0 +10.5 Vert -30.3 +25.4 +1.0 +1.0
2 1560.000M 27.4 +0.0 24.5 14.0 +10.5 Vert -30.3 +25.4 +1.0 +1.0
3 1559.910M 26.0 +0.0 23.1 14.0 +9.1 Vert -30.3 +25.4 +1.0 +1.0
4 1560.357M 23.9 +0.0 21.0 14.0 +7.0 Vert -30.3 +25.4 +1.0 +1.0
5 1579.998M 20.9 +0.0 18.1 14.0 +4.1 Vert -30.3 +25.5 +1.0 +1.0

Page 168 of 224Report No.: MIL05-015
6 1560.526M 20.7 +0.0 17.8 14.0 +3.8 Vert -30.3 +25.4 +1.0 +1.0
7 1580.127M 20.2 +0.0 17.4 14.0 +3.4 Vert -30.3 +25.5 +1.0 +1.0
8 1579.938M 19.6 +0.0 16.8 14.0 +2.8 Vert -30.3 +25.5 +1.0 +1.0
9 1599.957M 19.1 +0.0 16.4 14.0 +2.4 Vert -30.3 +25.6 +1.0 +1.0
10 1580.076M 19.0 +0.0 16.2 14.0 +2.2 Vert -30.3 +25.5 +1.0 +1.0
11 1580.277M 18.7 +0.0 15.9 14.0 +1.9 Vert -30.3 +25.5 +1.0 +1.0
12 1560.760M 18.6 +0.0 15.7 14.0 +1.7 Vert -30.3 +25.4 +1.0 +1.0
13 1592.133M 17.3 +0.0 14.6 14.0 +0.6 Vert -30.3 +25.6 +1.0 +1.0
14 1560.886M 17.3 +0.0 14.4 14.0 +0.4 Vert -30.3 +25.4 +1.0 +1.0
15 1580.496M 16.6 +0.0 13.8 14.0 -0.2 Vert -30.3 +25.5 +1.0 +1.0
16 1584.205M 16.4 +0.0 13.6 14.0 -0.4 Vert -30.3 +25.5 +1.0 +1.0
17 1559.174M 16.4 +0.0 13.5 14.0 -0.5 Vert -30.3 +25.4 +1.0 +1.0
18 1599.510M 16.1 +0.0 13.4 14.0 -0.6 Vert -30.3 +25.6 +1.0 +1.0
19 1558.925M 16.2 +0.0 13.3 14.0 -0.7 Vert -30.3 +25.4 +1.0 +1.0
20 1558.982M 16.1 +0.0 13.2 14.0 -0.8 Vert -30.3 +25.4 +1.0 +1.0
21 1558.024M 16.0 +0.0 13.1 14.0 -0.9 Vert -30.3 +25.4 +1.0 +1.0
22 1579.361M 15.9 +0.0 13.1 14.0 -0.9 Vert -30.3 +25.5 +1.0 +1.0
23 1579.475M 15.9 +0.0 13.1 14.0 -0.9 Vert -30.3 +25.5 +1.0 +1.0
24 1580.535M 15.9 +0.0 13.1 14.0 -0.9 Vert -30.3 +25.5 +1.0 +1.0
25 1594.695M 15.7 +0.0 13.0 14.0 -1.0 Vert -30.3 +25.6 +1.0 +1.0
26 1559.042M 15.8 +0.0 12.9 14.0 -1.1 Vert -30.3 +25.4 +1.0 +1.0
27 1562.108M 15.4 +0.0 12.5 14.0 -1.5 Vert -30.3 +25.4 +1.0 +1.0
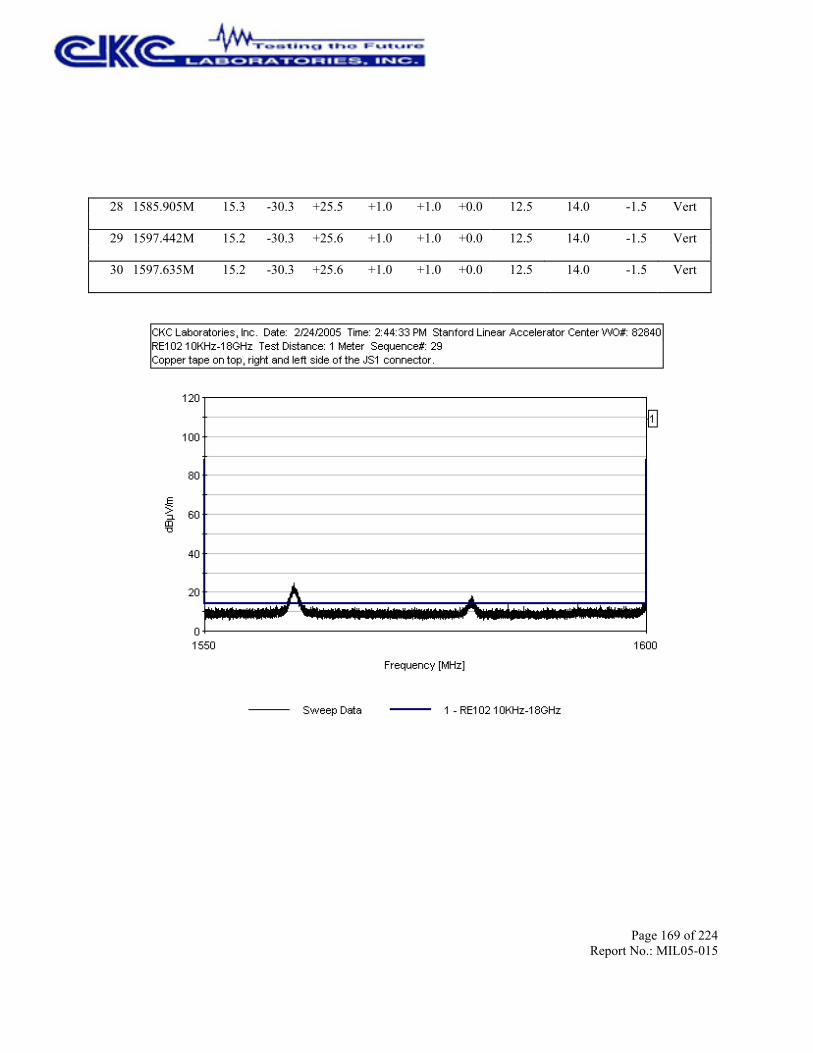
Page 169 of 224Report No.: MIL05-015
28 1585.905M 15.3 +0.0 12.5 14.0 -1.5 Vert -30.3 +25.5 +1.0 +1.0
29 1597.442M 15.2 +0.0 12.5 14.0 -1.5 Vert -30.3 +25.6 +1.0 +1.0
30 1597.635M 15.2 +0.0 12.5 14.0 -1.5 Vert -30.3 +25.6 +1.0 +1.0

Page 170 of 224Report No.: MIL05-015
Test Location: CKC Laboratories, Inc. •1120 Fulton Place • Fremont, CA 94539 • (510) 249 - 1170
Customer: Stanford Linear Accelerator CenterSpecification: RE102 10KHz-18GHzWork Order #: 82840 Date: 2/24/2005Test Type: Radiated Scan Time: 3:05:47 PMEquipment: TEM/TPS Sequence#: 30Manufacturer: Stanford Linear Accelerator Center Tested By: A. BrarModel: TEM/TPSS/N: GLA1754Equipment Under Test (* = UUT):
Function Manufacturer Model # S/NTEM/TPS* Stanford Linear Accelerator Center TEM/TPS GLA1754
Support Devices:Function Manufacturer Model # S/NVME Processor DAWN VME Not Listed Property Tag: GLAT0404Mouse Dell P/N X09-13962 69557-492-6014557-20350Keyboard Dell RT7D20 TH-04N454-37171-399-5494Monitor Dell 1901FP CN-05Y232-71616-41R-B363PC Dell DHM HXNLB41Power Supply BK Precision 1697 S240500299
Test Conditions / Notes:UUT is grounded to the copper table. UUT is running the FuncTest.py. Power cable is running along the front sideof the table to the 10uF feed through caps and from there to the equipment outside of the chamber. I/O cable isrouted along the power cable, 2cms from the power cable. Exposed cable lengths on the test table at 56". Coppertape on top, right and left side of the JS1 connector.
Transducer Legend:T1=AMP AN00941A 50GHzT3=ANP05200 1-40GHz
T2=Horn Antenna 4660 (Fremont)T4=ANP5201 1-40GHz
Measurement Data: Reading listed by margin. Test Distance: 1 Meter# Freq Rdng T1 T2 T3 T4 Dist Corr Spec Margin Polar
MHz dBµV dB dB dB dB Table dBµV/m dBµV/m dB Ant 1 1560.115M 17.1 +0.0 14.2 14.0 +0.2 Vert -30.3 +25.4 +1.0 +1.0
2 1560.000M 17.0 +0.0 14.1 14.0 +0.1 Vert -30.3 +25.4 +1.0 +1.0
3 1560.146M 16.4 +0.0 13.5 14.0 -0.5 Vert -30.3 +25.4 +1.0 +1.0
4 1559.929M 16.2 +0.0 13.3 14.0 -0.7 Vert -30.3 +25.4 +1.0 +1.0
5 1560.129M 16.2 +0.0 13.3 14.0 -0.7 Vert -30.3 +25.4 +1.0 +1.0

Page 171 of 224Report No.: MIL05-015
6 1559.992M 15.9 +0.0 13.0 14.0 -1.0 Vert -30.3 +25.4 +1.0 +1.0
7 1559.917M 15.7 +0.0 12.8 14.0 -1.2 Vert -30.3 +25.4 +1.0 +1.0
8 1559.997M 15.6 +0.0 12.7 14.0 -1.3 Vert -30.3 +25.4 +1.0 +1.0
9 1559.906M 15.4 +0.0 12.5 14.0 -1.5 Vert -30.3 +25.4 +1.0 +1.0
10 1559.977M 15.3 +0.0 12.4 14.0 -1.6 Vert -30.3 +25.4 +1.0 +1.0
11 1560.035M 15.3 +0.0 12.4 14.0 -1.6 Vert -30.3 +25.4 +1.0 +1.0
12 1559.986M 15.2 +0.0 12.3 14.0 -1.7 Vert -30.3 +25.4 +1.0 +1.0
13 1560.134M 15.2 +0.0 12.3 14.0 -1.7 Vert -30.3 +25.4 +1.0 +1.0
14 1560.139M 15.1 +0.0 12.2 14.0 -1.8 Vert -30.3 +25.4 +1.0 +1.0
15 1559.783M 14.9 +0.0 12.0 14.0 -2.0 Vert -30.3 +25.4 +1.0 +1.0
16 1559.872M 14.9 +0.0 12.0 14.0 -2.0 Vert -30.3 +25.4 +1.0 +1.0
17 1559.940M 14.9 +0.0 12.0 14.0 -2.0 Vert -30.3 +25.4 +1.0 +1.0
18 1560.077M 14.9 +0.0 12.0 14.0 -2.0 Vert -30.3 +25.4 +1.0 +1.0
19 1560.163M 14.9 +0.0 12.0 14.0 -2.0 Vert -30.3 +25.4 +1.0 +1.0
20 1559.868M 14.8 +0.0 11.9 14.0 -2.1 Vert -30.3 +25.4 +1.0 +1.0
21 1559.926M 14.8 +0.0 11.9 14.0 -2.1 Vert -30.3 +25.4 +1.0 +1.0
22 1560.057M 14.8 +0.0 11.9 14.0 -2.1 Vert -30.3 +25.4 +1.0 +1.0
23 1560.093M 14.8 +0.0 11.9 14.0 -2.1 Vert -30.3 +25.4 +1.0 +1.0
24 1560.227M 14.8 +0.0 11.9 14.0 -2.1 Vert -30.3 +25.4 +1.0 +1.0
25 1559.812M 14.7 +0.0 11.8 14.0 -2.2 Vert -30.3 +25.4 +1.0 +1.0
26 1560.217M 14.7 +0.0 11.8 14.0 -2.2 Vert -30.3 +25.4 +1.0 +1.0
27 1559.846M 14.6 +0.0 11.7 14.0 -2.3 Vert -30.3 +25.4 +1.0 +1.0
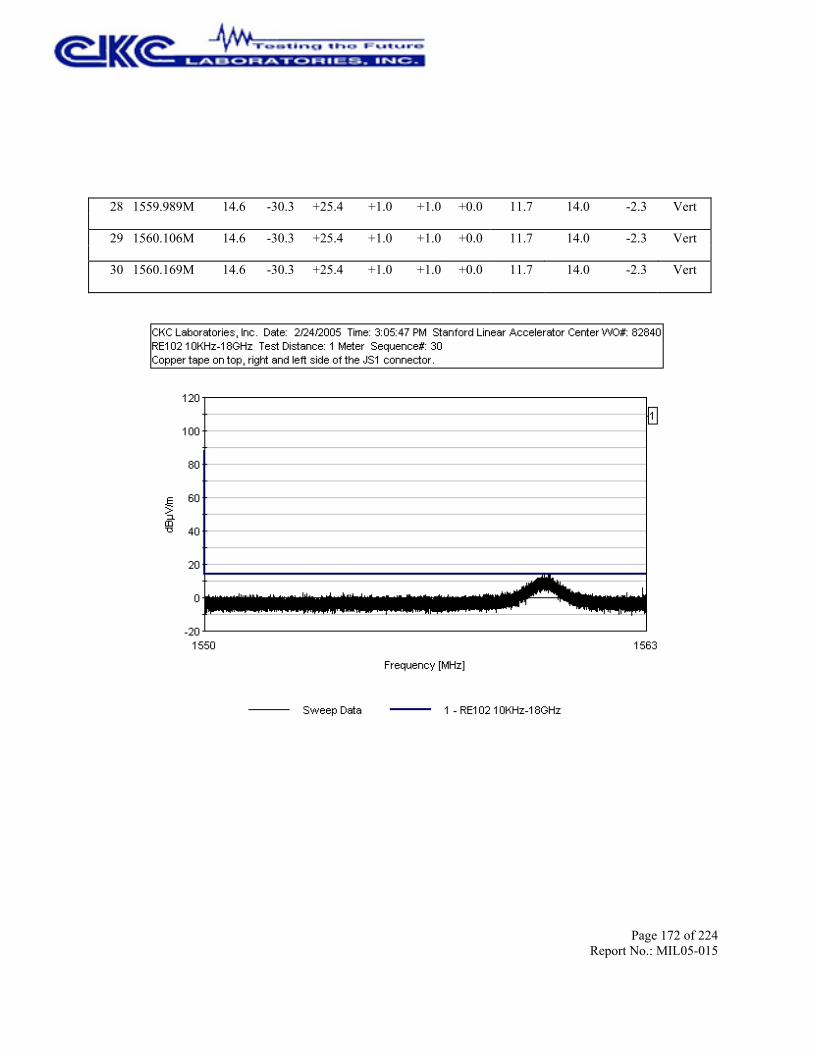
Page 172 of 224Report No.: MIL05-015
28 1559.989M 14.6 +0.0 11.7 14.0 -2.3 Vert -30.3 +25.4 +1.0 +1.0
29 1560.106M 14.6 +0.0 11.7 14.0 -2.3 Vert -30.3 +25.4 +1.0 +1.0
30 1560.169M 14.6 +0.0 11.7 14.0 -2.3 Vert -30.3 +25.4 +1.0 +1.0

Page 173 of 224Report No.: MIL05-015
Test Location: CKC Laboratories, Inc. •1120 Fulton Place • Fremont, CA 94539 • (510) 249 - 1170
Customer: Stanford Linear Accelerator CenterSpecification: RE102 10KHz-18GHzWork Order #: 82840 Date: 2/24/2005Test Type: Radiated Scan Time: 3:23:53 PMEquipment: TEM/TPS Sequence#: 31Manufacturer: Stanford Linear Accelerator Center Tested By: A. BrarModel: TEM/TPSS/N: GLA1754Equipment Under Test (* = UUT):
Function Manufacturer Model # S/NTEM/TPS* Stanford Linear Accelerator Center TEM/TPS GLA1754
Support Devices:Function Manufacturer Model # S/NVME Processor DAWN VME Not Listed Property Tag: GLAT0404Mouse Dell P/N X09-13962 69557-492-6014557-20350Keyboard Dell RT7D20 TH-04N454-37171-399-5494Monitor Dell 1901FP CN-05Y232-71616-41R-B363PC Dell DHM HXNLB41Power Supply BK Precision 1697 S240500299
Test Conditions / Notes:UUT is grounded to the copper table. UUT is running the FuncTest.py. Power cable is running along the front sideof the table to the 10uF feed through caps and from there to the equipment outside of the chamber. I/O cable isrouted along the power cable, 2cms from the power cable. Exposed cable lengths on the test table at 56". Coppertape on top, right and left side of the JS1 connector.
Transducer Legend:T1=AMP AN00941A 50GHzT3=ANP05200 1-40GHz
T2=Horn Antenna 4660 (Fremont)T4=ANP5201 1-40GHz
Measurement Data: Reading listed by margin. Test Distance: 1 Meter# Freq Rdng T1 T2 T3 T4 Dist Corr Spec Margin Polar
MHz dBµV dB dB dB dB Table dBµV/m dBµV/m dB Ant 1 1575.000M 7.9 +0.0 5.1 14.0 -8.9 Vert -30.3 +25.5 +1.0 +1.0
2 1574.943M 5.9 +0.0 3.1 14.0 -10.9 Vert -30.3 +25.5 +1.0 +1.0
3 1565.073M 5.8 +0.0 3.0 14.0 -11.0 Vert -30.3 +25.5 +1.0 +1.0
4 1573.150M 5.5 +0.0 2.7 14.0 -11.3 Vert -30.3 +25.5 +1.0 +1.0
5 1570.682M 5.3 +0.0 2.5 14.0 -11.5 Vert -30.3 +25.5 +1.0 +1.0

Page 174 of 224Report No.: MIL05-015
6 1565.250M 5.1 +0.0 2.3 14.0 -11.7 Vert -30.3 +25.5 +1.0 +1.0
7 1566.067M 5.0 +0.0 2.2 14.0 -11.8 Vert -30.3 +25.5 +1.0 +1.0
8 1564.672M 5.0 +0.0 2.1 14.0 -11.9 Vert -30.3 +25.4 +1.0 +1.0
9 1565.588M 4.9 +0.0 2.1 14.0 -11.9 Vert -30.3 +25.5 +1.0 +1.0
10 1567.736M 4.7 +0.0 1.9 14.0 -12.1 Vert -30.3 +25.5 +1.0 +1.0
11 1563.440M 4.7 +0.0 1.8 14.0 -12.2 Vert -30.3 +25.4 +1.0 +1.0
12 1564.451M 4.6 +0.0 1.7 14.0 -12.3 Vert -30.3 +25.4 +1.0 +1.0
13 1566.060M 4.5 +0.0 1.7 14.0 -12.3 Vert -30.3 +25.5 +1.0 +1.0
14 1575.644M 4.5 +0.0 1.7 14.0 -12.3 Vert -30.3 +25.5 +1.0 +1.0
15 1567.167M 4.4 +0.0 1.6 14.0 -12.4 Vert -30.3 +25.5 +1.0 +1.0
16 1567.400M 4.4 +0.0 1.6 14.0 -12.4 Vert -30.3 +25.5 +1.0 +1.0
17 1567.919M 4.4 +0.0 1.6 14.0 -12.4 Vert -30.3 +25.5 +1.0 +1.0
18 1570.269M 4.4 +0.0 1.6 14.0 -12.4 Vert -30.3 +25.5 +1.0 +1.0
19 1571.141M 4.4 +0.0 1.6 14.0 -12.4 Vert -30.3 +25.5 +1.0 +1.0
20 1571.861M 4.4 +0.0 1.6 14.0 -12.4 Vert -30.3 +25.5 +1.0 +1.0
21 1572.144M 4.4 +0.0 1.6 14.0 -12.4 Vert -30.3 +25.5 +1.0 +1.0
22 1565.132M 4.3 +0.0 1.5 14.0 -12.5 Vert -30.3 +25.5 +1.0 +1.0
23 1566.644M 4.3 +0.0 1.5 14.0 -12.5 Vert -30.3 +25.5 +1.0 +1.0
24 1566.764M 4.3 +0.0 1.5 14.0 -12.5 Vert -30.3 +25.5 +1.0 +1.0
25 1570.290M 4.3 +0.0 1.5 14.0 -12.5 Vert -30.3 +25.5 +1.0 +1.0
26 1571.511M 4.3 +0.0 1.5 14.0 -12.5 Vert -30.3 +25.5 +1.0 +1.0
27 1565.890M 4.2 +0.0 1.4 14.0 -12.6 Vert -30.3 +25.5 +1.0 +1.0

Page 175 of 224Report No.: MIL05-015
28 1566.180M 4.2 +0.0 1.4 14.0 -12.6 Vert -30.3 +25.5 +1.0 +1.0
29 1573.286M 4.2 +0.0 1.4 14.0 -12.6 Vert -30.3 +25.5 +1.0 +1.0
30 1574.194M 4.2 +0.0 1.4 14.0 -12.6 Vert -30.3 +25.5 +1.0 +1.0

Page 176 of 224Report No.: MIL05-015
Test Location: CKC Laboratories, Inc. •1120 Fulton Place • Fremont, CA 94539 • (510) 249 - 1170
Customer: Stanford Linear Accelerator CenterSpecification: RE102 10KHz-18GHzWork Order #: 82840 Date: 2/24/2005Test Type: Radiated Scan Time: 3:41:11 PMEquipment: TEM/TPS Sequence#: 32Manufacturer: Stanford Linear Accelerator Center Tested By: A. BrarModel: TEM/TPSS/N: GLA1754Equipment Under Test (* = UUT):
Function Manufacturer Model # S/NTEM/TPS* Stanford Linear Accelerator Center TEM/TPS GLA1754
Support Devices:Function Manufacturer Model # S/NVME Processor DAWN VME Not Listed Property Tag: GLAT0404Mouse Dell P/N X09-13962 69557-492-6014557-20350Keyboard Dell RT7D20 TH-04N454-37171-399-5494Monitor Dell 1901FP CN-05Y232-71616-41R-B363PC Dell DHM HXNLB41Power Supply BK Precision 1697 S240500299
Test Conditions / Notes:UUT is grounded to the copper table. UUT is running the FuncTest.py. Power cable is running along the front sideof the table to the 10uF feed through caps and from there to the equipment outside of the chamber. I/O cable isrouted along the power cable, 2cms from the power cable. Exposed cable lengths on the test table at 56". Coppertape on top, right and left side of the JS1 connector.
Transducer Legend:T1=AMP AN00941A 50GHzT3=ANP05200 1-40GHz
T2=Horn Antenna 4660 (Fremont)T4=ANP5201 1-40GHz
Measurement Data: Reading listed by margin. Test Distance: 1 Meter# Freq Rdng T1 T2 T3 T4 Dist Corr Spec Margin Polar
MHz dBµV dB dB dB dB Table dBµV/m dBµV/m dB Ant 1 1579.982M 13.0 +0.0 10.2 14.0 -3.8 Vert -30.3 +25.5 +1.0 +1.0
2 1580.051M 13.0 +0.0 10.2 14.0 -3.8 Vert -30.3 +25.5 +1.0 +1.0
3 1584.208M 12.9 +0.0 10.1 14.0 -3.9 Vert -30.3 +25.5 +1.0 +1.0
4 1580.102M 12.8 +0.0 10.0 14.0 -4.0 Vert -30.3 +25.5 +1.0 +1.0
5 1579.929M 12.7 +0.0 9.9 14.0 -4.1 Vert -30.3 +25.5 +1.0 +1.0
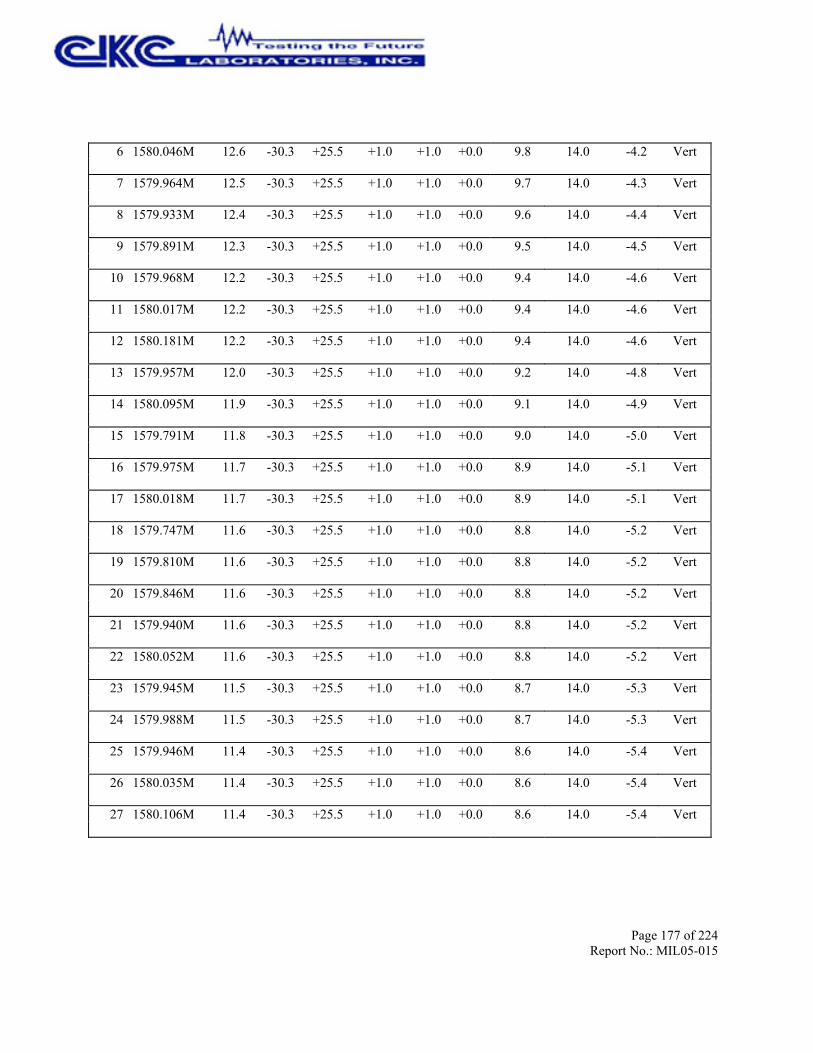
Page 177 of 224Report No.: MIL05-015
6 1580.046M 12.6 +0.0 9.8 14.0 -4.2 Vert -30.3 +25.5 +1.0 +1.0
7 1579.964M 12.5 +0.0 9.7 14.0 -4.3 Vert -30.3 +25.5 +1.0 +1.0
8 1579.933M 12.4 +0.0 9.6 14.0 -4.4 Vert -30.3 +25.5 +1.0 +1.0
9 1579.891M 12.3 +0.0 9.5 14.0 -4.5 Vert -30.3 +25.5 +1.0 +1.0
10 1579.968M 12.2 +0.0 9.4 14.0 -4.6 Vert -30.3 +25.5 +1.0 +1.0
11 1580.017M 12.2 +0.0 9.4 14.0 -4.6 Vert -30.3 +25.5 +1.0 +1.0
12 1580.181M 12.2 +0.0 9.4 14.0 -4.6 Vert -30.3 +25.5 +1.0 +1.0
13 1579.957M 12.0 +0.0 9.2 14.0 -4.8 Vert -30.3 +25.5 +1.0 +1.0
14 1580.095M 11.9 +0.0 9.1 14.0 -4.9 Vert -30.3 +25.5 +1.0 +1.0
15 1579.791M 11.8 +0.0 9.0 14.0 -5.0 Vert -30.3 +25.5 +1.0 +1.0
16 1579.975M 11.7 +0.0 8.9 14.0 -5.1 Vert -30.3 +25.5 +1.0 +1.0
17 1580.018M 11.7 +0.0 8.9 14.0 -5.1 Vert -30.3 +25.5 +1.0 +1.0
18 1579.747M 11.6 +0.0 8.8 14.0 -5.2 Vert -30.3 +25.5 +1.0 +1.0
19 1579.810M 11.6 +0.0 8.8 14.0 -5.2 Vert -30.3 +25.5 +1.0 +1.0
20 1579.846M 11.6 +0.0 8.8 14.0 -5.2 Vert -30.3 +25.5 +1.0 +1.0
21 1579.940M 11.6 +0.0 8.8 14.0 -5.2 Vert -30.3 +25.5 +1.0 +1.0
22 1580.052M 11.6 +0.0 8.8 14.0 -5.2 Vert -30.3 +25.5 +1.0 +1.0
23 1579.945M 11.5 +0.0 8.7 14.0 -5.3 Vert -30.3 +25.5 +1.0 +1.0
24 1579.988M 11.5 +0.0 8.7 14.0 -5.3 Vert -30.3 +25.5 +1.0 +1.0
25 1579.946M 11.4 +0.0 8.6 14.0 -5.4 Vert -30.3 +25.5 +1.0 +1.0
26 1580.035M 11.4 +0.0 8.6 14.0 -5.4 Vert -30.3 +25.5 +1.0 +1.0
27 1580.106M 11.4 +0.0 8.6 14.0 -5.4 Vert -30.3 +25.5 +1.0 +1.0
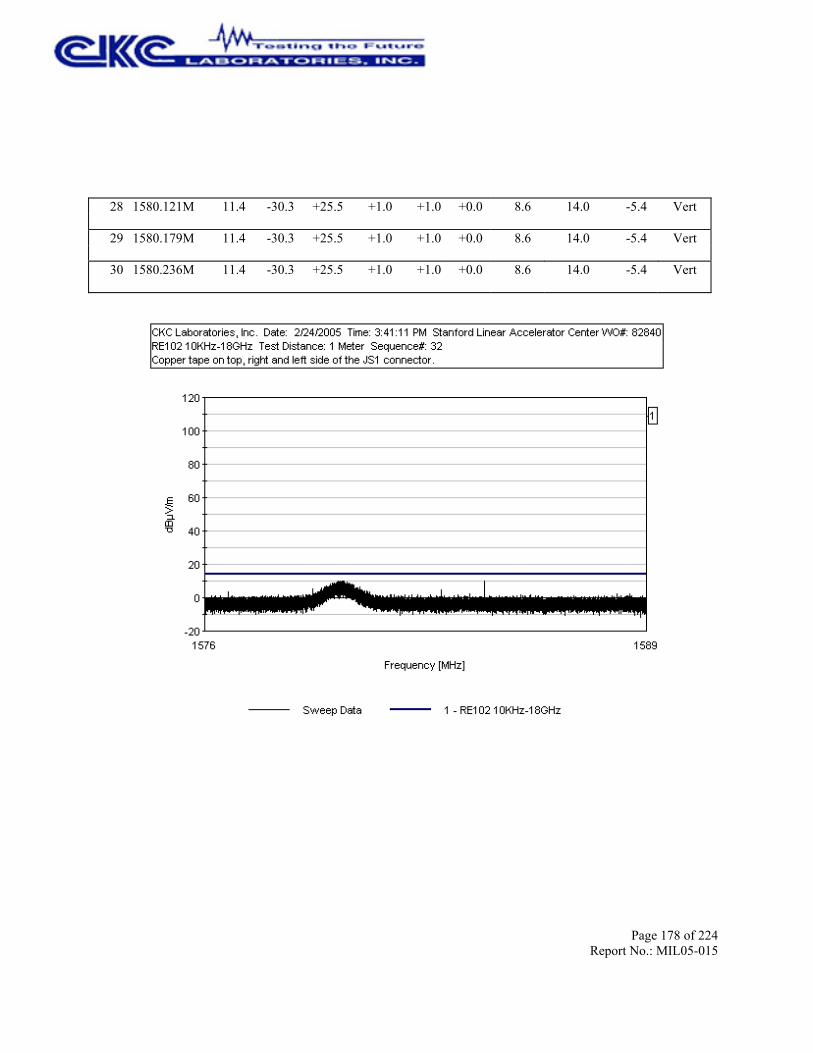
Page 178 of 224Report No.: MIL05-015
28 1580.121M 11.4 +0.0 8.6 14.0 -5.4 Vert -30.3 +25.5 +1.0 +1.0
29 1580.179M 11.4 +0.0 8.6 14.0 -5.4 Vert -30.3 +25.5 +1.0 +1.0
30 1580.236M 11.4 +0.0 8.6 14.0 -5.4 Vert -30.3 +25.5 +1.0 +1.0

Page 179 of 224Report No.: MIL05-015
Test Location: CKC Laboratories, Inc. •1120 Fulton Place • Fremont, CA 94539 • (510) 249 - 1170
Customer: Stanford Linear Accelerator CenterSpecification: RE102 10KHz-18GHzWork Order #: 82840 Date: 2/24/2005Test Type: Radiated Scan Time: 3:57:54 PMEquipment: TEM/TPS Sequence#: 33Manufacturer: Stanford Linear Accelerator Center Tested By: A. BrarModel: TEM/TPSS/N: GLA1754Equipment Under Test (* = UUT):
Function Manufacturer Model # S/NTEM/TPS* Stanford Linear Accelerator Center TEM/TPS GLA1754
Support Devices:Function Manufacturer Model # S/NVME Processor DAWN VME Not Listed Property Tag: GLAT0404Mouse Dell P/N X09-13962 69557-492-6014557-20350Keyboard Dell RT7D20 TH-04N454-37171-399-5494Monitor Dell 1901FP CN-05Y232-71616-41R-B363PC Dell DHM HXNLB41Power Supply BK Precision 1697 S240500299
Test Conditions / Notes:UUT is grounded to the copper table. UUT is running the FuncTest.py. Power cable is running along the front sideof the table to the 10uF feed through caps and from there to the equipment outside of the chamber. I/O cable isrouted along the power cable, 2cms from the power cable. Exposed cable lengths on the test table at 56". Coppertape on top, right and left side of the JS1 connector.
Transducer Legend:T1=AMP AN00941A 50GHzT3=ANP05200 1-40GHz
T2=Horn Antenna 4660 (Fremont)T4=ANP5201 1-40GHz
Measurement Data: Reading listed by margin. Test Distance: 1 Meter# Freq Rdng T1 T2 T3 T4 Dist Corr Spec Margin Polar
MHz dBµV dB dB dB dB Table dBµV/m dBµV/m dB Ant 1 1600.000M 14.1 +0.0 11.4 14.0 -2.6 Vert -30.3 +25.6 +1.0 +1.0
2 1597.442M 11.4 +0.0 8.7 14.0 -5.3 Vert -30.3 +25.6 +1.0 +1.0
3 1599.957M 8.8 +0.0 6.1 14.0 -7.9 Vert -30.3 +25.6 +1.0 +1.0
4 1599.813M 8.2 +0.0 5.5 14.0 -8.5 Vert -30.3 +25.6 +1.0 +1.0
5 1599.919M 7.4 +0.0 4.7 14.0 -9.3 Vert -30.3 +25.6 +1.0 +1.0

Page 180 of 224Report No.: MIL05-015
6 1599.951M 7.4 +0.0 4.7 14.0 -9.3 Vert -30.3 +25.6 +1.0 +1.0
7 1599.869M 7.3 +0.0 4.6 14.0 -9.4 Vert -30.3 +25.6 +1.0 +1.0
8 1599.944M 7.2 +0.0 4.5 14.0 -9.5 Vert -30.3 +25.6 +1.0 +1.0
9 1599.883M 7.1 +0.0 4.4 14.0 -9.6 Vert -30.3 +25.6 +1.0 +1.0
10 1599.883M 7.0 +0.0 4.3 14.0 -9.7 Vert -30.3 +25.6 +1.0 +1.0
11 1599.914M 7.0 +0.0 4.3 14.0 -9.7 Vert -30.3 +25.6 +1.0 +1.0
12 1589.261M 7.0 +0.0 4.2 14.0 -9.8 Vert -30.3 +25.5 +1.0 +1.0
13 1599.937M 6.9 +0.0 4.2 14.0 -9.8 Vert -30.3 +25.6 +1.0 +1.0
14 1599.832M 6.8 +0.0 4.1 14.0 -9.9 Vert -30.3 +25.6 +1.0 +1.0
15 1599.969M 6.8 +0.0 4.1 14.0 -9.9 Vert -30.3 +25.6 +1.0 +1.0
16 1599.976M 6.8 +0.0 4.1 14.0 -9.9 Vert -30.3 +25.6 +1.0 +1.0
17 1599.666M 6.7 +0.0 4.0 14.0 -10.0 Vert -30.3 +25.6 +1.0 +1.0
18 1599.923M 6.5 +0.0 3.8 14.0 -10.2 Vert -30.3 +25.6 +1.0 +1.0
19 1599.860M 6.4 +0.0 3.7 14.0 -10.3 Vert -30.3 +25.6 +1.0 +1.0
20 1599.897M 6.3 +0.0 3.6 14.0 -10.4 Vert -30.3 +25.6 +1.0 +1.0
21 1599.972M 6.3 +0.0 3.6 14.0 -10.4 Vert -30.3 +25.6 +1.0 +1.0
22 1599.857M 6.2 +0.0 3.5 14.0 -10.5 Vert -30.3 +25.6 +1.0 +1.0
23 1599.769M 6.1 +0.0 3.4 14.0 -10.6 Vert -30.3 +25.6 +1.0 +1.0
24 1599.901M 6.1 +0.0 3.4 14.0 -10.6 Vert -30.3 +25.6 +1.0 +1.0
25 1599.905M 6.1 +0.0 3.4 14.0 -10.6 Vert -30.3 +25.6 +1.0 +1.0
26 1599.945M 6.1 +0.0 3.4 14.0 -10.6 Vert -30.3 +25.6 +1.0 +1.0
27 1599.947M 6.1 +0.0 3.4 14.0 -10.6 Vert -30.3 +25.6 +1.0 +1.0
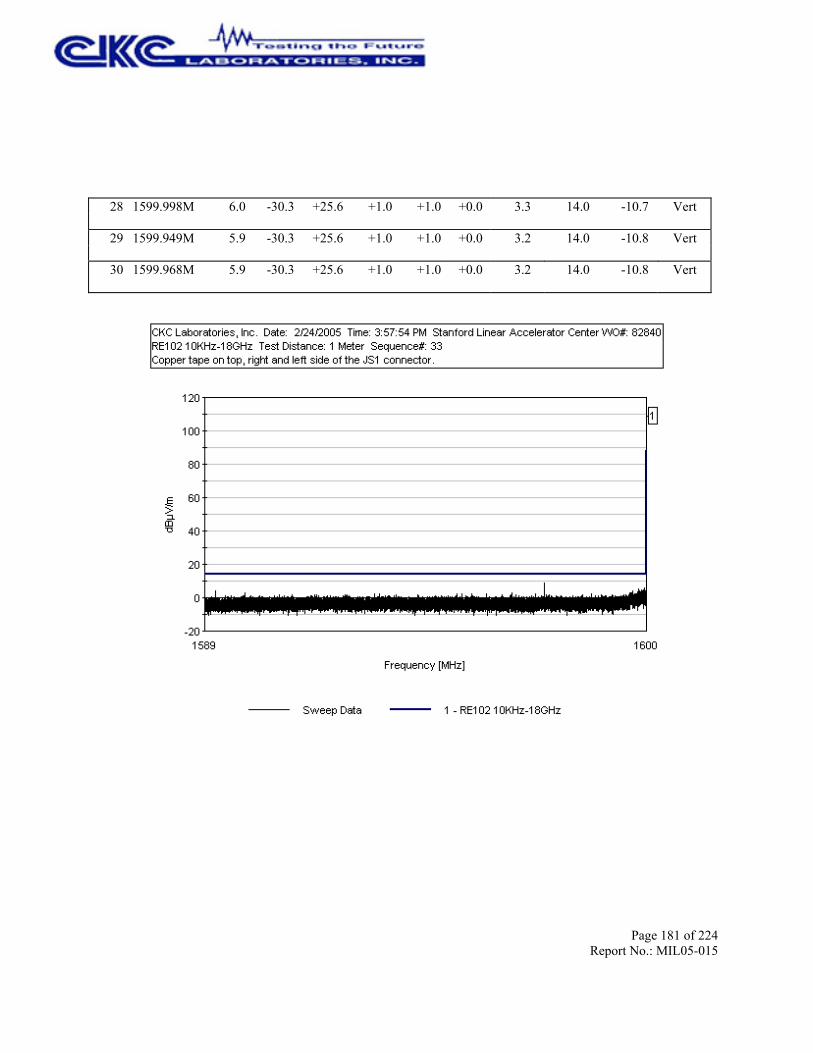
Page 181 of 224Report No.: MIL05-015
28 1599.998M 6.0 +0.0 3.3 14.0 -10.7 Vert -30.3 +25.6 +1.0 +1.0
29 1599.949M 5.9 +0.0 3.2 14.0 -10.8 Vert -30.3 +25.6 +1.0 +1.0
30 1599.968M 5.9 +0.0 3.2 14.0 -10.8 Vert -30.3 +25.6 +1.0 +1.0
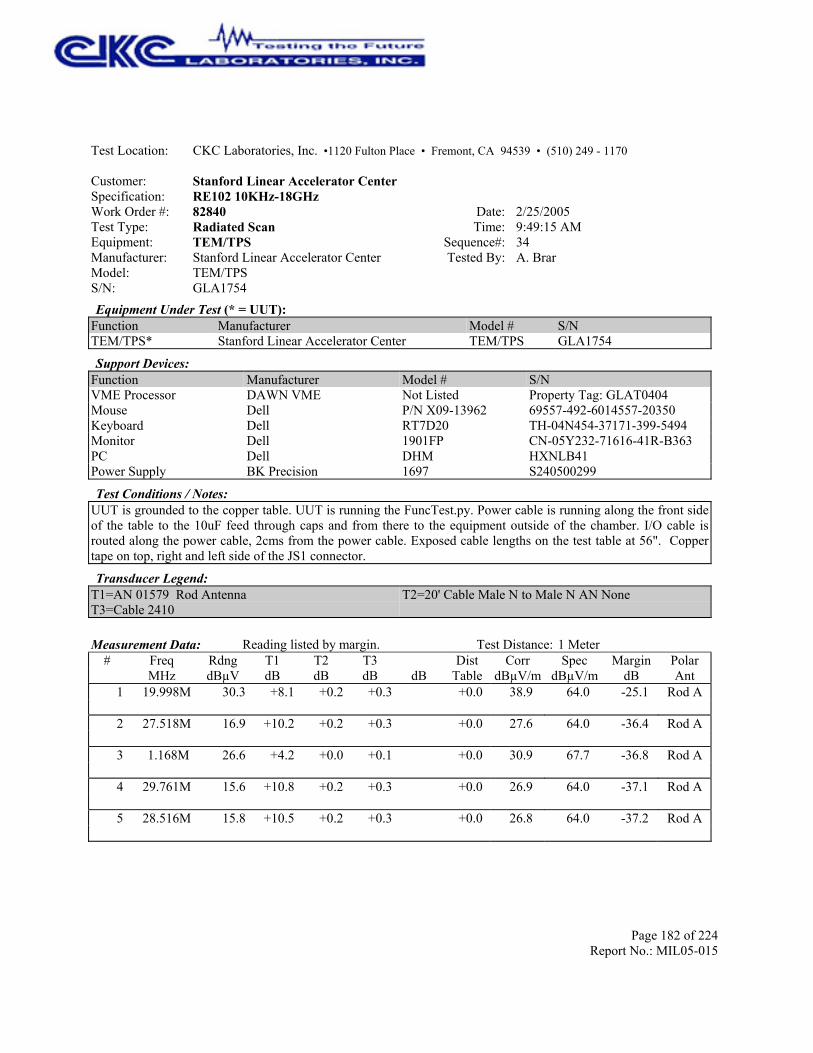
Page 182 of 224Report No.: MIL05-015
Test Location: CKC Laboratories, Inc. •1120 Fulton Place • Fremont, CA 94539 • (510) 249 - 1170
Customer: Stanford Linear Accelerator CenterSpecification: RE102 10KHz-18GHzWork Order #: 82840 Date: 2/25/2005Test Type: Radiated Scan Time: 9:49:15 AMEquipment: TEM/TPS Sequence#: 34Manufacturer: Stanford Linear Accelerator Center Tested By: A. BrarModel: TEM/TPSS/N: GLA1754Equipment Under Test (* = UUT):
Function Manufacturer Model # S/NTEM/TPS* Stanford Linear Accelerator Center TEM/TPS GLA1754
Support Devices:Function Manufacturer Model # S/NVME Processor DAWN VME Not Listed Property Tag: GLAT0404Mouse Dell P/N X09-13962 69557-492-6014557-20350Keyboard Dell RT7D20 TH-04N454-37171-399-5494Monitor Dell 1901FP CN-05Y232-71616-41R-B363PC Dell DHM HXNLB41Power Supply BK Precision 1697 S240500299
Test Conditions / Notes:UUT is grounded to the copper table. UUT is running the FuncTest.py. Power cable is running along the front sideof the table to the 10uF feed through caps and from there to the equipment outside of the chamber. I/O cable isrouted along the power cable, 2cms from the power cable. Exposed cable lengths on the test table at 56". Coppertape on top, right and left side of the JS1 connector.
Transducer Legend:T1=AN 01579 Rod AntennaT3=Cable 2410
T2=20' Cable Male N to Male N AN None
Measurement Data: Reading listed by margin. Test Distance: 1 Meter# Freq Rdng T1 T2 T3 Dist Corr Spec Margin Polar
MHz dBµV dB dB dB dB Table dBµV/m dBµV/m dB Ant 1 19.998M 30.3 +0.0 38.9 64.0 -25.1 Rod A +8.1 +0.2 +0.3
2 27.518M 16.9 +0.0 27.6 64.0 -36.4 Rod A +10.2 +0.2 +0.3
3 1.168M 26.6 +0.0 30.9 67.7 -36.8 Rod A +4.2 +0.0 +0.1
4 29.761M 15.6 +0.0 26.9 64.0 -37.1 Rod A +10.8 +0.2 +0.3
5 28.516M 15.8 +0.0 26.8 64.0 -37.2 Rod A +10.5 +0.2 +0.3
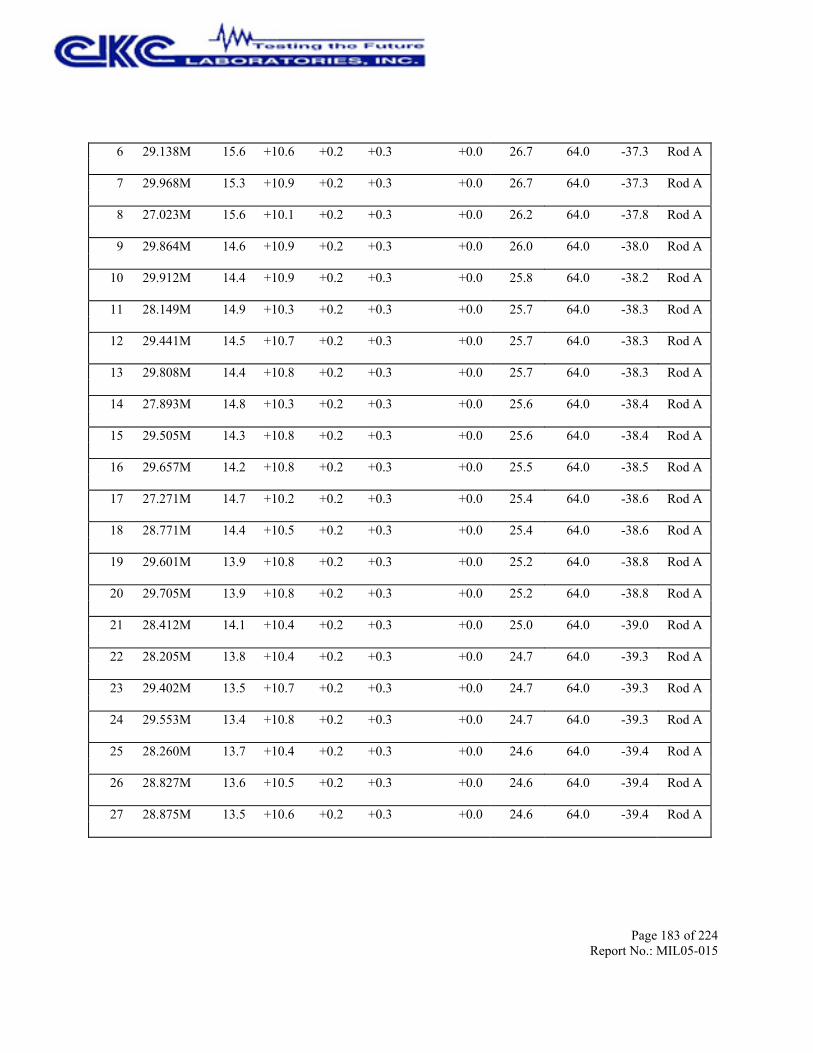
Page 183 of 224Report No.: MIL05-015
6 29.138M 15.6 +0.0 26.7 64.0 -37.3 Rod A +10.6 +0.2 +0.3
7 29.968M 15.3 +0.0 26.7 64.0 -37.3 Rod A +10.9 +0.2 +0.3
8 27.023M 15.6 +0.0 26.2 64.0 -37.8 Rod A +10.1 +0.2 +0.3
9 29.864M 14.6 +0.0 26.0 64.0 -38.0 Rod A +10.9 +0.2 +0.3
10 29.912M 14.4 +0.0 25.8 64.0 -38.2 Rod A +10.9 +0.2 +0.3
11 28.149M 14.9 +0.0 25.7 64.0 -38.3 Rod A +10.3 +0.2 +0.3
12 29.441M 14.5 +0.0 25.7 64.0 -38.3 Rod A +10.7 +0.2 +0.3
13 29.808M 14.4 +0.0 25.7 64.0 -38.3 Rod A +10.8 +0.2 +0.3
14 27.893M 14.8 +0.0 25.6 64.0 -38.4 Rod A +10.3 +0.2 +0.3
15 29.505M 14.3 +0.0 25.6 64.0 -38.4 Rod A +10.8 +0.2 +0.3
16 29.657M 14.2 +0.0 25.5 64.0 -38.5 Rod A +10.8 +0.2 +0.3
17 27.271M 14.7 +0.0 25.4 64.0 -38.6 Rod A +10.2 +0.2 +0.3
18 28.771M 14.4 +0.0 25.4 64.0 -38.6 Rod A +10.5 +0.2 +0.3
19 29.601M 13.9 +0.0 25.2 64.0 -38.8 Rod A +10.8 +0.2 +0.3
20 29.705M 13.9 +0.0 25.2 64.0 -38.8 Rod A +10.8 +0.2 +0.3
21 28.412M 14.1 +0.0 25.0 64.0 -39.0 Rod A +10.4 +0.2 +0.3
22 28.205M 13.8 +0.0 24.7 64.0 -39.3 Rod A +10.4 +0.2 +0.3
23 29.402M 13.5 +0.0 24.7 64.0 -39.3 Rod A +10.7 +0.2 +0.3
24 29.553M 13.4 +0.0 24.7 64.0 -39.3 Rod A +10.8 +0.2 +0.3
25 28.260M 13.7 +0.0 24.6 64.0 -39.4 Rod A +10.4 +0.2 +0.3
26 28.827M 13.6 +0.0 24.6 64.0 -39.4 Rod A +10.5 +0.2 +0.3
27 28.875M 13.5 +0.0 24.6 64.0 -39.4 Rod A +10.6 +0.2 +0.3

Page 184 of 224Report No.: MIL05-015
28 27.845M 13.6 +0.0 24.4 64.0 -39.6 Rod A +10.3 +0.2 +0.3
29 27.949M 13.6 +0.0 24.4 64.0 -39.6 Rod A +10.3 +0.2 +0.3
30 28.300M 13.5 +0.0 24.4 64.0 -39.6 Rod A +10.4 +0.2 +0.3
31 28.356M 13.5 +0.0 24.4 64.0 -39.6 Rod A +10.4 +0.2 +0.3
32 28.572M 13.3 +0.0 24.3 64.0 -39.7 Rod A +10.5 +0.2 +0.3
33 28.619M 13.3 +0.0 24.3 64.0 -39.7 Rod A +10.5 +0.2 +0.3
34 28.667M 13.3 +0.0 24.3 64.0 -39.7 Rod A +10.5 +0.2 +0.3
35 28.987M 13.2 +0.0 24.3 64.0 -39.7 Rod A +10.6 +0.2 +0.3
36 29.242M 13.1 +0.0 24.3 64.0 -39.7 Rod A +10.7 +0.2 +0.3
37 29.186M 13.0 +0.0 24.2 64.0 -39.8 Rod A +10.7 +0.2 +0.3
38 20.168M 15.4 +0.0 24.1 64.0 -39.9 Rod A +8.2 +0.2 +0.3
39 27.582M 13.4 +0.0 24.1 64.0 -39.9 Rod A +10.2 +0.2 +0.3
40 29.338M 12.9 +0.0 24.1 64.0 -39.9 Rod A +10.7 +0.2 +0.3
41 28.931M 12.9 +0.0 24.0 64.0 -40.0 Rod A +10.6 +0.2 +0.3
42 29.026M 12.9 +0.0 24.0 64.0 -40.0 Rod A +10.6 +0.2 +0.3
43 28.468M 13.0 +0.0 23.9 64.0 -40.1 Rod A +10.4 +0.2 +0.3
44 27.151M 13.2 +0.0 23.8 64.0 -40.2 Rod A +10.1 +0.2 +0.3
45 27.638M 13.1 +0.0 23.8 64.0 -40.2 Rod A +10.2 +0.2 +0.3
46 27.686M 13.1 +0.0 23.8 64.0 -40.2 Rod A +10.2 +0.2 +0.3
47 27.734M 13.1 +0.0 23.8 64.0 -40.2 Rod A +10.2 +0.2 +0.3

Page 185 of 224Report No.: MIL05-015
48 27.790M 13.0 +0.0 23.8 64.0 -40.2 Rod A +10.3 +0.2 +0.3
49 29.090M 12.7 +0.0 23.8 64.0 -40.2 Rod A +10.6 +0.2 +0.3
50 29.298M 12.5 +0.0 23.7 64.0 -40.3 Rod A +10.7 +0.2 +0.3
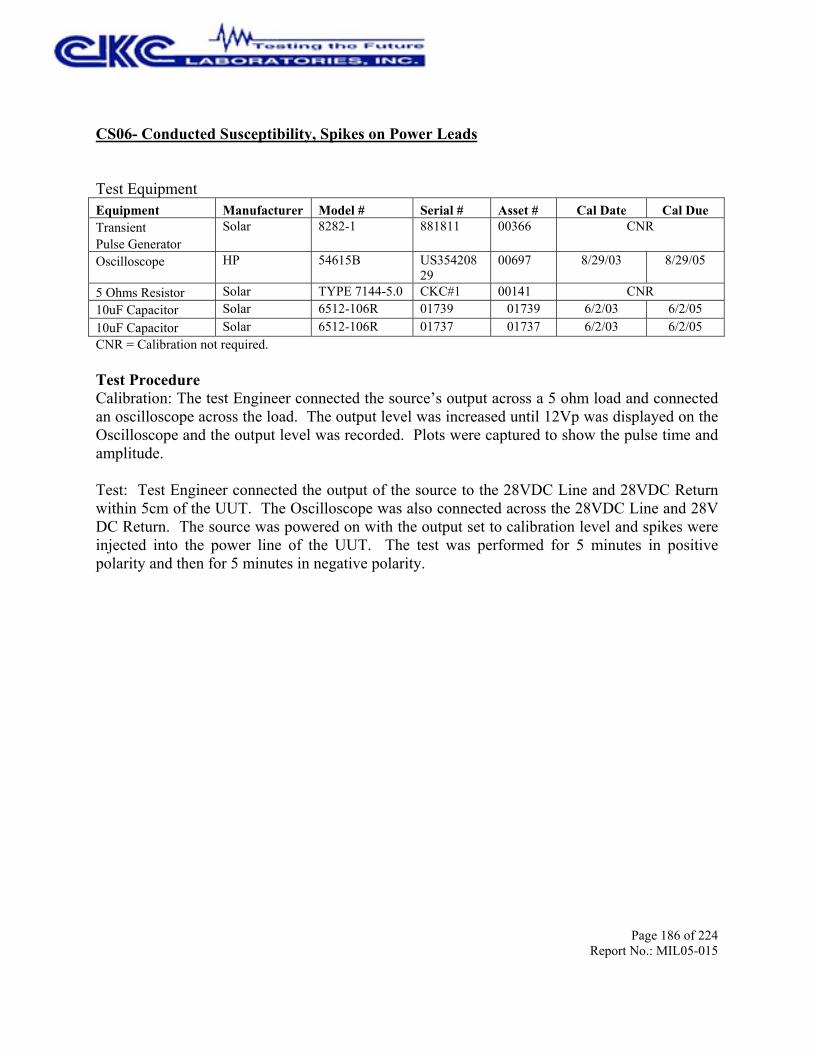
Page 186 of 224Report No.: MIL05-015
CS06- Conducted Susceptibility, Spikes on Power Leads
Test EquipmentEquipment Manufacturer Model # Serial # Asset # Cal Date Cal DueTransientPulse Generator
Solar 8282-1 881811 00366 CNR
Oscilloscope HP 54615B US35420829
00697 8/29/03 8/29/05
5 Ohms Resistor Solar TYPE 7144-5.0 CKC#1 00141 CNR10uF Capacitor Solar 6512-106R 01739 01739 6/2/03 6/2/0510uF Capacitor Solar 6512-106R 01737 01737 6/2/03 6/2/05CNR = Calibration not required.
Test ProcedureCalibration: The test Engineer connected the source’s output across a 5 ohm load and connectedan oscilloscope across the load. The output level was increased until 12Vp was displayed on theOscilloscope and the output level was recorded. Plots were captured to show the pulse time andamplitude.
Test: Test Engineer connected the output of the source to the 28VDC Line and 28VDC Returnwithin 5cm of the UUT. The Oscilloscope was also connected across the 28VDC Line and 28VDC Return. The source was powered on with the output set to calibration level and spikes wereinjected into the power line of the UUT. The test was performed for 5 minutes in positivepolarity and then for 5 minutes in negative polarity.

Page 187 of 224Report No.: MIL05-015
10pps
Negative Pulse

Page 188 of 224Report No.: MIL05-015
Positive Pulse
Time duration and Amplitude
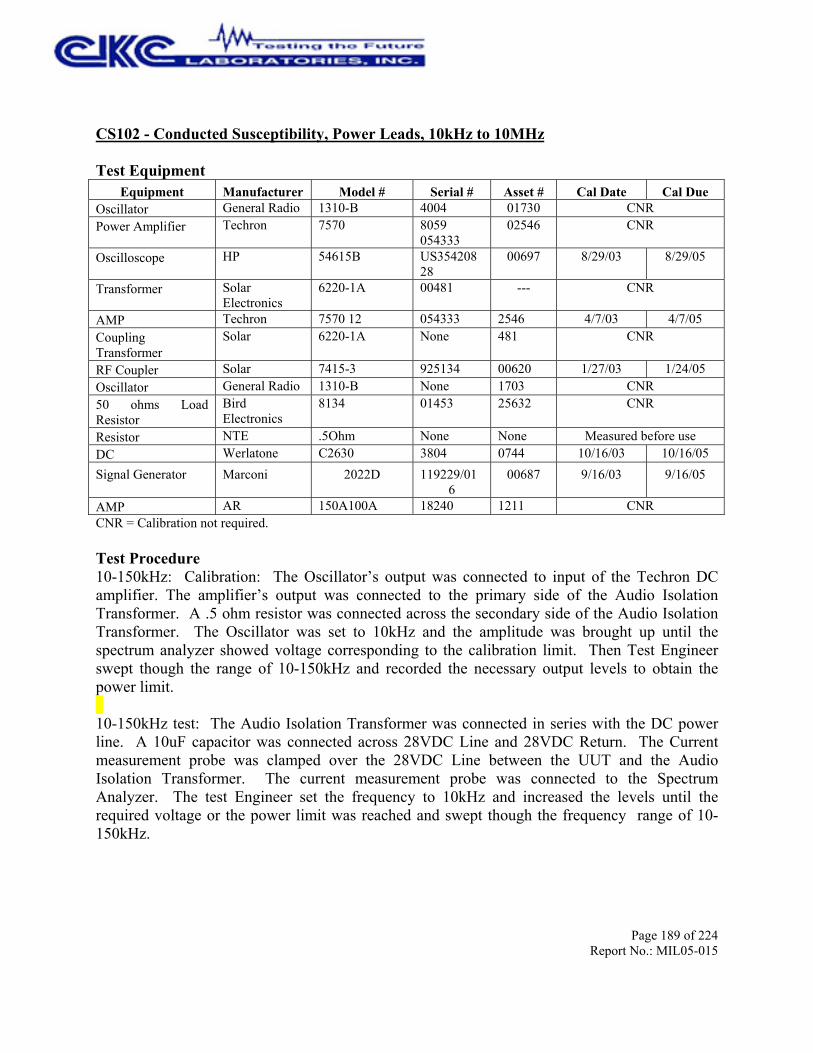
Page 189 of 224Report No.: MIL05-015
CS102 - Conducted Susceptibility, Power Leads, 10kHz to 10MHz
Test EquipmentEquipment Manufacturer Model # Serial # Asset # Cal Date Cal Due
Oscillator General Radio 1310-B 4004 01730 CNRPower Amplifier Techron 7570 8059
05433302546 CNR
Oscilloscope HP 54615B US35420828
00697 8/29/03 8/29/05
Transformer SolarElectronics
6220-1A 00481 --- CNR
AMP Techron 7570 12 054333 2546 4/7/03 4/7/05CouplingTransformer
Solar 6220-1A None 481 CNR
RF Coupler Solar 7415-3 925134 00620 1/27/03 1/24/05Oscillator General Radio 1310-B None 1703 CNR50 ohms LoadResistor
BirdElectronics
8134 01453 25632 CNR
Resistor NTE .5Ohm None None Measured before useDC Werlatone C2630 3804 0744 10/16/03 10/16/05Signal Generator Marconi 2022D 119229/01
600687 9/16/03 9/16/05
AMP AR 150A100A 18240 1211 CNRCNR = Calibration not required.
Test Procedure10-150kHz: Calibration: The Oscillator’s output was connected to input of the Techron DCamplifier. The amplifier’s output was connected to the primary side of the Audio IsolationTransformer. A .5 ohm resistor was connected across the secondary side of the Audio IsolationTransformer. The Oscillator was set to 10kHz and the amplitude was brought up until thespectrum analyzer showed voltage corresponding to the calibration limit. Then Test Engineerswept though the range of 10-150kHz and recorded the necessary output levels to obtain thepower limit.
10-150kHz test: The Audio Isolation Transformer was connected in series with the DC powerline. A 10uF capacitor was connected across 28VDC Line and 28VDC Return. The Currentmeasurement probe was clamped over the 28VDC Line between the UUT and the AudioIsolation Transformer. The current measurement probe was connected to the SpectrumAnalyzer. The test Engineer set the frequency to 10kHz and increased the levels until therequired voltage or the power limit was reached and swept though the frequency range of 10-150kHz.

Page 190 of 224Report No.: MIL05-015
150kHz-10MHz Calibration: The Signal Generator’s output was connected to the input of theamplifier. The amplifier’s output was connected to a RF coupler, which had 50 ohms load acrossthe output. A current measurement probe was clamped around the lead going from the output ofthe RF coupler to the 50 ohms load. The Signal Generator was set to 150kHz and the amplitudewas brought up until the spectrum analyzer indicated the voltage corresponding to the calibrationlimit. The test Engineer swept though the range of 10 – 150kHz and recorded the necessaryoutput levels to obtain the power limit.
150kHz - 10MHz test: The RF coupler’s output was connected to 28VDC power Line, 5cmfrom the UUT. The Current measurement probe was clamped over the 28VDC Line between theUUT and the RF coupler. The current measurement probe was connected to the SpectrumAnalyzer. The test Engineer set the frequency to 150kHz increasing the levels until the requiredvoltage on the Spectrum Analyzer was indicated or the power limit was reached. Then theentire frequency range of 150kHz - 10MHz was swept.
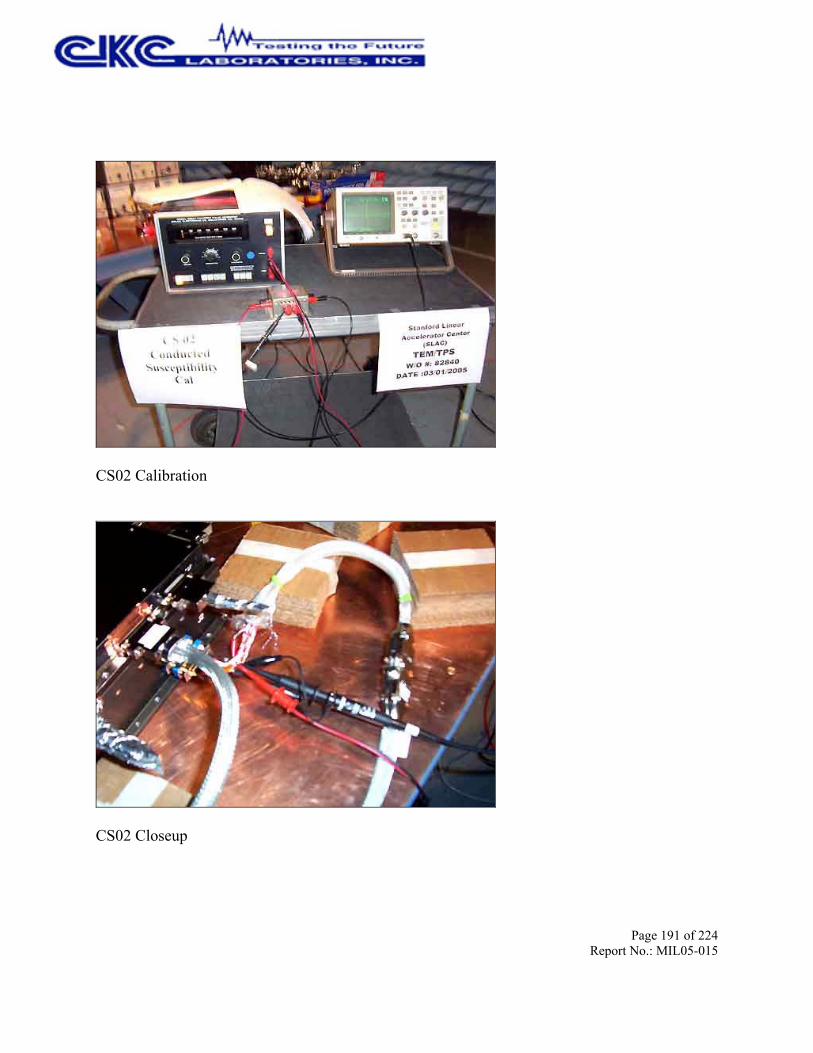
Page 191 of 224Report No.: MIL05-015
CS02 Calibration
CS02 Closeup
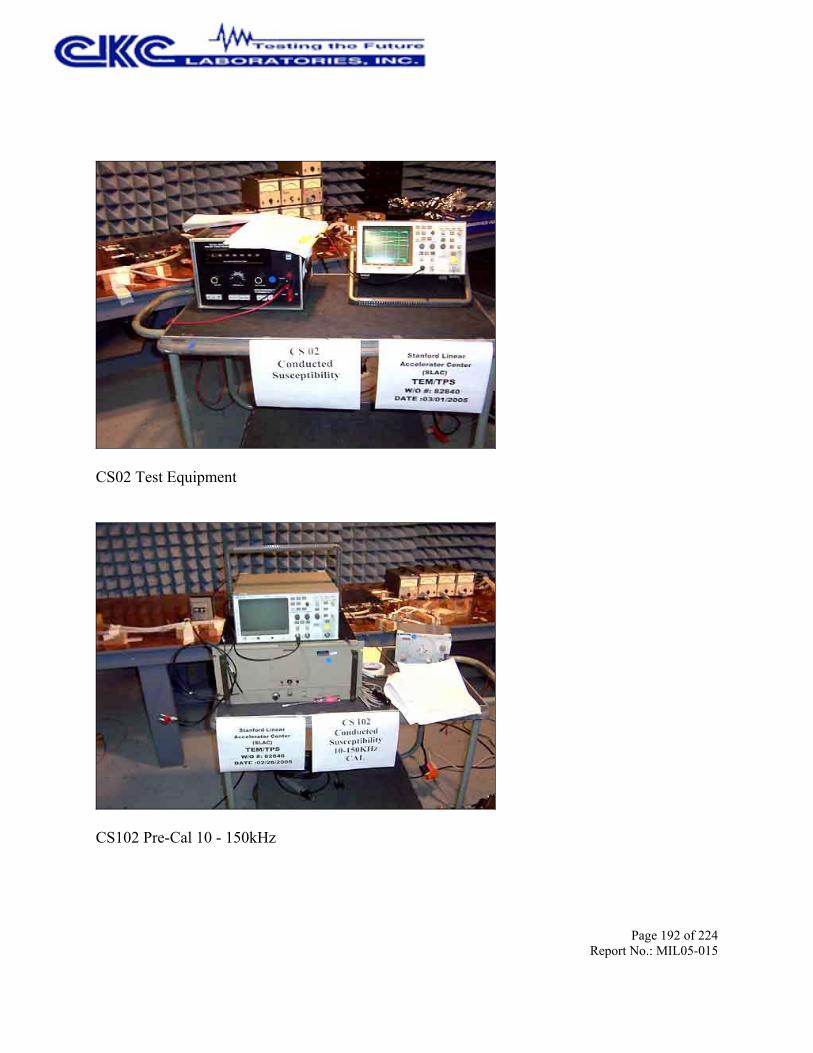
Page 192 of 224Report No.: MIL05-015
CS02 Test Equipment
CS102 Pre-Cal 10 - 150kHz

Page 193 of 224Report No.: MIL05-015
CS102 Pre-Cal 10 - 150kHz Closeup
CS102 Calibration

Page 194 of 224Report No.: MIL05-015
CS102 Calibration
CS102 Overall View of Test Setup
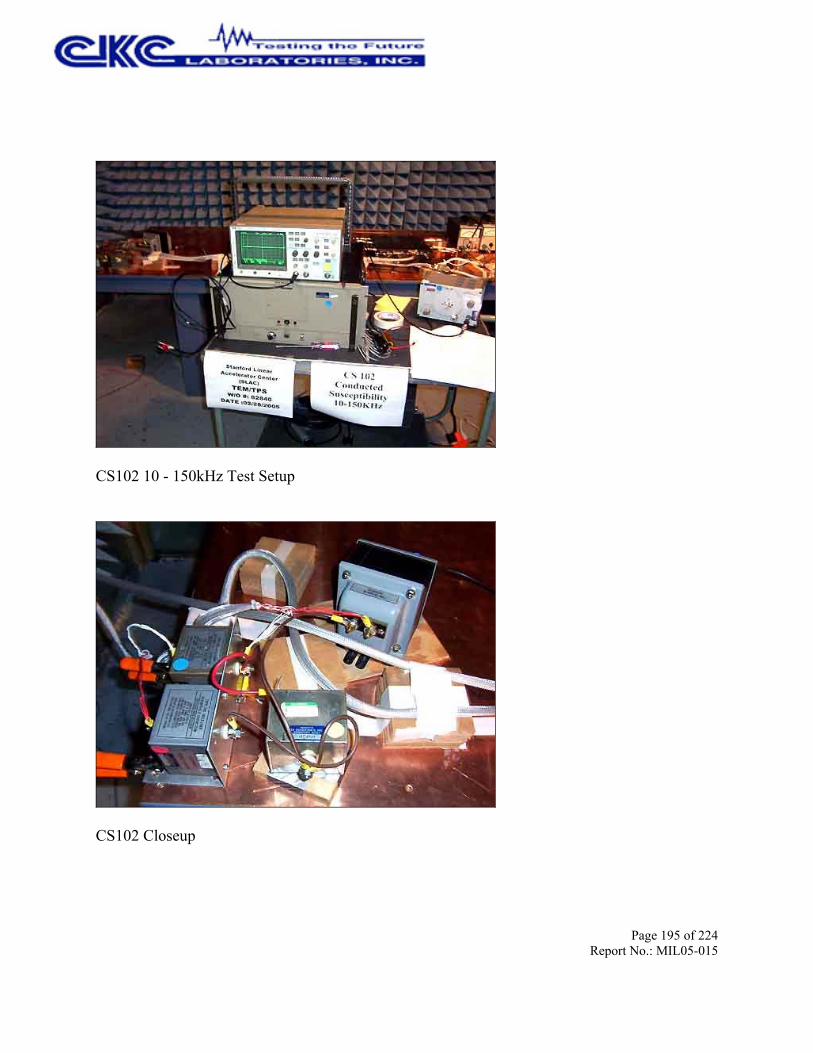
Page 195 of 224Report No.: MIL05-015
CS102 10 - 150kHz Test Setup
CS102 Closeup

Page 196 of 224Report No.: MIL05-015
CS102 Test Equipment Closeup

Page 197 of 224Report No.: MIL05-015
CSCM- Conducted Susceptibility, Common Mode, 30Hz to 150MHz
Test EquipmentEquipment Manufacturer Model # Serial # Asset # Cal Date Cal DueOscilloscope HP 54615B US354208
29697 8/29/03 8/29/05
10uF Capacitor Solar 6512-106R None 01740 6/2/03 6/2/05AMP Techron 7570 12 054333 2546 4/7/03 4/7/05CouplingTransformer
Solar 6220-1A None 481 CNR
RF Coupler Solar 7415-3 925134 00620 1/27/03 1/24/05Oscillator General Radio 1310-B None 1703 NR NRArbitrary WaveformGenerator
HP 33120A US36037746
02561 10/16/04 10/16/06
50 ohms LoadResistor
BirdElectronics
8134 01453 25632 CNR
Resistor NTE .5Ohm None None Measured before useSignal Generator Marconi 2022D 119229/01
600687 9/16/03 9/16/05
AMP AR 150A100A 18240 1211 CNRCNR = Calibration not required.
Test Procedure 30Hz to 150kHzA 0.5Ω load was placed across the secondary windings of the audio isolation transformer. Thefunction generator was connected to the amplifier and the output of the sweep generator wasconnected across the primary of the audio isolation transformer. The generator's output wasincreased until 80Watts were obtained. The test engineer recorded the drive levels whilemanually sweeping through the frequency range. The generator output was adjusted as necessaryto maintain the required power level into the 0.5Ω load.
The Input Power was connected from a 10µF RF capacitor mounted on the EMI ground plane toone side of the secondary winding of the audio isolation transformer. The other side of thesecondary winding was connected to the UUT. A 500MHz digital oscilloscope was connectedacross the +28VDC Return Lead referenced to the ground plane and configured for AC coupling.The generator's output was increased until the necessary voltage level as specified in MIL-STD461E Figure CS101-1 was achieved, while ensuring the 80 Watt calibration drive levels were notexceeded. The test engineer manually swept through the frequency range from 30Hz to 150kHzadjusting the output voltage as necessary to maintain the test levels. The functionality of the unitwas monitored throughout the sweep.
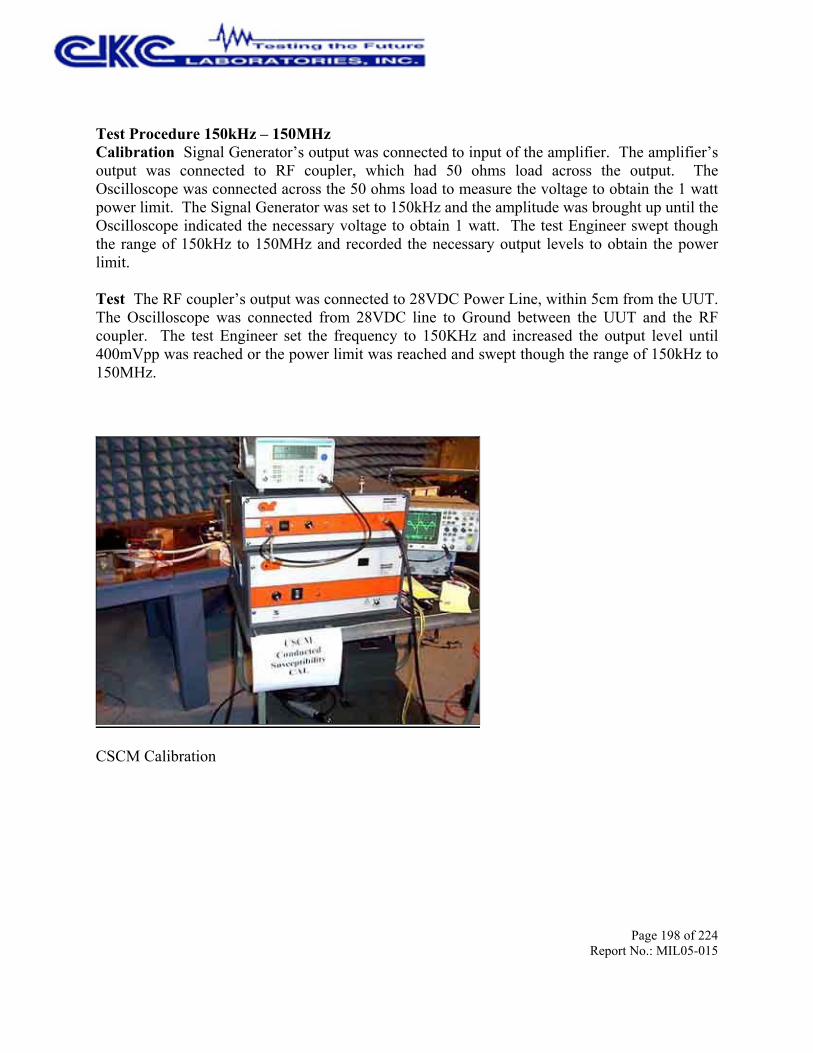
Page 198 of 224Report No.: MIL05-015
Test Procedure 150kHz – 150MHzCalibration Signal Generator’s output was connected to input of the amplifier. The amplifier’soutput was connected to RF coupler, which had 50 ohms load across the output. TheOscilloscope was connected across the 50 ohms load to measure the voltage to obtain the 1 wattpower limit. The Signal Generator was set to 150kHz and the amplitude was brought up until theOscilloscope indicated the necessary voltage to obtain 1 watt. The test Engineer swept thoughthe range of 150kHz to 150MHz and recorded the necessary output levels to obtain the powerlimit.
Test The RF coupler’s output was connected to 28VDC Power Line, within 5cm from the UUT.The Oscilloscope was connected from 28VDC line to Ground between the UUT and the RFcoupler. The test Engineer set the frequency to 150KHz and increased the output level until400mVpp was reached or the power limit was reached and swept though the range of 150kHz to150MHz.
CSCM Calibration
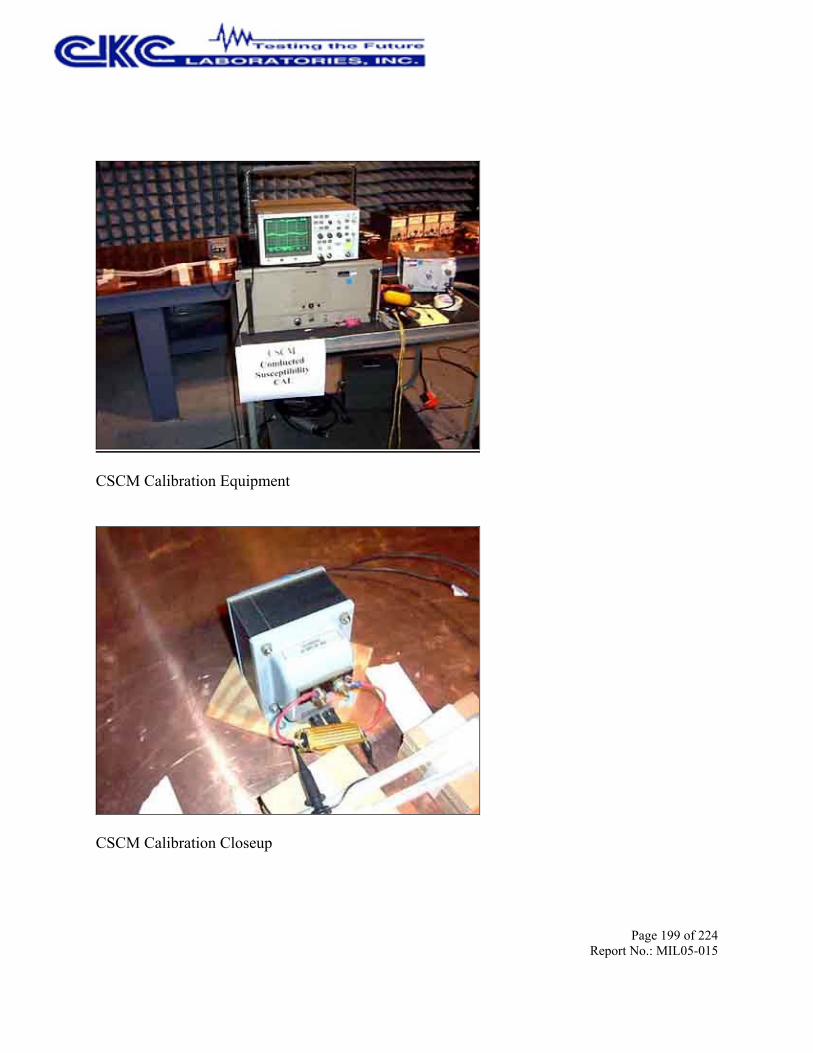
Page 199 of 224Report No.: MIL05-015
CSCM Calibration Equipment
CSCM Calibration Closeup
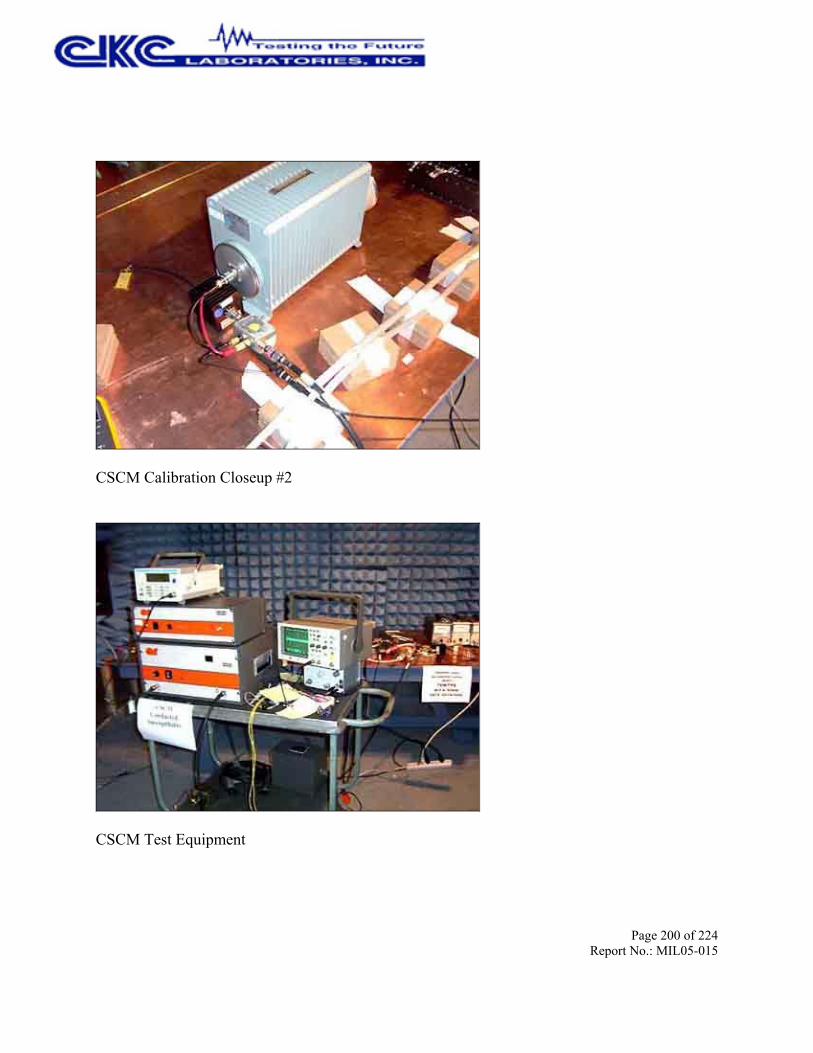
Page 200 of 224Report No.: MIL05-015
CSCM Calibration Closeup #2
CSCM Test Equipment

Page 201 of 224Report No.: MIL05-015
CSCM Test Setup
CSCM Test Setup Closeup

Page 202 of 224Report No.: MIL05-015
RS101 - Radiated Susceptibility, Magnetic Field, 30Hz to 100kHz
Test EquipmentEquipment Manufacturer Model # Serial # Asset # Cal Date Cal Due
RF Probe Fischer F-304 19 01573 8/20/03 8/20/05RF Probe Fischer F-305 19 01574 8/20/03 8/20/05SA – Display HP 8568A 2237A0435
000446 10/25/04 10/25/06
SA – RF HP 8568A 2235A02391
00447 10/25/04 10/25/06
SA Agilent E4446A US44300408
02668 1/13/05 1/13/07
Arbitrary WaveformGenerator
HP 33120A US36037746
02561 10/16/04 10/16/06
Power Amplifier Techron 7570 8059054333
02546 CNR
Current Probe Fischer F-10 37 02142 4/23/03 4/23/05Calibration not required.
Test ProcedureA calibration of the test setup was performed per the method specified in MIL-STD 461EParagraph 5.18.3.4.
The function generator was connected to the amplifier and the output of the amplifier wasconnected to the transmit loop. A digital multimeter was placed in line between the amplifierand the transmit loop to monitor the current applied to the loop. For testing from 30Hz to200Hz, the input to the transmit loop was set at 15Amps. The transmit loop was placed 5cmfrom the front face of the UUT. The test engineer manually increased the frequency from 30Hzto 200Hz while he maintained the 15Amp input current. Testing was repeated on the back, rightside, left side, bottom and top faces of the UUT.
At 100Hz, the transmit loop was placed 5cm from the reference loop antenna. The referenceloop was connected to the spectrum analyzer. The current applied to the transmitting loop wasincreased until the resulting magnetic field was 6dB above the required level. The test levels andcorresponding input currents were verified throughout the frequency range from 100Hz to100kHz. The transmit loop was then placed 5cm from the front of the UUT and the inputcurrents obtained during the calibration were applied to the loop. A full sweep was performedfrom 200Hz to 100kHz. Testing was repeated on the remaining faces of the UUT. Thefunctionality of the UUT was monitored throughout the testing.

Page 203 of 224Report No.: MIL05-015
Radiated Susceptibility Calibration
Radiated Susceptibility Test Setup

Page 204 of 224Report No.: MIL05-015
Radiated Susceptibility Test Equipment
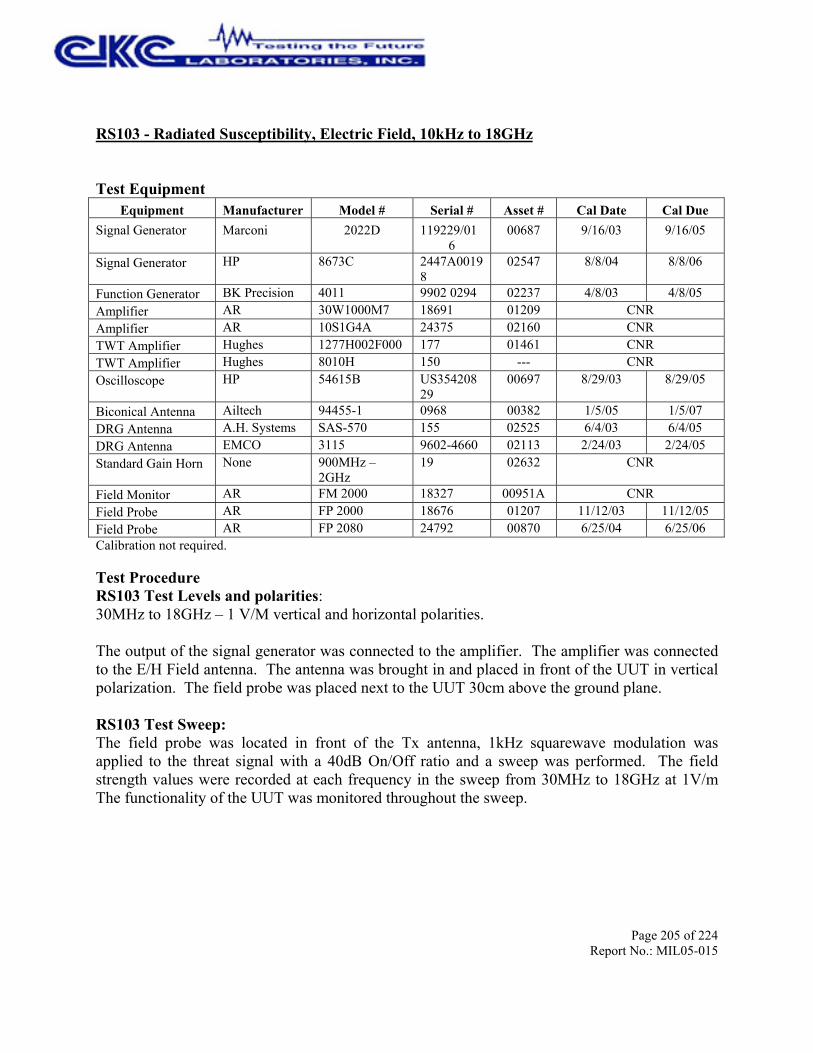
Page 205 of 224Report No.: MIL05-015
RS103 - Radiated Susceptibility, Electric Field, 10kHz to 18GHz
Test EquipmentEquipment Manufacturer Model # Serial # Asset # Cal Date Cal Due
Signal Generator Marconi 2022D 119229/016
00687 9/16/03 9/16/05
Signal Generator HP 8673C 2447A00198
02547 8/8/04 8/8/06
Function Generator BK Precision 4011 9902 0294 02237 4/8/03 4/8/05Amplifier AR 30W1000M7 18691 01209 CNRAmplifier AR 10S1G4A 24375 02160 CNRTWT Amplifier Hughes 1277H002F000 177 01461 CNRTWT Amplifier Hughes 8010H 150 --- CNROscilloscope HP 54615B US354208
2900697 8/29/03 8/29/05
Biconical Antenna Ailtech 94455-1 0968 00382 1/5/05 1/5/07DRG Antenna A.H. Systems SAS-570 155 02525 6/4/03 6/4/05DRG Antenna EMCO 3115 9602-4660 02113 2/24/03 2/24/05Standard Gain Horn None 900MHz –
2GHz19 02632 CNR
Field Monitor AR FM 2000 18327 00951A CNRField Probe AR FP 2000 18676 01207 11/12/03 11/12/05Field Probe AR FP 2080 24792 00870 6/25/04 6/25/06Calibration not required.
Test ProcedureRS103 Test Levels and polarities:30MHz to 18GHz – 1 V/M vertical and horizontal polarities.
The output of the signal generator was connected to the amplifier. The amplifier was connectedto the E/H Field antenna. The antenna was brought in and placed in front of the UUT in verticalpolarization. The field probe was placed next to the UUT 30cm above the ground plane.
RS103 Test Sweep:The field probe was located in front of the Tx antenna, 1kHz squarewave modulation wasapplied to the threat signal with a 40dB On/Off ratio and a sweep was performed. The fieldstrength values were recorded at each frequency in the sweep from 30MHz to 18GHz at 1V/mThe functionality of the UUT was monitored throughout the sweep.
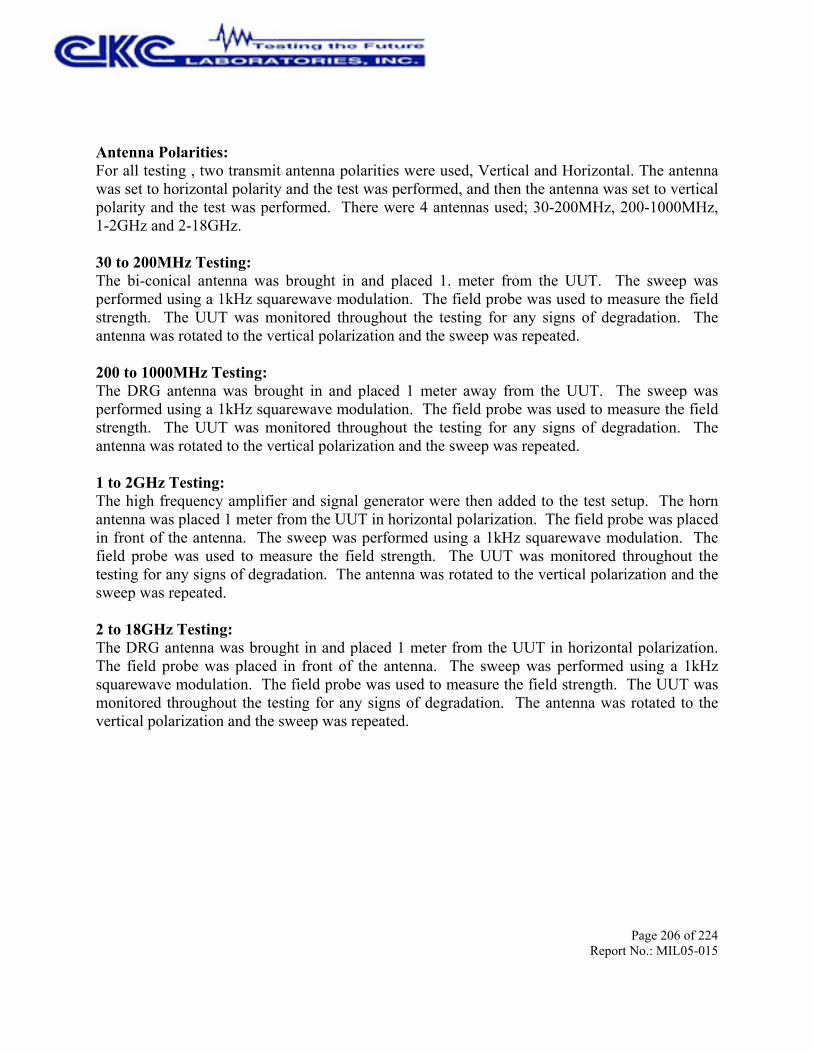
Page 206 of 224Report No.: MIL05-015
Antenna Polarities:For all testing , two transmit antenna polarities were used, Vertical and Horizontal. The antennawas set to horizontal polarity and the test was performed, and then the antenna was set to verticalpolarity and the test was performed. There were 4 antennas used; 30-200MHz, 200-1000MHz,1-2GHz and 2-18GHz.
30 to 200MHz Testing:The bi-conical antenna was brought in and placed 1. meter from the UUT. The sweep wasperformed using a 1kHz squarewave modulation. The field probe was used to measure the fieldstrength. The UUT was monitored throughout the testing for any signs of degradation. Theantenna was rotated to the vertical polarization and the sweep was repeated.
200 to 1000MHz Testing:The DRG antenna was brought in and placed 1 meter away from the UUT. The sweep wasperformed using a 1kHz squarewave modulation. The field probe was used to measure the fieldstrength. The UUT was monitored throughout the testing for any signs of degradation. Theantenna was rotated to the vertical polarization and the sweep was repeated.
1 to 2GHz Testing:The high frequency amplifier and signal generator were then added to the test setup. The hornantenna was placed 1 meter from the UUT in horizontal polarization. The field probe was placedin front of the antenna. The sweep was performed using a 1kHz squarewave modulation. Thefield probe was used to measure the field strength. The UUT was monitored throughout thetesting for any signs of degradation. The antenna was rotated to the vertical polarization and thesweep was repeated.
2 to 18GHz Testing:The DRG antenna was brought in and placed 1 meter from the UUT in horizontal polarization.The field probe was placed in front of the antenna. The sweep was performed using a 1kHzsquarewave modulation. The field probe was used to measure the field strength. The UUT wasmonitored throughout the testing for any signs of degradation. The antenna was rotated to thevertical polarization and the sweep was repeated.
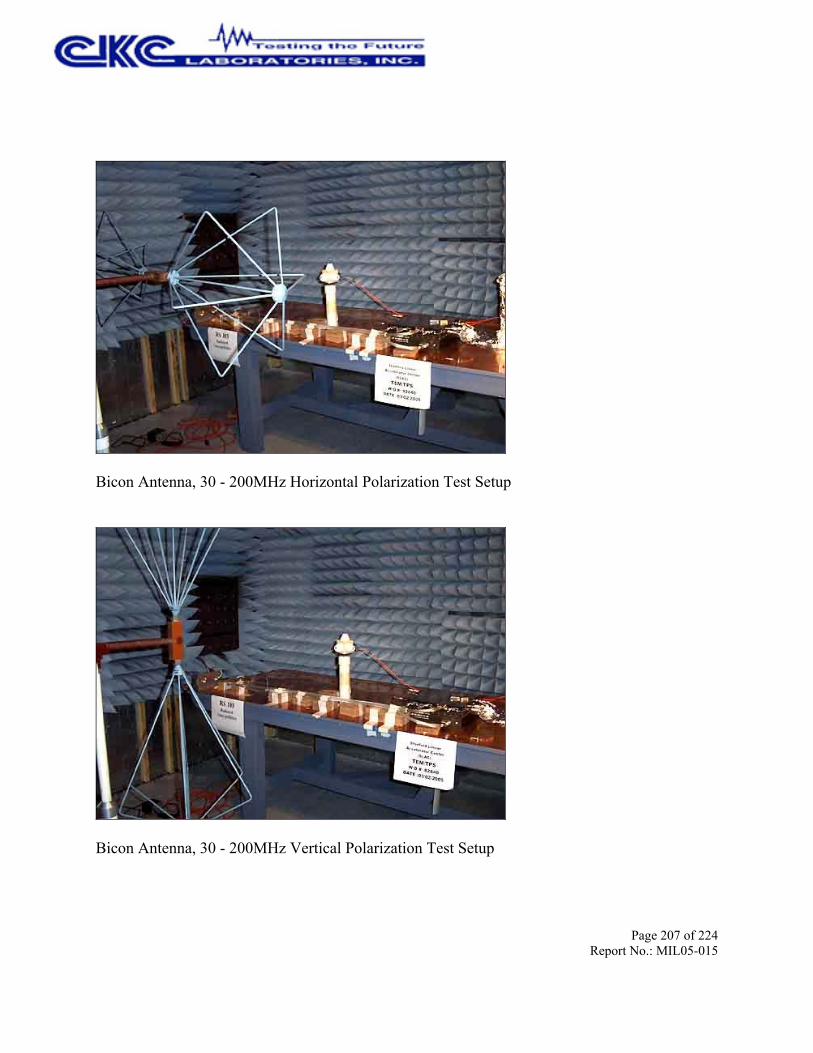
Page 207 of 224Report No.: MIL05-015
Bicon Antenna, 30 - 200MHz Horizontal Polarization Test Setup
Bicon Antenna, 30 - 200MHz Vertical Polarization Test Setup

Page 208 of 224Report No.: MIL05-015
Horn Antenna, 200 - 1000MHz Horizontal Polarization Test Setup
Horn Antenna, 200 - 1000MHz Vertical Polarization Test Setup

Page 209 of 224Report No.: MIL05-015
Horn Antenna, 1 - 2GHz Horizontal Polarization Test Setup
Horn Antenna, 1 - 18GHz Vertical Polarization Test Setup
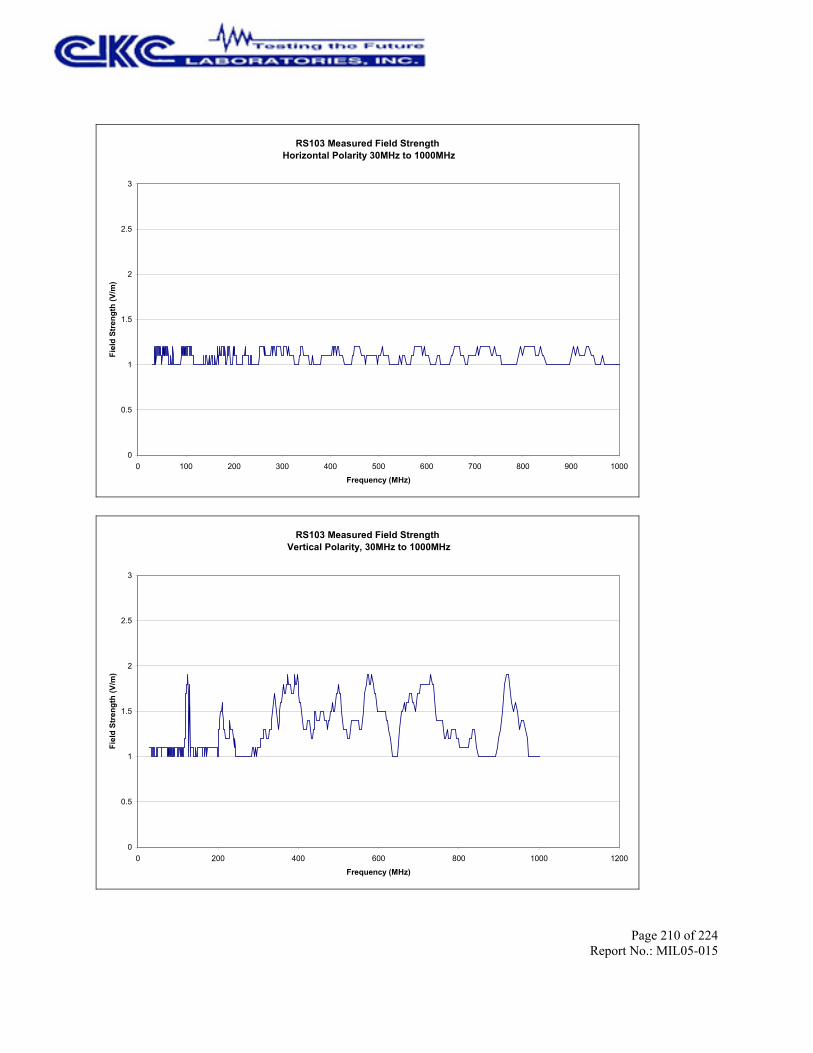
Page 210 of 224Report No.: MIL05-015
RS103 Measured Field Strength Horizontal Polarity 30MHz to 1000MHz
0
0.5
1
1.5
2
2.5
3
0 100 200 300 400 500 600 700 800 900 1000
Frequency (MHz)
Fiel
d St
reng
th (V
/m)
RS103 Measured Field Strength Vertical Polarity, 30MHz to 1000MHz
0
0.5
1
1.5
2
2.5
3
0 200 400 600 800 1000 1200
Frequency (MHz)
Fiel
d St
reng
th (V
/m)

Page 211 of 224Report No.: MIL05-015
RS103 Measured Field Strength Horizontal Polarity, 1 - 4GHz
0
1
2
3
4
5
6
0 500 1000 1500 2000 2500 3000 3500 4000 4500
Frequency (MHz)
Fiel
d St
reng
th (V
/m)
RS103 Measured Field StrengthVertical Polarity, 1 - 4GHz
0
1
2
3
4
5
6
7
8
0 500 1000 1500 2000 2500 3000 3500 4000 4500
Frequency (MHz)
Fiel
d St
reng
th (V
/m)
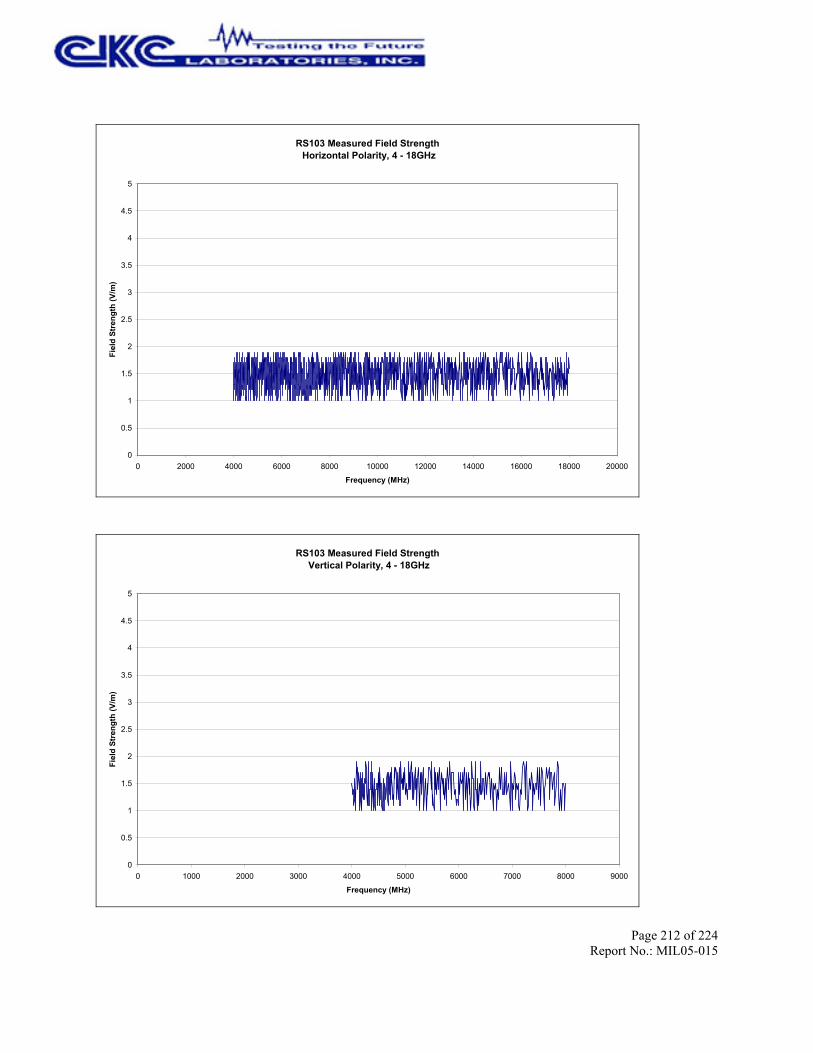
Page 212 of 224Report No.: MIL05-015
RS103 Measured Field Strength Horizontal Polarity, 4 - 18GHz
0
0.5
1
1.5
2
2.5
3
3.5
4
4.5
5
0 2000 4000 6000 8000 10000 12000 14000 16000 18000 20000
Frequency (MHz)
Fiel
d St
reng
th (V
/m)
RS103 Measured Field Strength Vertical Polarity, 4 - 18GHz
0
0.5
1
1.5
2
2.5
3
3.5
4
4.5
5
0 1000 2000 3000 4000 5000 6000 7000 8000 9000
Frequency (MHz)
Fiel
d St
reng
th (V
/m)
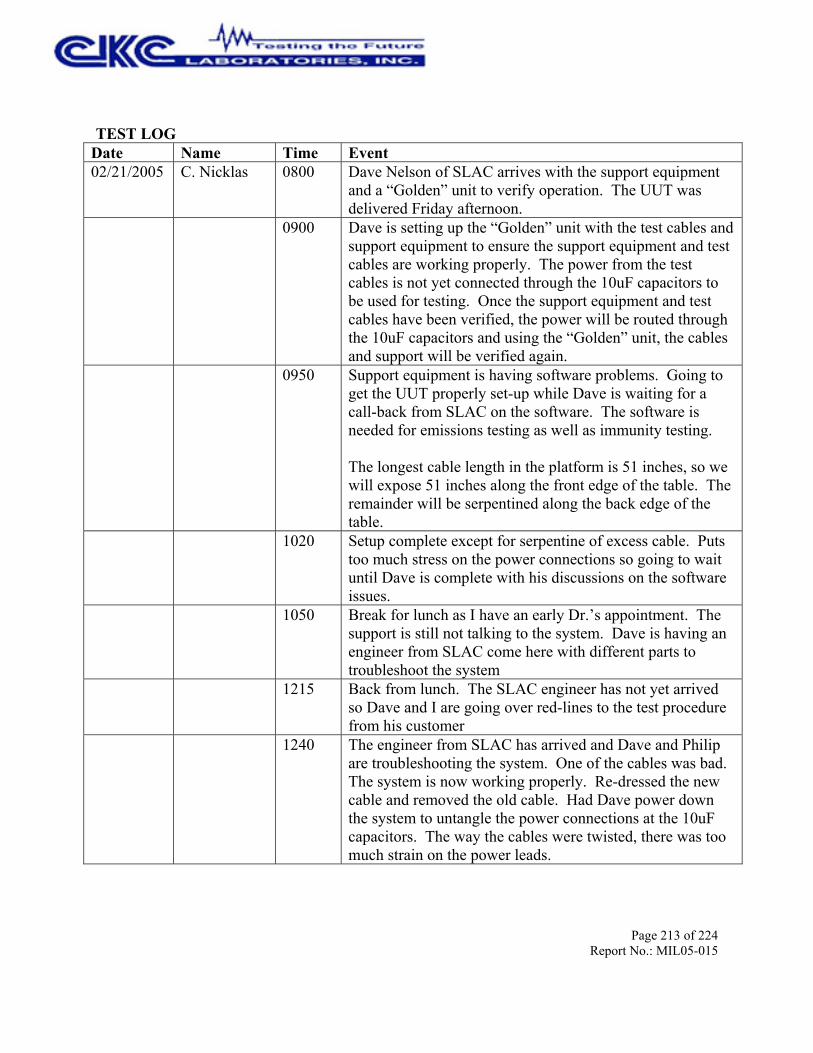
Page 213 of 224Report No.: MIL05-015
TEST LOG Date Name Time Event02/21/2005 C. Nicklas 0800 Dave Nelson of SLAC arrives with the support equipment
and a “Golden” unit to verify operation. The UUT wasdelivered Friday afternoon.
0900 Dave is setting up the “Golden” unit with the test cables andsupport equipment to ensure the support equipment and testcables are working properly. The power from the testcables is not yet connected through the 10uF capacitors tobe used for testing. Once the support equipment and testcables have been verified, the power will be routed throughthe 10uF capacitors and using the “Golden” unit, the cablesand support will be verified again.
0950 Support equipment is having software problems. Going toget the UUT properly set-up while Dave is waiting for acall-back from SLAC on the software. The software isneeded for emissions testing as well as immunity testing.
The longest cable length in the platform is 51 inches, so wewill expose 51 inches along the front edge of the table. Theremainder will be serpentined along the back edge of thetable.
1020 Setup complete except for serpentine of excess cable. Putstoo much stress on the power connections so going to waituntil Dave is complete with his discussions on the softwareissues.
1050 Break for lunch as I have an early Dr.’s appointment. Thesupport is still not talking to the system. Dave is having anengineer from SLAC come here with different parts totroubleshoot the system
1215 Back from lunch. The SLAC engineer has not yet arrivedso Dave and I are going over red-lines to the test procedurefrom his customer
1240 The engineer from SLAC has arrived and Dave and Philipare troubleshooting the system. One of the cables was bad.The system is now working properly. Re-dressed the newcable and removed the old cable. Had Dave power downthe system to untangle the power connections at the 10uFcapacitors. The way the cables were twisted, there was toomuch strain on the power leads.

Page 214 of 224Report No.: MIL05-015
1305 Dave is re-powering up the “Golden” unit and verifying thesoftware and support is working properly and verifying thevoltages for all the voltage outputs are correct. Once that isdone, Dave can remove the “Golden” unit and put the testarticle (UUT) in its place. We also need to strip the nyloncovering from the shielded cables to ground the shields asthey go through the access panel and shield over the accesspanel with aluminum foil.
1325 There are problems with the system again. Dave is callingback to SLAC to discuss and troubleshoot the issue.
The software program he is running spits out errors. Theerror count is too high to even tell is the system is running.The other program he could run sends resets to the powersupply and keeps turning the system off. Somebody fromSLAC is working on fixing this problem and hopefully willhave it working for tomorrow.
1345 As the software is down, we are finishing the cables androom shield by removing the plastic mesh that is on top ofthe braid so we can ground it to the chamber wall and alsocover the access panel opening with aluminum foil to shieldthe aperture.
1430 The shields of the cables have been grounded to thechamber wall with copper tape and the aperture has beenshielded over with aluminum foil. Now waiting on thesoftware engineer to arrive. He is slated to arrive between1530 and 1600. While waiting for the software, we arecontinuing to go over the Red-lines to the document. Allred-lines are complete except for the paragraph in eachsusceptibility test about testing each of the 7 voltage outputsseparately. As doing this would add 24+ days to the testing,SLAC personnel are attempting to obtain more voltagemeters to monitor either all 7 at once (preferred) or monitor4 at one time and only have to do the testing twice. Willmodify these sections once it is known exactly is to be done.
1600 The software has emailed a new software program. Davehas installed this new software and the errors are gone. Hehas verified the “Golden” system is correct and now isgoing to switch in the test article (UUT).
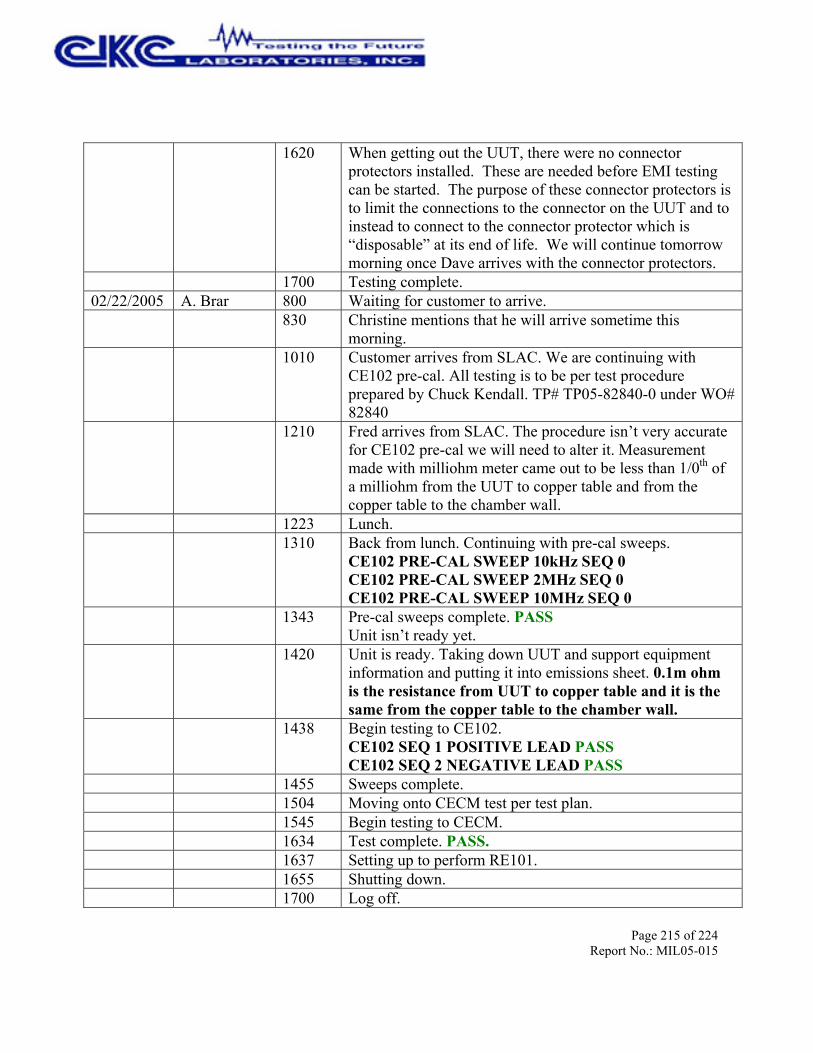
Page 215 of 224Report No.: MIL05-015
1620 When getting out the UUT, there were no connectorprotectors installed. These are needed before EMI testingcan be started. The purpose of these connector protectors isto limit the connections to the connector on the UUT and toinstead to connect to the connector protector which is“disposable” at its end of life. We will continue tomorrowmorning once Dave arrives with the connector protectors.
1700 Testing complete.02/22/2005 A. Brar 800 Waiting for customer to arrive.
830 Christine mentions that he will arrive sometime thismorning.
1010 Customer arrives from SLAC. We are continuing withCE102 pre-cal. All testing is to be per test procedureprepared by Chuck Kendall. TP# TP05-82840-0 under WO#82840
1210 Fred arrives from SLAC. The procedure isn’t very accuratefor CE102 pre-cal we will need to alter it. Measurementmade with milliohm meter came out to be less than 1/0th ofa milliohm from the UUT to copper table and from thecopper table to the chamber wall.
1223 Lunch.1310 Back from lunch. Continuing with pre-cal sweeps.
CE102 PRE-CAL SWEEP 10kHz SEQ 0CE102 PRE-CAL SWEEP 2MHz SEQ 0CE102 PRE-CAL SWEEP 10MHz SEQ 0
1343 Pre-cal sweeps complete. PASSUnit isn’t ready yet.
1420 Unit is ready. Taking down UUT and support equipmentinformation and putting it into emissions sheet. 0.1m ohmis the resistance from UUT to copper table and it is thesame from the copper table to the chamber wall.
1438 Begin testing to CE102.CE102 SEQ 1 POSITIVE LEAD PASSCE102 SEQ 2 NEGATIVE LEAD PASS
1455 Sweeps complete.1504 Moving onto CECM test per test plan.1545 Begin testing to CECM.1634 Test complete. PASS.1637 Setting up to perform RE101.1655 Shutting down.1700 Log off.

Page 216 of 224Report No.: MIL05-015
02/23/2005 A. Brar 800 Setting up for RE101 pre-cal and setting up limits percustomer’s spec.
820 Begin RE101 path check sweep.830 Sweep is too far above the limit at 20Hz, I will have to swap
the SA with E4446A.845 E4446A is sweeping too fast working on Greg Johnson to
resolve this problem.850 I let the customer know of the situation.930 I’m discussing this issue with Fred (the witness).935 Fred mentions that use the SA with faster sweep rates
(E4446A) as long as the plot is well under the spec limit andhe is aware that the sweep times are far off (too fast) withthis SA.
940 Repeating the path check sweep.RE101 Path Check Seq 0
945 Complete. PASS.955 Ready to test. Customer is on the phone.1000 Begin Re101 sweeps. SA Sweeps times and settings are
listed below and are to be included in the report forRE101.
1st BandStart: 20HzStop: 272HzSweep Time: 183.8msRBW: 10HzVBW: 30Hz
2nd BandStart: 270HzStop: 1kHzSweep Time: 185.8msRBW: 10HzVBW: 30Hz
3rd BandStart: 1kHzStop: 9kHzSweep Time: 110.5ms

Page 217 of 224Report No.: MIL05-015
RBW: 100HzVBW: 300Hz
4th BandStart: 9kHzStop: 10kHzSweep Time: 18.6msRBW: 100HzVBW: 300Hz
5th BandStart: 10kHzStop: 50kHzSweep Time: 1sRBW: 1 kHzVBW: 3 kHz
RE101 SEQ 3 - JT1, JT2 & JC1 Side PASSRE101 SEQ 4 - JT3, JS1, JT4, J2 & JC2 Side PASSRE101 SEQ 5 - JS1 & J2 parallel to cables PASSRE101 SEQ 6 – JT7, JC4 & JT8 PASSRE101 SEQ 7 - JT5, JC3 & JT6 side PASSRE101 SEQ 8 - Top side PASS
1110 RE101 complete.Setting up the unit to perform RE102, and then we will dothe path check.
1200 Setup almost ready, but we will continue from 30MHz andabove.
1235 Begin path check sweep at 200MHz.RE102 Path Check at 200MHz Seq 0 PASS
1245 Lunch break.1255 Continuing with path checks.1301 Begin path check sweep at 1000MHz.
RE102 Path Check at 1000MHz Seq 0 PASS1338 Path check sweeps complete. Setting up to test from 30-
200MHz.1342 Begin RE102 sweeps.
RE102 Seq 9 - 30-200MHz – Vertical PASSRE102 Seq 10 - 30-200MHz – Horizontal PASS

Page 218 of 224Report No.: MIL05-015
1351 Complete. Pass. Setting up to test form 200-1000MHz.1358 Begin testing from 200-1000MHz.
RE102 Seq 11 - 200-1000MHz – Horizontal PASSRE102 Seq 12 - 200-1000MHz – Vertical PASS
1411 Sweeps complete. Now setting up to perform RE102 from1-18GHz. PC and all of the test equipment has to be movedinto the chamber.
1512 All of the equipment is inside the chamber. Setting up toperform path check at 18GHz.
1530 Due to the restriction bands, we need to setup the RBWvery low, Fred approved 10kHz in the first band and 30kHzin the second band. Now we are also creating the spec totake the least amount of time when we perform runs,otherwise it comes out to be 92 increments and that willtake over 30 minutes per sweep.
1610 Begin RE102 path check at 18GHz.1655 Path check complete. PASS1705 Begin testing to RE102 above 1GHz, in 5 segments.
RE102 Seq 13 - 1-1.55GHz – Horizontal PASSRE102 Seq 14 - 1.55-1.6GHz – Horizontal FAILRE102 Seq 15 - 1.6-1.77GHz – Horizontal PASSRE102 Seq 16 – 1.77-2.3GHz – Horizontal FAILRE102 Seq 17 – 2.3-18GHz – Horizontal PASS
1723 Sweep complete. Shutting down for the day.1730 Log off.
02/24/2005 A. Brar 800 Booting up system.810 Discussing some of the failing data with customer.815 Customer mentions that Fred would like us to try the failing
range with lower RBW. seq 16 will be repeated and namedas seq 18-21. This sweep will take 45minutes due to lowRBW of 3kHz per customer.
830 Limit calculated. Begin sweep.
930 Sweep complete. calculating.940 Freezes up, too much data for software to handle. We will
repeat the sweep, and break it up into 4 segments.945 Repeating sweep.
RE102 Seq 18 – 1.77-1.9GHz – Horizontal FAILRE102 Seq 19 – 1.9-2.03GHz – Horizontal PASSRE102 Seq 20 – 2.03-2.16GHz – Horizontal PASSRE102 Seq 21 – 2.16-2.3GHz – Horizontal PASS

Page 219 of 224Report No.: MIL05-015
1108 1.77-2.3GHz sweep complete. Now moving onto Verticalfrom 1-18GHz, using original RBW settings.
1115 Begin testing to RE102 from 1-18GHz using original RBWsettings.RE102 Seq 22 – 1-1.55GHz – Vertical PASSRE102 Seq 23 – 1.55-1.6GHz – Vertical FAILRE102 Seq 24 – 1.6-1.77GHz – Vertical PASSRE102 Seq 25 – 1.77-2.3GHz – Vertical FAILRE102 Seq 26 – 2.3-18GHz – Vertical PASS
1140 Complete. Troubleshooting at 1599.99MHz vertically.1230 Lunch.1300 Back from lunch.1305 Begin scan with modification to JS1 connector.
RE102 Seq 27 – 1.55-1.6GHz – Vertical FAIL1315 Complete. Waiting for Fred to arrive.1400 Fred arrives. Continuing with troubleshooting.1411 Realized that the SA being inside the chamber is causing
one of the spikes in the spectrum.1412 Repeating seq 28 with UUT and support equipment shut off.
RE102 Seq 28 – 1.55-1.6GHz – Vertical FAIL1420 Complete.1447 Begin scan from 1.55-1.6GHz.
RE102 Seq 29 – 1.55-1.6GHz – Vertical FAIL1455 Complete.1505 Begin sweep from 1.55-1.6GHz with 300Hz RBW.
RE102 Seq 30 – 1.55-1.563GHz – Vertical-PASS seq 28 isambient sweepRE102 Seq 31 – 1.563-1.576GHz – Vertical PASSRE102 Seq 32 – 1.576-1.589GHz – Vertical PASSRE102 Seq 33 – 1.589-1.6GHz – Vertical PASS
1617 Sweeps complete. 1-18GHz radiated emissions testingcomplete. With the support of the ambient sweeps, customerwould like a report. Moving test equipment out of thechamber.
1630 Log off.02/25/2005 A. Brar 800 Continuing with setup outside of the chamber.
815 Setup complete. Now setting up the rod antenna inside thechamber to make path check measurements.
845 Downloading photos.
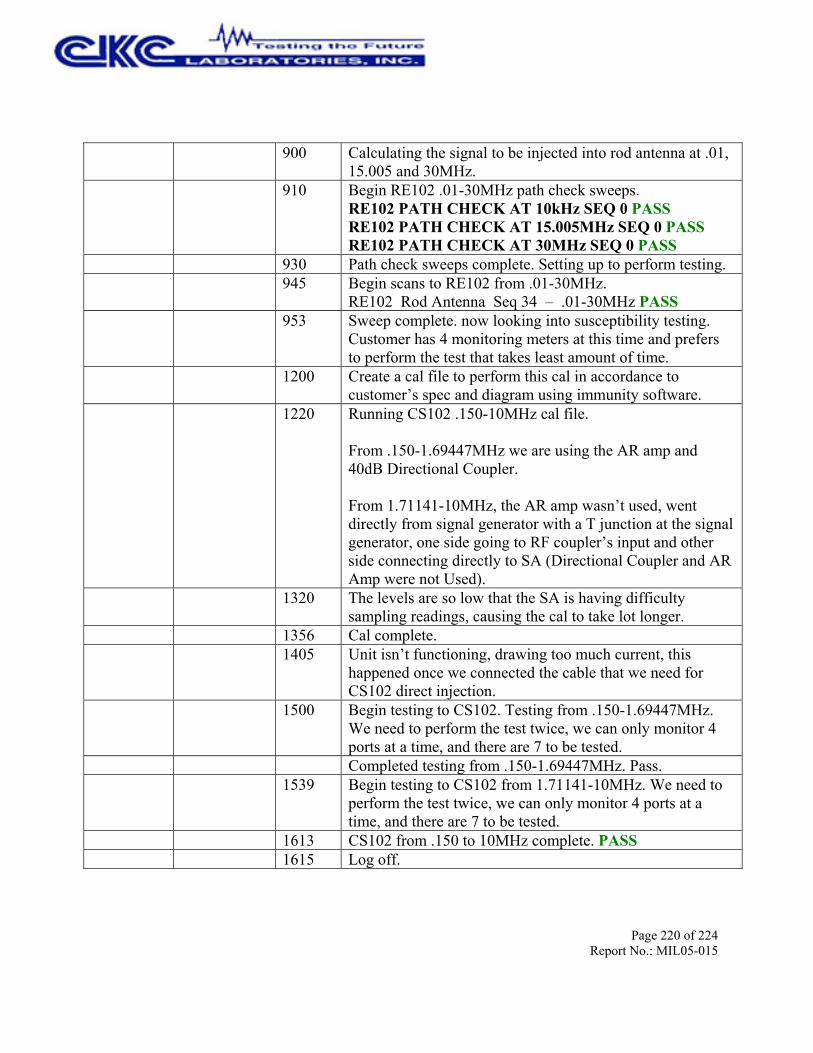
Page 220 of 224Report No.: MIL05-015
900 Calculating the signal to be injected into rod antenna at .01,15.005 and 30MHz.
910 Begin RE102 .01-30MHz path check sweeps.RE102 PATH CHECK AT 10kHz SEQ 0 PASSRE102 PATH CHECK AT 15.005MHz SEQ 0 PASSRE102 PATH CHECK AT 30MHz SEQ 0 PASS
930 Path check sweeps complete. Setting up to perform testing.945 Begin scans to RE102 from .01-30MHz.
RE102 Rod Antenna Seq 34 – .01-30MHz PASS953 Sweep complete. now looking into susceptibility testing.
Customer has 4 monitoring meters at this time and prefersto perform the test that takes least amount of time.
1200 Create a cal file to perform this cal in accordance tocustomer’s spec and diagram using immunity software.
1220 Running CS102 .150-10MHz cal file.
From .150-1.69447MHz we are using the AR amp and40dB Directional Coupler.
From 1.71141-10MHz, the AR amp wasn’t used, wentdirectly from signal generator with a T junction at the signalgenerator, one side going to RF coupler’s input and otherside connecting directly to SA (Directional Coupler and ARAmp were not Used).
1320 The levels are so low that the SA is having difficultysampling readings, causing the cal to take lot longer.
1356 Cal complete.1405 Unit isn’t functioning, drawing too much current, this
happened once we connected the cable that we need forCS102 direct injection.
1500 Begin testing to CS102. Testing from .150-1.69447MHz.We need to perform the test twice, we can only monitor 4ports at a time, and there are 7 to be tested.Completed testing from .150-1.69447MHz. Pass.
1539 Begin testing to CS102 from 1.71141-10MHz. We need toperform the test twice, we can only monitor 4 ports at atime, and there are 7 to be tested.
1613 CS102 from .150 to 10MHz complete. PASS1615 Log off.
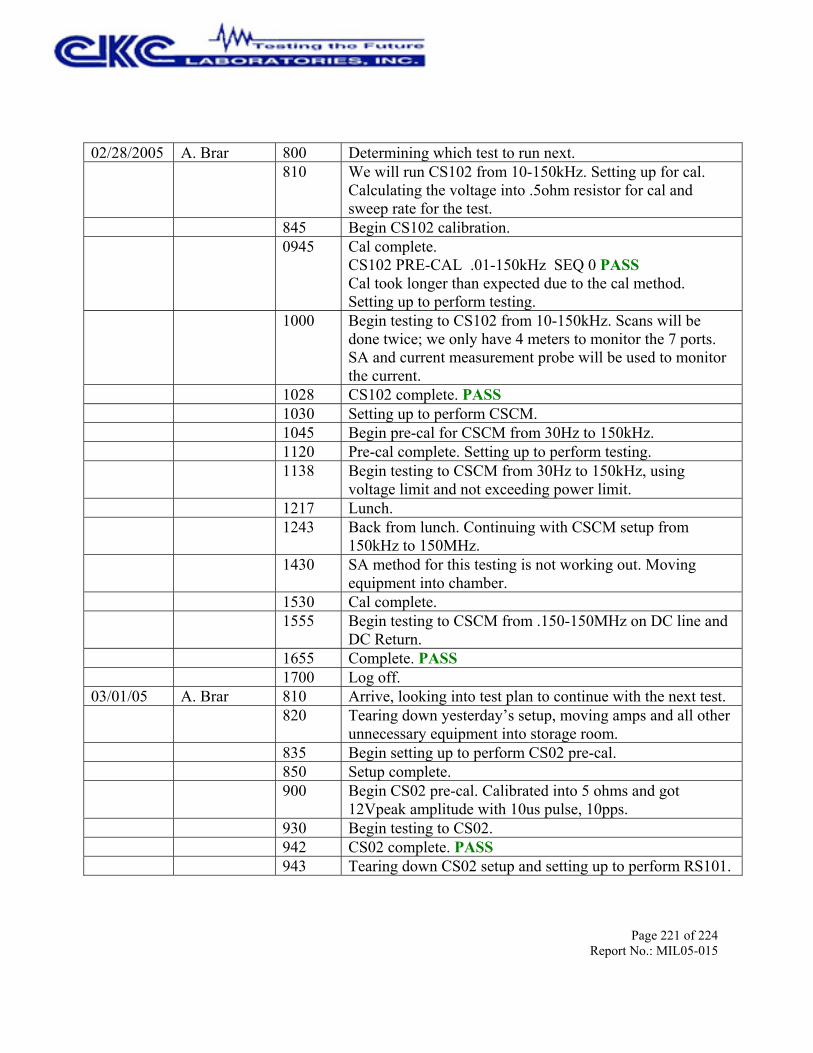
Page 221 of 224Report No.: MIL05-015
02/28/2005 A. Brar 800 Determining which test to run next.810 We will run CS102 from 10-150kHz. Setting up for cal.
Calculating the voltage into .5ohm resistor for cal andsweep rate for the test.
845 Begin CS102 calibration.0945 Cal complete.
CS102 PRE-CAL .01-150kHz SEQ 0 PASSCal took longer than expected due to the cal method.Setting up to perform testing.
1000 Begin testing to CS102 from 10-150kHz. Scans will bedone twice; we only have 4 meters to monitor the 7 ports.SA and current measurement probe will be used to monitorthe current.
1028 CS102 complete. PASS1030 Setting up to perform CSCM.1045 Begin pre-cal for CSCM from 30Hz to 150kHz.1120 Pre-cal complete. Setting up to perform testing.1138 Begin testing to CSCM from 30Hz to 150kHz, using
voltage limit and not exceeding power limit.1217 Lunch.1243 Back from lunch. Continuing with CSCM setup from
150kHz to 150MHz.1430 SA method for this testing is not working out. Moving
equipment into chamber.1530 Cal complete.1555 Begin testing to CSCM from .150-150MHz on DC line and
DC Return.1655 Complete. PASS1700 Log off.
03/01/05 A. Brar 810 Arrive, looking into test plan to continue with the next test.820 Tearing down yesterday’s setup, moving amps and all other
unnecessary equipment into storage room.835 Begin setting up to perform CS02 pre-cal.850 Setup complete.900 Begin CS02 pre-cal. Calibrated into 5 ohms and got
12Vpeak amplitude with 10us pulse, 10pps.930 Begin testing to CS02.942 CS02 complete. PASS943 Tearing down CS02 setup and setting up to perform RS101.
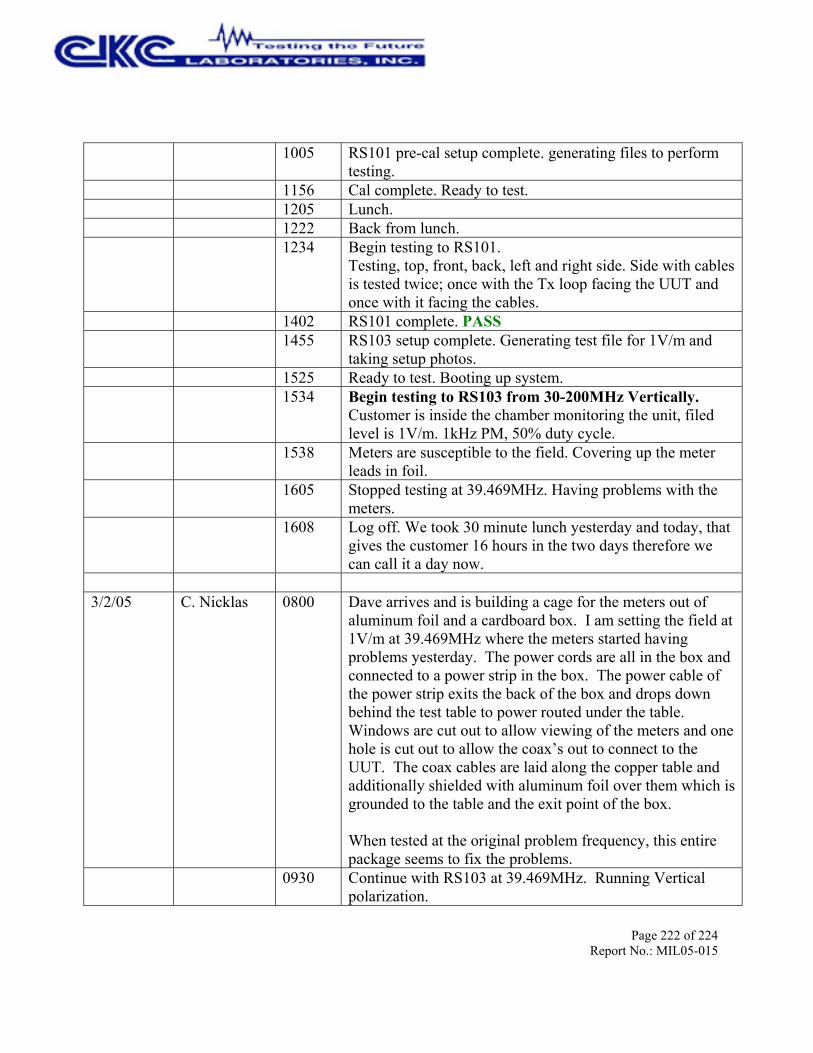
Page 222 of 224Report No.: MIL05-015
1005 RS101 pre-cal setup complete. generating files to performtesting.
1156 Cal complete. Ready to test.1205 Lunch.1222 Back from lunch.1234 Begin testing to RS101.
Testing, top, front, back, left and right side. Side with cablesis tested twice; once with the Tx loop facing the UUT andonce with it facing the cables.
1402 RS101 complete. PASS1455 RS103 setup complete. Generating test file for 1V/m and
taking setup photos.1525 Ready to test. Booting up system.1534 Begin testing to RS103 from 30-200MHz Vertically.
Customer is inside the chamber monitoring the unit, filedlevel is 1V/m. 1kHz PM, 50% duty cycle.
1538 Meters are susceptible to the field. Covering up the meterleads in foil.
1605 Stopped testing at 39.469MHz. Having problems with themeters.
1608 Log off. We took 30 minute lunch yesterday and today, thatgives the customer 16 hours in the two days therefore wecan call it a day now.
3/2/05 C. Nicklas 0800 Dave arrives and is building a cage for the meters out ofaluminum foil and a cardboard box. I am setting the field at1V/m at 39.469MHz where the meters started havingproblems yesterday. The power cords are all in the box andconnected to a power strip in the box. The power cable ofthe power strip exits the back of the box and drops downbehind the test table to power routed under the table.Windows are cut out to allow viewing of the meters and onehole is cut out to allow the coax’s out to connect to theUUT. The coax cables are laid along the copper table andadditionally shielded with aluminum foil over them which isgrounded to the table and the exit point of the box.
When tested at the original problem frequency, this entirepackage seems to fix the problems.
0930 Continue with RS103 at 39.469MHz. Running Verticalpolarization.

Page 223 of 224Report No.: MIL05-015
1010 Complete 30-200MHz Vertical. Pass. Switch to Horizontal1110 Complete 30-200MHz Horizontal. Pass. Setup for 200-
1000MHz frequency range.1120 Start RS103, 200-1000MHz Horizontal.1145 Complete 200-1000MHz Horizontal. Pass. Switch to
Vertical1215 Complete 200-1000MHz Vertical. Pass.1215 Break for lunch.1315 Back from lunch. Start setting up for the 1-18GHz testing.
The 1-18GHz antennas are in Hollister for calibration. Ihave a 1-2ish GHz horn that I will use today to start testing.Will get the antenna from Hollister for the remainder of thetesting tomorrow.
1430 Start 1-4 GHz testing Vertical polarity.1520 Restarted 1-4 GHz Vertical. Removed a piece of copper
tape that had been installed during radiated emissions to fixa leak from 1.55-1.6GHz.
1715 Completed 1-4GHz Vertical using the 900MHz – 2GHzStandard Gain Horn Antenna.Amrinder, I am going to pick up one of the DRG’stomorrow from Hollister to continue the 4-18GHzimmunity. You will need to run the 1-4GHz Horizontalimmunity with the standard gain horn. The file is alreadyset-up. In a few places, the sig gen could not level to get the1V/m level with the setting of 90% in the sig gen column.When that happened I would change the setting to 6|DB andrun 10-15 frequency places and then change it back to 90. Iwill see you around 9-9:30 AM with the 1-18GHz DRG.Thanks.
Christine03/03/2005 A. Brar 800 Arrive, we will continue from where Christine left off
yesterday.830 Begin testing from 1-4GHz in Horizontal polarity.920 Dave is checking his e-mail. Testing stopped.925 Continuing with testing.1027 Complete 1-4GHz in horizontal polarity. Customer is taking
a break, I will create the files to go up to 18GHz.1105 Begin testing from 4-8GHz in horizontal polarity.
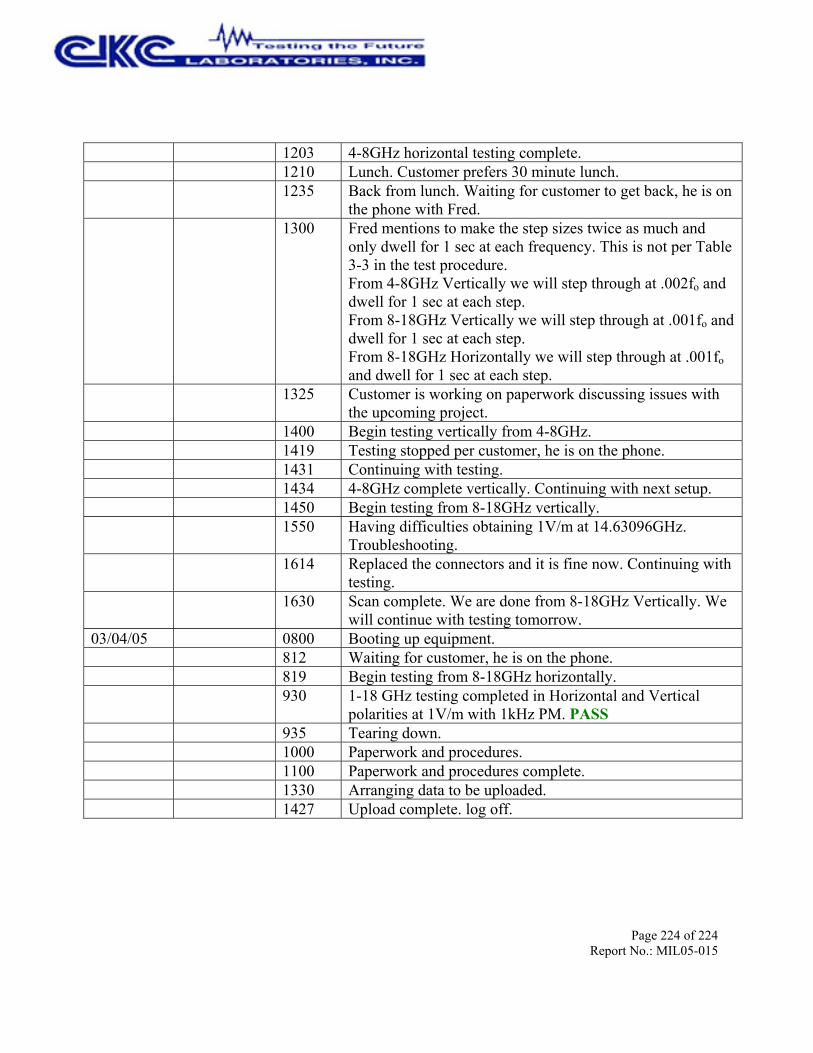
Page 224 of 224Report No.: MIL05-015
1203 4-8GHz horizontal testing complete.1210 Lunch. Customer prefers 30 minute lunch.1235 Back from lunch. Waiting for customer to get back, he is on
the phone with Fred.1300 Fred mentions to make the step sizes twice as much and
only dwell for 1 sec at each frequency. This is not per Table3-3 in the test procedure.From 4-8GHz Vertically we will step through at .002fo anddwell for 1 sec at each step.From 8-18GHz Vertically we will step through at .001fo anddwell for 1 sec at each step.From 8-18GHz Horizontally we will step through at .001foand dwell for 1 sec at each step.
1325 Customer is working on paperwork discussing issues withthe upcoming project.
1400 Begin testing vertically from 4-8GHz.1419 Testing stopped per customer, he is on the phone.1431 Continuing with testing.1434 4-8GHz complete vertically. Continuing with next setup.1450 Begin testing from 8-18GHz vertically.1550 Having difficulties obtaining 1V/m at 14.63096GHz.
Troubleshooting.1614 Replaced the connectors and it is fine now. Continuing with
testing.1630 Scan complete. We are done from 8-18GHz Vertically. We
will continue with testing tomorrow.03/04/05 0800 Booting up equipment.
812 Waiting for customer, he is on the phone.819 Begin testing from 8-18GHz horizontally.930 1-18 GHz testing completed in Horizontal and Vertical
polarities at 1V/m with 1kHz PM. PASS935 Tearing down.1000 Paperwork and procedures.1100 Paperwork and procedures complete.1330 Arranging data to be uploaded.1427 Upload complete. log off.