electron precipitation from emic waves: a case study from ... · 1 electron precipitation from emic...
TRANSCRIPT
Electron precipitation from EMIC waves: a case study from 31 May 1
2013 2
3
Mark A. Clilverd1, Roger Duthie1, Rachael Hardman1, Aaron T. Hendry2, Craig J. 4
Rodger2, Tero Raita3, Mark Engebretson4, Marc R. Lessard5, Donald Danskin6, and 5
David K. Milling7 6
1 British Antarctic Survey (NERC), Cambridge, United Kingdom. 7
2 Department of Physics, University of Otago, Dunedin, New Zealand. 8
3 Sodankylä Geophysical Observatory, University of Oulu, Sodankylä, Finland. 9
4 Department of Physics, Augsburg College, Minneapolis, Minnesota, USA. 10
5 University of New Hampshire, Durham, New Hampshire, USA. 11
6 Geomagnetic Laboratory, Natural Resources Canada, Ottawa, Canada. 12
7 Department of Physics, University of Alberta, Edmonton, Canada. 13
14
Abstract. 15
On 31 May 2013 several rising-tone electromagnetic ion-cyclotron (EMIC) waves 16
with intervals of pulsations of diminishing periods (IPDP) were observed in the 17
magnetic local time afternoon and evening sectors during the onset of a 18
moderate/large geomagnetic storm. The waves were sequentially observed in 19
Finland, Antarctica, and western Canada. Co-incident electron precipitation by a 20
network of ground-based Antarctic Arctic Radiation-belt Dynamic Deposition VLF 21
Atmospheric Research Konsortia (AARDDVARK) and riometer instruments, as well 22
as the Polar-orbiting Operational Environmental Satellite (POES) electron 23
telescopes, was also observed. At the same time POES detected 30-80 keV proton 24
precipitation drifting westwards at locations that were consistent with the ground-25
based observations, indicating substorm injection. Through detailed modelling of the 26
combination of ground and satellite observations the characteristics of the EMIC-27
induced electron precipitation were identified as: latitudinal width of 2-3° or 28
ΔL=1 Re, longitudinal width ~50° or 3 hours MLT, lower cut off energy 280 keV, 29
typical flux 1×10⁴ el. cm-2 sr-1 s-1 >300 keV. The lower cutoff energy of the most 30
clearly defined EMIC rising tone in this study confirms the identification of a class 31
of EMIC-induced precipitation events with unexpectedly low energy cutoffs of 32
<400 keV. 33
34

1. Introduction 35
Electron precipitation driven by electro-magnetic ion-cyclotron (EMIC) waves in 36
the Pc1-2 range (0.1-5 Hz) have been suggested as a significant loss mechanism for 37
outer radiation belt fluxes of electrons in the 1-5 MeV energy range [Millan and 38
Thorne, 2007]. Information about EMIC waves can be obtained from satellites 39
[Meredith et al., 2014], and by ground-based instrumentation [Erlandson et al., 1996]. 40
There are two principal regions where EMIC waves are found, close to the outer 41
edge of the plasmasphere on the dusk-side of the Earth [Fraser and Nguyen, 2001], 42
and also at high latitudes on the day-side [Usanova et al., 2008]. The first group of 43
EMIC waves, occurring near to the plasmapause, are at the right L-shells to interact 44
with outer radiation belt electrons in the 3<L<6 range and provide an electron loss 45
pathway. Wave-particle cyclotron resonance interactions between the EMIC waves 46
and <100 keV energy proton populations are likely to be ubiquitous, while under 47
certain conditions anomalous cyclotron resonance may also drive electron 48
precipitation into the atmosphere. However, although proton precipitation (30-49
80 keV) co-incident with EMIC wave occurrence has been observed [Søraas et al., 50
2005; Sandanger et al., 2007], electron precipitation driven by EMIC waves has been 51
much more difficult to characterise [e.g., Rodger et al., 2008]. 52
Energetic electron precipitation has been associated with a subset of EMIC waves 53
defined as Intervals of Pulsations with Diminishing Periods (IPDP). IPDP are 54
observed in the evening sector during geomagnetically disturbed periods [Yahnina et 55
al., 2003 and references therein]. Yahnina et al. [2003] showed that the IPDP 56
generation mechanism operates when newly injected protons drift westward, meeting 57

a boundary of the dense plasmasphere such as the plasmapause or the plasmaspheric 58
bulge region. The IPDP events were preceded by the injections of energetic protons 59
(~100 keV) and were thus found to be related to substorm activity. The duration of 60
IPDP events is typically shorter than other Pc1 wave types, with the duration being a 61
few tens of minutes. NOAA POES Space Environment Monitor-1 (SEM-1) satellite 62
observations of precipitating electrons from EMIC-IPDP waves showed enhanced 63
fluxes in the >30 keV channel [Yahnina et al., 2003], although we note that in an 64
integral channel this may be caused by energies significantly higher than ~30 keV. 65
However, the presence of the medium energy electrons is at odds with theoretical 66
studies which suggest precipitation energies of ~1 MeV [Thorne and Kennel, 1971; 67
Kersten et al., 2014 and references therein], and do not account for potential proton 68
contamination in the electron channel, which is now known to be significant for the 69
POES Space Environment Monitor-2 (SEM-2) instrument [Yando et al., 2011]. 70
At relativistic electron energies (>1 MeV) bursts of precipitation have been observed by 71
SAMPEX and are commonly referred to as precipitation bands [Blake et al., 1996]. The 72
precipitation bands that occur during active geomagnetic conditions have been associated with 73
EMIC waves [Bortnik et al., 2006 and references therein]. The bands are detected in the 74
afternoon-dusk sector during geomagnetic storms and have a correspondence with the radial 75
location of the plasmapause [Imhof et al., 1986]. Precipitation bands typically span a few 76
degrees in latitude, and increase in magnitude and occurrence during the main phase of storms, 77
particularly at L-shells consistent with the inner edge of the outer radiation belt (Blum, L., X. 78
Li, and M. Denton (2015), Rapid MeV electron precipitation as observed by SAMPEX/HILT 79
during high speed stream driven storms, submitted to J. Geophys. Res., 2014JA020633, 2015). 80

EMIC-driven energetic electron precipitation into the atmosphere has been 81
detected using the technique of subionospheric radio-wave propagation by Rodger et 82
al. [2008]. In that study Rodger et al. [2008] analysed a small group of events 83
detected using subionospheric radio-wave propagation techniques to show that the 84
electron precipitation events driven by EMIC-IPDP waves occurred close to the 85
location of the dusk-side plasmapause (L~4.4) and during moderate geomagnetic 86
activity (Kp~4). The electron precipitation was assumed to have a mono-energetic 87
spectrum of ~2 MeV, partly to explain the subionospheric radiowave signatures, and 88
partly to explain the lack of any riometer signatures. No satellite data was compared 89
with the ground-based data shown. 90
Miyoshi et al. [2008] undertook a case study of electron precipitation using the 91
POES SEM-2 telescopes. During a proton aurora that was observed from the ground 92
in September 2005, POES flew through the region above and detected >800keV 93
electron precipitation. Ground-based magnetometer data indicated the presence of 94
hydrogen band EMIC waves with 0.5-0.9 Hz frequency. With a magnetic latitude 95
that was close to the plasmapause at the time, both proton and electron precipitation 96
were confirmed, but they had different latitudinal width in agreement with theoretical 97
estimates made by Jordanova et al. [2007]. The observations were a clear 98
confirmation that ions with energies of tens of keV can affect the evolution of 99
relativistic electrons in the radiation belts via cyclotron resonance with EMIC waves. 100
Later, Carson et al. [2013] investigated the POES satellites SEM-2 dataset using 101
an algorithm that identified EMIC-driven events when low energy (30-80 keV) 102
proton precipitation was present at the same time as high energy electron 103

precipitation (~1 MeV), and when no high energy proton precipitation was observed 104
(which could cause false positive identifications). Carson et al. [2013] found that 105
electron precipitation was observed on the dusk-side (16-02 MLT), and on or just 106
outside of the plasmapause. The precipitation events were associated with periods of 107
increased geomagnetic activity, and as showed an 11-year solar cycle dependence on 108
the levels of geomagnetic activity, peaking during the declining phase when coronal 109
interaction regions are most prevalent. However, no clear description could be made 110
of the energy spectrum of the precipitation, or the size of the precipitation region 111
(other than it being relatively narrow in L-shell). No ground-based data was 112
compared with the satellite data shown. 113
Further analysis of the POES EMIC database showed two populations of 114
precipitation event, one with a lower energy cutoff of >400 keV, and a second with 115
<400 keV (A. T. Hendry, C. J. Rodger, M. A. Clilverd, T. Raita, Lower Energy cut-116
off limits of EMIC wave driven energetic electron precipitation, submitted to 117
Geophysical Research Letters, 2015). The first type is predicted by anomalous 118
cyclotron resonance [Thorne and Kennel, 1971; Albert and Bortnik, 2009], while the 119
second type is predicted by non-resonant scattering [Chen et al., 2014]. Rising tone 120
hydrogen band EMIC waves can drive non-linear resonances with electrons as low as 121
500 keV [Omura and Zhao, 2013]. However, a simulation using CRRES EMIC wave 122
power showed that only electron energies of >5 MeV would be lost from the 123
radiation belts through precipitation into the atmosphere [Kersten et al., 2014]. Thus 124
there is uncertainty in the published literature as to the mechanisms involved in 125
EMIC-induced electron precipitation, as well as the range of electron energies that 126
would be involved. 127
In this study we analyse in detail an 8 hour period of data during which EMIC 128
waves were observed by three ground-based magnetometer sites, subionospheric 129
radio-wave perturbations were seen at several AARDDVARK locations, and 130
energetic electron precipitation events were detected by an EMIC-scattering 131
algorithm applied to POES SEM-2 observations. The period analysed here is from 132
18:00 UT on 31 May 2013 until 02:00 UT on 01 June 2013. The observations are 133
summarised, inter-comparisons made between instrument responses, and the 134
energetic electron precipitation characteristics inferred. We confirm the previous 135
observations of electron precipitation by EMIC-IPDP waves, provide an estimate of 136
the lower cutoff of the electron energies involved, and determine the precipitation 137
fluxes entering the atmosphere. 138
139
2. Experimental setup 140
To study the energetic electron precipitation fluxes into the atmosphere we use 141
narrow band subionospheric very low frequency (VLF) and low frequency (LF) data 142
spanning 19-38 kHz received sites that are part of the AARDDVARK network 143
[Clilverd et al., 2009; for further information see the description of the array at 144
www.physics.otago.ac.nz/space/AARDDVARK_homepage.htm]. The 145
subionospheric radio-waves come from VLF/LF transmitters that are stable in 146
amplitude and frequency, and thus provide good quality signals for the analysis of 147
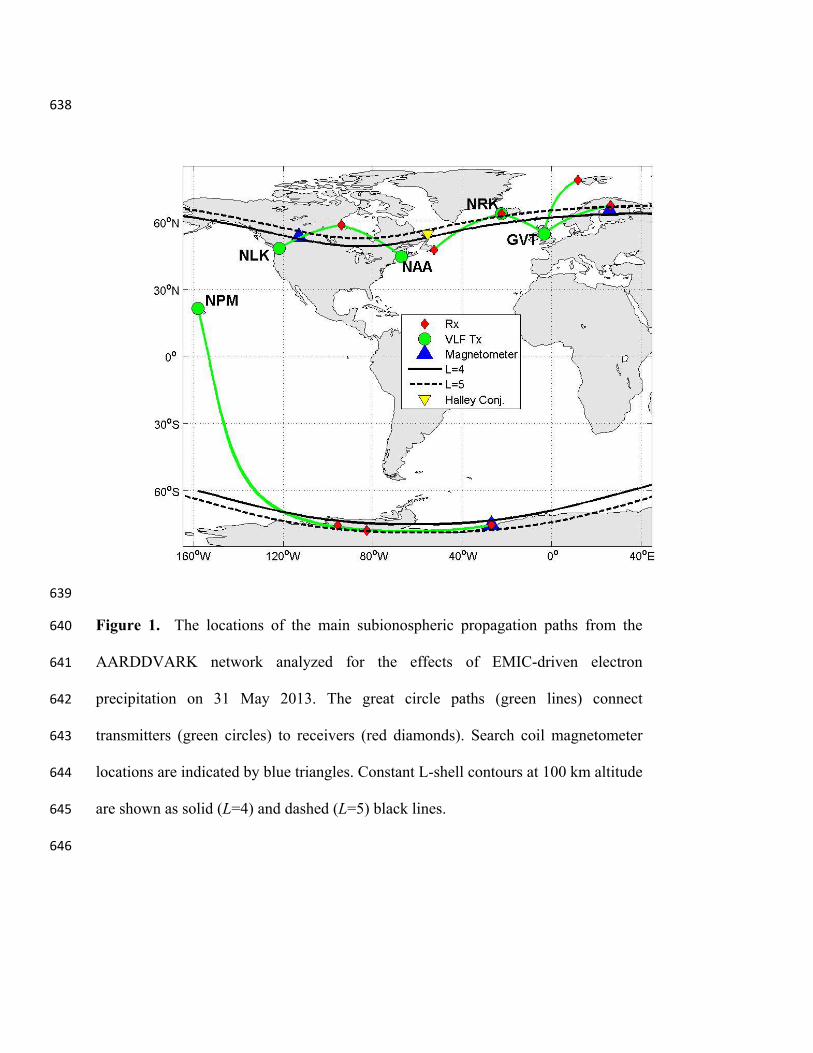
perturbations caused by changes in the Earth-ionosphere waveguide driven by 148
electron precipitation. Figure 1 shows the location of the transmitters (circles) and 149

receivers (diamonds) involved in this study, as well the great circle subionospheric 150
propagation paths between them. The propagation paths typically span the range 151
3<L<6, and are thus sensitive to electron precipitation driven by EMIC waves 152
occurring close to the plasmapause, which is typically located at L~4-5 (indicated by 153
contour lines on the map). 154
The EMIC wave observations are provided by three sites. In the northern 155
hemisphere we make use of the Finnish array of pulsation magnetometers, focusing 156
on the Oulu magnetometer located at L~4.4 [Rodger et al., 2008], and the CARISMA 157
induction coil magnetometers, focusing on Fort Smith, Canada at L=6.8 [Mann et al., 158
2008]. In the southern hemisphere we use pulsation magnetometer data from Halley, 159
Antarctica [Engebretson et al., 2008], which is located at L~4.5. The approximate 160
locations are shown in Figure 1 (blue squares). We concentrate on the frequency 161
range of 0.1-1 Hz, in which Pc1-2, and IPDP waves are known to occur. 162
In this study we also make use of particle measurements by the SEM-2 instrument 163
package onboard the POES spacecraft which are in Sun-synchronous orbits at ~800-164
850 km altitudes [Evans and Greer, 2004]. SEM-2 includes the Medium Energy 165
Proton and Electron Detector (MEPED), in addition to the Total Energy Detector 166
(TED). Together these instruments monitor electron fluxes from 50 eV up to 167
2700 keV. The POES SEM-2 instrument has been comprehensively described in 168
Rodger et al. [2010] and so we will just note here that it provides measurements of 169
the trapped and precipitating particle populations with 2 s time resolution. We use 170
the algorithm described in Carson et al. [2013] to detect EMIC-driven precipitation 171
during the study period, noting that Carson et al. were not able to unambiguously 172

link the events detected in that study with ground-based signatures of EMIC waves, 173
and thus defined their events as proton precipitation associated relativistic electron 174
precipitation events (PPAREP). 175
176
3. Results 177
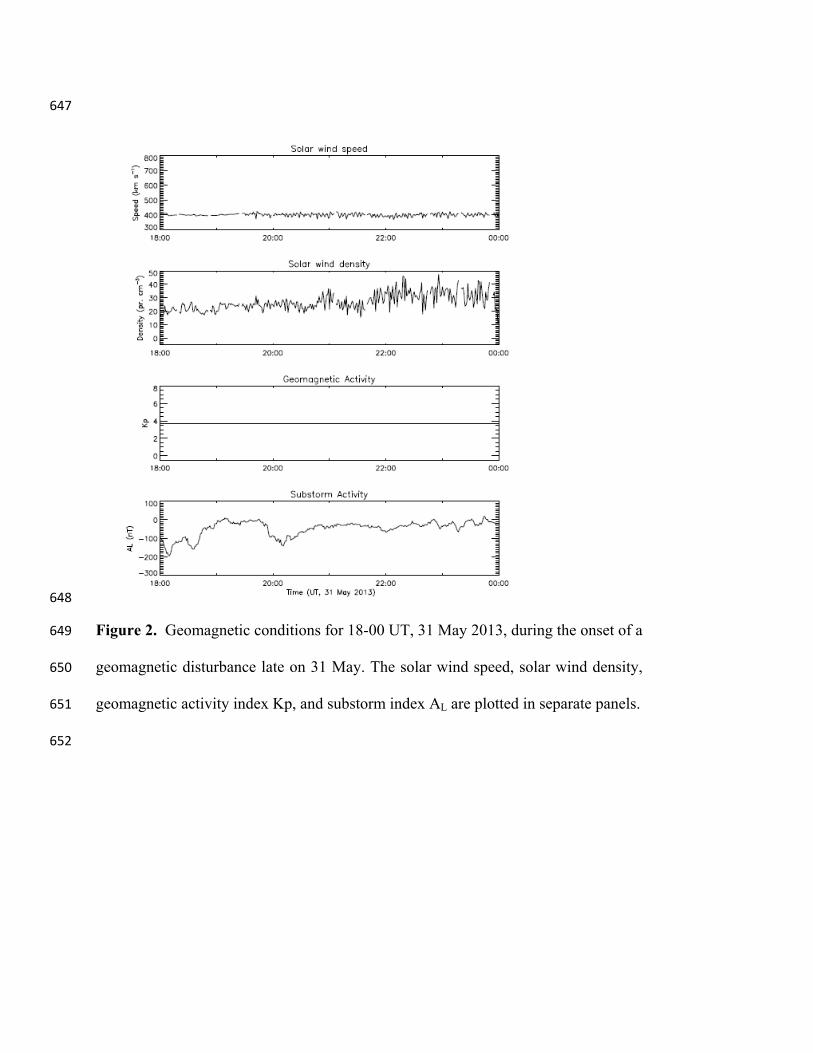
The background geomagnetic conditions for the period studied here are shown in 178
Figure 2. The study period straddles the onset of a moderate/large geomagnetic 179
disturbance, with Kp rising from 2 before 16 UT on 31 May to Kp~7 by 00-03 UT 180
on 01 June 2013. Solar wind speed shows an increase at ~16 UT on 31 May, with a 181
weak shock event seen at 15:32 UT by SOHO. The solar wind density rises gradually 182
from ~16 UT, with high density values occurring towards the end of the day. During 183
the actual study period shown in Figure 2 the solar wind speed, solar wind density, 184
and geomagnetic activity levels remain relatively unchanging. However, the 185
substorm index, AL, [Juusola et al., 2011] shows several features that could be 186
substorm signatures occurring during the beginning of the study period, and we 187
particularly note the one evident at ~20 UT on 31 May as a sharp decrease of 188
~130 nT followed by a gradual recovery lasting about 1 hour. 189
190
3.1 EMIC wave observations 191
Search coil magnetometer (SCM) observations from Oulu (Finland), Halley 192
(Antarctica), and Fort Smith (Canada) from 18 – 24 UT on 31 May are shown in 193
Figure 3. Wave power is shown over the frequency range 0-1 Hz. The main features 194
that can be observed at all three sites are EMIC-IPDP waves, with elements rising 195

from 0.1 to ~0.5 Hz. The IPDP features are initially seen at Oulu at ~2030 UT (~22 196
MLT), with Halley responding after 2100 UT (~1815 MLT), and Fort Smith further 197
west responding after ~2130 UT (~1330 MLT). The IPDP features are significantly 198
more distinct in the Halley data. We show Fort Smith data here (L~6.8) although we 199
note that the L~4.5 site at Ministik Lake shows the same features at the same time as 200
Fort Smith, but is less clearly identified because of local noise conditions. The 201
frequency range over which the EMIC-IPDP waves are observed is appropriate for 202
cyclotron resonance with O+ band ions [Engebretson et al., 2008]. This is consistent 203
with previous observations of an increased generation of oxygen band EMIC waves 204
during geomagnetic storms [Bräysy et al., 1998]. 205
The timing of the EMIC waves is potentially associated with the motion of low 206
energy ions drifting westwards from an injection region near MLT midnight, 207
crossing ~8.5 hours of MLT in about 1.5 hours, suggesting a drift period at L~4.5 of 208
~4.5 hours, and a proton energy of ~30-60 keV assuming a pitch angle of 45°. This 209
proton energy is the energy expected to be involved in the generation of EMIC 210
waves, with a drift motion expected for substorm injected protons from a nightside 211
injection region [Spasojevic and Fuselier, 2009]. The occurrence of the substorm 212
observed at ~20 UT in the AL index in Figure 2 is consistent with the observations 213
presented here. As electrons injected during a substorm drift eastwards from the 214
midnight injection region there is no expectation of any substorm-driven electron 215
precipitation on the duskside, i.e., where we observe the EMIC waves, unless the 216
EMIC waves are generating the electron precipitation themselves. 217
218
3.2 PPAREP observations 219
Figure 4 shows a map of the POES SEM-2 precipitating >300 keV electron fluxes 220
for orbits which occurred during 21:15-22:00 UT on 31 May 2013. Enhanced fluxes 221
can be seen in between the L=4 and L=5 contours shown on the map. The fluxes of 222
>300 keV electrons within the contours are typically 1×10⁴ el. cm-2 sr-1 s-1. Using the 223
algorithm developed by Carson et al. [2013] the POES SEM-2 dataset was analyzed 224
over the same period. Several positive identifications of PPAREP events were made, 225
and the insert of Figure 4 shows the L-shells and MLT values over-plotted on a 226
cartoon of the wave-particle interaction regions adapted from Summers et al. [2007]. 227
The events appear to be located in a range of MLT and occur on L-shells that are 228
parallel to the plasmapause, consistent with the larger sample of events shown in 229
Carson et al. [2013]. The events were observed at geographic longitudes that are 230
similar to those ground-based sites shown in Figure 1, i.e., longitudes around the 231
Weddell Sea region ranging from ~0° E to ~315° E in the southern hemisphere. The 232
four events are clustered within ±15 minutes of 21:32 UT, but span an MLT range 233
from 18-21 MLT, suggesting that a region covering ~3 hours in MLT is 234
simultaneously experiencing electron precipitation. 235
Recent studies have extended the analysis of POES SEM-2 electron precipitation 236
events identified by the Carson et al. [2013] algorithm (A. T. Hendry, C. J. Rodger, 237
M. A. Clilverd, T. Raita, Lower Energy cut-off limits of EMIC wave driven 238
energetic electron precipitation, submitted to Geophysical Research Letters, 2015). 239
Using the calibrated, decontaminated, and integral POES electron precipitation flux 240
measurements at >30, >100, >300 and >700 keV [Yando et al., 2011] an energy 241

spectrum and flux magnitude can be calculated for each event. Because of the 242
integral flux measurements it is possible for all four of the SEM-2 channels to 243
register enhanced fluxes, even if the energy distribution is limited to energies 244
considerably higher than the nominal energy range for that channel. This could 245
explain the observations of >30 keV EMIC-driven fluxes reported by Yahnina et al. 246
[2003], although proton contamination is a possibility in that case [Yando et al., 247
2011]. Of the four PPAREP events identified and plotted in Figure 1, three provided 248
real solutions to the flux and spectral gradient calculations (A. T. Hendry, C. J. 249
Rodger, M. A. Clilverd, T. Raita, Lower Energy cut-off limits of EMIC wave driven 250
energetic electron precipitation, submitted to Geophysical Research Letters, 2015). 251
The electron energy spectral gradient (k) of the EMIC-IPDP event at 21:30 UT was 252
k=-2.3, with the lowest energy present given as 280 keV, and the highest as >5 MeV. 253
In section 4.2 we will combine the PPAREP results for the 21:30 UT period with 254
ground-based observations in order to provide further details about the EMIC-driven 255
electron precipitation characteristics. 256
257
3.3 AARDDVARK observations 258
The AARDDVARK network has a large number of receivers, which typically 259
record narrow-band signals from 10 or so transmitters [Clilverd et al., 2009]. In this 260
study we focus on individual paths that cover the L-shell ranges that pass under the 261
magnetic field-line footprints of the plasmapause region (L~3-5). Figure 5 shows the 262
phase and amplitude of the GVT transmitter (UK) received at Sodankylä, Finland 263
during the study period. The non-disturbed amplitude and phase variation is 264

represented by the dashed lines. Phase and amplitude variations are near non-265
disturbed levels until ~21 UT, when a large negative amplitude perturbation and a 266
rapidly changing negative/positive phase perturbation, are observed, labeled (a). The 267
characteristics of the amplitude perturbation are very similar to those previously 268
reported by Rodger et al. [2008], i.e., an amplitude change of -12 dB associated with 269
EMIC-drive electron precipitation on a UK-Finland path. We report, for the first 270
time, the phase change of ~±25° observed with the EMIC event (indicated by red 271
lines). Both the amplitude and the phase perturbations develop very quickly, reaching 272
a maximum within 15 minutes of the first signs of deviation away from the non-273
disturbed levels. The geographic longitude range of the section of the GVT-SGO 274
path that intersects the L=4 and L=5 contours (see Figure 1) is stated in Figure 5, 275
indicating the longitude sector where the path is most likely to be responding to 276
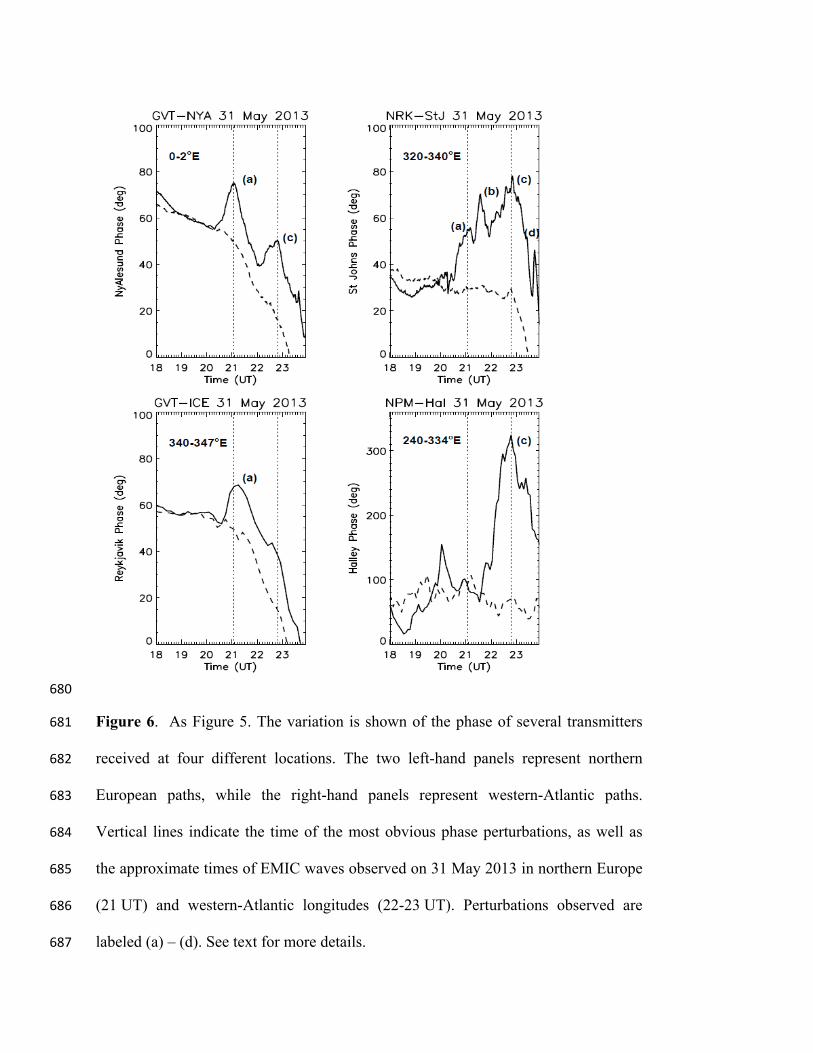
EMIC–driven electron precipitation [Carson et al., 2013]. 277
The phase data from four additional paths are presented in Figure 6. The format of 278
the panels is the same as for Figure 5. The panels represent paths that are shown in 279
Figure 1, and perturbations are labeled (a) – (d) in time ascending order. The 280
longitude range of the section of the path intersecting L=4-5 is shown, with the top-281
left panel (GVT, UK to Ny Ålesund, Svalbard) being the most easterly path, and the 282
bottom-right panel (NPM, Hawaii to Halley, Antarctica) the most westerly. 283
However, because the NPM-Halley propagation path lies within the L=4 and L=5 284
contours for ~100° of longitude to the west of Halley, the integrated phase effect 285
along that bit of the path makes perturbation (c) by far the largest event of the four. 286
Perturbation (a), co-incident with the EMIC wave seen at Oulu at 21:00 UT, is 287
observed in all panels other than NPM-Halley, suggesting that electron precipitation 288
is occurring over a longitude range of 55±10°, i.e., from Europe (14-25°E) to the 289
Atlantic south of Greenland (320-340°E), but not further west. The phase 290
perturbation is typically 25° in each of the paths. Perturbations (b), (c), and (d) are 291
only observed on some of the paths. The NRK, Iceland to St. John's, Newfoundland 292
path is unusual in that it shows all of the perturbations, including perturbation (b) at 293
21:30 UT, which is the time of the first strong IPDP EMIC wave seen at Halley, and 294
also the time of the POES-identified PPRAREP signatures. We note here that the 295
conjugate point of Halley is close to the NRK, Iceland to St. John's, Newfoundland 296
path as shown in Figure 1 by the yellow triangle. 297
Analysis of the NLK-Churchill subionospheric path (see Figure 1) indicates a clear 298
phase perturbation at 22:00 UT (not shown). This timing is consistent with the start 299
of the IPDP activity seen at Ministik Lake/Fort Smith in western Canada. As shown 300
in Figure 1, the NLK-Churchill propagation path passes close to the Ministik site, 301
and together they confirm the suggestion of an IPDP-induced precipitation region 302
moving westwards. 303
The time variation of the Halley SCM Pc1-2 wave power in the range 0.05-0.5 Hz, 304
the Halley riometer absorption, and the NRK-St. John's phase perturbation for the 305
study period are shown in Figure 7. We use NRK-St. John's due to the similarity of 306
the longitude range at L=4-5 compared with that of Halley. Vertical lines indicate the 307
same times as in previous figures along with the same labeling given to features in 308
the panels. Both the SCM and riometer measurements are made essentially overhead 309
of the detectors at Halley (with fields of view that are 100s of km, centered on the 310
instrument), while the NRK-St. John's path responds to propagation conditions in the 311
region conjugate to Halley as shown in Figure 1. Thus it would appear from Figure 7 312
that perturbation (a) is not observable from Halley on any instrument, while 313
perturbation (b) is seen by the SCM and riometer and therefore must be close to 314
Halley or just to the east. Perturbation (c) at 22:45 UT is observed west and east of 315
Halley in the AARDDVARK data, overhead at Halley in the riometer data, but does 316
not have a clear association with any specific EMIC wave feature at Oulu or Halley. 317
Perturbation (d) is clearly observed in the riometer data overhead of Halley, also in 318
the conjugate AARDDVARK data, and appears to be associated with an increase in 319
Pc1-2 wave power observed at Oulu and Halley. However the broadband nature of 320
the Pc1-2 wave power (as shown in Figure 3) is not consistent with EMIC wave 321
activity but more suggestive of a geomagnetic disturbance. However, although only 322
some specific features coincide in the data plotted in Figure 7, there is overall 323
similarity in all of the panels where the Halley SCM, riometer absorption, and 324
AARDDVARK phase perturbation data show increased activity levels from 325
~21:30 UT lasting until ~00:30 UT the next day. 326
327
4. Calculating EMIC-driven electron precipitation characteristics 328
Using the Long Wave Propagation Code [LWPC, Ferguson and Snyder, 1990] we 329
have calculated the VLF wave propagation from the transmitters of interest to their 330
respective receivers. In LWPC the transmitted wave propagates in the Earth-331
ionosphere waveguide, with the lower boundary given by a surface conductivity 332
map. The upper boundary condition is provided by a D-region electron density 333
altitude-profile. We use a Wait ionosphere where the electron number density (i.e., 334
electrons per m3), Ne, increases exponentially with altitude z, and is defined in terms 335
of a sharpness parameter β and a reference height h' [Wait and Spies, 1964]. The β 336
and h’ of the ambient ionosphere is provided by the analysis of Thomson et al. 337
[2007], Thomson and McRae [2009], and Thomson et al. [2011] and depends on the 338
time of day being modeled. 339
Initially, complete days of observations were compared with the LWPC output, in 340
order to give confidence that the D-region modeling parameters (β and h’) were 341
appropriate for each path. Then β and h’ were systematically varied over the part of 342
the path that spanned L=4 – 5 during the time of the EMIC event, i.e., ΔL=1, in order 343
to compare the calculated phase and amplitude changes with the observed 344
perturbation values on 31 May 2013. The latitudinal separation between L=4 and 345
L=5 contours is about 3°, which is consistent with the width of EMIC precipitation 346
bands observed by SAMPEX (Blum, L., X. Li, and M. Denton (2015), Rapid MeV 347
electron precipitation as observed by SAMPEX/HILT during high speed stream 348
driven storms, submitted to J. Geophys. Res., 2014JA020633, 2015). The β and h’ of 349
the rest of the path were kept the same as the non-disturbed case. 350
351
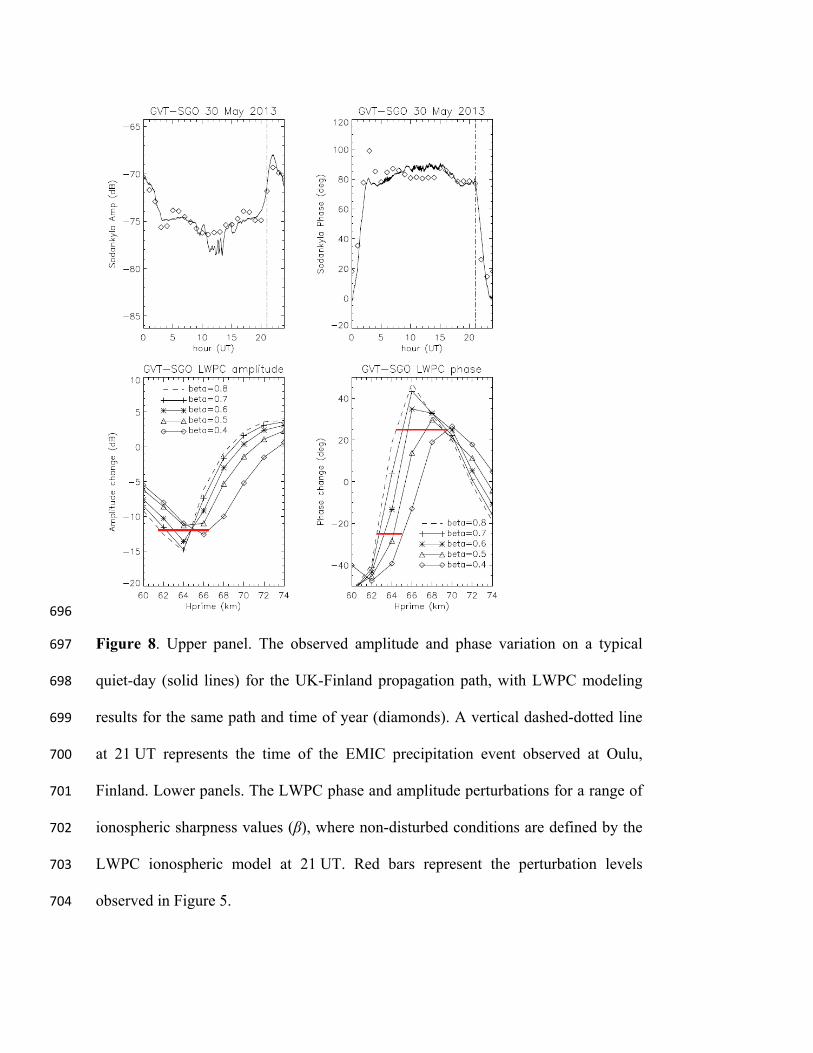
4.1 Analysis of event (a) 352
Figure 8 shows the comparison between LWPC calculations and the GVT-353
Sodankylä observations on 30 May 2013, which we use as a representative non-354
disturbed day. In both of the phase and amplitude panels the observed values are 355
indicated by the solid line, while the LWPC results are represented by the diamonds. 356

A vertical dashed line indicates 21:00 UT, which is the time of the EMIC-driven 357
perturbation shown in Figure 5. The panels show that the LWPC modeling is 358
capturing the non-disturbed diurnal variation in phase and amplitude, and that at 359
21:00 UT the LWPC background β and h’ values should be representative of the 360
undisturbed ionosphere. The phase value at 21:00 UT also suggests that the 361
propagation path can be considered to be day lit, as the decrease towards typical 362
nighttime values has not started at that time. The lower two panels show the variation 363
of the phase and amplitude perturbations from the non-disturbed values as β and h’ 364
are varied within a range that is expected to occur as a result of electron 365
precipitation. The initial non-disturbed values of β and h’ were β=0.32 km-1 and 366
h’=76 km. At 21:00 UT the GVT amplitude shown in Figure 5 is perturbed by -367
12 dB, at the same time the phase rapidly changes from a perturbation of -25° to 368
+25° (indicated by red lines). The two lower panels of Figure 8 indicate that these 369
conditions are met when h’=~64 km, although it is unclear which β value is most 370
appropriate. Similar analysis (not shown) of the other three northern hemisphere 371
paths that respond to the electron precipitation associated with this event also suggest 372
h’=64 ± 1 km at the peak of the event, but also provide little β information. This 373
analysis therefore indicates that EMIC-driven precipitation has lowered the reference 374
altitude from ~76 km to ~64 km, but it is unclear what exact electron density profile 375
exists around that altitude. At 64 km the most likely energy of electron precipitation 376
that would produce excess ionization is ~300 keV [Turunen et al., 2008]. 377
378
4.2 Analysis of event (b) 379
The second EMIC-IPDP event occurs at 21:30 UT and is observed by the 380
magnetometer and riometer instruments at Halley, and the AARDDVARK path that 381
passes close to the Halley conjugate location in the northern hemisphere (NRK-St. 382
John's). The Halley AARDDVARK data from NPM Hawaii shows only an onset of 383
disturbance in phase and amplitude at 21:30 UT rather than a peak in effect, although 384
this is consistent with electron precipitation initially only influencing a small part of 385
the 13,387 km long propagation path, i.e., electron precipitation only occurring 386
overhead of Halley at that time and not to the west. Using LWPC as before, we find 387
that the NRK-St. John's phase perturbation of ~40° (as shown in Figure 6) is 388
reproduced by an h’=64 km, consistent with electron precipitation energies of 389
~300 keV. 390
We can combine the information gained from the AARDDVARK observations, 391
Halley riometer, and the POES SEM-2 precipitation channels to investigate this 392
event more closely. Using the energy spectrum information given by POES as 393
described in section 3.2 we can model the electron density profile that would be 394
generated overhead of the Halley riometer. We do this using the ionosphere model 395
described in Rodger et al. [2012]. Figure 9 (left hand panel) shows the results from 396
the calculations, where the flux of electron precipitation with an energy spectrum of 397
k=-2.3 and an energy range of 280 keV to 5 MeV was varied over a wide range of 398
flux values and the resulting 30 MHz riometer absorption calculated following the 399
method described in Rodger et al. [2012]. The observed absorption value of 0.4 dB 400
is highlighted by a green circle and is generated by an electron flux of 1 x 10⁴ el. cm-401
2 s-1 sr-1. This flux level is consistent with the observed fluxes reported by POES 402
during the event. The right hand panel shows electron density profiles for the 403
ambient D-region profile (black line) and the profile that would be generated by the 404
precipitation required to give 0.4 dB riometer absorption in the left hand panel 405
(ΔCNA, red line). The background D-region profile is given by a combination of 406
nighttime β and h’ values [Thomson et al., 2007] and the IRI model, again following 407
the techniques described in Rodger et al. [2012]. Blue lines show two electron 408
density profiles based on Wait ionospheres defined by β and h’ values as labeled. 409
Over the altitude range that the reflection of oblique VLF waves would be occurring 410
(50-70 km) there is good agreement between the ΔCNA profile and h’ = 63-64 km, β 411
= 0.3 km-1. The h’ of the ΔCNA profile confirms the h’ found by analysis of the 412
AARDDVARK phase and amplitude perturbations (h’=64 ± 1). In addition, the 413
analysis suggests that β = 0.3 km-1 is the most likely value for the sharpness 414
parameter – something that the analysis of the AARDDVARK data was unable to 415
determine accurately in this study. 416
Thus we have shown that an EMIC-IPDP wave in the oxygen band is capable of 417
precipitating electrons with energies as low as ~300 keV. A distinct population of 418
events with this sort of unusually low lower-energy cutoff has recently been found, 419
where the population occurred ~20% of the time in an extensive database of EMIC 420
events (A. T. Hendry, C. J. Rodger, M. A. Clilverd, T. Raita, Lower Energy cut-off 421
limits of EMIC wave driven energetic electron precipitation, submitted to 422
Geophysical Research Letters, 2015). Saikin et al. [2014] undertook a statistical 423
study of EMIC waves observed by the Van Allen Probes mission, and found that 424
oxygen band waves occurred in ~11-13% of EMIC events. Although the MLT 425
distribution of oxygen band EMIC waves observed by Saikin et al. [2014] shows no 426
preference towards the evening sector position seen here, it may be that the low 427
cutoff energy population (<400 keV) is preferentially caused by Oxygen band EMIC 428
waves. 429
430
4.3 Analysis of events (c) and (d) 431
The largest phase perturbation occurs during events (c) and (d) on two of the 432
AARDDVARK paths, peaking at 22:45 UT on the NRK-St. John's path close to the 433
Halley conjugate location, and on the NPM-Halley path looking west of Halley. The 434
Halley riometer also shows a distinct peak in absorption at about 22:45-23:00 UT, 435
with the largest absorption value observed during the study period (0.5 dB). Phase 436
perturbations of ~25° on the GVT-Ny Ålesund path, ~50° on the NRK-St. John's 437
path, and 280° on the NPM-Halley path, are modeled by LWPC with h’=64 -65 km, 438
and in the case of NPM-Halley β=0.6 km-1. The reason why the NPM-Halley path 439
has such a large phase perturbation compared with the other paths is due to the large 440
part of the propagation path that lies within the L=4-5 contours (see Figure 1), 441
consistent with the LWPC modeling assuming that the whole of that part of the path 442
is affected by electron precipitation. However, the interpretation of event (c) is more 443
difficult than for (a) and (b). Observations suggest that overhead, as well as east and 444
west, of Halley longitudes (and Halley conjugate longitudes), electron precipitation 445
fluxes were increasing following a recovery from event (b) at 21:30 UT. At 446
22:45 UT almost all observations made in the longitude range studied here (>120°) 447
shows a peak of response. However, no clear EMIC wave can be identified, and 448
Figures 3 and 7 suggest that EMIC wave power, although elevated, is actually 449
decreasing at the time. Thus if EMIC-driven precipitation does occur around 450
22:45 UT it is likely to be contributing to only a fraction of the perturbation levels 451
observed, and another process is acting as well. 452
Event (d) is also observed by the riometer at Halley with an absorption level of 453
0.5 dB, and on the NRK-St. John's AARDDVARK path, as a short-lived, sharp-454
peaked phase perturbation. However, both search coil magnetometers at Halley and 455
Oulu suggest that the event is only accompanied by broadband Pi1-Pi2 wave power, 456
and thus is not an EMIC wave event. The electron precipitation seems localized to 457
Halley and Halley conjugate longitudes, but the driving mechanism is unclear, 458
although the occurrence of strong Pi1-Pi2 ULF noise and co-incident riometer 459
absorption is consistent with the onset of a geomagnetic storm [Engebretson et al., 460
2008]. 461
462
5. Discussion and Summary 463
During the onset of a moderate geomagnetic storm several rising-tone EMIC-IPDP 464
waves were observed in the evening sector with co-incident detection of electron 465
precipitation by ground-based AARDDVARK and riometer instruments. At the same 466
time the POES SEM-2 particle precipitation telescopes detected 30-80 keV proton 467
and 280-5000 keV electron precipitation at locations that were consistent with the 468
ground-based observations. The latitude of the electron precipitation is consistent 469
with the location of the evening sector plasmapause (L~4). The detection of electron 470
precipitation occurred in an east to west order in both hemispheres, consistent with 471

the drift of 30-80 keV substorm protons injected close to magnetic midnight and 472
drifting westwards. 473
Through a combination of ground and satellite observations the characteristics of 474
the electron precipitation were identified as: 475
- Latitudinal width of 2-3° or ΔL=1 Re 476
- Longitudinal width of ~50° or 3 hours MLT 477
- Lower cut off energy of 280 keV 478
- Upper cut off energy of >5 MeV 479
- Typical flux 1×10⁴ el. cm-2 sr-1 s-1 >300 keV 480
We find that the lower cutoff energy of the most clearly defined EMIC rising tone in 481
this study is in the class of events with cutoff <400 keV as described by recent work 482
(A. T. Hendry, C. J. Rodger, M. A. Clilverd, T. Raita, Lower Energy cut-off limits of 483
EMIC wave driven energetic electron precipitation, submitted to Geophysical 484
Research Letters, 2015). The presence of electron precipitation with energies of 485
~300 keV is confirmed through detailed modelling of observed riometer and 486
AARDDVARK radiowave perturbations. The Oxygen band rising tone EMIC-IPDP 487
waves observed here appear to generate electron precipitation at lower energies than 488
predicted through anomalous resonance, and instead, suggest non-resonant scattering 489
processes could be occurring. 490
491
Acknowledgements. The authors would like to thank Bergur Helgi and Jon Bjorn 492
Richardsson for their assistance and enthusiasm during the data collection in Iceland. 493
Data for this paper are available at the British Antarctic Survey Polar Data Centre 494
(http://psddb.nerc-bas.ac.uk/data/access/). MAC would like to acknowledge support 495
from the Natural Environmental Research Council grant NE/J008125/1. AH, RD and 496
RH received funding from the European Community’s Seventh Framework 497
Programme ([FP7/2007-2013]) under grant agreement number 263218. CARISMA is 498
operated by the University of Alberta and funded by the Canadian Space Agency. 499
Support for the Halley search coil magnetometer was provided by U.S. National 500
Science Foundation grants PLR-1341493 to Augsburg College and PLR-1341677 to 501
the University of New Hampshire. 502
503

504 References 505
Albert, J., and J. Bortnik (2009), Nonlinear interaction of radiation belt electrons with 506
electromagnetic ion cyclotron waves, Geophys. Res. Lett., 36 (12). 507
Blake, J. B., M. D. Looper, D. N. Baker, R. Nakamura, B. Klecker, and D. Hovestadt (1996), 508
New high temporal and spatial resolution measurements by SAMPEX of the precipitation of 509
relativistic electrons. Adv. Space Res., 18(8), 171-186. 510
Bortnik, J., R. M. Thorne, T. P. O'Brien, J. C. Green, R. J. Strangeway, Y. Y. Shprits, and D. N. 511
Baker (2006), Observation of two distinct, rapid loss mechanisms during the 20 November 512
2003 radiation belt dropout event, J. Geophys. Res., 111, A12216, 513
doi:10.1029/2006JA011802. 514
Braysy, T., K. Mursula, and G. Marklund (1998), Ion cyclotron waves during a great magnetic 515
storm observed by Freja double-probe electric field instrument, J. Geophys. Res., 103(A3), 516
4145–4155, doi:10.1029/97JA02820. 517
Carson, B. R., C. J. Rodger, and M. A. Clilverd (2013), POES satellite observations of EMIC-518
wave driven relativistic electron precipitation during 1998–2010, J. Geophys. Res., 118, 232–519
243, doi:10.1029/2012JA017998. 520
Chen, L., R. M. Thorne, and J. Bortnik (2014), Non-resonant interactions of electromagnetic ion 521
cyclotron waves with relativistic electrons, J. Geophys. Res., In Press. 522
Clilverd, M. A., C. J. Rodger, N. R. Thomson, J. B. Brundell, Th. Ulich, J. Lichtenberger, N. 523
Cobbett, A. B. Collier, F. W. Menk, A. Seppälä, P. T. Verronen, and E. Turunen (2009), 524
Remote sensing space weather events: the AARDDVARK network, Space Weather, 7, 525
S04001, doi:10.1029/2008SW000412. 526

Engebretson, M. J., et al. (2008), Pc1–Pc2 waves and energetic particle precipitation during and 527
after magnetic storms: Superposed epoch analysis and case studies, J. Geophys. Res., 113, 528
A01211, doi:10.1029/2007JA012362. 529
Erlandson, R. E., K. Mursula, and T. Bosinger (1996), Simultaneous ground-satellite 530
observations of structured Pc-1 pulsations, J. Geophys. Res., 101, 27149-27156. 531
Evans, D. S., and M. S. Greer (2004), Polar Orbiting environmental satellite space environment 532
monitor - 2 instrument descriptions and archive data documentation, NOAA technical 533
Memorandum version 1.4, Space Environment Laboratory, Colorado. 534
Ferguson, J. A., and F. P. Snyder (1990), Computer programs for assessment of long wavelength 535
radio communications, Tech. Doc. 1773, Natl. Ocean Syst. Cent., San Diego, California. 536
Fraser, B. J. and Nguyen, T. S. (2001), Is the plasmapause a preferred source region of 537
electromagnetic ion cyclotron waves in the magnetosphere?, J. Atmos. Solar-Terr. Phys., 63, 538
1225–1247. 539
Imhof, W.L., H.D. Voss, J.B. Reagan, D.W. Datlowe, E.E. Gaines, J. Mobilia (1986), 540
Relativistic electron and energetic ion precipitation spikes near the plasmapause, J. Geophys. 541
Res., 91, 3077–3088. 542
Jordanova, V. K., M. Spasojevic, and M. F. Thomsen (2007), Modeling the electromagnetic ion 543
cyclotron wave-induced formation of detached subauroral proton arcs, J. Geophys. Res., 112, 544
A08209, doi:10.1029/2006JA012215. 545
Juusola, L., N. Østgaard, E. Tanskanen, N. Partamies, and K. Snekvik (2011), Earthward plasma 546
sheet flows during substorm phases, J. Geophys. Res., 116, A10228, 547
doi:10.1029/2011JA016852. 548
Kersten, T., R. B. Horne, S. Glauert, N. P. Meredith, B. J. Fraser, and R. S. Grew (2014), 549
Electron losses from the radiation belts caused by EMIC waves, J. Geophys. Res., In Press. 550
Mann, I.R., et al., (2008), The upgraded CARISMA magnetometer array in the THEMIS era, 551
Space Sci. Rev., 141, 413-451, doi: 10.1007/s11214-008-9457-6. 552
Meredith, N. P., R. B. Horne, T. Kersten, B. J. Fraser, and R. S. Grew (2014), Global 553
morphology and spectral properties of EMIC waves derived from CRRES observations, J. 554
Geophys. Res. Space Physics, 119, 5328–5342, doi:10.1002/2014JA020064. 555
Millan, R. M., and R. M. Thorne (2007), Review of radiation belt relativistic electron loss, J. 556
Atmos. Sol. Terr. Phys., 69, 362–377, doi:10.1016/j.jastp.2006.06.019. 557
Miyoshi, Y., K. Sakaguchi, K. Shiokawa, D. Evans, J. Albert, M. Connors, and V. Jordanova 558
(2008), Precipitation of radiation belt electrons by EMIC waves, observed from ground and 559
space, Geophys. Res. Lett., 35, L23101, doi:10.1029/2008GL035727. 560
Omura, Y., and Q. Zhao (2013), Relativistic electron microbursts due to nonlinear pitch angle 561
scattering by emic triggered emissions, Journal of Geophysical Research, 118 (8), 5008-5020. 562
Rodger, C. J., T. Raita, M. A. Clilverd, A. Seppälä, S. Dietrich, N. R. Thomson, and T. Ulich 563
(2008), Observations of relativistic electron precipitation from the radiation belts driven by 564
EMIC waves, Geophys. Res. Lett., 35 (16), doi:10.1029/2008GL034804. 565
Rodger, C. J., M. A. Clilverd, J. Green, and M.-M. Lam (2010), Use of POES SEM-2 566
observations to examine radiation belt dynamics and energetic electron precipitation in to the 567
atmosphere, J. Geophys. Res., 115, A04202, doi:10.1029/2008JA014023. 568
Rodger, C. J., M. A. Clilverd, A. J. Kavanagh, C. E. J. Watt, P. T. Verronen, and T. Raita (2012), 569
Contrasting the responses of three different ground-based instruments to energetic electron 570
precipitation, Radio Sci., 47(2), RS2021, doi:10.1029/2011RS00497. 571

Saikin, A. A., J. -C. Zhang, R.C. Allen, C. W. Smith, L. M. Kistler, H. E. Spence, R. B. Torbert, 572
C. A. Kletzing, and V. K. Jordanova (2014), A statistical study of hydrogen-, helium-, and 573
oxygen-band EMIC waves observed by Van Allen Probe A, GEM Summer Workshop, 574
Portsmouth, VA, 15-20, 53. 575
Sandanger, M., F. Søraas, K. Aarsnes, K. Oksavik, and D. S. Evans (2007), Loss of relativistic 576
electrons: Evidence for pitch angle scattering by electromagnetic ion cyclotron waves excited 577
by unstable ring current protons, J. Geophys. Res., 112 (A12), doi:10.1029/2006JA012138. 578
Søraas, F., K. Aarsnes, D. Carlsen, K. Oksavik, and D. Evans (2005), Ring Current Behavior as 579
Revealed by Energetic Proton Precipitation, Washington DC American Geophysical Union 580
Geophysical Monograph Series, 155, 237. 581
Spasojevic, M., and S. A. Fuselier (2009), Temporal evolution of proton precipitation associated 582
with the plasmaspheric plume, J. Geophys. Res., 114, A12201, doi:10.1029/2009JA014530. 583
Summers, D., B. Ni, and N. P. Meredith (2007), Timescales for radiation belt electron 584
acceleration and loss due to resonant wave-particle interactions: 2. Evaluation for VLF chorus, 585
ELF hiss, and electromagnetic ion cyclotron waves, J. Geophys. Res., 112, A04207, 586
doi:10.1029/2006JA011993. 587
Thomson, N. R., M. A. Clilverd, and W. M. McRae (2007), Nighttime ionospheric D region 588
parameters from VLF phase and amplitude, J. Geophys. Res., 112, A07304, 589
doi:10.1029/2007JA012271. 590
Thomson, N. R., and W. M. McRae (2009), Nighttime ionospheric D region: Equatorial and 591
nonequatorial, J. Geophys. Res., 114, A08305, doi:10.1029/2008JA014001. 592

Thomson, N. R., M. A. Clilverd, and C. J. Rodger (2011), Daytime midlatitude D region 593
parameters at solar minimum from short-path VLF phase and amplitude, J. Geophys. Res., 594
116, A03310, doi:10.1029/2010JA016248. 595
Thorne, R. M., and C. F. Kennel (1971), Relativistic electron precipitation during magnetic storm 596
main phase, J. Geophys. Res. Space Physics, 76, 4446-4453. 597
Turunen, E., P. T. Verronen , A. Seppälä, C. J. Rodger, M. A. Clilverd, J. Tamminen, C.-F. Enell, and 598
Th. Ulich (2008), Impact of different precipitation energies on NOx generation during geomagnetic 599
storms, J. Atmos. Sol.-Terr. Phys., 71 (10), 1176-1189. 600
Usanova, M. E., I. R. Mann, I. J. Rae, Z. C. Kale, V. Angelopoulos, J. W. Bonnell, K. H. 601
Glassmeier, H. U. Auster, and H. J. Singer (2008), Multipoint observations of magnetospheric 602
compression-related EMIC Pc1 waves by THEMIS and CARISMA, Geophys. Res. Lett., 35 603
(17), doi:10.1029/2008GL034458. 604
Wait, J. R., and K. P. Spies (1964), Characteristics of the Earthionosphere waveguide for VLF 605
radio waves, NBS Tech. Note 300, Natl. Bur. of Stand., Gaithersburg, Md. 606
Yahnina, T. A., A. G. Yahnin, J. Kangas, J. Manninen, D. S. Evans, A. G. Demekhov, V. Y. 607
Trakhtengerts, M. F. Thomsen, G. D. Reeves, and B. B. Gvozdevsky (2003), Energetic 608
particle counterparts for geomagnetic pulsations of Pc1 and IPDP types, Ann. Geophys., 21, 609
2281–2292. 610
Yando, K., R. M. Millan, J. C. Green, and D. S. Evans (2011), A Monte Carlo simulation of the 611
NOAA POES Medium Energy Proton and Electron Detector instrument, J. Geophys. Res., 612
116, A10231, doi:10.1029/2011JA016671. 613
614
615 M. A. Clilverd, R Duthie, R. Hardman, British Antarctic Survey, High Cross, Madingley Road, Cambridge CB3 0ET, England, 616 U.K. (email: [email protected] ) 617 618

D. Danskin, Geomagnetic Laboratory, Natural Resources Canada, Ottawa, Canada. (email: Donald.Danskin@NRCan-619 RNCan.gc.ca) 620 621 M. Engebretson, Augsberg College, 2211 Riverside Ave. Minneapolis, MN 55454, USA. (email: [email protected] ) 622 623 A. Hendry, C. J. Rodger, Department of Physics, University of Otago, P.O. Box 56, Dunedin, New Zealand. (email: 624 [email protected]). 625 626 M. R. Lessard, Magnetosphere-Ionosphere Research Lab, Institute for the Study of Earth, Oceans, and Space, University of New 627 Hampshire, Durham, NH, USA. (email: [email protected] ) 628 629 D. K. Milling, Department of Physics, University of Alberta, Edmonton, AB, Canada T6G 2E1. (email: [email protected] ) 630 631 T. Raita, Sodankylä Geophysical Observatory, University of Oulu, Sodankylä, Finland. (email: [email protected] ) 632
633
(Received N x, 2015 N x 27, 2015 634
accepted N x, 2015) 635
CLILVERD ET AL.: ELECTRON PRECIPITATION FROM EMIC-IPDP 636
637
638
639
Figure 1. The locations of the main subionospheric propagation paths from the 640
AARDDVARK network analyzed for the effects of EMIC-driven electron 641
precipitation on 31 May 2013. The great circle paths (green lines) connect 642
transmitters (green circles) to receivers (red diamonds). Search coil magnetometer 643
locations are indicated by blue triangles. Constant L-shell contours at 100 km altitude 644
are shown as solid (L=4) and dashed (L=5) black lines. 645
646
647
648
Figure 2. Geomagnetic conditions for 18-00 UT, 31 May 2013, during the onset of a 649
geomagnetic disturbance late on 31 May. The solar wind speed, solar wind density, 650
geomagnetic activity index Kp, and substorm index AL are plotted in separate panels. 651
652

653
654
655
Figure 3. Pulsation magnetometer data from Oulu, Finland (MLT = UT + 1:30), 656
Halley, Antarctica (MLT = UT - 2:44), and Fort Smith, Canada (MLT=UT – 8:07) 657
from 18 – 24 UT, 31 May 2013. The color scale represents the Pc1-Pc2 wave power 658
(arbitrary units) in the 0.1-1 Hz frequency range. Intervals of pulsations of 659
diminishing periods (IPDPs) are observed at all three sites, arriving later at the more 660
westward locations (in the order Oulu-Halley-Fort Smith). 661
662

663
664
Figure 4. A map of the orbits of POES satellites during 21:15-22:00 UT on 31 May 665
2013. The color scale represents the >300 keV precipitating electron flux. Contours 666
of L=4 and L=5 are shown by dashed lines. Insert. The MLT and L-shell of 667
relativistic electron precipitation events observed by POES at about 21:30 UT on 31 668
May 2013. Super-imposed on this map is a cartoon representation of the 669
plasmasphere and wave dominated regions, described by Summers et al. [2007]. 670

671
Figure 5. The variation of the amplitude and phase of the GVT transmitter (UK) 672
received at Sodankylä, Finland along a path covering 2.5<L<5.3 on 31 May 2013. 673
The longitude range over which the path crosses the L=4-5 contours (see Figure 1) is 674
stated. The dashed line represents the variation observed during a typical non-675
disturbed day (02 June 2013). A large perturbation, labeled (a), is observed at 21 UT, 676
co-incident with the EMIC IPDP wave observed at Oulu, Finland shown in Figure 3. 677
Red bars indicate the maximum deviations. 678
679
680
Figure 6. As Figure 5. The variation is shown of the phase of several transmitters 681
received at four different locations. The two left-hand panels represent northern 682
European paths, while the right-hand panels represent western-Atlantic paths. 683
Vertical lines indicate the time of the most obvious phase perturbations, as well as 684
the approximate times of EMIC waves observed on 31 May 2013 in northern Europe 685
(21 UT) and western-Atlantic longitudes (22-23 UT). Perturbations observed are 686
labeled (a) – (d). See text for more details. 687

688
Figure 7. Upper panel. The power in the Pc1-2 wave band (0.05-0.5 Hz) observed 689
by the search coil magnetometer at Halley, Antarctica during 31 May – 01 June 690
2013. Middle panel. The variation in the Halley riometer absorption. Lower panel. 691
The phase perturbation observed on the Iceland NRK transmitter received at St. 692
John's. Vertical dash-dot lines represent the times of peak electron precipitation 693
observed in Figures 5 and 6. Perturbations are labeled as in Figure 6. 694
695
696
Figure 8. Upper panel. The observed amplitude and phase variation on a typical 697
quiet-day (solid lines) for the UK-Finland propagation path, with LWPC modeling 698
results for the same path and time of year (diamonds). A vertical dashed-dotted line 699
at 21 UT represents the time of the EMIC precipitation event observed at Oulu, 700
Finland. Lower panels. The LWPC phase and amplitude perturbations for a range of 701
ionospheric sharpness values (β), where non-disturbed conditions are defined by the 702
LWPC ionospheric model at 21 UT. Red bars represent the perturbation levels 703
observed in Figure 5. 704
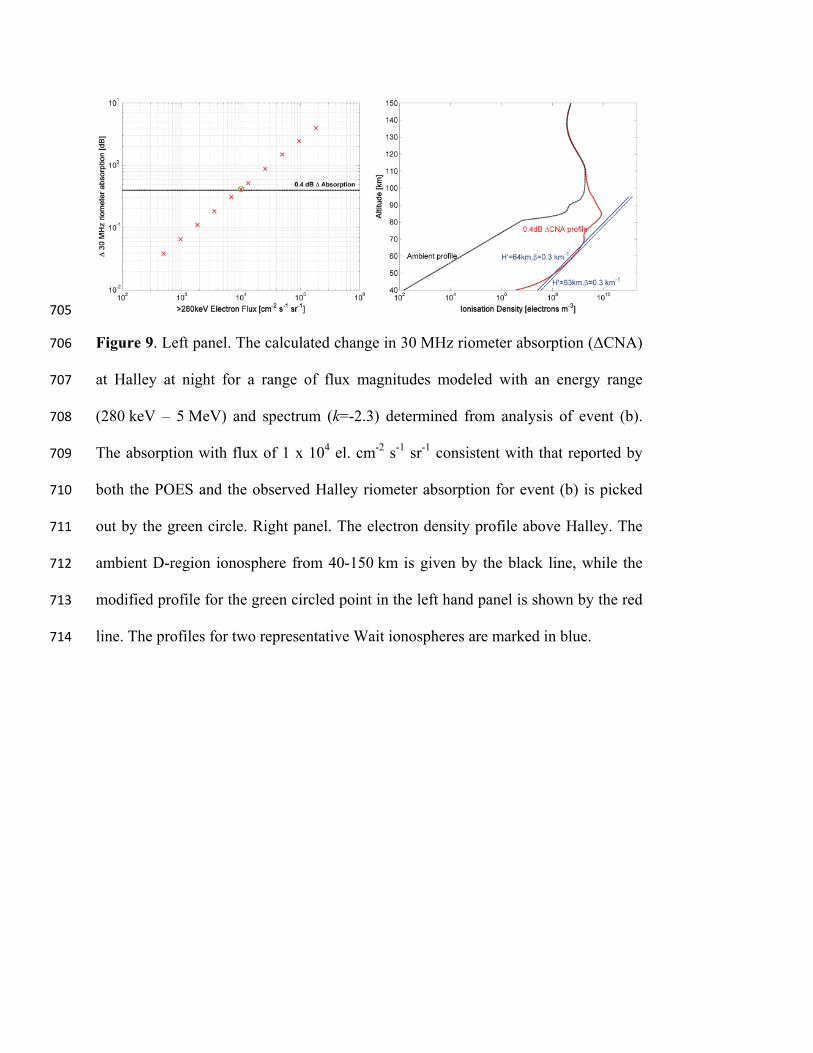
705
Figure 9. Left panel. The calculated change in 30 MHz riometer absorption (ΔCNA) 706
at Halley at night for a range of flux magnitudes modeled with an energy range 707
(280 keV – 5 MeV) and spectrum (k=-2.3) determined from analysis of event (b). 708
The absorption with flux of 1 x 10⁴ el. cm-2 s-1 sr-1 consistent with that reported by 709
both the POES and the observed Halley riometer absorption for event (b) is picked 710
out by the green circle. Right panel. The electron density profile above Halley. The 711
ambient D-region ionosphere from 40-150 km is given by the black line, while the 712
modified profile for the green circled point in the left hand panel is shown by the red 713
line. The profiles for two representative Wait ionospheres are marked in blue. 714