elevate your financial analytics: advice from cfos
TRANSCRIPT
Presented by: Matt Giroux
Managing Director
CohnReznick LLP
Elevate Your Financial Analytics:
Advice from CFOs
E l e v a t e Yo u r F i n a n c i a l A n a l y t i c s
May 16, 2017 2
What are your analytics telling you?
Perhaps more importantly,what aren’t your analytics telling you?
The Thinker, Auguste Rodin

3
Illustration by:M.C. EscherThe Paradoxical Art of “Inception”
May 16, 2017

4
Painting by:Norman Rockwell“The Vetrinarian”
May 16, 2017
What’s in an Analytic?
5
CFOs today should see analytics…as a way to instill a deeper understanding of the valuebehind the questions we ask across the organization.
May 16, 2017
E x a m p l e S t o r i e s f r o m C F O s
6May 16, 2017
7
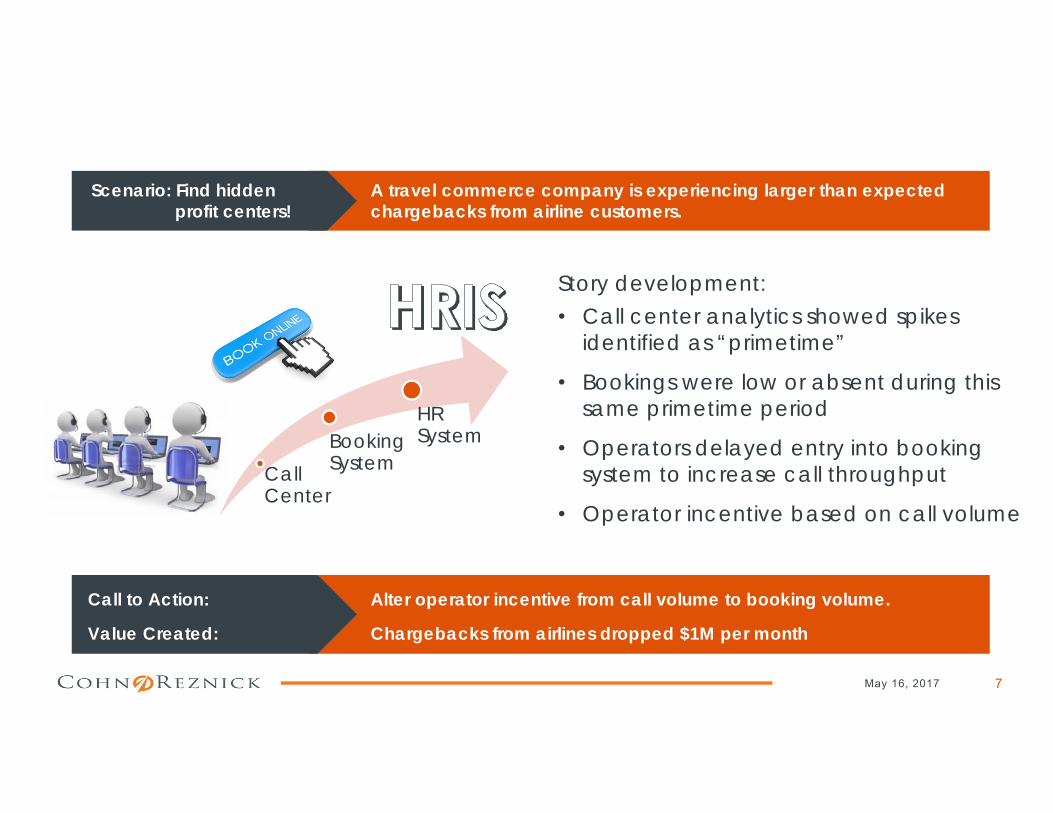
Call Center
Booking System
HR System
Story development:• Call center analytics showed spikes
identified as “primetime”
• Bookings were low or absent during this same primetime period
• Operators delayed entry into booking system to increase call throughput
• Operator incentive based on call volume
Alter operator incentive from call volume to booking volume.
Chargebacks from airlines dropped $1M per month
Call to Action:
Value Created:
A travel commerce company is experiencing larger than expected chargebacks from airline customers.
Scenario: Find hidden profit centers!
May 16, 2017
8
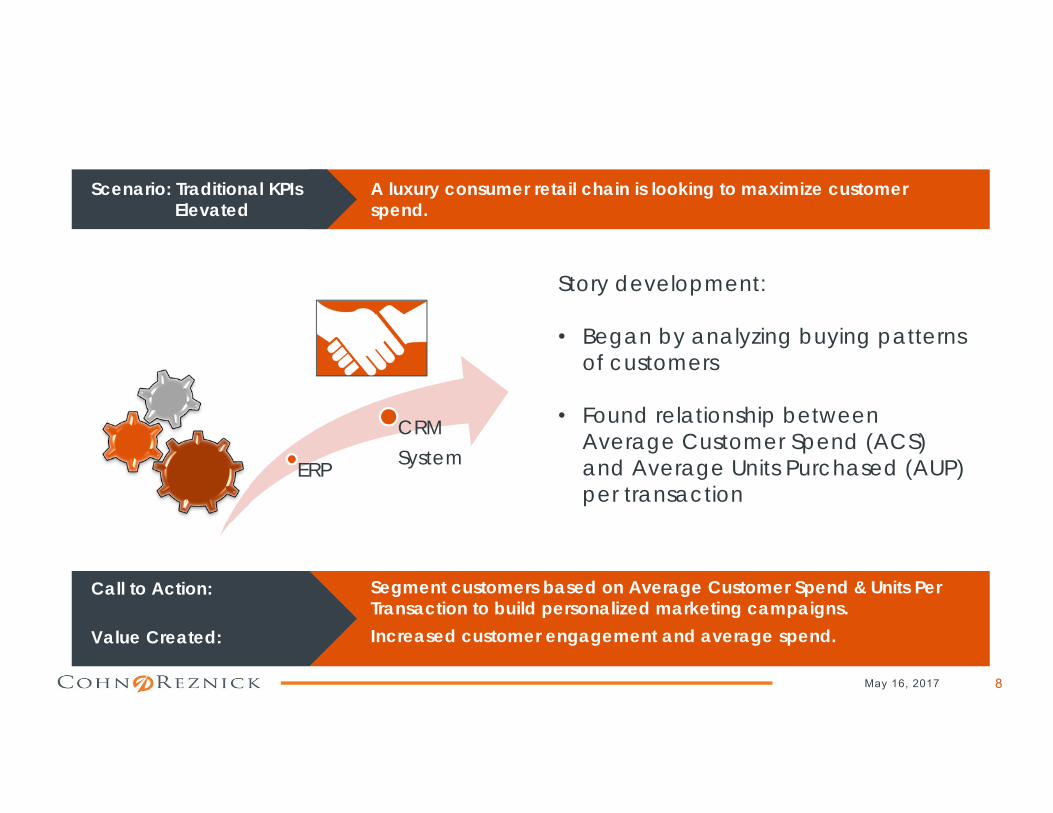
ERP
CRMSystem
Story development:
• Began by analyzing buying patterns of customers
• Found relationship between Average Customer Spend (ACS) and Average Units Purchased (AUP) per transaction
Segment customers based on Average Customer Spend & Units Per Transaction to build personalized marketing campaigns.Increased customer engagement and average spend.
Call to Action:
Value Created:
A luxury consumer retail chain is looking to maximize customer spend.
Scenario: Traditional KPIs Elevated
May 16, 2017
9
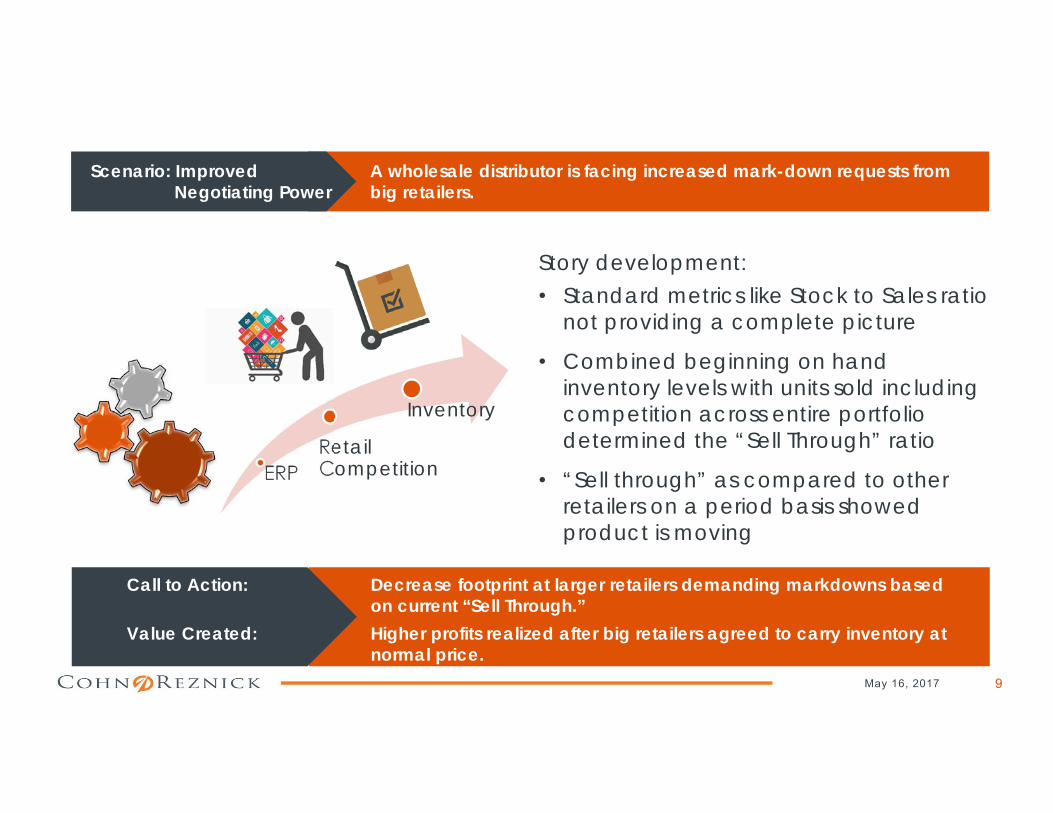
ERPRetailCompetition
Inventory
Story development:• Standard metrics like Stock to Sales ratio
not providing a complete picture
• Combined beginning on hand inventory levels with units sold including competition across entire portfolio determined the “Sell Through” ratio
• “Sell through” as compared to other retailers on a period basis showed product is moving
Decrease footprint at larger retailers demanding markdowns based on current “Sell Through.”Higher profits realized after big retailers agreed to carry inventory at normal price.
Call to Action:
Value Created:
A wholesale distributor is facing increased mark-down requests from big retailers.
Scenario: Improved Negotiating Power
May 16, 2017
10
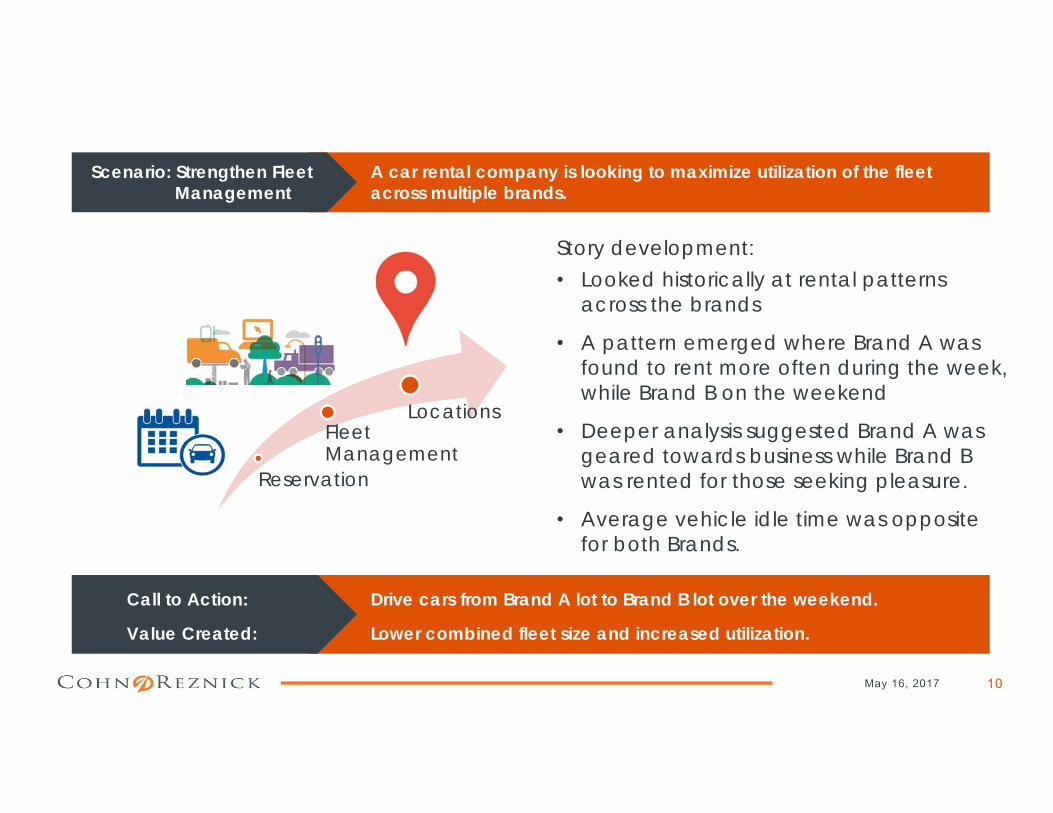
Reservation
Fleet Management
Locations
Story development:• Looked historically at rental patterns
across the brands
• A pattern emerged where Brand A was found to rent more often during the week, while Brand B on the weekend
• Deeper analysis suggested Brand A was geared towards business while Brand B was rented for those seeking pleasure.
• Average vehicle idle time was opposite for both Brands.
Drive cars from Brand A lot to Brand B lot over the weekend.
Lower combined fleet size and increased utilization.
Call to Action:
Value Created:
A car rental company is looking to maximize utilization of the fleet across multiple brands.
Scenario: Strengthen Fleet Management
May 16, 2017
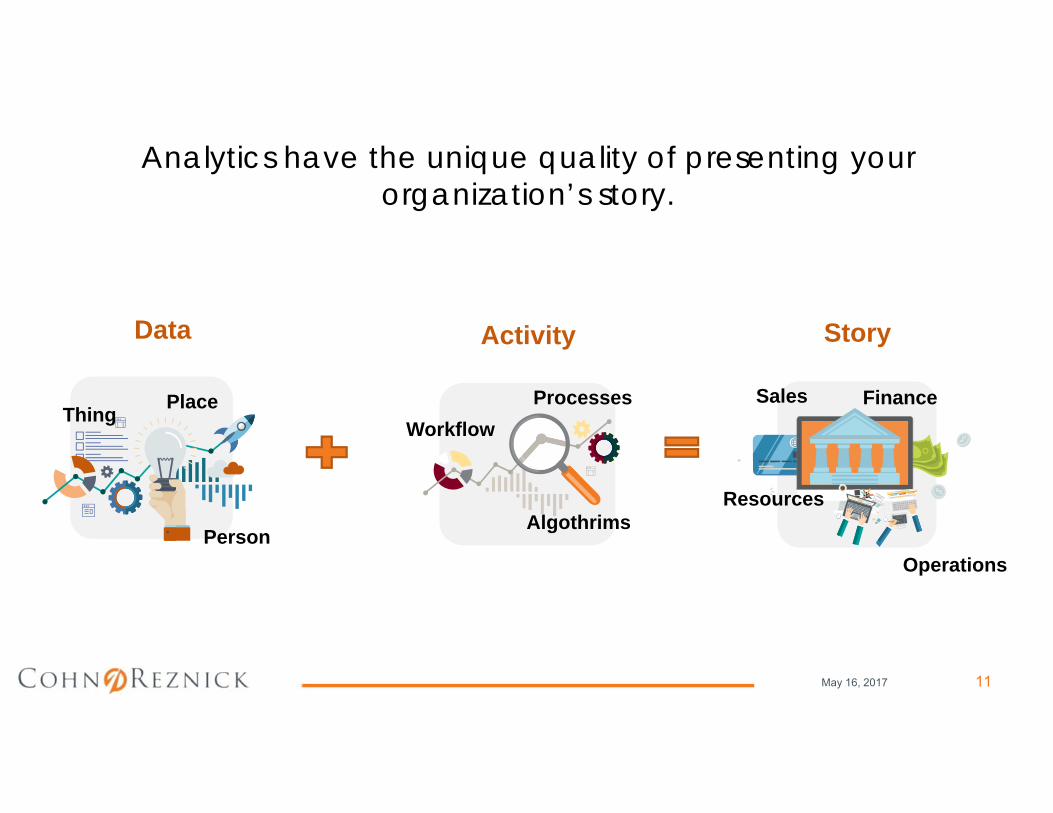
Analytics have the unique quality of presenting your organization’s story.
Person
Activity
WorkflowProcesses
Algothrims
PlaceThingSales Finance
Resources
Operations
StoryData
May 16, 2017 11
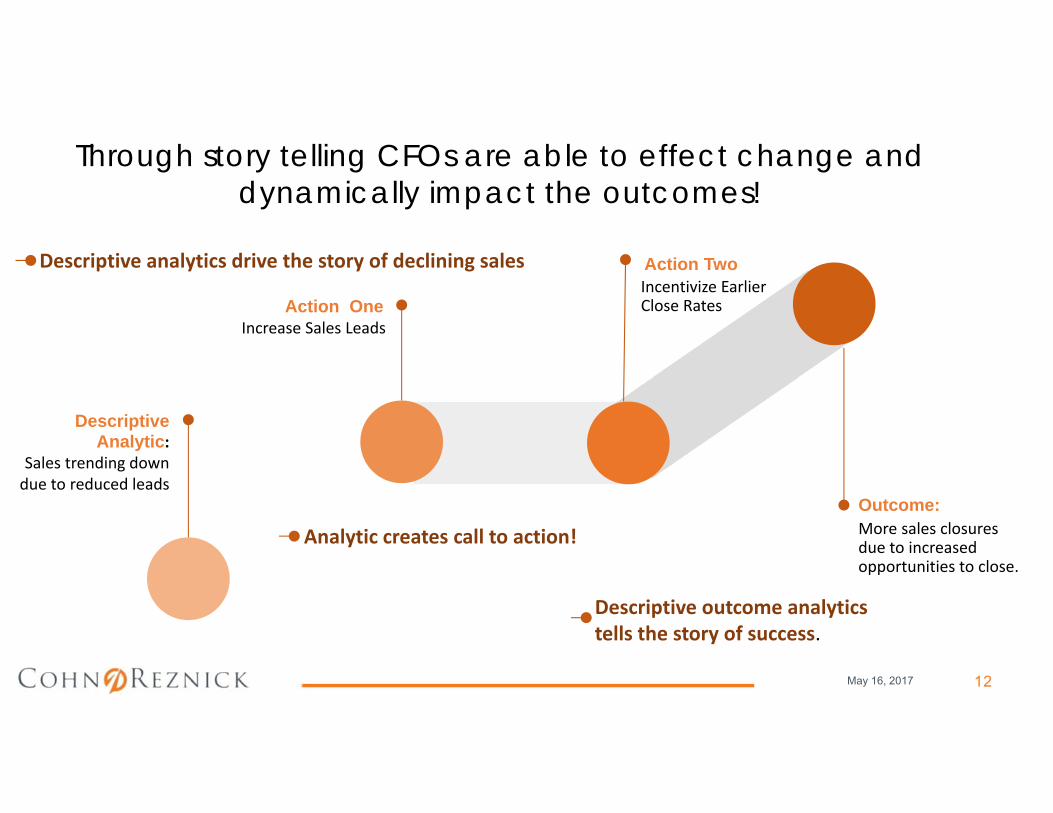
Through story telling CFOs are able to effect change and dynamically impact the outcomes!
Descriptive Analytic:
Sales trending down due to reduced leads
Increase Sales LeadsAction One
Incentivize Earlier Close Rates
Action Two
More sales closures due to increased opportunities to close.
Outcome:
�
� �
�
Descriptive outcome analytics tells the story of success.
Analytic creates call to action!
Descriptive analytics drive the story of declining sales
12May 16, 2017
13
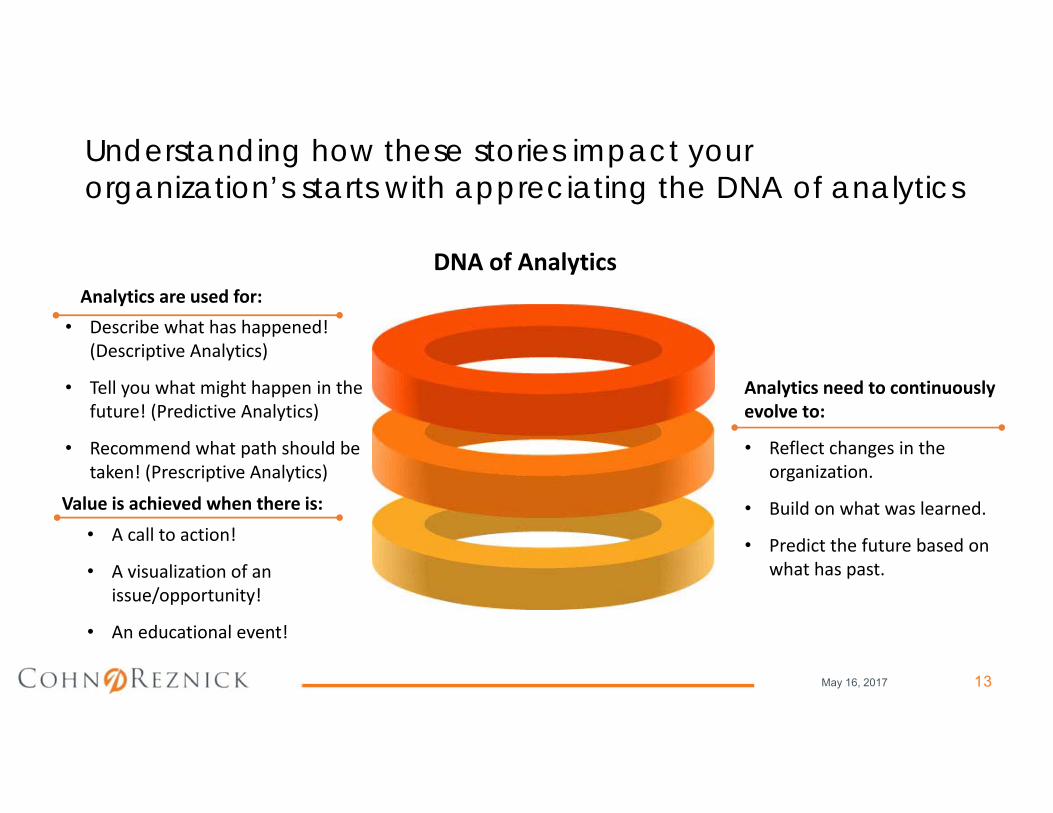
Understanding how these stories impact your organization’s starts with appreciating the DNA of analytics
DNA of AnalyticsAnalytics are used for:
Value is achieved when there is:
Analytics need to continuously evolve to:
• Describe what has happened! (Descriptive Analytics)
• Tell you what might happen in the future! (Predictive Analytics)
• Recommend what path should be taken! (Prescriptive Analytics)
• A call to action!
• A visualization of an issue/opportunity!
• An educational event!
• Reflect changes in the organization.
• Build on what was learned.
• Predict the future based on what has past.
May 16, 2017
14
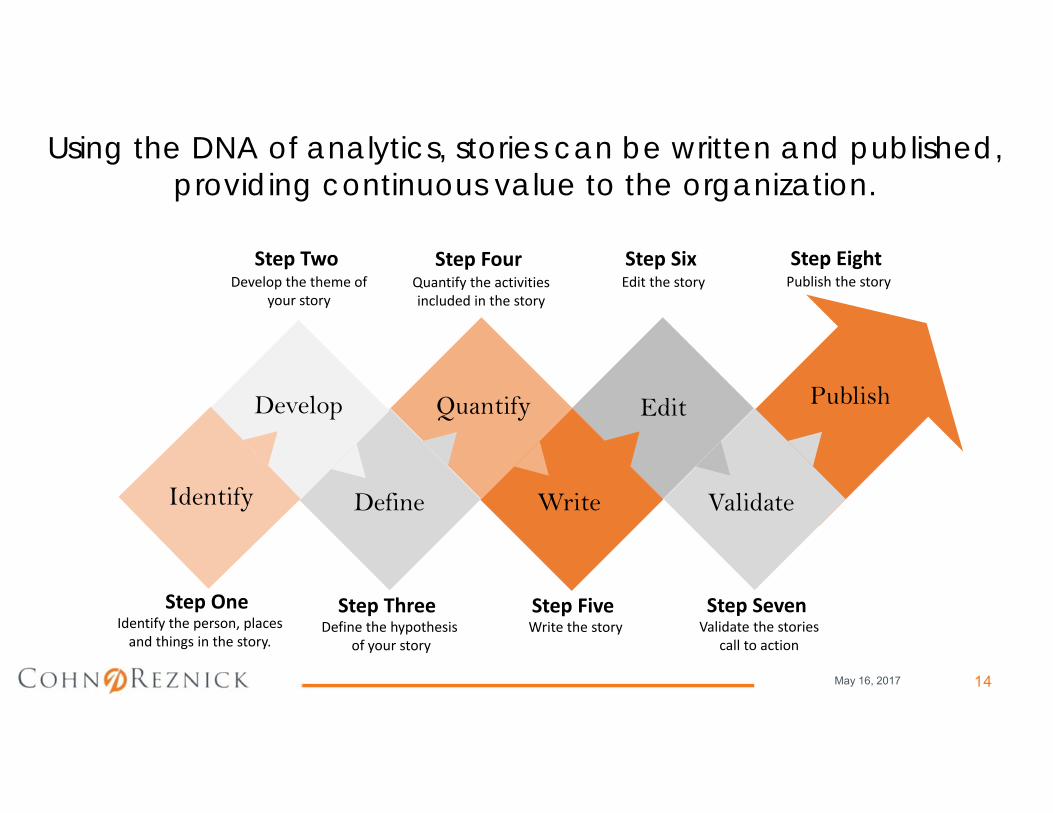
Define the hypothesisof your story
Step Three
Develop the theme of your story
Step TwoQuantify the activities included in the story
Step Four
Write the storyStep Five
Edit the storyStep Six
Validate the stories call to action
Step Seven
� Define
Quantify Publish
Write Validate
Edit
Publish the storyStep Eight
Identify
Develop
Using the DNA of analytics, stories can be written and published, providing continuous value to the organization.
Identify the person, places and things in the story.
Step One
May 16, 2017
15
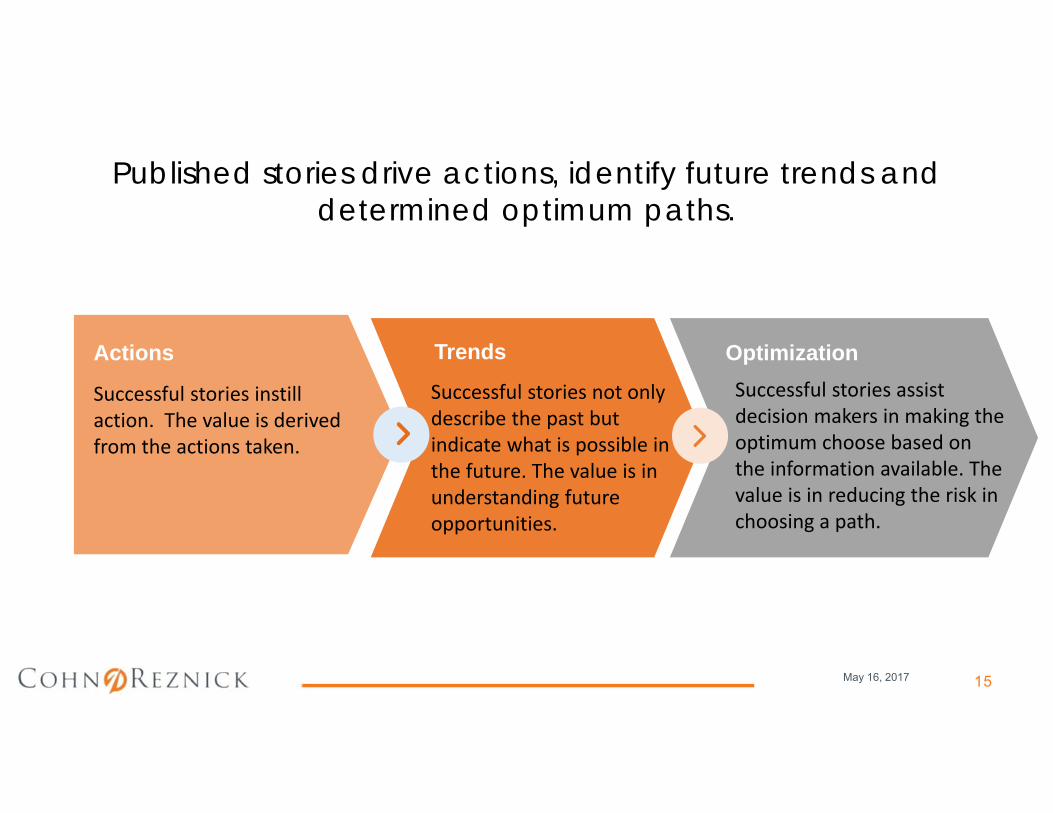
Published stories drive actions, identify future trends and determined optimum paths.
Successful stories instill action. The value is derived from the actions taken.
Actions
Successful stories not only describe the past but indicate what is possible in the future. The value is in understanding future opportunities.
TrendsSuccessful stories assist decision makers in making the optimum choose based on the information available. The value is in reducing the risk in choosing a path.
Optimization
May 16, 2017
16
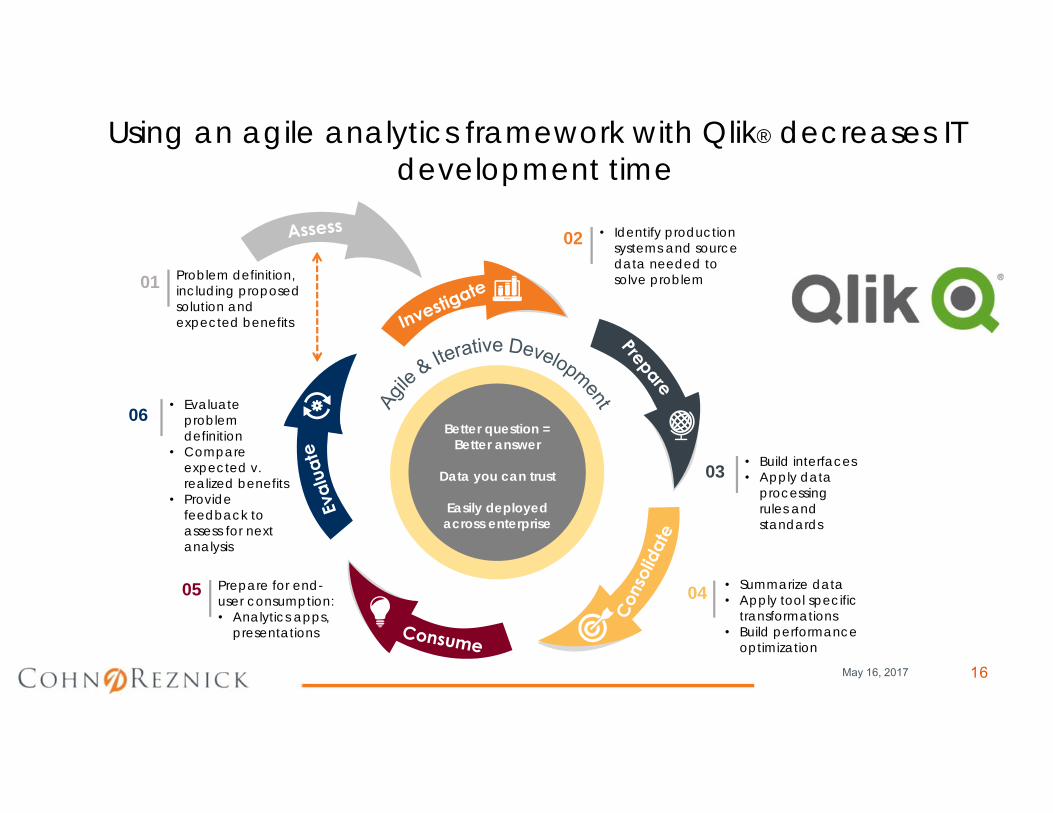
02 • Identify production systems and source data needed to solve problem
Better question = Better answer
Data you can trust
Easily deployed across enterprise
03 • Build interfaces• Apply data
processing rules and standards
04 • Summarize data• Apply tool specific
transformations• Build performance
optimization
05 Prepare for end-user consumption:• Analytics apps,
presentations
06 • Evaluate problem definition
• Compare expected v. realized benefits
• Provide feedback to assess for next analysis
01 Problem definition, including proposed solution and expected benefits
Using an agile analytics framework with Qlik® decreases IT development time
May 16, 2017

17
Matt GirouxManaging DirectorCohnReznick LLP
Visit us at Booth #500 to see how we can help you elevate your analytics.
And Pick Up your Complimentary Analytics T-shirt!
What’s Your KPI?
May 16, 2017